Embed Size (px)
Citation preview
l
TEXAS A&M UNIVERSITY
NEWSLETTER
No.383 August 1990
. Blixt, J., and Glaser, J. 2
Blum, F.D. 4
Equilibrium Constants by NMR and emf
Block Copolymers on Surfaces
Mode-Switched Radiofrequency Coils
Position Available
Barker, P. B., Shongo, D. C., and Schoeniger, J. 7
Hughes, D. A. 8
Lactate Edited Self-Diffusion Coefficient Measurements Sotak, C. H. 9
Fast Phase Sensitive COSY Turner, C. J. 15
SELRESOLV: Selective Measurements of Long Range C,H-Coupling Constants Ochs, M., and Berger, S. 16
Real or Artifact? Thoma, W. J. 18
H,D Exchange in Technetium-99 Complexes
Position Available
3D NMR: Displaying the Results from Pulse Sequence Simulations
Models for Porphyrin Ring-Current Shifts
Ovenall, D., and Albanese, J. 21
Hasson, N. 22
Methods for Solvent Suppression and Baseplane Flattening of NOESY and ROESY Spectra .
Position Available
Butler, L. G. 23
Cross, K. J. 27
. Ni, F. 28
Stilbs, P. 30
Neighbors Kline, A. D., Vandygriff, J., and Occolowitz, J. 33
Al NMR of Zeolites
Solid Phase 13c NMR ofa Dibenzo-15-Crown-5 Ether and Its NaNCS Complex
Ray, G.J. 34
Buchanan, G. W. 36
Williams, S. C. R. 39 NMR Imaging of the Cockroach .
NMR of Fluorinated ,B-Diketones Lindon, J. C., and Farrant, R. D. 40
The Third Dimension a la JEOL GSX Spectrometers Byrd, R. A. 41
Planning Relaxation Time Measurements of Quadrupolar Nuclei in Solids . Woessner, D. E. 45
Position Available
Overlapping COSY Cross Peaks
Randall, E. 46
Freeman, R. 48
Continued on page 68
A monthly collection of informal private letters from Laboratories of NMR . Information contained herein is solely for the use of the reader. Quotation is not permitted, except by direct arrangement with the author of the letter, and the material quoted must be referred to as a "Private Communication". Reference to the TAMU NMR Newsletter by name in the open literature is strictly forbidden.
These restrictions apply equally to both the actual Newsletter participant-recipients and to all others who are allowed open access to the Newsletter issues. Strict adherence to this policy is considered essential to the successful continuation of the Newsletter as an informal medium of exchange of NMR information .
Cat. No.
D-11
D-120
D-13
D-121
D-129
D-14
D-21
D-122
D-130
D-28
D-31
.,,., :Wtl:
.. ,r _1 1 ' · ""\1
TABLE 1 DEUTERA TED SOL VENTS
VARIAN
BOX/500 SHEETS
I ~••• ~,v •
CFT-20, FT-80, FT-BOA
All Models••· '161/2"or1i;
Gridded-Two Color
Rlanv
Searching for the Unusual Requirement? WILMAD HAS YOUR ANSWER!
·X, X 106@(°C}
0.55 1 (32)
0.460 (20)
.740 (20)
The most comprehensive offering of "widgets, gadgets and specials " for NMR spectroscopy, including:
Spatula for 5mm NMR Tubes Three types of Valve NMR Tubes
(including the new J. Young 'Valve Tube) Solvent Jet NMR Tube Cleaners pH Electrode for 5mm NMR Tubes
'
Taperlok ® NMR. Tubes A multitude of Ceaxial Inserts Alumina NMR Tube for Si-29 Studies Ultra-thin wall NMR Tubes Throwaway "THRIFT" and " ECONOMY" NMR Tubes
Serving the Spectroscopic Aftermarket
WILMAD GLASS COMPANY Route 40 and Oak Road • Buena, NJ 08310 U.S.A.
609-697-3000 • TWX 510-687-8911 FAX 609-697-0536
TEXAS A&M NMR NEWSLETTER
Ackerman, J . I,. 67 Diehl, I' . . Adam, U. 53 Farrant, R. D. Alhan<..-sc, J . 21 Freeman, R. Barker, I' . B. 7 Garrido, L. Berger, S. 16 Glaser, J. Blixt, .I . 2 Oupla, R. K. Blum, F. D. 4 Hasson, N. Buchanan, G. W. 36 Hughes, D. A Butler, L. G. 23 Jelicks, L.A Byrd, R.A 41 Jokisaari, J . Craik, D . 53 Kline, A. D. Cross, K. J. 27 Lindon, J . C.
TEXAS A&M NMR NEWSLETTER
American Microwave Technology, Inc. Bio-Rad, Sadlier Division Bruker Instruments, Inc. Chemagnetics, Inc. Doty Scientific, Inc.
37 47 31 63 19 43
NO. 383, AUGUST 1990
62 Miknis, F. 65 40 Netzel, D. A 65 48 Ni, F. 28 67 O'Byrnc, E. M . . 59
2 Occolowitz, J . 33 59 Ochs, M. 16 22 Ovenall, D .. 21
8 Paul, P. K. 59 59 Randall, E .. 46 62 Ray, G.J .. 34 33 Schoeniger, J . 7 40 Shapiro, B. L. 68
NO. 383, AUGUST 1990
JEOL Nalorac·cryogenics Corporation Otsuka Electronics (U.S.A) Inc. Oxford Instruments Ltd. Programmed Test Sources, Inc. Varian
383-1
AUTHOR INDEX
Shehan, P. . 53 Shungu, D. C. 7 Sotak, C. H. 9 Stilbs, P. 30 Thoma, W. J. 18 Turner, C. J . 15 Vandygriff, J . 33 Vega, S. 55 Wellard, M. 53 Williams, S. C. R. 39 Woessner, D. E. 45 Zax, D.B. . 55
ADVERTISER INDEX
outside back cover 25 5 57 61 51 Fremont Magnetic Resonance
GE NMR Instruments . 11, inside back cover Wilmad Glass Company, Inc .. inside front cover
SPONSORS OF THE TAMU NMR NEWSLETTER
Abbott Laboratories Analogic Corporation The British Petroleum Co. , Ltd. (England) Bruker Instruments, Inc. Burroughs Wcllcome Co. Cryomagnet Systems, Inc. The Dow Chemical Company Eastman Kodak Company E. I. du Pont de Nemours & Company GE NMR Instruments JEOL (U.S.A) Inc., Analytical Instruments Division The Lilly Research Laboratories, Eli Lilly & Company Merck Sharp & Dohme/lsotopes
The Monsanto Company New Methods Research, Inc. NMR Technologies Inc. Noren, Inc. The Procter & Gamble Company, Miami Valley Labs Programmed Test Sources, Inc. t Shell Development Company Siemens Medical Systems, Inc. Spectroscopy Imaging Systems Corporation Spectral Data Services, Inc. Tecmag Unilever Research Union Carbide Corporation
Millipore Corporation, Waters Chromatography Division Varian, Analytical Instrument Division
FORTHCOMING NMR MEETINGS
Bat-Shcva Workshop on New Developments and Applications in NMR and ESR Spectroscopy, October 14•24, 1990, Israel; Contact: Dr. D. Goldfarb, 'The Weizmann Institute of Science, Rehovot, Israel. See Newsleller 377, 10.
Eastern Analytical Symposium, Garden State Convention Center, Somerset, NJ; NMR Symposia and Poster Sessions on Nov. 13 and 14, 1990; Contact D. C. Dalgarno or C. A. Evans, Schering-Plough Research, 60 Orange St., Bloomfield, NJ 07003; (201) 429-3957; FAX: (201) 429-3916.
Advanced Tomographic Imaging Methods for the Analysis of Materials, Symposium at the Fall Meeting of the Materials Research Society, Boston, Mass., Nov. 26 • Dec. 1, 1990; See Newsletter 378, 57.
All Newsletter Correspondence
Should Be Addressed To:
Dr. Bernard L. Shapiro TAMU NMR Newsfetter
966 Elsinore Court Palo Alto, CA 94303, U.S.A
(415) 493-5971
Additional listings of meetings, etc., are invited.
DEADLINE DATES*
No. 385 (October) •·····•14 September 1990
No. 386 (November) •··--··12 October 1990
No. 387 (December)-------9 November 1990
No. 388 (January)---------• 7 December 1990
* Please note that these deadline dates have been moved a bit f01ward from those previously in effect.
vmNsKAP KUNGL TEKNISKA H6GSKOLAN 383-2 -~9· . . ~ . ROYAL INSTITUTE OF TECHNOLOGY
Dept. of Inorganic Chemistry Dr. Julius G'laser
Handl.i~gare, direktvalsnr
Prof. B.L. Shapiro TAMU NMR Newsletter 966 Elsinore Court Palo Alto California 94303, USA
Stockholm, June 21, 1990 (received 6/27/90)
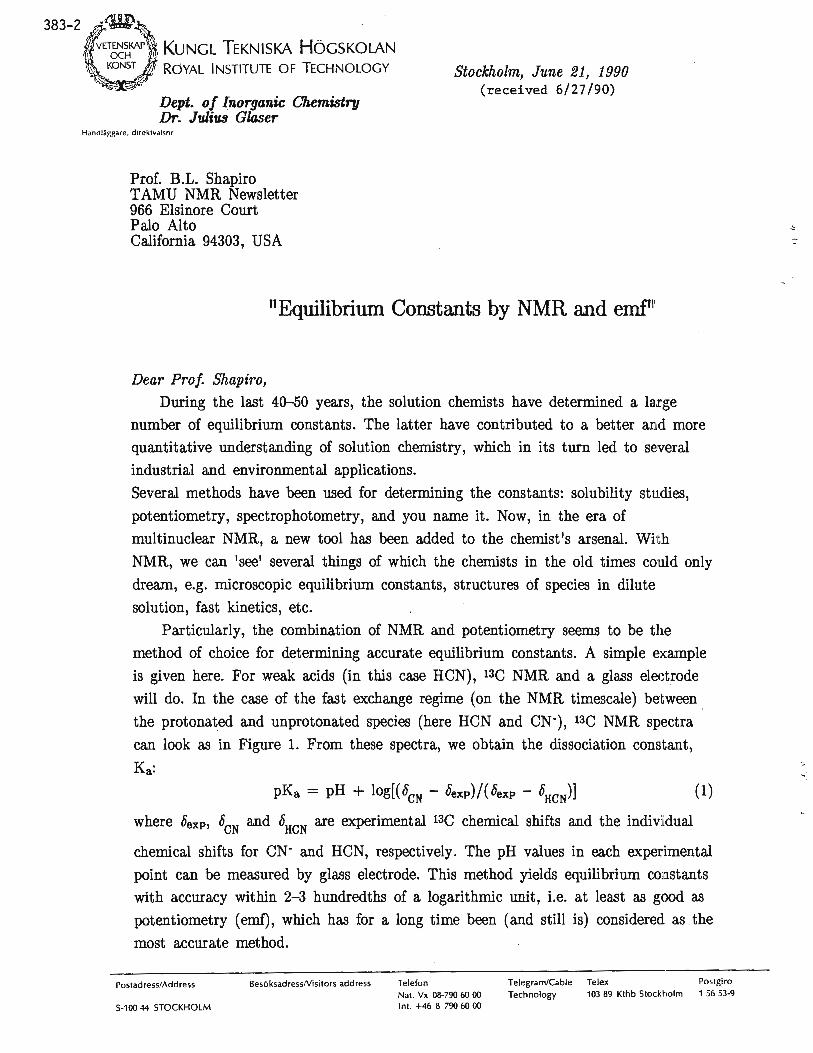
"Equilibrium Constants by NMR and emf'1'
Dear Prof. Shapiro,
During the last 40-50 years, the solution chemists have determined a large
number of equilibrium constants. The latter have contributed to a better and more
quantitative understanding of solution chemistry, which in its turn led to several
industrial and environmental applications.
Several methods have been used for determining the constants: solubility studies,
potentiometry, spectrophotometry, and you name it. Now, in the era of
multinuclear NMR, a new tool has been added to the chemist's arsenal. With
NMR, we can 'see' several things of which the chemists in the old times could only
dream, e.g. microscopic equilibrium constants, structures of species in dilute
solution, fast kinetics, etc.
Particularly, the combination of NMR and potentiometry seems to be the
method of choice for determining accurate equilibrium constants. A simple example
is given here. For weak acids (in this case HCN), 13C NMR and a glass elect~ode
will do. In the case of the fast exchange regime ( on the NMR timescale) between .
the protonat_ed and unprotonated species (here HCN and CN·), l3C NMR spectra
can look as in Figure 1. From these spectra, we obtain the dissociation constant,
Ka:
(1)
where Oexp, OCN and OHCN are experimental _13C chemical shifts and the ·individual
chemical shifts for CN· and HCN, respectively. The pH values in each experimental
point can be measured by glass electrode. This method yields equilibrium constants
with accuracy within 2-3 hundredths of a logarithmic unit, i.e. at least as good as
potentiometry (emf), which has for a long time been ( and still is) considered as . the
most accurate method.
Postadress/Address Bes6ksadressNisitors address
S-100 44 STOCKHOLM
Telefon Nat. Vx 08-790 60 00 Int. +46 8 790 60 00
. I
Telegram/Cable Telex Postgiro Technology 103 89 Kthb Stockholm 1 56 53-9
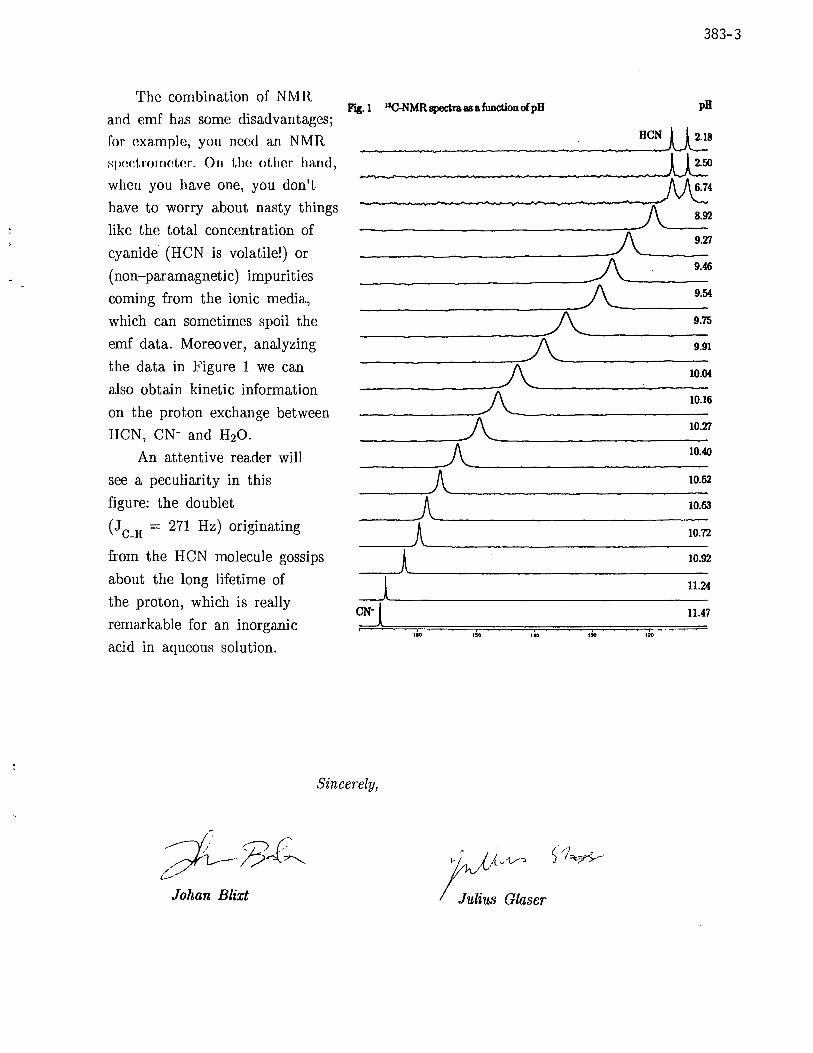
The combination of N MR
and emf has some disadvantages;
for example, you need an NMR Hp<!<:l,romc\t.er. On I.he other hand,
when you have one, you don't
have to worry about nasty things
like the total concentration of
cyanide· (HCN is volatile!) or
(non-paramagnetic) impurities
coming from the ionic media,
which can sometimes spoil the
emf data. Moreover, analyzing
the data in Figure 1 we can
also obtain kinetic information
on the proton exchange between
IICN, CN- and H20.
An attentive reader will
see a peculiarity in this
figure: the doublet
( J C-H = 271 Hz) originating
from the HCN molecule gossips
about the long lifetime of
the proton, which is really
remarkable for an inorganic
acid in aqueous solution.
383-3
Fig. 1 UC-NMR spectra as a function of pH pH
--~~~-~------~-----H_c_N ~8
---------------------------------~ ~· ..,..._,..,,... ________ _A.....-:-__ s_.92
A 9.27
-~-----::: ----~ I\ 9.46 __________ _./ '----A 9.54
-~---=- --/\ 9.75
------::./ '----A 9.91
--------=- -------A 10.04
--------= -------'-----/\ 10.16 __ __,..,/ '--------______ A _____________ 1_0_.21
_____ _A ______________ i_o.40
____ A _________________ 10_.s2
____ A _________________ i_o.63
___ A.._ _______________ 1_0_:n
l 10:92 _A..__ _____ _
_J 11.24 ~-----
~ 11.47
Ito , .. ... ,,.
Sincerely,
Johan Blixt
jJ)~v,, / Julius Glaser
383-4
:r.. College of Arts and Sciences
Department of Chemist ry
142 Schrenk Hall Rolla. MO 65401 -02 49
Telephone (314) 341 -4420 FAX (31 4) 34 1-6033
UNIVERSITY OF MISSOURI-ROLLA
June 13, 1990 (received 6/23/90)
Dr . Bernard L. Shapiro TAMU NMR Newsletter 966 Elsinore Court Palo Alto, CA 94303
Block Copolymers on Surfaces
Dear Barry :
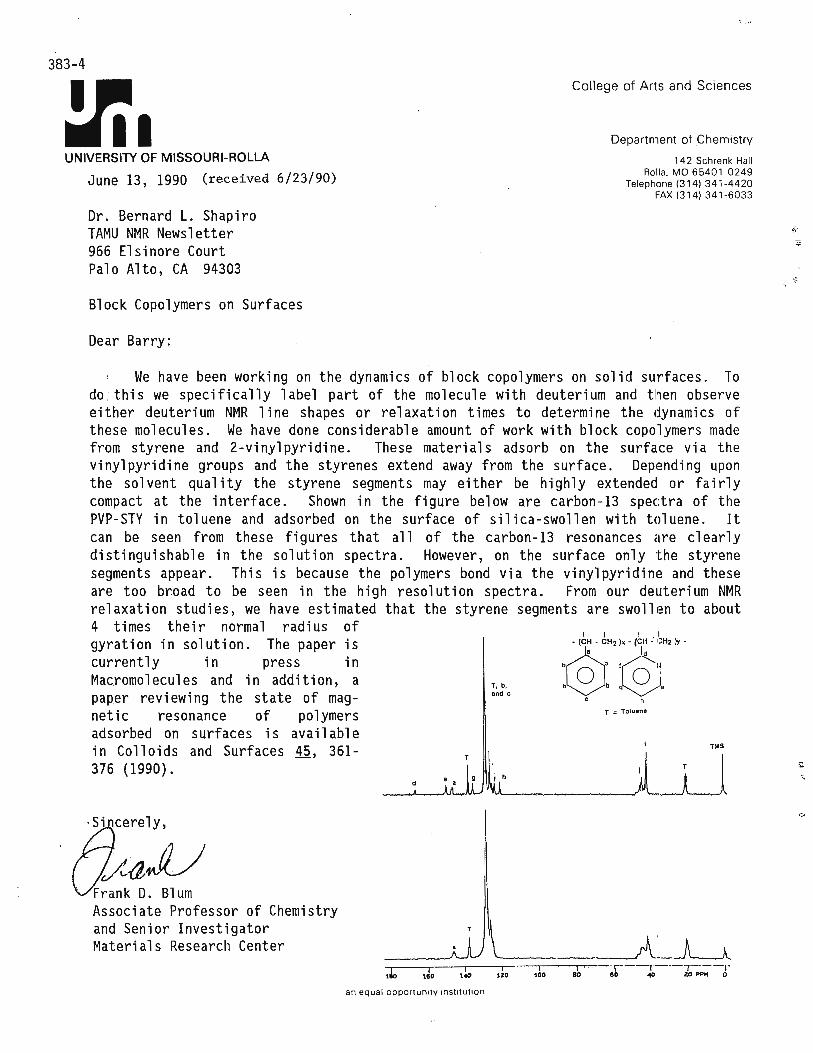
We have been working on the dynamics of block copolymers on solid suifaces . To do : this we specifically label part of the molecule with deuterium and t hen observe either deuterium NMR line shapes or relaxation times to determine the dynamics of these molecules. We have done considerable amount of work with block copolymers made from styrene and 2-vinylpyridine. These materials adsorb on the surface via the vinyl pyridine groups and the styrenes extend away from the surface. Dep,endi ng upon the solvent quality the styrene segments may either be highly extended or fairly compact at the interface. Shown in the figure bel!ow are carbon - 13 spectra of the PVP -STY in toluene and adsorbed on the surface of silica-swollen with toluene. It can be seen from these figures that all of the carbon-13 resonances are cl early distinguishable in the solution spectra. However, on the surface only the styrene segments appear. This is because the polymers bondi via the vinylpyridirn~ and these are too broad to be seen in the high resolution spectra. From our deuterium NMR relaxation studies, we have estimated that the styrene segments are swoll1en to about
T, b, and c
T :: Toluene
TMS
4 times their normal radius of gyration in solution. The paper is currently in press in Mac_rornolecules and in addition, a paper reviewing the state of rnag net i c resonance of polymers adsorbed on surfaces is available in Colloids and Surfaces 45, 361-376 (1990).
_____,.,,,__d ....AJl..-.,.J\I\-,'< ~.______,_h _Lij
a. cerely,
0a~U Frank D. Bl urn Associate Professor of Chemistry and Senior Investigator Materials Research Center
,L, I 160
an equal opport u n i ty in st1 t u t1o n
too 80 ·,---,--•- ·,r----,· 60 10 U,P"" 0
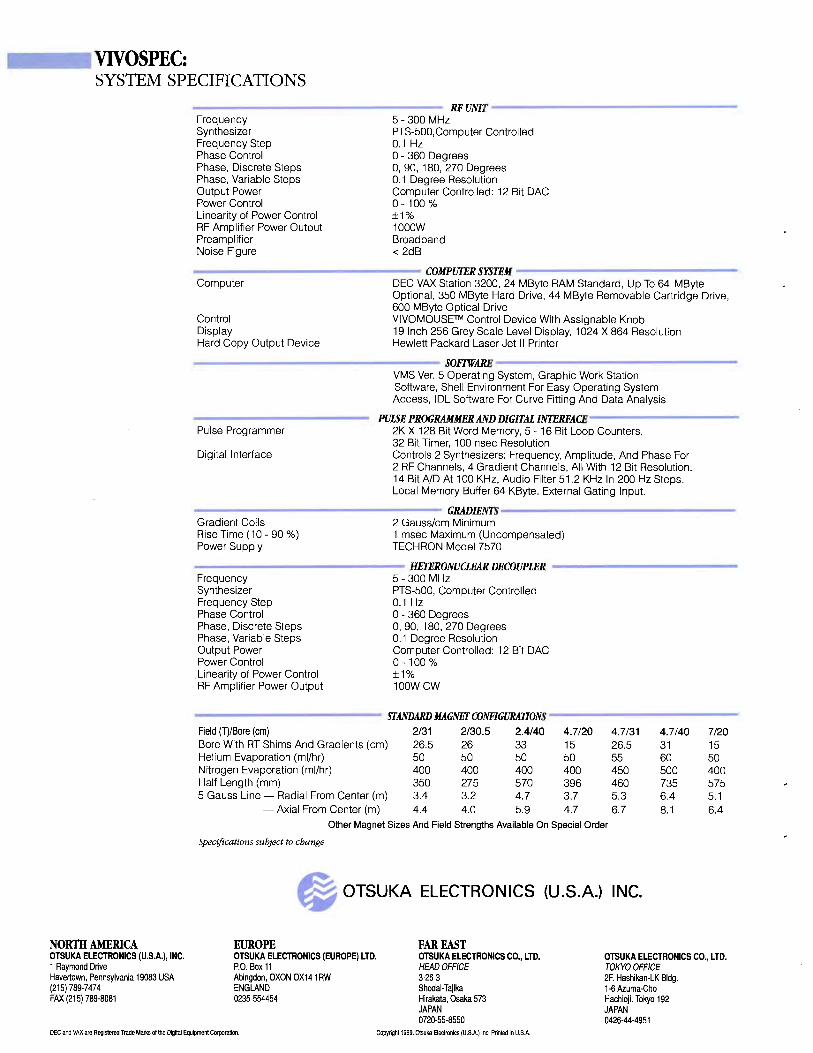
VIVOSPEC: SYSTEM SPECIFICATIONS
NORffi AMERICA OTSUKA ELECTRONICS (U.S.A.), INC. 1 Raymond Drive Havertown, Pennsylvania 19083 USA (215) 789-7474 FAX (215) 789-8081
Frequency Synthesizer Frequency Step Phase Control Phase, Discrete Steps Phase, Variable Steps Output Power Power Control Linearity of Power Control RF Amplifier Power Output Preamplifier Noise Figure
RFUNIT ----------------5- 300 MHz PTS-500,Computer Controlled 0.1 Hz O - 360 Degrees 0, 90, 180, 270 Degrees 0.1 Degree Resolution Computer Controlled: 12 Bit DAC 0-100% ±1% 1000W Broadband < 2dB
--------------- COMPUTER SYSTEM ---------------Computer
Control Display Hard Copy Output Device
DEC VAX Station 3200, 24 MByte RAM Standard, Up To 64 MByte Optional, 350 MByte Hard Drive, 44 MByte Removable Cartridge Drive, 600 MByte Optical Drive VIVOMOUSE™ Control Device With Assignable Knob 19 Inch 256 Grey Scale Level Display, 1024 X 864 Resolution Hewlett Packard Laser Jet II Printer
---------------- SOFJ'WARE----------------VMS Ver. 5 Operating System, Graphic Work Station Software, Shell Environment For Easy Operating System Access, IDL Software For Curve Fitting And Data Analysis
PUI.SE PROGRAMMER AND DIGITAL INTERFACE Pulse Programmer
Digital Interface
Gradient Coils Rise Time (10 - 90 %) Power Supply
2K X 128 Bit Word Memory, 5 - 16 Bit Loop Counters, 32 Bit Timer, 100 nsec Resolution Controls 2 Synthesizers: Frequency, Amplitude, And Phase For 2 RF Channels, 4 Gradient Channels, All With 12 Bit Resolution. 14 Bit A/D At 100 KHz, Audio Filter 51.2 KHz In 200 Hz Steps. Local Memory Buffer 64 KByte. External Gating Input.
GRADIENTS---------------2 Gauss/cm Minimum 1 msec Maximum (Uncompensated) TECHRON Model 7570
-------------- HETERONUCLEAR DECOUPLER ------------Frequency Synthesizer Frequency Step Phase Control Phase, Discrete Steps Phase, Variable Steps Output Power Power Control Linearity of Power Control RF Amplifier Power Output
5 - 300 MHz PTS-500, Computer Controlled 0.1 Hz O - 360 Degrees 0, 90, 180, 270 Degrees 0.1 Degree Resolution Computer Controlled: 12 Bit DAC 0- 100 % ±1% 100WCW
------------ STANDARDMAGNETCONFIGURAilONS------------Field (T)/Bore (cm) 2/31 2/30.5 2.4/40 4.7/20 4.7/31 4.7/40 7/20 Bore With RT Shims And Gradients (cm) 26.5 26 33 15 26.5 31 15 Helium Evaporation (ml/hr) 50 50 50 50 55 60 50 Nitrogen Evaporation (ml/hr) 400 400 400 400 450 500 400 Half Length (mm) 350 275 570 396 460 735 575 5 Gauss Line - Radial From Center (m) 3.4 3.2 4.7 3.7 5.3 6.4 5.1
- Axial From Center (m) 4.4 4.0 5.9 4.7' 6.7 8.1 6.4 Other Magnet Sizes And Field Strengths Available On Special Order
Specifications subject to change
e OTSUKA ELECTRONICS (U.S.A.) INC.
EUROPE OTSUKA ELECTRONICS (EUROPE) LTD. P.O. Box 11 Abingdon, OXON OX141RW ENGLAND 0235-554454
FAR EAST OTSUKA ELECTRONICS CO., LTD. HEAD OFFICE 3-26-3 Shodai-Tajika Hirakata, Osaka 573 JAPAN 0720-55-8550
OTSUKA ELECTRONICS CO., LTD. TOKYO OFFICE 2F. Hashikan-LK Bldg. 1-6 Azuma-Cho Hachioji, Tokyo 192 JAPAN 0426-44-4951
DEC and VAX are Registered Trade Marks of the Digital Equipment Corporation. Copyright 1989. Otsuka Electronics (U.S.A.) Inc. Printed in U.S.A.
THE .JOHNS HOPKINS UNIVERSITY
SCHOOL OF MEDICINE
and
THE JOHNS HOPKINS HOSPITAL
383-7
Mailing Address: DEPARTMENT OF RADIOLOGY
AND
RADIOLOGICAL SCIENCE
THE JOHNS HOPKINS HOSPITAL
Baltimore, Md. 21205
Professor B.L. Shapiro, TAMU NMR Newsletter, 966 Elsinore Court, Palo Alto, CA 94303
Dear Professor Shapiro, Mode-Switched Radiofreguency Coils
July 12th 1990 (received 7/20/90)
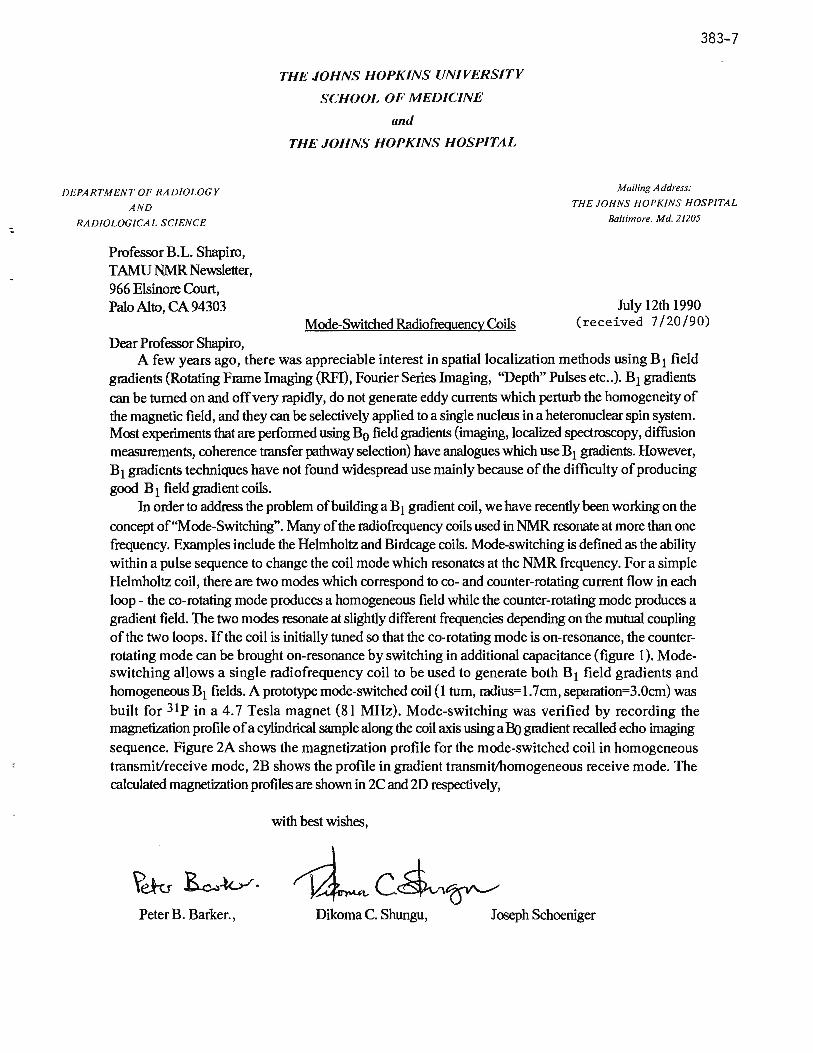
A few years ago, there was appreciable interest in spatial localization methods using B 1 field gradients (Rotating Frame Imaging (RFI), Fourier Series Imaging, "Depth" Pulses etc .. ). B1 gradients can be turned on and off very rapidly, do not generate eddy currents which perturb the homogeneity of the magnetic field, and they can be selectively applied to a single nucleus in a heteronuclear spin system. Most experiments that are performed using Bo field gradients (imaging, localized spectroscopy, diffusion measurements, coherence transfer pathway selection) have analogues which use B1 gradients. However, B 1 gradients techniques have not found widespread use mainly because of the difficulty of producing good B 1 field gradient coils.
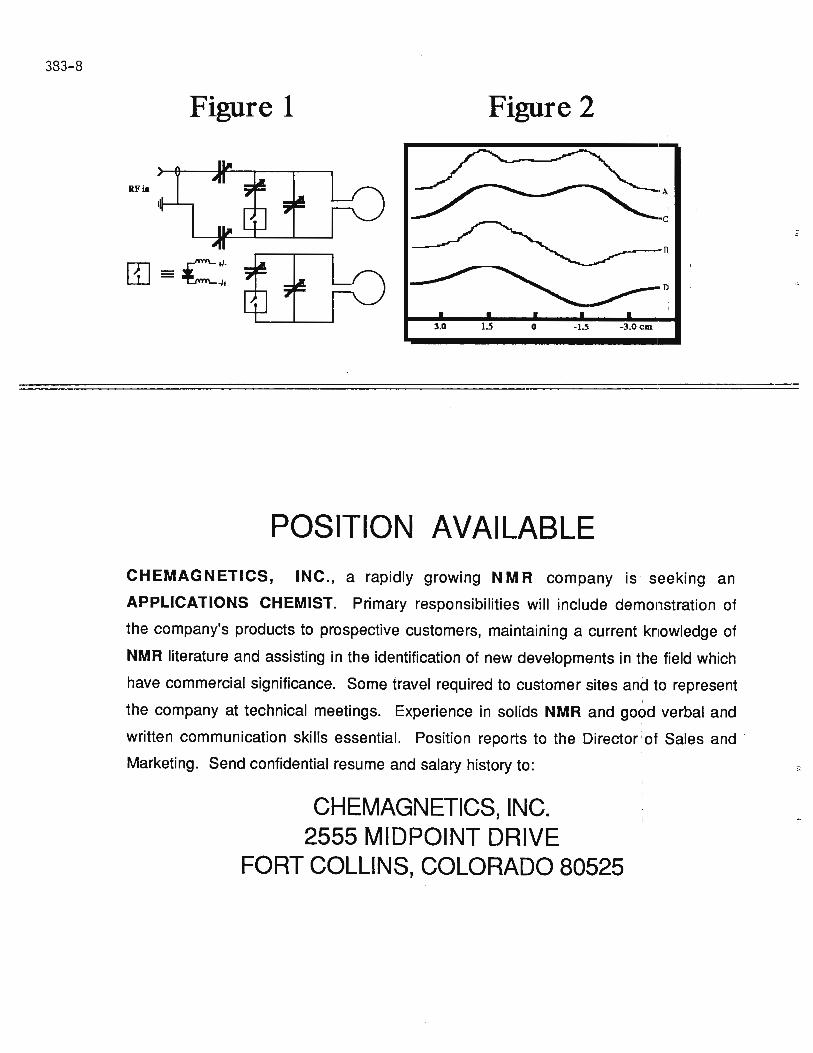
In order to address the problem of building a B1 gradient coil, we have recently been working on the concept of"Mode-Switching". Many of the radiofrequency coils used in NMR resonate at more than one frequency. Examples include the Helmholtz and Birdcage coils. Mode-switching is defined as the ability within a pulse sequence to change the coil mode which resonates at the NMR frequency. For a simple Helmholtz coil, there are two modes which correspond to co- and counter-rotating current flow in each loop- the co-rotating mode produces a homogeneous field while the counter-rotating mode produces a gradient field. The two modes resonate at slightly different frequencies depending on the mutual coupling of the two loops. If the coil is initially tuned so that the co-rotating mode is on-resonance, the counterrotating mode can be brought on-resonance by switching in additional capacitance (figure 1). Modeswitching allows a single radiofrequency coil to be used to generate both B 1 field gradients ~nd homogeneous B1 fields. A prototype mode-switched coil (1 tum, radius= 1. 7cm, separation=3.0cm) was built for 3lp in a 4. 7 Tesla magnet (81 MHz). Mode-switching was verified by recording the magnetization profile of a cylindrical sample along the coil axis using a Bo gradient recalled echo imaging sequence. Figure 2A shows the magnetization profile for the mode-switched coil in homogeneous transmit/receive mode, 2B shows the profile in gradient transmit/homogeneous receive mode. The calculated magnetization profiles are shown in 2C and 2D respectively,
with best wishes,
Peter B. Barker., Dikoma C. Shungu, Joseph Schoeniger
333-8
Figure 1 Figure 2
3.0 0 -1.S -3.0cm
POSITION AVAILABLE CHEMAGNETICS, INC., a rapidly growing 'NM R company is seeking an
APPLICATIONS CHEMIST. Primary responsibilities will include demonstration of I
the company's products to prospective customers, maintaining a current ,knowledge of i
NMR literature and assisting in the identification of new developments in the field which
have commercial significance. Some travel required to customer sites and to represent
the company at technical meetings. Experience in solids NMR and go0d verbal and
written communication skills essential. Position reports to the Director :of Sales and ·
Marketing. Send confidential resume and salary history to:
CHEMAGNETICS, INC. I
2555 MIDPOINT DRIVE FORT COLLINS, COLORADO 80525
4,1
Ql I UJJ WORCESTER
Iii\_ POLYTECHNIC lfrn~ INSTITUTE
Dr. Bernard L. Shapiro TAMU NMR Newsletter 966 Elsinore Court Palo Alto, California 94303
Lactate Edited Self-Diffusion Coefficient Measurements
Dear Dr. Shapiro,
. July 6, 1990 (received 7/8/90)
383-9
Biomedical Engineering Department
100 Institute Road Worcester, MA 01609-2280
(508) 831-5447 FAX (508) 831-5483
Knowledge of the sell-diffusion coefficient of biological metabolites would provide important information concerning compartmentation and mobility and could potentially be used to characterize the disease state of a tissue or organ. Unfortunately, the direct measurement of the diffusion coefficient of protonated metabolites, such as lactate, by the conventional Stejskal-Tanner technique (1) is frequently impossible due to the presence of interfering resonances (such as lipid). Therefore, the lactate diffusion measurement must implemented in concert with a suitable spectral editing technique.
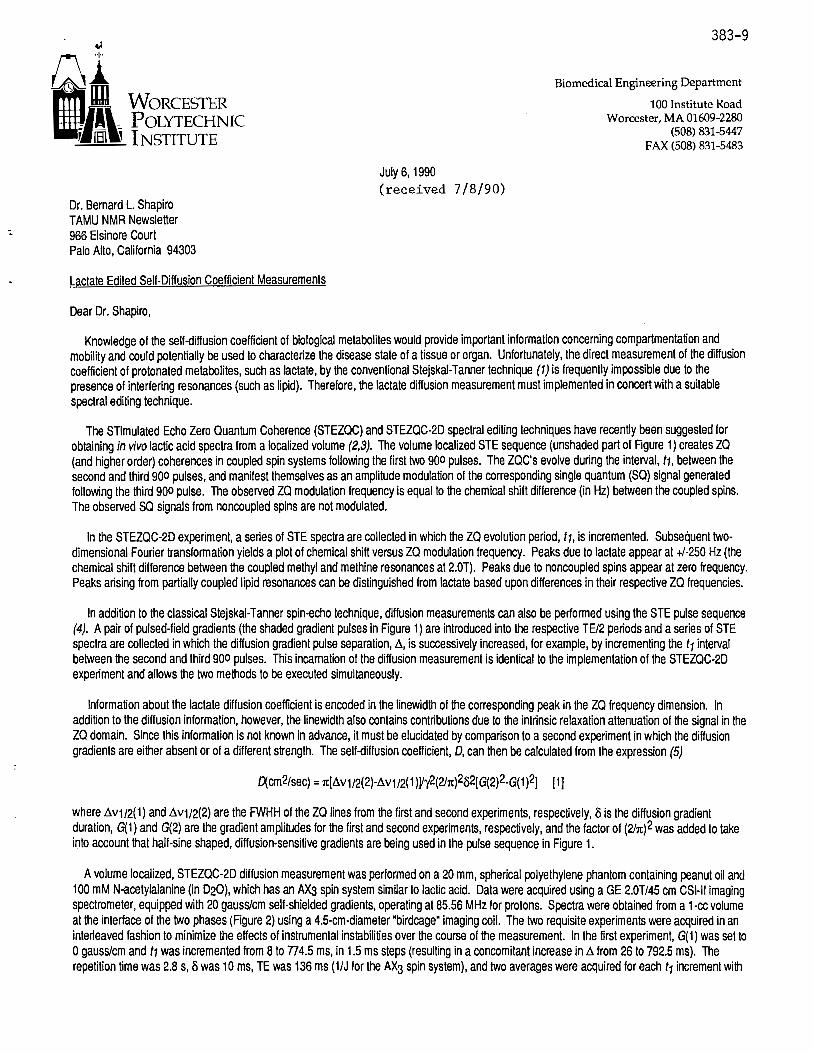
The STimulated Echo Zero Quantum Coherence (STEZQC) and STEZQC-2D spectral editing techniques have recently been suggested for obtaining in vivo lactic acid spectra from a localized volume (2,3). The volume localized STE sequence (unshaded part of Figure 1) creates ZQ (and higher order) coherences in coupled spin systems following the first two 900 pulses. The ZQC's evolve during the interval, t1, between the second and third 900 pulses, and manifest themselves as an amplitude modulation of the corresponding single quantum (SQ) signal generated following the third 900 pulse. The observed ZQ modulation frequency is equal to the chemical shift difference (in Hz) between the coupled spins. The observed SQ signals from noncoupled spins are not modulated.
In the STEZQC-2D experiment, a series of STE spectra are collected in which the ZQ evolution period, t1, is incremented. Subsequent twodimensional Fourier transformation yields a plot of chemical shift versus ZQ modulation frequency. Peaks due to lactate appear at +/-250 Hz (the chemical shift difference between the coupled methyl and methine resonances at 2.0T). Peaks due to noncoupled spins appear at zero frequency. Peaks arising from partially coupled lipid resonances can be distinguished from lactate based upon differences in their respective ZQ frequencies.
In addition to the classical Stejskal-Tanner spin-echo technique, diffusion measurements can also be performed using the STE pulse sequence (4). A pair of pulsed-field gradients (the shaded gradient pulses in Figure 1) are introduced into the respective TE/2 periods and a series of STE spectra are collected in which the diffusion gradient pulse separation,£\, is successively increased, for example, by incrementing the t1 interval between the second and third 900 pulses. This incarnation of the diffusion measurement is identical to the implementation of the STEZQC-20 experiment and allows the two methods to be executed simultaneously.
Information aboutthe lactate diffusion coefficient is encoded in the linewidth of the corresponding peak in the ZQ frequency dimension. In addition to the diffusion information, however, the linewidth also contains contributions due to the intrinsic relaxation attenuation of the signal in the ZQ domain. Since this information is not known in advance, it must be elucidated by comparison to a second experiment in which the diffusion gradients are either absent or of a different strength. The self-diffusion coefficient, D, can then be calculated from the expression (5)
where £\v1I2(1) and £\v112(2) are the FWHH of the ZQ lines from the first and second experiments, respectively, 8 is the diffusion gradient duration, G(1) and G(2) are the gradient amplitudes for the first and second experiments, respectively, and the factor of (2ht)2 was added to take into account that half-sine shaped, diffusion-sensitive gradients are being used in the pulse sequence in Figure 1.
A volume localized, STEZQC-2D diffusion measurement was performed on a 20 mm, spherical polyethylene phantom containing peanut oil and 100 mM N-acetylalanine (in D20), which has an AX3 spin system similar to lactic acid. Data were acquired using a GE 2.0T/45 cm CSl-11 imaging spectrometer, equipped with 20 gauss/cm self-shielded gradients, operating at 85.56 MHz for protons. Spectra were obtained from a 1-cc volume at the interface of the two phases (Figure 2) using a 4.5-cm-diameter "birdcage• imaging coil. The two requisite experiments were acquired in an interleaved fashion to minimize the effects of instrumental instabilities over the course of the measurement. In the first experiment, G(1) was set to 0 gauss/cm and t1 was incremented from 8 to 774.5 ms, in 1.5 ms steps (resulting in a concomitant increase in£\ from 26 to 792.5 ms). The repetition time was 2.8 s, 8 was 10 ms, TE was 136 ms (1/J for the AX3 spin system), and two averages were acquired for each t1 increment with
383-10
.. ~~--_,(\,.__ ______ _ ------~
+-a • ____ _;i---!"-~-----~-----. r..j A---ot,I -----------1t>Figure 1. Volume localized, diffusion sensitive Stimulated echo (STE) pulse sequence.
;1
: b
Fi gure 3. (a) ZQ time domain signal (r.eal and imaginary data) extracted from 2D dataset (at I. 1 ppm) acquired with C=O gauss/cm. (b) Expansion of Fourier transform of ( ,:) .
4 2 0 PPM
Figure 2. STE spectrum from a 1 cc : volume within a phantom containing lo'Q rnM N-a cetyl aL,uine (in D20) and reant1t 1oi1.
b
200 0 - 200 Hz
I
Figure 4. (a) ZQ time domai n signal
1(rea l and imaginary da t a )
extracted from 2D dataset (at l.J ppm) ac,quired with C=5 gauss/cm. (b) Expansion of Fourier trRnsform of (a).
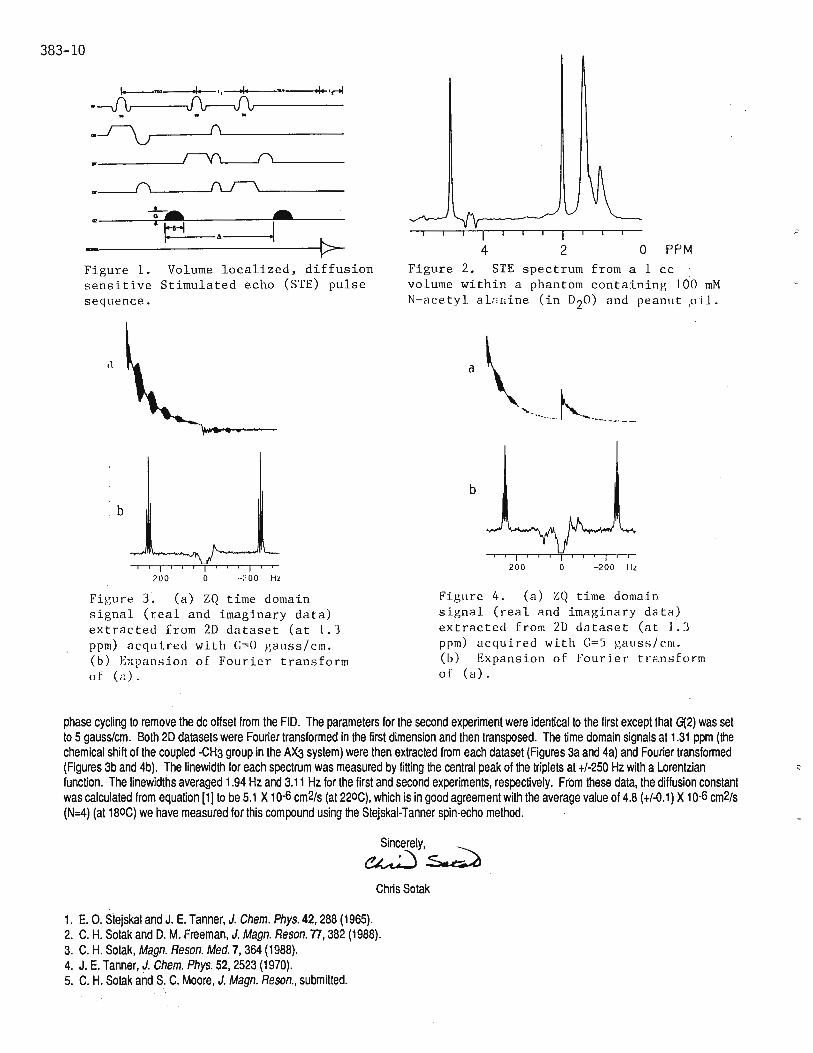
phase cycling to remove the de offset from the FID. The parameters for the second experiment were identical to the first except that G{2) was set to 5 gauss/cm. Both 20 datasets were Fourier transformed in the first dimension and then transposed. The time domain signals at 1.31 ppm (the chemical shift of the coupled -CH3 group in the AX3 system) were then extracted from each dataset (Figures 3a and 4a) and Fourier transformed (Figures 3b and 4b). The linewidth for each spectrum was measured by fitting the central peak of the triplets at +/-250 Hz with a Lorentzian function. The linewidths averaged 1.94 Hz and 3.11 Hz for the first and second experiments, respectively. From these data, the diffusion constant was calculated from equation (1) to be 5.1 X 10⁻⁶ cm2/s (at 220C), which is in good agreement with the average value of 4.8 (+/-0.1) X 10-6 cm2/s (N=4) (at 180C) we have measured for this compound using the Stejskal-Tann~r spin-echo method.
Sincerely, , ~ ~ _.s,,_...,~-
Chris Sotak
1. E. o: Siejskal and J.E. Tanner, J. Chem. Phys. 42,288 (1965). 2. C.H. Sotak and D. M. Freeman, J. Magn. Reson. 77,382 (1988). 3. C. H. Sotak, Magn. Reson. Med. 7,364 (1988). 4. J. E. Tanner, J. Chem. Phys. 52, 2523 (1970). 5. C. H. Sotak and S. C. Moore, J. Magn. Reson., submitted.
0 ......
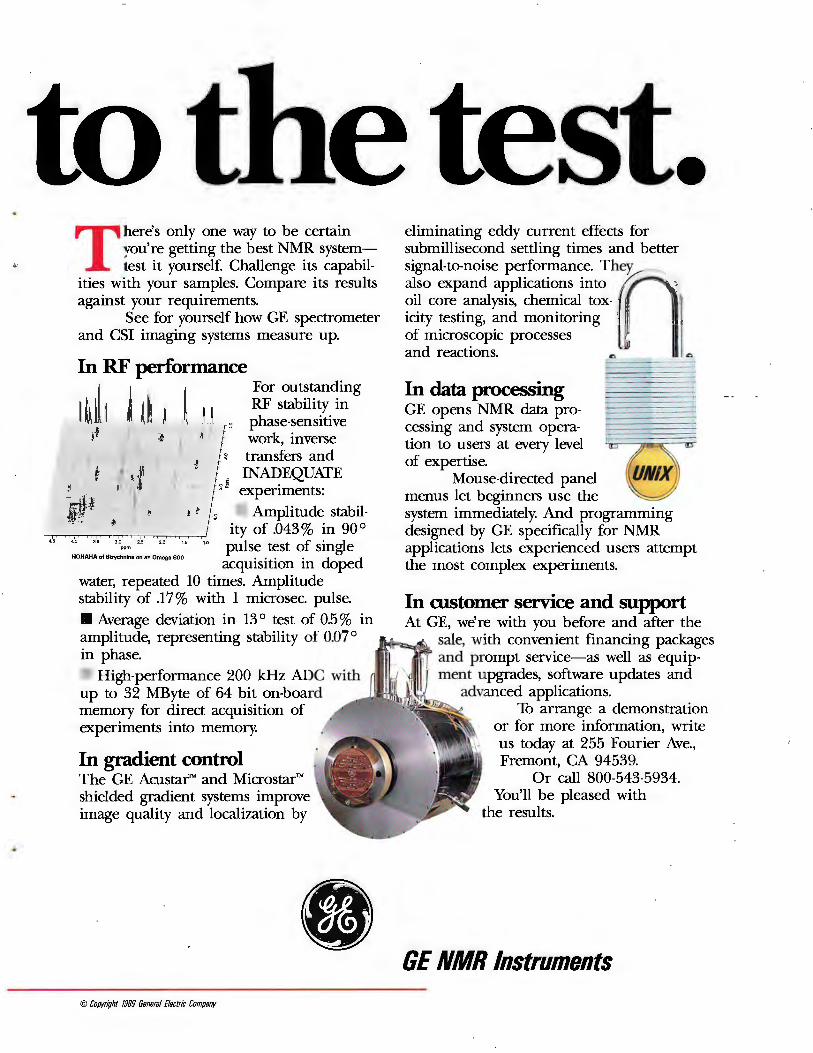
T here's only one way to be certain you're getting the best NMR systemtest it yourself. Challenge its capabil
ities with your samples. Compare its results against your requirements.
• eliminating eddy current effects for submillisecond settling times and better signal-to-noise performance. They also expand applications into
See for yourself how GE spectrometer and CSI imaging systems measure up.
oil core analysis, chemical tox- j , icity testing, and monitoring
1
of microscopic processes '
In RF performance
ll ! j For outstanding
I t, I j j ~ ~ RF stability in ~ ~f ~ 1 lL ~ phase-sensitive
¾ work, inverse transfers and INADEQUATE experiments:
Amplitude stability of .043 % in 90 °
" ~, '·' '·0,,m " '·0
,., 10 pulse test of single
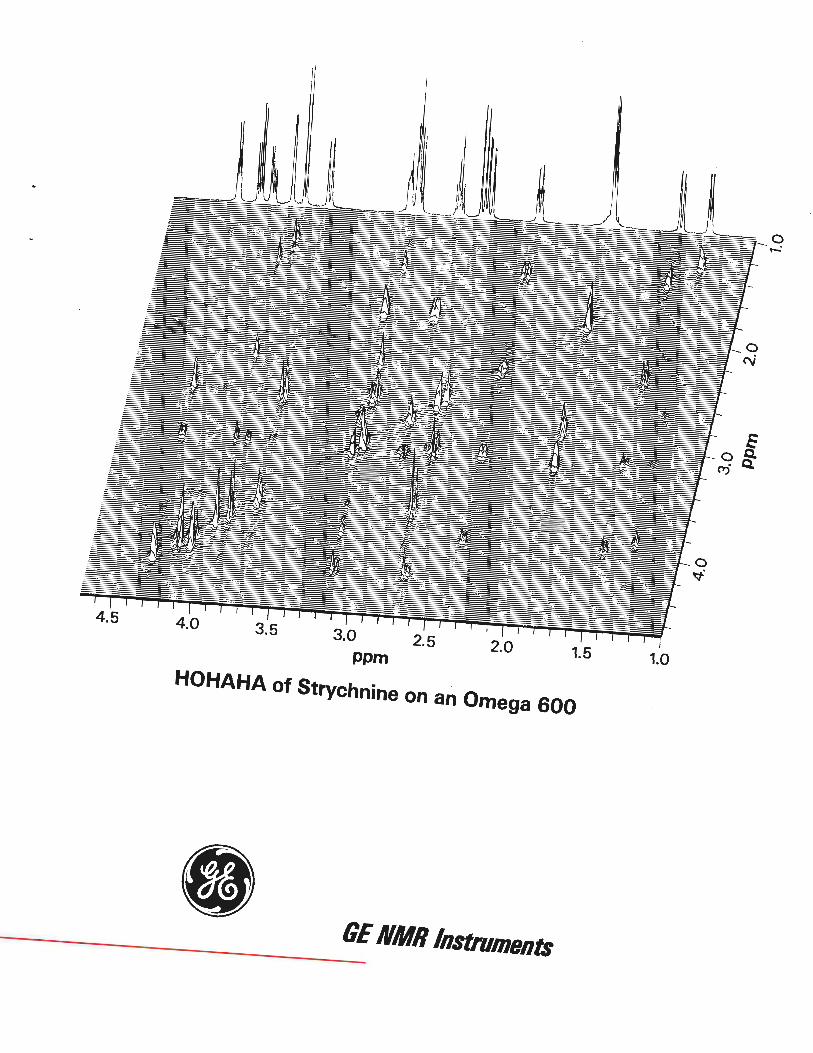
HOHAHA of Strychnine on en Omega 600 d d acquisition in ope
water, repeated 10 times. Amplitude stability of .17% with 1 microsec. pulse. ■ Average deviation in 13 ° test of 0.5 % in amplitude, representing stability of 0.07 ° in phase.
High-performance 200 kHz ADC with up to 32 MByte of 64 bit on-board memory for direct acquisition of experiments into memory.
In gradient control The GE Acustar™ and Microstar™ shielded gradient systems improve image quality and localization by
• © Copyright 1989 General Electric Company
and reactions. .,. I..,
In data processing GE opens NMR data processing and system opera-tion to users at every level ~ · · of expertise.
Mouse-directed panel UNIX menus let beginners use the system immediately. And programming designed by GE specifically for NMR applications lets experienced users attempt the most complex experiments.
In customer service and support At GE, we're with you before and after the
•i!"lir.._-.. sale, with convenient financing packages 1 • and prompt service-as well as equip
ment upgrades, software updates and advanced applications.
To arrange a demonstration or for more information, write us today at 255 Fourier Ave., Fremont, CA 94539.
Or call 800-543-5934. You'll be pleased with
the results.
GE NMR Instruments
,,
Alpha HDR The New Standard in Digitizer Performance
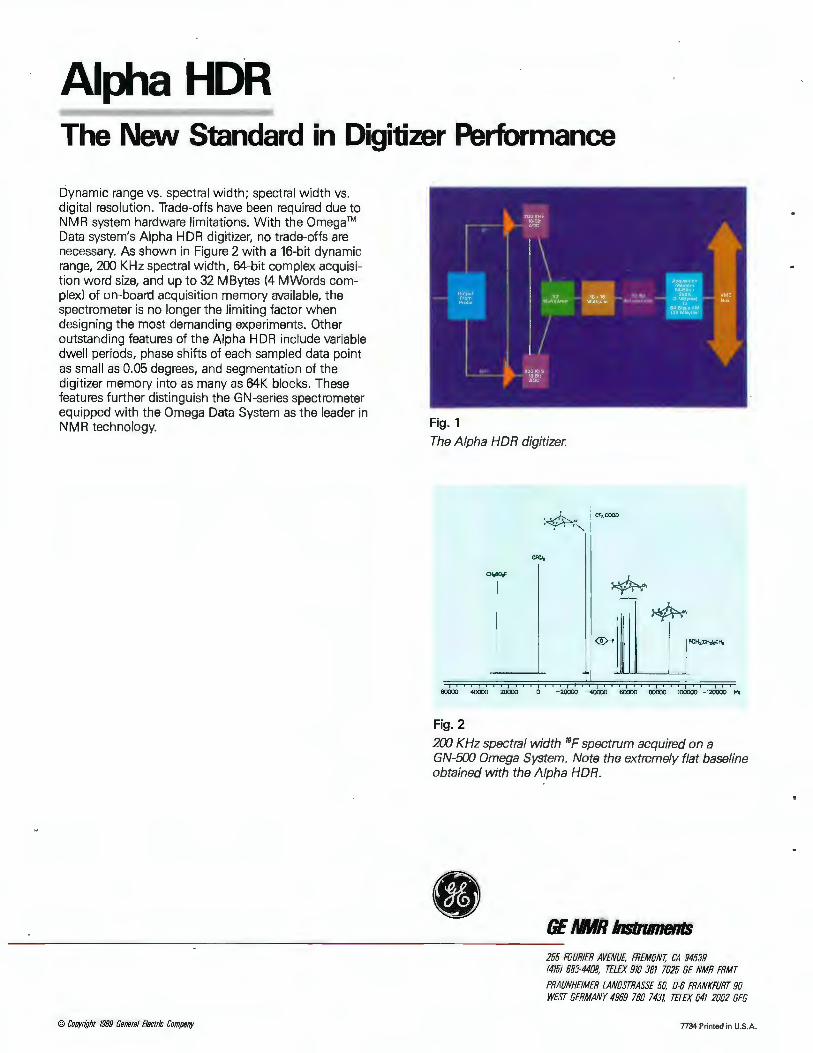
Dynamic range vs. spectra l width; spectral width vs. digital resolution . Trade-offs have been required due to NMR system hardware limitations. With the Omega™ Data system's Alpha HOR digitizer, no trade-offs are necessary. As shown in Figure 2 with a 16-bit dynamic range, 200 KHz spectral width, 64-bit complex acquisition word size, and up to 32 MBytes (4 MWords complex) of on-board acquisition memory available, the spectrometer is no longer the limiting factor when designing the most demanding experiments. Other outstanding features of the Alpha HOR include variable dwell periods, phase shifts of each sampled data point as small as 0.05 degrees, and segmentation of the digitizer memory into as many as 64-K blocks. These features further distinguish the GN-series spectrometer equipped with the Omega Data System as the leader in NMR technology.
© CoP'fright 1989 Geneml Elsctric Com{l8rr;
Fig. 1
The Alpha HDR digitizer.
OOCXX> 40000 20000 a -20000 -40CXXl -soooo -OOOOC> -100000 -120000 Hz
Fig. 2
200 KHz spectral width 19F spectrum acquired on a GN-500 Omega System. Note the extremely flat baseline obtained with the Alpha HOR.
GE MIIR Instruments 255 FOURIER AVENUE, FREMONT, CA 94539 (415) 683-4408, TELEX 910 381 7025 GE NMR FRMT
PRAUNHE/MER LANOSTRASSE 50, D-6 FRANKFURT 90 WEST GERMANY 4969 760 743l TELEX 041 2002 GEG
7734 Printed in U.S.A.
383-15
Columbia . University in the City of New York C. J. Turner
Department of Chemistry Havemeyer Hall ·
New York NY10027 Friday, July 6, 1990
Phone 212-854-4601
(received 7/18/90)
Dear Barry: Fast Phase Sensitive COSY
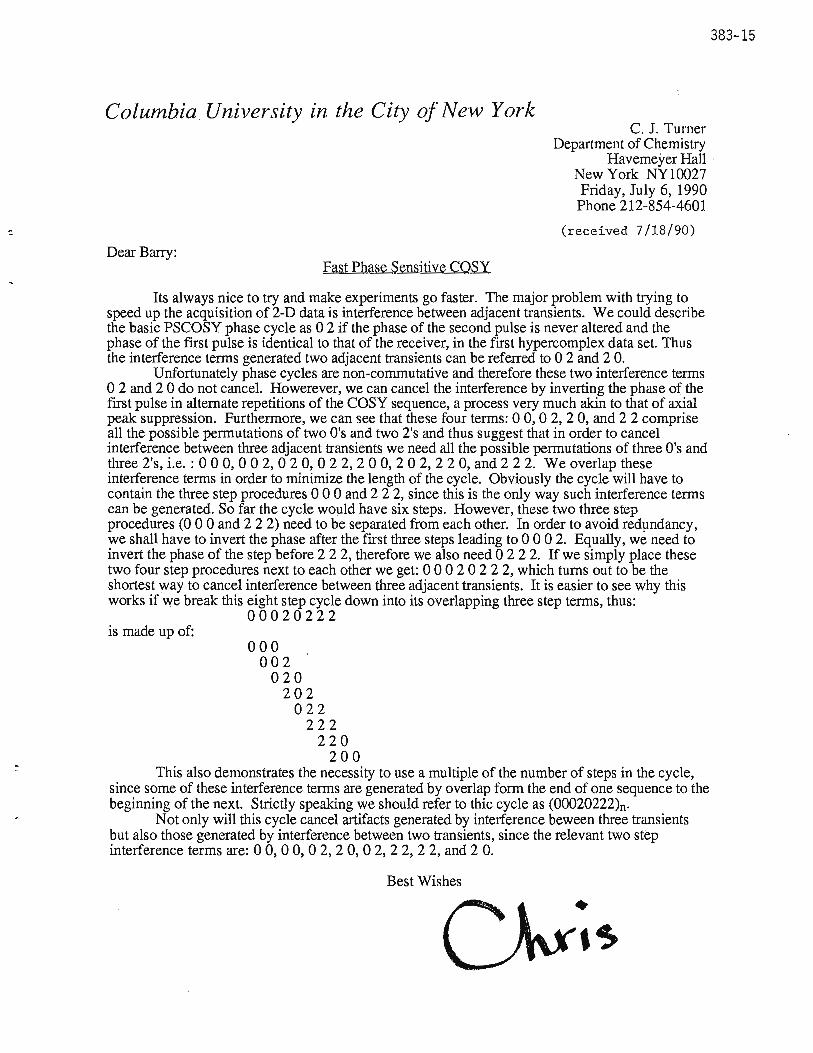
Its always nice to try and make experiments go faster. The major problem with trying to speed up the acquisition of 2-D data is interference between adjacent transients. We could describe the basic PSCOSY phase cycle as 0 2 if the phase of the second pulse is never altered and the phase of the first pulse is identical to that of the receiver, in the first hypercomplex data set. Thus the interference terms generated two adjacent transients can be referred to 0 2 and 2 0.
Unfortunately phase cycles are non-commutative and therefore these two interference terms 0 2 and 2 0 do not cancel. Howerever, we can cancel the interference by inverting the phase of the first pulse in alternate repetitions of the COSY sequence, a process very much akin to that of axial peak suppression. Furthermore, we can see that these four terms: 0 0, 0 2, 2 0, and 2 2 comprise all the possible permutations of two O's and two 2's and thus suggest that in order to cancel interference between three adjacent transients we need all the possible permutations of three O's and three 2's, i.e. : 0 0 0, 0 0 2, 0 2 0, 0 2 2, 2 0 0, 2 0 2, 2 2 0, and 2 2 2. We overlap these interference terms in order to minimize the length of the cycle. Obviously the cycle will have to contain the three step procedures 0 0 0 and 2 2 2, since this is the only way such interference terms can be generated. So far the cycle would have six steps. However, these two three step procedures (0 0 0 and 2 2 2) need to be separated from each other. In order to avoid redµndancy, we shall have to invert the phase after the first three steps leading to 0 0 0 2. Equally, we need to invert the phase of the step before 2 2 2, therefore we also need 0 2 2 2. If we simply place these two four step procedures next to each other we get: 0 0 0 2 0 2 2 2, which turns out to be the shortest way to cancel interference between three adjacent transients. It is easier to see why this works if we break this eight step cycle down into its overlapping three step terms, thus:
is made up of: 00020222
000 002
020 202
022 222
220 200
This also demonstrates the necessity to use a multiple of the number of steps in the cycle, since some of these interference terms are generated by overlap form the end of one sequence to the beginning of the next. Strictly speaking we should refer to thic cycle as (00020222)n-
Not only will this cycle cancel artifacts generated by interference beween three transients but also those generated by interference between two transients, since the relevant two step interference terms are: 0 0, 0 0, 0 2, 2 0, 0 2, 2 2, 2 2, and 2 0.
Best Wishes
383-16
PHILIPPS-UNIVERSITAT MARBURG FACHBEREICH CHEMIE
Prof. Dr. S. Berger
FB CHEMIE· HANS-MEERWEIN-STR.· D-3550 MARBURG
Prof. Dr. B. L. Shapiro TAMU-NMR Newsletter 966 Elsinore Court Palo Alto, Cal. 94303 USA
BITNET: BERGER@DMRHRZll MARBURG. DEN 29. 6 • 90 TELEFON (06421) 28-1 (received 7 /2/90) DURCHWAHL: (06421) 28 5520 TELEX 482372
SELRESOLV: Selective .Measurements of Long Range C,HCoupling Constants
Dear Professor Shapiro,
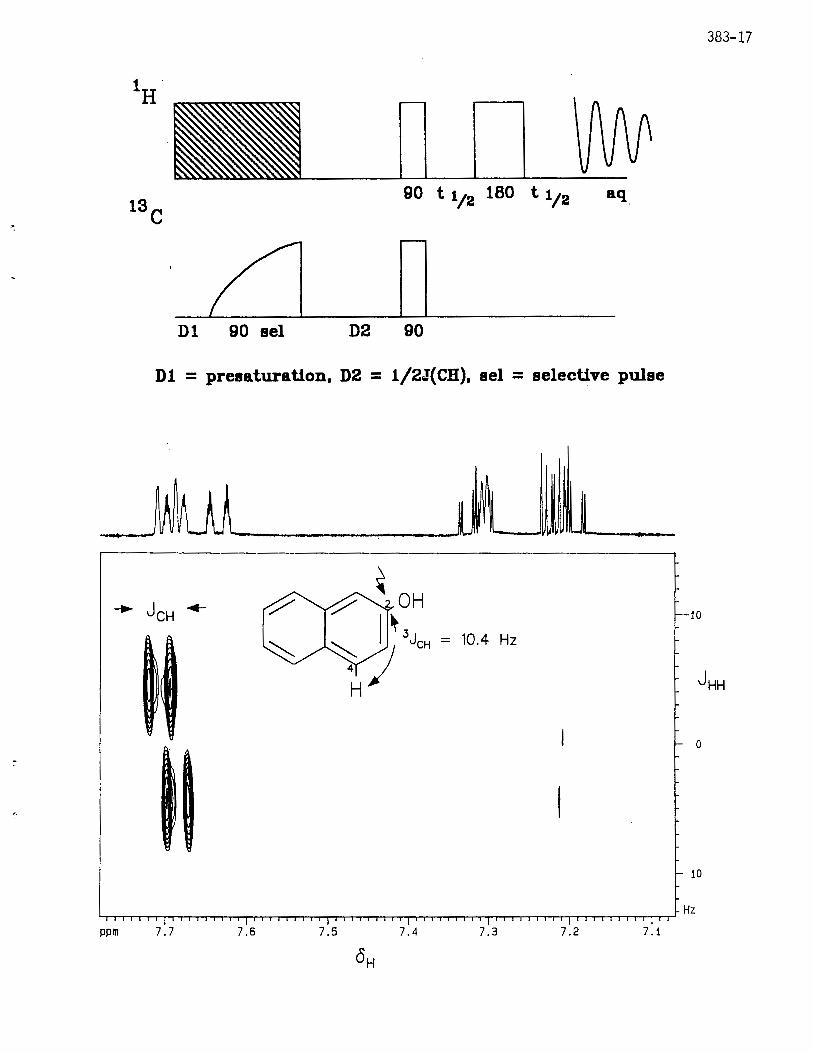
we would like to communicate a new variety of our selective~ pulse sequences112 . Sometimes one needs to know a long range C,H-spin coupling constant accurately. Usually one measures the gated decoupled carbon spectrum which, however, has to be analyzed carefully, because several protons exhibit spin coupling to the carbon atom in question and furthermore, very often the spin system is of higher order. Our sequence SELRESOLV tackles this problem by proton spectroscopy and belongs therefore to the class of inverse experiments, where first of all the signals of carbon-12 bound protons have to be suppressed. In addition, the proton proton multipletts must be separated from proton carbon couplings. We achieved this by a standard 2D Jresolved scheme. To obtain the information of only one carbon atom we used at the stijrt of the sequence one selective half gaussian pulse. · There are several o~h5r proposals in the literature to solve the same problem - , but we feel our method has the advantage that the desired coupling constant can be directly read from the 2Dspectrum. The example given on the opposite page is 2-hydroxynaphthalene, carbon atom 2 wa~ selected and its long range coupling to hydrogen 4
t1t::~r Matthias Ochs
1) S. Berger, Angewandte Chemie Int. Ed. 27, 1196 (1988). 2) s. Berger, J. Magn. Reson. 81, ,· 561 (1989). 3) A. Bax, R. Freeman, J. Am. Che~. Soc. 104, 1099 (1982). 4) T. K. Pratum, P. K. Hammen, N. H. Anderson, J. Magn. Re-son. 78, 376 (1988). 5) Bermel, w., Wagner, K., Griesinger, c., J. Magn. Reson. 83 223 (1989).
383-17
1 . H
vw · ~ n I I 13c
90 t 1;2 180 t t;2 aq
~
/1 n Dl 90 eel D2 90
Dl = preaaturation, D2 = 1/2J(CH), eel = selective pulse
-10
10.4 Hz
0
10
....,,...,,....,,.,....,....,..T""rT.,..,....,--r-r-,....,....,..T""rT.,..,....,--.--r-r--r-r"T""T"T-r-r-T...,.......,rr,-",--,--,-"T""T"T...,..,--,-.--,-r-r-r"T""T"T-r-T"""lrr,-"T""T""T".,...,..., Hz ppm 7.7 7.6 7.5 7.4 7.3 7.2 7.1
383-18
Dr. B. L. Shapiro Texas A&M Newsletter 966 Elsinore Court Palo Alto, CA 94303
Dear Dr. Shapiro:
m. OREGON ·
HEALTH SCIENCES UNIVERSI1Y 3181 S.W. Sam Jackson Park Road, Ponland, OR 97201-3098
Mail c.ode UHN 72, (503) 494-4498, FAX (503) 494-4621
School of Medld11e Departme11t of Dlag,,ostlc lladlology
June 12, 1990 (received 6/20/90)
RE: Real or Artifact?
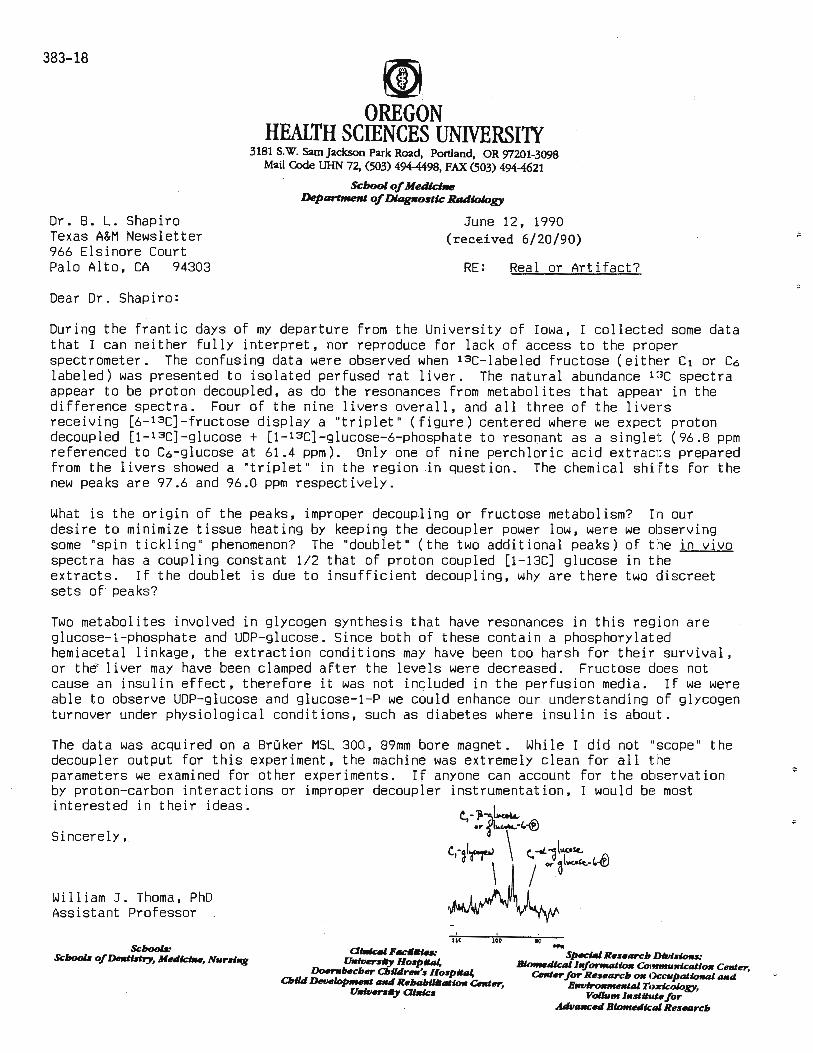
During the frantic days of my departure from - the University of Iciwa,) collected some data that I can neither fully interpret, nor reproduce for lack of access to the proper spectrometer. The confusing data were observed when 13C-labeled fructose (either C1 or C6 labeled) was presented to isolated perfused rat liver. The natural abundance 1,3c spectra appear to be proton decoupled, as do the resonances from metabolites that appear in the difference spectra. Four of the nine livers overall, and all three of the livers receiving [6- 13C]-fructose display a "triplet" (figure) centered where we expect proton decoupled [1- 13C]-glucose + [1-13C]-glucose-6-phosphate to resonant as a singlet (96.8 ppm referenced to C~-glucose at 61.4 ppm). Only one of nine perchloric acid extracts prepared from the livers showed a "triplet" in the region ,in question. The chemical shifts for the new peaks are 97.6 and 96.0 ppm respectively.
What is the origin of the peaks, improper decoupling or fructose metabolism? In our desire to minimize tissue heating by keeping the decoupler power low, were we observing some "spin tickling" phenomenon? The "doublet" (the two additional peaks) of the in vivo spectra has a coupling constant 1/2 that of proton coupled [1-13C] glucose in the extracts. If the doublet is due to insufficient decoupling, why are there two discreet sets of peaks?
Two metabolites involved in glycogen synthesis that have resonances in this region are glucose-1-phosphate and UDP-glucose. Since both of these contain a phosphorylated hemiacetal linkage, the extraction conditions may have been too harsh for their survival, or the· liver may have been clamped after the levels were decreased. Fructose does not cause an insulin effect, therefore it was not in~luded in the perfusion media. If we were able to observe UDP-glucose and glucose-1-P we could enhance our understanding of glycogen turnover under physiological conditions, such as diabetes where insulin is about.
The data was acquired on a Broker MSL 300, 89mm -bore magnet. While I did not "scope" the decoupler output for this experiment, the machine was extremely clean for all the parameters we examined for other experiments. lf anyone can account for the observation by proton-carbon interactions or improper decoupler instrumentation, I would be most interested in their ideas.
Sincerely,
William J. Thoma, PhD Assistant Professor
Schoo&: Schoo& of Dnllstry, M1tlllcbw, N11rnr,g
UC 100 II' -Sp.cu,l R•s•arcb Dlvisunu: Blo#Ntllcol l•forrtuuwr, Coifflfnl•tcallo• Ctml1tr
Cftd1tr for R1ts.tu"Cb °" Oce11paliorlol 1111d ' E~olTmdcology,
yoa,,,,. l•stthll1t for AAIJ11"C1td Biomedlc:al ReS1t11rcb
Double Tuneable
For any Wide Bore
Magnet
Interfaces with the
DSI VT Controller
Safe and easy to use.
Integral Dewars and Defrost System
For any Wide Bore Magnet
Interfaces with the DSI VT Controller
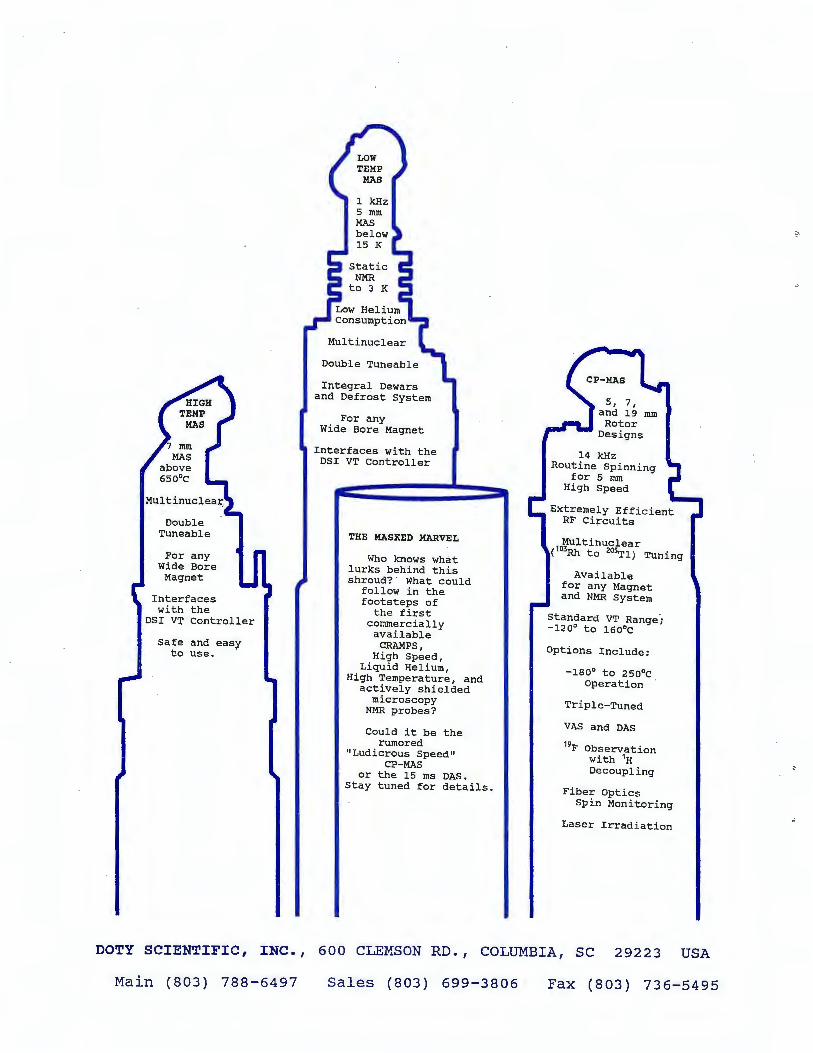
THE MASKED MARVEL
Who knows what lurks behind this shroud? . What could
follow in the footsteps of
the first commercially available
CRAMPS, High Speed,
Liquid Helium, High Temperature, and
actively shielded microscopy
NMR probes?
Could it be the rumored
"Ludicrous Speed" CP-MAS
or the 15 ms DAS. Stay tuned for details.
14 kHz Routine Spinning
for 5 mm High Speed
Extremely Efficient RF Ci+cuits
Multinuclear (
103Rh to 205Tl) Tuning
Available for any Magnet and NMR System
standard VT Range ·; -120° to l60°C
Options Include:
-180° to 2so 0c Operation ·
Triple-Tuned
VAS and DAS
19F Observation with 1H Decoupling
Fiber Optics Spin Monitoring
Laser Irradiation
DOTY SCIENTIFI C, INC. , 600 CLEMSON RD., COLUMBIA, SC 29223 USA
Main (803) 788 - 6497 Sales (803) 699-3806 Fax (803) 736-5495
383-21 ES-3739
ESTABLISHED I 8D2
E. I. DU PONT DE NEMOURS 8c COMPANY INCORPORATED
P.O. Box 80328 WILMINGTON. DELAWARE 19880-0328
CENTRAL RESEARCH 11: DEVELOPMENT DEPARTMENT
EXPERIMENTAL STATION
Dr. Bernard L. Shapiro TAMU NMR Newsletter 966 Elsinore Court Palo Alto, CA 94303
Dear Barry,
1990 June 28 )deviecer 09/50/70(
During a recent study of technetium-99 complexes, we wanted to determine if the hydrogen directly bonded to the technetium in the compound (Tc(PMe3)4(NHSCNH2)H)+(PF6)- could be readily replaced by deuterium. The spectrometer being used was a 1981 vintage Bruker WM-400. It has been upgraded from time to time but still has the original magnet which drifts downfield at about one ppm per day. This presents no problems unless one wants to look at weak deuterium samples requiring long data collection times. It is also difficult to shim such samples, since the use of a deuterated solvent for shimming would create a dynamic range problem, and the deuterium FID of the solute is too weak to be of use in shimming.
Since we were using protiated solvents, clearly what we needed was a proton lock and this was surprisingly easy to implement using a balanced mixer as a bidirectional frequency converter (1). A broadband probe tuned to the deuterium NMR frequency of 61.4 MHz was used. The lock cable was connected to one of the outer ports of a high level balanced mixer (Mini-Circuits model ZFM-2H) and the other outer port of the mixer was connected to the proton decoupling coil of the probe. About 1 volt of RF at 338.7225 MHz from a PTS-500 synthesizer was fed to the center port of the mixer. The deuterium lock pulses at 61.4 MHz are upconverted in the mixer to proton lock pulses at 400.13 MHz and excite the protons in the solvent via the proton decoupling coil. The resulting proton lock signal is downconverted in the same mixer back to 61.4 MHz. Despite losses in the mixer, the spectrometer can be easily locked up and shimmed using the protons in the solvent.
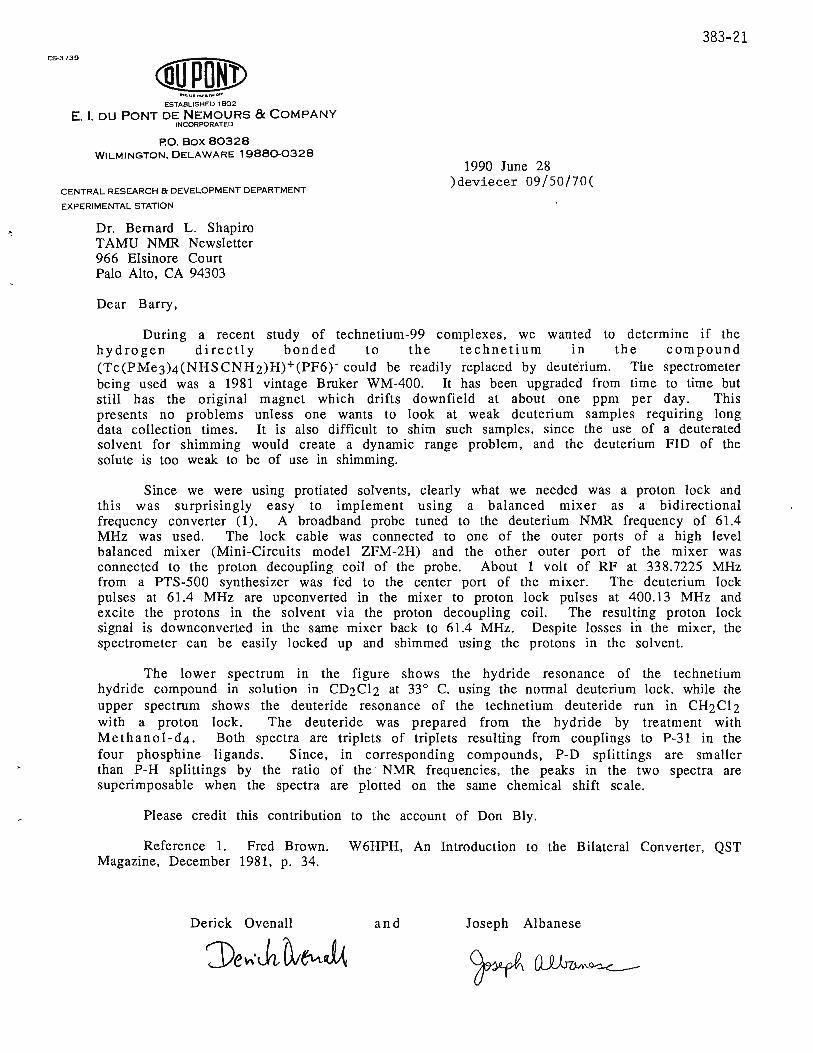
The lower spectrum in the figure shows the hydride resonance of the technetium hydride compound in solution in CD2Cl2 at 33° C. using the normal deuterium lock. while the upper spectrum shows the deuteride resonance of the technetium deuteride run in CH2 CI 2 with a proton lock. The deuteride was prepared from the hydride by treatment with Methanol-d4. Both spectra are triplets of triplets resulting from couplings to P-31 in the four phosphine ligands. Since, in corresponding compounds, P-D splittings are smaller than P-H splittings by the ratio of the · NMR frequencies, the peaks in the two spectra are superimposable when the spectra are plotted on the same chemical shift scale.
Please credit this contribution to the account of Don Bly.
Reference 1. Fred Brown. W6HPH, An Introduction to the Bilateral Converter, QST Magazine, December 1981, p. 34.
Derick Ovcnall and Joseph Albanese
383-22 Top spectrum: Deuterium NMR of Technetium Deutcridc in CH2Cl ~ using proton lock.
Bottom spectrum: Proton NMR of Technetium Hydride m CD2Cl 2 using deuterium lock.
-8.40 -8.60 -8.80 ~s.00 -s.20 -9.40 PPH
POSTDOCTORAL SCIENTIST
IN VIVO NMR/IMAGING SmithKline Beecham Pharmaceuticals, a worldwide leader; in pharmaceutical research, has a challenging opportunity in its Biological Nuclear Magnetic Resonance Research Group. This is a postdoctoral scientist position in NMR imaging and in vivo NMR spectroscopy. The successful candidate will be working in the area of
development of in vivo NMR techniques and its application to pharmacological research. The NMR group is equipped with two 500 MHz spectrometers and a 400 MHz spectrometer
with micro-imaging and solids accessories. A Sun 4, a Sparcstation and a -Microvax, connected to the spectrometers via standard networking, are used for off line data processing and image analysis. In addition we have access to a clinical 1.5 T instrument. Candidates should have a Ph.D. in physics, chemistry or biology with a strong background in NMR and an interest in in-vivo NMR.
Our state-of-the-art research facilities are located in suburban Philadelphia, near Valley Forge, PA. We offer a competitive compensation/benefits package as well as the opportunity for growth in a scientifically intense environment structured on creativity, tean:iwork and commitment. Please send your C.V. to
Nancy Hasson, Employment Administrator, IIH0145, SmithKline Beecham
Pharmaceuticals, P.O. Box 1539, King of Prussia, PA 19406-0939. We are an Equal Opportunity Employer, M/F/H/V.
SB Sm,thKllne Beecham
Pharmaceuticals
383-23
Dcpnrt111c11t of C/ie111istry
L O U I S I A N A S T AT E U N I V E R S IT Y ANO AGRICULTURAL AND MECHANICAL COLLl'G I:
BATON ROUG E · LOUISIANA · 7080'.1- 1804
Dr. B. L. Shapiro, Editor T AMU NMR Newsletter 966 Elsinore Court Palo Alto, CA 94393
504/388-3361
BUTLER@CHvi1t~~U June 21, 1990 (received 6/28/90)
3D NMR: Displaying the Results from Pulse Sequence Simulations.
Dear Dr. Shapiro: In some situations, it is so easy to simulate a pulse sequence that the simulation is done before one has a
"feel" for the effects of the pulse sequence. Recalling the pedagogical nature of Bloch diagrams, it is beneficial to display calculated spin magnetizations in a similar manner. However, for spin systems with the potential for dipolar or quadrupolar order, the length as well as the orientation of the spin magnetization is variable. To indicate both length and orientation of a vector on a 2D display, be it on paper or a computer screen, some three dimensional visual cueing is required. Herein, the possibilities of stereo diagrams are explored.
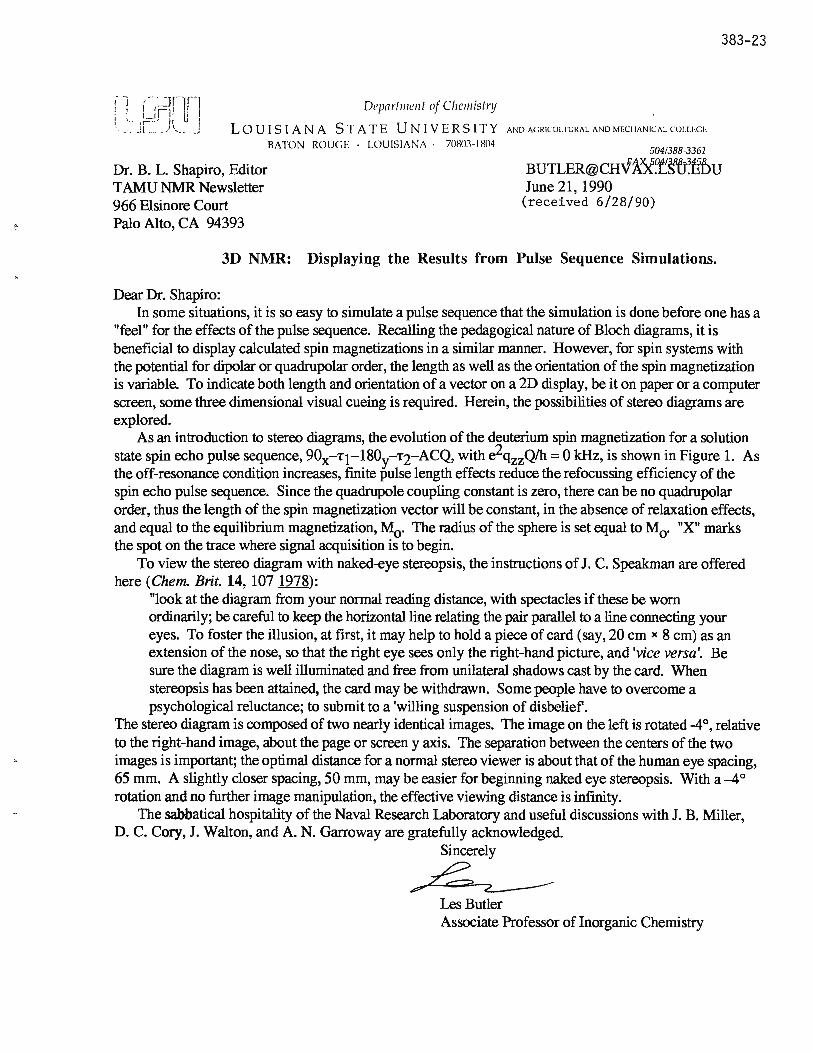
As an introduction to stereo diagrams, the evolution of the deuterium spin magnetization for a solution state spin echo pulse sequence, 90x-T1-l80y-T2-ACQ, with e2qz2Q/h = 0 kHz, is shown in Figure 1. As the off-resonance condition increases, finite pulse length effects reduce the refocussing efficiency of the spin echo pulse sequence. Since the quadrupole coupling constant is zero, there can be no quadrupolar order, thus the length of the spin magnetization vector will be constant, in the absence of relaxation effects, and equal to the equilibrium magnetization, M0 . The radius of the sphere is set equal to M0 . "X" marks the spot on the trace where signal acquisition is to begin.
To view the stereo diagram with naked-eye stereopsis, the instructions of J. C. Speakman are offered here (Chem. Brit. 14, 107 1978):
"look at the diagram from your normal reading distance, with spectacles if these be worn ordinarily; be careful to keep the horizontal line relating the pair parallel to a line connecting your eyes. To foster the illusion, at first, it may help to hold a piece of card (say, 20 cm x 8 cm) as an extension of the nose, so that the right eye sees only the right-hand picture, and 'vice versa'. Be sure the diagram is well illuminated and free from unilateral shadows cast by the card. When stereopsis has been attained, the card may be withdrawn. Some people have to overcome a psychological reluctance; to submit to a 'willing suspension of disbelief.
The stereo diagram is composed of two nearly identical images. The image on the left is rotated -4 °, relative to the right-hand image, about the page or screen y axis. The separation between the centers of the two images is important; the optimal distance for a normal stereo viewer is about that of the human eye spacing, 65 mm. A slightly closer spacing, 50 mm, may be easier for beginning naked eye stereopsis. With a--4° rotation and no further image manipulation, the effective viewing distance is infinity.
The sabbatical hospitality of the Naval Research Laboratory and useful discussions with J. B. Miller, D. C. Cory, J. Walton, and A. N. Garroway are gratefully acknowledged.
Sincerely
~ Les Butler Associate Professor of Inorganic Chemistry
383-24
Fig. 1 Calculated trajectories of the deuterium spin magnetization for a solution state spin echo pulse sequence, 90x-T1-l80y..:...T2-~c9.- Relevant parameters are: v(2H) = 30.7 MHz, T90 = 3 µs, Tl = 3 µs, T2 = 4.5 µs, sampling mterval = 0.05 µs, e2qzzQ/h = 0 kHz, and T = 300 K. The off-resonance conditions are: 5, 10, 20, and 40 kHz.
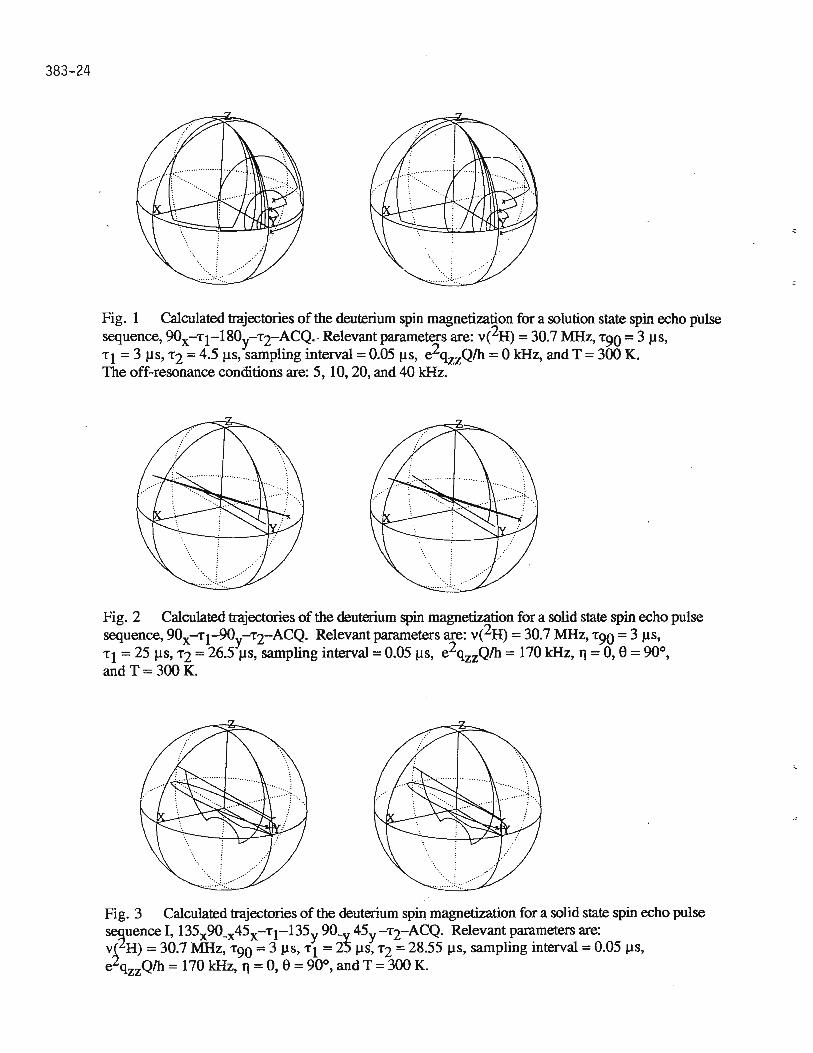
Fig. 2 Calculated trajectories of the deuterium spin magnetization for a solid state spin echo pulse sequence, 90x-T1-90y-T2-ACQ. Relevant parameters are: v(2H) = 30.7 MHz, T90 = 3 µs, Tl= 25 µs, T2 = 26.5 µs, sampling interval= 0.05 µs, e2qzzQ/h = 170 kHz, fl= 0, 0 = 90°, and T= 300 K.
Fig. 3 Calculated trajectories of the deuterium sp~ magnetization for a solid state spin echo pulse s~uence I, 135x90-x45x-T1-l 35y 90_ 45y -T2-ACQ. Relevant parameters are: v~ H) = 30.7 MHz, -r90 = 3 µs, -r1 = 2; µs, T2 = 28.55 µs, sampling interval = 0.05 µs, e qzzQ/h = 170 kHz, fl = 0, 0 = 90°, and T = 300 K.
Z·SPEC Four Nuclei Probe
FEATURES: 1H, 19F, 31P and 13C observe capability without retuning the probe. The four spectra shown on the
TECHNICAL:
The Z•SPEC Four Nuclei Probe
back were obtained using this probe. The only thing the NMR operator does is change the ob-serve frequency of the spectrome- interfaces directly to any Varian ter. The probe contains 200,300 or 400 MHz NMR Spec-no internal switches and ----L----~ trometer. The probe thus cannot wear out ~LL is capable of ob-from repeated observe serving an~ o~ the nuclei changes. 1 ~:::::~~~::;:;;;==~ four nuclei without
- retuning the ob-
APPLICA TIONS: ~ servefrequencyor
The Z•SPEC Four Nuclei changing 1/ 4 wavelength cables.
Probe is a great addition to t..::;;...--"L,:::;;;..---any NMR lab requiring high efficiency of sample throughput. Laboratories with automatic sample changers or open access environments benefit from the in-crease in experimental flexibility.
For more information, please contact Toby Zens, Manager of the Z•SPEC Products Group.
NALORAC CRYOGENICS CORPORATION 837 Arnold Drive, Suite 600, Martinez, CA 94553
Tel: (415) 229-3501 • FAX (415) 229-1651
Z · SPEC Four Nuclei Probe Spectra* 1H Observe I ,_ ________________ _
"I' '" ) " ljiliij il lij '"i " "'""l'"'I ii I I ij iiii ji ' " I'" j i " I ii I li i ji " l "" l 1 0 9 8 7 6 5 4 3 2 1 0 PPM
-----------------1 -1J~ . 5 -13~. 0
19F Observe
I -H1 . 0
I -141 . 5 pp
31P Observe I ..,_ ________________ __,
13C Observe
' 'l ' '' ' l '' · ' 1' ''' l''' ' l'' ••l '' ''l ··••i'''' 1· ·''l' ' 'l1iti, j ,li, j,li 1• ' '· 1•··' 1·' ·' !1,lijl ,, 1''''1·'' ' 100 80 b O 40 20 0 -20 -40 - bl) -ao PPM
I I * Spectra obtained with spectrometer operating in an automatic and unattended mode.
i i jliiljili lj ii l ijill l jlll lj l i lljlllljllll [ iilljlll l ji l ilj i ll i j l lljlllljill l jl ll ljll l ljll lljil l l jl l
180 160 140 120 100 80 60 40 20 0 PPM
NALORAC CRYOGENICS CORPORATION 837 Arnold Drive, Suite 600, Martinez, CA 94553
Tel: (415) 229-3501 • FAX (415) 229-1651
I THE UNIVERSITY OF NEW SOUTH WALES P.O. BOX 1 • KENSINGTON• NEW SOUTH WALES• AUSTRALIA• 2033
~ TELEX AA26054 • TELEGRAPH: UNITECH, SYDNEY• TELEPHONE 697-2222
FAX 61-2-662-2835 DIRECT LINE 697-4720
UNIVERSITY NMR FACILITY Dr. K.J. Cross PROJECT SCIENTIST
Dr. Bernard L. Shapiro TAMU NMR Newsletter 966 Elsinore Court Palo Alto, CA 94303
Dear Dr. Shapiro,
Models tor Porphyri□ Biog-Current Shifts
Fri, 6 Jul 1990 (received 7/14/90)
I have recently been reconsidering models for ring-current shifts experienced by atoms in close proximity to porphyrin ring-systems. In an earlier paper (1) a variety of ring-current models were calibrated using data from X-ray and NMR studies of a variety of heme proteins. The models used were relatively complex to calculate, but gave results in reasonable agreement with experiment.
Of the four models considered, three gave chemical shifts for the a-CH proton of Met 80 of cytochrome c in agreement with the experimental value of -1.42 ppm. The fourth model, a 5-loop Johnson-Bovey model gave a much smaller predicted shift of -0.57 ppm. The decision as to which model was giving the correct result was further complicated by evidence, from the ring-current shifts, that the Met 80 residue was in a slightly different position in the solution studies as compared to the X-ray study.
The model that I have been investigating also predicts a small ring-current shift for this atom. On further investigation, the polar angle e for this atom was found to be very close to 54.7°, the angle at which a dipolar type contribution to the ring-current shift goes to zero. Given that the atom is more than 5 A from the porphyrin ring, where the ring-current field should be approaching a dipolar field ( the higher order multipole contributions to the ring-current field tend rapidly to zero as the distance increases from the aromatic ring ), a large ring-current shift is not expected for this resonance.
The large ring-current shift in fact observed for the a-CH proton, despite the small dipole contribution, can be reconciled by assuming that the a-CH proton has moved from the X-ray determined location relative to the porphyrin. It is highly likely that the entire Met 80 residue of cytochrome c occupies a slightly different orientation in the solution structure as compared to the X-ray determined structure. The 8-loop Johnson-Bovey and both the Haigh-Mallion models appear to be unreliable at angles close to 54.7°.
We are currently investigating the ring-current shifts caused by aromatic side-chains in a series of sea anemone polypeptides. The structures of which have been determined by NMR.
Sincerely,
)<Q~ G--c-.ao Keith Cross
(1) K.J. Cross and P.E. Wright, J. Magn. Reson. 64, 220-231(1985)
Please credit this contribution to Dr. Ray Norton's account.
383-27
383-28
l♦I Conseil national de recherches Canada
lnstitut de recherche en biotechnologie
National Research Council Canada
Biotechnology Research Institute
6100, avenue Royalmount, Montreal, Quebec, Canada H4P 2R2
Tel.: (514) 496-6100
July 1, 1990
Dr. B.L. Shapiro, Editor TAMU Newsletter 966 Elsinore Court Palo Alto, CA 94303
Reference File
Linear-Prediction Methods for Solvent Suppression and Baseplane Flattening of NOESY and ROESY Spectra
Dear Dr. Shapiro,
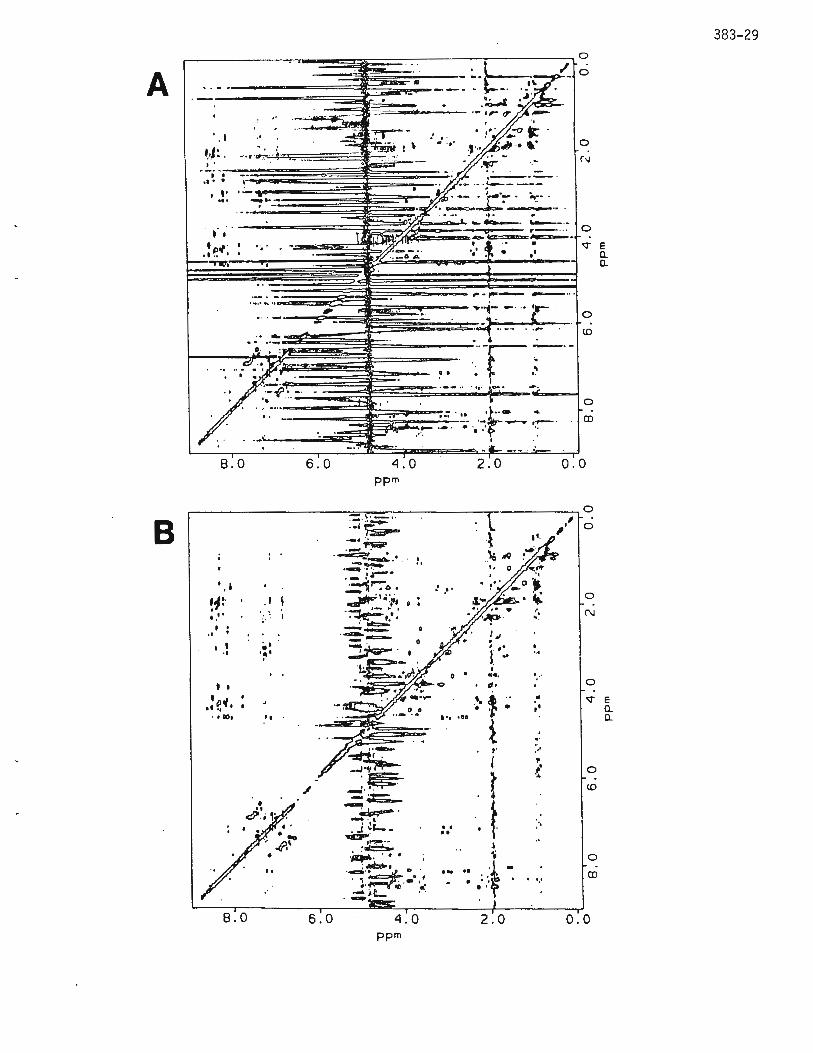
Cross-relaxation spectra, such as NOESY and ROESY, are of prime importance in the elucidation of the structure and dynamical properties of macromolecules of biological interest. In practice, the interpretation of NOESY and ROESY data is often complicated by the presence of large solvent resonance and baseplane distortions, especially for samples with very low concentration of the material under study (Figure A, the peptide was 3 mM in H20 in the presence 0.2 mM thrombin).
Advances in digital signal processing have offered very effective means for the enhancement of spectral quality. Bax and co-workers recently demonstrated that very good solvent suppresion can be achieved by a subtraction procedure involving the reconstruction of the large water resonance from the original FIDs acquired with the carrier centered on the solvent (Marion, Ikura and Bax, JMR 84, 425, 1989). They also showed that linear prediction (LP) methods can be used to correct the first few data points in the FID, thus reducing the baseline roll caused by these data points (Marion and Bax, JMR 83, 205, 1989). We have implemented these methods for use with Dennis Hare's FTNMR progrom to process spectra (Figure B) acquired on a Bruker AM-500 spectrometer. In this letter, we wish to point out a few enhancememts with our implementation.
For phase-sensitive NOESY and ROESY, we always acquire the FID's using TPPI with sine-modulation along t 1 (Otting, Widmer, Wagner and Wuthrich, JMR 66, 187, 1986). This eliminates the need for correcting the first data point in t 1 since this point is always zero. The FID matrix can be Fourier tranformed and phased along the t 1 dimension using FTNMR. The ·t 2-interferograms are used for LP processing since they in general contain much less signals than the full FID. In principle, we need a backward LP to reconstruct the first few data points along t 2 • The commonly used BURG algorithm is desig•ned, however, for the calculation of the forward prediction coefficients. In practice, one does not have to write
Canada
A
B
' , I
I•
. : .... .,,.. .#?"~-
' . .. . . , .. ' ,. .. , _ .. _ . -I• I
•11., · • •:. .. ... ..,...,,
8 . 0
' ,I •1:· . .. •· ..
t : .,
•' ' I ·• 1 ~ 1
' I
I &Joi I
,4 ., •
' . oo, ••
8.0
6.0
..
-✓
6 . 0
"'
4 . 0 ppm
:=.t•· .. , .::~
. -~-.:;:,f .... • ca :r--·• ~ l""'.:9 o • .,. I ~ '.;i, .
I • -~.:-: . -. ·--·---=- 0
~ · k~- : •• o•,J .
-. ~ ~ 1
:~· -·· -~ ~-- · • . J. ~i- -q::z,,,·
, .-,:m:•• . :~ -~- . , . . ~ '
-d,.~c, · . ~ .. G • ,t
_:• IL_ ID 0Q~ -4.0
ppm
. ·--~ ---=- · . ·- . ;-:~ . :..:- . ··~~ -=·· ·•· ..
~ oa..-,. "------ ·-
:.:_::!l-....rw,....= ~~-. . .•. . ,'
••
0
0
s;r E CL CL
0
(0
0
ro
2.0 0.0
0 ,., 0
·\ .\ii
,! .• . 0
'• N '
! ., I • • l .. ' 0 • 04,
d • 0
·'· ' .. • s;r ;, E
• • CL . .. . .. CL
i ,. .•·
' " l 0
t .. (0
t .. ••
l "; 0
·-.. -··~ . ro • . ' •.• ..
2.0 0 . 0
383-29
383-30 a different program for this. Since the BURG algorithm is symmetric in time (Ni and Scheraga, JMR 70, 506, 1986), we simply take the first few hundred (e.g. 200) data points and reverse the order before applying the LP extension. After LP, the 200 data points are again reversed and patched to the rest of the FID for Fourier transformation and phasing along the t 2 direction. A special data shuffling is required for the SMX file thus obtained before the spectrum can be displayed and plotted by FTNMR.
LP can also be incorporated to improve solvent suppresion by convolution of the t ~me-domain data. In the original procedure (Marion, Ikura and Bax, JMR 84, 425, 1989), the solvent signal was reconstructed from the FID via a smoothing operation using a sinebell shaped or a Gaussian-shaped window function. The first and the last M/2 (Mis the width of the window) data points were then calculated by linear extrapolation of the available solvent signal. We, however, used LP to calculate these missing points in the reconstructed solvent signal. The full solvent FID is then subtracted from the original FID.
Figure B shows the effect of the LP-based solvent suppression and baseplane flattening on the quality of a transferred NOESY spectrum of a 21-residue peptide complexed to thrombin. Both Figure A and B were processed and plotted using identical parameters apart from the LP processing used in obatining the spectrum in Figure B. The Fortran program was written as a supplementary (USR) command of the FTNMR program. This program and a few FTNMR macros are available upon request by sending an Email address to <FENGNI@BRIMV . NRC . CA>. I do not have time to supply these programs using tapes.
Yours sincerely,
1· /4c;V'· Feng Ni, Ph.D Protein Engineering
Re: POSTDOC POSITION AVAILABLE
I have an immediate opening for a postdoc in the field of NMR studies on adsorption at the liquid-solid interface. The stipend is prolongable to two years in tot al. Our equipment includes one Bruker MSL-200 ( with ethernet, diffusion- and micro-imaging attachments) and one multinuclear JEOL FX-100, equipped for FT-self-diffusion measurements. We also have access to Bruker high-resolution 400 and 200 MHz spectrometers and extensive VAX computing facilities, including Work_station-based N!\1Rl/NMR2/IMAGE/MEM from NMRi, as well as Ethernet transfer bet_ween the Bruker spectrometers and the Local
Area VAXcluster .
Interested persons please contact Peter Stilbs at the address given below. ·
Address: Prof. Peter Stilbs The Royal Institute of Technology Dept. of Physical Chemistry S-100 44 STOCKHOLM . Sweden
Telephone: Nat. 08-790 82 01 Int. +46 8-790 82 0 I Seer. 08-790 85 94·
Telefax: Nat 08- 79082 07 Int +46 8-790 82 07 Cable: Technology
Electronic mail: stilbsqjsek th. bitnet peter© physchem. k th . SP
The AMX overcomes the barrier
RoutineNMR
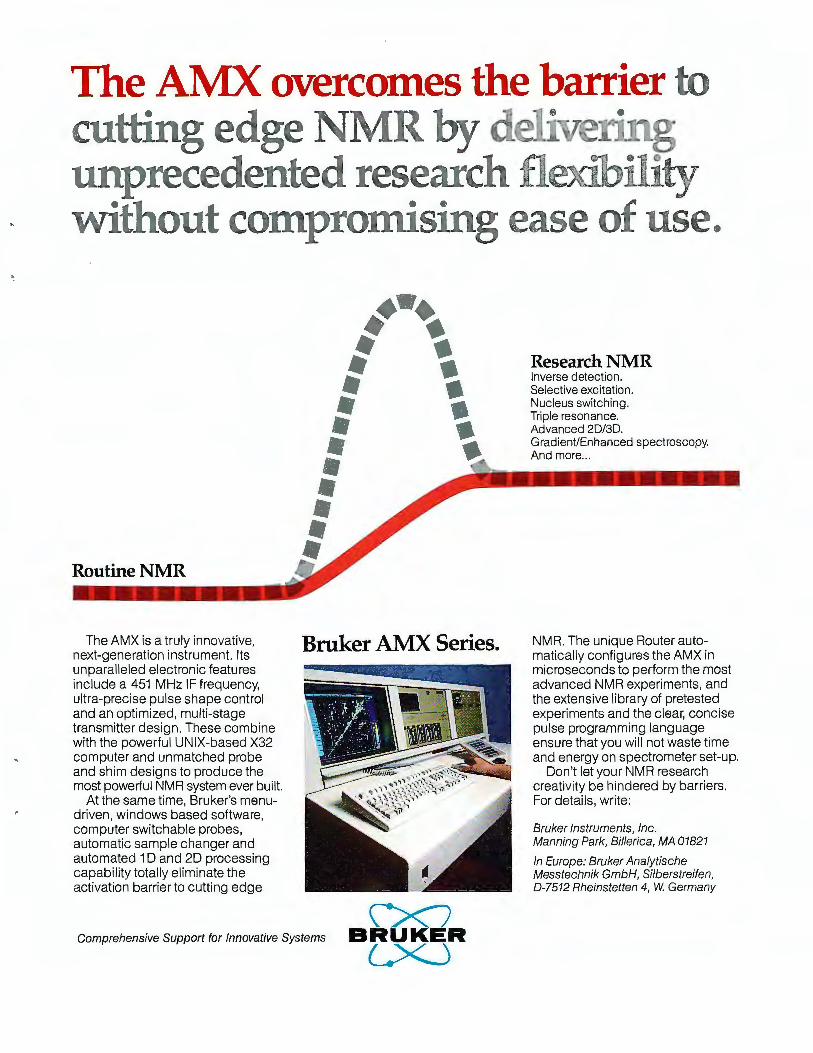
The AMX is a truly innovative, Bruker AMX Series. next-generation instrument. Its unparalleled electronic features include a 451 MHz IF frequency, ultra-precise pulse shape control and an optimized, multi-stage transmitter design. These combine with the powerful UNIX-based X32 computer and unmatched probe and shim designs to produce the most powerful NMR system ever built.
At the same time, Bruker's menudriven, windows based software, computer switchable probes, automatic sample changer and automated 1 D and 2D processing capability totally eliminate the activation barrier to cutting edge
Comprehensive Support for Innovative Systems \XI
BRUKER LX.J
Research NMR Inverse detection . Selective excitation. Nucleus switching . Triple resonance. Advanced 2D/3D. Gradient/Enhanced spectroscopy. And more ...
NMR. The unique Router automatically configures the AMX in microseconds to perform the most advanced NMR experiments, and the extensive library of pretested experiments and the clear, concise pulse programming language ensure that you will not waste time and energy on spectrometer set-up.
Don't let your NMR research creativity be hindered by barriers. For details, write:
Bruker Instruments, Inc. Manning Park, Billerica, MA 01821
In Europe: Bruker Analytische Messtechnik GmbH, Silberstreifen, D-7512 Rheinstetten 4, W. Germany
A~X Series Block Diagrams
r-------, F1/F2 r-------, I Frequency Router I SE-451 I
Generation I I
[:] I I T-FX
I I I
0 I 0 I M T-FH 0 F2 I lg- I I I<( L-------.J
r----, r----, I F3 I I PTS-250 I I Optional I Optional L._ ____ .J L._ ____ .J
------- RF Block Diagram
FX/FH Router
' ' I ' I ' i' __ ...J._
I I I
I I I I I '1 I;
I; I/ -----
X Transmitter
'H Transmitter
r-----, Optional I
I Transmitter I L ____ .J
Probe
0 0
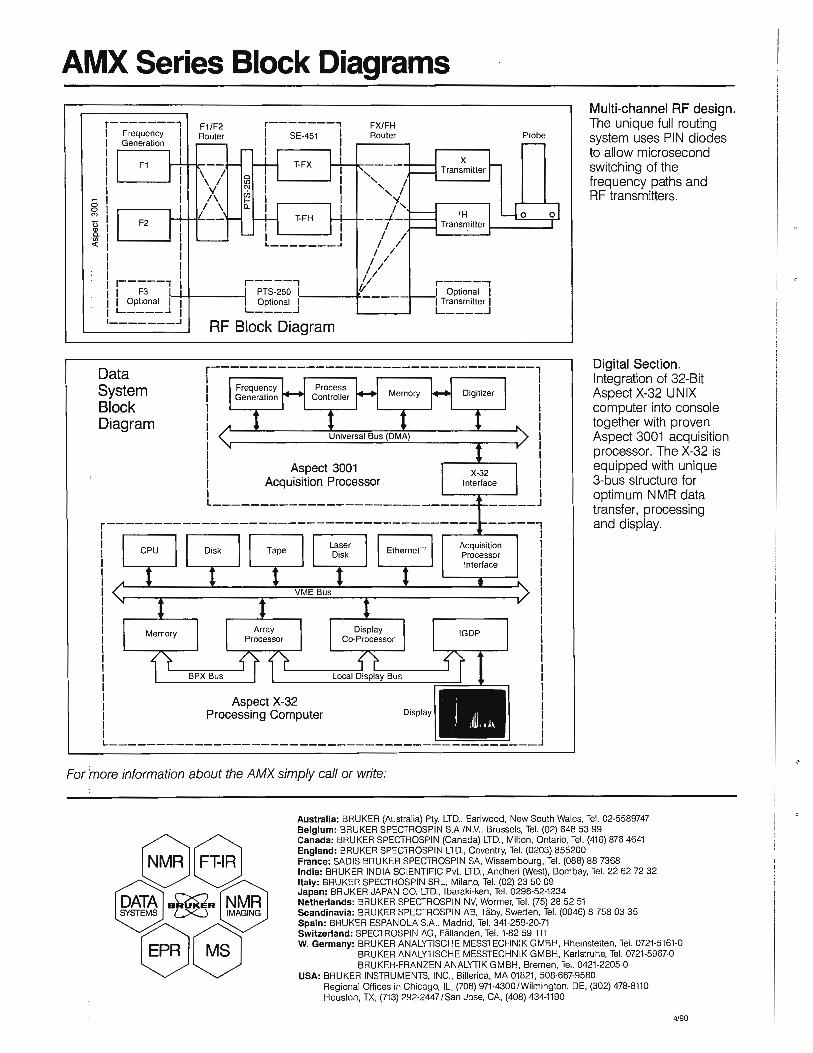
Multi-channel RF design. The unique full routing system uses PIN diodes to allow microsecond switching of the frequency paths and RF transmitters.
Data System
I Block
1 Diagram
r----------------------------------, I I I I I I I I I
Frequency Generation
Process Controller Memory Digitizer
Digital Section. Integration of 32-Bit Aspect X-32 UNIX computer into console together with proven Aspect 3001 acquisition processor. The X-32 is equipped with unique 3-bus structure for optimum NMR data transfer, processing and display.
I Universal Bus (OMA)
I Aspect 3001 I Acquisition Processor I L--------------------------- _____ J
r----------- --------------------------- -----, 1 __ ...,i. __ _
I I CPU Disk Tape
Laser Disk
VME Bus
BPX Bus
Array Processor
Aspect X-32 Processing Computer
Ethernet"' Acquisition Processor Interface
rn,,,.,.
I I I I I I I
_____________________________________________ j
For ½?ore information about the AMX simply call or write:
88 A BC?.QR N
EMS rx::i IMA
ee
Australia: BRUKER (Australia) Pty. LTD., Earlwood, New South Wales, Tel. 02-5589747 Belgium: BRUKER SPECTROSPIN S.A./N .V., Brussels, Tel. (02) 648 53 99 Canada: BRUKER SPECTROSPIN (Canada) LTD., Milton, Ontario, Tel. (416) 876-4641 England: BRUKER SPECTROSPIN LTD., Coventry, Tel. (0203) 855200 France: SADIS BRUKER SPECTROSPIN SA, Wissembourg , Tel. (088) 88 7368 India: BRUKER INDIA SCIENTIFIC Pvt. LTD., Andheri (West), Bombay, Tel. 22 62 72 32 Italy: BRUKER SPECTROSPIN SAL, Milano, Tel. (02) 23 50 09 Japan: BRUKER JAPAN CO. LTD., lbaraki-ken, Tel. 0298-52-1234 Netherlands: BRUKER SPECTROSPIN NV, Wormer, Tel. (75) 28 52 51 Scandinavia: BRUKER SPECTROSPIN AB, Taby, Sweden, Tel. (0046) 8 758 03 35 Spain: BRUKER ESPANOLA S.A., Madrid, Tel. 341 -259-20-71 Switzerland: SPECTROSPIN AG, Fiilianden, Tel. 1-82 59 111 W. Germany: BRUKER ANALYTISCHE MESSTECHNIK GMBH, Rheinstetten, Tel. 0721-5161-0
BRUKER ANALYTISCHE MESSTECHNIK GMBH, Karlstruhe, Tel. 0721 -5967-0 BRUKER-FRANZEN ANALYTIK GMBH, Bremen, Tel. 0421-2205-0
USA: BRUKER INSTRUMENTS, INC., Billerica, MA 01821, 508-667-9580 Regional Offices in Chicago, IL, (708) 971-4300/Wilminglon, DE, (302) 478-8110 Houston, TX, (713) 292-2447 /San Jose, CA, (408) 434-1190
4/90
Professor BL Shapiro TAMU Newsletter 966 Elsinore Ct. Palo Alto, CA 94303
Lilly Research Laboratories A Division of Eli Lilly and Company
Lilly Corporate Center Indianapolis, Indiana 46285
(31 7) 276-2000
383-33
June 1, 1990 (received 6/29/90)
Neighbors Dear Barry,
We at Lilly Research Laboratories certainly recognize the importance of a multidisciplined approach to solving chemical and biological problems. That has created a camaraderie between those of us practicing the various spectroscopic techniques here in Physical Chemistry. This collaboration is enhanced by the close proximity of all of our laboratories.
That camaraderie, however, was recently tested when the Mass Spectroscopy lab proposed to place their new double-focus instrument in the adjacent lab to the NMR spectrometers. But what was an obvious infraction to the NMR spectroscopists, was not so obvious to the Mass spectroscopists, nor to management. To prove the validity of our claims and to keep our AM-500 from being magnetically assaulted, we executed the following experiment.
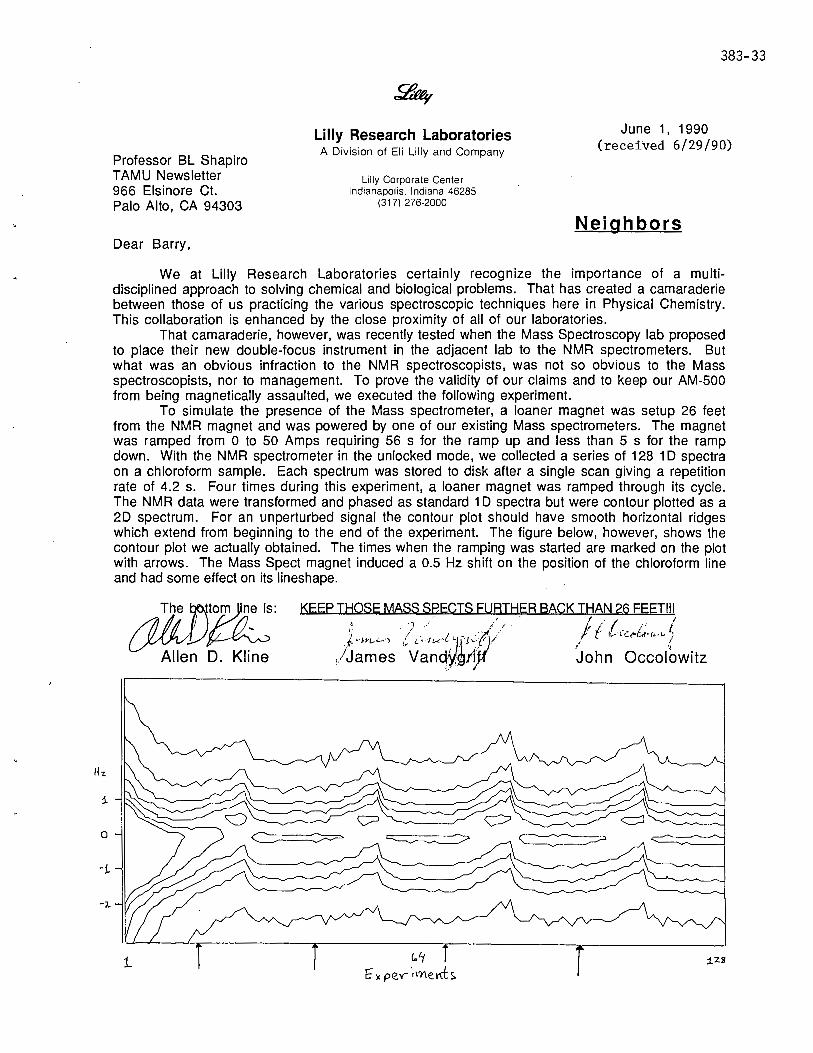
To simulate the presence of the Mass spectrometer, a loaner magnet was setup 26 feet from the NMR magnet and was powered by one of our existing Mass spectrometers. The magnet was ramped from 0 to 50 Amps requiring 56 s for the ramp up and less than 5 s for the ramp down. With the NMR spectrometer in the unlocked mode, we collected a series of 128 1 D spectra on a chloroform sample. Each spectrum was stored to disk after a single scan giving a repetition rate of 4.2 s. Four times during this experiment, a loaner magnet was ramped through its cycle. The NMR data were transformed and phased as standard 1 D spectra but were contour plotted as a 2D spectrum. For an unperturbed signal the contour plot should have smooth horizontal ridges which extend from beginning to the end of the experiment. The figure below, however, shows the contour plot we actually obtained. The times when the ramping was started are marked on the plot with arrows. The Mass Spect magnet induced a 0.5 Hz shift on the position of the chloroform line and had some effect on its lineshape.
dl!JJ~' Allen D. Kline
383-34
July 12, 1990 (received 7/16/90)
Prof. B. L. Shapiro TAMU NMR Newsletter 966 Elsinor Court Palo Alto, CA 94303
Al NMR of Zeolites
Amoco Corporation Amoco Research Center Post Office Box 3011 Naperville, Illinois 60566 708-420-5111
The '.analysis of zeolites using aluminum NMR is not straightforward. beeri several reports1 of a peak at 30 ppm that has been attributed spedies in a strained tetrahedral or pentacoordinate environment. spectra at two fields (9.4 and 14.l T), that both types of species dealuminated Y zeolites.
Recently, there have to either an aluminum By obtaining aluminum can be found in steam
We studied a series of commercial Union Carbide zeolites, LZ-Y62, LZ-Y82, and LZ-Y20, by aluminum NMR. The LZ-Y62 sample is the ammonium form of an as synthesized Y zeolite, whi~h is steamed to remove aluminum from the framework. The dealuminated sample is exchanged to the ammonium form, LZ-Y82, which is steam dealuminated a second time to from LZ-Y20.
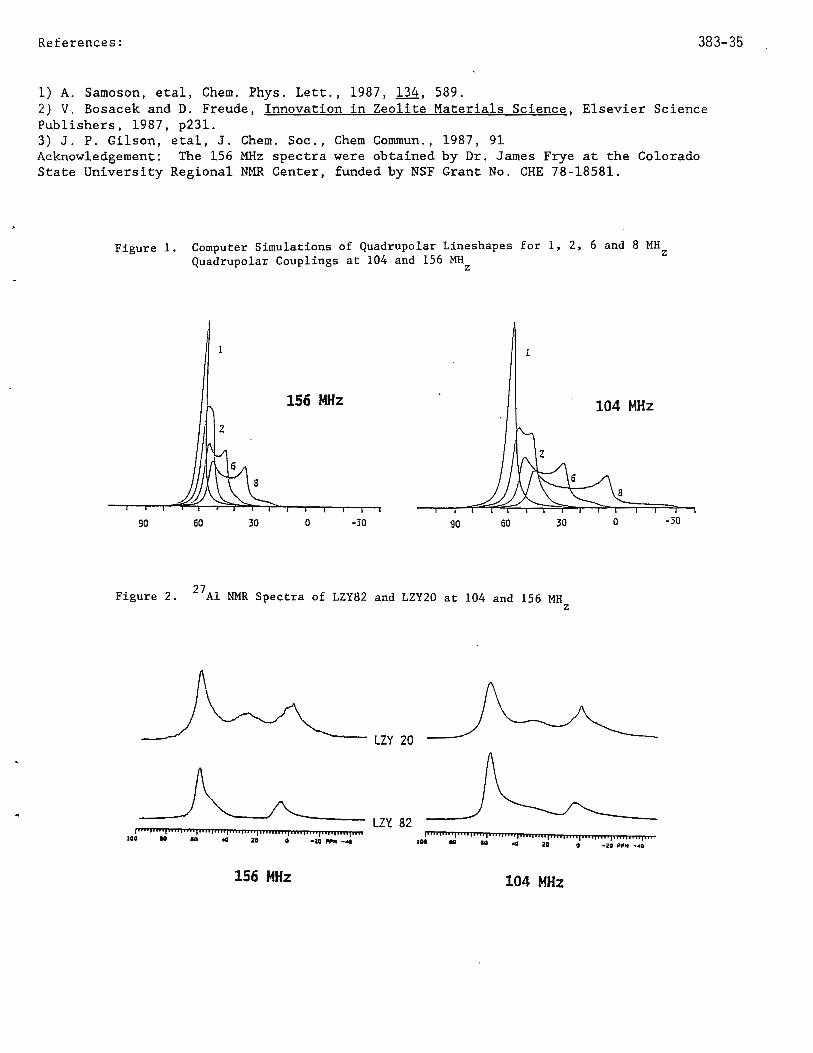
Figure 1 shows the computed lineshapes for a spin 5/2 nucleus calculated for quadrupole couRlings of 1, 2, 6, and 8 MHz at the aluminum resonance frequencies of 104 and 156 MHz. The !chemical shift was assumed to be 60 ppm. For small couplings (<1 MHz), the peak shape and position is essentially independent of resonance frequency while for larger couplings the peak shifts to lower frequency and assumes the characteristic "doublet" shape. Since both the shape and shift are dependant on resonance frequency, changing magnetic fields can determine whether an apparent "peak" is actually only a component of a complex lineshape.
Figure 2 shows the aluminum spectra of the LZY series. For LZY-62 only a single peak believed to be due to framework aluminum is observed. Both LZ-Y82 and -Y20 have several brodd peaks characteristic of nonframework aluminum. The peak(s) near 0 ppm are attributable to octahedrally bound aluminum species. Both samples also have considerable int~nsity in the 30 ppm region of the 104 MHz spectra. At 156 MHz, the spectrum of the LZ-Y20 sample is essentially unchanged, but the LZ-Y82 sample shows that the intensity of seen near 30 ppm in the 104 MHz spectrum has shifted to about 50 ppm. This is consistent with the 30 ppm intensity being the low frequency feature of the quadrupole "doublet". Its shift toward 60 ppm at higher field enables us to assign the aluminum to a tetrahedral species which is presumable experiencing strain because it has left the lattice. The absence of a field dependance for LZ-Y20 indicates that the aluminum responsible for the
I
intensity at 30 ppm has a small quadrupolar coupling. In naturally occurring aluminosolicate minerals, aluminum species having a 30 ppm shift were found to be pentacoordinate2 , but they also generally had quadrupole couplings of 5 MHz. Therefore, assignment of the 30 ppm peak to a pentacoordinate aluminum is somewhat tenuous. Reg~rdless of the assignment of the 30 ppm peak in LZ-Y20 we have shown that two different nonframework species are present in steamed Y zeolites.
Best regards,
~ -:~ -WIM,A{ G. J~ Ray \.(_ (1/1\0 Mail Station B-5 708~420-5217.
References: 383-35
1) A. Samoson, etal, Chem . Phys . Lett. , 1987, 134, 589. 2) V. Bosacek and D. Freude, Innovation in Zeolite Materials Science , Elsevier Science Publishers, 1987, p231. 3) J. P . Gilson, etal, J. Chem. Soc., Chem Commun., 1987, 91 Acknowledgement: The 156 MHz spectra were obtained by Dr. James Frye at the Colorado State University Regional NMR Center, funded by NSF Grant No . CHE 78-18581 .
Figure 1. Computer Simulations of Quadrupolar Lineshapes for 1, 2, 6 and 8 MHz Quadrupolar Couplings at 104 and 156 MH
z
90 60
Figure 2. 27
156 MHz
2
30 0 -30 90 60 30
Al NMR Spectra of LZY82 and LZY20 at 104 and 156 MH z
LZY 20
LZ'l 82
104 MHz
a
o
p•••1••••1 11 .:11111p11111Cnj1n11nu11a.:1;1111111n1111111111un1111•• 100 eo 10 .a ao o -zo ,.,,,. -..o jilhiiiilj ................... , ......... , .... jlilijiilljiilijliiijillljili .
156 MHz 104 MHz
-30
383-361
I
1i6 Carleton University ~ Ottawa, Canada K1 S 586 I Dr. B.L. Shapiro
TAMU NMR Newsletter 966 Elsinore Court Palo Alto Cal. 94303 .
June 18, 1990 (received 6/25/90)
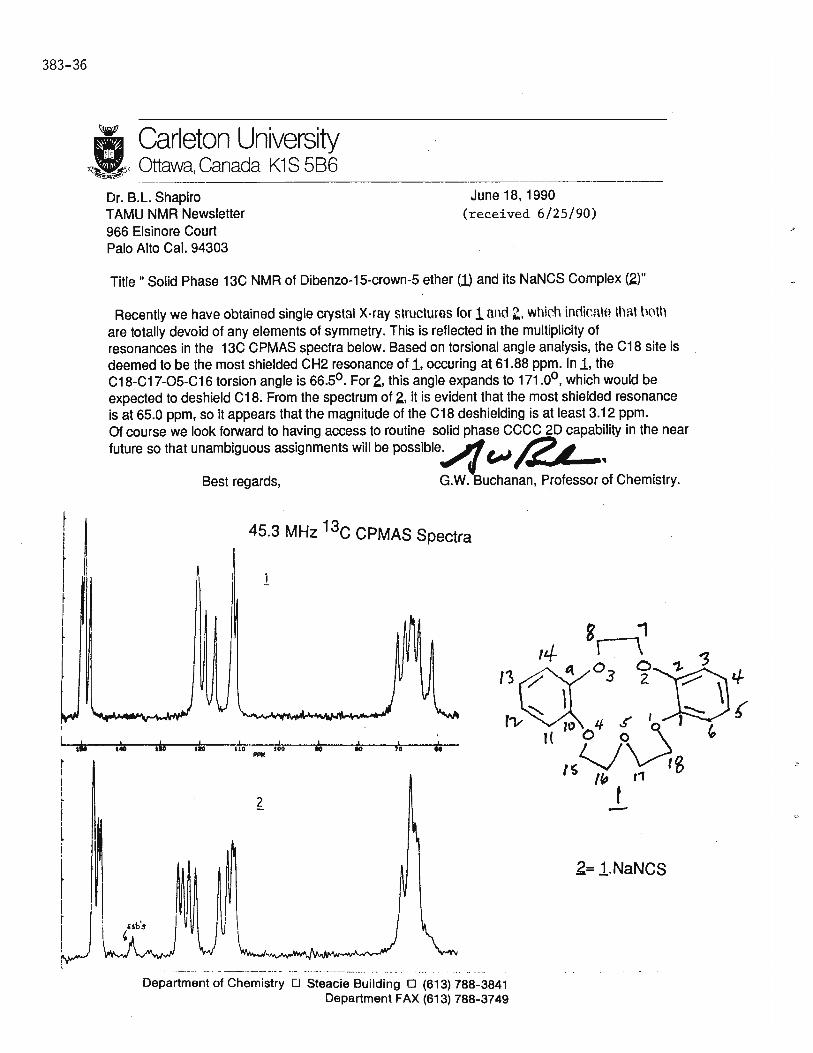
Title" Solid Phase 13C NMR of Dibenzo-15-crown-5 ether (1} and its NaNCS Complex (2)"
Recently we have obtained single crystal X-ray structurns for 1 nnd z.. which inoic;1to lh~t h0th are totally devoid of any elements of symmetry. This is reflected in the multiplicity of resonances in the 13C CPMAS spectra below. Based on torsional angle analysis, the C18 site is deemed to be the most shielded CH2 resonance of 1, occuring at 61.88 ppm. In 1, the
1
C18-C17-O5-C16 torsion angle is 66.5°. For 2, this angle expands to 171.0°, which would be expected to deshield C1 8. From the spectrum of 2, it is evident that the most shielded resonance is at 65.0 ppm, so it appears that the magnitude of the C18 deshielding is at least 3.12 ppm.
I I
u ' I
Of course we look forward to having access to routine solid phase CCCC 2D capability in the near future so that unambiguous assignments will be possible;// C,,,,J "2L .,
Best regards, G.W. Buchanan, Professor of Chemistry.
45.3 MHz 13C CPMAS Spectra
tlO I I
110 100 IO IO 1'o . ti -2
.. .. .
Department of Chemistry D Steacie Building □ (613) 788-3841 Department FAX (613) 788-3749
-2=1.NaNCS
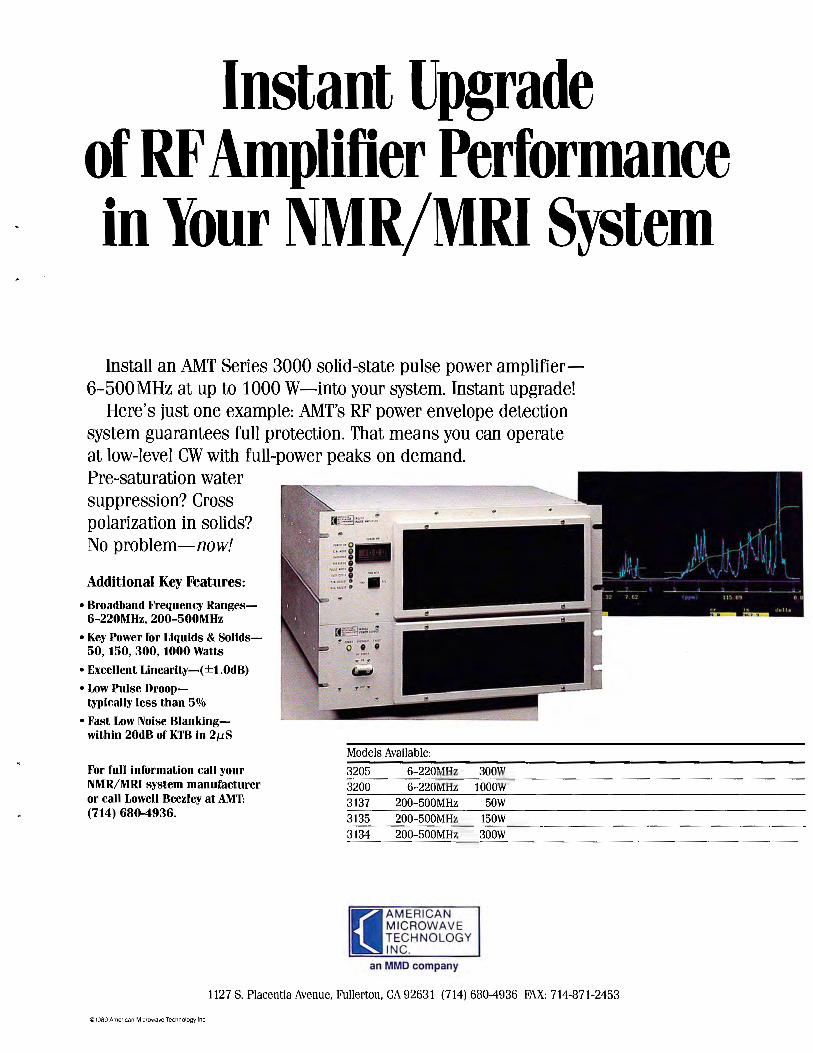
Instant Upgrade of RF Amplifier Performance in Your NMR/MRI System
Install an AMT Series 3000 solid-state pulse power amplifier-6-500 MHz at up to 1000 W-into your system. Instant upgrade!
Here's just one example: AMT's RF power envelope detection system guarantees full protection. That means you can operate at low-level CW with full-power peaks on demand. Pre-saturation water suppression? Cross polarization in solids? No problem-now!
Additional Key Features:
• Broadband Frequency Ranges-6-220MHz, 200-500MHz
• Key Power for Liquids & Sollds-50, 150, 300, 1000 Watts
• Excellent Llnearity-(±1.0dB)
• Low Pulse Drooptypically less than 5%
• Fast Low Noise Blankingwithin 20dB of KTB in 2µ8
For full information call your NMR/ MRI system manufacturer or call Lowell Beezley at AMT: (714) 680-4936.
r~~:::....11
~o· ~!:: ·•· :Y." "'-
c-
Models Available:
3205 6-220MHz 3200 6-220MHz 3137 200-500MHz 3135 200-500MHz 3134 200-500MHz
(
AMERICAN MICROWAVE TECHNOLOGY INC.
an MMD company
300W 1000W
50W 150W 300W
1127 S. Placentia Avenue. Fullerton. CA 92631 (714) 680-4936 FAX: 714-871-2453
© 1989 Ame11can Microwave Technology Inc
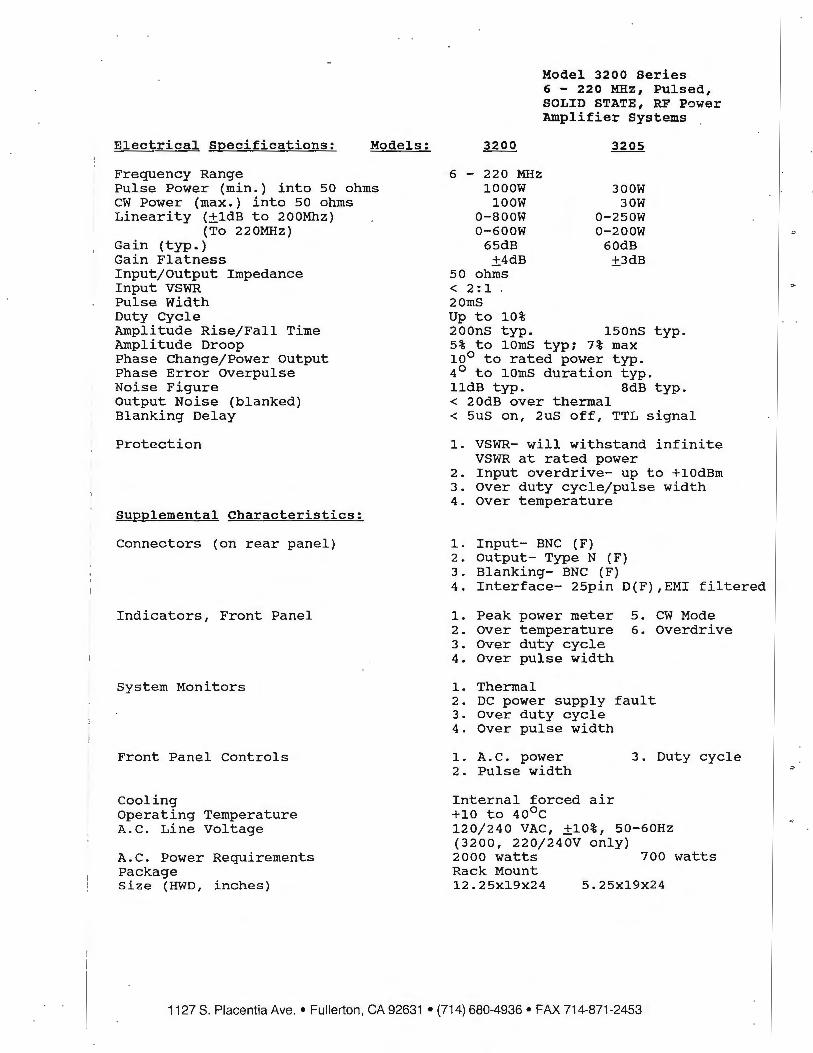
Electrical Specifications: Models:
Frequency Range Pulse Power (min.) into 50 ohms cw Power (max.) into 50 ohms Linearity {±ldB to 200Mhz)
{To 220MHz) Gain {typ.) Gain Flatness Input/Output Impedance Input VSWR Pulse Width Duty Cycle Amplitude Rise/Fall Time Amplitude Droop Phase Change/Power Output Phase Error Overpulse Noise Figure output Noise (blanked) Blanking Delay
Protection
supplemental Characteristics:
Connectors (on rear panel)
Indicators, Front Panel
System Monitors
Front Panel Controls
Coolinq Operating Temperature A.C. Line Voltage
A.C. Power Requirements Package size (HWD, inches)
Model 3200 Series 6 - 220 MHz, Pulsed, SOLID STATE, RF Power Amplifier Systems
6 - 220 MHz 1000W
lOOW o-aoow 0-600W
65dB ±4dB
50 ohms < 2:1 20mS Up to 10%
300W 30W
0-250W 0-200W
60dB ±3dB
2oons typ. 150nS typ. 5% to lOmS typ; 7% max 10° to rated power typ. 4° to lOmS duration typ. lldB typ. 8dB typ. < 20dB over thermal < Sus on, 2uS off, TTL signal
1. VSWR- will withstand infinite VSWR at rated power
2. Input overdrive- up to +lOdBm 3. Over duty cycle/pulse width 4. Over temperature
1. Input- BNC (F) 2. Output- Type N (F) 3. Blanking- BNC (F) 4. Interface- 25pin D(F) ,EMI filtered
1. Peak power meter 2. Over temperature 3. Over duty cycle 4. Over pulse width
1. Thermal 2. DC power supply 3. over duty cycle 4. Over pulse width
1. A. C. power 2. Pulse width
Internal forced air +10 to 40°c
5. CW Mode 6. Overdrive
fault
3. Duty cycle
120/240 VAC, ±10%, 50-60Hz (3200, 220/240V only) 2000 watts 700 watts Rack Mount 12.25xl9X24 5.25Xl9x24
1127 S. Placentia Ave. • Fullerton, CA 92631 • (714) 680-4936 • FAX 714-871-2453
383-39
Queen Mary College University of London Department of Chemistry
Mile End Road, London El 4NS · Tel: 01-980 4811 · Telex: 893750
Dr. Bernard L. Shapiro, TAMU NMR Newsletter, 966, Elsinore Court, Palo Alto, CA 94303, U.S.A.
Head of Department: Professor J .H.P. Utley BSc, PhD, DSc, CChem, FRSC
10th July 1990 (received 7/lS/90)
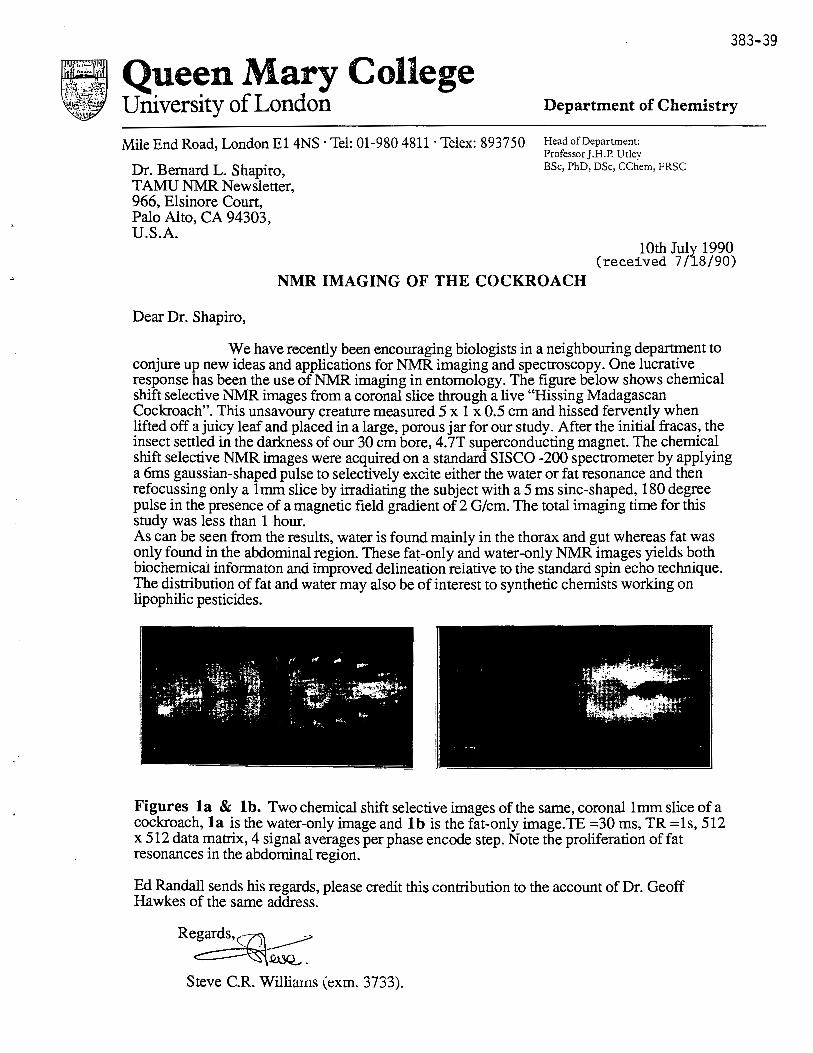
NMR IMAGING OF THE COCKROACH
Dear Dr. Shapiro,
We have recently been encouraging biologists in a neighbouring department to conjure up new ideas and applications for NMR imaging and spectroscopy. One lucrative response has been the use ofNMR imaging in entomology. The figure below shows chemical shift selective NMR images from a coronal slice through a live "Hissing Madagascan Cockroach". This unsavoury creature measured 5 x 1 x 0.5 cm and hissed fervently when lifted off a juicy leaf and placed in a large, porous jar for our study. After the initial fracas, the insect settled in the darkness of our 30 cm bore, 4. 7T superconducting magnet. The chemical shift selective NMR images were acquired on a standard SISCO -200 spectrometer by applying a 6ms gaussian-shaped pulse to selectively excite either the water or fat resonance and then refocussing only a 1mm slice by irradiating the subject with a 5 ms sine-shaped, 180 degree pulse in the presence of a magnetic field gradient of 2 G/cm. The total imaging time for this study was less than 1 hour. As can be seen from the results, water is found mainly in the thorax and gut whereas fat was only found in the abdominal region. These fat-only and water-only NMR images yields both biochemical informaton and improved delineation reiative to the standard spin echo technique. The distribution of fat and water may also be of interest to synthetic chemists working on lipophilic pesticides.
Figures la & lb. Two chemical shift selective images of the same, coronal Imm slice of a cockroach, la is the water-only image and lb is the fat-only image.TE =30 ms, TR =ls, 512 x 512 data matrix, 4 signal averages per phase encode step. Note the proliferation of fat resonances in the abdominal region.
Ed Randall sends his regards, please credit this contribution to the account of Dr. Geoff Hawkes of the same address.
Regard_:s:u\_~
~QIJQ_.. .
Steve C.R. Williarns (exm. 3733).
383-40
The Wellcome Foundation Ltd
The Wellcome Research Laboratories
Langley Court, South Eden Park Road Beckenham, Kent BR3 38S
BMNC/90/8
Dr. B.L. Shapiro, TAMU NMR Newsletter, 966 Elsinore Court, PALO ALTO, CA 94303, ~
~ Wellcome
telegrams and cables WELLAB BECKENHAM telex WELLAB 23937 G fax 081-650 9862 telephone 081-658 2211
1986
1989
DEPARTMENT FAX NO: 081-663 3788
28 June, 1990 (received 7/2/90)
Dear Dr. Shapiro,
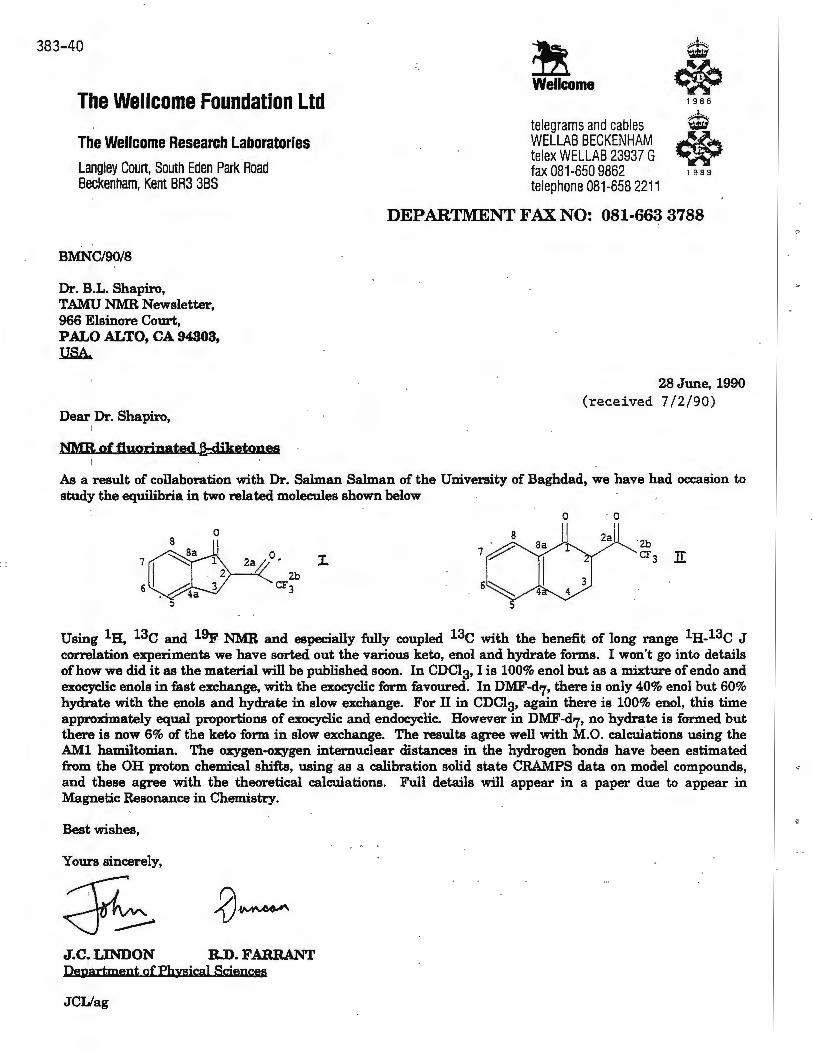
NMR of fluorinated l}diketones
As a result of collaboration with Dr. Salman Salman of the University of Baghdad, we have had occasion to study the equilibria in two related molecules shown below
0
2all I.
Using lH, 13c and l9F NMR and especially fully coupled l3c with the benefit of long range 1H-13c J correlation experiments we have sorted out the various keto, enol and hydrate forms. I won't go into details of how we did it as the material will be published soon. In CDC13, I is 100% enol but as a mixture of endo and exocyclic enols in fast exchange, with the exocyclic form favoured. In DMF-d7, there is only 40% enol but 60% hydrate with the enols and hydrate in slow exchange. For II in CDC13, again there is 100% enol, this time approximately equal proportions of exocyclic and endocyclic. However in DMF-d7, no hydrate is formed but there is now 6% of the keto form in slow exchange. The results agree well with M.O. calculations using the AMl hamiltonian. The oxygen-oxygen internuclear distances in the hydrogen bonds have been estimated from the OH proton chemical shifts, using as a calibration solid state CRAMPS data on model compounds, and these agree with the theoretical calculations. Full details will appear in a paper due to appear in Magnetic Resonance in Chemistry.
Best wishes,
Yours sincerely,
J.C.LINDON R.D.FARRANT De:gartment of Physical Sciences
JCUag
DEPARTMENT OF HEAL TH &. HUMAN SERVICES
Dr. B. L. Shapiro TAMU NMR Newsletter
966 Elsinore Court Palo Alto, CA 94303
The Third Dimension a la JEOL GSX Spectrometers
Dear Barry;
383-41
Public Health Service
Food and Drug Administration Bethesda MD 20892
July 3, 1990 (received 7/5/90)
After lapsing into the oblivion of colored sheets and missing Issues of TAMU, I would like to re-join the fold with some information regarding the flexibility of the JEOL GSX-500 spectrometer which we have had operating for a
little less than 2 years.
The system has a fully broadbanded X-decoupling channel, and with some careful nudging, can even do three channel experiments, e.g. 1 H, X, Y. The normal two channel, 2D inverse experiments are straightforward and
performed with very good sensitivity.
There are some features which we have found needed enhancement, which I will describe in later letters, since at
this point I would just like to illustrate the feasibility of performing three-dimensional experiments on this spectrometer. The figure shows a HMQC-TOCSY 3D experiment performed as a test sample on 13C-labelled
glucose. It Is a mixture of C1 and C2 labelled glucose with both alpha and beta anomers apparent.
This experiment was performed without any modifications of the spectrometer; in fact, it was run in Sept. 89! The data acquisition was buffered in-memory to minimize delays between t1 points, and the experiment was performed
as hypercomplex In both the indirect dimensions (F1 & F2). The raw data file was 256c x 128c x 32c and the final processed data matrix ls 256c x 128c x 128r. The data was processed using the program FELIX (Hare Research, Inc.) on a Silicon Graphics 4D25G workstation. The processing is very smooth and the entire transformation is performed in less than 2 hrs, even on my workstation with only 8 MB of memory. I have found the
conceptualization of N-dimensional processing in FELIX to be extremely powerful, and the extension to processing a 4D experiment, as Bax showed at the ENC, would be very straightforward!
This spectrum illustrates the facility for such experiments and extension to other 3D sequences is simply writing the pulse sequences. We are quite excited about these applications in our research programs, and we hope to present more results soon.
Best regards,
~ R. Andrew Byrd
Biophysics Laboratory, FDA
8800 Rockville Pike Bethesda, MD 20892
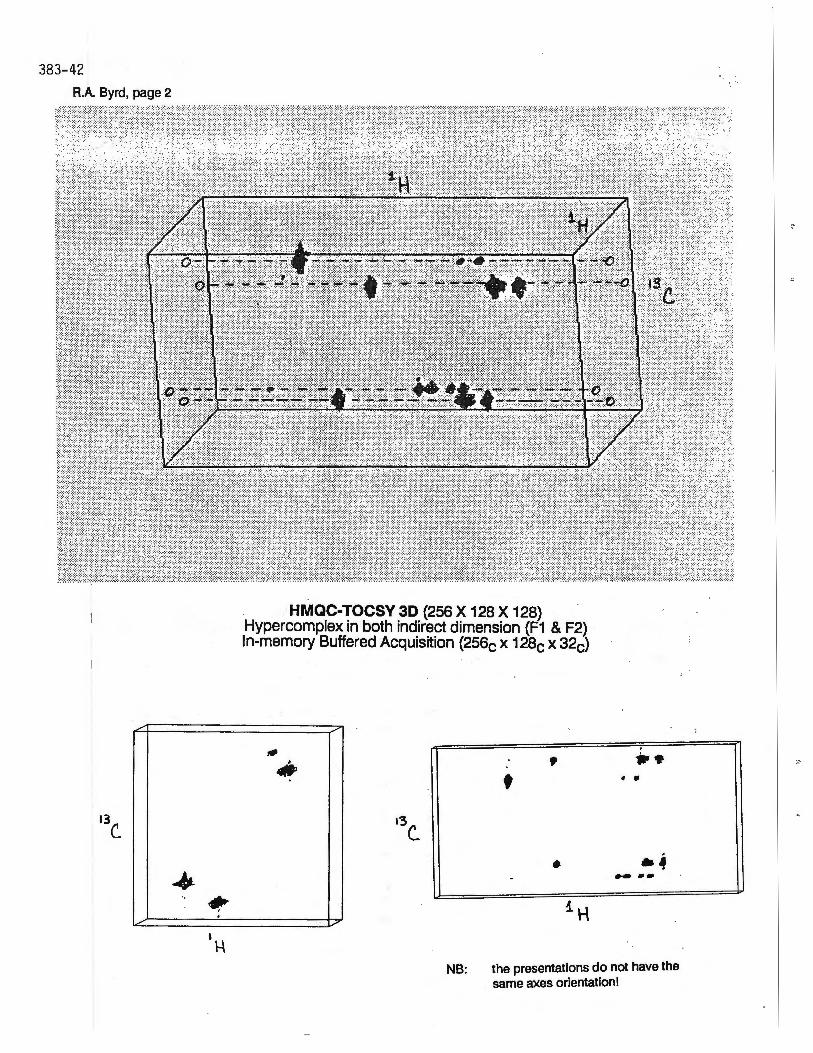
383-42 A.A. Byrd, page 2
~
~ '•
~ . ~
HMQC-TOCSY 3D (256 X 128 X 128) Hypercomplex in both indirect dimension (F1 & F2) In-memory Buffered Acquisition (256c x 128c x 32c)
,. , • •
,
•
~
• •
NB: the presentations do not have the same axes orientation!
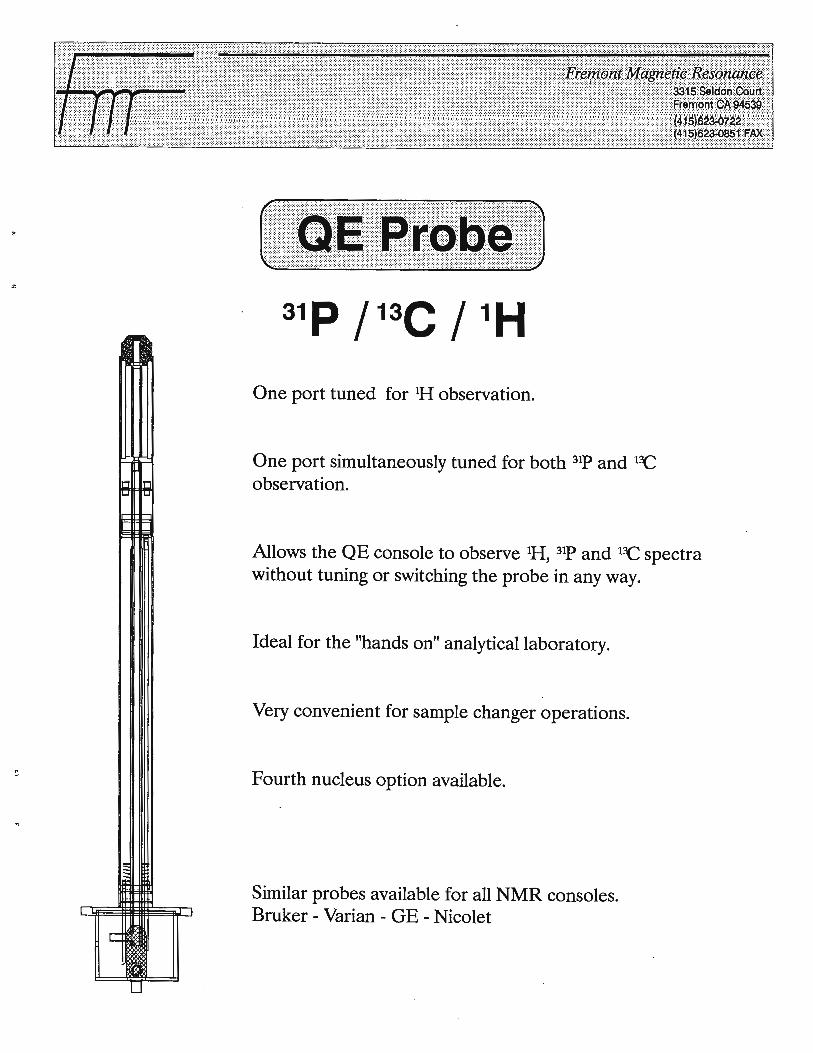
r- -
Fi Fi
~ tl
J
One port tuned for 1H observation.
One port simultaneously tuned for both 31P and 1~
observation.
Allows the QE console to observe 1H, 31P and 1~ spectra without tuning or switching the probe in any way.
Ideal for the "hands on" analytical laboratory.
Very convenient for sample changer operations.
Fourth nucleus option available.
Similar probes available for all NMR consoles. Bruker - Varian - GE - Nicolet
···•••· < ... f'r¢,1io11t Mtiiietic Resoiiiih¢e · · · · · · · · · JiiS seiaoii co~/i:i
Do you have the latest Gossip? _
Have you heard that... A CO"fV achieved escape velocity ... , The cat has volunteered to wear a bell ... , There's a new file transfer method that gives easy and inexpensive transfers from GN and NT spectrometers. But the last statement is no rumor. With our new program, Gossip, you can do serial transfers at 19 kBaud, .and you can run the transfer in the back- · ground. At 20 kwords ( complex)/rninute, most transfers will be completed while you are busy with some other operation. (We're still checking on the first two rumors.)
Gossip makes file transfers about as easy as they can be. Just cable together a PC and your 1280 with a standard serial cable, run Gossip on the PC and select 'host' mode. Now you can 'SE' and 'TF' from within CHARM or GEM on the 1280 to send and get files to and from the PC. Since transfers are a background operation, you can immediately go on and do something else.
On older systems running NMC-1280 or NMR-1280 you can still do transfers but may have to run the 'FILTRN' program on the 1280. Consequently these transfers may not be in background. ·
FMR provides a macro for QE operation that automates aquisition and transfer. Using this macro as a template, you can easily modify your standard macros to include a file transfer after aquisition, after processing, or both.
Files transferred to the PC can be read by PLOT, or translated with our Felix/PC Data Translation software for further processing on your PC using Felix/PC.
Gossip contains a full selection of communications features in addition to the SECS protocol that allow CHARM, GEM or FILTRN file transfers. It supports PC COM ports 1 through 4, many different baud rates and data formats, modern control, and Kermit and Xmodern transfers.
Gossip is available from stock, at a very reasonable price. Why not order it today?
Mobil Research and Development Corporation
Dr. Bernard L. Shapiro T AMU NMR Newsletter 966 Elsinore Court, Palo Alto, CA 94303
Dear Barry:
June 18, 1990 (received 6/19/90)
RESEARCH DEPARTMENT
DALLAS RESEARCH LABORATORY
P.O. BOX 819047
DALLAS, TEXAS 75381-9047
13777 MIDWAY ROAD
DALLAS, TEXAS 75244-4312
M.P. RAMAGE
MANAGER
Large nuclear electric quadrupole coupling constants (several MHz) in soliqs cause the NMR · transition frequencies of a powder to span a range of several MHz. This wide frequency range
affects the nuclear spin excitation by a pulse and enables MAS to strongly affect spin-lattice relaxation curves. We have studied these effects using the aluminum NMR of the mineral low albite (NaAlSi30g) as an example. One of them is reported in this letter.
All of the aluminum in albite has a nuclear electric quadrupole coupling constant of 3.37 MHz and an electrostatic field gradient (e.f.g.) asymmetry parameter of 0.634. The first order quadrupole interaction causes the satellite transitions of a powder to span a range of 2.02 MHz, because of the
3cos20-1 dependence on the orientation of the e.f.g. in the magnetic field. The second order quadrupole interaction causes the central transition to span 7 .90kHz (at 6.35 Tesla). As a result of the large first order interaction, the ordinary NMR spectrometer registers signals from only the central transition; signals from the satellite transitions are lost in the noise of the baseline.
As the frequency distribution contained in a square pulse is given by the sine function, a nominal 5 microsecond pulse contains an effective frequency range of only about 0.24 MHz, far smaller than the 2.02 MHz range of satellite transitions. Consequently, this pulse will excite central transitions for all of the nuclei in m = +/- 1/2 spin states, but it will excite satellite transitions for only those nuclei in m = +/- 3/2, 5/2 spin states that have e.f.g. orientations near the magic angle. Because the pulse flip angle when only the central transitions are excited is (I + 1/2) times that when all of the transitions are excited, there is not a unique flip angle for all of the sample. This has consequences in spin-lattice relaxation measurements.
We have made saturating comb spin-lattice relaxation measurements ai 11.74 Tesia on powdereci albite under both stationary and MAS conditions. The 13.0 microsecond pulses in the comb had ninety degree flip angles if all transitions were excited. The stationary measurement (200 pulses in the comb) gave a T1 value of 8.8 seconds, but the MAS measurement (96 pulses in the comb) gave 19 .4 seconds.
The larger T 1 value with MAS indicates a more complete saturation of the nuclear spin system even though only half as many pulses were used. In the static measurement, many of the spins are not saturated by the comb, for the reason given above. These spins comprise a relaxation reservoir ~hat enables spin diffusion to enhance the relaxation rate. Any given pulse can saturate only those spins that have e.f.g. orientations within a range of about 4 degrees centered near the magic angle. In the MAS measurement, each pulse can saturate a different set of spins because the sample rotation changes the e.f.g. orientations. Because every nucleus passes through the magic angle several times during each rotation, it is highly probable that all of them will be in e.f.g. orientations near the magic angle during at least one pulse in the comb.
383-45
383-46
Dr. Bernard L. Shapiro -2- June 18, 1990
The basic message in all this is that relaxation time measurements of quadrupolar nuclei in solids must be carefully planned.
Sincerely,
D. E. Woessner
DEW/mon
POSTDOCTORAL FELLOWSHIP
A 3 year position is available for innovative NMR work in the general area of soil and plant . chemistry. The project will involve multinucl~ar NMR spectroscopy in both liquid and solid phases using a Bruker WH-400 and MSL-300 respectively. The study will also include NMR imaging and localised spectroscopy using a SISCO-200 (4.7T, 30cm bore) imaging spectrometer.
The work is supported by the AFRC, and sets up a link between Queen Mary and Westfield College, London and the AFRC Rothamstead Research Station with its unique collection of plots, each with a documented history of more than 100 years.
Further details can be obtained from the project supervisors who are Dr. David Powlson (Head of Department of Soils and Agronomy at Rothamstead) and Professor Ed Randall at the Dept. of Chemistry, QMW, Mile End Road, London El 4NS (to whom correspondence should be addressed).
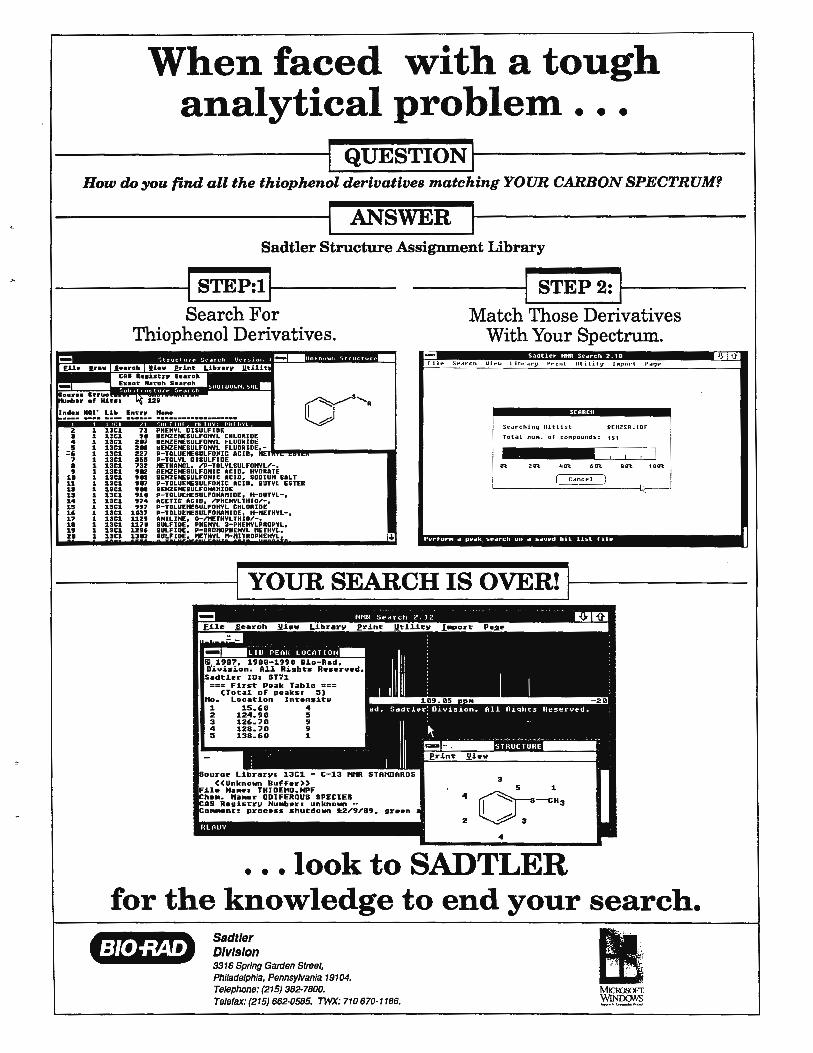
When faced vvith a tough analytical proble1n ...
---------ti QUESTIONII---------How do you 'fi,nd all the thiophenol derivatives matching YOUR CARBON SPECTRUM?
ANSWER Sadtler Structure Assignment Library
-----1 STEP:tl----Search For
STEP 2:
Match Those Derivatives With Your Spectrum.
our•• St'ruo lllller ■ f Hi.tH
tn••• 11u• L1~
z 1 13C1 I 1 1!Cl 4 1 11Cl , 1 13Cl =, 1 13Cl 1 l 13Cl I l 1SC1 , l 13Cl
u l 11Cl 11 l UCl 11 l 11Cl 1S l 13Cl 14 l 13Cl 1" l 1SC1 16 l 11Cl 11 l 11Cl ll 1 13C1 u l 11Cl H 1 13Cl
Thiophenol Derivatives.
13 ,. H1 ZN 227 n, 732 H:l!
;~ ,. , .. '14 ,,,
1131 111:t 1171 lZ9' 13113
PHENYL DISULFIDE BENZEl'EBULFOHYL CNLGltlDE ■ENZEl'EIULFONYL FLUORIDE YENZEIE6ULF0NYL FLUORIDE,-P-T0LUEIESULF0"IC ACID, NET P-T0LYL U11ULFIDE IETHAHDL, n>-T0LYLSULF0NYL/-, BEKZIENEBULFONIC aCJo. HYDIIIATE 8ENZUEIULFONIC ACID. IODIUN a•LT P-T0LUEIEIULF0NIC ACID, 8UTYL ESTER IENZEtEIIULFDHANIDE P-TOLUEtESULFDNAnlDE, H-DUTYL-, ACETIC ACID, l'PHEHYLTHIOI'-, P-TDLUENEIULf'ONYL CHLDIUDE P-TOLUEIEIULFOHillNIDE, N-IIETHYL-, ANILlfE, 0-l'NETHYLTHIOI'-, SULFIDE, PHENYL 3-PHENYLPROPYL, SULFIDE, P-BROltDPNEHYL fl.ETHYL. SULFIDE. IETHYL N-NITROPHEHYL.
=== First Pe~k Tablo === (To~ai of paaks1 5)
loc•t~on lncensit~ 1 15.60 4 2 124.90 5 3 126."l'0 9 4 128."l'0 9 5 138-60 1
souro~ L~brarva 13C1 - C-13 HtlR <<Unknown Buf~•r>>
F1ia Na-• THIDEND.NPF Ch••- Na-r DDIFER0US SPECIES CAB Registrv Nuabert unknown •· o,...nt: process shutdown ~2,,,a9. ar••n
HLAUY
I i J .. s ..... ,.,: 11 ui .. ~, I ilu-,1ry l'riul Ill ility '"JIii!"( , . ... ~ ..
Srarchinq Hitli::.t SEHZ SR. I or Total nun . of cofllpounds: 151
I .. 2 0\ ... , ...
pprf-orlll a pt>dk St'drCh on d fi.clUli'd hit li!iol f-1111
4
2
4
• • • look to SADTLER for the knowledge to end your search.
Sadtler Division 3316 Spring Garden Street, Phlladelphla, Pennsy/Vania 19104. Telephone: (215) 382-7800. Telefax: (215) 662-0585. TWX: 710 670-1186.
II . .
JJ.11.t
3133-48
UNIVERSITY OF CAMBRIDGE DEPARTMENT OF CHEMISTRY
Lensfield Road Cambridge CB2 lEP
Professor Barry Shaprro, Editor-in-chief, TAMU NMR, 966 Elsinore Court, Palo Alto, CA 94303.
Dear Barry, 18 June 90
(received 6/25/90)
Overlapping COSY Cross Peaks
One thing the organic chemists often ask is whether it is possible to disentangle .overlapping cross peaks in COSY spectra. Of course, one way is to go to higher dimensions to spread out the information, but usually these people are too busy for that kind of complication. We have recently tried out two different 2D methods of separating overlapping cross peaks.
The frrst uses a line-selective excitation pulse (spin pinging 1) at an F 1 frequency chosen to slice through one cross peak but avoid the other overlapping 2D multiplets. In a certain sense this is the equivalent of a spin tickling experiment The excitation spreads throughout the chosen multiplet when the frrst hard 90° pulse of the COSY sequence is applied. Thus we obtain a partial COSY spectrum with only one cross peak from the crowded region. The method lacks the full sensitivity since only one transition is excited, but if we catch two close transitions the sensitivity doubles. Skill is needed to choose a suitable F 1 frequency. Note that this need not be at the extreme edge of the cross peak, it may be at any point that avoids simultaneous excitation of the "unwanted" neighbours. Figure 1 shows the separation of a composite cross peak from a copolymer sample into four separate components.2 The arrows indicate the selective excitation frequencies. In Figure 1 b the four individual components are superimposed again for comparison with the raw data of Figure la.
The second approach requires no additional measurements but operates on the existing frequency-domain COSY data. It requires two orthogonal traces that catch the desired cross peak but avoid the overlapping neighbours. These two traces are multiplied together to reconstruct the complete 2D multiplet, which is then subtracted from the rest Where there are several overlapping components they can be taken out one at a time. We call this "deconstruction" by analogy with a concept that has caused some highly productive controversy in the world of literary criticism. Figure 2 shows the 400 MHz proton spectrum of one of the COSY cross peaks of the molecule of tolaasin: Starting with the raw experimental data (Figure 2a), four progressive stages of subtraction take out one primitive cross peak at a time (right-hand column). Figure 2h shows a good example of where the method cannot distinguish two cross peaks because all the F1 frequencies are degenerate. Nevertheless the intensities suggest that these are separate four-line cross peaks, making six overlapping components altogether.3
Kindest regards,
rrz~ Ray Freeman
1 X. L. Wu, P. Xu and R. Freeman, J. Magn. Reson. 83, 404 ( 1989). 2p_ Xu, X. L. Wu and R. Freeman, J. Magn. Reson. to be published. 3L. McIntyre .and R. Freeman, J. Magn. Reson. to be published.
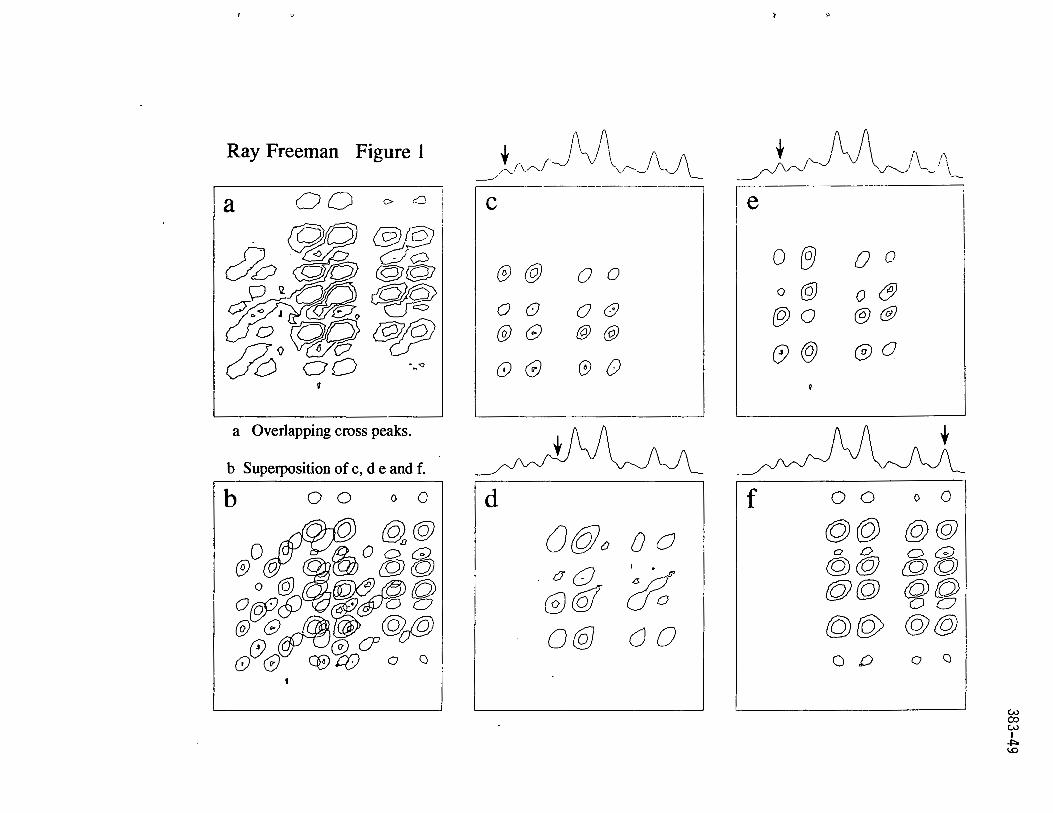
' U
Ray Freeman Figure 1
a 00 C> ~ I i
·. ~o/J!JJ c5bSif6©© o;:: ~ ga~ ~
~ 0 0 ~ @c!fiJ a oo .. ., g
a Overlapping cross peaks.
b Superposition of c, d e and f.
b 0 0 ◊ 0
0~ @@ @ 0 ij,@o onQ
0 @ (Q){Q)
O@P,_c§) ,~g @Q~ @@
(y (§) <Y V @ @ cezo o C)
)\. /~ ±_/\r,J --._ V (v--._~(V\__
re
(o) @
0 () (§) Q
Q<i)
d
0 O
O@ @@
0 D
Q@o 00 . o(J I •,d'
(§) (Q/ c?a O@ CJ a
I
I
_,l,_J-1'-JlJ"-- !\ - '~
,e
I 0 @J 0 0
0 @ 0 & (90 @ (§)
I (y@ @O
t
f 0 0 ◊ 0
©@ @@ o D O Q
@© {Q){Q) @(Q) ©D
00 ©@ @@
0 t) 0 C)
w co w I ~ \.0
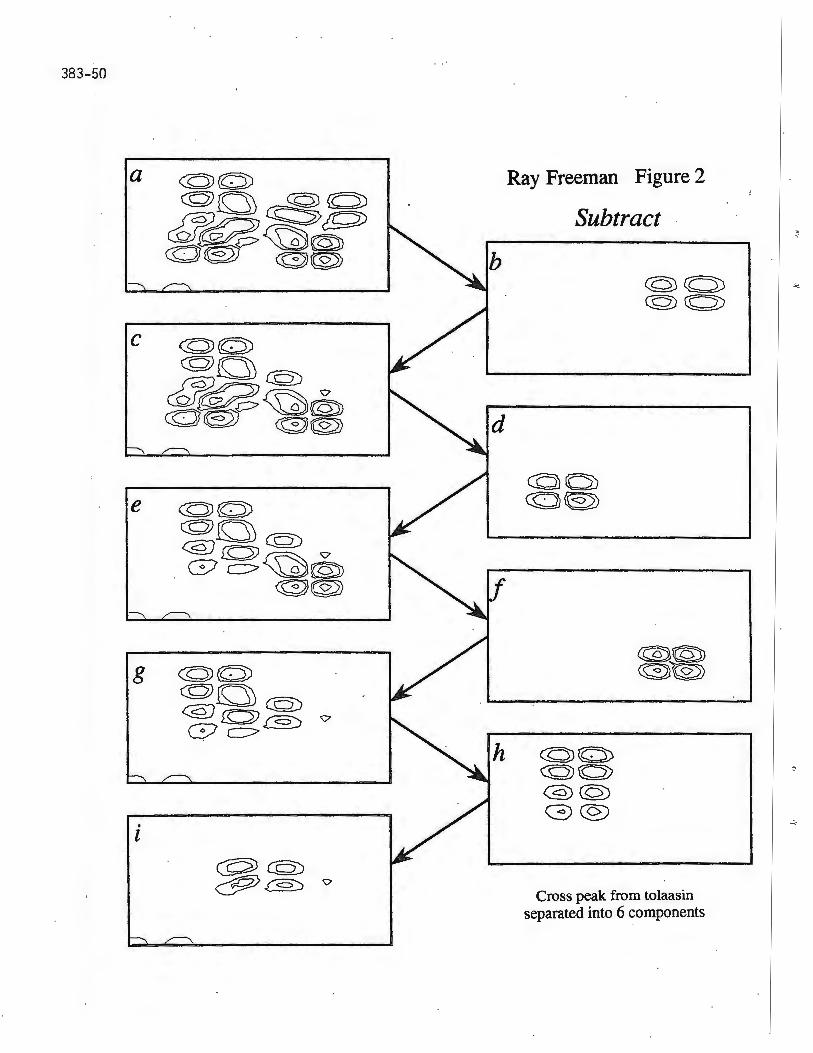
383-50
C (Q){w)
©>DJ (Q) u~~@ cw~ <GJ®>
e (Q)~
©>DJ (Q) ~£0)~ 9 Ge::> a@)
<G}@)
g (Q)~
©>fa") (Q) 9 ~[Q).(§::J
G c::>
. l
p· re2 Ray Freeman igu
Subtract
CQ')O) (Q)©)
~@) <0~
~a> (Q)Q) @)(Q) G©
k from tolaasin Cross P~ 6 components separated mto
c
_,
I '
VARIAN NMR FLEXIBILITY NOW RESOLVES PROBLEM DIVERSITY
~~ ,•
·J'· ,t ~
"'~, " •,;"~ ~?
~ . -,. . '
- , MICROIMAGING
Varian is your full-line company for analytical instrumentation NMR UV-Visible-NIR Atomic Absorption Solid Phase Extraction Liquid Chromatography Gas Chromatography GC/MS
SOLIDS LIQUIDS
UNITY LETS YOU SWITCH FROM ONE TO THE OTHER WITH EASE Combine high performance capabilities with unparalleled flexibility using Varian's new UNITY™ NMR spectrometer. This unique spectrometer is a true, multicapability instrument that performs high resolution microimaging as easily as it analyzes liquid and solid samples.
UNITY's revolutionary system architecture employs a modular design that addresses all NMR applications with a single instrument.
Analyze liquid samples using a variety of techniques over a wide range of nuclei. Perform CP /MAS, wideline and multipulse for solid samples. Examine microimaging samples with ease. Maximum flexibility has been built in to cover future experimental capabilities for every application.
Resolve problem diversity: invest in the most flexible technology of today to better address the research of tomorrow. Invest in a UNITY NMR spectrometer. For additional information, please call the Varian office closest to you.
NMR WITH A FUTURE
Varian Associates 611 Hansen Way D-298 Palo Alto, CA 94303 U.S.A. Tel: 1-800-356-4437
Varian AG Steinhauserstrasse CH-6300 Zug, Switzerland Tel: (42) 44 88 44
Varian GmbH Alsfelderstrasse 6 D-61 DD Darmstadt West Germany Tel: (D 61 51) 70 30
Varian Instruments Ltd. 3rd Matsuda Bldg 2-2-6 Ohkubo-Shinjuku Tokyo, 169, Japan Tel: (3) 204- 1211
varian@
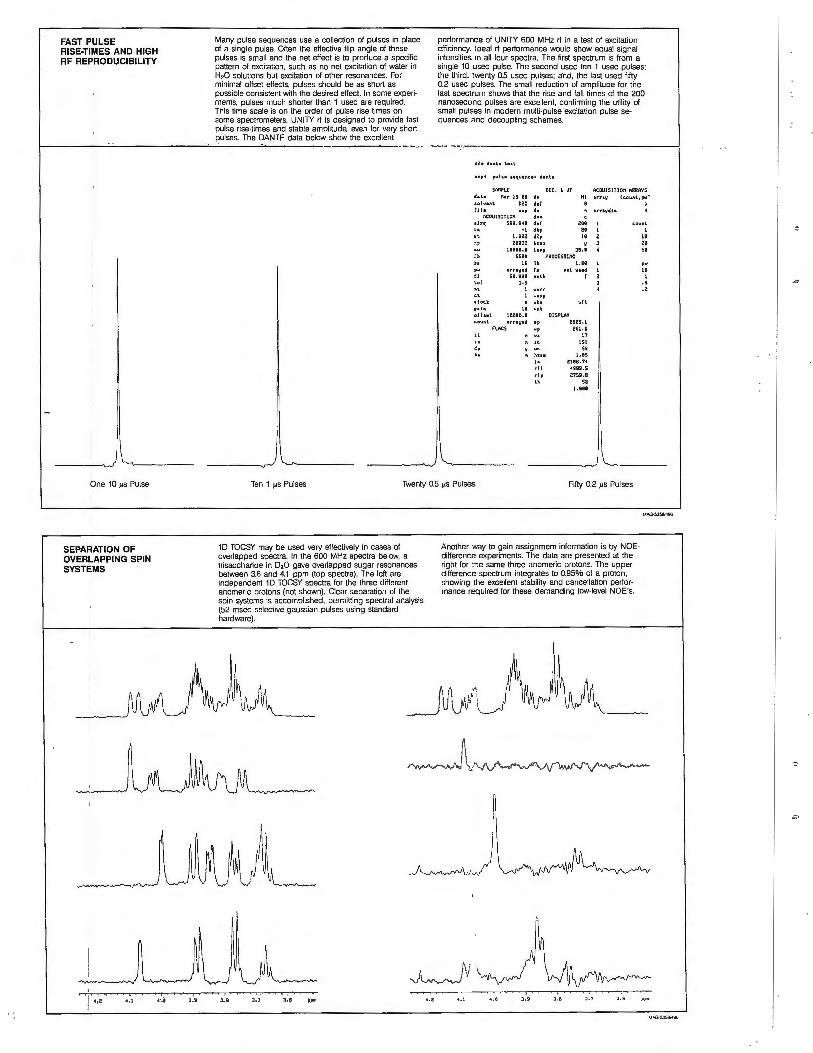
FAST PULSE RISE-TIMES AND HIGH RF REPRODUCIBILITY
Many pulse sequences use a collection of pulses in place of a single pulse. Olten the effective flip angle of these pulses is small and the net effect is to produce a specific pattern of excitation, such as no net excitation of water in
performance of UNITY 600 MHz rf in a test of excitation efficiency. Ideal rf performance would show equal signal intensities ,n all lour spectra. The first spectrum is from a single 10 usec pulse. The second used ten 1 usec pulses; the third. twenty 0.5 usec pulses; and, the last used fifty 0.2 usec pulses. The small reduction of amplitude for the last spectrum shows that the rise and fall times of the 200 nanosecond pulses are excellent, confirming the utility of small pulses in modern multi-pulse excitation pulse se-quences and decoupling schemes.
H,O solutions but excitation of other resonances. For minimal offset effects. pulses should be as short as possible consistent with lhe desired effect. In some experi ments, pulses much shorter than 1 usec are required. This time scale is on the order of pulse rise times on some spectrometers. UNITY rf is designed to provide fast pulse rise-limes and stable amplitude, even for very short ~ulses. The DANTE data below show the excellent >-------------~--~----~-------------....... -.. . --·.•· --:,-· .. -____________________ ...J
One 10 µs Pulse
SEPARATION OF OVERLAPPING SPIN SYSTEMS
l!Zo l!•nh lHl
ACOUJSITJON AllRAVS ,.i. n., ts 89 d11 Hl ernv Cc.ownl,pw• aoJ.,,11\. 020 dol . ' !ti• up d■ unydt ■ 4
ntOUISITION d.. c. •lrq S99,9'1 d■ f 281 I '.a HI dhp i!.9 1 •l l.99Z dip 18 i!. :: p 2HJZ ho■ o V J ..... 1eaee. , h■p Js.e 4 ?ll SSH PROCCSSil'1C ::. 16 lb 1,H 1
1loc.k
0111■ \ '-Ounl
uny■d fn se.aee ulh ,.,
HI wn\. 18889.8 arr.y ■d •P
flACS wp
110\.iiaad l r a
DISPLAY eszs.1
i::61,SI 17
191
" 1.es 2186 . 74
◄ SISISI.S Z7S9,I
SB 1,881
c.ownl r
II
" .. ,. 18
I ., .,
Ten 1 µs Pulses Twenty 0.5 µs Pulses Fifty 0.2 µs Pulses
10 TOCSY may be used very effectively in cases of overlapped spectra. In the 600 MHz spectra below, a trisaccharide in 0 20 gave overlapped sugar resonances between 3.6 and 4.1 ppm (top spectra). The lett are independent 10 TOCSY spectra for the three different anomeric protons (not shown). Clear separation of the spin systems is accomplished, permitting spectral analysis (52 msec selective gaussian pulses using standard hardware).
Another way to gain assignment information is by NOEdifference experiments. The data are presented at the right for me same three anomeric protons. The upper difference spectrum integrates to 0.95% of a proton, showing the excellent stability and cancellation performance required for these demanding low-level NOE's.
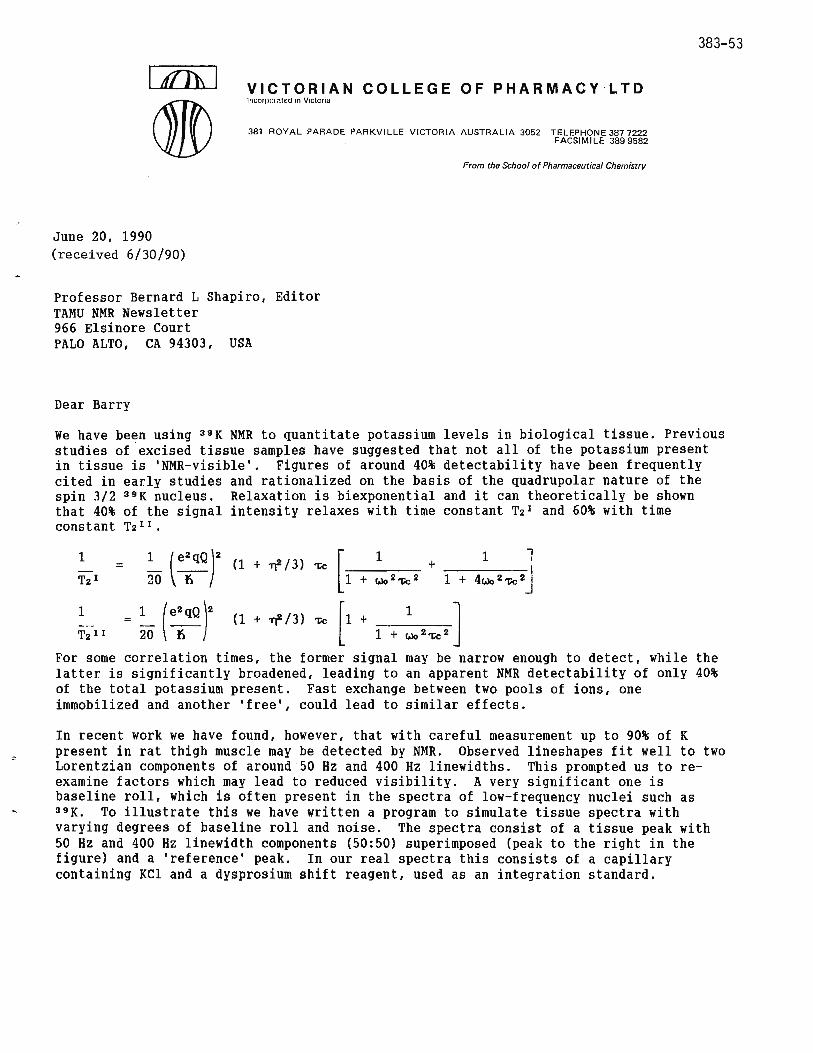
I rtZTo I
® June 20, 1990 (received 6/30/90)
VICTORIAN COLLEGE OF PHARMACY LTD lncorprn ntcd m Victoria
381 RO YAL PARADE PAR KVILLE VICTORIA AUSTRALIA 3052 TELEPHONE 387 7222 FACSIMILE 389 9582
From the School of Pharmaceutical Chemistry
Professor Bernard L Shapiro, Editor TAMU NMR Newsletter 966 Elsinore Court PALO ALTO, CA 94303, USA
Dear Barry
383-53
We have been using 39 K NMR to quantitate potassium levels in biological tissue. Previous studies of excised tissue samples have suggested that not all of the potassium present in tissue is 'NMR-visible'. Figures of around 40% detectability have been frequently cited in early studies and rationalized on the basis of the quadrupolar nature of the spin 3/2 39 K nucleus. Relaxation is biexponential and it can theoretically be shown that 40% of the signal intensity relaxes with time constant T2 1 and 60% with time constant T211 .
1 1 ( e~qQr (1 + -rf /3) 'l:c [1
1 + 4~•~•J = T2 1 20 + CJo 2-i:c 2 1 +
1 ~ ( e'qQ )' (1 + -rr /3) -i:c [1 + ~·~·] = T2 11 20 ri 1 +
F'or some correlation times, the former signal may be narrow enough to detect, while the latter is significantly broadened, leading to an apparent NMR detectability of only 40% of the total potassium present. Fast exchange between two pools of ions, one immobilized and another 'free', could lead to similar effects.
In recent work we have found, however, that with careful measurement up to 90% of K present in rat thigh muscle may be detected by NMR. Observed lineshapes fit well to two Lorentzian components of around ·5o Hz and 400 Hz linewidths. This prompted us to reexamine factors which may lead to reduced visibility . A very significant one is baseline roll, which is often present in the spectra of low-frequency nuclei such as 39 K. To illustrate this we have written a program to simulate tissue spectra with varying degrees of baseline roll and noise. The spectra consist of a tissue peak with 50 Hz and 400 Hz linewidth components (50:50) superimposed (peak to the right in the figure) and a 'reference' peak. In our real spectra this consists of a capillary containing KCl and a dysprosium shift reagent, used as an integration standard.
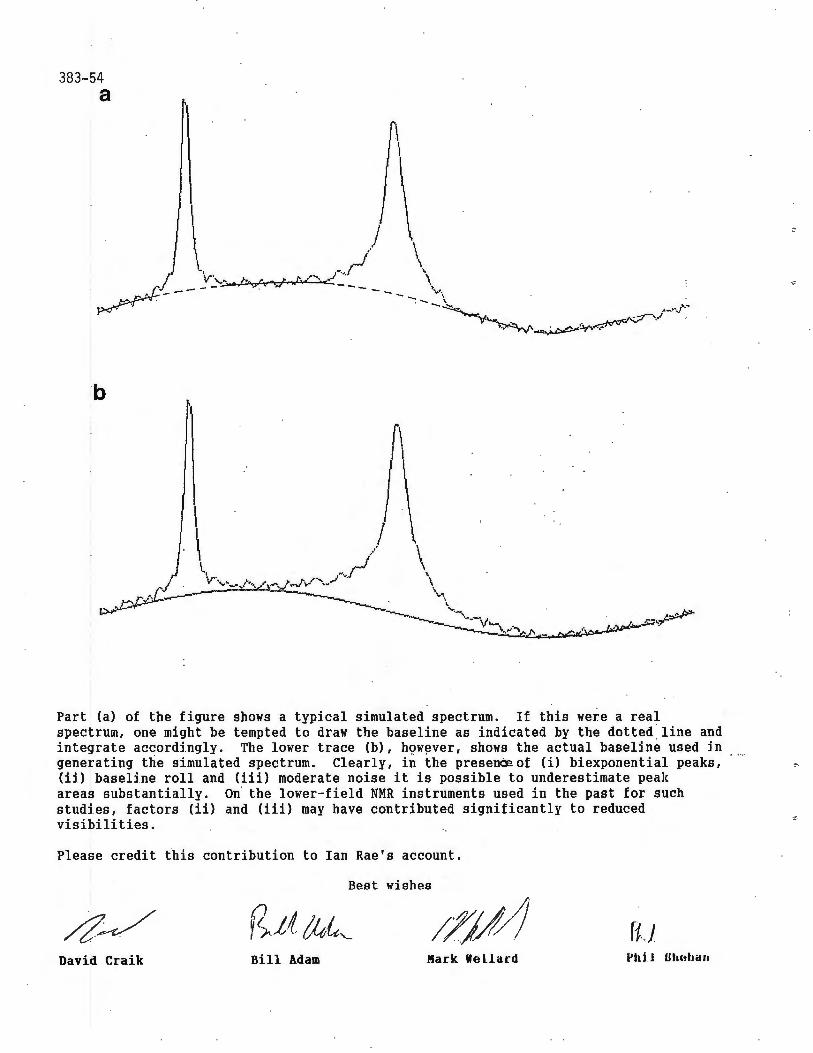
383-54 a
\ \
Part (a) of the figure shows a typical simulated spectrum. If this were a real spectrum, one might be tempted to draw the baseline as indicated by the dotted line and integrate accordingly. The lower trace (b), h9w,ver, shows the actual baseline used in generating the simulated spectrum. Clearly, in the presenceof (i) biexponential peaks, (ii) baseline roll and (iii) moderate noise it is possible to underestimate peak areas substantially. On the lower-field NMR instruments used in the past for such studies, factors (ii) and (iii) may have contributed significantly to reduced visibilities.
Please credit ibis contribution to Ian Rae's account.
Best wishes
David Craik Bill Adam Mark lfe Llacd J'hiJ Bhoha11
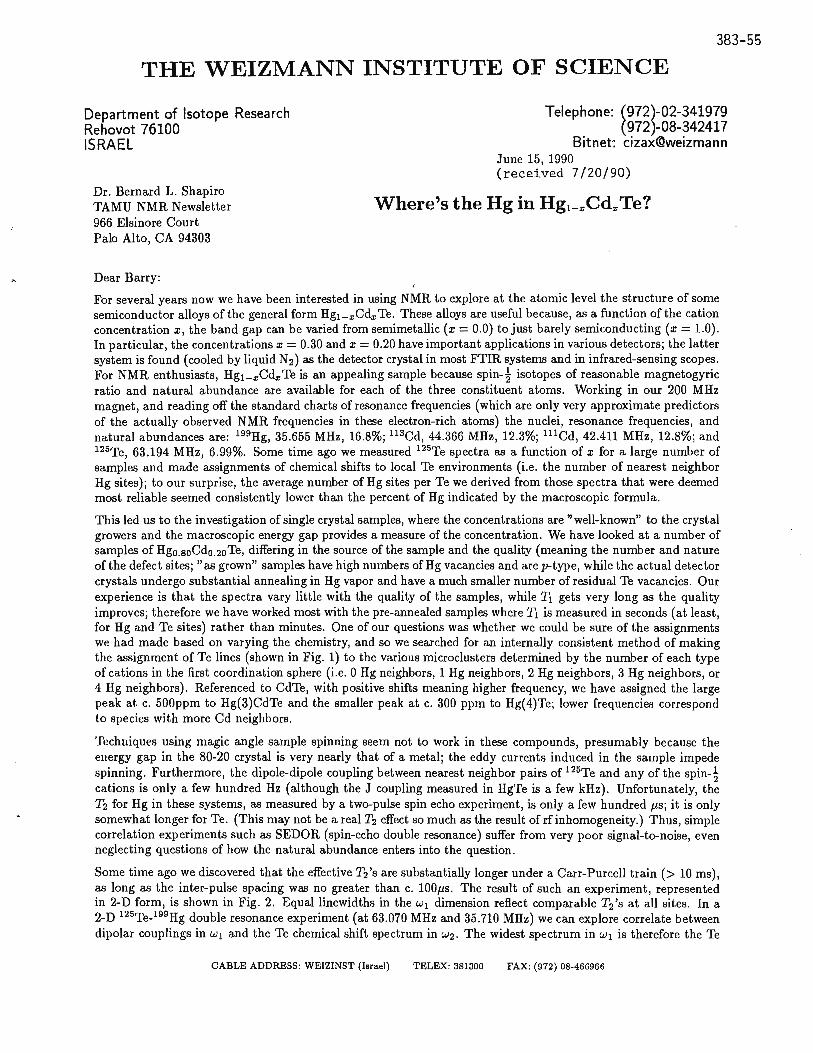
383-55
THE WEIZMANN INSTITUTE OF SCIENCE
Department of Isotope Research Rehovot 76100 ISRAEL
Dr. Bernard L. Shapiro TAMU NMR Newsletter 966 Elsinore Court Palo Alto, CA 94303
Dear Barry:
Telephone: (972)-02-341979 (972)-08-342417
Bitnet: cizax©weizmann June 15, 1990 (received 7/20/90)
Where's the Hg in Hg1_.,Cd., Te?
For several years now we have been interested in using NMR to explore at the atomic level the structure of some semiconductor alloys of the general form Hg1_.,Cd., Te. These alloys are useful because, as a function of the cation concentration x, the band gap can be varied from semimetallic (x = 0.0) to just barely semiconducting (x = 1.0) . In particular, the concentrations x = 0.30 and x = 0.20 have important applications in various detectors; the latter system is found (cooled by liquid N2) as the detector crystal in most FTIR systems and in infrared-sensing scopes. For NMR enthusiasts, Hg1_.,Cd., Te is an appealing sample because spin-½ isotopes of reasonable magnetogyric ratio and natural abundance are available for each of the three constituent atoms. Working in our 200 MHz magnet, and reading off the standard charts of resonance frequencies ( which are only very approximate predictors of the actually observed NMR frequencies in these electron-rich atoms) the nuclei, resonance frequencies, and natural abundances are: 199Hg, 35.655 MHz, 16.8%; 113Cd, 44.366 MHz, 12.3%; 111Cd, 42.411 MHz, 12.8%; and 125Te, 63.194 MHz, 6.99%. Some time ago we measured 125Te spectra as a function of x for a large number of samples and made assignments of chemical shifts to local Te environments (i.e. the number of nearest neighbor Hg sites); to our surprise, the average number of Hg sites per Te we derived from those spectra that were deemed most reliable seemed consistently lower than the percent of Hg indicated by the macroscopic formula.
This led us to the investigation of single crystal samples, where the concentrations are "well-known" to the crystal growers and the macroscopic energy gap provides a measure of the concentration. We have looked at a number of samples of Hg0_80Cd0.20 Te, differing in the source of the sample and the quality (meaning the number and nature of the defect sites; "as grown" samples have high numbers of Hg vacancies and are p-type, while the actual detector crystals undergo substantial annealing in Hg vapor and have a much smaller number of residual Te vacancies. Our experience is that the spectra vary little with the quality of the samples, while T1 gets very long as the quality improves; therefore we have worked most with the pre-annealed samples where T1 is measured in seconds ( at least, for Hg and Te sites) rather than minutes. One of our questions was whether we could be sure of the assignments we had made based on varying the chemistry, and so we searched for an internally consistent method of making the assignment of Te lines (shown in Fig. 1) to the various microclusters determined by the number of each type of cations in the first coordination sphere (i .e. 0 Hg neighbors, 1 Hg neighbors, 2 Hg neighbors, 3 Hg neighbors, or 4 Hg neighbors) . Referenced to CdTe, with positive shifts meaning higher frequency, we have assigned the large peak at. c. 500ppm to Hg(3)CdTe and the smaller peak at c. 300 ppm to Hg( 4)Te; lower frequencies correspond lo species with more Cd neighbors.
Techniques using magic angle sample spinning seem not to work in these compounds, presumably because the energy gap in the 80-20 crystal is very nearly that of a metal; the eddy currents induced in the sample impede spinning. Furthermore, the dipole-dipole coupling between nearest neighbor pairs of 125Te and any of the spin-½ cations is only a few hundred Hz (although the J coupling measured in HgTe is a few kHz). Unfortunately, the T2 for Hg in these systems, as measured by a two-pulse spin echo experiment, is only a few hundred µs; it is only somewhat longer for Te. (This may not be a real T2 effect so much as the result of rf inhomogeneity.) Thus, simple correlation experiments such as SEDOR (spin-echo double resonance) suffer from very poor signal-to-noise, even neglecting questions of how the natural abundance enters into the question.
Some time ago we discovered that the effective T2's are substantially longer under a Carr-Purcell train(> 10 ms), as long as the inter-pulse spacing was no greater than c. lOOµs. The result of such an experiment, represented in 2-D form, is shown in Fig. 2. Equal linewidths in the w1 dimension reflect comparable T2's at all sites. In a 2-D 125Te-199Hg double resonance experiment (at 63.070 MHz and 35.710 MHz) we can explore correlate between dipolar couplings in w1 and the Te chemical shift spectrum in w2. The widest spectrum in w1 is therefore the Te
CABLE ADDRESS: WEIZINST (Israel) TELEX: 381300 FAX: (972) 08-466966
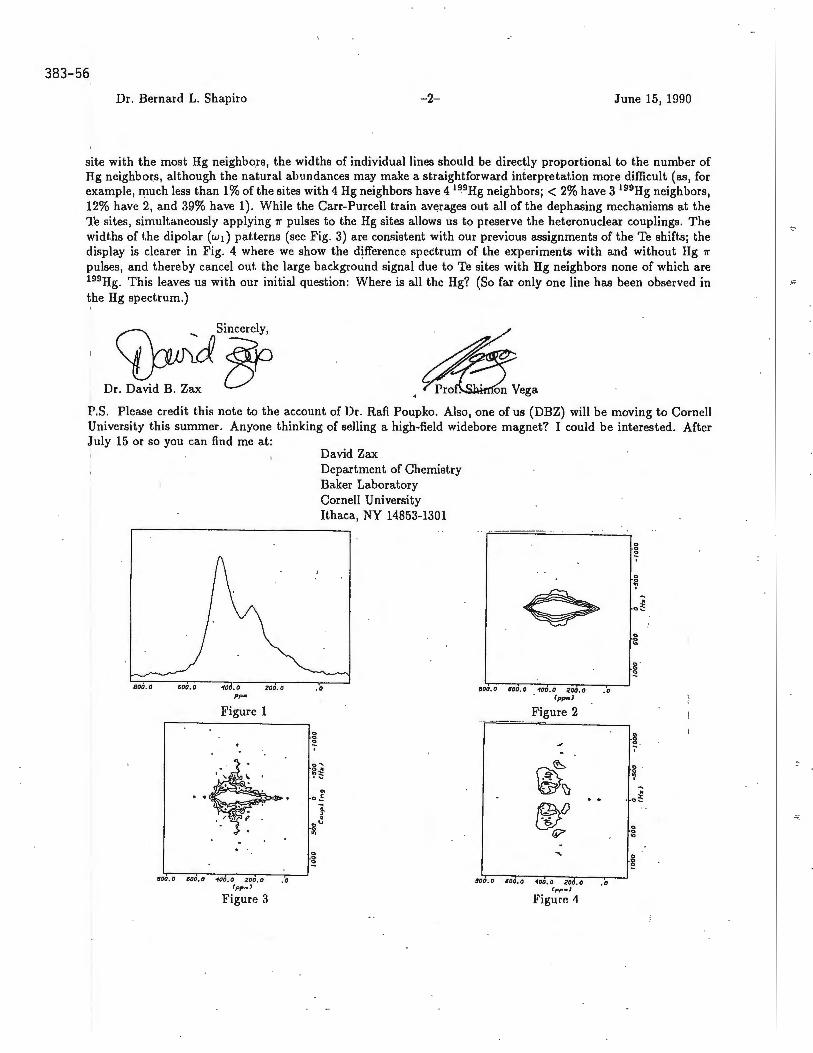
383-56
Dr. Bernard L. Shapiro -2- June 15, 1990
site with the most Hg neighbors, the widths of individual lines should be directly proportional to the number of Hg neighbors, although the natural abundances may make a straightforward interpretation more difficult (as, for example, much less than 1 % of the sites with 4 Hg neighbors have 4 1~9Hg neighbors; < 2% have 3 199Hg neighbors, 12% have 2, and 39% have 1). While the Carr-Purcell train averages out all of the dephasing mechanisms at the Te sites, simultaneously applying 1r pulses to the Hg sites allows us to preserve the heteronuclear couplings. The widths of the dipolar (wi) patterns (see Fig. 3) are consistent with our previous assignments of the Te shifts; the display is clearer in Fig. 4 where we show the difference spectrum of the experiments with and without Hg 1r
pulses, and thereby cancel out the large background signal due to Te sites with Hg neighbors none of which are 199Hg. This leaves us with our initial question: Where is all the Hg? (So far only one line has been observed in the Hg spectrum.)
~Sinmely,
D,. David B. Zax ~ .~ega
P.S. Please credit this note to the account of Dr. Rafi Poupko. Also, one of us (DBZ) will be moving to Cornell University this summer. Anyone thinking of selling a high-field widebore magnet? I could be interested. After July 15 or so you can find me at :
800.0 600.0 "100 . 0 200.0
Figure 1
!100. 0 600. 0 <fOO . O 200.0 . 0 {pp,.)
Figure 3
David Zax Department of Chemistry Baker Laboratory Cornell University Ithaca, NY 14853-1301
.o ,ao.o 100. 0
soo .o 100 , 0
-,oo .o zoo.a .o (pp,,,.)
Figure 2
g ✓ 2
~ 0
~\) ~ ~ . . -ol &!_0
0 (y 0 .,
"' 0 0 2
-tao. o 200 . 0 .o (pp•J
Figure 4
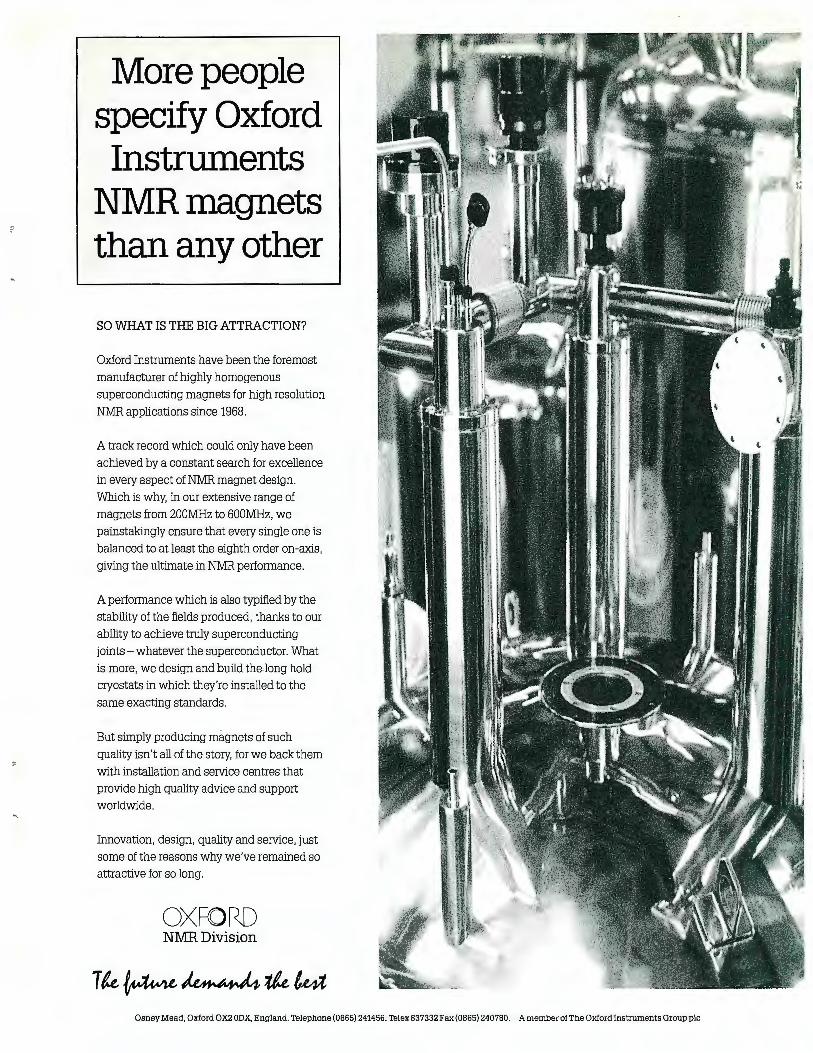
More people specify Oxford Instruillents
NMRmagnets than any other
SO WHAT IS THE BIG ATTRACTION?
Oxford Instruments have been the foremost
manufacturer of highly homogenous
superconducting magnets for high resolution
NMR applications since 1968.
A track record which could only have been
achieved by a constant search for excellence
in every aspect of NMR magnet design.
Which is why, in our extensive range of
magnets from 200MHz to 600MHz, we
painstakingly ensure that every single one is
balanced to at least the eighth order on-axis,
giving the ultimate in NMR performance.
A performance which is also typified by the
stability of the fields produced, thanks to our
ability to achieve truly superconducting
joints - whatever the superconductor. What
is more, we design and build the long hold
cryostats in which they're installed to the
same exacting standards.
But simply producing magnets of such
quality isn't all of the story, for we back them
with installation and service centres that provide high quality advice and support
worldwide.
Innovation, design, quality and service, just
some of the reasons why we've remained so
attractive for so long.
OXFORD NMR Division
Osney Mead, Oxford OX2 0DX, England. Telephone (0865) 241456. Telex 837332 Fax (0865) 240780. A member of The Oxford Instruments Group pie

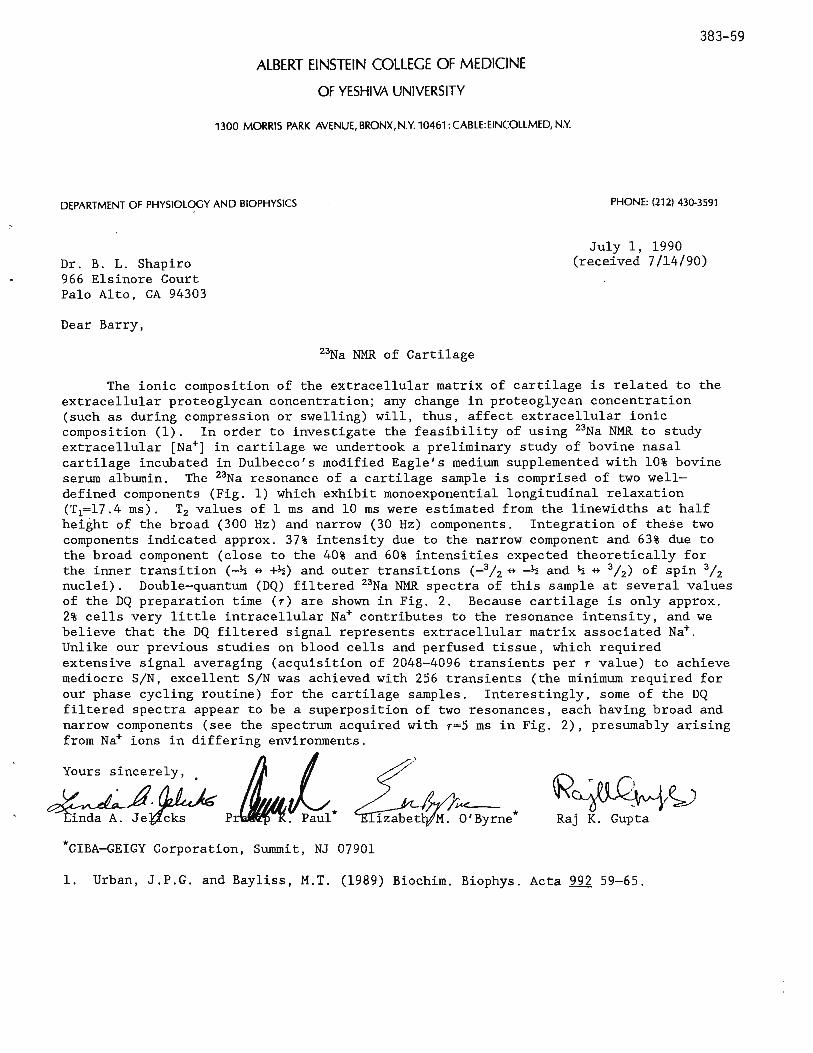
ALBERT EINSTEIN COLLEGE OF MEDICINE
OF YESHIVA UNIVERSITY
383-59
1300 MORRIS PARK AVENUE, BRONX, N.Y. 10461 : CABLE:EINCOLLMED, N.Y.
DEPARTMENT OF PHYSIOLOGY AND BIOPHYSICS
Dr. B. L. Shapiro 966 Elsinore Court Palo Alto, CA 94303
Dear Barry,
23Na NMR of Cartilage
PHONE: (212) 430-3591
July 1, 1990 (received 7/14/90)
The ionic composition of the extracellular matrix of cartilage is related to the extracellular proteoglycan concentration; any change in proteoglycan concentration (such as during compression or swelling) will, thus, affect extracellular ionic composition (1). In order to investigate the feasibility of using 23Na NMR to study extracellular [Na+] in cartilage we undertook a preliminary study of bovine nasal cartilage incubated in Dulbecco's modified Eagle's medium supplemented with 10% bovine serum albumin. The 23Na resonance of a cartilage sample is comprised of two welldefined components (Fig. 1) which exhibit monoexponential longitudinal relaxation (T1=17.4 ms). T2 values of 1 ms and 10 ms were estimated from the linewidths at half height of the broad (300 Hz) and narrow (30 Hz) components. Integration of these two components indicated approx. 37% intensity due to the narrow component and 63% due to the broad component (close to the 40% and 60% intensities expected theoretically for the inner transition (-½ ++ +½) and outer transitions (-3/z ++ -½ and½++ 3 / 2 ) of spin 3/ 2 nuclei). Double-quantum (DQ) filtered 23Na NMR spectra of this sample at several values of the DQ preparation time (r) are shown in Fig. 2. Because cartilage is only approx. 2% cells very little intracellular Na+ contributes to the resonance intensity, and we believe that the DQ filtered signal represents extracellular matrix associated Na+. Unlike our previous studies on blood cells and perfused tissue, which required extensive signal averaging (acquisition of 2048-4096 transients per r value) to achieve mediocre S/N, excellent S/N was achieved with 256 transients (the minimum required for our phase cycling routine) for the cartilage samples. Interestingly, some of the DQ filtered spectra appear to be a superposition of two resonances, each having broad and narrow components (see the spectrum acquired with r=5 ms in Fig. 2), presumably arising from Na+ ions in differing environments.
Yours s·ifi.ely, , /} L ~ Je~ P~. Paul*
~M-~ii/M~ O'Byrne*
~~~~ Raj K. Gupta
*CIBA-GEIGY Corporation, Summit, NJ 07901
1. Urban, J.P.G. and Bayliss, M.T. (1989) Biochim. Biophys. Acta 992 59-65.
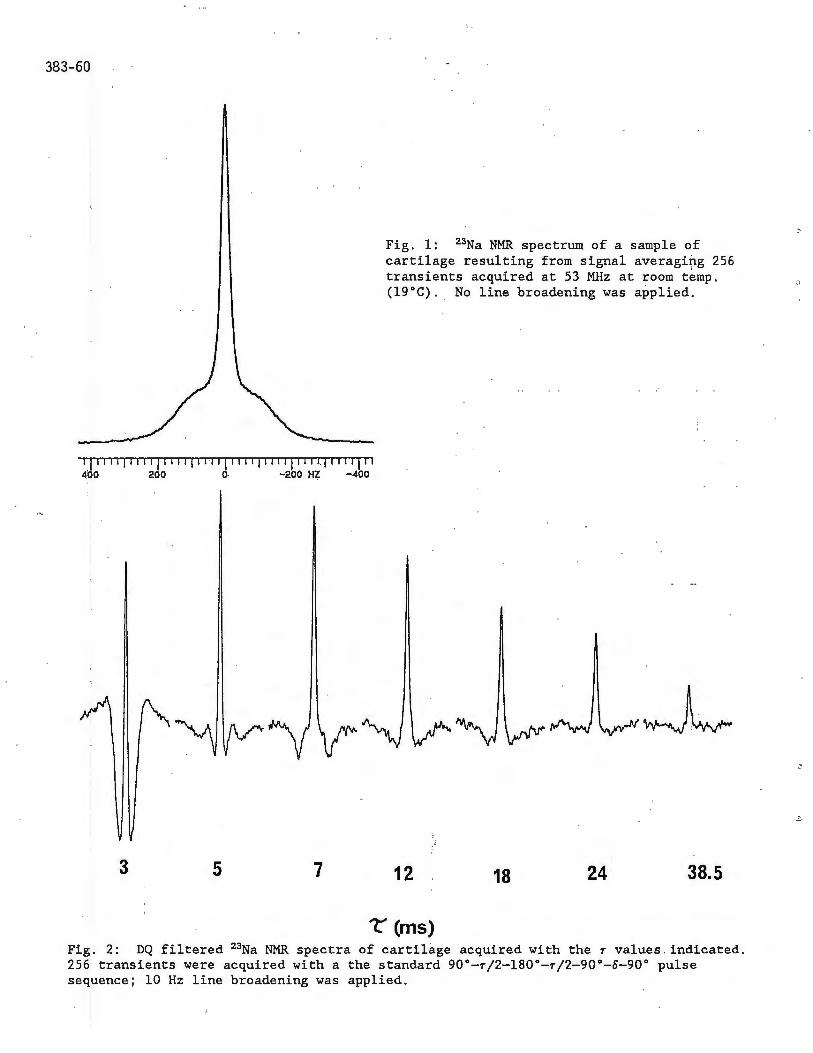
383-60
11111111111111111111111111111111111111111111 4'00 200 0 -200 HZ -400
I
3 5 7
Fig. 1: 23Na NMR spectrum qf a sample of cartilage resulting from signal averagifg 256 transients acquired at 53 MHz at room temp. (l9°C). No line broadening was applied.
~
12 18 24 38.5
"t' (ms) Fig. 2: DQ filtered 23Na NMR spectra of cartilage acquired with the r values . indicated. 256 transients were acquired with a the standard 90°-r/2-180"-r/2-90"-o-90° pulse sequence; 10 Hz line broadening was applied.
t----.,>lc, __ _ J
FREQUENCY SYNTHESIZERS
Range: 0.1-40 MHz Resolution: 0.1Hz-100KHz (opt) Switching: 1-2oµs
Range: 90-120 MHz Resolution: 0.1 Hz-100KHz (opt) Switching: 1-20µs
Range: 0.1-160 MHz Resolution: 0.1 Hz-1 OOKHz (opt) Switching: 1-20µs
Range: 1-250 MHz Resolution: 0.1 Hz-100KHz (opt) Switching: 1-20µs
Range: 0.1-300 MHz Resolution: 1 Hz Switching: 1-20µs
HIGH-PERFORMANCE DIRECT SYNTHESIZERS Accurate, stable, quiet frequencies on command, fast. For NMR, imaging, SATCOM, surveillance, ATE. Sources adapting to your needs with options. High demonstrated reliability. Thousands in use.
PIS . 040 . Output: +3 to +13dBm; 50ohm Spurious Outputs: - 75dB Phase Noise: - 75dBc (0.5Hz-15KHz)
PIS 120 Output: +3 to +10dBm; 50ohm Spurious Outputs: - 75dBc Phase Noise: -75dBc (0.5Hz-15KHz)
Output: +3 to +13dBm; 50ohm Spurious Outputs: - 75dB Phase Noise: -63dBc (0.5Hz-15KHz)
F'~ 250 Output: +3 to +13dBm; 50ohm Spurious Outputs: - 70dB Phase Noise: -63dBc (0.5Hz-15KHz)
PIS 300 Output: +3 to +13dBm; 50ohm Spurious Outputs: Type 1 Type 2
-65/60dB
Freq. St'd: OCXO, TCXO, Ext. Interface: BCD par. or GPIB Price: $4,800.00*
Freq. St'd: OCXO, TCXO, Ext. Interface: BCD par. or GPIB Price $4,800.00*
Freq. St'd: OCXO, TCXO, Ext. Interface: BCD par. or GPIB Price: $5,850.00*
Freq. St'd: 0CXO, TCXO, Ext. Interface: BCD par. or GPIB Price: $6,700.00*
Freq. St'd: OCXO, TCXO, Ext. Interface: BCD par. or GPIB Price: Type 1 Type 2
Phase Continuous: 1Hz-100KHz steps - 70/65 (typ/spec)
Phase Noise: -68dBc(0.5Hz-15KHz) -63dBc $5,800.00* $5,300.00*
Range: 1-500 MHz Resolution: 0.1 Hz-100KHz (opt) Switching: 1-20µs
Range: 10 MHz band, selected decade 0.1-100 MHz
Resolution: 1 Hz Switching: 1-5µs
PIS 500 . Output: +3 to +13dBm; 50ohm Spurious Outputs: - 70dB Phase Noise: -63dBc (0.5Hz-15KHz)
Freq. St'd: OCXO, TCXO, Ext. Interface: BCD par. or GPIB Price: $7,850.00*
PIS xi □ NEW Output: +3 to +13dBm; 50ohm Spurious Outputs: -65/-60dB (typ/spec) Phase Noise: - 70dBc (0.5Hz-15KHz)
Freq. St'd: 0CXO, TCXO, Ext. Interface: BCD par. or GPIB Price: $2,450.00*
Phase Continuous: 2 MHz band, even or odd steps
OTHER OPTIONS: Programmable Attenuator 0-90dB (or 0-99dB with GPIB) n x 10 MHz output (20-140 MHz) or any 10 MHz line
• Prices are US only, and include manual & remote (BCD) control, 1 Hz resolution, OCXO std.
PROGRAMMED TEST SOURCES. INC. P.O. Box 517, 9 Beaver Brook Rd., Littleton, MA 01460 508-486-3008 i=AX Number: 508-486-4495
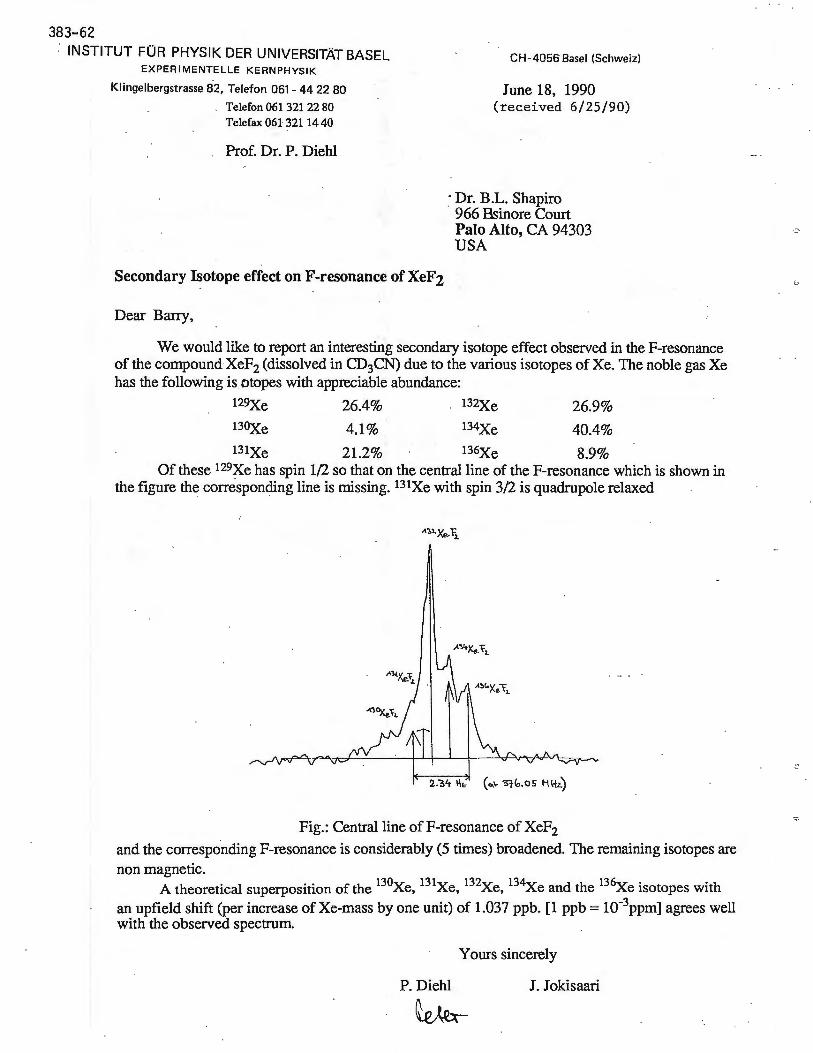
383-62 . INSTITUT FOR PHYSIK DER UNIVERSITAT BASEL CH-4056 Basel (Schweiz)
EX PERI MENTELLE KERNPHYSIK
Klingelbergstrasse 82, Telefon 061- 44 22 80
Telefon 061 321 22 80 Telefax 0§1321 14 40
Prof. Dr. P. Diehl
June 18, 1990 (received 6/25/90)
· Dr. B.L. Shapiro
Secondary Isotope effect on F-resonance of XeF2
Dear Barry,
966 Bsinore Court Palo Alto, CA 94303 USA
We would like to report an interesting secondary isotope effect observed in the F-resonance of the compound XeF2 (dissolved in CD3CN) due to the various isotopes of Xe. The noble gas Xe has the following is otopes with appreciable abundance:
129Xe 26.4%
130Xe 4.1%
132Xe
134Xe 26.9%
40.4%
131Xe 21.2% 136Xe 8.9% Of these 129Xe has spin 1/2 so that on the central line of the F-resonance which is shown in
the figure the corresponding line is missing. 131Xe with spin 3/2 is quadrupole relaxed
Fig.: Central line of F-resonance of XeF2 and the corresponding F-resonance is considerably (5 times) broadened. The remaining isotopes are non magnetic.
. . . 13ox nix n2x n4x d h 136x . . h A theoretical superpos1t1on of the e, e, e, e an t e e isotopes wit an upfield shift (per increase of Xe-mass by one unit) of 1.037 ppb. [1 ppb = 10·3ppm] agrees well with the observed spectrum.
Yours sincerely
P. Diehl J. Jokisaari
~~
I
11
Solids put us on THEMAP----
Over SO t / HEfflAGnETIC/, inc.
Installed Spectrometers.
: I
II
I
I
Dedicated to Design Exce]lence
303 - 484 - 0428
i / HEfflAGneTICJ! inc.
2555 Midpoint Dr., Fort Collins, Colarado 80525 Fax:(303) 484-0487
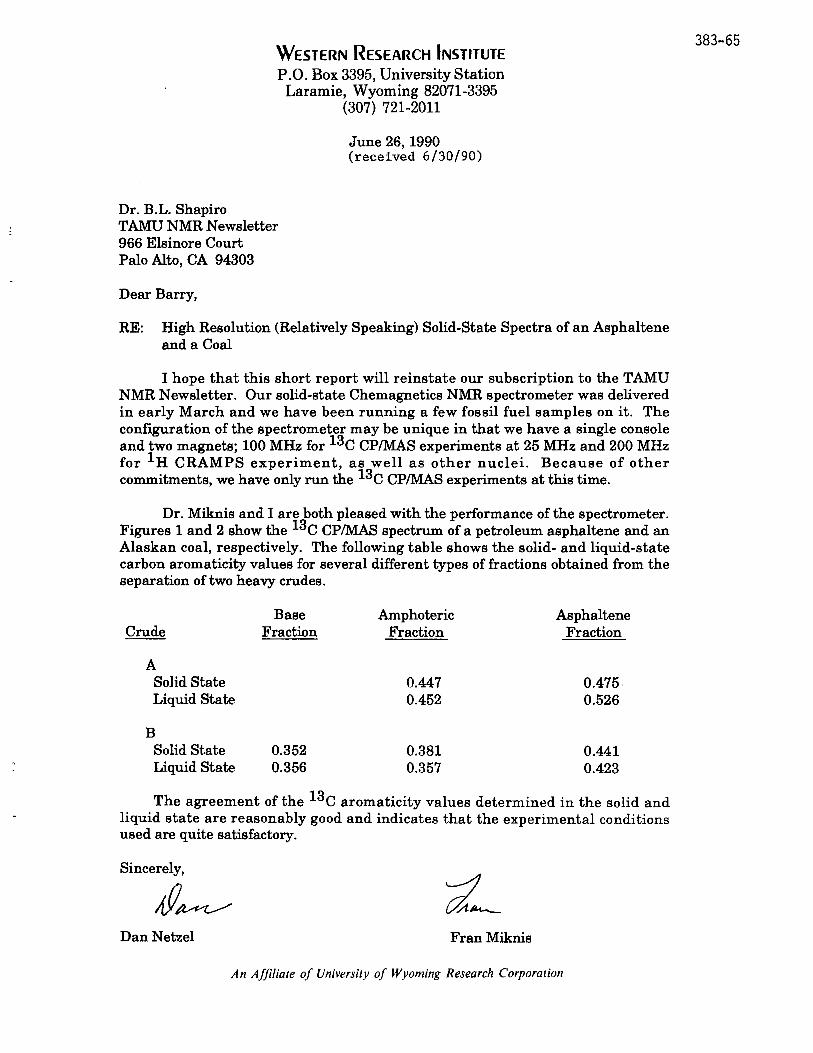
Dr. B.L. Shapiro
WESTERN RESEARCH INSTITUTE
P.O. Box 3395, University Station Laramie, Wyoming 82071-3395
(307) 721-2011
June 26, 1990 (received 6/30/90)
TAMU NMR Newsletter 966 Elsinore Court Palo Alto, CA 94303
Dear Barry,
RE: High Resolution (Relatively Speaking) Solid-State Spectra of an Asphaltene and a Coal
I hope that this short report will reinstate our subscription to the TAMU NMR Newsletter. Our solid-state Chemagnetics NMR spectrometer was delivered in early March and we have been running a few fossil fuel samples on it. The configuration of the spectrometer may be unique in that we have a single console and two magnets; 100 MHz for 13c CP/MAS experiments at 25 MHz and 200 MHz for 1H CRAMPS experiment, as well as other nuclei. Because of other commitments, we have only run the 13c CP/MAS experiments at this time.
Dr. Miknis and I are both pleased with the performance of the spectrometer. Figures 1 and 2 show the 13c CP/MAS spectrum of a petroleum asphaltene and an Alaskan coal, respectively. The following table shows the solid- and liquid-state carbon aromaticity values for several different types of fractions obtained from the separation of two heavy crudes.
A Solid State Liquid State
B Solid State Liquid State
Base Fraction
0.352 0.356
Amphoteric Fraction
0.447 0.452
0.381 0.357
Asphaltene Fraction
0.475 , 0.526
0.441 0.423
The agreement of the 13c aromaticity values determined in the solid and liquid state are reasonably good and indicates that the experimental conditions used are quite satisfactory.
Sincerely,
Dan Netzel FranMiknis
An Affiliate of University of Wyoming Research Corporation
383-65
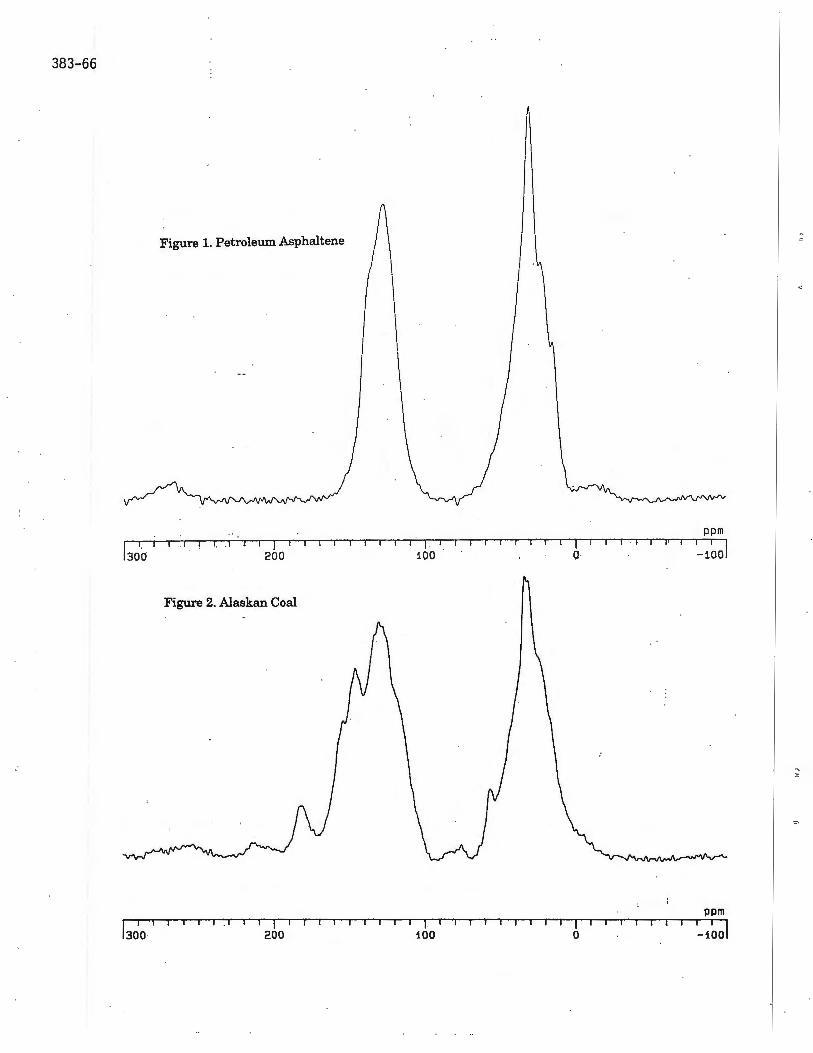
383-66
Figure 1. Petroleum Asphaltene
I I 200
Figure 2. Alaskan Coal
I I I
200
I I I
100
I I I 100
I 0
I 0
ppm
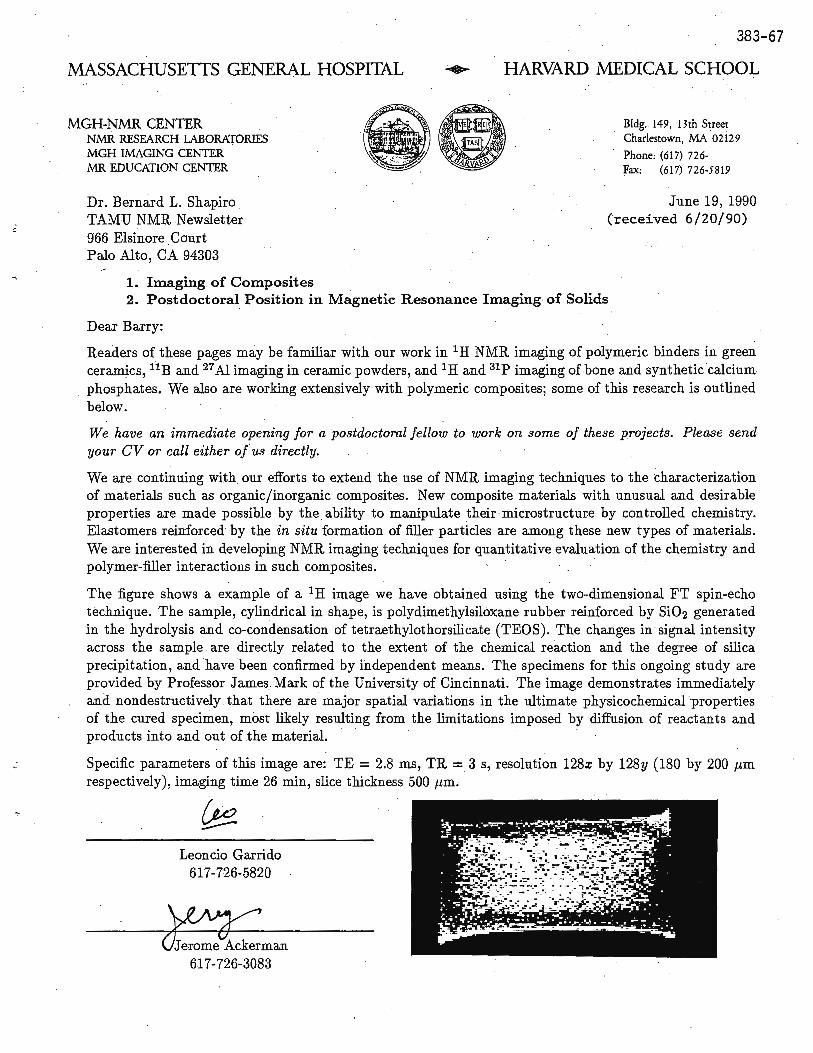
MASSACHUSETTS GENERAL HOSPITAL
MGH-NMR CENTER NMR RESEARCH LABORAIDRIES
. MGH IMAGING CENTER MR EDUCATION CENTER
Dr. Bernard L. Shapiro TAMU NMR Newsletter 966 Elsinore Court Palo Alto, CA 94303
383-67
HARVARD MEDICAL SCHOOL
Bldg. 149, 13th Street Charlestown, MA ·02i29
Phone: ( 617) 72 6-Fax: (617) 726-5819
June 19, 1990 (received 6/20/90)
1. Imaging. of Composites 2. Postdoctoral Position in M~gnetic Resonance Imaging of Solids
Dear Barry:
Readers of these pages may be familiar with our work in 1 H NMR imaging of polymeric binders in green ceramics, 11 B and 27 Al imaging in ceramic powders, and 1 H and 31 P imaging of.bone and synthetic calcium phosphates; We also are working extensively with polymeric composites; some of this research is outlined below.
We have an immediate opening for a postdoctoral fellow to work on some of these projects. Please send your CV or call either of us directly;
vVe are continuing with. our efforts to extend the use of NMR imaging techniques to the characterization of materials such as organic/inorganic composites. New composite materials with unusual and desirable properties are made possible by the ability to manipulate their microstructure by controlled chemistry. Elastomers reinforced by the in situ formation of filler particles are among these new types of materials. We are interested in developing NMR imaging techniques for quantitative evaluation of the chemistry and polymer-filler interactions in such composites. ·
The figure shows a example of a 1H image we have obtained using the two-dimensional FT spin-echo technique. The sample, cylindrical in. shape, is polydimethylsiloxane rubber reinforced by Si02 generated in the hydrolysis and co-condensation of tetraethylothorsilicate (TEOS). The changes in signal intensity across the sample . are directly related to the extent of the chemical reaction and the degree of silica precipitation, and have been confirmed by independent means. The specimens for this ongoing study are provided by Professor James Mark of the University of Cincinnati. The image demonstrates immediately and nondestructively . that there are · major spatial variations in the ultimate physicochemical properties of the cured specimen, most likely resulting from the limitations imposed by diffusion of reactants and
. products into and out of .the material.
Specific parameters of this image are: TE = 2.8 ms, TR = 3 s, resolution 128x by 128y (180 by 200 µm respectively), imaging time 26 min, slice thickness 500 µm,
Leoncio Gar.rido 617-726-5820
617-726-3083
383-68 TEXAS A&M UNIVERSITY No. 383
August 1990
Table of Contents, cont'd.
NEWSLETTER
39K NMR for Quantitation of Potassium in Biological Tissues Craik, D., Adam, B., Wellard, M., and Shehan, P. 53
Where's the Hg in Hgz.xCdxTe?; Equipment Wanted .Zax, D. B., and Vega, S. 55
23Na NMR of Cartilage . Jelicks, L.A., Paul, P. K., O'Byrne, E. M., and Gupta, R. K. 59
Secondary Isotope Effect on the 19P Resonance in XeFz
High Resolution Solid-State Spectra of an Asphaltene and a Coal
Imaging of Composites; Position Available
TAMU NMR Newsletter: Sundry Notices
* * * *
Diehl, P., and Jokisaari, J. 62
Netzel, D. A., and Miknis, F. 65
Garrido, L., and Ackerman, J. L. 67
. Shapiro, B. L. 68
*
Another (?) Mailing Label Adornment: Is Your Dot Red?
If the mailing label on your envelope of this issue is adorned with a large ~ or circle: this decoration means that you will not be mailed any more issues until a technical contribution has been received by me.
Page Length Request
Attention overseas subscribers: If you must use paper which is longer that 11 ", please take care that nothing appears below 10" (25.5 cm) on your pages. It is costly to make reductions. Thank you.
* * * * *
.:;
..;,
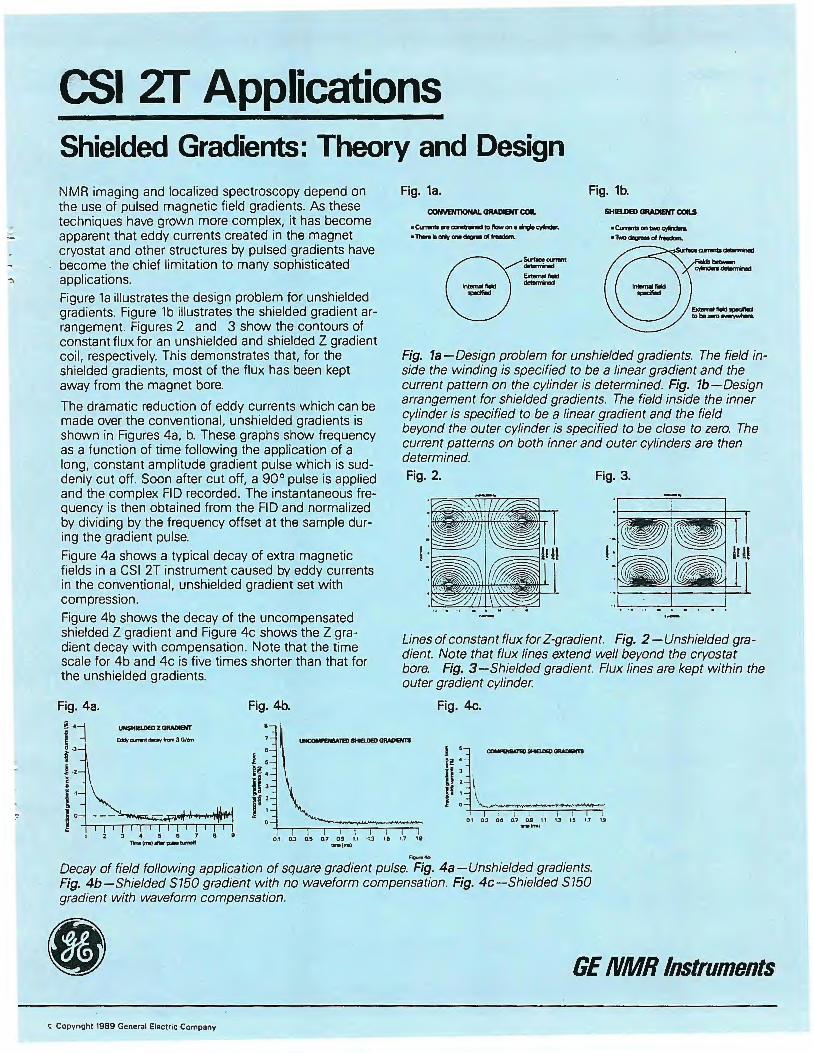
CSI 2T Applications Shielded Gradients: Theory and Design NMR imaging and localized spectroscopy depend on the use of pulsed magnetic field gradients. As these techniques have grown more complex, it has become apparent that eddy currents created in the magnet cryostat and other structures by pulsed gradients have become the chief limitation to many sophisticated applications.
Figure la illustrates the design problem for_ unshielded gradients. Figure lb illustrates the shielded gradient arrangement. Figures 2 and 3 show the contours of constant flux for an unshielded and shielded Z gradient coil, respectively. This demonstrates that, for the shielded gradients, most of the flux has been kept away from the magnet bore.
The dramatic reduction of eddy currents which can be made over the conventional, unshielded gradients is shown in Figures 4a, b. These graphs show frequency as a function of time following the application of a long, constant amplitude gradient pulse which is suddenly cut off. Soon after cut off, a 90° pulse is applied and the complex FID recorded . The instantaneous frequency is then obtained from the FID and normalized by dividing by the frequency offset at the sample during the gradient pulse.
Figure 4a shows a typical decay of extra magnetic fields in a CSI 2T instrument caused by eddy currents in the conventional, unshielded gradient set with compression.
Figure 4b shows the decay of the uncompensated shielded Z gradient and Figure 4c shows the Z gradient decay with compensation. Note that the time scale for 4b and 4c is five times shorter than that for the unshielded gradients.
Fig. 4a. Fig. 4b.
Fig. 1a.
C0NVENTlONAL GRADIENT COL
• Cl.ffllnts .,. ~ ID flow on a li"lQlle cylrdlr.
•Ther9iaaMfonedlgrar:Afrea:bn.
8_,,,,,,,..~,..,.,. ---.
Fig. 1b.
SHIBDB> GRADIENT C01U1
•o..nntl on two cyti,dn.
•T-M>dlgr-.01-
Fig. ta-Design problem for unshielded gradients. The field inside the winding is specified to be a linear gradient and the current pattern on the cylinder is determined. Fig. 1b-Design arrangement for shielded gradients. The field inside the inner cylinder is specified to be a linear gradient and the field beyond the outer cylinder is specified to be close to zero. The current patterns on both inner and outer cylinders are then determined. Fig. 2. Fig. 3.
Lines of constant flux for Z-gradient. Fig. 2-Unshielded gradient. Note that flux lines extend well beyond the cryostat bore. Fig. 3-Shielded gradient. Flux lines are kept within the outer gradient cylinder.
Fig. 4c.
UNSHIB.DED Z GRADIENT
EddyCU'T9'1tdllc:ayfrtffllG/an I.WCOW<NSATBI SHIELDED CllWllBffll
123 4 58 7 89 r..-. 11N1afWp.a1b.mcJff
..........
I • .,,.__.,..,SHIElDB)_ Bi! •-u :If. \ j O ~ - .... .,.__,,,_~
1 ; I 01 03 0 & 0 .7 0 .9 11 1.3 1.5 1.7 1.9
lll'N l-1
Decay of field following application of square gradient pulse. Fig. 4a-Unshielded gradients. Fig. 4b-Shielded S750 gradient with no waveform compensation. Fig. 4c-Shielded S750 gradient with waveform compensation.
GE NMR Instruments
~ Copyright 1989 General Elect r ic Company
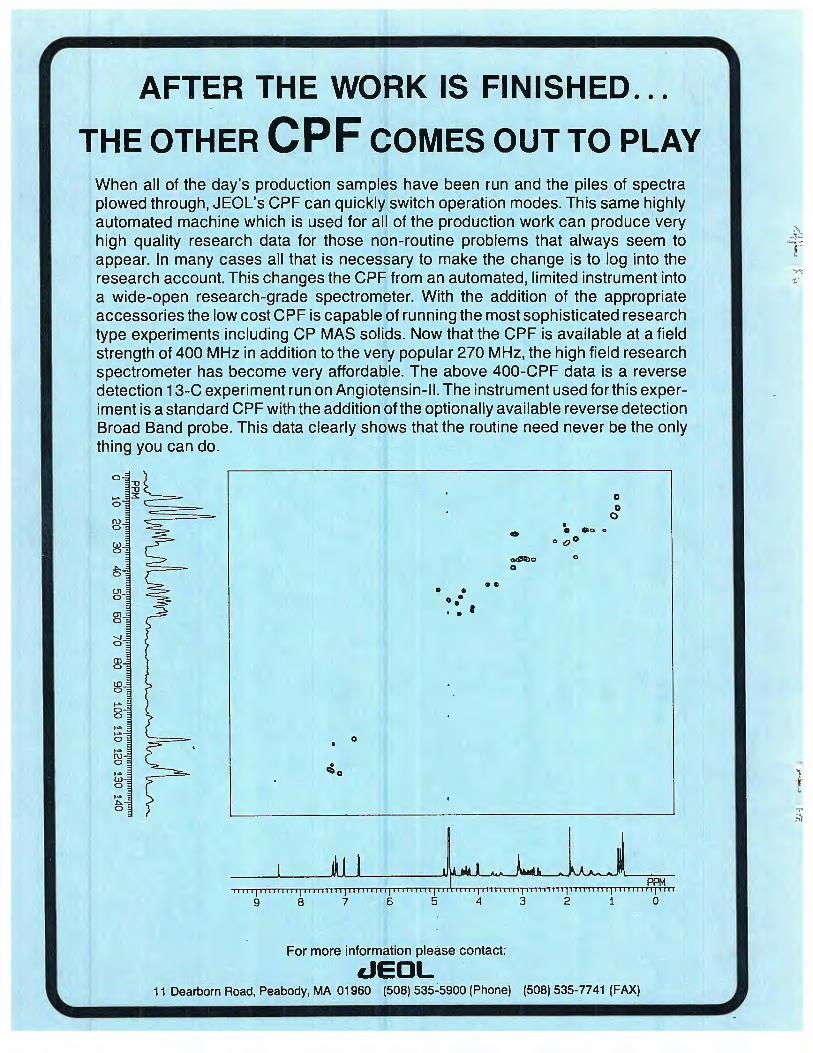
AFTER THE WORK IS FINISHED ...
THE OTHER CPF COMES OUT TO PLAY When all of the day's production samples have been run and the piles of spectra plowed through, JEOL's CPF can quickly switch operation modes. This same highly automated machine which is used for all of the production work can produce very high quality research data for those non-routine problems that always seem to appear. In many cases all that is necessary to make the change is to log into the research account. This changes the CPF from an automated, limited instrument into a wide-open research-grade spectrometer. With the addition of the appropriate accessories the low cost CPF is capable of running the most sophisticated research type experiments including CP MAS solids. Now that the CPF is available at a field strength of 400 MHz in addition to the very popular 270 MHz, the high field research spectrometer has become very affordable. The above 400-CPF data is a reverse detection 13-C experiment run on Angiotensin-11. The instrument used for this experiment is a standard CPF with the addition of the optionally available reverse detection Broad Band probe. This data clearly shows that the routine need never be the only thing you can do. ·
0
....,. 0
I\) 0
w 0
J::,. 0
Ul 0
m 0
'-..J 0
CD 0
lD 0
....,. 0 0 ....,. ....,. 0 ....,. I\) 0
11
a
~a
• • 0 •
': I
0 I 0 Goo
o 00
0
0 0
0
..... , .... ~ .... , ...... ~ ...... , ......... ,.:b~ ... bd ..... ~ .. 9 8 7 6 5 4 3 2 1 0
For more information please contact:
cJEOL 11 Dearborn Road, Peabody, MA 01960 (508) 535~5900 (Phone) (508) 535-7741 (FAX)


