Embed Size (px)
Citation preview
JOURNAL OF GEOPHYSICAL RESEARCH, VOL. 101, NO. D22, PAGES 28,793-28,804, DECEMBER 20, 1996
Nocturnal vertical distribution of stratospheric 03, NO2 and NO3 from balloon measurements
Jean-Baptiste Renard, Michel Pirre, • Claude Robert, Guy Moreau • Laboratoire de Physique et Chimie de l'Environnement / CNRS, Orl6ans, France
Daniel Huguenin Geneva Observatory, Sauvemy, Switzerland
James M. Russell III
Hampton University, Hampton, Virginia
Abstract. Simultaneous measurements of NO2, O3, NO3, and aerosol extinction coefficient vertical distribution have been made in the middle of the night by the AMON (Absorption par Minoritaires Ozone et Nox) instrument on October 16, 1993, from a balloon platform at float altitude, above Aire sur l'Adour in the south of France. Amon measures atmospheric transmission in the UV Visible range, using the star occultation method. Vertical distributions, obtained between 20 and 40 km, are calculated by a tangent ray inversion technique. Measurements of NO and NO2 by the HALOE (HALogen Occultation Experiment) instrument aboard UARS were also available on October 17, 1993, close to Aire sur l'Adour. Comparison with box model simulations, including heterogeneous reactions, shows that while an increase of NO3 concentration at 38 km could be explained by an occasionally steep vertical gradient of temperature concentrations, another increase of both NO2 and NO3 measured by AMON between 22 to 25 km, i.e. in the upper part of the aerosol layer, cannot be explained by the model. Such an increase is also present on one HALOE profile close to Aim sur l'Adour, for the same altitude range.
1. Introduction
In this paper we present balloon-borne nighttime measurements of the stratospheric vertical distribution of 03, NO2, and NO3. These observations were made during fall in midlatitude with the new so-called AMON
(Absorption par Minoritaires Ozone et Nox) instrument, which allows simultaneous detection of these species. The measurements were obtained using the stellar occultation when the balloon was at float altitude.
Measurements of these species had been previously made by our group with the CMS (Compos6s Minoritaires Stratosph6riques)instrument and the same experiment technique [Rigaud et al., 1983; Naudet et al., 1989]. Contrary to AMON, this instrument was not able to measure simultaneously NO2, NO3, and ozone. Comparison between model data and a set of five NO3 vertical distributions obtained with CMS [Naudet et al., 1989] has always been reasonable [Pirre et al., 1989], especially when taking into account the relatively large uncertainties in the measurements. The NO3 vertical
•Also at Universit6 d'Or16ans
Copyright 1996 by the American Geophysical Union.
Paper number 96JD02012. 0148-0227/96/96JD-02012509.00
distribution has also been measured from the ground at night using the Moon as a light source and during sunrise [Smith and Solomon, 1990; Smith et al., 1993; Solomon et al., 1993]. Reasonable agreement with model calculations was also obtained with these data.
The NO2 vertical distribution has been shown theoretically to be very dependent on the sulfate aerosol content of the lower stratosphere [Hofmann and Solomon, 1989; Brasseur and Granier, 1992]. The main cause is the large probability for heterogeneous hydrolysis of N2Os on sulfate aerosols leading to its conversion to HNO3 [Tolbert et al., 1988; Hanson and Ravishankara, 1991; Fried et al., 1994]. Such a reaction had been suggested a long time ago to explain the partitioning in the NOy family [Cadle et al., 1975]. Recent measurements have demonstrated the efficiency of this reaction [McElroy et al., 1992; Rinsland et al., 1994; Webster et al., 1994; Lateltin et al., 1994].
After a brief description of the new instrument, we present the slant column of the species retrieved from the measurement of atmospheric transmission in the UV visible 300-700 nm range. A tangent-ray inversion technique is used to derive the vertical distribution of the species and the aerosol extinction coefficient. These vertical distributions are then compared with other measurements, in particular those made by the HALOE (HALogen Occultation Experiment) instrument aboard
28,793
28,794 RENARD ET AL.: NOCTURNAL DISTRIBUTION OF 03, NO2 AND NO3
UARS (Upper Atmospheric Research Satellite) close to our measurement location. Our results are f'mally compared with the results of a box model which takes into account the heterogeneous hydrolysis of N205 on sulfate aerosols.
Table 1. Latitude, Longitude, and Local Time of the Measurements by AMON on October 16, 1993, for a Few Elevation Angles of the Star Altair
Zenith Angle Altitude, km Latitude Longitude Local Time
2. Instrumentation and Observational Conditions
The AMON instrument, conceived for retrieving the vertical distribution of atmospheric species by using the stellar occultation method, is composed of a 20-cm Casselgrain telescope with a 1-m focal length, a grating spectrometer, and a charge-coupled device (CCD) detector 385 by 578 pixels [Robert, 1992; Naudet et al., 1994]. The spectrometer is designed to cover the near-UV and the visible wavelength domain in five bands: 300-400 nm, 400-475 nm, 475-550 nm, 550-625 nm and 625-700 nm. The maximum of NO2, 03, and NO3 absorption occurs near the middle of the 400- to 475-nm, 550- to 625-nm, and 625- to 700-m bands, respectively. These bands are dispersed by a flat-field grating and are focused on the CCD. This yields five parallel spectra at the surface of the detector. Each band covers a strip of 20 by 578 pixels, on which about 10 columns are devoted to the spectra and 5 columns on both sides are devoted to estimate the sky contamination. Spectra are sampled in a UV band at 0.18 nm per pixel and in the four visible bands at 0.14 nm per pixel. Such resolution is suitable for the retrieval of the NO2 and NO3 absorption features, as pointed out by Roscoe et al. [ 1996].
During the stratospheric flights the instrument is mounted on board a stabilized balloon platform built by the Geneva Observatory. Description and performance of the platform can be found in the work of Huguenin [1994]. The startracker, used to follow the setting star, has a precision of 3 arcsec rms. The observations can be performed until the star reaches an elevation of -5 ø below the horizon of the gondola, which corresponds to a line of sight with a minimum tangent point altitude of 15 km.
The flight reported here took place on the night of October 15-16, 1993, from the French launching base of l'Aire sur PAdour (43.7øN, 0.3øW). This flight was planned as part of the UARS correlative measurements program. The star used for the occultation was Altair (o• Aquila). The usable observations started on October 16 at 0016 UT and ended at 0104 UT when the balloon was at a
float altitude ranging between 39.1 and 40.0 km. Seventy spectra were recorded, with an exposure time of 19 s. Data were taken when the elevation of Altair above the horizon
was decreasing from 3.9 ø to -5.2 ø (corresponding to a zenith angle from 86.1 ø to 95.2ø). Several measurements of the dark current were also performed during the flight. The balloon remained close to the coordinates of the
launching base during the observations. Table 1 gives the altitude, location, and local time of measurements made by AMON, for a few elevation angles of the star. During balloon ascent, pressure and temperature were measured aboard the platform, as well as altitude, using the global positioning system (GPS) network. This allowed AMON measurements to be made of species concentration and mixing ratio versus altitude.
0.00 ø 39.3 44.3øN 2.6øE 0050 -1.22 ø 38.0 44.0øN 1.1øE 0050 - 1.97 ø 35.8 43.8 øN 0.2øE 0050
-3.07 ø 30.4 43.5øN 358.8øE 0050 -4.01 ø 24.3 43.2øN 357.7øE 0050
3. Data Reduction Procedure
3.1. Spectrum Retrieval
A description of the data reduction procedure used for an AMON flight which occurred one year earlier (May 25, 1992) can be found in the work of Naudet et al. [1994]. We used a similar procedure for data reported here. The first step in the data reduction is to eliminate, on each exposure, the spikes due to the cosmic rays and to subtract the dark current. Next we construct the spectrmn of the star, the pixels perpendicular to the dispersion on the CCD are added together, and we subtract the sky background estimated using the outer parts of the strip. The wavelength scale is adjusted by using the stellar hydrogen absorption lines that cause the main features in the star spectra in each band. This procedure is applied to each individual exposure, which corresponds to a different optical path in the atmosphere.
Five consecutive exposures are chosen to establish a reference spectrum, roughly distributed between the near- maximum altitude of the balloon and the greatest possible elevation of the star 39.2 km and 3.4 ø, respectively. The reference spectrum was obtained by averaging the five spectra. The reference spectrum attenuation caused by ozone and Rayleigh scattering was calculated by integrating the contribution induced by the residual atmosphere above the balloon, which corresponds to 0.04 air mass. This effect was then removed from the reference
spectrum using standard profile available between 40 and 60 km for midlatitude fall.
After the division of each spectrum by the reference spectrum the only remaining features are atmospheric absorption bands. Because some instrumental shift occurred between the beginning and the end of the flight, a correction of the order of a few tenths of a pixel was made by step-by-step shifting on each spectrum, until the hydrogen line residuum became as small as possible. To minimize the chromatic scintillation, a sliding average was calculated over three spectra, except for the reference spectrum. Each spectrum was finally smoothed respectively over eight pixels for the NO2 band, 20 pixels for 03, and 12 pixels for NO3.
3.2. Slant Column Density
A least squares fit is applied on each spectrum to retrieve the slant column density, using the cross sections available in the various spectral domains. We have used
RENARD ET AL.' NOCTURNAL DISTRIBUTION OF 03, NO2 AND NO3 28,795
the cross sections near 440 nm at temperature T = 240 K [Coquart et al., 1995] for NO2. This temperature is in the range of the measured or assumed temperature during the flight: 217-245 K. The cross sections do not vary by more than 3% over this temperature range [Coquart et al., 1995], and this small temperature effect has not been taken into account in this work. We used cross sections at T = 218 K for O3 (B. Coquart, personal communication, 1995), in the Chappuis bands where the temperature dependence is not significant. For NO3 we used cross sections tabulated for T = 298 K [Sander, 1986; Wayne, 1990] near 660 nm. The temperature dependence of the NO3 cross sections is not clearly established [Naudet et al., 1989], and we have assumed that using those measured at 298 K do not lead to significant discrepancies in the slant column retrievals.
The usual differential absorption method is applied to retrieve NO2: Rayleigh, ozone, and aerosol contributions were removed by a high-pass filter before determining the slant columns, in order not to interfere with the complex behavior of the cross sections. For the spectral region around the NO3 feature, the slope due to Rayleigh scattering, ozone, and aerosol contributions is subtracted on each spectrum. These contributions are estimated for the Rayleigh diffusion by using the formula given by Nicolet [1984], the low-resolution cross sections of Vigroux [1953], and the column density retrieved in the Chappuis bands. A careful examination of the raw data in this band has showed that no other absorbers were present in the NO3 spectral domain.
For the high negative elevation angles of the lines of sight (i.e., below -3 ø ) which correspond to observations in the lower stratosphere, aerosol attenuation dominates the
signal. The aerosol contribution can be represented by a (L/•o) k formula in the optical depth calculation, where • is the wavelength, •o is the central wavelength of the spectral domain used, and k is a fixed coefficient equal to 1.7 in agreement with the wavelength dependence detected for post-Pinambo aerosols [e.g., Post et al., 1992]. For all spectra the extinction coefficient of aerosols is determined in the residuum of the NO2 spectral domain, i.e., around 440 m, after removal of Rayleigh, ozone, and NO2 contributions.
AMON is a "self-calibrating" experiment (since only ratios of spectra are used to retrieve geophysical data), and thus no assumption about the transmission of the instrument is needed. The main source of error is due to
mathematical errors induced by the least squares fit procedure used to fit the observed spectra. The error bars on slant colurn densities correspond to the computed standard deviation. Note that the error bars are minimal
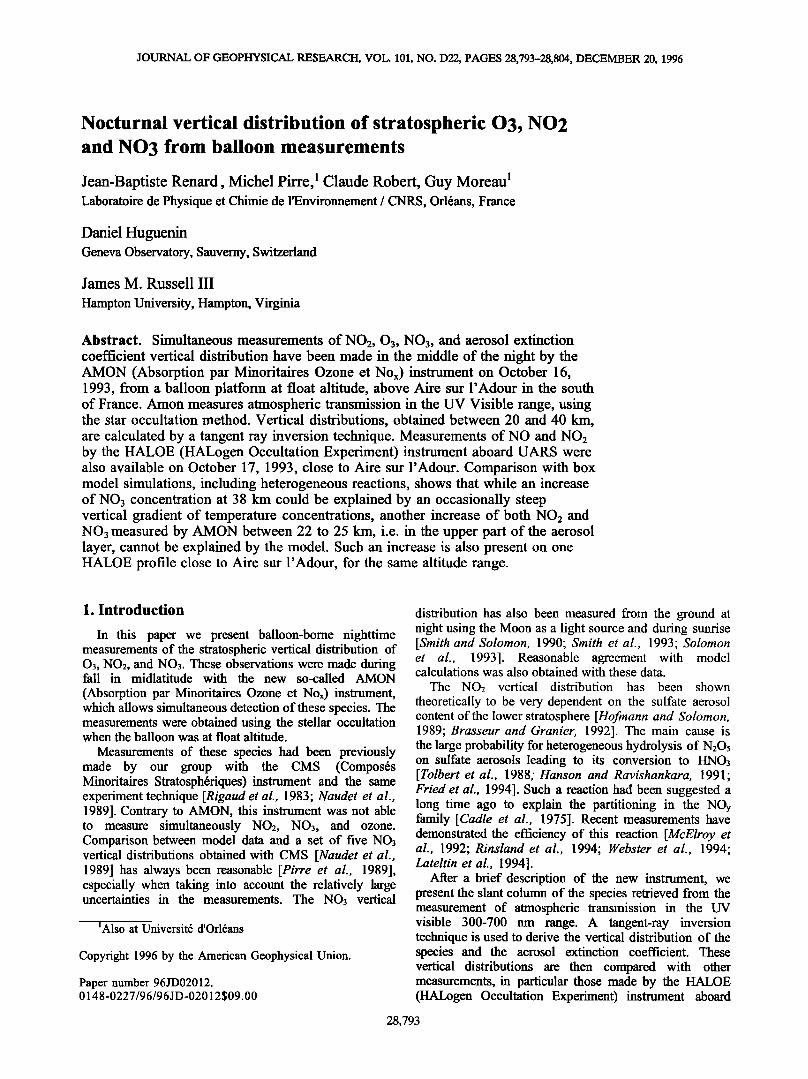
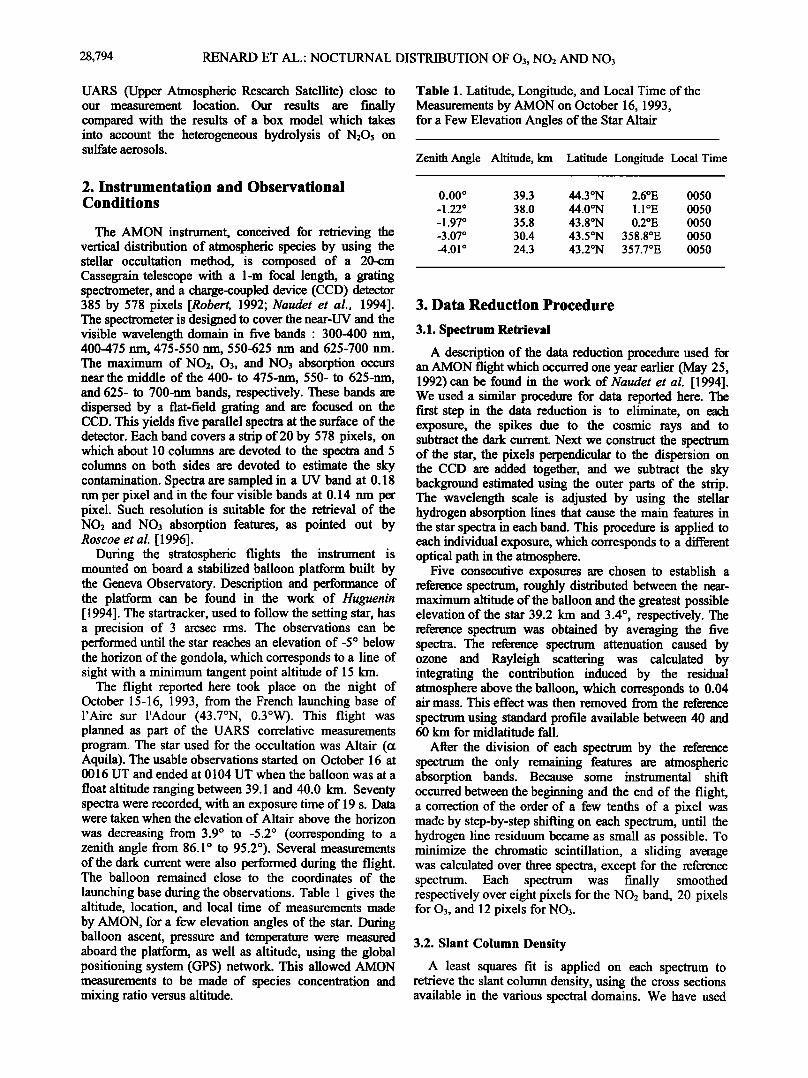
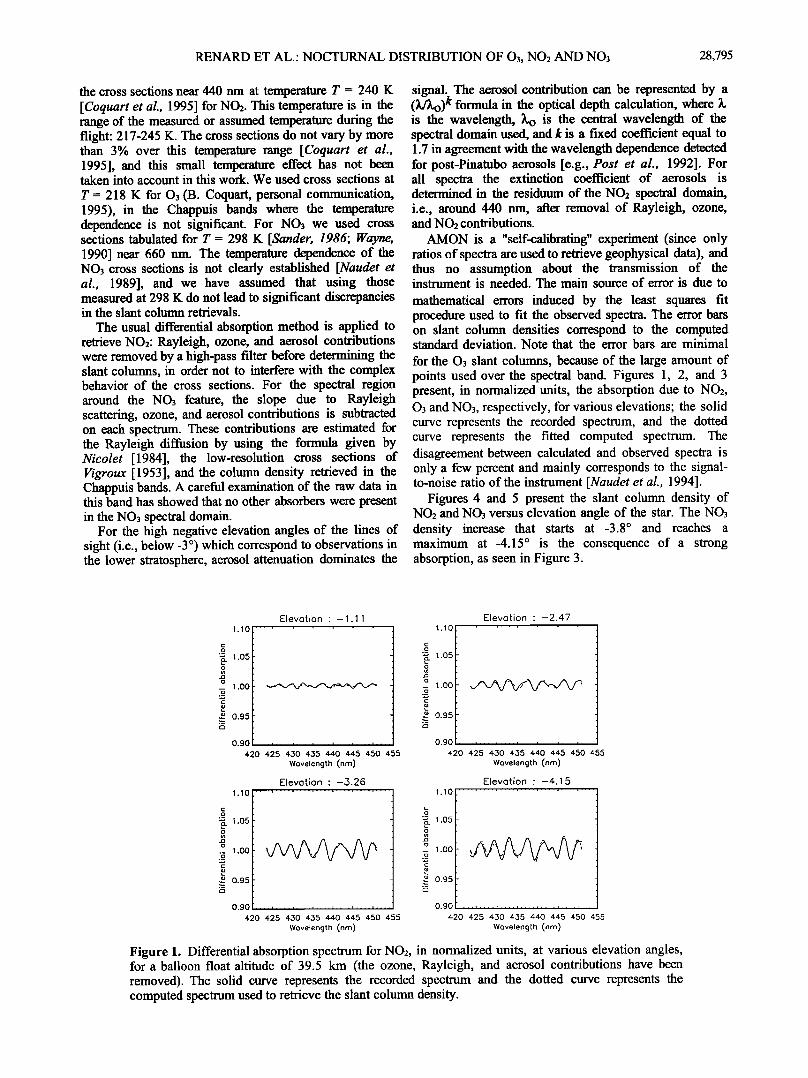
for the 03 slant columns, because of the large amount of points used over the spectral band. Figures 1, 2, and 3 present, in normalized units, the absorption due to NO2, 03 and NO3, respectively, for various elevations; the solid curve represents the recorded spectrum, and the dotted curve represents the fitted computed spectrum. The disagreement between calculated and observed spectra is only a few percent and mainly corresponds to the signal- to-noise ratio of the instrument [Naudet et al., 1994].
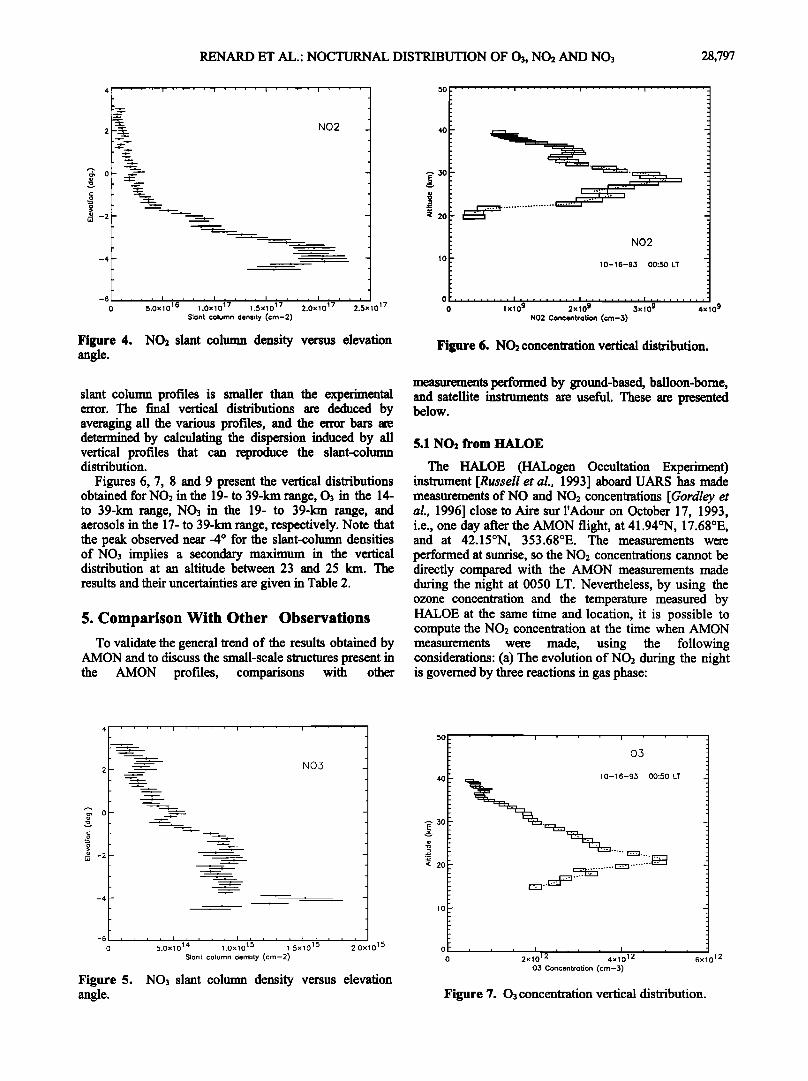
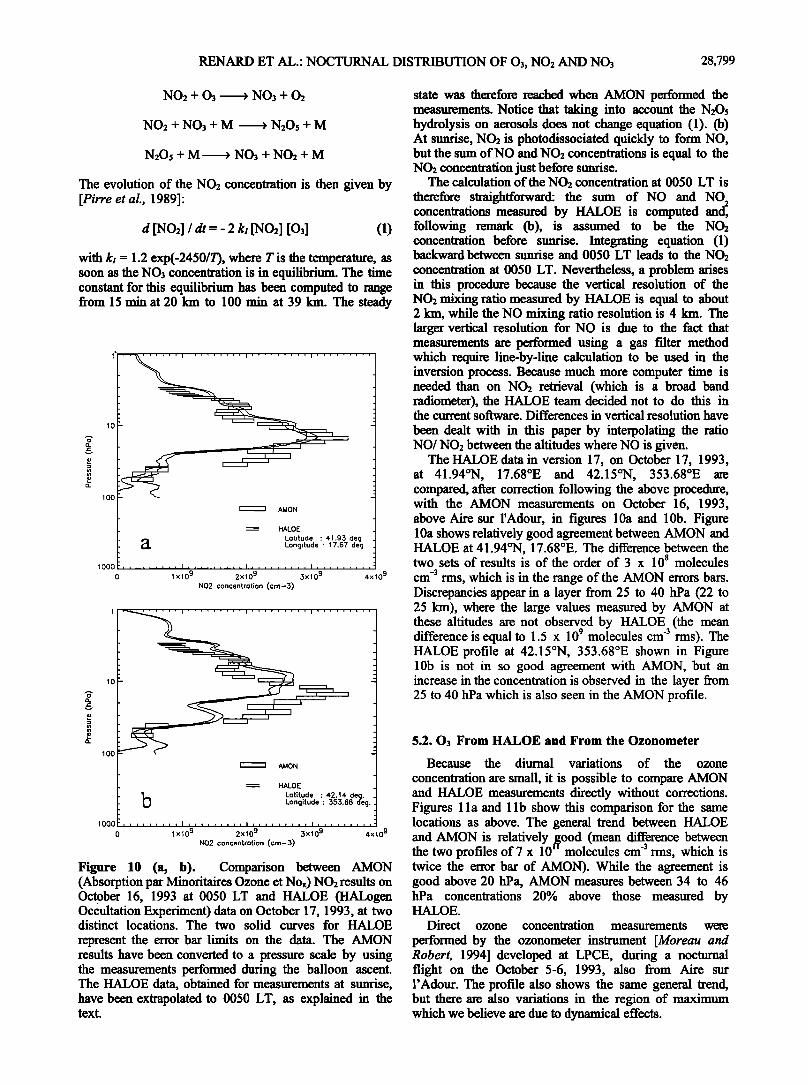
Figures 4 and 5 present the slant colurn density of NO2 and NO3 versus elevation angle of the star. The NO3 density increase that starts at-3.8 ø and reaches a maximum at-4.15 ø is the consequence of a strong absorption, as seen in Figure 3.
1.10
c, 1.05
o
1.00 ._
• 0.95 ._
Elevation - -1.11
0.90
420 425 430 435 440 445 450 455
Wavelength (nm)
Elevation ß -3.26 1.10
a. 1.05
o
1.00 o
._
• 0.95 ._
0.90 .... ! .... , .... , .... , .... , .... , ....
420 425 4,30 4,35 440 445 4-50 455
Wavelength (nm)
1.10
•o_ 1.05
1.00 o_
• 0.95 ._
Elevation ' -2.47
0.90 ..................................
420 425 4,.30 4,.35 440 445 450 455
Wavelength (rim)
Elevation ß -4.15 1.10
•a. 1.05
• 1.00 ._
• 0.95 ._
0.90 .................................
420 425 4.50 4.35 440 445 450 455
Wavelength (nm)
Figure 1. Differential absorption spectrum for NO2, in normalized units, at various elevation angles, for a balloon float altitude of 39.5 km (the ozone, Rayleigh, and aerosol contributions have been removed). The solid curve represents the recorded spectrum and the dotted curve represents the computed spectrum used to retrieve the slant column density.
28,796 RENARD ET AL.' NOCTURNAL DISTRIBUTION OF 03, NO2 AND NO3
= 1.4
.• 1.2 o
c 0.8 o
._
• o.•
• 0.4 ....
540 560
g 1.,•
.N_ 1.2 o
'- 1.0 o
.
c 0.8 .9
o 0.6
< 0.4
540
Elevation ß -1.12
580 600 620
Wavelength (nm) Wavelength (rim)
Elevation ß -3.26
Elevation ß -2.59 .-• 1.6 ' - ' ' ........ ' ' ' ' '
._
._• 1.2
E • 1.o
õ 0.8 ._
• 0.6
< 0.4
540 560 580 600 620
Elevotion ' -4.15 .
._N 1.2
h• i.o
õ 0.8 ._
• 0.6
< 0.4
540 560 580 600 620 560 580 600 620
Wavelength (nm) Wavelength (nm)
Figure 2. Absorption spectrum for 03, in normalized units, at various elevation angles. The solid curve represents the recorded spectrum, and the dotted curve represents the computed spectrum.
4. Vertical Distribution
Tangent-ray inversion method developed and discussed by Naudet et al. [1989] is used to retrieve the vertical distribution of the various species. The inversion is applied for lines of sight below the local horizon, i.e., for negative elevations. The atmosphere is divided into homogeneous layers, with vertical extent from 0.1 km at an altitude 40 km to 1.0 km at an altitude of 19 km, in
such a way that each tangent point is located in the lower part of the layer. Nine guess profiles are chosen, for each species, to initialize the inversion. These profiles, with concentration maxima occurring at different altitudes, have different exponentially decreases of concentration above the balloon (by assuming various but realistic scale heights). The profiles are then adjusted to reproduce the slant-column distribution. The iterations are stopped when the difference between the theoretical and the experimental
Elevation ß -1.1 2
1.1o
1.o5
1.00
0.95
0.90 .
645 650 655 660 665 670 675
Wavelength (nm)
• 1.10 ._
3 1.o5 ._N
E • 1.00
o c 0.95 ._
..o 0.90
Elevation ' -3.26 .
645 650 655 660 665 670 675
Wavelength (nm)
Elevation ß -2.59 ,
• 1.10
½• 1.05 N
.--
• 1.00
.•_ 0.95
,-, 0.90 • '...., .... , .... , ......... , ....
64-5 650 655 660 665 670 675
Wavelength (rim)
• 1.10
• 1.o5 ._
E • 1.oo
.•_ 0.95
• 0.90
Elevation ß -4.15 , ,
64-5 650 655 660 665 670 675
Wavelength (rim)
Figure 3. Absorption spectrum for NO3, in normalized units, at various elevation angles. The solid curve represents the recorded spectrum, and the dotted curve represents the computed spectrum.
RENARD ET AL.' NOCTURNAL DISTRIBUTION OF 03, NO2 AND NO3 28,797
-4
0 5.0x10 1.0x10 1.5x10 2.0x10 2,5xl
Slant column density (cm-2)
Figure 4. NOa slant column density versus elevation angle.
50 t ......... I'' ........ I ......... I .........
•- 30
• 2o
NO2
10-16-93 00:50 LT
0 ......... I ......... 10.9, . , , , , , , I , • , , , . , . , 0 1 xlO 9 2xl 3xlO 9 4xlO 9 NO2 Concentration (cm-3)
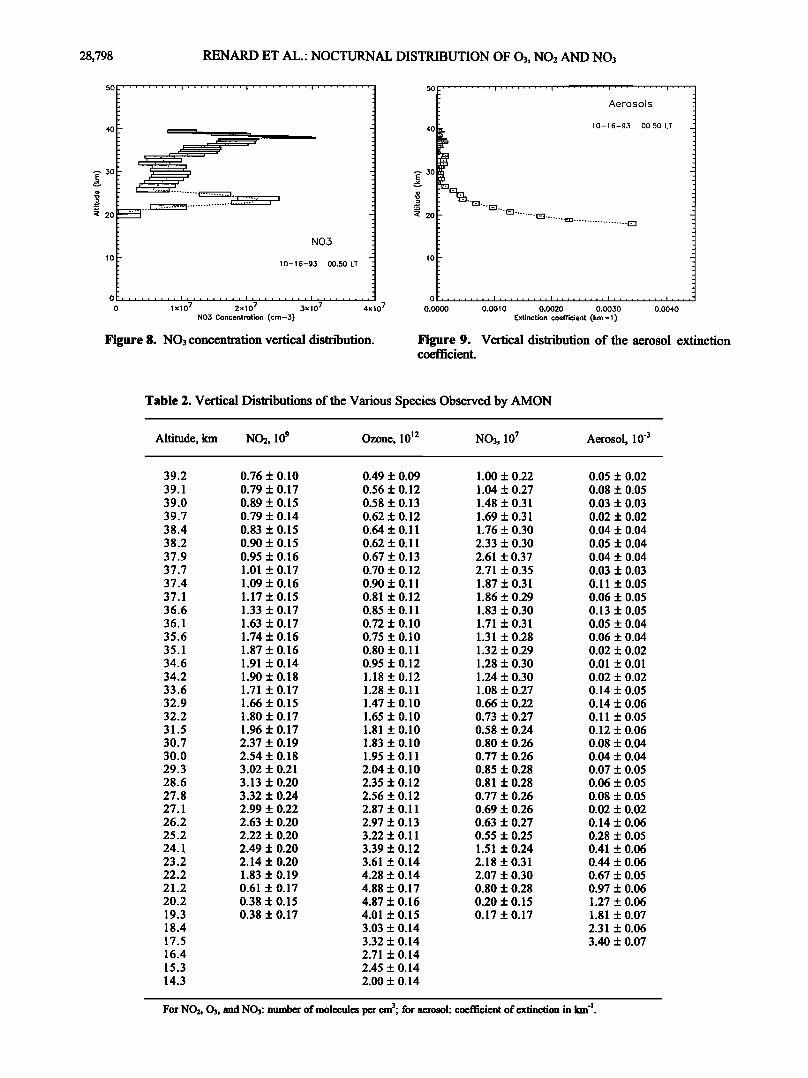
Figure 6. NO2 concentration vertical distribution.
slant column profiles is smaller than the experimental error. The final vertical distributions are deduced by averaging all the various profiles, and the error bars are determined by calculating the dispersion induced by all vertical profiles that can reproduce the slant-column distribution.
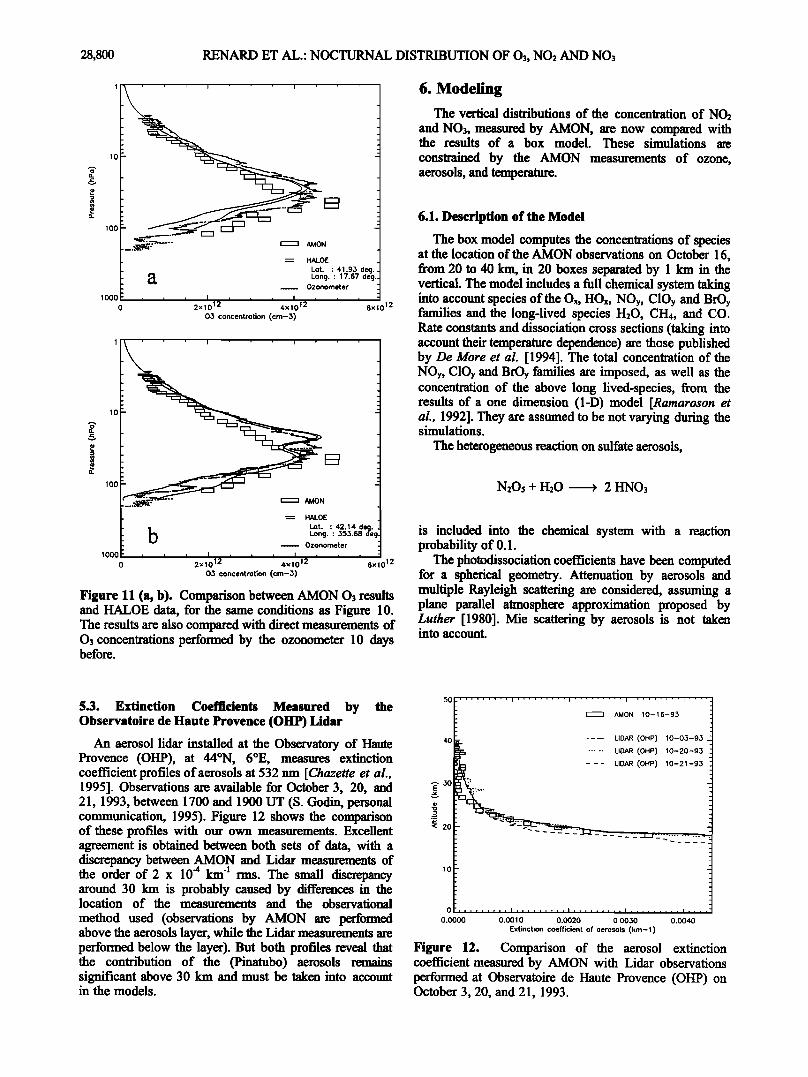
Figures 6, 7, 8 and 9 present the vertical distributions obtained for NO• in the 19- to 39-km range, 03 in the 14- to 39-km range, NO3 in the 19- to 39-km range, and aerosols in the 17- to 39-km range, respectively. Note that the peak observed near-4 ø for the slant-column densities of NO3 implies a secondary maximum in the vertical distribution at an altitude between 23 and 25 km. The
results and their uncertainties are given in Table 2.
5. Comparison With Other Observations
To validate the general trend of the results obtained by AMON and to discuss the small-scale structures present in the AMON profiles, comparisons with other
measurements performed by ground-based, balloon-borne, and satellite instruments are useful. These are presented below.
5.1 NO2 from HALOE
The HALOE (HALogen Occultation Experiment) instrument [Russell et aL, 1993] aboard UARS has made measurements of NO and NO2 concentrations [Gordley et al., 1996] close to Aire sur l'Adour on October 17, 1993, i.e., one day after the AMON flight, at 41.94øN, 17.68øE, and at 42.15øN, 353.68øE. The measurements were performed at sunrise, so the NO2 concentrations cannot be directly compared with the AMON measurements made during the night at 0050 LT. Nevertheless, by using the ozone concentration and the temperature measured by HALOE at the same time and location, it is possible to compute the NO2 concentration at the time when AMON measurements were made, using the following considerations: (a) The evolution of NO2 during the night is governed by three reactions in gas phase:
-4
-6
0
NO5
i i i
5.0x10¹⁴ 1.0x10¹⁵ 1.5x10¹⁵ 2.0x10¹⁵ Slant column density (cm-2)
Figure 5. angle.
NO3 slant column density versus elevation
--'- 30 E
._
< 20
1 o- 16-93 00:50 LT _
0 I I , , ,
0 2x10¹² 4x10¹² 6x10 TM 03 Concentration (cm-3)
Figure 7. 03 concentration vertical distribution.
28,798 RENARD ET AL.: NOCTURNAL DISTRIBUTION OF O3, NO2 AND NO3
3O
20. .
NO3
10-16-93 00:50 LT
0 1 xl 7' 2x10⁷ 3x10⁷ 4x10⁷ NO3 Concentrotion (cm-3)
Figure 8. NO3 concentration vertical distribution.
30
"• 20
......... i ......... i ......... i ......... i ....
Aerosols
1 O- 16-93 00:50 LT
0 ......... I ......... I ......... I
0.0000 0.0010 0.0020 0.0030 0.0040
Extinction coefficient (kin- 1 )
Figure 9. Vertical distribution of the aerosol extinction coefficient.
Table 2. Vertical Distributions of the Various Species Observed by AMON
Altitude, km NO2, 10 9 Ozone, 1012 NO3, 10 7 Aerosol, 10 -3
39.2 0.76 + 0.10 0.49 + 0.09 1.00 + 0.22 0.05 + 0.02 39.1 0.79 :k 0.17 0.56 + 0.12 1.04 + 0.27 0.08 + 0.05 39.0 0.89 + 0.15 0.58 + 0.13 1.48 + 0.31 0.03 + 0.03 39.7 0.79 + 0.14 0.62 + 0.12 1.69 + 0.31 0.02 + 0.02 38.4 0.83 + 0.15 0.64 +_ 0.11 1.76 _+ 0.30 0.04 + 0.04 38.2 0.90 + 0.15 0.62 + 0.11 2.33 + 0.30 0.05 + 0.04 37.9 0.95 + 0.16 0.67 + 0.13 2.61 + 0.37 0.04 + 0.04 37.7 1.01 + 0.17 0.70 + 0.12 2.71 _+ 0.35 0.03 + 0.03 37.4 1.09 + 0.16 0.90 + 0.11 1.87 + 0.31 0.11 + 0.05 37.1 1.17 + 0.15 0.81 + 0.12 1.86 + 0.29 0.06 + 0.05 36.6 1.33 + 0.17 0.85 + 0.11 1.83 + 0.30 0.13 + 0.05 36.1 1.63 + 0.17 0.72 + 0.10 1.71 + 0.31 0.05 + 0.04 35.6 1.74 + 0.16 0.75 + 0.10 1.31 + 0.28 0.06 + 0.04 35.1 1.87 + 0.16 0.80 + 0.11 1.32 + 0.29 0.02 + 0.02 34.6 1.91 + 0.14 0.95 + 0.12 1.28 + 0.30 0.01 + 0.01 34.2 1.90 + 0.18 1.18 + 0.12 1.24 + 0.30 0.02 + 0.02 33.6 1.71 + 0.17 1.28 + 0.11 1.08 + 0.27 0.14 + 0.05 32.9 1.66 + 0.15 1.47 _+ 0.10 0.66 + 0.22 0.14 + 0.06 32.2 1.80 + 0.17 1.65 + 0.10 0.73 + 0.27 0.11 + 0.05 31.5 1.96 + 0.17 1.81 + 0.10 0.58 + 0.24 0.12 + 0.06 30.7 2.37 + 0.19 1.83 + 0.10 0.80 + 0.26 0.08 + 0.04 30.0 2.54 + 0.18 1.95 + 0.11 0.77 + 0.26 0.04 + 0.04 29.3 3.02 + 0.21 2.04 + 0.10 0.85 + 0.28 0.07 + 0.05 28.6 3.13 + 0.20 2.35 + 0.12 0.81 + 0.28 0.06 + 0.05 27.8 3.32 + 0.24 2.56 + 0.12 0.77 + 0.26 0.08 + 0.05 27.1 2.99 + 0.22 2.87 + 0.11 0.69 + 0.26 0.02 + 0.02 26.2 2.63 + 0.20 2.97 + 0.13 0.63 + 0.27 0.14 + 0.06 25.2 2.22 + 0.20 3.22 + 0.11 0.55 + 0.25 0.28 + 0.05 24.1 2.49 + 0.20 3.39 + 0.12 1.51 + 0.24 0.41 + 0.06 23.2 2.14 + 0.20 3.61 + 0.14 2.18 + 0.31 0.44 + 0.06 22.2 1.83 + 0.19 4.28 + 0.14 2.07 + 0.30 0.67 + 0.05 21.2 0.61 + 0.17 4.88 + 0.17 0.80 + 0.28 0.97 + 0.06 20.2 0.38 + 0.15 4.87 + 0.16 0.20 + 0.15 1.27 + 0.06 19.3 0.38 + 0.17 4.01 + 0.15 0.17 + 0.17 1.81 + 0.07 18.4 3.03 + 0.14 2.31 + 0.06 17.5 3.32 + 0.14 3.40 + 0.07 16.4 2.71 + 0.14 15.3 2.45 + 0.14 14.3 2.00 + 0.14
For NO2, O3, and NO3: number of molecules per cm3; for aerosol: coefficient of extinction in km 4.
RENARD ET AL.' NOCTURNAL DISTRIBUTION OF 03, 1•O2 AND NO3 28,799
NO2 + 03 ) NO3 + 02
NO2 + NO3 + M > N205 + M
N205 + M > NO3 + NO2 + M
The evolution of the NO2 concentration is then given by [Pirre et al., 1989]:
d [NO2] /dt =- 2 k• [NO2] [03] (1)
with k• = 1.2 exp(-2450/T), where T is the temperature, as soon as the NO3 concentration is in equilibrium. The time constant for this equilibrium has been computed to range from 15 min at 20 km to 100 min at 39 km. The steady
lOO
a
1000 •
0 1 xl 09
i 1 AMON
-- HALOE
Latitude : 41.93 deg. Longitude ß 17.67 deg.
I i
2x10⁹ 3x10⁹ 4x10⁹ NO2 concentration (cm-3)
lOO
i__..__J AMON
'---- HALOE
b LotRude - 42.14 deg. Longitude : 353.68 de 9.
1000 ......... • ......... i ......... •
0 1 xl 09 2xl 09 3xl 09 4xl 09 NO2 concentration (cm-3)
Figure 10 (a, b). Comparison between AiMON (Absorption par Minoritaires Ozone et Nox) NO2 results on October 16, 1993 at 0050 LT and HALOE (HALogen Occultation Experiment) data on October 17, 1993, at two distinct locations. The two solid curves for HALOE
represent the error bar limits on the data. The AMON results have been converted to a pressure scale by using the measurements performed during the balloon ascent. The HALOE data, obtained for measurements at sunrise, have been extrapolated to 0050 LT, as explained in the text.
state was therefore reached when AMON performed the measurements. Notice that taking into account the N2Os hydrolysis on aerosols does not change equation (1). Co) At sunrise, NO2 is photodissociated quickly to form NO, but the sum of NO and NO2 concentrations is equal to the NO2 concentration just before sunrise.
The calculation of the NO2 concentration at 0050 LT is therefore straightforward: the sum of NO and NO concentrations measured by HALOE is computed an•,, following remark (b), is assumed to be the NO2 concentration before sunrise. Integrating equation (1) backward between sunrise and 0050 LT leads to the NO2 concentration at 0050 LT. Nevertheless, a problem arises in this procedure because the vertical resolution of the NO2 mixing ratio measured by HALOE is equal to about 2 km, while the NO mixing ratio resolution is 4 km. The larger vertical resolution for NO is due to the fact that measurements are performed using a gas filter method which require line-by-line calculation to be used in the inversion process. Because much more computer time is needed than on NO2 retrieval (which is a broad band radiometer), the HALOE team decided not to do this in the current software. Differences in vertical resolution have
been dealt with in this paper by interpolating the ratio NO/NO2 between the altitudes where NO is given.
The HALOE data in version 17, on October 17, 1993, at 41.94øN, 17.68øE and 42.15øN, 353.68øE are compm-•u, correction with the AMON measurements on October 16, 1993, above Aire sur l'^dour, in fiõures 10a and 10b. Figure 10a shows relatively õood agreement between AMO• and HALOE at 41.94øN, 17.68øE. The difference between the two sets of results is of the order of 3 x 10⁸ molecules cm -3 rms, which is in the range of the AMON errors bars. Discrepancies appear in a layer from 25 to 40 hPa (22 to 25 km), where the large values measured by AMON at these altitudes are not observed by HALOE (the mean difference is equal to 1.5 x 10⁹ molecules cm -3 rms). The HALOE profile at 42.15øN, 353.68øE shown in Figure 10b is not in so good agreement with AMON, but an increase in the concentration is observed in the layer fxom 25 to 40 hPa which is also seen in the AMON profile.
5.2. 03 From HALOE and From the Ozonometer
Became the diurnal variations of the ozone
concentration are small, it is possible to compare AMON and HALOE measurements directly without corrections. Figures 1 l a and 1 lb show this comparison for the same locations as above. The general trend between HALOE
and AMON is relatively ,•ood (mean difference between the two profiles of 7 x 10 molecules cm -3 rms, which is twice the error bar of AMON). While the agreement is good above 20 hPa, AMON measures between 34 to 46 hPa concentrations 20% above those measured by HALOEo
Direct ozone concentration measurements were
performed by the ozonometer instrument [Mareau and Robert, 1994] developed at LPCE, during a nocturnal flight on the October 5-6, 1993, also from Aire sur l'Adour. The profile also shows the same general trend, but there are also variations in the region of maximum which we believe are due to dynamical effects.
28,800 RENARD ET AL.' NOCTURNAL DISTRIBUTION OF 03, NO2 AND NO3
lOO
lOOO
o
a
• HALOE Lot. : 41.9.3 deg. -I Long. : 17.67 deg.•
Ozonometer
, I , , , I , , , 2x10¹² 4x10¹² 6x10¹²
0.3 concentrotion (cm-5)
lOO
• AMON 1
f b • HALOF' • Lat. : 42.14 deq. 4
Long. : 353,68 d'eg• ....... Ozonometer • 1000 , m , I m I , I
0 2x10¹² 4x10¹² 6x10¹² 0.3 concentrotion (cm-3)
Figure 11 (a, b). Comparison between AMON 03 results and HALOE data, for the same conditions as Figure 10. The results are also compared with direct measurements of O3 concentrations performed by the ozonometer 10 days before.
6. Modeling
The vertical distributions of the concentration of NO2 and NO3, measured by AMON, are now compared with the results of a box model. These simulations are
constrained by the AMON measurements of ozone, aerosols, and temperature.
6.1. Description of the Model
The box model computes the concentrations of species at the location of the AMON observations on October 16, from 20 to 40 kin, in 20 boxes separated by 1 km in the vertical. The model includes a full chemical system taking into account species of the On, HOx, NOv, ClOy and BrO v families and the long-lived species H20, CHn, and CO. Rate constants and dissociation cross sections (taking into account their temperature dependence) are those published by De More et al. [1994]. The total concentration of the NOv, ClOy and BrO v families are imposed, as well as the concentration of the above long lived-species, from the results of a one dimension (l-D) model [Ramaroson et al., 1992]. They are assumed to be not varying during the simulations.
The heterogeneous reaction on sulfate aerosols,
N205 + H20 ) 2 HNO3
is included into the chemical system with a reaction probability of 0.1.
The photodissociation coefficients have been computed for a spherical geometry. Attenuation by aerosols and multiple Rayleigh scattering are considered, assuming a plane parallel atmosphere approximation proposed by Luther [1980]. Mie scattering by aerosols is not taken into account.
5.3. Extinction Coefficients Measured
Observatoire de Haute Provence (OHP) Lidar by the
An aerosol lidar installed at the Observatory of Haute Provence (OHP), at 44øN, 6øE, measures extinction coefficient profiles of aerosols at 532 nm [Chazette et al., 1995]. Observations are available for October 3, 20, and 21, 1993, between 1700 and 1900 UT (S. Godin, personal communication, 1995). Figure 12 shows the comparison of these profiles with our own measurements. Excellent agreement is obtained between both sets of data, with a discrepancy between AMON and Lidar measurements of the order of 2 x 10⁴ km '1 rms. The small discrepancy around 30 km is probably caused by differences in the location of the measurements and the observational
method used (observations by AMON are performed above the aerosols layer, while the Lidar measurements are performed below the layer). But both profiles reveal that the contribution of the (Pinambo) aerosols remains significant above 30 km and must be taken into account in the models.
30
< 20
I-• AMON 10-16-93
40 LIDAR (OHP) 10-03-93 _ ....... LIOAR (OHP) 10-20-93
- - - LIDAR (OHP) 10-21-93
0.0000 0.0010 0.0020 0.0030 0.0040
Extinction coefficient of aerosols (km-1)
Figure 12. Comparison of the aerosol extinction coefficient measured by AMON with Lidar observations performed at Observatoire de Haute Provence (OHP) on October 3, 20, and 21, 1993.
RENARD ET AL.: NOCTURNAL DISTRIBUTION OF 03, NO2 AND NO3 28,801
40
35
E •,• 30
-_•
25
20
1.• I , • , • • , • I • • , • I .... I .... I ....
2 0 215 220 225 230 235 240 245
Temperoture (K)
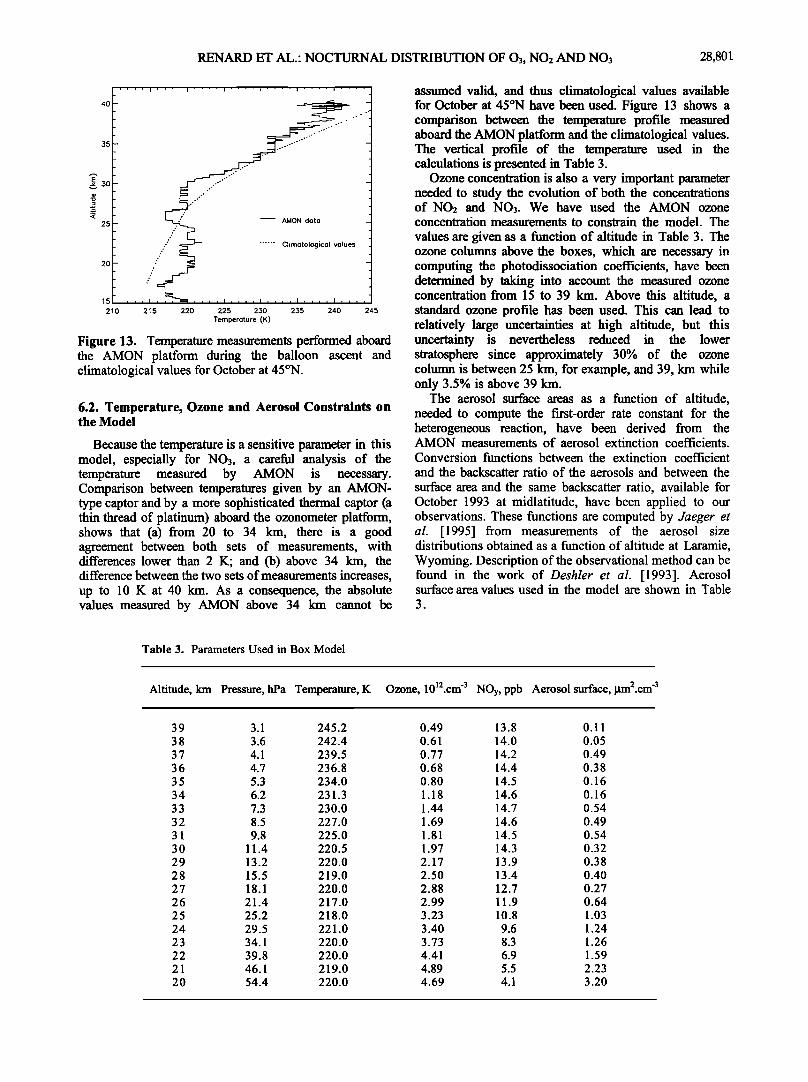
Figure 13. Temperature measurements performed aboard the AMON platform during the balloon ascent and climatological values for October at 45øN.
6.2. Temperature, Ozone and Aerosol Constraints on the Model
Because the temperature is a sensitive parameter in this model, especially for NO3, a careful analysis of the temperature measured by AMON is necessary. Comparison between temperatures given by an AMON- type captor and by a more sophisticated thermal captor (a thin thread of platinum) aboard the ozonometer platform, shows that (a) from 20 to 34 km, there is a good agreement between both sets of measurements, with differences lower than 2 K; and (b) above 34 km, the difference between the two sets of measurements increases, up to 10 K at 40 km. As a consequence, the absolute values measured by AMON above 34 km cannot be
assumed valid, and thus climatological values available for October at 45øN have been used. Figure 13 shows a comparison between the temperature profile measured aboard the AMON platform and the climatological values. The vertical profile of the temperature used in the calculations is presented in Table 3.
Ozone concentration is also a very important parameter needed to study the evolution of both the concentrations of NO2 and NO3. We have used the AMON ozone concentration measurements to constrain the model. The
values are given as a function of altitude in Table 3. The ozone columns above the boxes, which are necessary in computing the photodissociation coefficients, have been determined by taking into account the measured ozone concentration from 15 to 39 km. Above this altitude, a standard ozone profile has been used. This can lead to relatively large uncertainties at high altitude, but this uncertainty is nevertheless reduced in the lower stratosphere since approximately 30% of the ozone column is between 25 km, for example, and 39, km while only 3.5% is above 39 km.
The aerosol surface areas as a function of altitude, needed to compute the first-order rate constant for the heterogeneous reaction, have been derived from the AMON measurements of aerosol extinction coefficients.
Conversion functions between the extinction coefficient and the backscatter ratio of the aerosols and between the
surface area and the same backscatter ratio, available for October 1993 at midlatitude, have been applied to our observations. These functions are computed by Jaeger et al. [1995] from measurements of the aerosol size distributions obtained as a function of altitude at Laramie, Wyoming. Description of the observational method can be found in the work of Deshler et al. [1993]. Aerosol surface area values used in the model are shown in Table 3.
Table 3. Parameters Used in Box Model
Altitude, km Pressure, hPa Temperature, K Ozone, 1012.cm -3 NOy, ppb Aerosol surface, gm2.cm -3
39 3.1 245.2 0.49 13.8 0.11 38 3.6 242.4 0.61 14.0 0.05 37 4.1 239.5 0.77 14.2 0.49 36 4.7 236.8 0.68 14.4 0.38 35 5.3 234.0 0.80 14.5 0.16 34 6.2 231.3 1.18 14.6 0.16 33 7.3 230.0 1.44 14.7 0.54 32 8.5 227.0 1.69 14.6 0.49 31 9.8 225.0 1.81 14.5 0.54 30 11.4 220.5 1.97 14.3 0.32 29 13.2 220.0 2.17 13.9 0.38 28 15.5 219.0 2.50 13.4 0.40 27 18.1 220.0 2.88 12.7 0.27 26 21.4 217.0 2.99 11.9 0.64 25 25.2 218.0 3.23 10.8 1.03 24 29.5 221.0 3.40 9.6 1.24 23 34.1 220.0 3.73 8.3 1.26 22 39.8 220.0 4.41 6.9 1.59 21 46.1 219.0 4.89 5.5 2.23 20 54.4 220.0 4.69 4.1 3.20
28,802 RENARD ET AL.' NOCTURNAL DISTRIBUTION OF 03, NO2 AND NO3
7. Results and Discussion
The box models have been mn for 30 days using the conditions available for October 16 close to Aire sur l'Adour. This long integration is necessary to obtain a repeating 24-hour cycle of the species concentrations at low altitude owing to, mainly, HNO3 which tends slowly toward equilibrium. This equilibrium is not necessarily effective in the lower stratosphere but is approximately obtained if the air parcels encounter temperature and sunlight conditions similar to those which existed on the days preceding the measurements. This is often true at midlatitude at the equinox. We assume this hypothesis.
7.1. NO2 Vertical Distribution
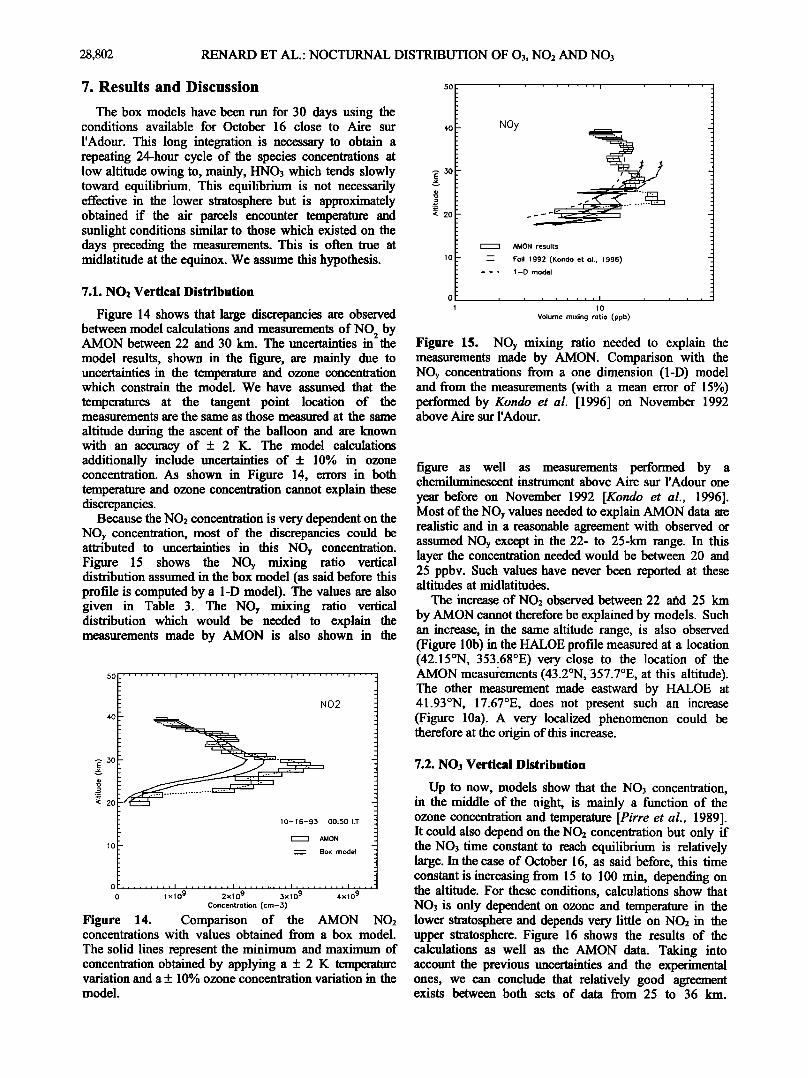
Figure 14 shows that large discrepancies are observed between model calculations and measurements of NO_ by AIMON between 22 and 30 km. The uncertainties in 2 the model results, shown in the figure, are mainly due to uncertainties in the temperature and ozone concentration which constrain the model. We have assumed that the
temperatures at the tangent point location of the measurements are the same as those measured at the same
altitude during the ascent of the balloon and are known with an accuracy of + 2 K. The model calculations additionally include uncertainties of + 10% in ozone concentration. As shown in Figure 14, errors in both temperature and ozone concentration cannot explain these discrepancies.
Because the NO2 concentration is very dependent on the Nay concentration, most of the discrepancies could be attributed to uncertainties in this Nay concentration. Figure 15 shows the Nay mixing ratio vertical distribution assumed in the box model (as said before this profile is computed by a 1-D model). The values are also given in Table 3. The Nay mixing ratio vertical distribution which would be needed to explain the measurements made by AMON is also shown in the
501 ......... I ......... I ......... I ......... • .... • NO2
1 O- 16-93 00:50 LT
f•l AMON lO
= Box model
0 , , , • .... , i .... , .... i ......... i , i i i I i i i i j i i i I
0 1 xl 09 2xl 09 3xl 09 4xl 09 Concentration (cm-3)
Figure 14. Comparison of the AMON NO2 concentrations with values obtained from a box model.
The solid lines represent the minimum and maximum of concentration obtained by applying a + 2 K temperature variation and a + 10% ozone concentration variation in the model.
50
40
•- 30
< 20
NOy
AMON results
Fall 1992 (Kondo et al., 1996) 1-D model
i i i i ! i J
lO
Volume mixing ratio (ppb)
Figure 15. Nay mixing ratio needed to explain the measurements made by AMON. Comparison with the Nay concentrations from a one dimension (l-D) model and from the measurements (with a mean error of 15%) performed by Kondo et al. [1996] on November 1992 above Aire sur l'Adour.
figure as well as measurements performed by a chemiluminescent instrument above Aire sur l'Adour one
year before on November 1992 [Kondo et al., 1996]. Most of the NOy values needed to explain AMON data are realistic and in a reasonable agreement with observed or assumed NOy except in the 22- to 25-km range. In this layer the concentration needed would be between 20 and 25 ppbv. Such values have never been reported at these altitudes at midlatitudes.
The increase of NO2 observed between 22 arid 25 km by AMON cannot therefore be explained by models. Such an increase, in the same altitude range, is also observed (Figure 10b) in the HALOE profile measured at a location (42.15øN, 353.68øE) very close to the location of the AMON measurements (43.2øN, 357.7øE, at this altitude). The other measurement made eastward by HALOE at 41.93øN, 17.67øE, does not present such an increase (Figure 10a). A very localized phenomenon could be therefore at the origin of this increase.
7.2. NO3 Vertical Distribution
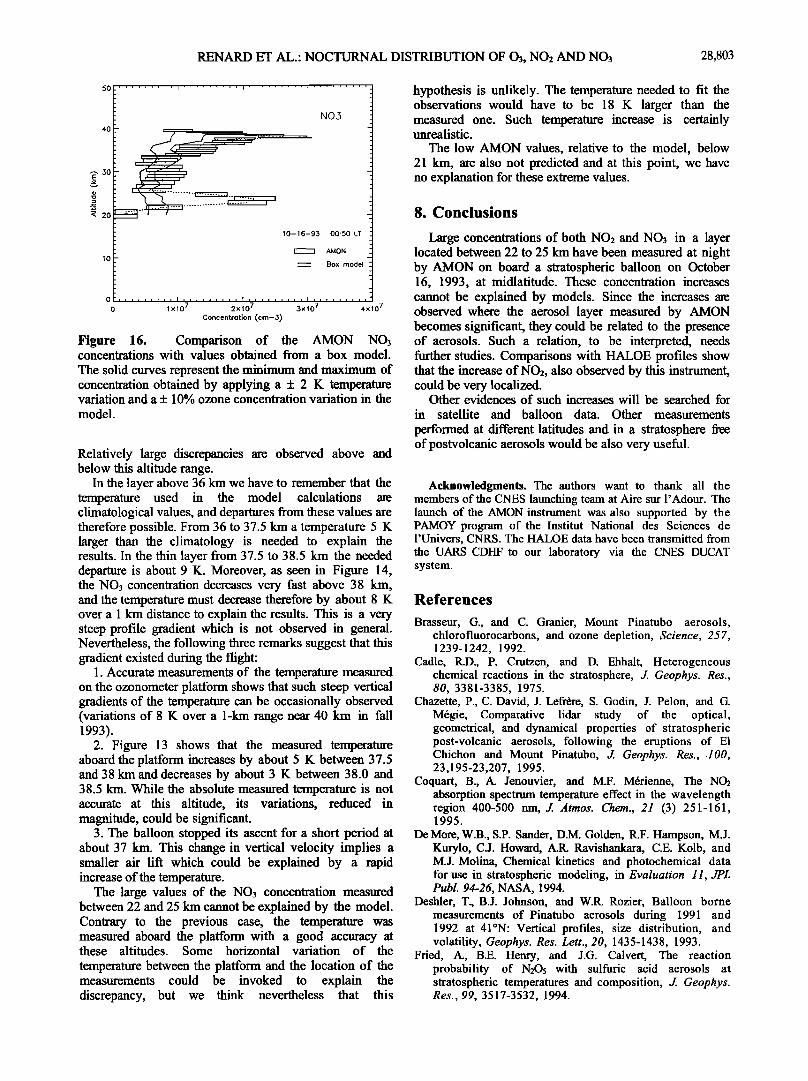
Up to now, models show that the NO3 concentration, in the middle of the night, is mainly a function of the ozone concentration and temperature [Pirre et al., 1989]. It could also depend on the NO2 concentration but only if the NO3 time constant to reach equilibrium is relatively large. In the case of October 16, as said before, this time constant is increasing from 15 to 100 min, depending on the altitude. For these conditions, calculations show that NO3 is only dependent on ozone and temperature in the lower stratosphere and depends very little on NO2 in the upper stratosphere. Figure 16 shows the results of the calculations as well as the AMON data. Taking into account the previous uncertainties and the experimental ones, we can conclude that relatively good agreement exists between both sets of data from 25 to 36 km.
RENARD ET AL.: NOCTURNAL DISTRIBUTION OF 03, NO2 AND NO3 28,803
30
20__
NO3
10-16-93 00:50 LT
• AMON
• Box model
0 lxl 2xl 5xl 4x10⁷ Concentration (cm-3)
Figure 16. Comparison of the AMON NO3 concentrations with values obtained from a box model.
The solid curves represent the minimum and maximum of concentration obtained by applying a + 2 K temperature variation and a + 10% ozone concentration variation in the model.
Relatively large discrepancies are observed above and below this altitude range.
In the layer above 36 km we have to remember that the temperature used in the model calculations are climatological values, and departures from these values are therefore possible. From 36 to 37.5 km a temperature 5 K larger than the climatology is needed to explain the results. In the thin layer from 37.5 to 38.5 km the needed departure is about 9 K. Moreover, as seen in Figure 14, the NO3 concentration decreases very fast above 38 km, and the temperature must decrease therefore by about 8 K over a 1 km distance to explain the results. This is a very steep profile gradient which is not observed in general. Nevertheless, the following three remarks suggest that this gradient existed during the flight:
1. Accurate measurements of the temperature measured on the ozonometer platform shows that such steep vertical gradients of the temperature can be occasionally observed (variations of 8 K over a 1-km range near 40 km in fall 1993).
2. Figure 13 shows that the measured temperature aboard the platform increases by about 5 K between 37.5 and 38 km and decreases by about 3 K between 38.0 and 38.5 km. While the absolute measured temperature is not accurate at this altitude, its variations, reduced in magnitude, could be significant.
3. The balloon stopped its ascent for a short period at about 37 km. This change in vertical velocity implies a smaller air lift which could be explained by a rapid increase of the temperature.
The large values of the NO3 concentration measured between 22 and 25 km cannot be explained by the model. Contrary to the previous case, the temperature was measured aboard the platform with a good accuracy at these altitudes. Some horizontal variation of the
temperature between the platform and the location of the measurements could be invoked to explain the discrepancy, but we think nevertheless that this
hypothesis is unlikely. The temperature needed to fit the observations would have to be 18 K larger than the measured one. Such temperature increase is certainly unrealistic.
The low AMON values, relative to the model, below 21 km, are also not predicted and at this point, we have no explanation for these extreme values.
8. Conclusions
Large concentrations of both NO2 and NO3 in a layer located between 22 to 25 km have been measured at night by AMON on board a stratosphefic balloon on October 16, 1993, at midlatitude. These concentration increases cannot be explained by models. Since the increases are observed where the aerosol layer measured by AMON becomes significant, they could be related to the presence of aerosols. Such a relation, to be interpreted, needs further studies. Comparisons with HALOE profiles show that the increase of NO2, also observed by this instrument, could be very localized.
Other evidences of such increases will be searched for in satellite and balloon data. Other measurements
performed at different latitudes and in a stratosphere free of postvolcanic aerosols would be also very useful.
Acknowledgments. The authors want to thank all the members of the CNES launching team at Aire sur l'Adour. The launch of the AMON instrument was also supported by the PAMOY program of the Institut National des Sciences de l'Univers, CNRS. The HALOE data have been transmitted from the UARS CDHF to our laboratory via the CNES DUCAT system.
References
Brasseur, G., and C. Granier, Mount Pinatubo aerosols, chlorofiuorocarbons, and ozone depletion, Science, 257, 1239-1242, 1992.
Cadle, ILD., P. Crutzen, and D. Ehhalt, Heterogeneous chemical reactions in the stratosphere, J. Geophys. Res., 80, 3381-3385, 1975.
Chazette, P., C. David, J. Lefrbre, S. Godin, J. Pelon, and G. Mbgie, Comparative lidar study of the optical, geometrical, and dynamical properties of stratospheric post-volcanic aerosols, following the eruptions of E1 Chichon and Mount Pinatubo, J. Geophys. Res., .100, 23,195-23,207, 1995.
Coquart, B., A• Jenouvier, and M.F. Mbrienne, The NO2 absorption spectrum temperature effect in the wavelength region 400-500 nm, J. Atmos. Chem., 21 (3) 251-161, 1995.
De More, W.B., S.P. Sander, D.M. Golden, 1LF. Hampson, M.J. Kurylo, C.J. Howard, A.R. Ravishankara, C.E. Kolb, and M.J. Molina, Chemical kinetics and photochemical data for use in stratospheric modeling, in Evaluation 11, JPL Publ. 94-26, NASA, 1994.
Deshler, T., B.J. Johnson, and W.1L Rozier, Balloon borne measurements of Pinatubo aerosols during 1991 and 1992 at 41øN: Vertical profiles, size distribution, and volatility, Geophys. Res. Lett., 20, 1435-1438, 1993.
Fried, A., B.E. Henry, and J.G. Calvert, The reaction probability of N2Os with sulfuric acid aerosols at stratospheric temperatures and composition, J. Geophys. Res., 99, 3517-3532, 1994.
28,804 RENARD ET AL.: NOCTURNAL DISTRIBUTION OF 03, NO2 AND NO3
Gordley L.L., J.M. Russell III, L.J. Mickley, J.E. Frederick, J.H. Park, ICA. Stone, G.M. Beaver, J.M. McInerney, L.E. Deaver, G.C. Toon, F.J. Murcray, R.D. Blatherwick, M.R. Gunson, J.P.D. Abbatt, R.L. Mauldin III, G.H. Mount, B. Sen, and J.F. Blavier, Validation of nitric oxide and nitrogen dioxide measurements made by Halogen Occultation experiment for UARS platform, J.. Geophys. Res, 101, 10,241-10,266, 1996.
Hanson, D.R., and A.R. Ravishnakara, The reaction probabilities of CIONO2 and N205 on 40 to 75% sulfuric acid solutions, J. Geophys. Res., 96, 17,307-17,314, 1991.
Holmann, D.J., and S. Solomon, Ozone destruction through heterogeneous chemistry following the eruption of El Chichon, o r. Geophys. Res., 94, 5029-5041, 1989.
Huguenin, D., Design and performance of stratospheric balloon-borne platforms for infrared astrophysical observations, Infrared Phys. Technol., 35 (2/3) 195-202, 1994.
Jaeger, H., T. Desbier, and D.J. Holmann, Midlatitude lidar backscatter conversion based on balloon borne aerosol
measurements, Geophys. Res. Lett., 22 (13) 1729-1732, 1995.
Kondo, Y., T. Sugita, R.J. Salawitch, M. Koike, P. Aimedieu, and T. Deshler, The effect of Pinatubo aerosols on stratospheric NOy, J. Geophys. Res., in press, 1996.
Lateltin, E., J.P. Pommereau, H. Le Texier, M. Pin'e, and R.A. Ramaroson, Perturbation of stratospheric nitrogen dioxide by volcanic aerosol in the arctic, Geophys. Res. Lett.,21 (13) 1411-1414, 1994.
Luther, F.M., Report to F.A.A. on the high altitude pollution program, LLNL Rep., UCRL 50042, Livermore, Calif., 1980.
McElroy, M.B., R. J. Salawitch, and IC Minschwaner, The changing stratosphere, Planet. Space Sci., 40 (2/3) 373- 401, 1992.
Moreau, G., and C. Robert, Local fluctuations of ozone from 16 km to 45 km deduced from {n-situ vertical ozone profile, in Proceedings of the Quadrennial Ozone Symposium 1992, NASA Conf. Publ., Charlottesville, Va., 1994.
Naudet, J.P., P. Rigaud, M. Pin'e, and D. Huguenin, Altitude distribution of stratospheric NO3, 1., Observations of NO3 and related species, J. Geophys. Res., 94, 6374-6382, 1989.
Naudet, J.P., C. Robert, and D. Huguenin, Balloon measurements of stratospheric trace species using a multichanel UV-visible spectrometer, in Proceedings of the 14th ESA Symposium on European Rocket and Balloon Programs and Related Research, ESA SP-355, pp. 165-168, Eur. Space Agency, Paris, France, 1994.
Nicolet, M., On the molecular scattering in the terrestrial atmosphere: An empirical formula for its calculation in the homosphere, Planet. Space Sci., 32, 1467-1468, 1984.
Pirre, M., R. Ramaroson, J.P. Naudet, and P. Rigaud, Altitude distribution of stratospheric NO3, 2., Comparison of observations with model, J. Geophys. Res., 94, 6383- 6388, 1989.
Post, J.M., C.J. Grund, A.O. Langford, and M.H. Proffitt, Observations of Pinatubo ejecta over Boulder, Colorado, by Lidar of three different wavelengths, Geophys. Res. Let., 19 (2), 195-198, 1992.
Ramaroson, R.A., M. Pirre, and D. Cariolle, A box model for on-line computations of diurnal variation in a 1-D model:
Potential for application in multidimensionnal cases, Ann. Geophys., 10 (6) 416-428, 1992.
Rigaud, P., J.P. Naudet, and D. Huguenin, Simultaneous measurements of vertical distribution of stratospheric NO3 and 03 at different period of the night, J. Geophys. Res, 88, 1463-1467, 1983.
Rinsland, C.P., M.R. Gunson, M.C. Abrams, L.L. Lowes, 1L Zander, E. Mahieu, A. Goldman, M.K.W. Ko, J.M. Rodriguez, and N.D. Sze, Heterogeneous conversion of N205 to HNO3 in the post-Mount Pinatubo eruption stratosphere, o r. Geophys. Res., 99, 8213-8219, 1994.
Robert, C., R6alisation d'un spectrom6tre stellaire multicanal embarquable sous ballon stratosph6rique, Ph.D. thesis, Univ. of Orl6ans, Ofi6ans, 1992.
Roscoe, H.K., D.J. Fish, and R.L. Jones, Interpolation errors in UV-visible spectrometry for stratospheric sensing: implications for sensivity, spectral resolution, and spectral range, Appl. Opt., 35 (3) 427-432, 1996.
Russell III, J.M., L.L. Gordley, J.H. Park, S.R. Drayson, WX). Hesketh, R.J. Cicerone, A.F. Tuck, J.E. Frederick, J.E. Hardes, and P.J. Crutzen, The halogen occultation experiment, o r. Geophys. Res, 98, 10,777-10,797, 1993.
Sander, S.P., Temperature dependence of the NO3 absorption spectrum, o r. Phys. Chem., 90, 4135-4142, 1986.
Smith, J.P., and S. Solomon, Atmospheric NO3, 3., Sunrise disappearance and the stratospheric profile, J. Geophys. Res, 95, 13,819-13,827, 1990.
Smith, J.P., S. Solomon, 1LW. Sanders, H.L. Miller, L.M. Perliski, J.G. Keys, and A.L. Schmeltekopf, Atmospheric NO3, 4., Vertical profiles at middle and polar latitude at sunrise, o r. Geophys. Res, 98, 8983-8989, 1993.
Solomon, S., J.P. Smith, R. W. Sanders, L. Perlisky, H. L Miller, G. H. Mount, J. G. Keys, and A.L., Schmeltekopf, Visible and near-ultraviolet spectroscopy at McMurdo Station, Antarctica, 8., Observations of nighttime NO2 and NO3 from April to October 1991, o r. Geophys. Res., 98, 993- 1000, 1993.
Tolbert, M•., M.J. Rossi, and D. Golden, Heterogeneous interactions of chlorine nitrate, hydrogen chloride, and nitric acid with sulfuric acid surfaces at stratospheric temperatures, Geophys. Res. Lett., 15 (8), 847-850, 1988.
Vigroux, E., Contribution /t l'6tude exp6rimentale de l'absorption par l'Ozone, Ann. Phys., 8, 709-763, 1953.
Wayne, 1L P, The nitrate radical: physics, chemistry, and the atmosphere, Air pollut. res. rep. 31, Comm. Europ. Commun., Brussels, Belgium, 1990.
Webster, C.R., 1LD. May, M. Allen, L. Jaeg16, and M.P. McCormick, Balloon profiles of stratospheric NO2 and HNO3 for testing the heterogeneous hydrolysis of N205 on sulfate aerosols, Geophys. Res. Lett., 21 (1), 53-56, 1994.
D. Huguenin, Observatoire de Gen•ve, CH-1290 Sauvemy, Switzerland.
G. Moreau, M. Pin'e, J.B. Renard and C. Robert, LPCE/CNRS, 3A Avenue de la Recherche Scientifique, F- 45071 Orl6ans cedex 2, France. (e-mail: mpirre•cnrs- orleans.fr; jbrenard•cnrs-orleans.fr).
J.M. Russell III, Department of Physics, Hampton University, Hampton, VA 23668, USA. (e-mail: russell•gprc.hamptonu.edu).
(Received October 10, 1995; revised May 4, 1996; accepted June 21, 1996).


