Embed Size (px)
Citation preview
Nonlinear photoacoustics for measuring the nonlinear optical absorption coefficient
Chandra S Yelleswarapu1,*
and Sri-Rajasekhar Kothapalli2
1Department of Physics, University of Massachusetts Boston, 100 Morrissey Blvd, Boston, MA 02125, USA 2Molecular Imaging Program at Stanford, Department of Radiology, Stanford University, Palo Alto, CA 94305, USA
Abstract: We report a novel photoacoustic Z-scan (PAZ-scan) technique that combines the advantages offered by the conventional Z-scan method and the sensitivity of the photoacoustic detection. The sample is scanned through the focused laser beam and the generated photoacoustic signal is recorded using a 10 MHz focused ultrasound transducer. Since the signal strength is directly proportional to the optical absorption, PAZ-scan displays nonlinear behavior depicting the nonlinear optical absorption of the material. Among many advantages, our experiments on mouse blood show that PAZ-scan can potentially be used as a standard technique to calibrate contrast agents used in theranostics in general and photoacoustics in particular.
©2010 Optical Society of America
OCIS codes: (190.0190) Nonlinear optics; (190.4400) Nonlinear optics, materials; (190.3270) Kerr effect.; (170.5120) Photoacoustic imaging; (190.4870) Photothermal effects
References and links
1. J. Wang, and W. J. Blau, “Inorganic and hybrid nanostructures for optical limiting,” J. Opt. A, Pure Appl. Opt. 11(2), 024001 (2009).
2. X. Huang, W. Qian, I. H. El-Sayed, and M. A. El-Sayed, “The potential use of the enhanced nonlinear properties of gold nanospheres in photothermal cancer therapy,” Lasers Surg. Med. 39(9), 747–753 (2007).
3. F. Kajzar, and J. Messier, “Third-harmonic generation in liquids,” Phys. Rev. A 32(4), 2352–2363 (1985). 4. E. J. Canto-Said, D. J. Hagan, J. Young, and E. W. Van Stryland, “Degenerate four-wave mixing measurements
of high order nonlinearities in semiconductors,” IEEE J. Quantum Electron. 27(10), 2274–2280 (1991). 5. M. J. Moran, C. Y. She, and R. L. Carman, “Interferometric measurements of the nonlinear refractive-index
coefficient relative to CS2 in laser-system related materials,” IEEE J. Quantum Electron. 11(6), 259–263 (1975). 6. Y. J. Ding, C. L. Guo, G. A. Swartzlander, Jr., J. B. Khurgin, and A. E. Kaplan, “Spectral measurement of the
nonlinear refractive index in ZnSe using self-bending of a pulsed laser beam,” Opt. Lett. 15(24), 1431–1433 (1990).
7. M. Sheik-Bahae, A. A. Said, T. H. Wei, D. J. Hagan, and E. W. Vanstryland, “Sensitive measurement of optical nonlinearities using a single beam,” IEEE J. Quantum Electron. 26(4), 760–769 (1990).
8. T. Xia, D. J. Hagan, M. Sheik-Bahae, and E. W. Van Stryland, “Eclipsing Z-scan measurement of λ/104 wave-front distortion,” Opt. Commun. 134, 529 (1994).
9. S. M. Mian, B. Taheri, and J. P. Wicksted, “Effects of beam ellipticity on Z-scan measurements,” J. Opt. Soc. Am. B 13(5), 856 (1996).
10. P. Chen, D. A. Oulianov, I. V. Tomov, and P. M. Rentzepis, “Two-dimensional Z-scan for arbitrary beam shape and sample thickness,” J. Appl. Phys. 85(10), 7043 (1999).
11. A. G. Bell, “On the production and reproduction of sound by light,” Am. J. Sci. 20, 305 (1880). 12. A. Hordvik, and H. Schlossberg, “Photoacoustic technique for determining optical absorption coefficients in
solids,” Appl. Opt. 16(1), 101–107 (1977). 13. A. C. Tam, and C. K. Patel, “Two-photon absorption spectra and cross-section measurements in liquids,” Nature
280(5720), 304–306 (1979). 14. Y. C. Teng, and B. S. H. Royce, “Absolute optical absorption coefficient measurements using photoacoustic
spectroscopy amplitude and phase information,” J. Opt. Soc. Am. 70(5), 557 (1980). 15. N. G. C. Astrath, A. C. Bento, M. L. Baesso, Ferreira da Silva, R. Ahuja, C. Persson, S. Zhao, and C. G.
Granqvist, “Thermal lens and photoacoustic spectroscopy to determine the thermo-optical properties of semiconductors,” J. Phys. IV 125, 181–183 (2005).
16. L. V. Wang, “Multiscale photoacoustic microscopy and computed tomography,” Nat. Photonics 3(9), 503–509 (2009).
17. V. Torres-Zúñiga, R. Castañeda-Guzmán, S. J. Pérez-Ruiz, O. G. Morales-Saavedra, and M. Zepahua-Camacho, “Optical absorption photoacoustic measurements for determination of molecular symmetries in a dichroic organic-film,” Opt. Express 16(25), 20724–20733 (2008).
#124610 - $15.00 USD Received 24 Feb 2010; revised 8 Apr 2010; accepted 12 Apr 2010; published 14 Apr 2010(C) 2010 OSA 26 April 2010 / Vol. 18, No. 9 / OPTICS EXPRESS 9020
18. S. Mallidi, and S. Emelianov, “Photoacoustic technique to measure beam profile of pulsed laser systems,” Rev. Sci. Instrum. 80(5), 054901 (2009).
19. K. V. Larin, I. V. Larina, M. Motamedi, and R. O. Esenaliev, “Optoacoustic laser monitoring of cooling and freezing of tissues,” Quantum Electron. 32(11), 953–958 (2002).
20. A. De La Zerda, C. Zavaleta, S. Keren, S. Vaithilingam, S. Bodapati, Z. Liu, J. Levi, B. R. Smith, T. J. Ma, O. Oralkan, Z. Cheng, X. Chen, H. Dai, B. T. Khuri-Yakub, and S. S. Gambhir, “Carbon nanotubes as photoacoustic molecular imaging agents in living mice,” Nat. Nanotechnol. 3(9), 557–562 (2008).
21. K. Maslov, H. F. Zhang, S. Hu, and L. V. Wang, “Optical-resolution photoacoustic microscopy for in vivo imaging of single capillaries,” Opt. Lett. 33(9), 929–931 (2008).
1. Introduction
Every real and physical oscillating system exhibits nonlinear response when it is overdriven. In optical systems it occurs when there is sufficiently intense light illumination. The third order optical nonlinearities cover a vast and diverse area in nonlinear optics. The third order nonlinear susceptibility χ
(3) is a complex quantity and its real and imaginary components
represent nonlinear refraction and nonlinear absorption, respectively. Measurement of these parameters is important for many practical applications. In recent years, χ
(3) is measured for a
wide variety of materials which are potential candidates for photonics, optoelectronics and biomedical applications [1,2]. Several techniques have been proposed to measure these parameters [3–7]. Of them, in view of its simplicity and sensitivity, Z-scan is the most extensively used technique [1,7]. It can be used for measuring both the sign and magnitude of the nonlinear refractive index coefficient n2 and the magnitude of the nonlinear absorption coefficient β. In the conventional Z-scan experiment (hereafter called Z-scan) the transmittance of a nonlinear medium is recorded by a photodetector while the sample is scanned through (Z-axis) the focused laser beam. This is called an open aperture Z-scan and the plot between z-axis and the normalized transmittance curve depicts only the losses due to the linear and nonlinear absorptions of the sample from which β is calculated. However if the transmitted light is recorded behind an aperture, closed aperture Z-scan, the curve displays both the absorption and scattering. From this n2 will be obtained. Since the invention of Z-scan several improvements have been demonstrated in order to improve the sensitivity and/or to study a variety of materials. These include the use of non-Gaussian-beam profiles, thick samples, measurements in reflection mode (reflection Z-scan, appropriate for opaque materials) and total beam-profile distortions [8–10]. In spite of these advances, however, it is still not convenient to use the Z-scan technique in certain situations. For example, the excitation laser wavelength has to be off resonance for strongly nonlinear absorption materials so that transmitted optical signal can be measured. Weak nonlinear materials require intense optical beam, often resulting in damage of the material. Also Z-scan cannot be used to study opaque and highly absorptive optical samples, and surface properties of non-transparent materials like semiconductors. This holds true even for frozen aqueous samples where formation of microcrystals and craks lowers the transparency of the sample.
In this paper, we present a novel technique, photoacoustic Z-scan (PAZ-scan), to measure the nonlinear absorption coefficients of a wide variety of materials. It combines the advantages offered by the conventional optical Z-scan technique and the highly sensitive photoacoustic detection. The photoacoustic effect, in which the absorption of light results in the generation of acoustic waves, was first described by Alexander Graham Bell in 1860 [11]. It has been used as a highly-sensitive tool for the measurement of low absorptions and linear absorption coefficients in various forms of materials [12–15]. With advent of state of art high power nanosecond lasers, recently the photoacoustic tomography and microscopy have become popular in medical imaging [16]. In the last two years the photoacoustic effects have also been exploited to study Malus’s law and optical beam characterization [17,18]. It is argued that the photoacoustic detection technique allows the investigation of nonstandard and opaque polymeric films, where the analysis of the optical measurements is a difficult task.
In PAZ-scan, like in the Z-scan, the lens is translated in small steps along the (Z-axis, optical axis) so that the test sample is scanned through the focused laser beam. In the Z-scan the transmitted optical signal is recorded at each step. In the PAZ-scan, however, the generated photoacoustic (PA) signal is recorded using a focused ultrasound transducer. The
#124610 - $15.00 USD Received 24 Feb 2010; revised 8 Apr 2010; accepted 12 Apr 2010; published 14 Apr 2010(C) 2010 OSA 26 April 2010 / Vol. 18, No. 9 / OPTICS EXPRESS 9021
feasibility of the technique is demonstrated by studying nonlinear absorption behaviors of saturable (SA) and reverse saturable absorbers (RSA). Further the blood sample of mouse was studied which otherwise is not possible with the Z-scan without diluting the blood sample. Our calculations on nonlinear absorption coefficient of the samples using the PAZ-scan curves are in good agreement with those obtained from the Z-scan curves and complement each other. PAZ-scan technique has potential for the characterization of nonlinear optical properties for a wide variety of materials including highly absorbing, non transparent or optically thick samples which can be in a variety of physical forms – thin films, frozen, crystals, powders, and liquids. As the generated acoustic waves are propagated outwards in all directions, PAZ-scan can be easily performed in either transmission or reflection geometry. This enables one to study the surface properties of non-transparent materials and living subjects.
2. Experimental results and discussion
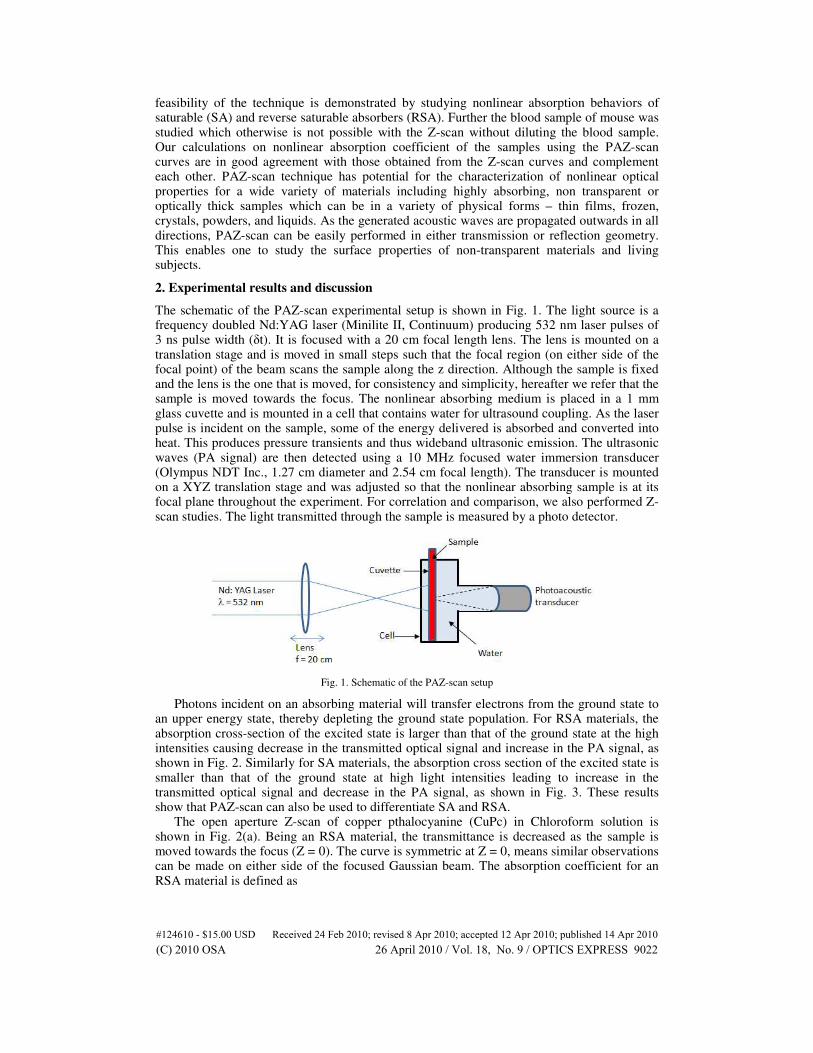
The schematic of the PAZ-scan experimental setup is shown in Fig. 1. The light source is a frequency doubled Nd:YAG laser (Minilite II, Continuum) producing 532 nm laser pulses of 3 ns pulse width (δt). It is focused with a 20 cm focal length lens. The lens is mounted on a translation stage and is moved in small steps such that the focal region (on either side of the focal point) of the beam scans the sample along the z direction. Although the sample is fixed and the lens is the one that is moved, for consistency and simplicity, hereafter we refer that the sample is moved towards the focus. The nonlinear absorbing medium is placed in a 1 mm glass cuvette and is mounted in a cell that contains water for ultrasound coupling. As the laser pulse is incident on the sample, some of the energy delivered is absorbed and converted into heat. This produces pressure transients and thus wideband ultrasonic emission. The ultrasonic waves (PA signal) are then detected using a 10 MHz focused water immersion transducer (Olympus NDT Inc., 1.27 cm diameter and 2.54 cm focal length). The transducer is mounted on a XYZ translation stage and was adjusted so that the nonlinear absorbing sample is at its focal plane throughout the experiment. For correlation and comparison, we also performed Z-scan studies. The light transmitted through the sample is measured by a photo detector.
Fig. 1. Schematic of the PAZ-scan setup
Photons incident on an absorbing material will transfer electrons from the ground state to an upper energy state, thereby depleting the ground state population. For RSA materials, the absorption cross-section of the excited state is larger than that of the ground state at the high intensities causing decrease in the transmitted optical signal and increase in the PA signal, as shown in Fig. 2. Similarly for SA materials, the absorption cross section of the excited state is smaller than that of the ground state at high light intensities leading to increase in the transmitted optical signal and decrease in the PA signal, as shown in Fig. 3. These results show that PAZ-scan can also be used to differentiate SA and RSA.
The open aperture Z-scan of copper pthalocyanine (CuPc) in Chloroform solution is shown in Fig. 2(a). Being an RSA material, the transmittance is decreased as the sample is moved towards the focus (Z = 0). The curve is symmetric at Z = 0, means similar observations can be made on either side of the focused Gaussian beam. The absorption coefficient for an RSA material is defined as
#124610 - $15.00 USD Received 24 Feb 2010; revised 8 Apr 2010; accepted 12 Apr 2010; published 14 Apr 2010(C) 2010 OSA 26 April 2010 / Vol. 18, No. 9 / OPTICS EXPRESS 9022
0RSA RSA
Iµ α β= + (1)
where α0RSA is the linear absorption coefficient, and β is the excited state absorption or two-
photon absorption coefficient. Solid line in the Fig. 2(a) is the best fit to the experimental data obtained using the relation [6]
( ) 2
0 0 0exp( ) / ln 1 exp( )RSAT L q q t dtα π+∞
−∞
= − + − ∫ (2)
where q0 is given by βI0Leff. I0 is the on-axis peak intensity, and Leff is given by [1-exp(-α0RSAL)]/α0RSA. By fitting the experimental data to the Eq. (2), the best-fit two-photon
absorption coefficient β was calculated to be 3.976x10⁻⁹
m/W at I0 = 6.1x10¹¹
W/m2 where the
linear absorption coefficient (α0RSA) was measured to be ~1950 m−1
using Beer-Lambert’s law at low input powers.
-0.06 -0.04 -0.02 0.00 0.02 0.04 0.060.5
0.6
0.7
0.8
0.9
1.0
1.1
No
rma
lize
d o
pti
ca
l s
ign
al
Z in meters
(a)
-0.06 -0.04 -0.02 0.00 0.02 0.04 0.06
0
1
2
3
4
5
6
7
8
No
rma
lize
d p
ho
toa
co
us
tic
sig
na
l
Z in meters
(b)
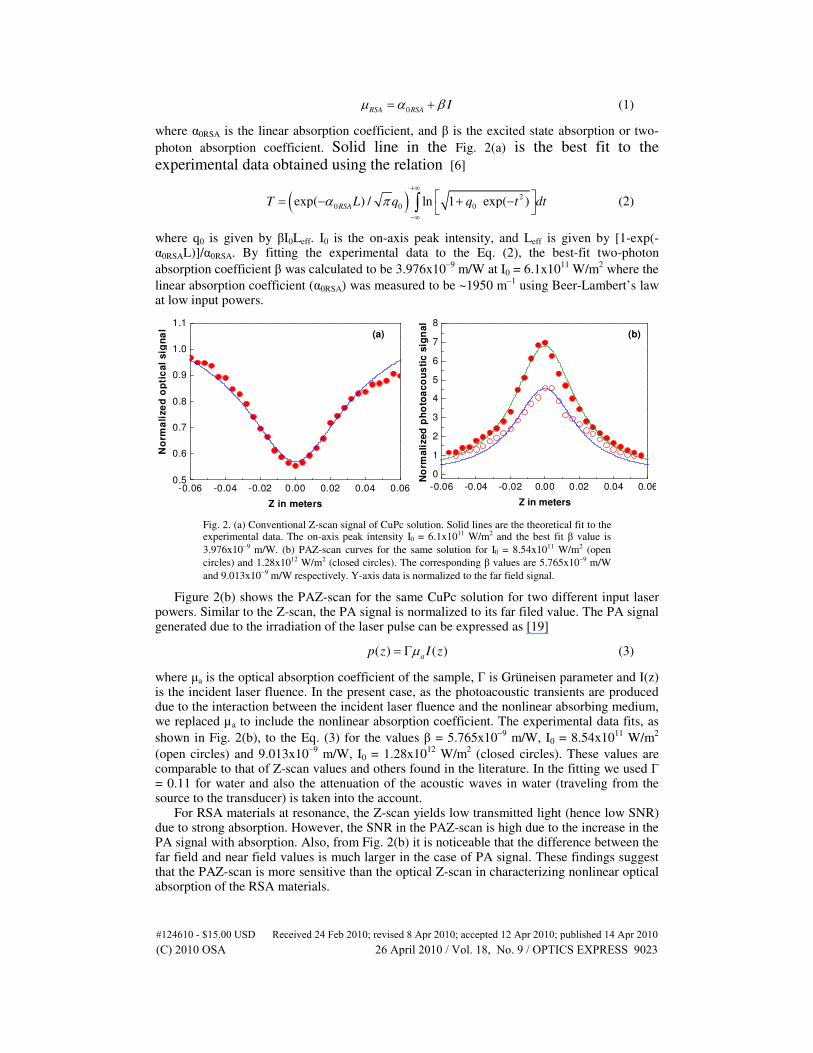
Fig. 2. (a) Conventional Z-scan signal of CuPc solution. Solid lines are the theoretical fit to the experimental data. The on-axis peak intensity I0 = 6.1x10¹¹ W/m2 and the best fit β value is
3.976x10⁻⁹ m/W. (b) PAZ-scan curves for the same solution for I0 = 8.54x10¹¹ W/m2 (open
circles) and 1.28x10¹² W/m2 (closed circles). The corresponding β values are 5.765x10⁻⁹ m/W
and 9.013x10⁻⁹ m/W respectively. Y-axis data is normalized to the far field signal.
Figure 2(b) shows the PAZ-scan for the same CuPc solution for two different input laser powers. Similar to the Z-scan, the PA signal is normalized to its far filed value. The PA signal generated due to the irradiation of the laser pulse can be expressed as [19]
( ) ( )a
p z I zµ= Γ (3)
where µa is the optical absorption coefficient of the sample, Γ is Grüneisen parameter and I(z) is the incident laser fluence. In the present case, as the photoacoustic transients are produced due to the interaction between the incident laser fluence and the nonlinear absorbing medium, we replaced µa to include the nonlinear absorption coefficient. The experimental data fits, as
shown in Fig. 2(b), to the Eq. (3) for the values β = 5.765x10⁻⁹
m/W, I0 = 8.54x10¹¹
W/m2
(open circles) and 9.013x10⁻⁹
m/W, I0 = 1.28x10¹²
W/m2 (closed circles). These values are
comparable to that of Z-scan values and others found in the literature. In the fitting we used Γ = 0.11 for water and also the attenuation of the acoustic waves in water (traveling from the source to the transducer) is taken into the account.
For RSA materials at resonance, the Z-scan yields low transmitted light (hence low SNR) due to strong absorption. However, the SNR in the PAZ-scan is high due to the increase in the PA signal with absorption. Also, from Fig. 2(b) it is noticeable that the difference between the far field and near field values is much larger in the case of PA signal. These findings suggest that the PAZ-scan is more sensitive than the optical Z-scan in characterizing nonlinear optical absorption of the RSA materials.
#124610 - $15.00 USD Received 24 Feb 2010; revised 8 Apr 2010; accepted 12 Apr 2010; published 14 Apr 2010(C) 2010 OSA 26 April 2010 / Vol. 18, No. 9 / OPTICS EXPRESS 9023
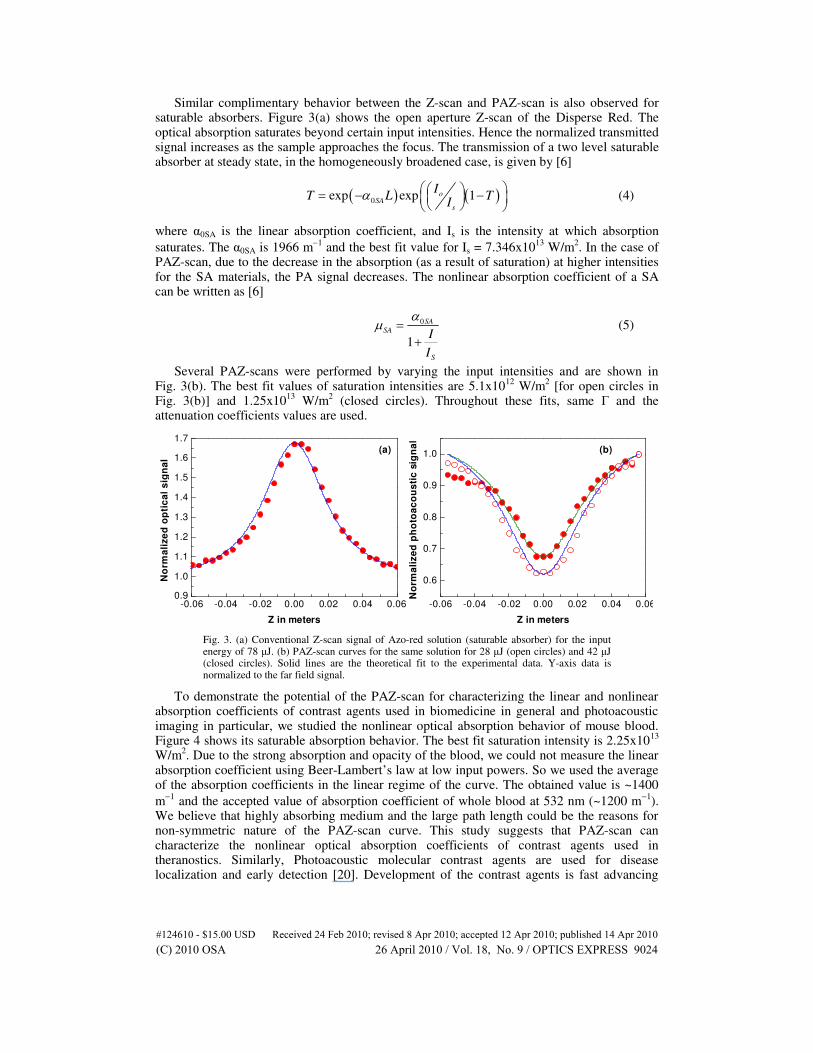
Similar complimentary behavior between the Z-scan and PAZ-scan is also observed for saturable absorbers. Figure 3(a) shows the open aperture Z-scan of the Disperse Red. The optical absorption saturates beyond certain input intensities. Hence the normalized transmitted signal increases as the sample approaches the focus. The transmission of a two level saturable absorber at steady state, in the homogeneously broadened case, is given by [6]
( ) ( )0exp exp 1o
SAs
IT L T
Iα = − −
(4)
where α0SA is the linear absorption coefficient, and Is is the intensity at which absorption
saturates. The α0SA is 1966 m−1
and the best fit value for Is = 7.346x10¹³
W/m2. In the case of
PAZ-scan, due to the decrease in the absorption (as a result of saturation) at higher intensities for the SA materials, the PA signal decreases. The nonlinear absorption coefficient of a SA can be written as [6]
0
1
SA
SA
S
I
I
αµ =
+ (5)
Several PAZ-scans were performed by varying the input intensities and are shown in Fig. 3(b). The best fit values of saturation intensities are 5.1x10
12 W/m
2 [for open circles in
Fig. 3(b)] and 1.25x10¹³
W/m2 (closed circles). Throughout these fits, same Γ and the
attenuation coefficients values are used.
-0.06 -0.04 -0.02 0.00 0.02 0.04 0.060.9
1.0
1.1
1.2
1.3
1.4
1.5
1.6
1.7
No
rma
lize
d o
pti
ca
l s
ign
al
Z in meters
(a)
-0.06 -0.04 -0.02 0.00 0.02 0.04 0.06
0.6
0.7
0.8
0.9
1.0
No
rma
lize
d p
ho
toa
co
us
tic
sig
na
l
Z in meters
(b)
Fig. 3. (a) Conventional Z-scan signal of Azo-red solution (saturable absorber) for the input energy of 78 µJ. (b) PAZ-scan curves for the same solution for 28 µJ (open circles) and 42 µJ (closed circles). Solid lines are the theoretical fit to the experimental data. Y-axis data is normalized to the far field signal.
To demonstrate the potential of the PAZ-scan for characterizing the linear and nonlinear absorption coefficients of contrast agents used in biomedicine in general and photoacoustic imaging in particular, we studied the nonlinear optical absorption behavior of mouse blood. Figure 4 shows its saturable absorption behavior. The best fit saturation intensity is 2.25x10
13
W/m2. Due to the strong absorption and opacity of the blood, we could not measure the linear
absorption coefficient using Beer-Lambert’s law at low input powers. So we used the average of the absorption coefficients in the linear regime of the curve. The obtained value is ~1400
m−1
and the accepted value of absorption coefficient of whole blood at 532 nm (~1200 m−1
). We believe that highly absorbing medium and the large path length could be the reasons for non-symmetric nature of the PAZ-scan curve. This study suggests that PAZ-scan can characterize the nonlinear optical absorption coefficients of contrast agents used in theranostics. Similarly, Photoacoustic molecular contrast agents are used for disease localization and early detection [20]. Development of the contrast agents is fast advancing
#124610 - $15.00 USD Received 24 Feb 2010; revised 8 Apr 2010; accepted 12 Apr 2010; published 14 Apr 2010(C) 2010 OSA 26 April 2010 / Vol. 18, No. 9 / OPTICS EXPRESS 9024
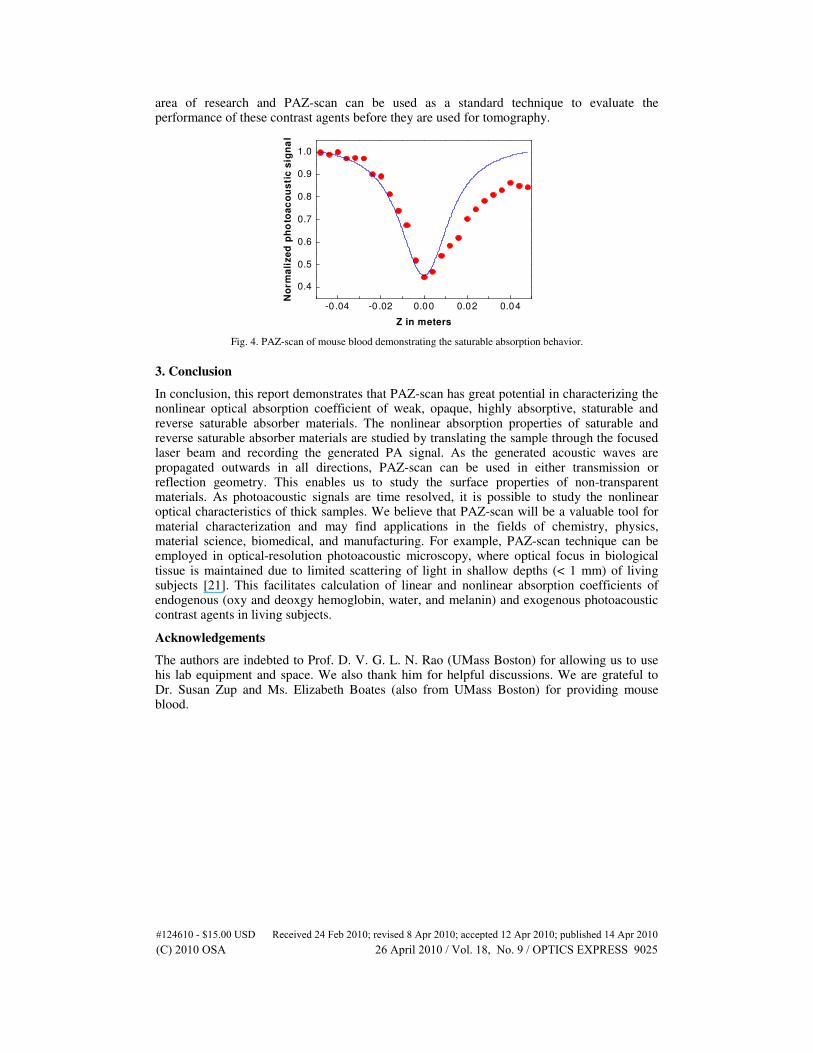
area of research and PAZ-scan can be used as a standard technique to evaluate the performance of these contrast agents before they are used for tomography.
-0.04 -0.02 0.00 0.02 0.04
0.4
0.5
0.6
0.7
0.8
0.9
1.0
No
rm
ali
ze
d p
ho
toa
co
us
tic
sig
na
l
Z in meters
Fig. 4. PAZ-scan of mouse blood demonstrating the saturable absorption behavior.
3. Conclusion
In conclusion, this report demonstrates that PAZ-scan has great potential in characterizing the nonlinear optical absorption coefficient of weak, opaque, highly absorptive, staturable and reverse saturable absorber materials. The nonlinear absorption properties of saturable and reverse saturable absorber materials are studied by translating the sample through the focused laser beam and recording the generated PA signal. As the generated acoustic waves are propagated outwards in all directions, PAZ-scan can be used in either transmission or reflection geometry. This enables us to study the surface properties of non-transparent materials. As photoacoustic signals are time resolved, it is possible to study the nonlinear optical characteristics of thick samples. We believe that PAZ-scan will be a valuable tool for material characterization and may find applications in the fields of chemistry, physics, material science, biomedical, and manufacturing. For example, PAZ-scan technique can be employed in optical-resolution photoacoustic microscopy, where optical focus in biological tissue is maintained due to limited scattering of light in shallow depths (< 1 mm) of living subjects [21]. This facilitates calculation of linear and nonlinear absorption coefficients of endogenous (oxy and deoxgy hemoglobin, water, and melanin) and exogenous photoacoustic contrast agents in living subjects.
Acknowledgements
The authors are indebted to Prof. D. V. G. L. N. Rao (UMass Boston) for allowing us to use his lab equipment and space. We also thank him for helpful discussions. We are grateful to Dr. Susan Zup and Ms. Elizabeth Boates (also from UMass Boston) for providing mouse blood.
#124610 - $15.00 USD Received 24 Feb 2010; revised 8 Apr 2010; accepted 12 Apr 2010; published 14 Apr 2010(C) 2010 OSA 26 April 2010 / Vol. 18, No. 9 / OPTICS EXPRESS 9025


