Embed Size (px)
Citation preview

Journal of Theoretical and Applied Computer Science Vol. 6, No. 3, 2012, pp. 36-49 ISSN 2299-2634 http://www.jtacs.org
Nonlinearity of human multi-criteria in decision-making
Andrzej Piegat, Wojciech Sałabun
Faculty of Computer Science and Information Technology, West Pomeranian University of Technology, Szczecin, Poland
{apiegat, wsalabun}@wi.zut.edu.pl
Abstract: In most cases, known methods of multi-criteria decision-making are used in order to make linear aggregation of human preferences. Authors of these methods seem not to take into account the fact that linear functional dependences rather rarely occur in real systems. Lin-ear functions rather imply a global character of multi-criteria. This paper shows several examples of human nonlinear multi-criteria that are purely local. In these examples, the nonlinear approach is used based on fuzzy logic. It allows for better understanding of how important is the non-linear aggregation of human multi-criteria. The paper contains also proposal of an indicator of nonlinearity degree of the criteria. The presented results are based on investigations and experiments realized by authors.
Keywords: Multi-criteria analysis, multi-criteria decision-analysis, non-linear multi-criteria, fuzzy multi-criteria, indicator of nonlinearity.
1. Introduction
On a daily basis and in professional life we frequently have to make decisions. Then we use some criteria that depend on our individual preferences, or in case of group-decisions on preferences of the group. Further on, criteria represent preferences of a single person will be called individual criteria and criteria represent a group will be called group-criteria. Group-criteria can be achieved by aggregation of individual ones. Therefore, further on, the nonlin-earity problem of criteria will be analyzed on examples of individual criteria, because prop-erties of individual criteria are transferred on the group-ones. Individual human multi-criteria are “programmed” in our brains and special methods for their elicitation and math-ematical formulation of them are necessary. Multi-criteria (for short M-Cr) of different per-sons are more or less different and therefore it would be not reasonable to assume one and the same type of a mathematical formula for certain criterion representing thousands of dif-ferent people, e.g. for the individual criterion of car attractiveness. However, in case of M-Crs most frequently used criterion type is the linear M-Cr form (1).
� = �� + ���� + ���� + ⋯+ �� , (1)
where: wi – weight coefficients of particular component criteria, ∑ �� = 1� � , Ki - the com-
ponent criteria aggregated by the M-Cr (� = 1: ������). They are mostly used, also in this paper, in the form which is normalized to interval [0,1]. The linear criterion-function in the space 2D is represented by a straight line, in the space 3D by a plane, Fig.1, and in the space nD by a hyper-plane.

Nonlinearity of human, decisional multi-criteria 37
Figure 1. A linear criterion function in space 2D (Fig.1a) and in space 3D (Fig.1b)
Let us notice that in the linear-criterion function K particular component-criteria Ki in-fluence the superior criterion in the mutually independent and uncorrelated way. Apart of this, the influence strength of particular component criteria Ki is of the global, constant and unchanging character in the full criterion-domain. Both above features are great disad-vantages of the linear M-Cr, because human M-Cr are in most cases nonlinear and signifi-cance of component criteria Ki is not constant, is not independent from other criteria and varies in particular, local sub-domains of the global MCr. Unfortunately, linear multi-criteria are used in many world-known methods of the multi-criteria decision-analysis. Fol-lowing examples illustrating the above statement can be given: the method SAW (Simple Additive Weighting) [4,15], the very known and widely used AHP-method of Saaty (the Analytic Hierarchy Process) [11,15,18], the ANP-method (Analytic Network Process), [12,13]. Other known MCr-methods as TOPSIS [15,16], ELECTRE [2], PROMETHEE [1,2] are not strictly linear ones. However, they assume global weight-coefficients wi, con-stant for the full MCr-domain and in certain steps of their algorithms they also use the line-ar, weighted aggregation of alternatives. The next part will present the simplest examples of nonlinear criterion-functions in 2D-space.
2. Nonlinear human criterion-functions in 2D-space
An example of a very simple human nonlinear criterion-function can be the dependence between the coffee taste (CT), CT ∈ [0,1], and the sugar quantity S, S ∈ [0,5] expressed in number of sugar spoons, Fig.2. Coffee taste represents inner human preference.
The criterion function of the coffee taste can be identified by interviewing a given per-son or more exactly, experimentally, by giving the person coffees with different amount of sugar and asking he/she to evaluate the coffee taste or to compare tastes of pairs of coffees with different amount of sugar. The achieved taste evaluations can be processed with vari-ous MCr-methods previously cited or with the method of characteristic objects proposed by one of the paper authors. However, even without scientific investigations it is easy to under-stand that the criterion-function shown in Fig.2 is qualitatively correct. This function repre-sents preferences of the author-AP. He does not like coffee with too great amount of sugar (more than 3 coffee-spoons) and evaluates its taste as CT≈0. The taste of coffee without sugar (S=0) he also evaluates as a poor one. The best taste he feels when cup of coffee con-

38 Andrzej Piegat, Wojciech Sałabun
tains 2 spoons of sugar (Sopt=2). For other persons the optimal sugar amount will be differ-ent. Thus, this criterion-function is not an “objective” (what does it mean?) function of all people in the world but an individual criterion-function of the AP-author of the paper. It is very important to differentiate between individual criteria and group-criteria, which repre-sent small or greater group of people. Similar in character as the function in Fig.2 is also other one-component human criterion function: e.g. dependence of the text-reading easiness from the light intensity.
Figure 2. Criterion function representing dependence of the coffee taste CT from number of sugar spoons S (felt by an individual person, the paper author-AP)
3. Nonlinear, human, multi-criterion function in 3D-space and a method
of its identification
Already in 60-ties and 70-ties of the 20th century American scientists D. Kahneman and A. Tversky, Nobel prize winners from 2002 have drawn the attention of the scientific com-munity on the nonlinearity of human multi-criteria [5] by their investigation results on hu-man decisions based on a MCr. In their experiment were aggregated some component criteria: value of a possible profit, probability of the possible profit value, value of a possi-ble loss, probability of the possible loss-value. Further on, there will be presented a similar but a simplified problem of evaluation of the individual play acceptability-degree K in de-pendence of a possible winnings-value K1[$] and of a possible loss-value K2 [$]. Both val-ues are not great. The interviewed person has to make decisions in the problem described below.
Among 25 plays shown in Table 1, with different winnings K1[$] and losses K2[$] (if you
don’t win you will have to pay a sum equal to the loss K2) at first find all plays (K1,K2) which certainly are not accepted by you (K=0), and next all plays which are certainly ac-cepted by you (K=1). For rest of the plays determine a rank with the method of pair-tournament (pair comparisons). Probability of winnings and losses are the same and equal to 0.5.

Nonlinearity of human, decisional multi-criteria 39
Table 1 gives values of possible winnings and losses (K1,K2) in particular plays. It also informs for which plays the AP-author declares the full acceptation (full readiness to take up the game) that means K=1, and informs for which plays he does not accept at all (zero read-iness to take up the game) that means K=0. The acceptability degree plays a role of the mul-ti-criterion in the shown decision-problem.
The acceptability degree of plays marked with question mark will be determined with the tournament-rank method. The investigated person chooses from each play-pair the more acceptable play (inserting the value 1 in the table for this play), which means the win. If the person is not able to decide which of two plays is better, then she/he inserts the value 0.5 for both plays of the pair, which means the draw.
Summarized scores from Table 2 are shown in Table 3 for particular plays (K1,K2).
Table 1. Winnings K1[$] and losses K2[$] in particular 25 plays and first decisions of the interviewed person : determining the unacceptable plays (acceptation degree K=0) and the fully acceptable plays (K=1) which certainly would be played by the person. Plays with question marks are plays of a par-
tial (fractional) acceptation that is to be determined.
The value of losses
��[$] The value of winning ��[$]
0.0 2.5 5.0 7.5 10.0
0.0 0 1 1 1 1
2.5 0 0 ? ? ?
5.0 0 0 0 ? ?
7.5 0 0 0 0 ?
10.0 0 0 0 0 0
Table 2. Tournament results of particular play-pairs. The value 1 means the win of a play, the value 0.5 means the draw. A single play is marked by (K1,K2).
Points ���, ���[$]���, ��) [$] Points Points ���, ���[$]���, ��) [$] Points
0 (5.0, 2.5) (7.5, 2.5) 1 1 (7.5, 2.5) (10.0, 7.5) 0 0 (5.0, 2.5) (10.0, 2.5) 1 1 (10.0, 2.5) (7.5, 5.0) 0
0.5 (5.0, 2.5) (7.5, 5.0) 0.5 1 (10.0, 2.5) (10.0, 5.0) 0 0 (5.0, 2.5) (10.0, 5.0) 1 1 (10.0, 2.5) (10.0, 7.5) 0
0.5 (5.0, 2.5) (10.0, 7.5) 0.5 0 (7.5, 2.5) (10.0, 5.0) 1 0 (7.5, 2.5) (10.0, 2.5) 1 0.5 (7.5, 2.5) (10.0, 7.5) 0.5 1 (7.5, 2.5) (7.5, 5.0) 0 1 (10.0, 5.0) (10.0, 7.5) 0
0.5 (7.5, 2.5) (10.0, 5.0) 0.5
Table 3. Scores of particular plays (K1,K2) and rank places assigned to particular plays with fractional acceptation degree K (multi-criterion) of the investigated person
Play (K1,K2) (10.0,
2.5) (10.0,
5.0) (7.5, 2.5) (10.0,
7.5) (5.0, 2.5) (7.5, 5.0)
��� !"#���, ��� 5 3.5 3.5 1 1 1
Rank(K1,K2) I II II III III III
Analysis of Table 3 shows that in the end we have 3 play types with differentiated val-
ues of the multi-criterion K. Apart from 6 plays with fractional acceptation given in Table 3 we also have 15 plays with the zero-acceptability K=0 and 4 plays with the full acceptability

40 Andrzej Piegat, Wojciech Sałabun
K=1, see Table 1. Applying the indifference principle of Laplace [2], we can assume that the full difference of acceptation value relating to plays from Table 3, Kmax - Kmin= 1 - 0 = 1 should be partitioned in 4 equal differences ∆K = ¼. The plays (5, 2.5), (7.5, 5), (10,7.5) achieve the M-Cr value K=1/4 (the third place in the rank). The plays (7.5, 2.5) and (10, 5) achieve K=2/4 (the second place in the rank). The play (10,2.5) achieves K=3/4 (the first place in the rank of fractional-acceptability of plays). Resulting values of the M-Cr K de-termined for particular plays with the tournament-rank method are given in Table 4.
Table 4. Resulting values of the multi-criterion K= f(K1,K2), which represents the acceptability de-gree of particular plays (K1,K2) for the investigated person.
The value of losses
��[$] The value of winning ��[$]
0.0 2.5 5.0 7.5 10.0
0.0 0 1 1 1 1
2.5 0 0 1 4⁄ 2 4⁄ 3 4⁄
5.0 0 0 0 1 4⁄ 2 4⁄
7.5 0 0 0 0 1 4⁄
10.0 0 0 0 0 0
On the basis of Table 4 a visualization of the investigated multi-criterion K of the play
acceptability-degree can be realized, Fig. 3 and 4.
Figure 3. Visualization of the 25 analyzed plays (K1,K2) as 25 characteristic objects regularly placed in the decisional domain K1 K2 of the problem
Each of the 25 characteristic plays (decisional objects) can be interpreted as a crisp rule, e.g.:
IF (K1 = 7.5) AND (K2 = 5) THEN (K = ¼) (2)
However, if K1 is not exactly equal to 7.5 and K2 is not exactly equal to 5.0 then rule (2) can be transformed in a fuzzy rule (3) based on tautology Modus Ponens [8, 9].
IF (K1 close to 7.5) AND (K2 close 5.0) THEN (K close ¼) (3)

Nonlinearity of human, decisional multi-criteria 41
This way 25 fuzzy rules of type (4) were achieved on the basis of each characteristic ob-ject (play) given in Table 3. The rules enable calculating values of the nonlinear multi-criterion K for any values of the component criteria K1i and K2j, i,j =1:5.
IF (K1 close to K1i) AND (K2 close to K2j) THEN (K close to Kij) (4)
The complete rule base is given in Table 3. To enable calculation of the fuzzy M-Cr-function K it is necessary to define membership functions µK1i ( close to K1i ), µK2j (close to K2j) and µKij (close to Kij). These functions are shown in Fig.4.
Figure 4. Membership functions µK1i (close to K1i), µK2j (close to K2j) of the component criteria and µKij (close to Kij) of the aggregating multi-criterion K
On the basis of the rule base (Table 3) and of membership functions from Fig.4 it is easy to visualize the function-surface K = f(K1,K2) of individual multi-criterion of the play ac-ceptation. As visualization tool one also can use toolbox of fuzzy logic from MATLAB or own knowledge about fuzzy modeling [8, 9]. The functional surface is shown in Fig.5.
As Fig.5 shows, the functional surface of the human multi-criterion K=f(K1,K2) is strongly nonlinear. This surface represents the M-Cr of one person. However, in case of other persons surfaces of this multi-criterion are qualitatively very similar (an investigation was realized on approximately 100 students of Faculty of Computer Science of West Pom-eranian University of Technology in Szczecin and of Faculty of Management and Economy of University of Szczecin). Quantitative differences of the multi-criterion K between partic-ular investigated persons were mostly not considerable. All identified surfaces were strongly nonlinear.
The second co-author WS of the paper used the method of characteristic objects in in-vestigation of the attractiveness degree of color. In the experiment two attributes occur:
• the degree of brightness green (in short G),
• the degree of brightness blue (in short B).

42 Andrzej Piegat, Wojciech Sałabun
Figure 5. Functional surface of the individual multi-criterion K=f(K1,K2) of the play acceptability with possible winnings K1[$] and losses K2[$], probability of winnings and losses are identical and
equal to 0.5. This particular surface represents the AP-author of the paper.
The degree of red was fixed at constant brightness level 50%. The brightness level of each components was normalized to the range [0,1]. The first step was to define linguistic values for the G and B components, presented in Fig. 6. and 7.
Figure 6. Definitions of linguistic values for the component G
Figure 7. Definitions of linguistic values for the component B

Nonlinearity of human, decisional multi-criteria 43
Membership functions presented in Fig 6. are described by formula (5):
() = �.+,-�.+ (.) = -,�
�.+ (./ = �,-�.+ (0 = -,�.+
�.+ , (5)
where: L – low, ML – medium left, MR – medium right, H – height, G – the level of bright-ness green.
Membership functions presented in Fig. 7. are described by formula (6):
() = �.+,1�.+ (.) = 1,�
�.+ (./ = �,1�.+ (0 = 1,�.+
�.+ , (6)
where: L – low, ML – medium left, MR – medium right, H – height, B – the level of bright-ness blue.
Linguistic values of attributes generate 9 characteristic objects. Their distribution in the problem space is presented by Fig.8.
Figure 8. Characteristic objects Ri in the space of the problem
Attribute values of the characteristic Ri objects, their names and colors are given in Ta-ble 5.
Table 5. Complex color and their rules
Rule [R, G, B] Color
R1 [0.5, 0.0, 0.0]
R2 [0.5, 0.0, 0.5]
R3 [0.5, 0.0, 1.0]
R4 [0.5, 0.5, 0.0]
R5 [0.5, 0.5, 0.5]
R6 [0.5, 0.5, 1.0]
R7 [0.5, 1.0, 0.0]
R8 [0.5, 1.0, 0.5]
R9 [0.5, 1.0, 1.0]
The interviewed person has to make decisions described below. In the survey, please indicate, which color of the pair of colors is more attractive (please
mark this color by X). If both colors have similar or identical level of attractiveness, please mark a draw. Attractiveness of color is telling you which color you prefer more from the pair of colors.

44 Andrzej Piegat, Wojciech Sałabun
Evaluation of characteristic objects is determined with the tournament-rank method. If one color of a pair is preferred, then this color receives 1 point and second color receives 0 points. If the interviewed person marks a draw, both colors receive 0.5 point. Next, all the points assigned to each object are added. On the basis of the sums the ranking of objects is established. Applying the indifference principle of Laplace we can assume that the full dif-ference value �234 5 �2� = 1 5 0 = 1 should be partitioned in 7 5 1 equal differences 89:;,89<=
2,� . ( m – number of places in the ranking). Experimental identification of surfaces
of the multi-criterion showed, that for all interviewed people, this surfaces were strongly nonlinear. Fig. 9. shows the multi-criterion surface for a randomly chosen person.
For comparison, Fig. 10 shows the multi-criterion surface for co-author WS of the arti-cle.
Figure 9. Functional surface of the individual multi-criterion of the resulting color-attractiveness achieved by mixing 2 component colors with different proportion-rates.
Figure 10. Functional surface of the individual multi-criterion of attractiveness of the resulting color achieved by mixing 2 component colors with different proportion-rates (WS)

Nonlinearity of human, decisional multi-criteria 45
The realized investigation also showed that functional surfaces of the multi-criterion of all persons were strongly nonlinear. Fig. 9 presents the functional, M-Cr-surface of one of the persons taking part in the investigation. For other interviewed people, these M-Cr-surfaces were also highly nonlinear. (Identification of M-Cr-surfaces has been performed for a group of 307 selected people).
4. Nonlinearity indicator of the functional surface of a multi-criterion
In case of the 2-component multi-criterion K = f(K1,K2) there exists visualization possi-bility of the functional surface of the M-Cr and possibility of an approximate, visual evalua-tion of its nonlinearity degree or, at least, of evaluation whether the surface is linear or nonlinear one. However, in case of higher-dimensional multi-criteria K = f(K1,K2, … ,Kn) visualization and visual evaluation of nonlinearity becomes more and more difficult, though it can be realized e.g. with method of lower-dimension cuts [7]. Therefore it would be very useful to construct a quantitative indicator of nonlinearity N-IndK of a model of the multi-criterion K. First, let us analyze, for better understanding of the problem, the most simple criterion-model K = f(K1),the criterion of the lowest dimension identified with the method of characteristic objects (Ch-Ob-method). Let us assume that after realized investigations we have at disposal m objects, each of them is described by the pair (K1,K) of coordinate values and can be interpreted as a measurement sample that can be used for identification of a functional dependence. Let us assume that the characteristic objects are distributed in the coordinate-system space as shown in Fig.11a.
Figure 11. An example placement of characteristic objects (���, ��), � = 1:7������, in the space �� > �, Fig.11a, and a nonlinear, fuzzy model approximating the characteristic objects, Fig.11b
Nonlinearity of the fuzzy model approximating the criterion-function K=f(K1) will be the smaller, the smaller is the difference sum (Ki – KLi ) of corresponding points lying on the fuzzy and on the linear approximation of the criterion function. Information about this sum delivers the proposed indicator N-IndK of nonlinearity, formula (7).
? 5 @�A8 = ∑ |8<,8C<|9<DE�.+2�89:;,89<=� = ∑ |8<,�FGHFE8E<|9<DE
�.+2�89:;,89<=� (7)

46 Andrzej Piegat, Wojciech Sałabun
The denominator 0.5m∙(Kmax-Kmin) in formula (5) realizes normalization of the indicator to interval [0,1]. Fig. 12a presents distribution of characteristic objects for which the nonlin-earity indicator equals zero. Fig.12b presents the inverse situation, when the indicator as-sumes value equal to 1.
Figure 12. Distribution of characteristic objects (K1i,Ki), I = 1-m, for which the nonlinearity indicator N-IndK is equal to zero, Fig.12a, and distribution for which the indicator assumes the maximal
value 1, Fig.12b
If we use a multi-criterion K aggregating n component criteria Ki, then the linear approx-imation KL of K has the form (8) and the nonlinearity indicator N-IndK is expressed by for-mula (9).
�) = �� + ���� + ���� + ⋯+ �� (8)
? 5 @�A8 = ∑ |8<,8C<|9<DE�.+2�89:;,89<=� (9)
The linear approximation KL of a M-Cr can be determined e.g. with the method of the minimal sum of square errors for which many program-tools can be found, e.g. in MATLAB and STATISTICA. As an example, the nonlinearity indicator was determined for the multi-criterion K = f(K1,K2) aggregating winnings and losses of a play, see Fig.5 and Table 3. The achieved value of the indicator was? 5 @�A8 = 0.35. The obtained (with the least squares) linear model KL of multi-criterion K is presented in Fig. 13a, and in Fig. 13b, for comparison, the fuzzy model of this criterion, obtained with the characteristic objects method is shown.
Another example of determining the nonlinearity indicator N-IndK is given for the multi-criterion of attractiveness of the resulting color achieved by mixing 2 component colors with different proportion-rates, which was presented in part 3. The indicator N-IndK was calculated for the nonlinear models from Fig. 9 and Fig. 10.

Nonlinearity of human, decisional multi-criteria 47
Figure 13. Comparison of the linear model KL = w0 + w1K1 +w2K2, Fig.13a, and of the nonlinear model K = f(K1,K2) of the multi-criterion of acceptability of plays on the basis of their winnings
K1($) and losses K2($). In Fig.13b the nonlinear model obtained with the method of characteristic objects with the nonlinearity indicator ? 5 @�A8 = 0.35.
The linear model in Fig. 14a was identified by method of least squares. For comparison the nonlinear model presented in Fig. 14b was determined. For this model the nonlinearity indicator is equal to 0.49. This means a higher nonlinearity degree than in case of the play-problem presented in Fig. 13 where this value was equal to 0.35.
Figure 14. Comparison of the linear model KL = w0 + w1G +w2B, Fig.14a, and of the nonlinear model K = f(G, B) of the multi-criterion of attractiveness of the resulting color achieved by mixing 2 com-ponent colors with different proportion-rates, Fig.14b. The nonlinear model obtained with the meth-
od of characteristic objects is characterized by the nonlinearity indicator ? 5 @�A8 = 0.49.
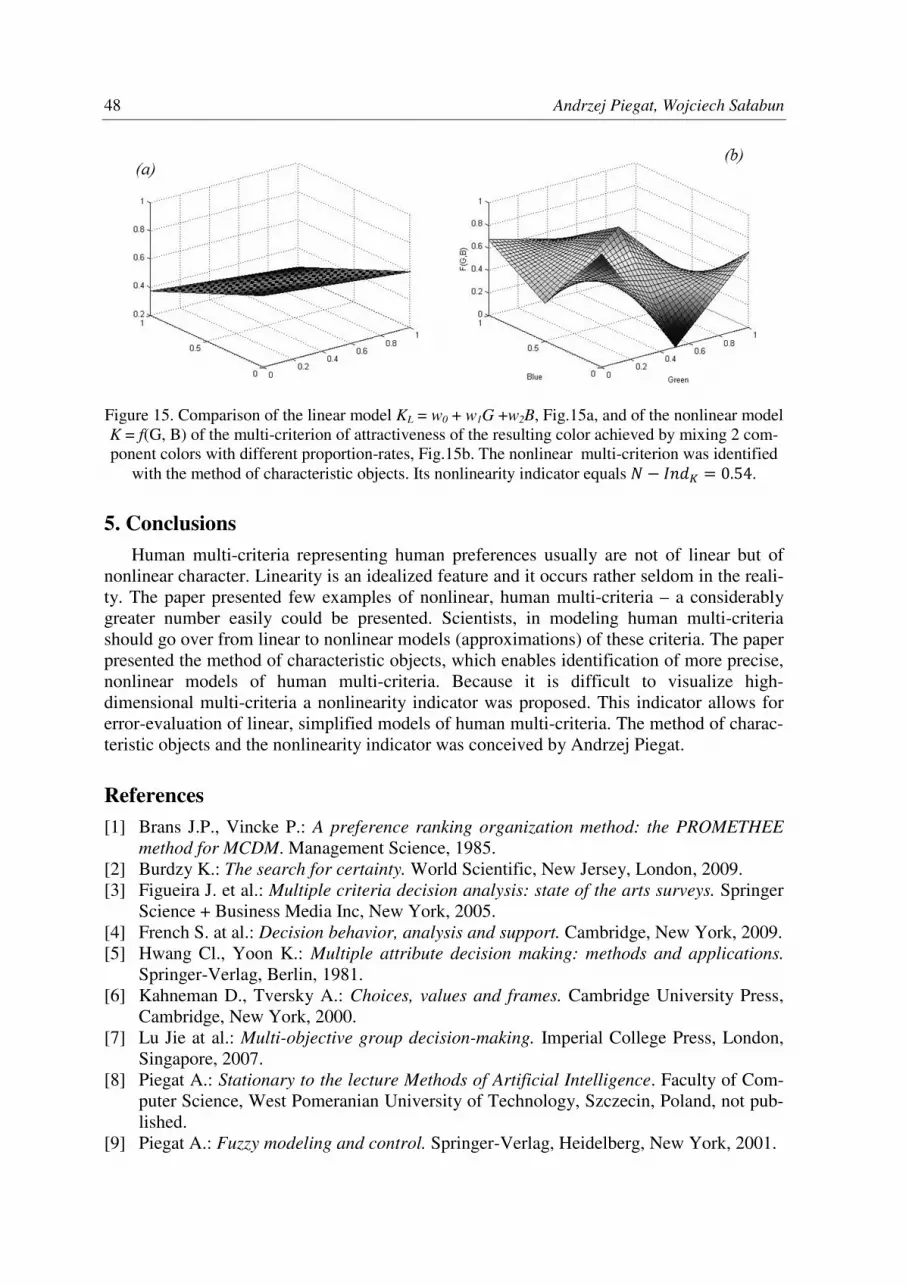
Fig. 15a presents the linear model of this same multi-criterion for co-author WS of the article. This model was identified with method of least squares. After comparing the linear model with the fuzzy model presented in Fig. 15b the nonlinearity indicator 0.54 was achieved. This means the highest degree of the multi-criterion nonlinearity in all presented cases.
48 Andrzej Piegat, Wojciech Sałabun
Figure 15. Comparison of the linear model KL = w0 + w1G +w2B, Fig.15a, and of the nonlinear model K = f(G, B) of the multi-criterion of attractiveness of the resulting color achieved by mixing 2 com-ponent colors with different proportion-rates, Fig.15b. The nonlinear multi-criterion was identified
with the method of characteristic objects. Its nonlinearity indicator equals ? 5 @�A8 = 0.54.
5. Conclusions
Human multi-criteria representing human preferences usually are not of linear but of nonlinear character. Linearity is an idealized feature and it occurs rather seldom in the reali-ty. The paper presented few examples of nonlinear, human multi-criteria – a considerably greater number easily could be presented. Scientists, in modeling human multi-criteria should go over from linear to nonlinear models (approximations) of these criteria. The paper presented the method of characteristic objects, which enables identification of more precise, nonlinear models of human multi-criteria. Because it is difficult to visualize high-dimensional multi-criteria a nonlinearity indicator was proposed. This indicator allows for error-evaluation of linear, simplified models of human multi-criteria. The method of charac-teristic objects and the nonlinearity indicator was conceived by Andrzej Piegat.
References
[1] Brans J.P., Vincke P.: A preference ranking organization method: the PROMETHEE method for MCDM. Management Science, 1985.
[2] Burdzy K.: The search for certainty. World Scientific, New Jersey, London, 2009. [3] Figueira J. et al.: Multiple criteria decision analysis: state of the arts surveys. Springer
Science + Business Media Inc, New York, 2005. [4] French S. at al.: Decision behavior, analysis and support. Cambridge, New York, 2009. [5] Hwang Cl., Yoon K.: Multiple attribute decision making: methods and applications.
Springer-Verlag, Berlin, 1981. [6] Kahneman D., Tversky A.: Choices, values and frames. Cambridge University Press,
Cambridge, New York, 2000. [7] Lu Jie at al.: Multi-objective group decision-making. Imperial College Press, London,
Singapore, 2007. [8] Piegat A.: Stationary to the lecture Methods of Artificial Intelligence. Faculty of Com-
puter Science, West Pomeranian University of Technology, Szczecin, Poland, not pub-lished.
[9] Piegat A.: Fuzzy modeling and control. Springer-Verlag, Heidelberg, New York, 2001.

Nonlinearity of human, decisional multi-criteria 49
[10] Rao C.R.: Linear Models: Least Squares and Alternatives., Rao C.R.(eds), Springer Series in Statistics, 1999.
[11] Rutkowski L.: Metody i techniki sztucznej inteligencji (Methods and techniques of arti-ficial intelligence)
[12] Saaty T.L.: How to make a decision: the analytic hierarchy process. European Journal of Operational Research, vol.48, no1, pp.9-26, 1990.
[13] Saaty T.L.: Decision making with dependence and feedback: the analytic network pro-cess. RWS Publications, Pittsburg, Pennsylvania, 1996.
[14] Saaty T.L., Brady C.: The encyclicon, volume 2: a dictionary of complex decisions us-ing the analytic network process. RWS Publications, Pittsburgh, Pennsylvania, 2009.
[15] Stadnicki J.: Teoria I praktyka rozwiązywania zadań optymalizacji (Theory and practi-ce of solving optimization problems). Wydawnictwo Naukowo Techniczne, Warszawa, 2006.
[16] Zarghami M., Szidarovszky F.: Multicriteria analysis. Springer, Heidelberg, New York, 2011.
[17] Zeleny M.: Compromise programming. In Cochrane J.L., Zeleny M.,(eds). Multiple criteria decision-making. University of South Carolina Press, Columbia, pp. 263-301, 1973.
[18] Zimmermann H.J.: Fuzzy set theory and its applications. Kluwer Academic Publishers, Boston/Dordrecht/London, 1991.


