Embed Size (px)
Citation preview
Normal Macular Thickness Measurements in Healthy Eyes UsingStratus Optical Coherence Tomography
Annie Chan, MD, Jay S. Duker, MD, Tony H. Ko, PhD, James G. Fujimoto, PhD, and Joel S.Schuman, MDNew England Eye Center, Tufts–New England Medical Center, Tufts University School of Medicine,Boston, Mass (Drs Chan and Duker); Department of Electrical Engineering and Computer Scienceand Research Laboratory of Electronics, Massachusetts Institute of Technology, Cambridge (DrsKo and Fujimoto); and University of Pittsburgh Medical Center Eye Center, Department ofOphthalmology, University of Pittsburgh School of Medicine, Pittsburgh, Pa (Dr Schuman).
AbstractObjective— To report normal macular thickness measurements in healthy eyes using the latestcommercially available optical coherence tomography (OCT) mapping software, version 3.0, fromthe Stratus OCT (OCT3).
Methods— Thirty-seven eyes from 37 healthy subjects underwent a complete ophthalmologicexamination, including OCT. Six radial scans, 6 mm in length and centered on the fovea, wereobtained using the OCT3. Retinal thickness was automatically calculated by OCT mapping software.Measurements were displayed as the mean and standard deviation for each of the 9 regions definedin the Early Treatment Diabetic Retinopathy Study.
Results— Foveal thickness (mean thickness in the central 1000-m diameter area) and central fovealthickness (mean thickness at the point of intersection of 6 radial scans) on the OCT3 were 212 ± 20and 182 ± 23 m, respectively. Macular thickness measurements were thinnest at the center of thefovea, thickest within 3-mm diameter of the center, and diminished toward the periphery of themacula. The temporal quadrant was thinner than the nasal quadrant. Central foveal thickness wasalso manually determined as 170 ± 18 m, approximately 12 m less than the value automaticallyobtained from the OCT3 software. There was no correlation between age and foveal thickness (P = .80).
Conclusions— Mean foveal thickness measurements were 38 to 62 m thicker than previouslyreported values, while mean central foveal thickness measurements were 20 to 49 m thicker thanpreviously published values. This discrepancy should be considered when interpreting OCT scans.
INTRODUCTIONMacular edema is a common cause of visual loss. Abnormal fluid accumulation within theretina and a concomitant increase in retinal thickness usually result from the breakdown of theblood-retinal barrier. This process can be found in those with diabetic retinopathy, retinal veinocclusion, uveitis, and other ocular disorders. However, it has been observed repeatedly inclinical practice that the presence of macular edema does not necessarily preclude good vision.1,2 Nussenblatt et al3 were able to demonstrate that the degree of macular thickening, ratherthan the presence of macular edema, is significantly correlated with visual acuity. Traditional
Correspondence: Jay S. Duker, MD, New England Eye Center, Tufts–New England Medical Center, 750 Washington St, Campus Box450, Boston, MA 02111-1533 ([email protected]).Financial Disclosure: Drs Fugimoto and Schuman receive royalties from intellectual property licensed by the Massachusetts Instituteof Technology to Carl Zeiss Meditec.
NIH Public AccessAuthor ManuscriptArch Ophthalmol. Author manuscript; available in PMC 2007 August 9.
Published in final edited form as:Arch Ophthalmol. 2006 February ; 124(2): 193–198.
NIH
-PA Author Manuscript
NIH
-PA Author Manuscript
NIH
-PA Author Manuscript
methods for evaluating macular edema, such as slitlamp biomicroscopy, stereoscopicphotography, and fluorescein angiography, are relatively insensitive to small changes in retinalthickness and are qualitative at best.4 The introduction of optical coherence tomography (OCT)has enabled clinicians to reliably detect and measure small changes in macular thickness andto quantitatively evaluate the efficacy of different therapeutic modalities.5–22
The latest OCT model (Stratus OCT [OCT3]; Carl Zeiss Meditec, Dublin, Calif) was madecommercially available in 2002. It provides a 4-fold increase in imaging speed and betterresolution (axial resolution, <10 m) than earlier generations of the instrument. Based on ourexperience with the OCT3 and previous versions of the system, we observe that the macularthickness measurements for healthy eyes are higher than the values obtained using earlierversions of the instrument, including the prototype OCT. Recently, Frank et al23 comparedmacular thickness measurements from 2 versions of OCT scanners: OCT1 and OCT3. Scanswere acquired from both eyes of 8 consecutive patients with suspected macular edema. Themeasurements from the 2 instruments were statistically different. Therefore, as the OCT3becomes more widely available and used, normative data will be important in interpretingpathological features of the macula.
This study measures and defines normal macular thickness values in healthy eyes using OCT3mapping software. To our knowledge, this is the first study to provide normative macularthickness data for the OCT3 system.
METHODSThe study protocol was approved and monitored by the Human Investigation ReviewCommittee at New England Medical Center. All participants engaged in an informed consentprocess and signed a written consent document before study procedures were carried out.Healthy subjects were examined at New England Eye Center between August 1, 2003, andFebruary 27, 2004. All subjects underwent a complete ophthalmologic examination, includinga medical and family history, best-corrected visual acuity testing with Early Treatment DiabeticRetinopathy Study charts, Humphrey SITA standard 24-2 visual field testing, applanationtonometry, slitlamp biomicroscopy, indirect ophthalmoscopy, and color fundus photography.Optical coherence tomograms were acquired through a dilated pupil by an experienced operatorusing the OCT3 (Carl Zeiss Ophthalmic Systems, Inc, Humphrey Division, Dublin).
Exclusion criteria for healthy eyes included any history or evidence of pathological featuresof the retina, diabetes mellitus or other systemic disease that could affect the eye, glaucoma orfirst-degree relative with glaucoma, intraocular pressure higher than 21 mm Hg, abnormalvisual fields, intraocular surgery or laser therapy (although refractive surgery >1 year beforeenrollment was acceptable), best-corrected visual acuity worse than 20/32, and refractive errorgreater than 6.00 or less than −6.0 diopters.
The macular thickness map scan protocol on the OCT3 was used to obtain 6 consecutivemacular scans, 6 mm in length, centered on the fovea, at equally spaced angular orientations.The cross-sectional images were analyzed using OCT3 mapping software that used an edgedetection technique to locate the strongest 2 edges in each tomogram, presumed to be at thevitreoretinal interface and the anterior surface of the retinal pigment epithelial–choriocapillarisregion. Retinal thickness was measured as the distance between these 2 interfaces at eachmeasurement point along the scan’s x-axis. Bilinear interpolation in polar coordinates was usedto estimate the thickness of the wedges between each consecutive OCT scan.
We selected the retinal map analysis protocol on the OCT3 to reconstruct a surface map as afalse-color topographic image displayed with numeric averages of the measurements for eachof the 9 map sectors as defined by the Early Treatment Diabetic Retinopathy Study.24 The
Chan et al. Page 2
Arch Ophthalmol. Author manuscript; available in PMC 2007 August 9.
NIH
-PA Author Manuscript
NIH
-PA Author Manuscript
NIH
-PA Author Manuscript
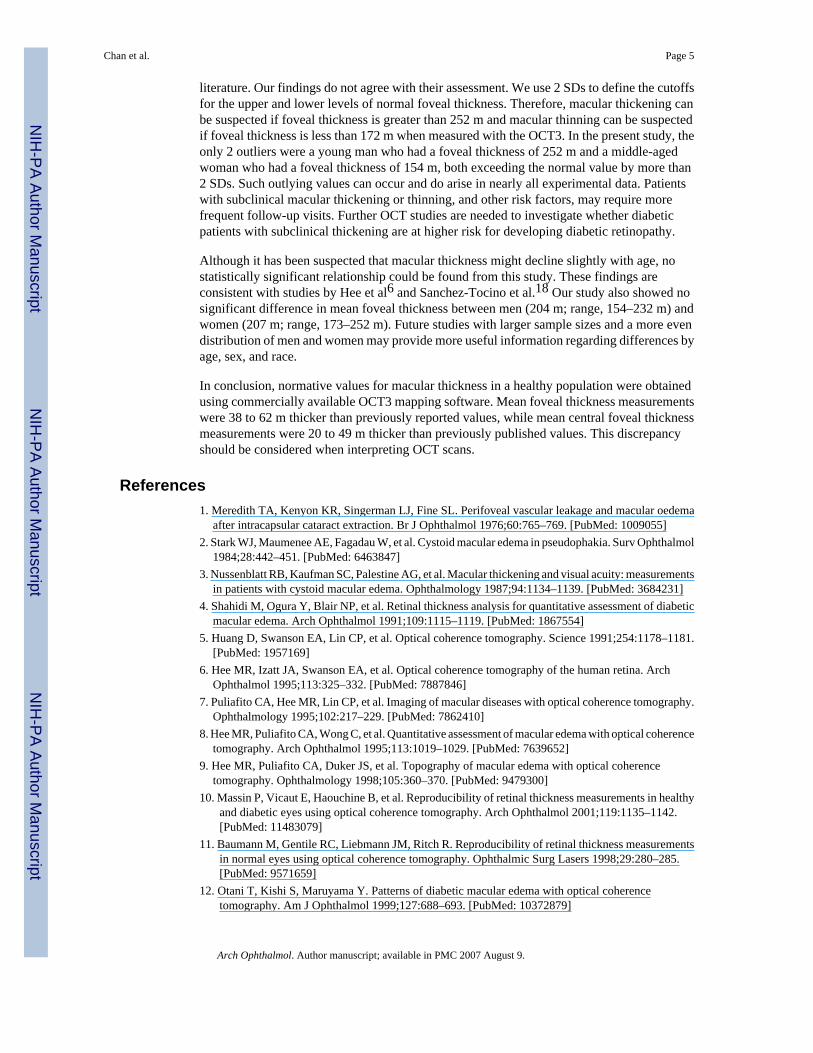
inner and outer rings were segmented into 4 quadrants, with radii of 1.5 and 3 mm, respectively.Foveal thickness was defined as the average thickness in the central 1000-m diameter of theEarly Treatment Diabetic Retinopathy Study layout (Figure 1A). Central foveal thickness wasdefined as the mean thickness at the point of intersection of the 6 radial scans (Figure 1B).
In addition, the OCT3 mapping software was used to manually locate the minimum value alongeach radial scan using the raw data. All 6 values were averaged to determine the mean centralfoveal thickness for each subject. The manually determined central foveal thicknessmeasurements were compared with the values generated by the software, corresponding to thebox labeled “Center” on the OCT3 patient printout.
The relationship between foveal thickness and age was investigated using linear regressionanalysis. Statistical analysis was performed with a commercially available software program(SPSS 11.0.1; SPSS Inc, Chicago, 1ll).
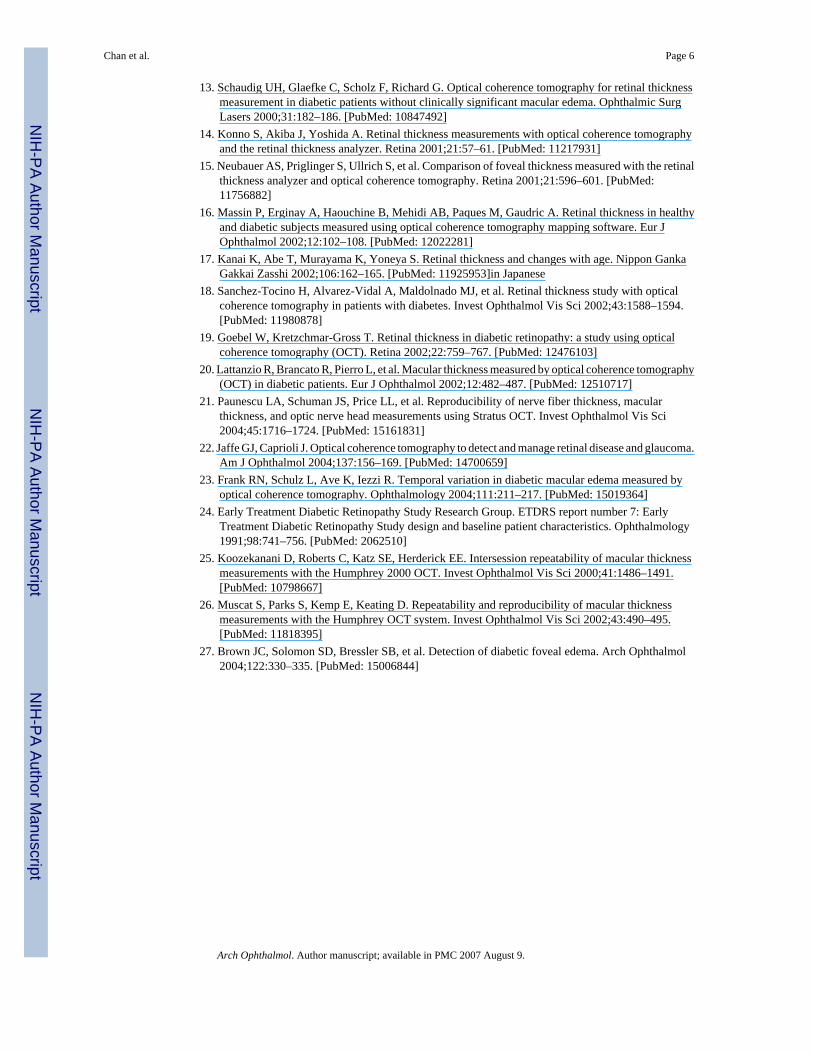
RESULTSThirty-seven healthy eyes from 37 healthy subjects were examined clinically and by the OCT3.The patients were aged 22 to 71 years (median, 43 years). There were 26 women (70%) and11 men (30%). The mean and standard deviation retinal thickness by sector are shown in Figure2 and Table 1. The foveal thickness never exceeded 252 m in any of the healthy eyes. Asexpected, macular thickness was thinnest at the center, thickest within 3-mm diameter of thecenter, and diminished toward the periphery of the macula. The temporal quadrant was thinnerthan the nasal quadrant. The superior and nasal quadrants were thickest overall. In this study,the inner nasal sector was thickest in 29 patients (78%), the inner inferior sector was thickestin 6 patients (16%), the outer superior sector was thickest in 1 patient (3%), and the innersuperior sector was thickest in 1 patient (3%).
The standard deviation of the mean thickness of each sector outside the central 1000-m diameterwas consistently approximately 15 m, demonstrating little variability in thicknessmeasurements by OCT3. The SDs of 20 and 23 m for mean foveal thickness and mean centralfoveal thickness, respectively, were slightly larger. The standard deviation of the 6 centralmacular measurements provided a simple estimate of the measurement reproducibility for agiven patient. The average of this reproducibility was 11 m. The mean ± SD central fovealthickness was manually measured as 170 ± 18 m, approximately 12 m less than the valueautomatically obtained from the OCT3 software.
By using linear regression analysis, we found no relationship between age and foveal thicknesswithin the central 1000-m diameter (P = .80) (Figure 3).
A summary of previous studies that have measured retinal thickness in healthy eyes using OCTis shown in Table 2 for comparison with this study.
COMMENTOptical coherence tomography has emerged as a useful imaging technique by providing newhigh-resolution cross-sectional information about various pathological features of the macula.5–7 It allows clinicians to quantitatively measure retinal thickness in a reliable and highlyreproducible manner.10,11,21, 25,26 The introduction of the commercial OCT3 in 2002provided faster imaging speed and better visualization of intraretinal morphological featurescompared with earlier versions of the instrument. Although there are several articles8,9,11–20 that report normative data for the prototype OCT, OCT1, and OCT2, to our knowledge,such data for OCT3 have been published in only 1 other article.21 That study had a samplesize of 10 and characterized the reproducibility of OCT3 measurements.
Chan et al. Page 3
Arch Ophthalmol. Author manuscript; available in PMC 2007 August 9.
NIH
-PA Author Manuscript
NIH
-PA Author Manuscript
NIH
-PA Author Manuscript
Our results are different from previously published values obtained using earlier versions ofthe device. In our study, the mean ± SD foveal thickness (average thickness in the central 1000-m diameter area) was 212 ± 20 m, approximately 38 to 62 m thicker than previously reportedvalues. The mean ± SD central foveal thickness (average thickness at the point of intersectionof 6 radial scans) was automatically determined to be 182 ± 23 m, approximately 29 to 49 mthicker than previously published values. Clinicians should be aware of these discrepancieswhen interpreting OCT images from different OCT models. These discrepancies may be adirect result of the greater resolution achieved by the more recent OCT systems. Less movementby the patient because of faster scanning times and more refined algorithms have allowed betterimage quality. We found that the thickness measurements in the 4 peripheral outer quadrantson the OCT3 were thinner than those reported in the literature. This may reflect the differencein scan length between the OCT3 and previous versions of the instrument. The OCT3 uses ascan length of 6 mm, whereas the OCT1, which was based on the prototype, used a scan lengthof 4.5 mm. As a result, the OCT3 scans more peripheral regions of the retina that areanatomically thinner. The 4 outermost zones measured by the OCT3 are thinnest, as expectedfrom histological examination of the eye. In previous reports,9,16 the superior and inferiorquadrants were thickest, presumably from the superior and inferior arcuate bundling of thenerve fibers. Our findings show that the superior and nasal quadrants were thickest. Weidentified the nasal quadrant as the thickest region within the central 3-mm diameter. This isconsistent with the anatomical relationship of the converging of nerve fibers with the opticdisc.
Most of the OCT studies6,8,11–15,17–20 in the literature report central foveal thickness only.Investigators have shown that central foveal thickness is significantly correlated with best-corrected visual acuity in healthy and diabetic eyes. However, foveal thickness may be moreindicative of changes in the macula than central foveal thickness for several reasons. Fovealthickness is determined from many more data points than central foveal thickness. For example,each radial scan on the OCT3 is composed of a sequence of 512 A-scans. The macular thicknessmap scan protocol uses 6 radial scans per individual. Within the central 1000-m diameter area,foveal thickness is determined from 512 data points, whereas central foveal thickness isdetermined from only 6 data points. In addition, we were able to manually measure the centralfoveal thickness from the raw data and compare this value with the computer output. We foundthe mean ± SD central foveal thickness to be 170 ± 18 m, approximately 12 m less than thevalue automatically obtained from the OCT3 software. This may reflect the difference inapproach between the manual method and the automatic method of the OCT3 mappingsoftware. The software automatically determined the mean and standard deviation thicknessfor the center point where all 6 scans intersected, whereas we manually located the minimumpoint on each separate radial scan and averaged those values. If the OCT scans were notperfectly centered on the patient’s fixation point for all 6 scans, the point of intersection wouldnot correspond to the center exactly (Figure 4). This may give falsely elevated values. Giventhat the awake human eye is in constant motion, the minimum point for each radial scan willvirtually never converge at the center, despite faster OCT3 scanning speeds. Because the centralpoint is the smallest area of measurement, it will be most affected by tiny eye movements,followed by the central foveal zone. As a result, the standard deviation for central fovealthickness is the largest. Consequently, foveal thickness may be a more practical and reliableindicator than central foveal thickness for changes in the macula. We believe future OCTstudies should report foveal thickness, in addition to central foveal thickness, in the evaluationof the efficacy of different therapies for macular edema.
Recently, Brown et al27 directly compared the clinical gold standard for the detection ofmacular edema (contact lens biomicroscopy) with the OCT3 for the detection of diabetic fovealedema. Because of the lack of normative data on the OCT3, the study suggested that the cutofffor the upper level of normal foveal thickness be 200 m, based on their analysis of the existing
Chan et al. Page 4
Arch Ophthalmol. Author manuscript; available in PMC 2007 August 9.
NIH
-PA Author Manuscript
NIH
-PA Author Manuscript
NIH
-PA Author Manuscript
literature. Our findings do not agree with their assessment. We use 2 SDs to define the cutoffsfor the upper and lower levels of normal foveal thickness. Therefore, macular thickening canbe suspected if foveal thickness is greater than 252 m and macular thinning can be suspectedif foveal thickness is less than 172 m when measured with the OCT3. In the present study, theonly 2 outliers were a young man who had a foveal thickness of 252 m and a middle-agedwoman who had a foveal thickness of 154 m, both exceeding the normal value by more than2 SDs. Such outlying values can occur and do arise in nearly all experimental data. Patientswith subclinical macular thickening or thinning, and other risk factors, may require morefrequent follow-up visits. Further OCT studies are needed to investigate whether diabeticpatients with subclinical thickening are at higher risk for developing diabetic retinopathy.
Although it has been suspected that macular thickness might decline slightly with age, nostatistically significant relationship could be found from this study. These findings areconsistent with studies by Hee et al6 and Sanchez-Tocino et al.18 Our study also showed nosignificant difference in mean foveal thickness between men (204 m; range, 154–232 m) andwomen (207 m; range, 173–252 m). Future studies with larger sample sizes and a more evendistribution of men and women may provide more useful information regarding differences byage, sex, and race.
In conclusion, normative values for macular thickness in a healthy population were obtainedusing commercially available OCT3 mapping software. Mean foveal thickness measurementswere 38 to 62 m thicker than previously reported values, while mean central foveal thicknessmeasurements were 20 to 49 m thicker than previously published values. This discrepancyshould be considered when interpreting OCT scans.
References1. Meredith TA, Kenyon KR, Singerman LJ, Fine SL. Perifoveal vascular leakage and macular oedema
after intracapsular cataract extraction. Br J Ophthalmol 1976;60:765–769. [PubMed: 1009055]2. Stark WJ, Maumenee AE, Fagadau W, et al. Cystoid macular edema in pseudophakia. Surv Ophthalmol
1984;28:442–451. [PubMed: 6463847]3. Nussenblatt RB, Kaufman SC, Palestine AG, et al. Macular thickening and visual acuity: measurements
in patients with cystoid macular edema. Ophthalmology 1987;94:1134–1139. [PubMed: 3684231]4. Shahidi M, Ogura Y, Blair NP, et al. Retinal thickness analysis for quantitative assessment of diabetic
macular edema. Arch Ophthalmol 1991;109:1115–1119. [PubMed: 1867554]5. Huang D, Swanson EA, Lin CP, et al. Optical coherence tomography. Science 1991;254:1178–1181.
[PubMed: 1957169]6. Hee MR, Izatt JA, Swanson EA, et al. Optical coherence tomography of the human retina. Arch
Ophthalmol 1995;113:325–332. [PubMed: 7887846]7. Puliafito CA, Hee MR, Lin CP, et al. Imaging of macular diseases with optical coherence tomography.
Ophthalmology 1995;102:217–229. [PubMed: 7862410]8. Hee MR, Puliafito CA, Wong C, et al. Quantitative assessment of macular edema with optical coherence
tomography. Arch Ophthalmol 1995;113:1019–1029. [PubMed: 7639652]9. Hee MR, Puliafito CA, Duker JS, et al. Topography of macular edema with optical coherence
tomography. Ophthalmology 1998;105:360–370. [PubMed: 9479300]10. Massin P, Vicaut E, Haouchine B, et al. Reproducibility of retinal thickness measurements in healthy
and diabetic eyes using optical coherence tomography. Arch Ophthalmol 2001;119:1135–1142.[PubMed: 11483079]
11. Baumann M, Gentile RC, Liebmann JM, Ritch R. Reproducibility of retinal thickness measurementsin normal eyes using optical coherence tomography. Ophthalmic Surg Lasers 1998;29:280–285.[PubMed: 9571659]
12. Otani T, Kishi S, Maruyama Y. Patterns of diabetic macular edema with optical coherencetomography. Am J Ophthalmol 1999;127:688–693. [PubMed: 10372879]
Chan et al. Page 5
Arch Ophthalmol. Author manuscript; available in PMC 2007 August 9.
NIH
-PA Author Manuscript
NIH
-PA Author Manuscript
NIH
-PA Author Manuscript
13. Schaudig UH, Glaefke C, Scholz F, Richard G. Optical coherence tomography for retinal thicknessmeasurement in diabetic patients without clinically significant macular edema. Ophthalmic SurgLasers 2000;31:182–186. [PubMed: 10847492]
14. Konno S, Akiba J, Yoshida A. Retinal thickness measurements with optical coherence tomographyand the retinal thickness analyzer. Retina 2001;21:57–61. [PubMed: 11217931]
15. Neubauer AS, Priglinger S, Ullrich S, et al. Comparison of foveal thickness measured with the retinalthickness analyzer and optical coherence tomography. Retina 2001;21:596–601. [PubMed:11756882]
16. Massin P, Erginay A, Haouchine B, Mehidi AB, Paques M, Gaudric A. Retinal thickness in healthyand diabetic subjects measured using optical coherence tomography mapping software. Eur JOphthalmol 2002;12:102–108. [PubMed: 12022281]
17. Kanai K, Abe T, Murayama K, Yoneya S. Retinal thickness and changes with age. Nippon GankaGakkai Zasshi 2002;106:162–165. [PubMed: 11925953]in Japanese
18. Sanchez-Tocino H, Alvarez-Vidal A, Maldolnado MJ, et al. Retinal thickness study with opticalcoherence tomography in patients with diabetes. Invest Ophthalmol Vis Sci 2002;43:1588–1594.[PubMed: 11980878]
19. Goebel W, Kretzchmar-Gross T. Retinal thickness in diabetic retinopathy: a study using opticalcoherence tomography (OCT). Retina 2002;22:759–767. [PubMed: 12476103]
20. Lattanzio R, Brancato R, Pierro L, et al. Macular thickness measured by optical coherence tomography(OCT) in diabetic patients. Eur J Ophthalmol 2002;12:482–487. [PubMed: 12510717]
21. Paunescu LA, Schuman JS, Price LL, et al. Reproducibility of nerve fiber thickness, macularthickness, and optic nerve head measurements using Stratus OCT. Invest Ophthalmol Vis Sci2004;45:1716–1724. [PubMed: 15161831]
22. Jaffe GJ, Caprioli J. Optical coherence tomography to detect and manage retinal disease and glaucoma.Am J Ophthalmol 2004;137:156–169. [PubMed: 14700659]
23. Frank RN, Schulz L, Ave K, Iezzi R. Temporal variation in diabetic macular edema measured byoptical coherence tomography. Ophthalmology 2004;111:211–217. [PubMed: 15019364]
24. Early Treatment Diabetic Retinopathy Study Research Group. ETDRS report number 7: EarlyTreatment Diabetic Retinopathy Study design and baseline patient characteristics. Ophthalmology1991;98:741–756. [PubMed: 2062510]
25. Koozekanani D, Roberts C, Katz SE, Herderick EE. Intersession repeatability of macular thicknessmeasurements with the Humphrey 2000 OCT. Invest Ophthalmol Vis Sci 2000;41:1486–1491.[PubMed: 10798667]
26. Muscat S, Parks S, Kemp E, Keating D. Repeatability and reproducibility of macular thicknessmeasurements with the Humphrey OCT system. Invest Ophthalmol Vis Sci 2002;43:490–495.[PubMed: 11818395]
27. Brown JC, Solomon SD, Bressler SB, et al. Detection of diabetic foveal edema. Arch Ophthalmol2004;122:330–335. [PubMed: 15006844]
Chan et al. Page 6
Arch Ophthalmol. Author manuscript; available in PMC 2007 August 9.
NIH
-PA Author Manuscript
NIH
-PA Author Manuscript
NIH
-PA Author Manuscript
Figure 1.Foveal thickness (A) and central foveal thickness (B). In A, foveal thickness is defined as themean thickness within the central 1000-m diameter area (the central blue circle on the EarlyTreatment Diabetic Retinopathy Study map). In B, central foveal thickness is defined as themean thickness measured at the point of intersection of the 6 radial scans on optical coherencetomography. The mean foveal thickness is approximately 30 m greater than the mean centralfoveal thickness.
Chan et al. Page 7
Arch Ophthalmol. Author manuscript; available in PMC 2007 August 9.
NIH
-PA Author Manuscript
NIH
-PA Author Manuscript
NIH
-PA Author Manuscript
Figure 2.Macular thickness measurements for a healthy eye population in this study, displayed as themean and standard deviation in 9 regions, as defined in the Early Treatment DiabeticRetinopathy Study (A) and a false-color map for a prototypical healthy eye (B). I indicatesinferior; N, nasal; S, superior; and T, temporal.
Chan et al. Page 8
Arch Ophthalmol. Author manuscript; available in PMC 2007 August 9.
NIH
-PA Author Manuscript
NIH
-PA Author Manuscript
NIH
-PA Author Manuscript
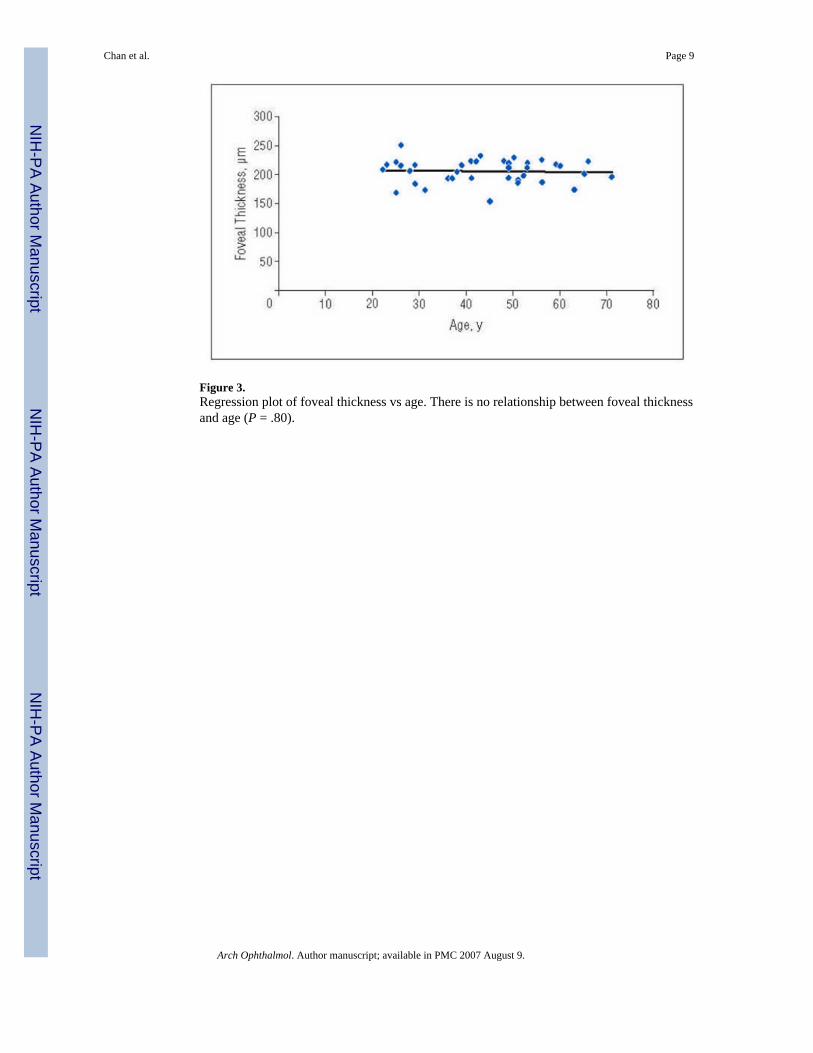
Figure 3.Regression plot of foveal thickness vs age. There is no relationship between foveal thicknessand age (P = .80).
Chan et al. Page 9
Arch Ophthalmol. Author manuscript; available in PMC 2007 August 9.
NIH
-PA Author Manuscript
NIH
-PA Author Manuscript
NIH
-PA Author Manuscript
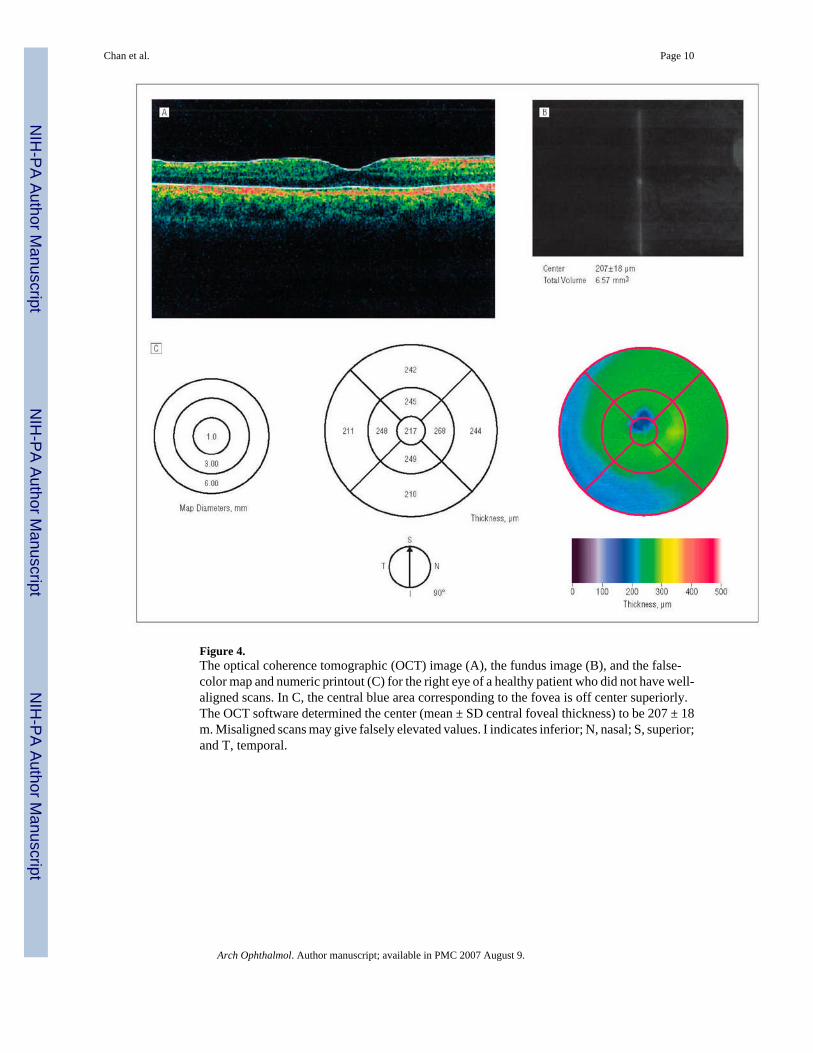
Figure 4.The optical coherence tomographic (OCT) image (A), the fundus image (B), and the false-color map and numeric printout (C) for the right eye of a healthy patient who did not have well-aligned scans. In C, the central blue area corresponding to the fovea is off center superiorly.The OCT software determined the center (mean ± SD central foveal thickness) to be 207 ± 18m. Misaligned scans may give falsely elevated values. I indicates inferior; N, nasal; S, superior;and T, temporal.
Chan et al. Page 10
Arch Ophthalmol. Author manuscript; available in PMC 2007 August 9.
NIH
-PA Author Manuscript
NIH
-PA Author Manuscript
NIH
-PA Author Manuscript

NIH
-PA Author Manuscript
NIH
-PA Author Manuscript
NIH
-PA Author Manuscript
Chan et al. Page 11
Table 1Macular Thickness Measurements in 37 Healthy Eyes Using the OCT3
Region Retinal Thickness in the Healthy Eves, Mean ± SDFovea (500-μm radius) 212±20Center Automatically determined 182 ±23 Manually determined 170 ± 18Inner ring (1.5-mm radius) Superior 255 ± 17 Inferior 260 ±15 Temporal 251 ±13 Nasal 267 ± 16Outer ring (3-mm radius) Superior 239 ± 16 Inferior 210 ± 13 Temporal 210 ± 14 Nasal 246 ± 14Abbreviation: OCT3, Straus optical coherence tomograph.
Arch Ophthalmol. Author manuscript; available in PMC 2007 August 9.

NIH
-PA Author Manuscript
NIH
-PA Author Manuscript
NIH
-PA Author Manuscript
Chan et al. Page 12Ta
ble
2M
acul
ar T
hick
ness
Mea
sure
men
ts in
Hea
lthy
Eyes
Rep
orte
d in
Pre
viou
s Stu
dies
Usi
ng O
CT
Sour
ceN
o. o
f Eve
s Stu
died
Typ
e of
OC
T D
evic
ePr
otoc
ol N
o. o
f Sca
nsFo
veal
Thi
ckne
ss (1
000-
mD
iam
eter
)*C
entr
al F
ovea
l Thi
ckne
ss,
m*
Hee
et a
l,8 199
520
Prot
otyp
e6
NS
147
± 17
Hee
et a
l,9 199
873
Prot
otyp
e6
174
± 18
152
± 21
Bau
man
n et
al,11
199
818
Prot
otyp
e1
NS
154
± 13
Ota
ni e
t al,12
199
910
Com
mer
cial
1N
S13
3 ±
9Sc
haud
ig e
t al,13
200
025
Com
mer
cial
6N
S15
2 ±
17K
onno
et a
l,14 2
001
24C
omm
erci
al2
NS
155
± 20
Neu
baue
r et a
l,15 2
001
21C
omm
erci
al6
NS
154
± 26
Mas
sin
et a
l,16 2
002
60C
omm
erci
al6
170
± 18
146
± 20
Kan
ai e
t al,17
200
247
NS
NS
NS
142
± 15
Sanc
hez-
Toci
no e
t al,18
200
244
Com
mer
cial
6N
S14
5 ±
16G
oebe
l and
Kre
tzch
mar
-Gro
ss,19
200
230
OC
T24
NS
153
± 15
Latta
nzio
et a
l,20 2
002
50N
S3
NS
162
± 13
Paun
escu
et a
l,21 2
004
10O
CT3
620
4 ±
2016
4 ±
21Pr
esen
t stu
dy37
OC
T36
212
± 20
182
± 23
Abb
revi
atio
ns: N
S, d
ata
not s
peci
fied;
OC
T, o
ptic
al c
oher
ence
tom
ogra
phy.
* Dat
a ar
e gi
ven
as m
ean
± SD
.
Arch Ophthalmol. Author manuscript; available in PMC 2007 August 9.


