Embed Size (px)
Citation preview

nternational Handbook of Academic Research and Teaching
ISSN 1940-1868
2011 Proceedings
Published by: Intellectbase International Consortium. Editors: David King, Karina Dyer & Reviewers Task Panel (RTP)
Volume 16

Conference Proceedings Summer 2011
CONFERENCE CO-CHAIRS
Dr. Harrison Hartman Georgia State University, USA
Dr. Anita King University of South Alabama, USA
PROGRAM COMMITTEE
Dr. David King Conference Chair & Editor-in-Chief
Mrs. Karina Dyer
Academic Senior Executive & Chief-Coordinator
Dr. Nitya Karmakar
Curtin University of Technology, Australia
Dr. Gerald Marquis Tennessee State University, USA
Dr. James Ellzy Senior Advisory Board Member
Dr. Norma Ortiz Senior Advisory Board Member
CONFERENCE ORGANIZERS & INTERNATIONAL AFFILIATES
United States Australasia (Oceania) Europe
Ms. Loria Hampton Ms. Anita Medhekar Mr. Kevin Kofi
Mr. Robert Edwards Mr. Graeme William Mr. Benjamin Effa
Ms. Rita Touzel Ms. Michelle Joanne Ms. Christina Maame
Mr. Ben Murray Mrs. Karina Dyer Mr. Kenneth Obeng
www.intellectbase.org
INTELLECTBASE INTERNATIONAL CONSORTIUM Academic Conference, Nashville, TN, USA, May 26-28, 2011
Intellectual Perspectives & Multi-Disciplinary Foundations

6
Published by Intellectbase International Academic Consortium: Intellectbase International Consortium, 1615 Seventh Avenue North, Nashville, TN 37208, USA
ISSN (Print): 1940-1876 --------- Issued by the Library of Congress, Washington DC, USA ISSN (CD-ROM): 1940-1884 --------- Issued by the Library of Congress, Washington DC, USA ISSN (Online): 1940-1868 --------- Issued by the Library of Congress, Washington DC, USA
©2011. This volume is copyright to the Intellectbase International Academic Consortium. Apart from use as permitted under the Copyright Act of 1976, no part may be reproduced by any process without prior written permission.
EXECUTIVE EDITORIAL BOARD (EEB) AND REVIEWERS TASK PANEL (RTP)
Dr. David White Dr. Dennis Taylor
Roosevelt University, USA RMIT University, Australia
Dr. Danka Radulovic Dr. Harrison C. Hartman
University of Belgrade, Serbia University of Georgia, USA
Dr. Sloan T. Letman, III Dr. Sushil Misra
American Intercontinental University, USA Concordia University, Canada
Dr. Jiri Strouhal Dr. Avis Smith
University of Economics-Prague, Czech Republic New York City College of Technology, USA
Dr. Joel Jolayemi Dr. Smaragda Papadopoulou
Tennessee State University, USA University of Ioannina, Greece
Dr. Xuefeng Wang Dr. Burnette Hamil
Taiyun Normal University, China Mississippi State University, USA
Dr. Jeanne Kuhler Dr. Alejandro Flores Castro
Auburn University, USA Universidad de Pacifico, Peru
Dr. Babalola J. Ogunkola Dr. Robert Robertson
Olabisi Onabanjo University, Nigeria Southern Utah University, USA
Dr. Debra Shiflett Dr. Sonal Chawla
American Intercontinental University, USA Panjab University, India
Dr. Cheaseth Seng Ms. Katherine Leslie
RMIT University, Australia Chicago State University, USA
Dr. R. Ivan Blanco Dr. Shikha Vyas-Doorgapersad
Texas State University – San Marcos, USA North-West University, South Africa
Dr. Tahir Husain Dr. James D. Williams
Memorial University of Newfoundland, Canada Kutztown University, USA
Dr. Jifu Wang Dr. Tehmina Khan
University of Houston Victoria, USA RMIT University, Australia
Dr. Janet Forney Dr. Werner Heyns
Piedmont College, USA Savell Bird & Axon, UK
Dr. Adnan Bahour Dr. Mike Thomas
Zagazig University, Egypt Humboldt State University, USA
Dr. Rodney Davis Dr. William Ebomoyi
Troy University, USA Chicago State University, USA
Dr. Mumbi Kariuki Dr. Khalid Alrawi
Nipissing University, Canada Al-Ain University of Science and Technology, UAE
Dr. Mohsen Naser-Tavakolian Dr. Joselina Cheng
San Francisco State University, USA University of Central Oklahoma, USA

EXECUTIVE EDITORIAL BOARD (EEB) AND REVIEWERS TASK PANEL (RTP) (Continued)
Dr. Rafiuddin Ahmed Dr. Natalie Housel
James Cook University, Australia Tennessee State University, USA
Dr. Regina Schaefer Dr. Nitya Karmakar
University of La Verne, USA University of Western Sydney, Australia
Dr. Ademola Olatoye Dr. Anita King
Olabisi Onabanjo University, Nigeria University of South Alabama, USA
Dr. Dana Tesone Dr. Lloyd V. Dempster
University of Central Florida, USA Texas A & M University - Kingsville, USA
Dr. Farhad Simyar Dr. Bijesh Tolia
Chicago State University, USA Chicago State University, USA
Dr. John O'Shaughnessy Dr. John Elson
San Francisco State University, USA National University, USA
Dr. Stephen Kariuki Dr. Demi Chung
Nipissing University, Canada University of Sydney, Australia
Dr. Rose Mary Newton Dr. James (Jim) Robbins
University of Alabama, USA Trinity Washington University, USA
Dr. Mahmoud Al-Dalahmeh Dr. Jeffrey (Jeff) Kim
University of Wollongong, Australia University of Washington, USA
Dr. Shahnawaz Muhammed Dr. Dorothea Gaulden
Fayetteville State University, USA Sensible Solutions, USA
Dr. Brett Sims Dr. Gerald Marquis
Grambling State University, USA Tennessee State University, USA
Dr. Frank Tsui Dr. David Davis
Southern Polytechnic State University, USA The University of West Florida, USA
Dr. John Tures Dr. Peter Ross
LaGrange College, USA Mercer University, USA
Dr. Mary Montgomery Dr. Van Reidhead
Jacksonville State University, USA University of Texas-Pan American, USA
Dr. Frank Cheng Dr. Denise Richardson
Central Michigan University, USA Bluefield State College, USA
Dr. Vera Lim Mei-Lin Dr. Reza Vaghefi
The University of Sydney, Australia University of North Florida, USA
Dr. Robin Latimer Dr. Jeffrey Siekpe
Lamar University, USA Tennessee State University, USA
Dr. Michael Alexander Dr. Greg Gibbs
University of Arkansas at Monticello, USA St. Bonaventure University, USA
Dr. Kehinde Alebiosu Dr. Mike Rippy
Olabisi Onabanjo University, Nigeria Troy University, USA
Dr. Gina Pipoli de Azambuja Dr. Steven Watts
Universidad de Pacifico, Peru Pepperdine University, USA
Dr. Andy Ju An Wang Dr. Ada Anyamene
Southern Polytechnic State University, USA Nnamdi Azikiwe University, Nigeria
Ms. Alison Duggins Dr. Nancy Miller
Vanderbilt University, USA Governors State University, USA

8
EXECUTIVE EDITORIAL BOARD (EEB) AND REVIEWERS TASK PANEL (RTP) (Continued)
Dr. Dobrivoje Radovanovic Dr. David F. Summers
University of Belgrade, Serbia University of Houston-Victoria, USA
Dr. George Romeo Dr. Robert Kitahara
Rowan University, USA Troy University – Southeast Region, USA
Dr. William Root Dr. Brandon Hamilton
Augusta State University, USA Hamilton's Solutions, USA
Dr. Natalie Weathers Dr. William Cheng
Philadelphia University, USA Troy University, USA
Dr. Linwei Niu Dr. Taida Kelly
Claflin University, USA Governors State University, USA
Dr. Nesa L‟Abbe Wu Dr. Denise de la Rosa
Eastern Michigan University, USA Grand Valley State University, USA
Dr. Rena Ellzy Dr. Kimberly Johnson
Tennessee State University, USA Auburn University Montgomery, USA
Dr. Kathleen Quinn Dr. Sameer Vaidya
Louisiana State University, USA Texas Wesleyan University, USA
Dr. Josephine Ebomoyi Dr. Pamela Guimond
Northwestern Memorial Hospital, USA Governors State University, USA
Dr. Douglas Main Dr. Vivian Kirby
Eastern New Mexico University, USA Kennesaw State University, USA
Dr. Sonya Webb Dr. Randall Allen
Montgomery Public Schools, USA Southern Utah University, USA
Dr. Angela Williams Dr. Claudine Jaenichen
Alabama A&M University, USA Chapman University, USA
Dr. Carolyn Spillers Jewell Dr. Richard Dane Holt
Fayetteville State University, USA Eastern New Mexico University, USA
Dr. Kingsley Harbor Dr. Barbara-Leigh Tonelli
Jacksonville State University, USA Coastline Community College, USA
Dr. Chris Myers Dr. William J. Carnes
Texas A & M University – Commerce, USA Metropolitan State College of Denver, USA
Dr. Kevin Barksdale Dr. Faith Anyachebelu
Union University, USA Nnamdi Azikiwe University, Nigeria
Dr. Michael Campbell Dr. Donna Cooner
Florida A&M University, USA Colorado State University, USA
Dr. Thomas Griffin Dr. Kenton Fleming
Nova Southeastern University, USA Southern Polytechnic State University, USA
Dr. James N. Holm Dr. Zoran Ilic
University of Houston-Victoria, USA University of Belgrade, Serbia
Dr. Joan Popkin Dr. Edilberto A. Raynes
Tennessee State University, USA Tennessee State University, USA
Dr. Rhonda Holt Dr. Cerissa Stevenson
New Mexico Christian Children's Home, USA Colorado State University, USA
Dr. Yu-Wen Huang Dr. Donna Stringer
Spalding University, USA University of Houston-Victoria, USA

EXECUTIVE EDITORIAL BOARD (EEB) AND REVIEWERS TASK PANEL (RTP) (Continued)
Dr. Christian V. Fugar Dr. Lesley M. Mace
Dillard University, USA Auburn University Montgomery, USA
Dr. John M. Kagochi Dr. Cynthia Summers
University of Houston-Victoria, USA University of Houston-Victoria, USA
Dr. Yong-Gyo Lee Dr. Rehana Whatley
University of Houston-Victoria, USA Oakwood University, USA
Dr. George Mansour Dr. Jianjun Yin
DeVry College of NY, USA Jackson State University, USA
Dr. Peter Miller Dr. Carolyn S. Payne
Indiana Wesleyan University, USA Nova Southeastern University, USA
Dr. Ted Mitchell Dr. Veronica Paz
University of Nevada, USA Nova Southeastern University, USA
Dr. Alma Mintu-Wimsatt Dr. Terence Perkins
Texas A & M University – Commerce, USA Veterans' Administration, USA
Dr. Liz Mulig Dr. Dev Prasad
University of Houston-Victoria, USA University of Massachusetts Lowell, USA
Dr. Robert R. O'Connell Jr. Dr. Kong-Cheng Wong
JSA Healthcare Corporation, USA Governors State University, USA
Dr. P.N. Okorji Dr. Azene Zenebe
Nnamdi Azikiwe University, Nigeria Bowie State University, USA
Dr. James Ellzy Dr. Sandra Davis
Tennessee State University, USA The University of West Florida, USA
Dr. Padmini Banerjee Dr. Yvonne Ellis
Delaware State University, USA Columbus State University, USA
Dr. Aditi Mitra Dr. Elizabeth Kunnu
University of Colorado, USA Tennessee State University, USA
Dr. Myna German Dr. Brian A. Griffith
Delaware State University, USA Vanderbilt University, USA
Dr. Robin Oatis-Ballew Mr. Corey Teague
Tennessee State University, USA Middle Tennessee State University, USA
Dr. Dirk C. Gibson Dr. Joseph K. Mintah
University of New Mexico, USA Azusa Pacific University, USA
Dr. Susan McGrath-Champ Dr. Raymond R. Fletcher
University of Sydney, Australia Virginia State University, USA
Dr. Bruce Thomas Dr. Yvette Bolen
Athens State University, USA Athens State University, USA
Dr. William Seffens Dr. Svetlana Peltsverger
Clark Atlanta University, USA Southern Polytechnic State University, USA
Dr. Kathy Weldon Dr. Caroline Howard
Lamar University, USA TUI University, USA
Dr. Shahram Amiri Dr. Philip H. Siegel
Stetson University, USA Augusta State University, USA
Dr. Virgil Freeman Dr. William A. Brown
Northwest Missouri State University, USA Jackson State University, USA

10
EXECUTIVE EDITORIAL BOARD (EEB) AND REVIEWERS TASK PANEL (RTP) (Continued)
Dr. Larry K. Bright Dr. M. N. Tripathi
University of South Dakota, USA Xavier Institute of Management – Bhubaneswar, India
Dr. Barbara Mescher Dr. Ronald De Vera Barredo
University of Sydney, Australia Tennessee State University, USA
Dr. Jennifer G. Bailey Dr. Samir T. Ishak
Bowie State University, USA Grand Valley State University, USA
Dr. Julia Williams Dr. Stacie E. Putman-Yoquelet
University of Minnesota Duluth, USA Tennessee State University, USA
Mr. Prawet Ueatrongchit Dr. Curtis C. Howell
University of the Thai Chamber of Commerce, Thailand Georgia Southwestern University, USA
Dr. Stephen Szygenda Dr. E. Kevin Buell
Southern Methodist University, USA Augustana College, USA
Dr. Kiattisak Phongkusolchit Dr. Simon S. Mak
University of Tennessee at Martin, USA Southern Methodist University, USA
Dr. Reza Varjavand Dr. Ibrahim Kargbo
Saint Xavier University, USA Coppin State University, USA
Dr. Stephynie C. Perkins Mrs. Donnette Bagot-Allen
University of North Florida, USA Judy Piece – Monteserrat, USA
Dr. Robert Robertson Dr. Michael D. Jones
Saint Leo University, USA Kirkwood Community College, USA
Dr. Kim Riordan Dr. Eileen J. Colon
University of Minnesota Duluth, USA Western Carolina University, USA
Mrs. Patcharee Chantanabubpha Mr. Jeff Eyanson
University of the Thai Chamber of Commerce, Thailand Azusa Pacific University, USA
Dr. Neslon C. Modeste Dr. Eleni Coukos Elder
Tennessee State University, USA Tennessee State University, USA
Mr. Wayne Brown Dr. Brian Heshizer
Florida Institute of Technology, USA Georgia Southwestern University, USA
Dr. Tina Y. Cardenas Dr. Thomas K. Vogel
Paine College, USA Stetson University, USA
Dr. Ramprasad Unni Dr. Hisham M. Haddad
Portland State University, USA Kennesaw State University, USA
Dr. Thomas Dence
Ashland University, USA
Intellectbase International Consortium and the Conference Program Committee express their sincere thanks to the following sponsors:
The Ellzy Foundation
Tennessee State University (TSU)
The King Foundation
International Institute of Academic Research (IIAR)

i
PREFACE
Intellectbase International Consortium (IIC) is a professional and academic organization dedicated to advancing and encouraging quantitative and qualitative, including hybrid and triangulation, research practices. This volume contains articles presented at the Summer 2011 conference in Nashville, TN – USA from May 26-28, 2011. The conference provides an open forum for Academics, Scientists, Researchers, Engineers and Practitioners from a wide range of research disciplines. It is the sixteenth (16) Volume produced in a unique, peer-reviewed intellectual perspectives and multi-disciplinary foundation format (See back cover of the proceedings). Intellectbase International Consortium is responsible for publishing innovative and refereed research work on the following hard and soft systems related themes – Business, Education, Science, Technology, Multimedia, Arts, Political and Social (BESTMAPS). The scope of the proceeding (International Handbook of Academic Research & Teaching) is: literature reviews, data collection and analysis, methodology selection, data evaluation, research design and development, hypothesis-based creativity and reliable data interpretation. The theme of the proceeding is related to pedagogy, research methodologies, organizational ethics, accounting, management, leadership, marketing, economics, administration, policy and political issues, health-care systems, engineering, multimedia, music, arts, social psychology, eBusiness, technology and information science. Intellectbase International Consortium promotes broader intellectual resources and exchange of ideas among global research professionals through a collaborative process. To accomplish research collaboration, knowledge sharing and transfer, Intellectbase is dedicated to publishing a range of refereed academic Journals, book chapters and conference proceedings, as well as sponsoring several annual academic conferences globally.
Senior, Middle and Junior level scholars are invited to participate and contribute one or several article(s) to the Intellectbase International conferences. Intellectbase welcomes and encourages the active participation of all researchers seeking to broaden their horizons and share experiences on new research challenges, research findings and state-of-the-art solutions.
SCOPE & MISSION
Build and stimulate intellectual interrelationships among individuals and institutions who have interest in the research discipline.
Promote the collaboration of a diverse group of intellectuals and professionals worldwide.
Bring together researchers, practitioners, academicians, and scientists across research disciplines globally - Australia, Europe, Africa, North America, South America and Asia.
Support governmental, organizational and professional research that will enhance the overall knowledge, innovation and creativity.
Present resources and incentives to existing and new-coming scholars who are or planning to become effective researchers or experts in a global research setting.
Promote and publish professional and scholarly journals, handbook, book chapters and other forms of refereed publications in diversified research disciplines.
Plan, organize, promote, and present educational prospects - conferences, workshops, colloquiums, conventions — for global researchers.

ii
LIST OF AUTHORS
First Name Last Name Institution Country
Jonathan Abramson Colorado Technical University USA
Prince G. Adu University of Nebraska at Omaha USA
David Allbright Eastern Michigan University USA
Khalid Alrawi American University in the Emirates UAE
Waleed Alrawi Al-Khawarismi International College UAE
Megan Anderson Marylhurst University USA
Christon G. Arthur Andrews University USA
Adnan Bahour Tennessee State University USA
Ronald De Vera Barredo Tennessee State University USA
Kimberly F. Bazemore Elizabeth City State University USA
Dustin Bessette Marylhurst University USA
Krishna Bista Arkansas State University USA
Yvette Bolen Athens State University USA
Jacques L. Bonenfant Florida Memorial University USA
Thomas M. Brinthaupt Middle Tennessee State University USA
Darrell Norman Burrell Virginia International University A.T. Still University Marylhurst University
USA USA USA
Howard Cochran Belmont University USA
Betty Cox The University of Tennessee at Martin USA
Anita S. Craig University of Michigan Hospital USA
Mayble E. Craig Howard University Hospital USA
Miguel Angel Crespo Norwich University USA
Maurice Eugene Dawson Jr. Alabama A &M University Morgan State University Capella University
USA USA USA
Corey Dickens Morgan State University USA

iii
LIST OF AUTHORS (CONTINUED)
First Name Last Name Institution Country
Amy Dorsey Delaware State University USA
William Emanuel Morgan State University USA
Ginny Esch The University of Tennessee at Martin USA
Chris Fairchild Nova Southeastern University USA
Neil T. Faulk McNeese State University USA
Aikyna Finch Strayer University USA
Joann Fisher Nova Southeastern University USA
Barbara K. Fralinger Delaware State University USA
Carl J. Franklin Southern Utah University USA
Virgil Freeman Northwest Missouri State University USA
Reza Shafiezadehgarousi Islamic Azad University - Saveh Branch Iran
Catherine Glascock East Tennessee State University USA
Donald W. Good East Tennessee State University USA
Nate Goodman Tennessee State University USA
Marquael Green Tennessee State University USA
Bonnie S. Guy Appalachian State University USA
Kathleen M. Hargiss Colorado Technical University USA
Harrison C. Hartman Georgia State University USA
Jackie Hester Buckhorn Middle School USA
David S. Hood North Carolina Central University USA
Lisa Hyde Athens State University USA
Stephen A. Idem Tennessee Technological University USA
William C. Ingram Lipscomb University USA
Ravi Jain University of Massachusetts Lowell USA
Lamar Jones Tennessee State University USA
iv
LIST OF AUTHORS (CONTINUED)
First Name Last Name Institution Country
Phyllis Kariuki Morgan State University USA
Matthew Kaufman Nova Southeastern University USA
Anita H. King University of South Alabama USA
Robert Kitahara Troy University USA
Jasmin Hyunju Kwon Middle Tennessee State University USA
Joshua Lepselter Tennessee State University USA
Imran Mahmud International University of Business Agriculture and Technology Bangladesh
John Mankelwicz Troy University USA
Eric Martin Austin Peay State University USA
Peter K. Miller Indiana Wesleyan University USA
Michael J. Montgomery Tennessee State University USA
Md. Fazle Munim Jahangirnagar University Bangladesh
Chinyere Ogbonna Austin Peay State University USA
Festus O. Olorunniwo Tennessee State University USA
Festus Onyegbula Colorado Technical University USA
Oludare A. Owolabi Morgan State University USA
Yana Parfenyuk Deloitte & Touche LLP USA
J. Byron Pennington Tennessee State University USA
Ashley Pierre Colorado Technical University USA
Jerry Plummer Austin Peay State University USA
Ronald L. Poulson Elizabeth City State University USA
Dev Prasad University of Massachusetts Lowell USA
Emad Rahim Walden University Kaplan University Morrisville State College
USA USA USA
Joshua Robinson Morgan State University USA

v
LIST OF AUTHORS (CONTINUED)
First Name Last Name Institution Country
Sandra Scheick Tennessee State University USA
Robert O. Seale Colorado Technical University USA
Karthik Silaipillayarputhur Kordsa Global USA
Brett A. Sims Borough of Manhattan Community College USA
Phyllis Skorga Arkansas State University- Jonesboro USA
Joy T. Smith Elizabeth City State University USA
Jeffery Stevens Colorado Technical University Workforce Solutions Company
USA USA
Bruce Thomas Athens State University USA
Brittny Lynn Thompson Morgan State University USA
Reza Varjavand Saint Xavier University USA
Milton A. Walters Sr. Argosy University USA
Kerry W. Ward University of Nebraska at Omaha USA
Frederick Westfall Troy University USA
John Wrieden Florida International University USA
Nesa L‘abbe Wu Eastern Michigan University USA
Charles Keith Young Northeast State Technical Community College USA
vi
LIST OF INSTITUTIONS, STATES AND COUNTRIES
Institution State Country
A. T. Still University AZ USA
Alabama A &M University AL USA
Al-Khawarismi International College UAE
American Intercontinental University IL USA
American University in the Emirates UAE
Andrews University MI USA
Appalachian State University NC USA
Argosy University NY USA
Arkansas State University AK USA
Arkansas State University- Jonesboro AK USA
Athens State University AL USA
Austin Peay State University TN USA
Belmont University TN USA
Borough of Manhattan Community College NY USA
Buckhorn Middle School AL USA
Capella University MN USA
Colorado Technical University CO USA
Workforce Solutions Company CO USA
Delaware State University DE USA
Deloitte & Touche LLP MI USA
East Tennessee State University TN USA
Eastern Michigan University MI USA
Elizabeth City State University NC USA
Florida Memorial University FL USA
Georgia State University GA USA
Howard University Hospital MI USA
Indiana Wesleyan University IN USA
International University of Business Agriculture and Technology Bangladesh
Islamic Azad University - Saveh Branch Iran

vii
LIST OF INSTITUTIONS, STATES AND COUNTRIES (CONTINUED)
Institution State Country
Jahangirnagar University Bangladesh
Kaplan University IA USA
Kordsa Global TN USA
Lipscomb University TN USA
Marylhurst University OR USA
McNeese State University LA USA
Middle Tennessee State University TN USA
Morgan State University MD USA
Morrisville State College NY USA
North Carolina Central University NC USA
Northeast State Technical Community College TN USA
Northwest Missouri State University MO USA
Norwich University VT USA
Nova Southeastern University FL USA
Saint Xavier University IL USA
Southern Utah University UT USA
Strayer University VA USA
Tennessee State University TN USA
Tennessee Technological University TN USA
The University of Tennessee at Martin TN USA
Troy University FL USA
University of Massachusetts Lowell MA USA
University of Michigan Hospital MI USA
University of Nebraska at Omaha NE USA
University of South Alabama AL USA
Virginia International University VA USA
Walden University MN USA
A Commitment to Academic Excellence.
www.intellectbase.org
INTELLECTUAL
PERSPECTIVES &
MULTI-DISCIPLINARY
FOUNDATIONS
EDUCATION
BUSINESS
SOCIAL
POLITICAL
ARTS
MULTIMEDIA
TECHNOLOGY
SCIENCE
B E S T M A P S
INTELLECTBASE INTERNATIONAL CONSORTIUM Intellectual Perspectives & Multi-Disciplinary Foundations

TABLE OF CONTENT
LIST OF AUTHORS ............................................................................................................................................. II
LIST OF INSTITUTIONS, STATES AND COUNTRIES ...................................................................................... VI
SECTION 1: EDUCATION, SOCIAL & ADMINISTRATION
Addressing Academic Integrity with New Technology: Can it be Done? Robert Kitahara, John Mankelwicz and Frederick Westfall .............................................................................................................. 1
Knowledge Management for E-learning: Productive Work and Learning Coverage Khalid Alrawi and Waleed Alrawi ................................................................................................................................................... 14
The Value of Using Micro Teaching as a Tool to Develop Instructors Joann Fisher and Darrell Norman Burrell ...................................................................................................................................... 21
Using a Mentor-Based Progressive Sales Project in a Professional Selling Course Bonnie S. Guy ................................................................................................................................................................................ 27
MindMap: A Powerful Tool to Improve Academic Reading, Presentation and Research Performance Md. Fazle Munim and Imran Mahmud ........................................................................................................................................... 36
The Dilemma of Licensing Alternatives and Reciprocities for Teachers and Administrators Ginny Esch and Betty Cox ............................................................................................................................................................. 41
Education Leadership: Exploring Personality Styles: DISC ―High I‖ and Colors Virgil Freeman ................................................................................................................................................................................ 46
Multifaceted Assessment of Adult Learning Styles and Technology-Driven Learning for Online Students Aikyna Finch, Emad Rahim and Darrell Norman Burrell ................................................................................................................ 49
The Use of Case Studies, Videos, New Teaching Approaches, and Storytelling in Classroom Teaching to Improve the Learning Experiences for Millennial Graduate Students
Darrell Norman Burrell, Aikyna Finch, Maurice Eugene Dawson Jr. and Joann Fisher ................................................................. 58
Perceptions of Arizona and New Mexico Public School Superintendents Regarding Online Teacher Education Courses Neil Faulk ....................................................................................................................................................................................... 62
The Cross-Cultural Effects of Rescaling Verbal and Numeric Rating Scales Using Correspondence Analysis Chris Fairchild ................................................................................................................................................................................ 67
Linguistic Link between Haitian-Creole and English Jacques L. Bonenfant .................................................................................................................................................................... 75
Famous Last Works: Mortality and Music in the Final Chorales Johannes Brahms und die Elf Chorale Vorspiele Peter K. Miller ................................................................................................................................................................................ 78
Building a Greener School with LEED Certification Virgil Freeman and Jeff Klein ......................................................................................................................................................... 95
The Impact of Gender on Preferences for Transactional Versus Transformational Professorial Leadership Styles: An Empirical Analysis
Ronald L. Poulson, Joy T. Smith, David S. Hood, Christon G. Arthur and Kimberly F. Bazemore ................................................ 98
Development and Management of Urban and Rural Infrastructures in Osun State, Nigeria: Roads, Drainage, Water, Etc. Oludare A. Owolabi ...................................................................................................................................................................... 107
The Correlation between Campaign Contributions and Legislation Authored in the Tennessee General Assembly Chinyere Ogbonna and Eric Martin .............................................................................................................................................. 114
Addressing the Lack of Minority Woman in Senior Leadership Positions in the Federal Government Brittny Lynn Thompson, Maurice Eugene Dawson Jr. and Darrell Norman Burrell ..................................................................... 131
Perceptions of Bullying a in Newly Built, Spacious School Facility Jackie Hester, Yvette Bolen, Lisa Hyde and Bruce Thomas ........................................................................................................ 133
Alert for New Professors: Classroom Management Considerations David Allbright .............................................................................................................................................................................. 136
Utilization of Open Source Software (OSS) Tools to Alleviate a Project‘s Cost Joshua Robinson and Maurice Eugene Dawson Jr. .................................................................................................................... 138
Time Management Practices Across All College Students‘ Classifications – Impact on Persistence J. Byron Pennington, Festus O. Olorunniwo and Michael J. Montgomery ................................................................................... 140
The Integration of Fashion and Culture in an Apparel Design and Merchandising Course Jasmin Hyunju Kwon and Thomas M. Brinthaupt ........................................................................................................................ 141
Silence in Teaching and Learning: Perceptions of Foreign Students in American Classroom Krishna Bista ................................................................................................................................................................................ 142

SECTION 2: BUSINESS & MANAGEMENT
Default Externalities – Is There an Optimal Quantity of Defaults? Harrison C. Hartman .................................................................................................................................................................... 144
The Empowerment, Ongoing Limits and Consequences in Financial Services Reza Shafiezadehgarousi ............................................................................................................................................................ 153
Pride Versus Profit, Can Capitalism Solve Our Socioeconomic Problems? Reza Varjavand ........................................................................................................................................................................... 167
Vital Collaboratives, Alliances and Partnerships: A Search for Key Elements of an Effective Public-Private Partnership Charles Keith Young, Donald W. Good and Catherine Glascock ................................................................................................ 174
A Quantitative Analysis of the Public Administrator‘s Likely Use of Eminent Domain after Kelo Carl J. Franklin ............................................................................................................................................................................. 181
Leaning the Work Place and Change Management: Some Successful Case Implementations Nesa L‘abbe Wu, Yana Parfenyuk, Anita S. Craig and Mayble E. Craig ..................................................................................... 189
Applying Traditional Risk Assessment Models to Information Assurance: A New Domain Not a New Paradigm Prince G. Adu and Kerry W. Ward ............................................................................................................................................... 203
Country vs. Industry Effect on Board Structures Ravi Jain and Dev Prasad ........................................................................................................................................................... 209
The Impact Human Resources has on Strategic Planning Matthew Kaufman ........................................................................................................................................................................ 216
The Bigger the Carrot: Cognizant Compensation for Effective Human Resource Management Milton A. Walters, Sr. ................................................................................................................................................................... 226
Viable Frameworks of Effective Organizational Planning and Sustainability Strategic Planning Approaches at U.S. Universities Darrell Norman Burrell, Megan Anderson and Dustin Bessette ................................................................................................... 229
Snapshot of the Global Wine Market Matthew Kaufman ........................................................................................................................................................................ 240
Where do Millennials stand on the Market System? William C. Ingram ......................................................................................................................................................................... 246
Leading Business Intelligence Initiatives Jonathan Abramson, Ashley Pierre and Jeffery Stevens ............................................................................................................. 247
How Economic Theory may Explain Frequency Collision Avoidance Behaviour among High Frequency International Broadcasters Jerry Plummer and Howard Cochran........................................................................................................................................... 248
Utilizing Project Management Tools to Improve Project Performance in Africa Phyllis Kariuki ............................................................................................................................................................................... 249
Dismantling Barriers to the Free Flow of Commerce in the European Union: A Prescription for Political Failure John Wrieden ............................................................................................................................................................................... 251

SECTION 3: SCIENCE & TECHNOLOGY
Late Intake Valve Closing and Early Exhaust Valve Opening in a Four Stroke Spark Ignition Engine Stephen A. Idem and Karthik Silaipillayarputhur .......................................................................................................................... 253
A Case for Intelligent Mobile Agent Computer Network Defense Robert O. Seale and Kathleen M. Hargiss ................................................................................................................................... 264
Spark Advance Effects in Spark Ignition Engines Stephen A. Idem and Karthik Silaipillayarputhur .......................................................................................................................... 272
An Anthropomorphic Perspective in Homology Theory Brett A. Sims ................................................................................................................................................................................ 286
Motor-Control Center Design Joshua Lepselter, Lamar Jones, Nate Goodman, Marquael Green and Adnan Bahour ............................................................. 295
The Skinny on the Lap-Band: A Case Study Barbara K. Fralinger and Amy Dorsey ......................................................................................................................................... 298
Factors Affecting Cloud Computing Acceptance in Organizations: From Management to the End-Users‘ Perspectives Festus Onyegbula, Maurice Eugene Dawson Jr. and Jeffery Stevens ........................................................................................ 312
Applying Object Orientated Analysis Design to the Greater Philadelphia Innovation Cluster (GPIC) for Energy Efficient Buildings William Emanuel, Corey Dickens and Maurice Eugene Dawson Jr. ............................................................................................ 313
Developing the Next Generation of Cyber Warriors and Intelligence Analysts Maurice Eugene Dawson Jr., Miguel Angel Crespo and Darrell Norman Burrell ......................................................................... 315
A Qualitative Study of Recurrent Themes from the Conduct of Disability Simulations by Doctor of Physical Therapy Students Ronald De Vera Barredo .............................................................................................................................................................. 316
Rich Eating with a Poor Income: Can the Poor Afford to Eat a Healthy Diet? Anita H. King ................................................................................................................................................................................ 318
Exploring Alzheimer‘s Disease from the Perspective of Patients and Caregivers Phyllis Skorga .............................................................................................................................................................................. 319

SECTION 1
EDUCATION, SOCIAL & ADMINISTRATION
Addressing Academic Integrity with New Technology: Can it be Done? Robert Kitahara, John Mankelwicz and Frederick Westfall .............................................................................................................. 1
Knowledge Management for E-learning: Productive Work and Learning Coverage Khalid Alrawi and Waleed Alrawi ................................................................................................................................................... 14
The Value of Using Micro Teaching as a Tool to Develop Instructors Joann Fisher and Darrell Norman Burrell ...................................................................................................................................... 21
Using a Mentor-Based Progressive Sales Project in a Professional Selling Course Bonnie S. Guy ................................................................................................................................................................................ 27
MindMap: A Powerful Tool to Improve Academic Reading, Presentation and Research Performance Md. Fazle Munim and Imran Mahmud ........................................................................................................................................... 36
The Dilemma of Licensing Alternatives and Reciprocities for Teachers and Administrators Ginny Esch and Betty Cox ............................................................................................................................................................. 41
Education Leadership: Exploring Personality Styles: DISC ―High I‖ and Colors Virgil Freeman ................................................................................................................................................................................ 46
Multifaceted Assessment of Adult Learning Styles and Technology-Driven Learning for Online Students Aikyna Finch, Emad Rahim and Darrell Norman Burrell ................................................................................................................ 49
The Use of Case Studies, Videos, New Teaching Approaches, and Storytelling in Classroom Teaching to Improve the Learning Experiences for Millennial Graduate Students
Darrell Norman Burrell, Aikyna Finch, Maurice Eugene Dawson Jr. and Joann Fisher ................................................................. 58 Perceptions of Arizona and New Mexico Public School Superintendents Regarding Online Teacher Education Courses
Neil Faulk ....................................................................................................................................................................................... 62 The Cross-Cultural Effects of Rescaling Verbal and Numeric Rating Scales Using Correspondence Analysis
Chris Fairchild ................................................................................................................................................................................ 67 Linguistic Link between Haitian-Creole and English
Jacques L. Bonenfant .................................................................................................................................................................... 75 Famous Last Works: Mortality and Music in the Final Chorales Johannes Brahms und die Elf Chorale Vorspiele
Peter K. Miller ................................................................................................................................................................................ 78 Building a Greener School with LEED Certification
Virgil Freeman and Jeff Klein ......................................................................................................................................................... 95 The Impact of Gender on Preferences for Transactional Versus Transformational Professorial Leadership Styles: An Empirical Analysis
Ronald L. Poulson, Joy T. Smith, David S. Hood, Christon G. Arthur and Kimberly F. Bazemore ................................................ 98 Development and Management of Urban and Rural Infrastructures in Osun State, Nigeria: Roads, Drainage, Water, Etc.
Oludare A. Owolabi ...................................................................................................................................................................... 107 The Correlation between Campaign Contributions and Legislation Authored in the Tennessee General Assembly
Chinyere Ogbonna and Eric Martin .............................................................................................................................................. 114
ABSTRACTS
Addressing the Lack of Minority Woman in Senior Leadership Positions in the Federal Government Brittny Lynn Thompson, Maurice Eugene Dawson Jr. and Darrell Norman Burrell ..................................................................... 131
Perceptions of Bullying a in Newly Built, Spacious School Facility Jackie Hester, Yvette Bolen, Lisa Hyde and Bruce Thomas ....................................................................................................... 133
Alert for New Professors: Classroom Management Considerations David Allbright .............................................................................................................................................................................. 136
Utilization of Open Source Software (OSS) Tools to Alleviate a Project‘s Cost Joshua Robinson and Maurice Eugene Dawson Jr. .................................................................................................................... 138
Time Management Practices Across All College Students‘ Classifications – Impact on Persistence J. Byron Pennington, Festus O. Olorunniwo and Michael J. Montgomery ................................................................................... 140
The Integration of Fashion and Culture in an Apparel Design and Merchandising Course Jasmin Hyunju Kwon and Thomas M. Brinthaupt ........................................................................................................................ 141
Silence in Teaching and Learning: Perceptions of Foreign Students in American Classroom Krishna Bista ................................................................................................................................................................................ 142
R. Kitahara, J. Mankelwicz and F. Westfall IHART - Volume 16 (2011)
1
ADDRESSING ACADEMIC INTEGRITY WITH NEW TECHNOLOGY: CAN IT BE DONE?
Robert Kitahara, John Mankelwicz and Frederick Westfall
Troy University, USA
ABSTRACT
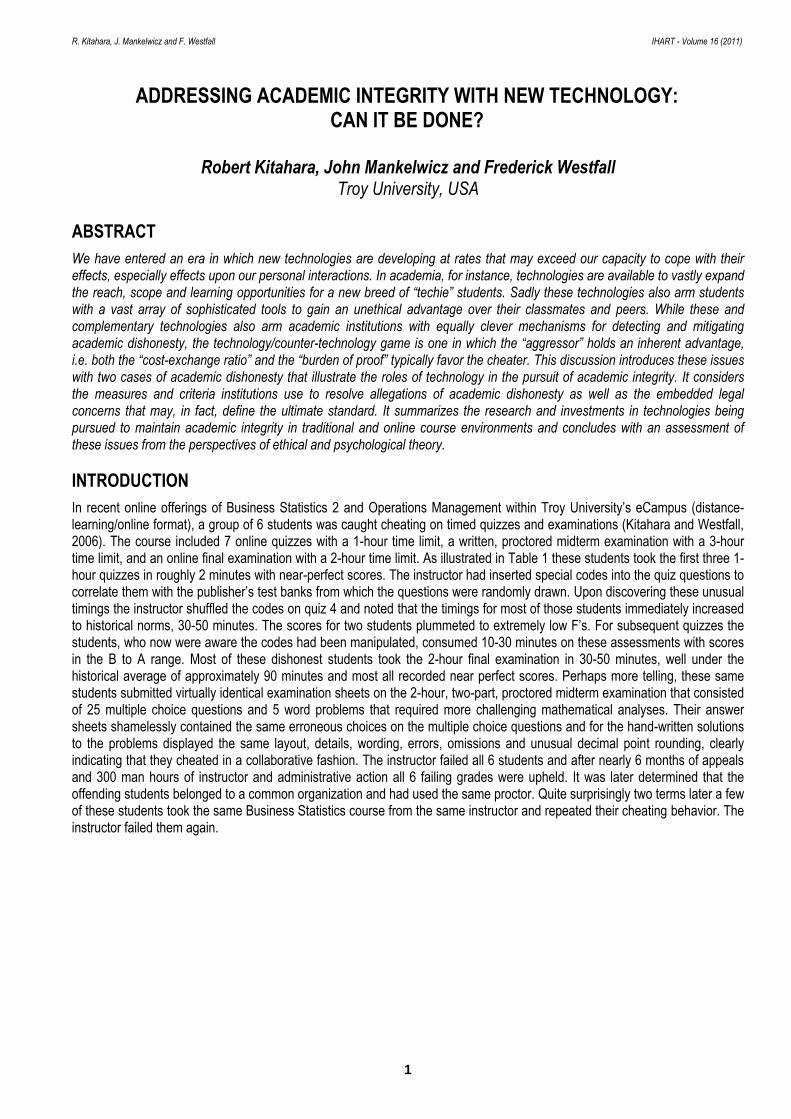
We have entered an era in which new technologies are developing at rates that may exceed our capacity to cope with their effects, especially effects upon our personal interactions. In academia, for instance, technologies are available to vastly expand the reach, scope and learning opportunities for a new breed of ―techie‖ students. Sadly these technologies also arm students with a vast array of sophisticated tools to gain an unethical advantage over their classmates and peers. While these and complementary technologies also arm academic institutions with equally clever mechanisms for detecting and mitigating academic dishonesty, the technology/counter-technology game is one in which the ―aggressor‖ holds an inherent advantage, i.e. both the ―cost-exchange ratio‖ and the ―burden of proof‖ typically favor the cheater. This discussion introduces these issues with two cases of academic dishonesty that illustrate the roles of technology in the pursuit of academic integrity. It considers the measures and criteria institutions use to resolve allegations of academic dishonesty as well as the embedded legal concerns that may, in fact, define the ultimate standard. It summarizes the research and investments in technologies being pursued to maintain academic integrity in traditional and online course environments and concludes with an assessment of these issues from the perspectives of ethical and psychological theory.
INTRODUCTION
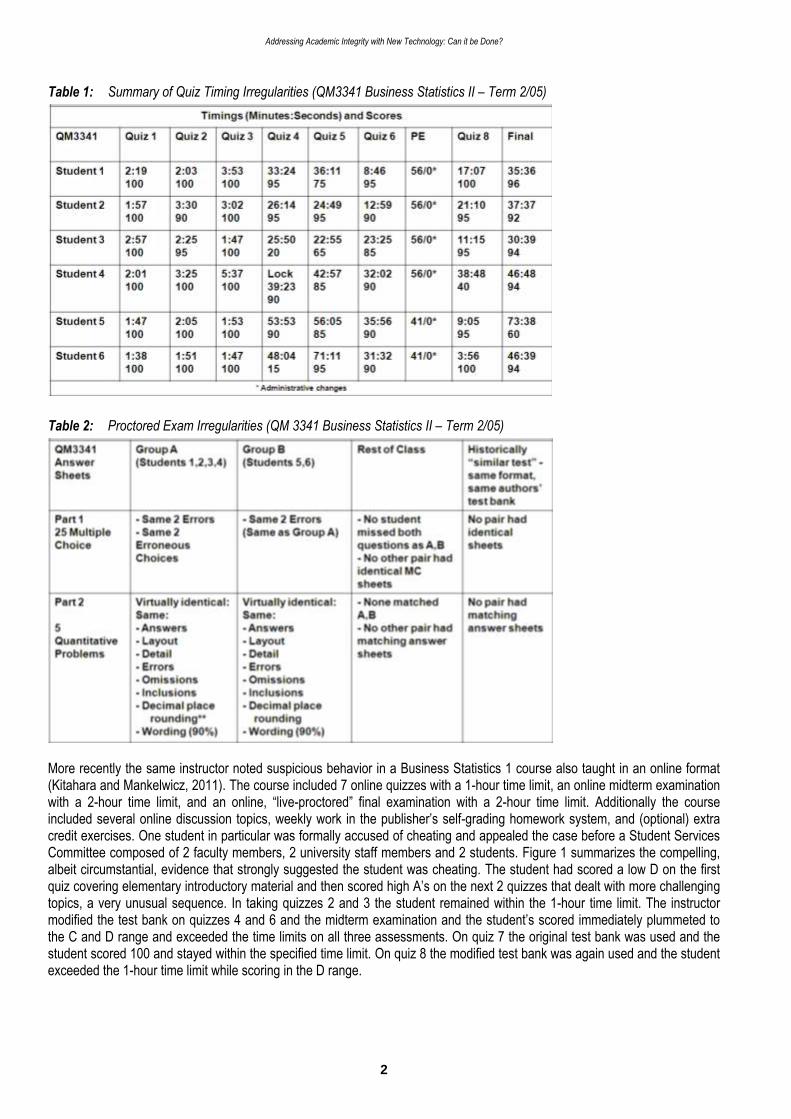
In recent online offerings of Business Statistics 2 and Operations Management within Troy University‘s eCampus (distance-learning/online format), a group of 6 students was caught cheating on timed quizzes and examinations (Kitahara and Westfall, 2006). The course included 7 online quizzes with a 1-hour time limit, a written, proctored midterm examination with a 3-hour time limit, and an online final examination with a 2-hour time limit. As illustrated in Table 1 these students took the first three 1-hour quizzes in roughly 2 minutes with near-perfect scores. The instructor had inserted special codes into the quiz questions to correlate them with the publisher‘s test banks from which the questions were randomly drawn. Upon discovering these unusual timings the instructor shuffled the codes on quiz 4 and noted that the timings for most of those students immediately increased to historical norms, 30-50 minutes. The scores for two students plummeted to extremely low F‘s. For subsequent quizzes the students, who now were aware the codes had been manipulated, consumed 10-30 minutes on these assessments with scores in the B to A range. Most of these dishonest students took the 2-hour final examination in 30-50 minutes, well under the historical average of approximately 90 minutes and most all recorded near perfect scores. Perhaps more telling, these same students submitted virtually identical examination sheets on the 2-hour, two-part, proctored midterm examination that consisted of 25 multiple choice questions and 5 word problems that required more challenging mathematical analyses. Their answer sheets shamelessly contained the same erroneous choices on the multiple choice questions and for the hand-written solutions to the problems displayed the same layout, details, wording, errors, omissions and unusual decimal point rounding, clearly indicating that they cheated in a collaborative fashion. The instructor failed all 6 students and after nearly 6 months of appeals and 300 man hours of instructor and administrative action all 6 failing grades were upheld. It was later determined that the offending students belonged to a common organization and had used the same proctor. Quite surprisingly two terms later a few of these students took the same Business Statistics course from the same instructor and repeated their cheating behavior. The instructor failed them again.
Addressing Academic Integrity with New Technology: Can it be Done?
2
Table 1: Summary of Quiz Timing Irregularities (QM3341 Business Statistics II – Term 2/05)
Table 2: Proctored Exam Irregularities (QM 3341 Business Statistics II – Term 2/05)
More recently the same instructor noted suspicious behavior in a Business Statistics 1 course also taught in an online format (Kitahara and Mankelwicz, 2011). The course included 7 online quizzes with a 1-hour time limit, an online midterm examination with a 2-hour time limit, and an online, ―live-proctored‖ final examination with a 2-hour time limit. Additionally the course included several online discussion topics, weekly work in the publisher‘s self-grading homework system, and (optional) extra credit exercises. One student in particular was formally accused of cheating and appealed the case before a Student Services Committee composed of 2 faculty members, 2 university staff members and 2 students. Figure 1 summarizes the compelling, albeit circumstantial, evidence that strongly suggested the student was cheating. The student had scored a low D on the first quiz covering elementary introductory material and then scored high A‘s on the next 2 quizzes that dealt with more challenging topics, a very unusual sequence. In taking quizzes 2 and 3 the student remained within the 1-hour time limit. The instructor modified the test bank on quizzes 4 and 6 and the midterm examination and the student‘s scored immediately plummeted to the C and D range and exceeded the time limits on all three assessments. On quiz 7 the original test bank was used and the student scored 100 and stayed within the specified time limit. On quiz 8 the modified test bank was again used and the student exceeded the 1-hour time limit while scoring in the D range.

R. Kitahara, J. Mankelwicz and F. Westfall IHART - Volume 16 (2011)
3
Figure 1: Assessment Time, Score Correlation with Test Bank Version
Beyond these suspicious and compelling ―correlations‖ the student‘s performance on all other elements of the course was in the D to F range. The only work for which the student‘s scores were in the A range were the assessments utilizing the original, unmodified test bank. All other work submitted by this student (discussion responses, self-grading homework, extra credit assignments, etc.) was incoherent, non-responsive to assignment requirements, and demonstrated the student had little command of the course material. In addition to the aforementioned circumstantial evidence the instructor received direct testimony from another student in the class who had spoken with the offending student. In that conversation the dishonest student indicated that several students in the class were illicitly collaborating on the online exams, were sharing ―materials,‖ forwarded a sample file (verified to be the publisher‘s test bank), and offered to let the ―witness‖ join the group. The witness, however, ignored the offer and later chose to remain anonymous. During the hearing for the accused student, the attorney for the University recommended that the witness‘ testimony not be used since the witness would not be physically present. However, the emailed test bank file was used in the proceedings. Despite that the fact that all members of the Student Services Committee felt the student had cheated, based upon the evidence presented and the ―measure‖ used by the committee to render its decisions, they surprisingly ruled that the case could not be definitively ―proven.‖ The accused student was therefore advised that no further disciplinary action would be taken. Given the similarities between these two cases why were the ultimate outcomes so dramatically different? Figure 2 summarizes the salient aspects of the cases.
Case 1 Case 2
A good deal of (circumstantial) empirical data
Compelling trends that cannot happen ―statistically‖
Written, proctored exam with identical answers, errors,
omissions, and details
Eventually one student admitted having the test bank
A good deal of (circumstantial) empirical data
Compelling trends that cannot happen ―statistically‖
eMail (test bank) file
Student continued to deny
Figure 2: Contrasting Cases
Although both cases revolved around dramatically compelling trends that could happen without conspiratorial dishonest activity, Case 1 included more direct evidence (proctored exam) with clear and unusual ―similarities‘ in the students‘ own handwriting. Case 2 included a test-bank file, which the student denied sending and suggested that the email address could have been ―altered.‖ Although there is no logical reason for such alteration to have taken place, since it was a forwarded file, the University‘s information technology (IT) specialists could not identify the specific originating Internet Protocol (IP) address. These cases illustrate that in resolving accusations of academic dishonesty, the governing committees may employ measures beyond those dictated by purely academic concerns and perhaps beyond those required for resolving violations of academic policy. They highlight several key issues in addressing incidents of academic dishonesty:
Are the University‘s Academic Policies and Procedures to which all incoming students must agree, truly effective?
What importance does ―logic‖ and ―common sense‖ carry in such proceedings?
Is the real measure that which can be proven beyond a shadow of a doubt in a ―court of law‖?
What role/value does technology play in resolving such cases?
Addressing Academic Integrity with New Technology: Can it be Done?
4
EXTENT OF THE PROBLEM
An enormous body of research exists on the scope and extent of academic dishonesty, the reasons why students cheat, and what can be done to gain control over what appears to be a problem that is growing at epidemic proportions on a global scale. This inherently multifaceted and complex problem certainly requires careful consideration of the underlying mechanisms that may drive an individual‘s social behavior using appropriate elements of classical and modern ethics and psychological theory. Such analysis is further complicated by rapidly-changing environmental dynamics. Technological advances arm the student with much more robust tools and many more opportunities to cheat. Counter technologies also provide the instructor and institutions with equally robust and powerful tools with which to respond. However, much like any ―conflict,‖ the ―aggressor‖ has an inherent advantage and in most cases the ―cost-exchange ratio‖ (the costs of aggression compared to the costs of reaction) always favors the aggressor. Crown and Spiller (1998) summarize a good deal of this research including studies on demographic, individual, situational factors and variables.
Many reports suggest that academic dishonesty is prevalent in many, if not most, academic institutions around the globe and is growing at significant and alarming rates (McCabe, Klebe-Trevio & Butterfield, 2001a; Eckstein, 2003). Attempts to identify generally descriptive or even predictive characteristics of cheaters have produced interesting but often conflicting correlations and results depending upon the sample populations studied (Slobogin, 2002; McCabe and Klebe-Trevino, 1997) and are plagued with methodological issues and inconsistencies within the existing body of research (Crown and Spiller, 1998). Among the reasons students cheat is the historically small number of students who are caught and the relatively ―light‖ consequences the cheaters receive from the institutions (Lester and Diekhoff, 2002). Furthermore because of the high cost in time, energy and emotional involvement required to pursue these cases, many instructors choose to ignore such incidents when detected (Adkins, Kenkel, & Lo Lim, 2005).
Whatever the influencing variables, most research indicates that cheaters are generally; less mature, less reactive to observed cheating, less deterred by social stigma and guilt, less personally invested in their education, and more likely to be receiving scholarships but performing more poorly (Diekhoff, et. al., 1996). Not surprisingly cheaters tend to shun accountability for their actions and blame their parents and teachers for widespread cheating, citing increased pressure on them to perform well (Greene & Saxe, 1992). Perhaps more disturbing, society as a whole has become increasingly more tolerant and even accepting of the practice of cheating, often citing the need to survive in today‘s competitive environment as justification for that shift in attitude (Callahan, 2004). Academia is undergoing dramatic shifts to accommodate the ―new breed‖ of tech-savvy students and is exploring, developing and slowly deploying innovative ways to educate these students using increasingly sophisticated and technology-laded methods. In doing so many researchers believe new ―areas of grey‖ are being created, at least in the minds of some students, as to what constitutes ethical and honest behavior.
THREE APPROACHES TO MITIGATE THE PROBLEM
Olt (2002) classifies the approaches to combating academic dishonesty for online courses into three categories that apply to traditional in-class courses as well those taught in an online format:
Police approach – seeks to catch and punish those who cheat
Prevention approach – reduces the opportunities for students to cheat as well as the pressure to cheat
Virtues approach – establishes a climate and culture for students so that they do not want to cheat
This classification structure provides a convenient and concise way to discuss potential approaches to ensuring academic integrity.
To date academic institutions have developed individualized technology-based and non-technology based strategies and tools for mitigating the problem unique to their organization, administrative policies and student populations. Historically most institutions have focused on the policing and prevention approaches although many are now gradually evolving towards various forms of a virtues approach or a customized hybrid. The methods commonly employed include; electronic and procedural mechanisms for controlling the classroom/exam-room environment, software aids for detecting plagiarism, biometric systems for student identification, and statistical methods for analyzing unusual patterns in student performance compared to class or historical norms.
These reactionary approaches require that the university publish well-defined policies and procedures for dealing with cases of cheating to protect students‘ rights to Fourteenth Amendment rights to due process (SMU Office of Student Conduct and Community Standards, 2008). Most institutions impose penalties dependent upon the type and frequency of the offense including:

R. Kitahara, J. Mankelwicz and F. Westfall IHART - Volume 16 (2011)
5
Warning/reprimand
Lower grade on assignment or examination, with or without make-up
Failure in assignment or examination
Suspension due to breach of academic honesty for a period consistent with the severity of the offense
Placing student on academic probation for a period consistent with the severity of the offense
Expulsion due to breach of academic honesty
Notation on internal records/transcripts
Ban from reapplying to the institution
Although these approaches and consequences are common to most institutions, their effectiveness appears to be rather limited, particularly in the face of evolving environmental dynamics. The common wisdom is that these conventional approaches must ultimately be replaced with a culture of honesty, an issue that must be addressed at the societal level (Hendershott, Drinan & Cross, 1999) Consistent with the pursuit of a virtues approach to a long term resolution of the problem, many universities have adopted appropriate policies that define proper student academic conduct and comprehensive procedures for resolving accusations of violations of those policies. These institutions have created collaborative mechanisms among students, instructors and administrators for establishing policies towards academic integrity that include a university-wide Academic Code, a corresponding student Honor Code, and a formal academic process for hearing cases of alleged academic dishonesty. At Troy University, for instance, the governing board responsible for conducting those hearings includes instructors, administration/staff members and students, all with specific term limits. Some research suggests that institutions with strong honor codes and measures for establishing a climate for cooperative efforts focused on promoting academic integrity experience lower rates of academic dishonesty than those that do not (McCabe, Trevino and Butterfield, 2001b). The virtues approach requires a change in ―culture‖ throughout the academic community. The proper climate cannot be established without support and commitment by the institution to make serious efforts to maintain appropriate ethical standards (Heberling, 2002). Until a comprehensive and effective virtues approach is implemented, most institutions are pursuing hybrid approaches customized to their community that attack the problem in a patchwork fashion.
TECHNOLOGICAL APPROACHES
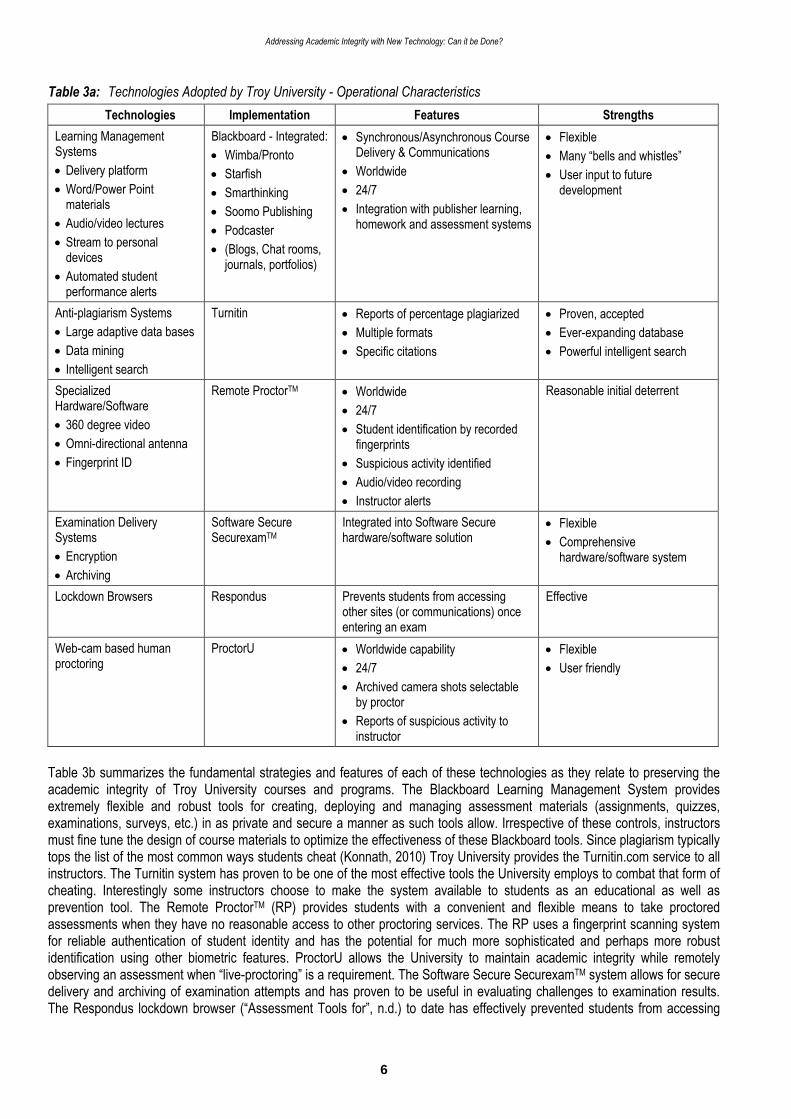
Several academic institutions, including Troy University, utilize policing and prevention approaches heavily laden with sophisticated technology-based tools and systems to gain control over increasing academic dishonesty rates in both traditional and online environments. These systems range from robust course management systems that deliver course content to the new wave of tech-savvy students using a wide variety of innovative features (audio/video lectures, performance alerts, course organization tools, exploitation of personal electronic devices, online communications forums that replicate social networking, etc.) to more advanced techniques that provide scoring metrics predictive of cheating behavior. Many incorporate technologies to control the classroom environment and hardware and software providing unique, physiological biometric characteristics to identify students and monitor the examination environment. Table 3a summarizes many of the approaches currently implemented by Troy University, their operational characteristics and deployment/implementation status. These security tools include; Software Secure SecurexamTM provisions for encrypting and archiving exam data, the Respondus Lockdown Browser to deny students access to unapproved websites and files during examinations, and Turnitin anti-plagiarism software. The University has invested significant resources in developing and deploying a ―virtual proctor‖ (the Remote ProctorTM) consisting of a 360 degree camera, omni-directional microphone, a fingerprint scanner, and intelligent software to detect and record ―suspicious activity‖ by students taking examinations. The University also offers a live-proctoring option using the web-camera based services provided by ProctorU.
Addressing Academic Integrity with New Technology: Can it be Done?
6
Table 3a: Technologies Adopted by Troy University - Operational Characteristics
Technologies Implementation Features Strengths
Learning Management Systems
Delivery platform
Word/Power Point materials
Audio/video lectures
Stream to personal devices
Automated student performance alerts
Blackboard - Integrated:
Wimba/Pronto
Starfish
Smarthinking
Soomo Publishing
Podcaster
(Blogs, Chat rooms, journals, portfolios)
Synchronous/Asynchronous Course Delivery & Communications
Worldwide
24/7
Integration with publisher learning, homework and assessment systems
Flexible
Many ―bells and whistles‖
User input to future development
Anti-plagiarism Systems
Large adaptive data bases
Data mining
Intelligent search
Turnitin Reports of percentage plagiarized
Multiple formats
Specific citations
Proven, accepted
Ever-expanding database
Powerful intelligent search
Specialized Hardware/Software
360 degree video
Omni-directional antenna
Fingerprint ID
Remote ProctorTM Worldwide
24/7
Student identification by recorded fingerprints
Suspicious activity identified
Audio/video recording
Instructor alerts
Reasonable initial deterrent
Examination Delivery Systems
Encryption
Archiving
Software Secure SecurexamTM
Integrated into Software Secure hardware/software solution
Flexible
Comprehensive hardware/software system
Lockdown Browsers Respondus
Prevents students from accessing other sites (or communications) once entering an exam
Effective
Web-cam based human proctoring
ProctorU Worldwide capability
24/7
Archived camera shots selectable by proctor
Reports of suspicious activity to instructor
Flexible
User friendly
Table 3b summarizes the fundamental strategies and features of each of these technologies as they relate to preserving the academic integrity of Troy University courses and programs. The Blackboard Learning Management System provides extremely flexible and robust tools for creating, deploying and managing assessment materials (assignments, quizzes, examinations, surveys, etc.) in as private and secure a manner as such tools allow. Irrespective of these controls, instructors must fine tune the design of course materials to optimize the effectiveness of these Blackboard tools. Since plagiarism typically tops the list of the most common ways students cheat (Konnath, 2010) Troy University provides the Turnitin.com service to all instructors. The Turnitin system has proven to be one of the most effective tools the University employs to combat that form of cheating. Interestingly some instructors choose to make the system available to students as an educational as well as prevention tool. The Remote ProctorTM (RP) provides students with a convenient and flexible means to take proctored assessments when they have no reasonable access to other proctoring services. The RP uses a fingerprint scanning system for reliable authentication of student identity and has the potential for much more sophisticated and perhaps more robust identification using other biometric features. ProctorU allows the University to maintain academic integrity while remotely observing an assessment when ―live-proctoring‖ is a requirement. The Software Secure SecurexamTM system allows for secure delivery and archiving of examination attempts and has proven to be useful in evaluating challenges to examination results. The Respondus lockdown browser (―Assessment Tools for‖, n.d.) to date has effectively prevented students from accessing

R. Kitahara, J. Mankelwicz and F. Westfall IHART - Volume 16 (2011)
7
other websites while taking online assessments but caution must be exercised as students discover and disseminate new ways to defeat its security features (―Critical Analysis of‖, 2008 ).
Table 3b: Technologies Adopted by Troy University - Addressing/Controlling Ethical Issues
Technologies Embedded Strategies/Features
Learning Management Systems
Delivery platform
Word/Power Point materials
Audio/video lectures
Stream to personal devices
Automated student performance alerts
General access
Password controlled Assignments:
Provisions for secure/private submission
Instructor options for student access Examinations:
Flexible formats
Options for randomizing exam questions
Options for presentation of exam questions
Options for password access to exams
Anti-plagiarism Systems
Large adaptive data bases
Data mining
Intelligent search
Assessing/Detecting plagiarism
Multiple report formats for enhanced data mining
May be used as feedback reports to students or ethical diagnostic tool
Specialized Hardware/Software
360 degree video
Omni-directional antenna
Fingerprint ID
Student verification
Primary biometric = fingerprint signature
Potential for other biometrics
Examination Delivery Systems
Encryption
Archiving
Mitigate undesired access to exam & results
Provides traceability for post-exam analysis
Lockdown Browsers Eliminate student access to alternate websites and files once an exam is entered
Web-cam based human proctoring Live, human-proctoring in remote environment
The technologies currently being deployed by academic institutions on an international scale are certainly the ―first generation‖ of policing and prevention approaches to academic integrity. They employ straightforward strategies using somewhat conventional technical mechanisms. Interesting research and development efforts are now focused on the next generation of tools and techniques. Table 4a summarizes several of the more promising technologies and their potential operating characteristics. They range from simple, exam-room management technologies, such as recessed computer screens to minimize sharing of on screen information, to sociological ―profiling‖ using next generation artificial intelligence hardware and software. The table entries are presented in two general categories; more conventional technologies for direct in-class policing/prevention and more information intense techniques incorporating state of the art biometric and intelligent processing techniques using hardware- and software-based solutions.

Addressing Academic Integrity with New Technology: Can it be Done?
8
Table 4a: Other Promising Technologies - Operational Issues
Technologies Implementation Features Comments
Policing/Prevention
Recessed computer screens
Deployed in many institutions
No current ―production system‖
Allows easier detection of students attempting to photograph computer screens
Minimize sharing of on screen exam information
Existing technology
Dedicated monitoring systems
Overhead cameras
Archive to CD/DVD
Deployed in many institutions
No current ―production system‖
Archive suspicious behavior
Currently largely human observers
Existing technology
Bluetooth detection No current ―production system‖
Prevent communication through Bluetooth connected devices
Near term technology
Directly addresses unwanted student communications
Electronic detection/jamming
No current ―production system‖
Detect/jam/prevent electronic communications, e.g. Faraday cage technology
Directly addresses unwanted student communications
Information Exploitation
Fingerprint recognition Limited ―production systems‖, e.g. Remote ProctorTM
Student verification Existing technology
Unique, reliable
Facial recognition (automated)
No current ―production system‖
Student verification Huge potential
Existing technology (military, intelligence)
Other Physiological Biometrics
(palm print, hand geometry, iris, scent, DNA)
No current ―production system‖
Student verification Good potential
Existing technology (military, industry)
Behavioral Biometrics No current ―production system‖
Student verification Huge potential
Emerging technologies
Data Mining No current ―production system‖
Database search for suspicious patterns and interrelationships
Huge potential
Proactive strategy
Pattern Recognition No current ―production system‖
Search for suspicious patterns and interrelationships
Huge potential
Proactive strategy
Artificial Intelligence No current ―production system‖
Identification of suspicious patterns and interrelationships
Huge potential
Proactive strategy
―Profiling‖ via complex interrelationships
Table 4b summarizes the strategies and features each new technology brings to bear with regard to academic integrity applications as well as qualitative assessments of their potential effectiveness. With the exception of electromagnetic detection and jamming systems for policing and prevention, the technologies are relatively conventional and commonly used in many environments, including academia. Bluetooth, electronic jamming systems and Faraday cages are more common in military or security organizations although there may be lucrative applications within academia, e.g. delivery of course materials in extremely secure environments, for which these devices and systems are acceptable and correspondingly useful. Systems that efficiently exploit information technologies potentially provide much more robust discrimination capability, particularly in the information-rich and highly-connected age we are now entering. Using data mining, pattern recognition and artificial intelligence hardware and algorithms, these systems can potentially detect cheating using behavioral biometrics to complement more standard physiological biometrics and may provide predictive metrics for those likely to cheat (Hernandez, et. al., 2006; Korman, 2010). While most of these technologies require significant development effort, some are relatively mature and are now being implemented within select institutions. Identification and authentication of students through keystroke patterns, for

R. Kitahara, J. Mankelwicz and F. Westfall IHART - Volume 16 (2011)
9
instance, is proving to be extremely effective with detection and reliability rates at least as good as fingerprint scanning systems (Revett, K., 2001; Analoui, Mirzaer & Davarpanah, 2003; Tappert, Villani, Cha, 2010). Other technologies may prove to be even more effective. With the growing popularity and incorporation of social networking into university course delivery systems, solutions that exploit data mining technologies are particularly interesting. A good deal of research is being conducted on developing appropriate metrics related to the ―propensity to cheat‖ using these complex interrelationships among distributed information systems and databases.
Table 4b: Other Promising Technologies - Addressing/Controlling Ethical Issues
Technologies Embedded Strategies/Features Effectiveness
Policing/Prevention
Recessed computer screens Classroom/exam-room management
Enhances detection of attempts to photograph computer screen.
Easily compromised
Requires close observation by human observers
Dedicated monitoring systems
Overhead cameras
Archive to CD/DVD
Classroom/exam-room management
Real-time monitoring of exams
Allows recording & archiving suspicious behavior
Can be compromised
Requires close observation by human observers
Bluetooth detection Classroom/exam-room management
Prevents inappropriate communication during examinations
Reasonably effective for specific frequency ranges
Electronic detection/jamming Classroom/exam-room management
Prevents inappropriate communication during examinations
Effective for broad range of frequencies
Information Exploitation
Fingerprint recognition Student verification
Ensure student taking exam is student of record
Effective
Can only ensure student taking exam is student whose fingerprint is on record
Facial recognition (automated) Student verification
Ensure student taking exam is student of record
Reasonably effective
Enhanced capability when combined with other biometrics
Other Physiological Biometrics
(palm print, hand geometry, iris, scent, DNA)
Student verification
Ensure student taking exam is student of record
Enhanced capability using alternate and/or multiple biometrics
Potentially large gain in capability, particularly when combined with other biometrics
Behavioral Biometrics
Student verification
Ensure student taking exam is student of record
Enhanced capability using alternate and/or multiple biometrics
Large gain in capability, particularly when combined with other biometrics
Potential for establishing predictive metrics
Data Mining Student verification
Ensure student taking exam is student of record
Incorporate information from multiple, large databases
Patterns of suspicious behavior
Enhanced verification capability
Potential to include multiplicity of demographic and individual characteristics related to the propensity to cheat
Pattern Recognition Student verification
Ensure student taking exam is student of record
Profiling suspicious behavior
Robust verification capability
Good potential for establishing ―predictive‖ metrics
Artificial Intelligence Student verification
Ensure student taking exam is student of record
Profiling patterns of suspicious behavior using broader behavioral data and complex relationships
Most robust verification capability
Best potential for establishing ―predictive‖ metrics
Potential to include diverse data (e.g. personality characteristics, individual characteristics, demographics)

Addressing Academic Integrity with New Technology: Can it be Done?
10
ETHICS, PSYCHOLOGY, AND LAW
The road to reviving collegiate culture around virtue ethics will be a very long one. While the new technologies may be useful, perhaps even necessary aids in that direction, they can hardly be sufficient. A full explication of the path, even if one were available, would be beyond the purview here. Nevertheless, it is instructive to consider the use of technologies in the broader psychological, ethical, and legal framework. Human psychology provides a substrate for understanding behaviors related to academic dishonesty. Indeed, it is impossible in practice to completely parse the ethical and psychological aspects of the issue. This section will first review some key material from psychology and then frame the use of technology in academic integrity issue in ethical terms, with an emphasis on Utilitarian thinking. Finally, the issue is addressed in terms of the interplay of psychology, ethics, and law. Both psychology and ethics deal with human values and sensed obligations. In the twentieth and now early twenty-first century, ethical discussion is frequent. Most modern research and writing, however, has focused not on new or newly interpreted ethical principles, but rather on meta-ethics: i.e., on what people do when they make moral decisions. This perspective, along with a definite Utilitarian emphasis, cements the modern psychology-ethics linkage. The purpose here is to consider these concepts in the context of the new educational and other information technologies. This context has for decades involved major change, often rapid, and not always pleasant. Implementing new technology and adapting to the attendant changes has entailed a great deal of learning and unlearning – by individuals, firms, and institutions. Ancients such as Aristotle, classics such as Adam Smith, and moderns (e.g., Eck, 1971) have all acknowledged that growth of the personality and the sense of ethics occur concurrently. However, a pattern of personal loyalties begins in infancy and is fairly developed before the child has any true sense of ethical principles. Loyalty to family, social group, and perhaps faith and nation supersede any sense of abstract principles, which may never develop in some individuals. Loyalty to a school or classmates may occur somewhere in the middle of the sequence. If these social entities honor academic integrity, the game is half won. The problem is that these school and classmate loyalties must be redeveloped early in the college experience. Traditional explanations of the necessity for ethics stress that it evolved in response to two shortages: that of physical goods and amenities and also of human sympathy for others. In response, society developed norms, mores, and formal ethical systems to create clear expectations and make behaviors more predictable. Nevertheless, even if human free will behavior constrained in this manner, some individual‘s behavior would harm others. As this pattern continued, people agreed to some form of social contract, under which laws developed – to be enforced by secular rulers and officers. These processes have been variously described by such classic thinkers as Hobbes, Locke, or Lord Moulton. Again, the context of educational technology is one of rapid change. In such conditions some will feel threatened. Some fear loss greatly, and some do lose. Emotions are stirred. The usual sources of authority may seem weakened. Not surprisingly, both sides of an academic dispute may assert that the other is unfair or biased; the law may be invoked. For discussion of academic integrity, any school of ethical thought is in principle relevant. However, the very nature of the issue – stemming in turn from the very nature of modern society – suggests a primacy of Utilitarian thinking over Justice, Rights, Deontic, or other possible approaches. As developed by Jeremy Bentham and John Stuart Mill (Ryan, 2004), Utilitarianism does not necessarily imply any dishonest or even overly selfish conduct, but a concern for human happiness. One way or another, the concern is over consequences. In academic dishonesty, these consequences might include inappropriately appropriated gain to the cheater, undeserved treatment to the honest student, the social consequences of later job related incompetence, the distrust among peers, parents, or others, the reputational damage to the academic institution, etc. All of these are immediately recognizable as consequences, or they can be easily rephrased as such. In this sense the ethics of modern academe are very similar to that of business; concerns arise and are articulated as ethical when one party senses actual loss, potential loss, or lost opportunities. When such losses can be traced to the action of another party, both ethics and law are invoked. Three Utilitarian themes, embodied through three models with variants remain central to contemporary discussion of business ethics: the stakeholder approach, with many advocates (e.g., Mitchell, et. al., 1997), the Jones (1991) Issue Contingent Model, and Integrative Social Contracts Theory (Donaldson & Dunfee, 1994). Each has a contribution for our understanding of academic integrity, and the three work well together. The integrity issue of course involves many stakeholders. Each of the stakeholders may hold a different sense of importance, or ―Moral Intensity‖ (Jones, 1991) for the consequences from academic dishonesty. Moral Intensity of an issue or action increases as any of its six conceptual dimensions are increased:
1) the magnitude of consequences of the act

R. Kitahara, J. Mankelwicz and F. Westfall IHART - Volume 16 (2011)
11
2) the probability of the consequences 3) the immediacy of the consequences 4) the proximity of the consequences 5) the degree of social consensus regarding the morality of the act 6) the concentration of effect of the consequences
Regarding this last dimension, highly diffuse (and presumably small) consequences add little to moral intensity. Integrative Social Contracts Theory would hold that cheating is some violation of an implied or explicit ―contract‖ at the local or micro level of students and schools; basic contract administration and adjudication is at this level. These academic contracts have their validity - and possibly their ultimate enforceability also – from their adherence to ―hypernorms‖ prescribed by some larger social entity(s) at the macro level. Here, the macro level might include society and the state and federal levels of government, which may also be important third party payers for education services. Industry also values the benefits from education. However, the stakeholders at the macro level have not adapted to provide the constraint and detailed guidance, the ―downward causation‖ needed. Discussions of this theory also naturally link ethics to law. Applying these concepts together yields some interesting insights. First the superiority of building a culture of virtue becomes very clear. First, it would galvanize stakeholders and perhaps add new ones. By raising the consensus regarding academic integrity, it would also increase the probability of negative consequences to the perpetrator. There would greater social disapproval as a consequence, and likely imposition of greater and more immediate adjudicated consequences, and possibly more macro level support ultimately. Now consider in the same fashion the 6 technologies/strategies implemented by Troy University (Table 3). First, they do not directly influence stakeholders. Secondly, while these six tools may already be formidable prevention/policing tools with some deterrent effect, they have little impact on the Jones (1991) Issue Contingent Model dimensions. For the most part they increase the probability and immediacy of detection, not necessarily the probability of consequences - except of course for the very raising of the issue at all as a form of consequence. Of the six methodologies, only web-cam based human proctoring provides a clear, real time source of testimonial evidence, so important in both academic and legal proceedings. This facet could, of course, be strengthened by providing more immediate alarm systems from the other methods to a live proctor. Also, the technologies could possibly be used to add a new category of consequences as a deterrent. By more judiciously providing signals to suspected perpetrators during the suspected offenses, the technologies might cause some undesired behaviors to cease. Finally, the technical information provided by these hardware/software solutions finds its way to the macro level stakeholders slowly, usually as aggregated report data after passing through many hands. The support from this macro level is slow, if it arrives at all. As the individual and social impacts resulting from the behaviors of some actors continue, it may still not be necessary to turn to the law and courts. Organizations, including schools and colleges, have within their internal mechanisms for ―legal rationality‖ (Diesing, 1973) to resolve disputes. In any organization with a strong culture, a sense of exclusivity, and social cohesion these mechanisms may be strong. Indeed, historically these mechanisms were very strong in academic institutions, as many of them fell under the protection of the Church and universities, in particular, were generally granted considerable legal autonomy as their own municipal units. Some vestiges of this system persist to this day, even in the United States. However, the application of these principles is not uniform throughout academia and lacking further guidance some institutions tend to err on the side of safety and apply criteria appropriate to ―courts of law‖ in resolving violations of academic integrity. This current, probably premature retreat to courtroom standards of proof in academic dishonesty cases may hold a noble sound, but it is more indicative of much broader changes and trends: societal litigiousness, increasingly more students in higher education, and decreasing social cohesion within colleges. At the same time, the macro level of courts and law has not yet responded to the issue.
DISCUSSION
Many powerful technologies to support the policing and prevention approaches are available. Today‘s technologies exploit straightforward observation and prevention strategies and first-generation physiological biometrics for identification and authentication. Tomorrow‘s technologies will likely exploit more advanced physiological biometrics, behavioral biometrics and intelligent technologies that will seamlessly navigate the highly-connected and networked world of information that most certainly lies ahead.

Addressing Academic Integrity with New Technology: Can it be Done?
12
Each of these technologies may appear to some to be invasive strategies raising numerous privacy concerns and legal issues. To date anti-plagiarism systems appears to be most effective and generally accepted technology to combat academic dishonesty and thus far has survived privacy and legal challenges. Overall the psychological, ethical and legal challenges of next-generation technologies will be correspondingly more formidable. However, these technology-intense tools and provide only ―stop gap‖ measures. An emphasis on virtue ethics, with attendant cultural change lead by committed leadership is necessary. Of even more concern, perhaps, is the appropriate measure needed to adjudicate cases of cheating. Because of the litigious nature of today‘s society some institutions are using measures that require a level of evidence and burden of proof beyond those necessary for resolving these cases of academic dishonesty. What level of evidence, i.e. burden of proof is necessary? Applying courtroom standards to such cases marks a retreat from the historic independence of universities. Currently, the consequences for a student caught cheating are often grossly disproportionate to the costs of policing, preventing and adjudicating cases of academic dishonesty. Using overly restrictive measure only emboldens cheaters to continue.
REFERENCES
Adkins, J., Kenkel, C, & Lo Lim, C. (2005). Deterrents to online academic dishonesty. The Journal of Learning in Higher Education, 1(1), 17-22. Retrieved October 12, 2008 from http://jwpress.com/JLHE/Issues/v1i1/Deterrents%2 0to%20Online%20Academic%20Dishonesty.pdf
Analoui, M., Mirzaer, A., Davarpanah, H., (2003). Using Multivariate Analysis of Variance Algorithm in Keystroke Identification, Proceedings of the International Symposium in Telecommunications, Isfahan, Iran, 16-18 August.
―Assessment Tools for Learning Systems‖ (n.d.). Respondus, Online, retrieved March 24, 2011 from http://www.respondus.com/products/lockdown.shtml
Callahan, D. (2004). The Cheating Culture: Why More Americans Are Doing Wrong to Get Ahead. Harcourt Publishers. ―Critical Analysis of Respondus LockDown Web Browser‖, (*2008). Open Source Club, the Ohio State University, Online,
retrieved March 18, 2011 from http://opensource.osu.edu/lockdown Crown, D.F., Spiller, M.S., (1998). Learning from the Literature on Collegiate Cheating: A Review of Empirical Research,
Journal of Business Ethics, Volume 17, Number 6, 683-700. Diekhoff, G., LaBeff, E. Clark, R., Williams, L., Francis, B., Haines V. (1996). College Cheating: Ten Years Later. Research in
Higher Education, Vol. 37, No. 4, pp 487-502. Diesing, P. (1973) Reason in society: Five types of decisions and their social conditions. Westport, Conn: Greenwood Press. Donaldson, T, & Dunfee, T. W. 1994. Toward a unified conception of business ethics: Integrative social contracts theory.
Academy of Management Review. 19(2):252-284. Eck, M. (1971) Lies and truth. New York: McMillan. Eckstein, M. (2003). Combating academic fraud – Towards a culture of integrity. International Institute for Education Planning,
UNESCO booklet 2003, ISN92-803-124103. Retrieved from http://unesdoc.unesco.org/images/0013/001330/133038e.pdf Greene, A.S., Saxe, L. (1992). Everybody (Else) Does It: Academic Cheating Education. Retrieved on June 15, 2006 from
http://www.eric.ed.gov/ERICWebPortal/search/detailmini.jsp?_nfpb=true&_&ERICExtSearch_SearchValue_0=ED347931&ERICExtSearch_SearchType_0=no&accno=ED347931
Heberling, M. (2002). Maintaining academic integrity in on-line education. Online Journal of Distance Learning Administration, 5(1). Retrieved February 16, 2006, from Online Journal of Distance Learning Administration Web site: http://www.westga.edu/%7Edistance/ojdla/spring51/heberling51.html
Hendershott, A., Drinan, P., Cross, M. (1999). Toward Enhancing a Culture of Academic Integrity. NASPA Journal, Vol. 37, No. 4, pp 587-598.
Hernandez, J. A., Ochoa, A., Munoz, J., Burlak, G., (2006). Detecting cheats in online student assessments using Data Mining, Proceedings of Electronics, Robotics and Automotive Mechanics Conference, Cuernavaca, Morelos, Mexico, September 26-29.
Jones, T. M. 1991 Ethical decision making by individuals in organizations: An issue contingent model. Academy of Management Review. 16(2): 366-395.
Kitahara, R. T., Westfall, F. W. (2006). ―Challenges to Academic Integrity in a Distance Learning Environment‖. Clute Institute for Academic Research, 2006 College Teaching and Learning Conference, Las Vegas, Nevada, October 2-6, 2006.
Kitahara, R. T., Mankelwicz, J. (2011). Academic Integrity and New Technology: Ethics vs Legalities, Presentation at 9th Troy University Psychology Conference, Troy University, Troy, Alabama, April 22.
Konnath, H., (2010), Academic dishonesty cases increase at UNL, better detection is to credit, DailyNebraskan.com, Online, retrieved March 2011 from http://www.dailynebraskan.com/news/academic-dishonesty-cases-increase-at-unl-better-detection-is-to-credit-1.2421099

R. Kitahara, J. Mankelwicz and F. Westfall IHART - Volume 16 (2011)
13
Korman, M., (2010). Behavioral Detect ion of Cheating in Online Examination‖, Dissertation , Lulea University of Technology, ISSN: 1402-1552, ISRN: LTU-DUPP—10/112—SE, Retrieved March 12, 2011 from http://epubl.ltu.se/1402-1552/2010/112/LTU-DUPP-10112-SE.pdf
Lester, M. C., & Diekhoff, G. M. (2002). A comparison of traditional and internet cheaters. Journal of College Student Development, 43(5), 2-7.
McCabe, D., Klebe-Trevino, L. (1997). Individual and Contextual Influences on Academic Dishonesty: A Multicampus Investigation. Research in Higher Education, Vol. 38, no. 3, pp379-396.
McCabe, D., Klebe-Trevino, L., Butterfield, K. (2001a), Cheating in Academic Institutions: A Decade of Research, Ethics and Behavior 11(3), 219-232
McCabe, D. L., Trevino, L. K., & Butterfield, K. D. (2001b). Dishonesty in academic environments: The influence of peer reporting requirements. The Journal of Higher Education, 72(1), 29-45.
Mill, J. S., Bentham, J. (2004) Utilitarianism and other essays. Ryan, A. (ed.) London: Penguin Books. Mitchell, R. K., Agle, B. A. & Wood, D. J. 1997 Toward a theory of stakeholder identification and salience: defining the principle
of who and what really counts. Academy of Management Review, 22:853-886. Olt, M. (2002), Ethics and Distance Education: Strategies for Minimizing Academic Dishonesty in Online Assessment, Online
Journal of Distance Learning Administration, Vol. V, No. III, Fall. Revett, K., (2007). A machine learning approach to keystroke dynamics based user authentication, International Journal
Electronic Security and Digital Forensics, Vol. 1, No. 1. SMU Office of Student Conduct and Community Standards (2008), The Role of Faculty in Confronting Academic Dishonesty at
Southern Methodist University, Honor Council Brochure. Retrieved on October 12, 2008 from http://smu.edu/honorcouncil/PDF/Brochure_Acad_Honesty_Faculty_Role.pdf
Tappert, C.C., Villani, M., Cha, S. H. (2010) Keystroke Biometric Identification and Authentication on Long-Text Input, Behavioral Biometrics for Human identification: Intelligent Applications, IGI Global Publishing, pp. 342-367.
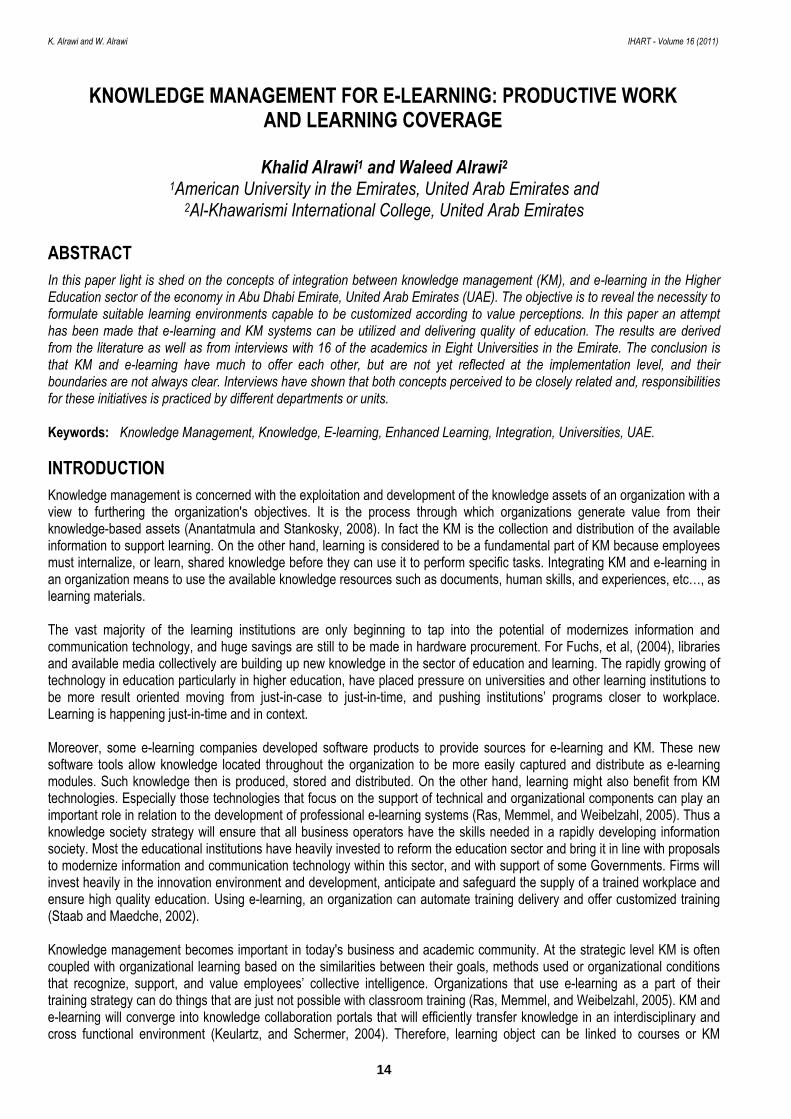
K. Alrawi and W. Alrawi IHART - Volume 16 (2011)
14
KNOWLEDGE MANAGEMENT FOR E-LEARNING: PRODUCTIVE WORK AND LEARNING COVERAGE
Khalid Alrawi1 and Waleed Alrawi2
1American University in the Emirates, United Arab Emirates and 2Al-Khawarismi International College, United Arab Emirates
ABSTRACT
In this paper light is shed on the concepts of integration between knowledge management (KM), and e-learning in the Higher Education sector of the economy in Abu Dhabi Emirate, United Arab Emirates (UAE). The objective is to reveal the necessity to formulate suitable learning environments capable to be customized according to value perceptions. In this paper an attempt has been made that e-learning and KM systems can be utilized and delivering quality of education. The results are derived from the literature as well as from interviews with 16 of the academics in Eight Universities in the Emirate. The conclusion is that KM and e-learning have much to offer each other, but are not yet reflected at the implementation level, and their boundaries are not always clear. Interviews have shown that both concepts perceived to be closely related and, responsibilities for these initiatives is practiced by different departments or units. Keywords: Knowledge Management, Knowledge, E-learning, Enhanced Learning, Integration, Universities, UAE.
INTRODUCTION
Knowledge management is concerned with the exploitation and development of the knowledge assets of an organization with a view to furthering the organization's objectives. It is the process through which organizations generate value from their knowledge-based assets (Anantatmula and Stankosky, 2008). In fact the KM is the collection and distribution of the available information to support learning. On the other hand, learning is considered to be a fundamental part of KM because employees must internalize, or learn, shared knowledge before they can use it to perform specific tasks. Integrating KM and e-learning in an organization means to use the available knowledge resources such as documents, human skills, and experiences, etc…, as learning materials. The vast majority of the learning institutions are only beginning to tap into the potential of modernizes information and communication technology, and huge savings are still to be made in hardware procurement. For Fuchs, et al, (2004), libraries and available media collectively are building up new knowledge in the sector of education and learning. The rapidly growing of technology in education particularly in higher education, have placed pressure on universities and other learning institutions to be more result oriented moving from just-in-case to just-in-time, and pushing institutions‘ programs closer to workplace. Learning is happening just-in-time and in context. Moreover, some e-learning companies developed software products to provide sources for e-learning and KM. These new software tools allow knowledge located throughout the organization to be more easily captured and distribute as e-learning modules. Such knowledge then is produced, stored and distributed. On the other hand, learning might also benefit from KM technologies. Especially those technologies that focus on the support of technical and organizational components can play an important role in relation to the development of professional e-learning systems (Ras, Memmel, and Weibelzahl, 2005). Thus a knowledge society strategy will ensure that all business operators have the skills needed in a rapidly developing information society. Most the educational institutions have heavily invested to reform the education sector and bring it in line with proposals to modernize information and communication technology within this sector, and with support of some Governments. Firms will invest heavily in the innovation environment and development, anticipate and safeguard the supply of a trained workplace and ensure high quality education. Using e-learning, an organization can automate training delivery and offer customized training (Staab and Maedche, 2002). Knowledge management becomes important in today's business and academic community. At the strategic level KM is often coupled with organizational learning based on the similarities between their goals, methods used or organizational conditions that recognize, support, and value employees‘ collective intelligence. Organizations that use e-learning as a part of their training strategy can do things that are just not possible with classroom training (Ras, Memmel, and Weibelzahl, 2005). KM and e-learning will converge into knowledge collaboration portals that will efficiently transfer knowledge in an interdisciplinary and cross functional environment (Keulartz, and Schermer, 2004). Therefore, learning object can be linked to courses or KM

K. Alrawi and W. Alrawi IHART - Volume 16 (2011)
15
systems. The value of e-learning lies in its ability to integrate into enterprise business processes and to better leverage intellectual capital. Knowledge management and e-learning have much to offer each another, but are not yet integrated in practice (Brown, Collins, and Duguid, 1989). This paper is concerned with the effects of KM on e-learning sources development. The purpose of this paper is to take a closer look on the integration between e-learning and KM initiatives in the learning institutions in Abu Dhabi Emirate, UAE, and providing some insights and perceptions in order to successfully integrate the two fields that may be addressed in the future.
DYNAMIC E-LEARNING AND CONCEPTS
In organizations where KM and e-learning systems are used, most working processes are very knowledge intensive and involve many people working at different locations and on different tasks. Knowledge management needs to take into consideration findings from social sciences and technologies. The philosophy of KM transfer provides a path for the convergence of KM and training. To the extent that an organization has automated its KM processes e-learning may become fully integrated partner. On the other hand, learning might benefit from KM technologies; specifically those technologies that focus on the support of technical and organizational components, and at the end can play an important role in relation to the development of professional e-learning systems. Recent research reveals great interest in introducing KM ideas into e-learning systems, and argued that KM can facilitate an e-learning system (McAdam and McCreedy, 1999). Some organizations that offer KM products are adding e-learning components. Hyperwave for example, sells a knowledge management that originated in a university setting. Moreover, organizations will promote open and lifelong learning and, on-the-job training by means of information and communication technologies (Sammour et al., 2008). Universities nowadays trying to combine traditional KM components with reinforced them specifically in classroom or on-the- job-training. These signs of convergence between the two fields are promising, but these institutions should know how to implementing these relations between KM and e-learning in practice. At this end, there is a thin line between learning and development as a focus of attention of training department and knowledge exchange focus of KM teams (Efimova and Swaak, 2002). All the educational institutions need to take a strategic view of their media needs. Advances in the software industry facilitating the integration, although those in the KM and e-learning environments are finding that the distinctions between the two concepts are undesirable or even unnecessary. Ideally, integrating KM and e-learning also means to use all available knowledge resources in an organization such as instructors, documents, and experiences as learning materials. Moreover, trends in e-learning content systems supporting the link with KM, and proponents of integration tend to see e-learning to become a part of KM. Although, organizational and cultural gaps are remain (Lytras and Sicilia, 2005). Practically many universities labs require high volume mono printing for course work and general student related Material. The proliferation of e-learning at the level of technologies enables and support knowledge sharing. Within the training field delivered via internet in terms of a set of courses e-learning moves to more flexible, bringing learning closer to the work. On the other hand, academics should be able to recognize trends and to identify correlations within their daily work or the subjects they are working on. The effectiveness of instructors does not stem from an overabundance of training and preparation but from the instructor‘s ability to work one-to-one with a student and to provide feedback that enables efficient learning (Sun and Scott, 2006). KM is related to an organizational perspective, opposed to that, e-learning emphasizes an individual perspective. KM is concerned with the exploitation and development of the knowledge assets of an organization with a view to furthering the organization's objectives. Management entails all the processes associated with the identification, sharing and creation of knowledge. Learning tasks and activities are an important characteristic of good instructional design (Eveline, 2006). Learning management systems are becoming more popular as a way to track employee competencies and manage career progress. Such systems should handle those functions and, integrates with other applications to incorporate training delivery into enterprise business processes, and this is the real value of such systems. In this respect, learning is considered to be a fundamental part of KM because employees must internalize shared knowledge before they can use it to perform specific tasks. Thus, different and innovative ways of learning are required, and hence a new type of learning systems (Williams, 2003). KM and e-learning will converge into knowledge collaboration portals that will efficiently transfer knowledge in an interdisciplinary and cross functional environment, (Keulartz, and Schermer, 2004). So far research within KM has addressed learning as part of knowledge sharing processes or on providing access to learning resources or experts. This requires systems for the creation and maintenance of knowledge repositories, and for cultivating and facilitating the sharing of

Knowledge Management for E-learning: Productive Work and Learning Coverage
16
knowledge and organizational learning. Therefore KM is the management of processes that govern the creation, dissemination, and utilization of knowledge by mergering technologies, organizational structures, and people to create the most effective learning, problem solving and decision making in the organization (Sammour, et al., 2008).
THE INTEGRATION OF E-LEARNING AND KM IN PRACTICE
Most often, organizations generate value from its intellectual assets, including knowledge assets, involves codifying what partners, customers and employees know, and sharing that valuable information among employees in an attempt to accomplish best practices. It is crucial to note that KM is derived benefits and facilitated by information technologies. Therefore, it is up to individual organizations to determine what information qualifies as intellectual and knowledge-based assets (Ojedo and Owolabi, 2003). The primary objectives of the universities or other educational institutions then is the integration, creation and application of knowledge, and therefore it is accepted to say that KM tools and technologies may be applied to e-learning in different way. For example students working together to aid their learning is through accessing a set of learning materials, or posting their questions or comments on the site. Then customized information can be integrated within a particular environment as the e-learning courses will be delivered through a portal (Widding, 2007). Teaching with interactive electronics media for example can produce learning environments that are unlike any that have been produced in traditional classrooms. The use of high speed networked computation can stimulate both real and imaginary words. The controversy over whether e-learning is more effective than classrooms training has subsided with most experts supporting a mix of technologies. The best mix depends on the skills being taught. Team building and role playing are best accomplished in the classroom. For example ‗‘downtime training‘‘ in teaching institution when teaching process is stopped during semesters holidays, is one good application for delivery of short modules. Knowledge transfer open door to KM (Khan, 2003). A philosophy of knowledge transfer provides a natural path for the convergence of KM and training. Moreover, to the extent that an organization has automated its KM processes, e-learning can become a fully integrated partner, and allows delivery of individualized training geared toward filing competency gaps. In other words organizations seeking to leverage their existing information and its knowledge resources allow them to package the available information into a learning model (Nichols, 2003). The use of a massive storage and retrieval facilities allows the growth of adjunct intelligence, and an external repository of knowledge that can improve human capabilities and performance. Adaptive systems strive to monitor learners and select next learning step (Hoodgins, 2003). Learning environment has to support learning interactions, such as lesson-learned meeting at the end of a project, or asking supervisors and experts for advice. Learning materials in any format can be integrated in the system used in the organization. For example ‗Telecom Austria‘ plans to implement the e-learning Suite as a corporate wide online learning platform for a large number of its employees. The company provides telecommunications services for the telephone networks in Austria. The system used to train employees in the marketing fields such as sales, customer services and support (Woelk and Agarwal, 2002). So far, most e-learning systems do not support recognizing trends or correlations between subjects. The need for careful analysis prior to a system implementation is appropriate. The value of a system‘s solution is integrating knowledge across the organization that can integrate with a wide variety of organization software to monitor processes and deliver better quality of e-learning. When the organization has automated its processes, e-learning can be integrated in ways that support business objectives, greater flexibility in delivery and interoperability (Wang, 2007). E-learning could be much more successful by making it more cognitively adequate, entertaining, and illustrating to the learner. Codified knowledge in systems could be processed and store to provide easier access and retrieval (Figure 1).
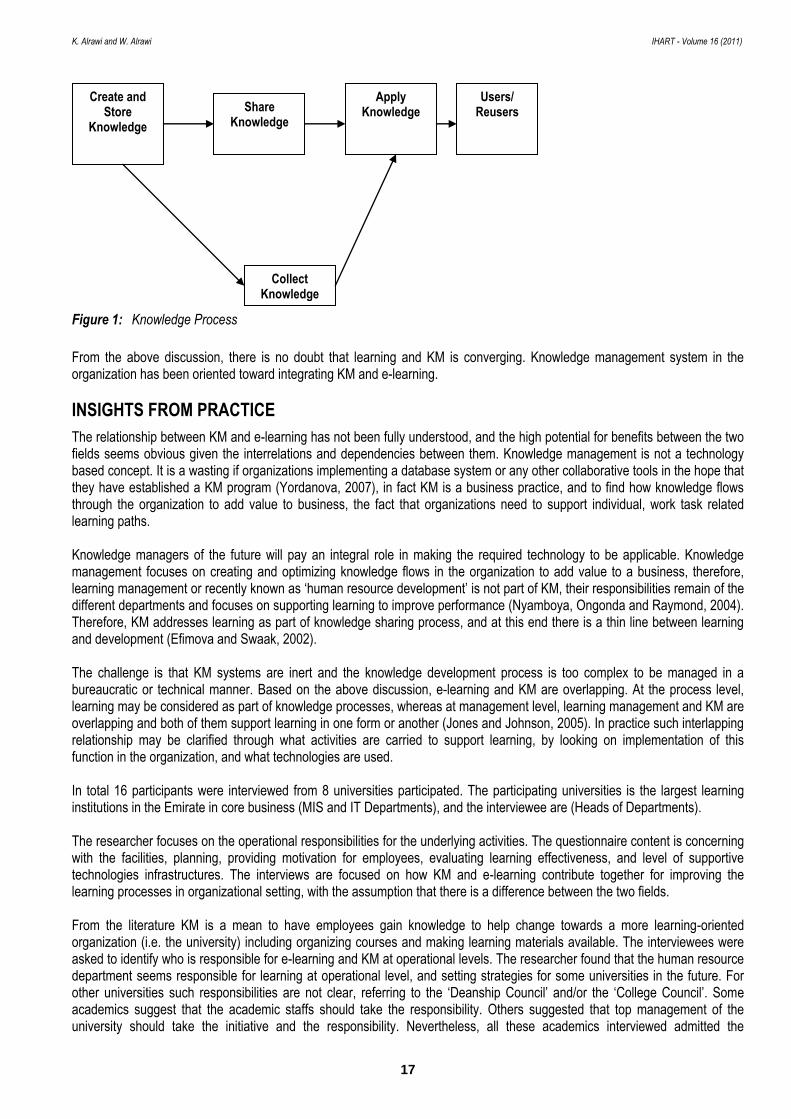
K. Alrawi and W. Alrawi IHART - Volume 16 (2011)
17
Figure 1: Knowledge Process
From the above discussion, there is no doubt that learning and KM is converging. Knowledge management system in the organization has been oriented toward integrating KM and e-learning.
INSIGHTS FROM PRACTICE
The relationship between KM and e-learning has not been fully understood, and the high potential for benefits between the two fields seems obvious given the interrelations and dependencies between them. Knowledge management is not a technology based concept. It is a wasting if organizations implementing a database system or any other collaborative tools in the hope that they have established a KM program (Yordanova, 2007), in fact KM is a business practice, and to find how knowledge flows through the organization to add value to business, the fact that organizations need to support individual, work task related learning paths. Knowledge managers of the future will pay an integral role in making the required technology to be applicable. Knowledge management focuses on creating and optimizing knowledge flows in the organization to add value to a business, therefore, learning management or recently known as ‗human resource development‘ is not part of KM, their responsibilities remain of the different departments and focuses on supporting learning to improve performance (Nyamboya, Ongonda and Raymond, 2004). Therefore, KM addresses learning as part of knowledge sharing process, and at this end there is a thin line between learning and development (Efimova and Swaak, 2002). The challenge is that KM systems are inert and the knowledge development process is too complex to be managed in a bureaucratic or technical manner. Based on the above discussion, e-learning and KM are overlapping. At the process level, learning may be considered as part of knowledge processes, whereas at management level, learning management and KM are overlapping and both of them support learning in one form or another (Jones and Johnson, 2005). In practice such interlapping relationship may be clarified through what activities are carried to support learning, by looking on implementation of this function in the organization, and what technologies are used. In total 16 participants were interviewed from 8 universities participated. The participating universities is the largest learning institutions in the Emirate in core business (MIS and IT Departments), and the interviewee are (Heads of Departments). The researcher focuses on the operational responsibilities for the underlying activities. The questionnaire content is concerning with the facilities, planning, providing motivation for employees, evaluating learning effectiveness, and level of supportive technologies infrastructures. The interviews are focused on how KM and e-learning contribute together for improving the learning processes in organizational setting, with the assumption that there is a difference between the two fields. From the literature KM is a mean to have employees gain knowledge to help change towards a more learning-oriented organization (i.e. the university) including organizing courses and making learning materials available. The interviewees were asked to identify who is responsible for e-learning and KM at operational levels. The researcher found that the human resource department seems responsible for learning at operational level, and setting strategies for some universities in the future. For other universities such responsibilities are not clear, referring to the ‗Deanship Council‘ and/or the ‗College Council‘. Some academics suggest that the academic staffs should take the responsibility. Others suggested that top management of the university should take the initiative and the responsibility. Nevertheless, all these academics interviewed admitted the
Create and Store
Knowledge
Apply Knowledge
Collect Knowledge
Share Knowledge
Users/ Reusers

Knowledge Management for E-learning: Productive Work and Learning Coverage
18
importance of learning, again responsibility is not clear. The researcher beliefs that although human resource management is to address business needs with the right knowledge, but the technical department in the university is more aware to provide courses and provide training requirements to achieve skills‘ improvement. Engaging learners and actively involving them in the learning process often increases motivation and learning gain. Those academics in the survey admitted that evaluating learning effectiveness and motivation were considered crucial, but this aspect is performed by some universities/departments only. The researcher concluded through his discussions, that these learning institutions didn‘t have document repositories/database systems efficient for facilitating the learning process, and on the other hand – in case of existence-responsibilities for managing such systems varied across other departments. Therefore, line of responsibility is not clear and none of these institutions had proper solutions yet. It is accepted that up to the professionals to share knowledge and to learn. In other part of the interview, interviewees were asked to clarify the strategic goals of e-learning and KM. One may expect a different views and perceptions. The interviewees had difficulties in defining the strategic goals, and indicated that goals were much intertwined. Only two participants expressed that both fields (e-learning and KM) are concerning with individuals (see Appendix 1). The basis for such expression is that KM organizes all types of knowledge exchange activities, such as organizing database, and making courses materials available. Standards play an important role both in e-learning systems as well as in KM systems, and KM technologies can support the learners‘ needs and individual learning processes. Participants asked about the technology used in e-learning and KM. Five universities used different systems to facilitate the learning process such as- lotus learning spaces, and in-house system, also these departments has document management systems with information about individual and job specifications. During the discussions the researcher concluded that the majority of these universities are looking for some form of integration, and believes that technical integration will enhance the learning process and KM in general, and that lack of integration is a serious problem. However, seven of the interviewees do not believe that technology will bring solutions. They said that solutions are mainly with human initiatives, and integration is only to reduce the usability of technology.
CONCLUSION
E-learning is becoming the common method of delivery education and growing rapidly. In this paper an attempt has been made that e-learning and KM systems can be utilized for delivering quality of education. Knowledge management and e-learning are perceived to be closely, and responsibilities for these initiatives are supervised by different department or units in these universities, therefore, logistical technologies are hardly related. Emphasis was made on the main characteristics of KM and e-learning. Both domains can be utilized within the organization. The emergence of the soft ware as a standard for e-learning will provide strong support for the integration with KM. E-learning is considered as systematically and organized activities in which the academics and the learners use technology to facilitate their collaboration and relationships. Interview in eight universities shown that integration between the two fields is not reflected at the implementation level in its absolute understanding. Different units or departments are responsible for supporting e-learning process and, practicing systems in an attempt to support learning are hardly related. Then learning object methodology coupled with assessment tools could be used to provide access to KM and e-learning systems. Feasibility of integration between KM and e-learning in these universities is not clear, and practitioners need some motivation and time to bridge the organizational barriers gap and to link technological support and interventions to enhance the learning process. However, despite implementation difficulties both domains are the way for future distance online education.
REFERENCES
Anantatmula, S., and Stankosky, M., (2008), Knowledge Management Criteria For Different Type of Organizations, Int. J. Knowledge and Learning, Vol. 4, no. 1, pp. 18-35.
Brown, S., Collins, A., and Duguid, P., (1989), Situated Cognition and the Culture of Learning, Educational Researcher, Vol. 18, No. 1, pp. 32-42.
Eveline, V., et al., (2006), A Hierarchical Characterization of A Live Streaming Media Work-load, IEEE/ACM Transactions on Networking, Vol. 14, No. 1, pp. 133-146.

K. Alrawi and W. Alrawi IHART - Volume 16 (2011)
19
Efimova, L., and Swaak, J., (2002), In ‗‘The New Scope of KM in Theory and Practice‘‘, proceeding of the 2nd EKMF Knowledge Management Summer School, Sophia Antipolis, France, pp. 63-69.
Fuchs, M., et al., (2004), Digital Libraries, in Knowledge Management: an e-learning case study, International Journal of Digital Library, Vol. 4, No.1, pp. 31-35.
Hodgins, W., (2003), Information about All the Learning Students Being Developed. Available at: WWW.Learnativity.com/standards.html.
Jones, S., and Johnson, C., (2005). Professors Online: The Internets‘ Impact on College Faculty. Available at: http://firstmonday.org/issues10_9/jones/index.html.
Keulartz, J, and Schermer, M., (2004), Ethics in Technological Culture: A Programmatic Proposal for a Pragmatist Approach, Journal of Science Technology Human Value, Vol. 29, No. 1, pp. 3-29.
Khan, B., (2003), Building Effective Blending Learning Programs, Journal of Educational Technology, Vol. 43, No. 6, pp. 51-54. Lytras, M., and Sicilia, M., (2005), Knowledge Society: A Manifesto for Knowledge and Learning, Int. J. Knowledge and
Learning, Vol. 1, No. 1, pp.1-11. McAdam, R., and McCreedy, S., (1999), A critical Review of Knowledge Management Models, The Learning Journal, Vol. 6,
No. 3, pp. 91-101. Nyamboya, C, Ongonda, M., and Raymond, W., (2004), Experiences in The Use of the Internet at Egerton University Library,
Njoro-Keyna, DESIDOC Bulletin on Information Technology, Vol. 24, No. 5, pp. 11-24. Nichols, M., (2003), A Theory for learning, Journal of Educational Technology, Vol. 6, No. 2, pp.1-10. Ojedo, A., and Owolabi, E., (2003), Internet Access Competences and the Use of the Internet for Teaching and Research
Activities of Botswana Academic Staff, African Journal of Library Archives and Information Science, Vol.13, No. 1, pp. 43-53.
Ras, E., et al.,(2005), Using Web logs for Knowledge Sharing and Learning In Information Spaces, Journal of Universal Computer Science, Vol. 11, No. 3, pp. 394-409.
Ras, E., Memmel, M., and Weibelzahl, S., (2005), Professional Knowledge Management-Experiences and Visions, 3rd Conference, Springer Verlag, Berlin.
Sammour, G., et al., (2008), The Role of Knowledge Management and E-learning in Professional Development, Int. J. Knowledge and learning, Vol. 4, No. 5, pp. 465-477.
Staab, S., and Maedche, A., (2002), Knowledge Portals- Ontology‘s at work, Available at:http://Citeseer.nj.nec.com/382983.html.
Sun, P., and Scott, J., (2006), Process Level Integration of Organizational Learning, Vol.2, Int.J. Knowledge and Learning, Nos.3-4, pp. 308-319.
Widding, L., (2007), Entrepreneurial Knowledge Management and Sustainable Opportunity Creations: A Conceptual Framework, Int. J. Learning and Intellectual Capital, Vol. 4, Nos. 1-2, pp. 187-202.
Williams, R., (2003), Integrated Distributed Learning With Just-in-context Knowledge Management, Electronic Journal of E-learning Vol.1, No. 1. pp. 45-50.
Woelk, D., and Agarwal, S., (2002), Integration of E-learning and Knowledge Management. Available at: http://elasticknowledge.com/ElearnandKM.pdf.
Wang, Y-M., (2007), Internet Uses in University Courses, International Journal of E-learning, Vol. 6, No. 2, pp. 279-292. Yordanova, K., (2007), Integration of Knowledge Management and E-learning, Common Features, International Conference on
Computer Systems and Technologies, Sofia, Bulgaria, pp. 14-15.

Knowledge Management for E-learning: Productive Work and Learning Coverage
20
APPENDIX 1: STRATEGIC GOALS FOR KM AND E-LEARNING
Knowledge Management Examples:
- Enhance employee retention rates by recognizing the value of employees‘ knowledge and rewarding them for it.
- Creating environments to support knowledge sharing with reusers.
- Using knowledge in an attempt to achieve the organizational goals.
- Development of knowledge –sharing attitude and employees‘ skills.
E-learning Examples:
- To allows the communication with the instructors and peers.
- To provide courses for learners and improving their skills.
- To provide collaboration tools that engage student in a range of tasks and learning environment.
- To develop the instructors‘ perceptions and initiatives.
- To facilitate the usability of the learning objects and contents.

J. Fisher and D. N. Burrell IHART - Volume 16 (2011)
21
THE VALUE OF USING MICRO TEACHING AS A TOOL TO DEVELOP INSTRUCTORS
Joann Fisher1 and Darrell Norman Burrell2,3,4
1Nova Southeastern University, USA, 2Virginia International University, USA, 3A.T. Still University, USA and 4Marylhurst University, USA
ABSTRACT
New teachers are often faced with having to learn how to be effective. The challenge is that book knowledge does not always apply in the real world of teaching. Effective teaching is as much about passion as it is about reason. It's about not only motivating students to learn, but instruction them how to learn, and doing so in a manner that is relevant, meaningful, and memorable. It's about caring for your craft, having a passion for it, and conveying that passion to everyone, most importantly to your students. Effective instruction is also about bridging the gap between theory and practice. Effective instruction is about not always having a fixed agenda and being rigid, but being flexible, fluid, experimenting, and having the confidence to react and adjust to changing circumstances. Effective instruction is about not always having a fixed agenda and being rigid, but being flexible, fluid, experimenting, and having the confidence to react and adjust to changing circumstances. Effective teachers work the room and every student in it. They realize that they are the conductors and the class is the orchestra. All students play different instruments and at varying proficiencies. This paper explores the nuances of effective instruction and provides a framework for the use of ―Micro-Teaching‖ as a tool to improve the craft of instructors.
INTRODUCTION
Education has become a clear focus of attention for balancing the budget as a means of meeting school district needs by laying off or cutting teachers (Sterrett & Imig, 2011). Instead of teacher shortages there is a constant call of teacher layoffs. This has been done through frozen pay raises, underfunding for supplies and technology, and a lack of funds for building upgrades. Where once teaching was the main focus for our children, it has now become a target for budget balancing. Five years ago no one saw this coming—the focus on education as a reduction issue for spending. Those hit the hardest are ―at-risk‖ students whose numbers are rising. Benchmarks accountability is increasing as well as the deteriorating conditions of school buildings infrastructure nationwide. With all this, everything must be done to maintain high quality education for our students through quality teachers without an excuse for a slowdown in growth for our educational development. The strength of our nation will be determined by the development through education of our future leaders.
NEW TEACHERS
During these difficult economic times, new teachers are being hired and face problems that they are not taught to handle in school (Sterrett & Imig, 2011; Melnick & Meister, 2008, & Le Maistre & Paré, 2010). Getting a degree, which includes paratica, internships, and work study programs, is not always enough to prepare new teachers for the classroom experience (Le Maistre & Paré, 2010). Newcomers to the teaching profession must be prepared for the experience through a transition process. Beginning teachers are new teachers who have been teaching for three years (Melnick & Meister, 2008). The most serious problem areas for these teachers are: classroom discipline, motivating pupils, dealing with individual differences, assessing pupils‘ work, relations with parents, organization of class work, insufficient materials and supplies, and dealing with problems of individual pupils. Lesser problems are relations with colleagues, planning of lessons and schooldays; effective use of different teaching methods; awareness of school policies and rules; determining learning level of students; knowledge of subject matter, burden of clerical work, and relations with principals/administrators. After completing university courses, teacher candidates are required to pass their practicum, reach an acceptable level of performance, and then become certified to teach (Le Maistre & Paré, 2010). New teachers need help with coping strategies because of a lack of classroom problem solving strategies which is gained through experience. School leaders must recognize the gap between veteran and new teachers so that assistance can be given to help them gain the experience they need to be successful. Mentoring, technology, collaborative leadership, and working within professional organizations are four areas that were found to assist new teachers with gaining experience (Sterrett & Imig, 2011).

The Value of Using Micro Teaching as a Tool to Develop Instructors
22
According to Le Maistre and Paré (2009) factors explaining the increase in teachers‘ workload are greater societal expectations and lower societal recognition; greater accountability to parents and policy-makers; pedagogical and curriculum changes being implemented at an increasing rate; increased need for technological competence; increased demands beyond the pedagogical task; increasing diversity among students; and more administrative work (p. 3). Other problem areas for new teachers are (1) attrition caused by a lack of support as the main reason with what is expected and what is the realty of teaching; (2) problem solving is caused by new teachers not having the experience or knowledge of what to do find solutions; (3) inadequate or non-existent mentoring; (4) satisficing is a construct that refers to strategy in decision making situations where the solution for the problem will work and one that the new teacher can live with (Le Maistre & Paré, 2010). Sterrett and Imig (2011) strongly support mentoring of new teachers by either a veteran teacher or colleague in the areas of classroom management, alignment of curriculum, and managerial minutia. Classroom management involved the new teacher learning to build a classroom community as well as being consistent with good communication skills. It requires new teachers learn the school or district‘s approach to classroom management rather than punitive structures. The alignment of curriculum involves the new teacher understanding the material and being sure it is appropriately paced for the age group. New teachers need either a mentor or veteran colleague to assist with the completion of forms, meeting deadlines, and protocols which can be overwhelming. Even though budgets are tight there are opportunities for the use of technology for engaging students through interactive lessons, communicating with parents, interacting with colleagues, and using underused resources. This can be accomplished through the use of SMART BoardTM, or a web site and communicating with parents using confidentiality with email, Skype, twitter. Using some of the classroom technology developed but not used because the United States has spent billions of dollars developing projects that were either not used, put on the shelf, or set aside for something newer or more up to date. It is important that new teachers stay up with the latest trends in education and are aware of changes by continuing to learn. Becoming a collaborative leader is important and involves subject/grade level or district leadership; peer observations, and community leadership (Sterrett & Imig, 2011). It is suggested that new teachers take on assignment by volunteering when given the opportunity with a veteran colleague review and validate what was done before final submission. Visiting colleagues will give a new teacher an opportunity to seek advice about pedagogy and working with students. Community leadership can be accomplished by volunteering at reading clinics, toy drive efforts, or working with tutoring through local organizations. Making contact with professional organizations can be accomplished through awareness of current policy issues, advocate through service, and sharing ideas. The new teachers of today will be the veteran educator of tomorrow. It is important that new teachers learn from more experienced colleagues. As new teachers gain experience they can pass on their new ideas. The most serious problem for new teachers is classroom management which affect students learning Clement, 2010). Without proper training, it becomes easy for a new teacher to manage as they were managed or resort to other techniques they may have been told or seen. Some of the myths for classroom teaching are (1) you can be taught classroom management because it is something you have to learn, (2) begin firmly to show you are in charge, (3) when all else fails turn the lights on and off to get the students attention, (4) keep a stern look by not smiling, (5) single out the student causing all the problems and focus on them by making an example to scare others. Teaching classroom management and experiencing it are different things completely and many new teachers are not properly prepared for working in the classroom with students. Classroom management can contribute to a beginning teacher becoming either a good or bad teacher through how well they problem solve or handle situations in the classroom. Suggested reading for classroom management by Dr. Mary C. Clement (2010) recommends: Lee and Marlene Canter‘s Assertive Discipline (2010) and Succeeding with Difficult Students (1993), Harry and Rosemary Wong‘s The First Days of School (2009), and Carol Fuery‘s Discipline Strategies for the Bored, Belligerent, and Ballistic in Your Classroom (1994). When Dr. Clement conducted her research (2002), she found few students could name a writer or theorist in the field of classroom management. Today, there are over 11,000 books on the topic. Classroom management is not a requirement by some states for teacher certification but should be a part of a requirement for school and universities in preparation for beginning teachers.
BAD TEACHING
A Nation at Risk (1983) a report published by the U.S. Department of Education set off other reports that saw the education problem as ―bad teachers‖ with others seeing the problems as ―bad schools of education‖ and low standards (Blake, 2008). The bad schools of education referred to how teachers were trained which has contributed to the creation almost 25 years later

J. Fisher and D. N. Burrell IHART - Volume 16 (2011)
23
alternate training programs. The report recommended raising admission standards for four year colleges with testing students at different levels from high school to college or work. Some are concerned that A Nation at Risk focused more on producing satisfying various agendas instead of producing independent thinkers. Many solutions have been found for improving teacher quality as well as identifying and firing poor performers (Aubry, 2011& Wilson, 2010). The questions are who is most affected by incompetent teachers and do the new solutions really work? Those most affected are inner-city Black children who are seen as not wanting to learn, at the bottom for achieving success, and having difficulty becoming academically successful (Aubry, 2011). The process for firing ineffective teachers, even with changes in the process, is cumbersome. Some of the problems rest with parents, community leaders, and uncaring Black leadership which are seen through their silence (Aubry, 2011). Other areas of concern are the low expectations for teachers and widespread incompetence are seen as main contributors to the miseducation of Black students. Black leadership, parents and local communities need to come together to speak out for better reform for teaching effectiveness for Black students because these students are seldom included in the debate regarding firing of incompetent teaches (Aubry, 2011). Poor children living in areas of poverty with inexperienced and ineffective teachers including poor performing principals are also greatly affected. In Los Angeles, an example of an ineffective teacher is a young man showing his teacher and class mates the slit wrist marks of his attempted suicide (Aubry, 2011). His teacher made a joke about it in front of the entire class accusing the student of being unable to commit suicide. Even though the teacher was fired for poor judgment, the decision was overturned by the review commission. The Los Angeles Unified School District (LAUSD) proposed revising state teacher discipline laws and received strong opposition from board members, unions, and a state senator.
DEVELOPING TEACHERS
The University of Saskatchewan‘s study (2010) found beginning teachers found planning and collaboration with other teachers and professional development as the least need of support during their early years of study (Prytula, Hellsten, & McIntyre, 2010). The University examined two stages of teacher development, pre-service and in-service. It has been found that a change must be made regarding how teacher candidates are taught because universities and schools can teach in the same old way and expect new ideas and ways from new teachers. A continuum of knowledge and learning must be entrenched with a generation of knowledge that has been learned. The practice of collaboration and planning will enhance new teachers learning and student centered practices. For in-stage service, teachers developing the leadership skill in approaching knowledge and learning in non-traditional ways are important for developing a learning community which consists of an environment of learning, trust, and improvements (Prytula, Hellsten, & McIntyre, 2010). The move from pre-service to in-service teaching may be difficult and at times lonely with teacher preparation program inadequately preparing beginning teaches with the knowledge, skills, and dispositions requisite to make that transition (Melnick & Meistger, 2008). It should be noted that the pre-service teaching is done in a controlled classroom environment without any children and does not adequately prepare beginning teachers for their first teaching assignments. At university and school levels, collaborative action research is important for providing a diverse database for training materials, curricula, and theoretical discussions. which has had a positive effect on beginning teachers improving writing, mathematics, and problem-solving (Mitchell, Reilly, &Logue, 2008). The development of a community of practice that focuses on collaborative action research enables the beginning teacher to participate in learning relationships. New and creative methods of learning for beginning teachers are encouraged for learning must be continuous. Better teachers cannot be produced using the same old techniques—creativity is important. A video was developed as a form of student-centered creative teaching for the purpose of improving teaching practices for math teachers (Gainsbury, 2009). The technique was similar to microteaching. Previously, videos were made to professional using people to demonstrate teaching techniques. Some teachers used videos as a tool to assist beginning teachers with understanding the teaching process or expose them to classroom learning. The videos used in this study were amateur, with no subheadings or titles, and focused on teacher and student interaction, and other activities in the classroom. No emphasis was made on classroom management, only the capturing of learning and student centered work. The finished videos were used at University level to show students actual classroom work as a form of collaboration for new learning. The finished video took about ten minutes. The teachers in the segments were presented as local colleagues. Using this form of teaching, three request were made by the professor at the end of term:
(1) Did viewing the video affect the students in the course learning?

The Value of Using Micro Teaching as a Tool to Develop Instructors
24
(2) Comments were requested regarding any of the videos that were shown and its effect. (3) Comments on how the video influenced the work product for the course, teaching practice, or how the students in the
course thought about teaching.
TEACHING METHODS
Various teaching processes exist for teaching children to learn as it identifies and eliminates bad teachers. Some believe this is accomplished through standardized teaching which is a process consisting of common units, lessons, core assignments, and assessments for grade levels which are commonly used (Wilson, 2010). The advantage of teachers using this process is to develop equity for students by having the same experiences because of different teachers. Also, students that move around a lot would receive the same teaching from another school in the area or district because all classes would be taught the same. A form of control over teachers‘ actions is developed by using a mandated uniform program. The problem becomes misidentified with teachers losing their decision-making abilities for teaching with self development through knowledge, experience, and reflection overlooked (Wilson, 2010). By taking away a teacher‘s ability to make good decisions about teaching may affect core values for teaching such as choice, appropriate level, and shared experience. Wilson (2010) advocates more teacher freedom because she believes there is no equality in uniformity. An example given was rules were imposed affecting students‘ book choices at library level. Students were allowed to select books for their grade level in the classroom and at the library which did not allow them to grow academically because their skill level may be higher or their desire to grow greater. If they selected a book that was higher than their grade level they were not allowed to use it in the classroom or check it out of the library. Another form of creative teaching is microteaching which is a proven and successful teaching technique (Dr. D. Burrell personal communication, May 3, 2011). The importance of this technique is to prepare beginning teachers for actual classroom teaching by strengthening their approach to teaching, identifying their personal strengths, assisting with developing empathic understanding of students as learners, enhancing the student teacher‘s teaching style, and improve the student teacher‘s ability to receive feedback (Satheesh, 2011, & Gavrilović et al., 2011). Microteaching can be used at undergraduate, masters or professorship levels of education as well as for other areas of learning. Student teachers are given 5 minutes to teach a lesson to their teacher and peers in a small group setting using flipcharts, overheads, and handouts. Helpful tips for teaching are given as well as instruction for how to prepare their session. Effective feedback and questions for reflection are encouraged. The United States investment in human capital for development of quality teachers is a sound investment for the development of human resources to lead and train our next generation. For this reason we need quality teachers so that student teachers can perform their learning comprehensively and efficiently. Because teaching means different things with teaching done differently from person to person and situation to situation, microteaching is an excellent choice for preparing student teachers for the future. The purpose of microteaching is to strengthen a student teacher‘s core value for teaching as well as their understanding of what is expected of them. It also gives them an ability to hear and see their strengths and weaknesses. The teaching cycle includes planning, teaching, feedback, replanning, reteaching, and refeedback. The rationale for the teaching procedure is based on behavior modification which involves the student teaching knowing the components of skill to be practices with practice during each step, and getting feedback on performance for improvement. Core teaching skills include probing questions, explaining, illustrating with examples, stimulus variation, reinforcement, classroom management, and using Blackboard.
Teaching is a complicated process but it can be analyzed into simple teaching tasks called teaching skills.
Teaching skill is the set of behaviors/acts of the teacher which facilitates pupils‘ learning.
Teaching is observable, definable, measurable, demonstrable and can be developed through training.
Micro-teaching is a teacher training technique which plays a significant role in developing teaching skills among the pupil teachers.
The procedure of micro-teaching involves the following steps: Plan →Teach →Feed-back →Re-plan →Re-teach →Re-feedback. These steps are repeated till the pupil-teacher attains mastery in the use of the skill.
The micro-teaching cycle consists of all the steps of micro-teaching.
For practicing teaching skill the setting of micro-teaching involves : (i) a single skill for practice

J. Fisher and D. N. Burrell IHART - Volume 16 (2011)
25
(ii) one concept of content for teaching (iii) a class of 5 to 10 pupils (iv) time of practice 5 to 10 minutes
Systematic use of feedback plays a significant role in the acquisition of the skill up to mastery level.
After the acquisition of all the core skills it is possible to integrate them for effective teaching in actual classroom-situations.
USING MICRO TEACHING
Microteaching has been successfully used in the United States and in other countries to assist teacher students improve their skills (Napoles, 2008; Butler, 2001; Popovich, & Katz, 2009; Mensa, et al., 2008; Mastromarino, 2004; & Martin, & Campbell, 1999). In the field of music, microteaching has been very useful for teacher effectiveness and performance using the microteaching technique (Butler, 2001; & Napoles, 2008). Two studies are examined seven years apart in the field of music. The first study, (Butler, 2001) involved 15 undergraduate students and evaluated teacher effectiveness using microteaching during 2 sessions. It was found the microteaching helped shaped the students understanding of what it meant to teach. The second study, Napoles (2008), involved 36 students was conducted after each taught three microteaching segments. Afterwards the instructions, peers, and students evaluated the segments. The students evaluated themselves on areas they did well, suggestions for improvement, and effectiveness scores with ratings compared. A week later the students were asked to recall their evaluations an important aspect of the survey to see if students retained what they had learned from the sessions. This study developed by focusing on more than the teaching but the strengthening of students to assist them with self-development. Microteaching was incorporated in a professional development class (Popovich, & Katz, 2009) and included communication skills, critical-thinking skills, and problem-solving abilities. The development of this class included a peer evaluation and a DVD of the student‘s presentation with a requirement to write a reflective essay of their performance. The findings showed microteaching is a valuable tool for assisting students with development the skills of communication, critical-thinking, and problem-solving so students can think on their feet. Their development is aided by fellow classmates input for students‘ personal development. Microteaching was used twice a month in a Distance Education Programme in Ghana, (Mensa, et al., 2008), using a 78 item questionnaire collecting data from 895 female participants. Classes were set up for female distance learners on weekends with face-to-face tutorials. Specific problems were found for the students based on their sex with an advocacy for increasing integration of Information Communication Technology (ICT) systems such as e-portfolio, blackboard virtual learning environment for teaching and learning. Also, more use of audio and video conferencing, radio broadcast including the use of other electronic resources which is found in microteaching. Microteaching is used in the field of therapy, (Mastromarino, 2004), to help convert theoretical knowledge into practical applications during interaction with patients. Five techniques were used: (1) role playing and video or audio recording, (2) self-observational and/or supervision (monitoring), (3) reinforcement (dissonance), (4) reexperimentation, and (5) practice of the acquired abilities. It shows people improve their performance using this method of teaching. The United Kingdom used microtraining for managing and participating in group discussion (Martin, & Campbell, 1999). Recommendations were made by the Dearing Committee (1977) to develop student skills in universities and colleges in the area of communicative abilities. It was believed that the development of students ability to communicate during their higher learning experience was necessary a quality education. The students viewing themselves on video proved were helpful in developing their skills.
DEVELOPMENT OF NEW UNIVERSITY PROFESSORS
Microteaching is an excellent tool for preparing beginning teacher candidates for teaching at school to university professorship level. It was a technique first developed in the early and mid 1960‘s at Sanford University to improve verbal and nonverbal areas of teacher‘s speech and general performance (Gavrilović, et al., 2011). Dr. Dwight Allen and a group of his colleague decided to improve student‘s teaching of science a model was developed that included teaching, with review and reflect, and re-teaching. Later it was used to teach language and from there a similar model was developed, Instructional Skills Workshop (ISW), for college and institute faculty.

The Value of Using Micro Teaching as a Tool to Develop Instructors
26
Since that time the 1960‘s microteaching has been used in many schools, universities, and programs. It has a strong background of success and has been used for five decades. Microteaching is an excellent tool for developing new university professor and can be done through the creation of a required course that includes collaboration and journaling as well as an assigned mentor. Videos should be done of the professor teaching and viewed with peers to focus on the particular elements of the lesson or teaching style. Observations may include clarity of lesson explanation, voice and body language, and level of group interaction. It is suggested that new university professors also are included in collaboration with veteran professors as well as assigned a mentor. Even though microteaching can be given as a one day event, it should be given as a longer course for new professors to assist with adjustment to academic activities.
REFERENCE
Aubry, L. (2011, March 17). Bad teachers are rarely fired. Why? Los Angeles Sentinel, 11, A7, 1. Blake, S. (2008). ―A nation at risk‖ and the blind men. Phi Delta Kappan, 89, 8, 601-602. Butler, A. (2001). Preservice music teachers‘ conceptions of teaching effectiveness microteaching experiences, and teaching
performance. Journal of Research in Music Education, 49, 3, 258-272. Clement, M. C. (2010) Preparing teachers for classroom management: The teacher educator‘s role. The Delta Kappa Gamma
Bulletin, Fall, 41-44. Gainsburg, J. (2009). Creating effective video to promote student-centered teaching. Teacher Education Quarterly, Spring,
163-178. Gavriliović, T. Ostojić, M., Sambunjak, D., Kirschfink, M., Steiner, T., and Stritmatter, V. (n.d.) Chapter 5: Microteaching.
Retrieved May 4, 2011 from http://www.bhmed-emanual.org/book/export/html/36 Le Maistre, C., & Paré, A. (2010). Whatever it takes: How beginning teachers learn to survive. Teaching and Teacher
Education, 26, 3, 559-564. Martin, D., & Campbell, B. (1999). Managing and participating in group discussion: a microtraining approach to the
communication skill development of students in higher education. Teaching in Higher Education, 4, 3, 327-337. Mastromarino, R. (2004). The use of microteaching in learning the redecision model: A proposal for an observation grid.
Transactional Analysis Journal, 34, 1, 37-47. Melnick, S. A., & Meister, D. G. (2008). A comparison of beginning and experienced teachers‘ concerns. Education Research
Quarterly, 31, 3, 39-56. Mensa, K. O., Ahiatrogah, P. D., & Deku, P. (2008) Challenges facing female distance learners of the University of Cape
Coast, Ghana. Gender and Behavior, 6, 2, 1751-1764. Mitchell, S. N., Reilly, R. C., & Logue, M. E. (2009). Benefits of collaborative action research for the beginning teacher.
Teaching and Teacher Education, 25, 2, 344-349. Napoles, J. (2008). Relationships among instructor, peer, and self-evaluations of undergraduate music education majors‘
micro-teaching experiences. Journal of Research in Music Education, 56, 1, 82-91. Popovich, N. G., & Katz, N. L. (2009). Instructional design and assessment. A microteaching exercise to develop performance-
based abilities in pharmacy students. American Journal of Pharmaceutical Education, 73, 4, 1-8. Prytula, M. P., Hellsten, L. M., & McIntyre, L. J. (2010). Perception of teacher planning time: And epistemological challenge.
Current Issues in Education, 14, 1, 4-29. Retrieved from http://cie.asu.edu/ojs/index.php/cieatasu/article/view/437 Satheesh, K. (2008, November 15). Introduction to micro-teaching [Web log post]. Retrieved from
http://sathitech.blogspot.com/2008/11/introction-to-micro-teaching.html Sterrett, W. L., & Imig, S. (2011). Thriving as a new teacher in a bad economy. Kappa Delta Pi Record, 47, 2, 68-71. Wilson, M. (2010). There are a lot of really bad teaches out there. Phi Delta Kappan, 92, 2, 51-55.
B. S. Guy IHART - Volume 16 (2011)
27
USING A MENTOR-BASED PROGRESSIVE SALES PROJECT IN A PROFESSIONAL SELLING COURSE
Bonnie S. Guy
Appalachian State University, USA
ABSTRACT
Experiential teaching and learning methods have been consistently demonstrated to achieve better outcomes than traditional lecture-based, passive teaching and learning techniques. Behavioral skills courses, such as a course in Personal Selling, not only lend themselves to, but virtually demand the use of such approaches to assist students in acquiring the knowledge, skills, and competencies necessary to succeed in selling and a professional sales environment. This paper describes a course created using the active-learning framework, and focuses specifically on a semester-long, mentor-guided Progressive Sales Project. This project allows the student to experience how a salesperson executes each step of the professional selling process to culminate in a successful sales presentation. Students are able to role play a realistic sales presentation to a buyer who has particular expertise on the product or service being sold and on buyers who purchase these products or services. Details of the project components and implementation are provided. Both formal and anecdotal evidence suggests outcomes including increased positive attitudes of students towards salespersons and the profession of selling, increased student willingness to consider selling as an occupational alternative, student expression of confidence in their abilities to successfully execute the selling process, demonstrated acquisition of selling skills and competencies, and the offering of employment to students by their mentors.
INTRODUCTION
Experiential teaching and learning methods have been consistently demonstrated to achieve better attitudinal and learning outcomes than traditional lecture-based, passive teaching and learning techniques (Fink 2003; Kolb and Kolb 2005). Benefits empirically demonstrated include more enjoyable and memorable learning experiences (Karns 2005), increased student motivation and enthusiasm (Dabbour 1997; Sautter 2007, Young 2005), higher levels of self-confidence (Anderman and Young 1994; Inks and Avila 2008), improved critical thinking and problem solving skills (Crespy et al. 1999; Gremler et al. 2000; Hunt and Laverie 2004; Klebba and Hamilton 2007; McBane and Knowles 1994), and enhanced retention and conceptual learning as well as increased performance on assignments (Fink 2003; Hamer 2000; Lawson 1995; Perry et al. 1996). Behavioral skills courses, such as a course in Personal Selling, are increasingly being recognized by educators and practitioners alike as important to the marketing curriculum in colleges and universities (Deeter-Schmelz and Kennedy 2011; Michaels and Marshall) These courses not only lend themselves to, but virtually demand the use of such approaches to assist students in acquiring the knowledge, skills, and competencies necessary to succeed in selling and a professional sales environment (Michaels and Marshall 2002). Basic interaction and communication skills such as establishing eye contact, shaking hands, learning names, giving compliments, and listening have been taught via in-class exercises (Schaefer 2002) as well as more focused sales process skills. A review of sales courses illustrates the consensus that role playing, in one form or another, is a critical technique to employ in selling courses, providing concept application and directive feedback (Deeter-Schmelz and Kennedy 2011; Futrell 2009; Marks 1997; Sojka and Fish 2008; Weitz, Castleberry, and Tanner 2009). In fact, some suggest that the sales role play may be the best sales training method short of on-the-job experience for the acquisition of both verbal and nonverbal skills (Sellars 2005; Sojka and Fish 2008; Widmier, Loe and Selden 2007). Role plays, while highly effective teaching tools, are typically simulated and artificial experiences. To the extent that they can be incorporated with interactions with practitioners and/or real-world learning experiences, skill acquisition is enhanced and students are further socialized to the professional environment. Examples include shadowing salespeople (Marshall and Michaels 2001; Neeley and Cherry 2010), using actual sales and business persons as buyers in and/or evaluators of student role play presentations (Totten 2010; Tyler and Hair 2007), and working with businesses and community partners to produce tangible products or outcomes like sales training manuals, product demonstration videos, and business literature (Inks and Avila 2008). Some experiential learning approaches in have involved selling actual products, services or ideas to real persons or buyers. For example, student sales teams sold a professional sales minor to academic disciplines outside the business program, including geology, health sciences, mathematics, leisure services administration, and sports management (Neeley and Cherry 2010), while in another course, students used cold calling to sell educational products, resulting in behavioral skills

Using a Mentor-Based Progressive Sales Project in a Professional Selling Course
28
acquisition as well as attitudinal development and change, achieved through multiple sales calls and feedback sessions (Prasad 2005). The purpose of this paper is to describe some active-learning, experiential teaching methods employed in a college-level professional selling course, with particular emphasis on a semester-long Progressive Selling Project. In keeping with many of the methods, suggested as effective in the reviewed literature, the project incorporates the elements of pre-presentation planning and execution of selling process activities which are documented and analyzed in a written notebook, student interaction with and mentoring by actual salespersons of the project‘s focal products and services, a culminating role play of a realistic sales call utilizing the sponsoring mentor as buyer, and detailed written feedback provided by the professor, the mentor, and student peers from the same class.
OVERALL COURSE APPROACH
This Professional Selling course is intended to give students a basic understanding of what a career in professional selling entails. Basic methodologies for effectively executing the sales process, specifics for addressing different products/services/situations, channels and markets, economic and psychological motivations, and so forth are addressed. The objectives are for students, at the end of the course, to be able to confidently present their ideas and propositions in a way that would lead intended ―buyers‖ to adopt the idea/proposition. Students should develop self-confidence and the ability to communicate succinctly and effectively to a variety of personalities in a multitude of situations. An additional objective is for students to have more positive attitudes towards selling as a career option. The course is conducted in a very applied, hands-on fashion, emphasizing active learning on the part of students rather than passive learning and significant portions of lecturing on the part of the professor. Thus, the class is a co-creation of the students and professor, rather than the primary creation of the professor alone which is then ―delivered to‖ the students. Students are assigned reading from the textbook, Professional Selling: A Trust-Based Approach, 4E, by Ingram, LaForge, Avila, Schwepker, and Williams prior to class meetings. During those class meetings, short lecture supplements applied activities including, but not limited to, brief role plays of buyer-seller interactions in specifically defined contexts, identification and qualification of prospects for given products and services, development of optimal approach strategies based on specific prospect profiles, creating sales aids to support a prepared sales presentation, brainstorming plausible objections to particular product/service proposals and subsequent responses to those objections, role playing trial close scenarios, planning customer-follow-up activities, allocating amount of time and number of sales calls to a set of existing and prospective customers based on a number of characteristics and criteria, and charting route plans for calling on a number of customers within a set time period. Along with these day-to-day applied activities, students participate in a semester-long Progressive Sales Project, which is the focus of this paper. Its purpose is to provide students the opportunity to experience first-hand how salespeople work through the stages of the sales process in selling a good, service, or idea proposition. It also provides them the opportunity to do so through interaction with and guidance by a professional who sells the same product, service, or idea proposition. The culmination of the project is a realistic, unscripted sales call role play with the mentor acting as the buyer. Following the role play, the student ―sellers‖ are provided evaluative feedback from the professor, the mentor, and 5-9 peers from the class. Following is a detailed description of the project and how it is executed.
MENTOR-CENTERED PROGRESSIVE SALES PROJECT
At the beginning of the semester, with the distribution of the syllabus, the details of and guidelines for the Progressive Sales Project are presented to and discussed with students. The project is divided into twelve parts: 1) Selection of a Product and Mentor, 2) the Salesperson Interview, 3) Product Knowledge, 4) Prospecting, 5) Information Gathering and Pre-Approach, 6) Pre-call Preparation, 7) ADAPT Question Sequencing, 8) Expected Questions, Objections and Resistance, 9) Gaining Customer Commitment, 10) Customer Follow-Up, 11) Sales Call Shadowing, and 12) Sales Presentation Role Play. The guidelines as provided to students are presented in Appendix A. Throughout the steps, students are encouraged to interact with and obtain assistance from the sales mentor as much as possible, stopping short of having the mentor complete the work for them. For the first step of selecting a product and mentor, students are asked to brainstorm five or more products, services, or ideas they would be interested in using for the sales project. The ideas are reviewed by the professor to determine if the products would plausibly utilize professional sales activities (rather than mere order taking or ―ringing up the sale‖), and would not create undue difficulties in completing the sales project. Once a set of products, services, and/or ideas are approved, students are

B. S. Guy IHART - Volume 16 (2011)
29
directed to find a mentor who sells the product, service, or idea professionally. Doing so creates the students‘ first real ―selling experience.‖ Students must identify mentor ―prospects‖ and approach them to discuss the possibility of a mentor relationship. A contact letter template (see Appendix B) is provided to students as a means of establishing the initial contacts. Occasionally students have difficulty identifying or obtaining mentors, so prior to the beginning of a class, the professor compiles a list of sales professionals who are willing to fill that role. Having said that, this list is not made known until students have made a significant, concerted effort to obtain a mentor on their own. The second step is to conduct an interview with the mentor to learn more about his or her job and daily activities. This helps the mentor and student develop a relationship and often dispels many misconceptions students have about sales positions, approaches, and activities. A summary of responses is placed in the sales project notebook. The third step is to develop a critical knowledge base about the product/service offering. Students are directed to construct a Features, Advantages, and Benefits Matrix for use later in developing effective sales presentations. Students often underestimate the importance of in-depth product knowledge. Therefore, this section requires early review by the professor and feedback regarding further development and expansion of specific features, advantages, and benefits as well as the inclusion of sales aid materials. The same is true of competitive analysis; students rarely comprehend the importance of knowing the competitions‘ offerings as completely as knowing one‘s own. The fourth step addresses prospecting. Students are directed to determine which of the prospecting methods discussed in class would be effective for identifying possible customers for their sales project product/service/proposition. They are encouraged to discover what prospecting methods are employed by their mentors, and the relative levels of effectiveness associated with these methods. Utilizing several methods, the students construct a list of 10 actual prospects for their products, and whenever possible, to determine how well qualified these prospects are in terms of need, ability to make a decision, and resources available to pay for the purchase. Mentors are directed not to provide a list of prospects to the students, but only to assist in the process of identifying the prospects. This give the students practice in this critical selling activity. Students, and some mentors, may need to be reassured at this point that at no time will the students be making actual contact with these prospects. Once a list of 10 prospects is complete, students are directed to select two who appear to represent promising opportunities to make a sales presentation. In this fifth step, students gather as much pre-call information as possible about the prospects, developing a more detailed profile of each of the two. This parallels the preparation a salesperson would conduct prior to making initial contact with a prospect. When students compare notes on this exercise in class, it provides an opportunity to discuss that some salespeople are able to have more pre-call information about their prospects than others, and what adaptations are then required of salespeople who know very little about their prospects when calling on them. At this point, salespeople would craft a strategy for approaching a prospect in an attempt to obtain consent to make a sales presentation. Since the sales call role play is a simulated experience, it is not possible for students to actually experience or practice this. In the sixth step of the project, students select one of the two customers profiled in more depth as the focus of the remainder of the project. This is the ―persona‖ that will be assumed by the mentor during the sales call role play, and each subsequent step in the project targets this prospective customer as specifically as possible. It is at this step that students create the context of the sales call to take place, including the time, date and place of the call, a summary of any previous dialogue and calls which have been made, and the specific objectives to be achieved by the salesperson during the role play presentation. Some students‘ mentors may have a product or service that requires one call only to make a sale, while others may interact with prospects several times over the course of months prior to closing the final sale. For those with extended sales processes, students select which of the calls the wish to emulate. In the seventh phase of the project, students develop ADAPT sequence questions for utilization in developing an effective sales presentation. There is no shortage of sales presentation models available, and different products, services, and industries have distinctly different needs and norms. However, most successful relationship-based, customer-oriented presentations utilize some type of effective questioning sequences. The ADAPT model acronym stands for Assessment, Discovery, Activation, Projection, and Transition. Assessment entails asking a variety of open-ended questions to determine the broad nature of the customer‘s business, current situation, market dynamics, goals and objectives. From there, Discovery questions seek to identify areas need including, if relevant, dissatisfaction with current suppliers and products/services currently being purchased. Answers received to these questions allow salespeople to focus on features, advantages, and benefits of one‘s own offerings that are relevant to the buyer and for which those offerings provide significant need satisfaction and competitive advantage. In the Activation stage, the salesperson asks questions that allow the customer to identify on his or her own, the negative outcomes and problems being experienced as a result of these unmet needs, some examples being

Using a Mentor-Based Progressive Sales Project in a Professional Selling Course
30
lost sales, increased operating costs, unwanted overtime shifts, excessive product returns, and so forth. From there, the salesperson uses Projection questions that get the prospect to state the benefits of having the problem solved, such as greater sales revenues, increased market share, lower costs, increased employee morale, fewer customer complaints, etc. Finally, Transition questions are used to get the prospect to invite the salesperson to show the customer how his/her proposal can create the solutions just identified by the buyer as desirable. The goals of the ADAPT model are to provide the salesperson with information key to addressing the prospect‘s actual needs, and to gain customer involvement and buy-in to the sales presentation. While students usually understand the purpose and process of the ADAPT model at an intellectual level, they find this a highly challenging process to execute. The ADAPT model is role played in class across multiple scenarios in preparation for students having to create their own sequences for their sales projects. Even with correct development of an ADAPT sequence in the notebooks, students may have difficulty actually pulling the sequences all the way through in their role plays, and need considerable encouragement and feedback on this. While not every possible objection or question can be anticipated in advance, thinking about objections and how to respond ahead of time gives the salesperson the best chance of success during a call with prospective customers. In the eighth step, students generate a list of at least 10 frequently heard or plausible objections to their sales proposals. Students categorize each objection by type, craft a strategic response to the objection, and classify the response by type as presented in their textbooks and in class. Likewise, in the ninth step, students create specific approaches for gaining customer commitment, applying several of the methods taught in the text and in class. Students are taught that getting an agreement to purchase is not the end of the selling process. Customer follow-up is important to deal with unexpected problems, to establish customer satisfaction, to gain referrals, to identify opportunities for additional sales, and to maintain a positive ongoing business relationship with buyers. In the tenth step of the project, students chart planned follow-up activities for scenarios in which the sale is made and also in which the sale is not made. The eleventh step of the project involves shadowing the mentor over the course of one or more significant sales calls. Students must complete the shadowing prior to the date of the role play. They are encouraged to do this as early and often as time and the mentor permit. Their write-ups serve as a reflective activity to identify how their mentors do or do not apply the methods presented during the selling course. It also allows them to refine their approaches for the actual sales role play. Finally, as the culmination of the Progressive Sales Project, each student conducts a sales call role play, using the mentor as the prospective buyer. Several weeks prior to the role plays, a letter is sent to each mentor, thanking them for their considerable efforts in supporting the student during this project, and setting proper expectations for the role play itself. See Appendix C for a copy of this letter. Role play sessions are scheduled during the last three weeks of class. Most sessions occur during the scheduled time period for the class however, two sessions scheduled during the evening allow mentors who cannot come during the work day to participate. As a rule, for a 75 minute session, the maximum number of role plays that can be schedule is five, and if possible, four is more preferable. For each session of role plays scheduled, a set number of classmates sign up to be official observers. After the role play is completed, the professor, the mentor, and the official observers all provide written feedback to the ―salesperson‖. The evaluation forms consist of a Likert scale for a list of specific dimensions as well as free form comments about what the salesperson did well and what he or she could have done better. Classmates‘ feedback is provided anonymously so to encourage honest commentary and constructive criticism where needed. Each official observer is graded on the quality of the feedback provided, and this becomes part of his or her class participation grade.
CLOSING OBSERVATIONS AND COMMENTS
The Progressive Sales Project has been used in two different semesters. Evidence of its effectiveness is based on student evaluations and unsolicited feedback from both students and mentors. Mean numerical scores for the course have exceeded the means for other courses in the department as well as the college. Many students have commented that this course was one of the best they have had in their major or even in their college careers. Many of the positive comments focus on the project itself. Students have found it to be very challenging but typically far more beneficial than they expected at the outset of the project. In general, the course and the project have increased positive impressions of selling and salespeople, and increased students‘ expressed willingness to consider a sales job or career after graduation. In fact, several students in each semester received offers of employment from their mentors. Mentors have also served as points of networking and references for students seeking employment from other organizations in sales and other job areas. Students also express greater confidence in their abilities to be successful in sales. Finally, many of the students in the second semester commented that they had registered because they had been encouraged to do so by someone taking the course in the preceding semester.
B. S. Guy IHART - Volume 16 (2011)
31
Mentors also have commented positively, and often enthusiastically, about the project. While being an effective mentor requires a significant commitment of time and effort, more than half expressed a willingness to be a mentor for students in subsequent classes. Some saw it as a good source of recruiting for future sales employees. Several mentioned that they wish they had been able to have a comparable experience when they were in college, and some even indicated that they had learned more about effective selling methods themselves as a result of their participation. As an intentional, formal means of obtaining mentor feedback has not yet been implemented, other than to inquire about their willingness to be a mentor in the future, all the feedback was provided unsolicited through personal conversations, phone calls, and email.
REFERENCES
Anderman, E. M., & Young, A. J. (1994). The Effects of Peer Evaluation on the Behavior of Undergraduate Students Working in Tutorless Groups. In Group and Interactive Learning, H. C. Foote, C. J. Howe, A. Anderson, A.K. Tolmie, & D. A. Warden (eds.), Southampton: Computational Mechanics Publications, 153-158.
Crespy, C. T., Rosenthal, D.W., & Stearns, J.M. (1999). Change and Growth: Advances in the Use of Cases in Marketing. Marketing Education Review, 9 (Fall), 1-3.
Dabbour, K. S. (1997). Applying Active Learning Methods to the Design of Library Instruction for Freshman Seminar. College and Research Libraries, 58 (July), 299-308.
Deeter-Schmelz, D. R. & Kennedy, K.N. (2011). A Global Perspective on the Current State of Sales Education in the College Curriculum. Journal of Personal Selling and Sales Management, 1 (Winter), 55-75.
Fink, L. D. (2003). Creating Significant learning Experiences: An Integrated Approach to Designing College Courses, San Francisco, CA: Jossey-Bass.
Futrell, C. M. (2009). Fundamentals of Selling, 11th Edition, Boston, MA: McGraw-Hill/Irwin. Gremler, D. D., Hiffman, K. D., Keaveney, S.M., & Wright, L. (2000). Experiential Learning Exercises in Service Marketing
Courses. Journal of Marketing Education, 22, 1. Hamer, L. O. (2000). The Additive Effects of Semi-Structured Classroom Activities on Student Learning: An Application of
Classroom-Based Experiential Learning Techniques. Journal of Marketing Education, 22, 25-34. Hunt, S.D., & Laverie, D. A. (2004). Experiential Learning and the Hunt-Vitell Theory of Ethics: Teaching marketing Ethics by
Integrating Theory and Practice. Marketing Education Review, 14 (Fall), 1-14. Inks, S. A., & Avial, R. A. (2008). Preparing the Next Generation of Sales Professionals Through Social, Experiential, and
Immersive Learning Experiences. Journal for Advancement of Marketing Education, 13 (Winter), 47-54. Karns, G. L. (2005). An Update of Marketing Students Perceptions of Learning Activities: Structure, Preferences and
Effectiveness. Journal of Marketing Education, 27, 163-171. Klebba, J. & Hamilton, J. G. (2007). Structured Case Analysis: Developing Critical Thinking Skills in Marketing Case Courses
Journal of Marketing Education, 29 (2), 132-139. Marks, R. B. (1997), Personal Selling: A Relationship Approach, 6th Edition, Upper Saddle River, NY: Prentice Hall. Marshall, G. W., & Michaels, R. E. (2001). Teaching Selling and Sales Management in the Next Millenium: An Agenda from
the AMA Faculty Consortium. Marketing Education Review, 11 (1), 1-4. McBane, D. A., & Knowles, P. A. (1994). Teaching Communication Skills in the Personal Selling Class. Marketing Education
Review, 4 (Fall), 41-48. Michaels, R. E., & Marshall, G. W. (2002). Perspectives on Selling and Sales Management Education. Marketing Education
Review, 12 (2), 1-11. Neeley, C.R., & Cherry, K.S. (2010). Zero to 60 in One Semester: Using an Applied Advanced Selling Project to Build a
Professional Sales Program. Marketing Educational Review, 20 (2), 123-129. Prasad, T. (2005). A Field Sales Campaign for Teaching Personal Selling Skills through Experiential Approach. IIMB
Management Review, March, 87-94. Perry, N. W., Huss, M. T., McAuliff, B. D., & Galas, J. M. (1996). An Active-Learning Approach to Teaching the Undergraduate
Psychology and Law Course. Teaching of Psychology, 23 (April), 76-81. Sautter, P. (2007). Designing Discussion Activities to Achieve Desired Learning Outcomes: Choices Using Mode of Delivery
and Structure. Journal of Marketing Education, 29 (2), 122-131. Schaefer, A. D. (2002). Incorporating Experiential Learning into Large Personal Selling Sections. Sellars, D. (2005). Developing and Role Playing Effective Sales Presentations, Canada: Southwestern. Sojka, J. Z., & Fish, M. S. B. (2008). Brief In-Class Role Plays: An Experiential Teaching Tool Targeted to Generation Y
Students. Marketing Education Review 18 (Spring), 25-31. Totten, J. W (2010). Using Real Business People as ―Buyers‖ in Student Role Play Sales Presentations. Society for Marketing
Advances Proceeding, 150-153. Tyler, P. R., & Hair, N (2007). Teaching Professional Selling: A Relationship Building Process. Journal for the Advancement of
Marketing Education, 11 (Winter), 31-34.

Using a Mentor-Based Progressive Sales Project in a Professional Selling Course
32
Weitz, B. A., Castleberry, S. B., & Tanner, J. F. (2009). Selling: Building Partnerships, 7th Edition, Boston: McGraw-Hill/Irwin. Widmier, S., Loe, T. & Selden, G. (2007). Using Role-Play Competition to Teach Selling Skills and Team work. Marketing
Education Review, 17 (1), 69-78. Young, M. R. (2005). The Motivational Effects of the Classroom Environment in Facilitating Self-Regulated Learning. Journal
of Marketing Education, 27, 25-40.
APPENDIX A
Requirements and Guidelines for Progressive Sales Project
MKT 3052 PROFESSIONAL SELLING – PROGRESSIVE SALES PROJECT
1. Selection of Product/Mentor
2. Salesperson Interview a. Formal title/position in company b. Number of years selling experience with company c. Number of years total selling experience d. Average number of hours worked per week e. Percent of work time spent on: prospecting administration/paperwork, travel, face-to-face selling, internal meetings,
servicing accounts f. In a typical sales presentation, the amount of time spent on: information gathering, presenting features/benefits,
handling objections, closing, follow through and servicing aspects g. What specific preparations do you make before meeting with a prospective buyer? h. On average, how many sales calls are required with a single prospect to make a sale? i. What is the approximate close rate of sales calls? j. How often do you talk or otherwise communicate with a buyer between sales? k. How stressful is your job? What aspect is most stressful? How do you deal with that stress? l. Are your sales presentations fairly standard across prospects or are presentations highly adaptive to each prospect? m. How are you compensated? What percentage of your pay is salary, commission, other bonuses and incentives? Is
the compensation structure ideal or how would you change it if you could? What other motivators are in place? n. What abilities and characteristics are crucial for success in your industry? o. What college courses prepared you best for your sales career? p. How frequently do you set specific goals for sales calls? Are they formal and/or written? Can you provide a specific
example of a prospecting goal you set? A sales goal? q. Do you keep formal records of sales calls. Is it possible to get a blank copy of the sales call report you would use? r. How much formal sales training is provided by your organization? Is there an ongoing sales training process in
place? What is involved in either or each kind of training? s. What aspects of your job do you enjoy the most? The least? t. Please describe your most memorable sales call.
3. Product Knowledge Describe in detail the product or product mix which will be the focus of your end-of semester sales presentation. What
does the product do? What needs/wants/situations is it appropriate for? How does it work? What is its price?....and so forth.
Look on pp. 18-19 of your textbook, under item #2, to determine what an FAB (Features, Advantages Benefits) Matrix looks like. Construct one of these in as much detail as possible for your product(s).
Who are the major competitors and competing alternatives? What are their relative strengths and weaknesses? How do the competitive offerings compare to yours in terms of FABs? You must address these questions for at least the two strongest competitors.

B. S. Guy IHART - Volume 16 (2011)
33
4. Prospecting Make a list of 10 potential prospects for your product offering. a) Provide names, addresses, phone and other contact information, etc. b) Indicate how you identified each as a prospect, and, c) to the extent possible, indicate how well qualified the prospect is (existing need or want that can be satisfied by your
product, willingness and ability to pay for product, anything else bearing on how highly rated this prospect might be).
5. Information Gathering/Pre-Approach Select two (2) of the 10 prospects and develop a customer sales profile for each. Include as much of the following as possible: a) nature of need/want/situation for which your product may provide a solution, b) time frame in which purchase is most likely to be made, c) prospect‘s most likely key decision criteria, d) what brands/suppliers are currently being used by the prospect, if any. e) as well, add as many pieces of information described in Exhibit 5.4 on page 150 and Exhibit 5.5 on page 5.5 (if your
prospect is an organizational buyer).
6. Pre-call Preparation Select one of the two prospects previously profiled. Identify the context in which the sales call will take place, such as: a) time, b) date, c) place of call, d) summary of any previous calls which led up to the targeted call, and e) specific objectives to be achieved in the sales call.
7. ADAPT Question Sequencing Develop and include a series of product and customer relevant questions that can be used to further assess the needs
of this prospect. These questions should follow the ADAPT questioning sequence (explained in Module/Chapter 4, Questioning Skills). Workbook pages for developing ADAPT questions are included in your text on pages 379-380. Remember that the ADAPT questioning sequence is designed to help your prospect discover and solve a problem, as opposed to your ―pitching‖ the product.
8. Expected Questions, Objections, Resistance Anticipate forms of resistance which may be offered by the prospect. Detail ten specific objections which the prospect
might plausibly offer during the course of your presentation and classify each objection by type. Describe how you would respond and classify your response by type as well. Relevant content material for this section is provided in Module/Chapter 8.
9. Gaining Customer Commitment Describe and illustrate how you will gain customer commitment and finalize the sale. Your description should include a
statement classifying the type of commitment gaining method being used. Relevant content material for this section is provided in Module/ Chapter 8.
10. Customer Follow-Up Discuss the follow-up activities that will be undertaken and provide a timetable for their implementation. Follow-up
activities should be developed for both contingencies: a) that you are successful in achieving the objective set out for this sales call, and b) that you are not successful in achieving the sales call objective(s).
11. Shadowing - this MUST be completed prior to your sales presentation role play and contained in your notebook, which will be turned in 2-3 days before your scheduled presentation. You will shadow your mentor on at least one in-depth sales call or some part of a day of sales calls. You will describe
your impressions of these calls, relating them to what we have learned and discussed in class, and in terms of your planned role play.
12. Role Play – day/time to be determined You will role play a planned sales call in class with either your mentor or the professor as the buyer.

Using a Mentor-Based Progressive Sales Project in a Professional Selling Course
34
APPENDIX B
Mentor Inquiry Letter
DATE Mentor Name Mentor Address Dear (Mentor Prospect), My Name is (your name), and I am an Appalachian State University student currently enrolled in a course called Professional Selling. The purpose of this letter is to ask you if you would consider being my Sales Mentor for this semester. One of our course requirements is to do a progressive sales project. This involves selecting some product, service, or proposition to focus on as we learn about selling, and then going through a series of steps and assignments in preparation for doing a live sales role play in class at the end of the term. I have attached a copy of the assignment instructions to this letter. The product I have chosen to focus on is _______. In conjunction with this project, our professor has charged us with finding someone who is a salesperson for this type of product to be a mentor to us, and I have identified you as someone who I believe could be very helpful to me in this learning process. [or My professor, Dr. Bonnie Guy, mentioned you as someone in this field who might be willing to help me in this learning process]. The roles and activities expected of such a mentor would include: a) participating in a salesperson interview, the questions for which are included in the assignment guidelines, b) providing information and guidance for the assignment areas when needed, c) allowing me to shadow him/her on a sales call or some portion of a day‘s sales calls, and d) participating in my final sales call role play as the prospective buyer. Should you have an interest in agreeing to be my mentor or at least in learning more about this arrangement, I would appreciate the opportunity to speak with you as soon as possible. You may reach my by email at ________________, or by phone at _____________. Alternately, if I have not heard from you in the next few days, I will call to follow up on this matter. I appreciate your willingness to consider my request, and I look forward to speaking with you very soon. Sincerely, Your Name

B. S. Guy IHART - Volume 16 (2011)
35
APPENDIX C
Mentor Follow-Up and Thank You Letter
March 28, 2011 Mr. John Smith XYZ, Inc. 123 Street Address City, ST 00110 Dear Mr. Smith, First, I want to thank you very much for agreeing to be a sales mentor for Brett Johnson this semester. A student‘s learning experience is always enhanced significantly when combined with real world experiences and interactions with business professionals. I understand that the requests made of you in terms of time and effort have not been insignificant, and we are very grateful for your willingness to help. Second, I wanted to touch base to clarify for you what the role play on campus entails. Your student will have identified a specific ―prospect‖ for the product or service being sold and developed an information profile for that person to the extent that is possible. You will be playing the role of that prospect. The student will also have set the context of the sales call and identified the sales objective for the call. This information should be provided to you in advance so you may best play into your part. The role play should not be a pre-scripted interaction, however. What I am asking of you is to play the part of the prospect or customer plausibly, based on your own experience. You should ―challenge‖ the student somewhat, raising some questions and/or objections. This requires the student to think on his or her feet, relying on the pre-call preparation that was done. In this way, the student experiences more realistically what it is like to be a salesperson in a given situation. In general, sales presentations should not last more than 10 minutes, and may take fewer. We have 30 students in this one class, so time slots are tight. The evening sessions afford us 90 minutes of time, whereas the daytime, in-class sessions only provide 75 minutes. Scheduling a maximum of 6 role plays per session should ensure that we have enough time for each dyad and for transitions. After your role play has been completed, I will provide you a form for evaluating what the student did well and what could have been done differently and/or better. Students will appreciate your feedback far more than that of their peers or professor. If you have any questions whatsoever, please do not hesitate to contact me. I can be reached by phone at (XXX) 555-1111 and via email at [email protected]. I look forward to seeing all of you and thanking you personally. Sincerely, Bonnie S. Guy, PhD Associate Professor of Marketing Appalachian State University

M. F. Munim and I. Mahmud IHART - Volume 16 (2011)
36
MINDMAP: A POWERFUL TOOL TO IMPROVE ACADEMIC READING, PRESENTATION AND RESEARCH PERFORMANCE
Md. Fazle Munim1 and Imran Mahmud2
1Jahangirnagar University, Bangladesh and 2International University of Business Agriculture and Technology, Bangladesh
ABSTRACT
This paper represents a research on how MindMap helps to improve the academic reading, presentation and research performance of students. It also focuses on use of MindMap in a learning environment which involves a different way of thinking, learning and knowing. Researchers developed a research framework and a conceptual framework to conduct this research. Based on both frameworks a case study followed by group interview was done on a group of students. The case study aimed to know student‘s performance before the use of mind map and the improvement level after using it. In a part of the research students‘ thinking were justified with group interview and open ended questions. Result of the research is quite satisfactory and it shows that use of MindMap increases the learning and presenting capacity of the students as well as improvement of their research work. This research ended with the scope of various academic research interest and the developed frameworks will help researchers to study related problem. This research paper will facilitate the students, teachers and the researchers on the field of contemporary research, academic research, academic reading, poster presentation, academic presentation, and innovative teaching and learning methodologies. Keywords: MindMap; Academic Reading; Research; Presentation; Learning.
1. INTRODUCTION
Mind mapping was firstly developed by Tony Buzan, who was a mathematician, psychologist and brain researcher. It was used as a special technique for taking notes as briefly as possible whilst being interesting to the eye as possible. But nowadays it is begun to use as a tool of modern education and research methods. As two halves of the human brain are performing different tasks like, while the left side is mainly responsible for logic, words, arithmetic, linearity, sequences, analysis, lists, the right side of the brain mainly performs tasks like multidimensionality, imagination, emotion, color, rhythm, shapes, geometry, synthesis. But Mind mapping uses both sides of the brain [1], letting them work together and thus increases productivity and memory retention. According to Zhang at al [2]‖ It fully utilizes both the left and right brain, and can be used as a memory aided tool in any field of study, work and life. The use of mind mapping can be assisted with ―the adoption of colors, images, codes, and multidimensional approaches to help human memory, so that one could concentrate the mind on the central part, which is, the crucial subject‖ [3]. To make a mind map take a plane paper and write the title of the subject on the middle of the page and draw a circle around it. Draw lines from the circles and write the subdivisions or subheadings. Circle the Subheadings and draw lines from the subheadings if there are subheadings under those. Take the important findings from the Subheadings and write down those in the label of the lines. Sometime side notes can be taken as reference. Different color in different level of circle and lines can be used to make it more presentable. Fig 1 - contain a sample of Ming map. [4]

M. F. Munim and I. Mahmud IHART - Volume 16 (2011)
37
Figure 1: Sample of Mind Map, Source - http://kartones.net/images_posts/screenshots/mindmap_example_post.png
1.2 Research Question
How MindMap used as a Powerful Tool to Improve Academic Reading, Presentation and Research Performance? Objectives of the study are to identify the following accepts in terms of using mind map – Identify the level on improvement on academic reading How to formulate faster Academic reading Identify the improvement level on presentation Indentify the level of improvement on research
1.3 Motivation
Reading is vital part in academic research. Especially on every research we have to study lots of books, articles and study material. In case of article which is the first and easy part of academic reading, but students face lots of trouble to read those article. To understand the article they need to read the article more than three times. Such as at the first time they have to read it to get the overall understanding, then on the second time then read it to gain knowledge from it and finally, they read it to get the most highlighted points. But if the article is not in the form of his/her native language then the number of reading will be increased. Again after fifteen munities of the study has finished if any students asked to write a summery without looking at the article, most of the time they are unable to come up with a good summery. And in the case of presentation after reading the article they were also unable to present the main and important outcomes of the article. In such case researchers asked their students to take side notes while study but even students were not clear about what to take as side and how. In such case mind map could be good tools and researchers try to get the output of using mind map in this research.
2. METHODOLOGY
In the research 10 students of Computer Science department from International University of Business Agriculture and Technology (IUBAT), Bangladesh were chosen and the research timeline was in between on January 2011 to April 2011. A research process framework was developed by the researchers and that is shown on Fig 2.
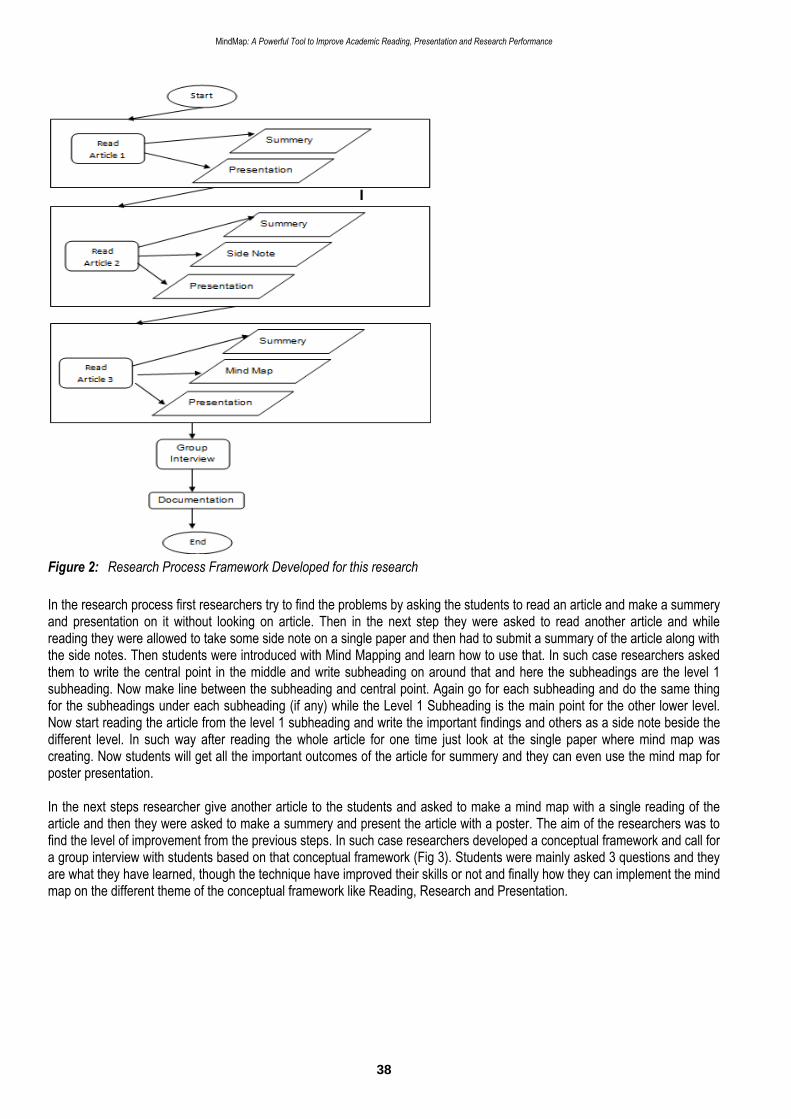
MindMap: A Powerful Tool to Improve Academic Reading, Presentation and Research Performance
38
Figure 2: Research Process Framework Developed for this research
In the research process first researchers try to find the problems by asking the students to read an article and make a summery and presentation on it without looking on article. Then in the next step they were asked to read another article and while reading they were allowed to take some side note on a single paper and then had to submit a summary of the article along with the side notes. Then students were introduced with Mind Mapping and learn how to use that. In such case researchers asked them to write the central point in the middle and write subheading on around that and here the subheadings are the level 1 subheading. Now make line between the subheading and central point. Again go for each subheading and do the same thing for the subheadings under each subheading (if any) while the Level 1 Subheading is the main point for the other lower level. Now start reading the article from the level 1 subheading and write the important findings and others as a side note beside the different level. In such way after reading the whole article for one time just look at the single paper where mind map was creating. Now students will get all the important outcomes of the article for summery and they can even use the mind map for poster presentation. In the next steps researcher give another article to the students and asked to make a mind map with a single reading of the article and then they were asked to make a summery and present the article with a poster. The aim of the researchers was to find the level of improvement from the previous steps. In such case researchers developed a conceptual framework and call for a group interview with students based on that conceptual framework (Fig 3). Students were mainly asked 3 questions and they are what they have learned, though the technique have improved their skills or not and finally how they can implement the mind map on the different theme of the conceptual framework like Reading, Research and Presentation.

M. F. Munim and I. Mahmud IHART - Volume 16 (2011)
39
Figure 3: Conceptual Framework developed for this research
3. RESULT
Researchers gave 3 articles to the students step by step of the research process. Same 10 students were participating on the research process. In the reading experiment researchers judge the written summery to get the output of their reading. Researcher marked the summaries of 10 students based on 4 point and total 40 marks where each point consist 10 mark each. The judgment points were relatedness, sharing literature, Efficiency and Speed up reading and learning. As well as on the same process steps researchers Researcher judge the presentation of 10 students based on 5 points and total 50 marks where each point consist 10 mark each. The judgment points were Communication, Design of poster, Analytical ability, Better Craftiness and Critical attributes finding. Following chart will show the average marks on each judgment criteria where highest marks on each criteria is 10.
Figure 4: Output of Reading
Fig 4 shows the differences of the use of mind map. Result of Article 3 is in the top and an average mark of each criterion is much better than the article 2 and 3. In article 2 students were taking side notes but they did not know what to write and the way to write. So the variation of Article 2 is not as good as it should be in compare with article 1.
Figure 5: Output of Presentation

MindMap: A Powerful Tool to Improve Academic Reading, Presentation and Research Performance
40
Fig 5 shows also the clearly difference of the use on mind map and it‘s almost as same as the output of the Fig 4. In all the criteria of judgment the marking ration of after using mind map is much better. While in such case also the variation of article 2´s output with article 1 is very little. In the group interview all the 10 students were there and according to them mind map helps them to memorize the article for long time. Even after reading for a single time then can understand and take note of most of the important findings. But before that they were actually don‘t know how to take side notes properly. After all they increased their presentation skills and even the Mind Map itself can be a good poster of their presentation. According to the group interview there was a important finding of mind map on different research. As they mention they can learn and memorize the topic easily by a single reading which refer the learning and gain knowledge of the conceptual framework of the research. They also said the mind map will help them memorize the concept for long time and they can use it even after long time. In the interview process they also mention that in every semester they have to do some research on different subjects where they had to read lots of books. But the process of using mind map will help them on the Literature review part and they will able to make their Literature review more strong in a short span of time.
4. DISCUSSION
Moreover the research output was the use of mind map is quite satisfactory and it does really can be a better tool. According to the relation of research objectives and results researchers shows,
Mind Map improves the academic reading Performance
Mind Map not only help for faster Academic reading but also learning on same time
Mind Map improves the level on presentation
Mind Map helps the students on their research activities
4.2 Limitation and Future Scope
According to the researcher the main limitation of the research was the sample size. But it is considerable thought it‘s a test case. The research also open scopes to do further research on use of mind map in different academic and social sectors.
5. CONCLUSION
Researchers concluded the research with a positive view on Mindmap and from the experiments to shows that it is really a powerful tool to improve academic Reading, Presentation and Research Performance. This research will help the researchers of the field of contemporary research, academic research, academic reading, poster presentation, academic presentation, and innovative teaching and learning methodologies.
REFERENCES
[1]. Buzan, Tony. 1976. ―Use Both Sides of Your Brain”. New York: E. P. Dutton & Co. [2]. ZHANG Yan-lei, XIAO Shuang-jiu, YANG Xu-bo , DING Lei,2010 ―Mind Mapping Based Human Memory Management
System‖, Digital Art Lab, Software School, Shanghai Jiaotong University, Shanghai, China [3]. Chen, J. 2008. ―The use of mind mapping in concept design‖. IEEE. Retrieved from: http://ieeexplore.ieee.org.www.
bibproxy.du.se/stampPDF/getPDF.jsp?tp=&arnumber=04730739&isnumber=4730505?tag=1 [4]. Brinkmann, Astrid. 2003‖ Graphical Knowledge Display – Mind Mapping and Concept Mapping as Efficient Tools in
Mathematics Education‖, Mathematics Education Review, No 16
G. Esch and B. Cox IHART - Volume 16 (2011)
41
THE DILEMMA OF LICENSING ALTERNATIVES AND RECIPROCITIES FOR TEACHERS AND ADMINISTRATORS
Ginny Esch and Betty Cox
The University of Tennessee at Martin, USA
ABSTRACT
Today‘s American society is mobile and continually shifting because of the economy and personal factors such as a spousal career or family dynamics. The families with school-aged children want to select the best educational system for their offspring to attend within the parameters of the new location. Other family units contain teachers/school administrators who are seeking valid employment in a local educational institution. Many of these educators are finding that the requirements of their former positions, which had already been met, are not sufficient for the new desired location, and that they must complete additional courses or tests in order to obtain licensure. Obtaining a new state license in education can take many forms such as the use of life experiences or certification exemptions. Some loopholes may exist for these requirements, but often, to the contrary, there are myriad obstacles to overcome for becoming certified in a new locality because the requisite criteria are vastly deviating among states. This disparity impacts both the children who are attending school and the educators who are employed there. Educational systems want to hire professionals who are well-trained and can motivate students to perform skillfully on standardized tests, but are willing to accept a level of pay that will not overburden budgets. Children and families must accept the choices regarding which educators are hired, and have little voice in the process to which they must adhere. These teachers and administrators may have a reciprocal license or an alternative license that appears adequate in meeting the requirements of the school system, but the quality of the education can suffer, in some cases, because high standards have not been met and/or high-quality teachers and administrators are impeded by the new requirements imposed upon them, thereby causing them to abandon a vocation in the educational arena. Keywords: Licensure, Certification, Alternative License, Reciprocity.
INTRODUCTION
You have earned a well-deserved vacation, so you pack your duds and head out in your sporty little car. You have just crossed the state line when you hear the dreaded sound of a police car siren; your stomach sinks to your toes. You know that you were not speeding and that your taillights work, so you have no idea why you are being stopped. The officer tells you that since it is raining and your windshield wipers are running, your headlights must be turned on…it is the law. Your license plate indicated that you are from another state so you plead ignorance. This does not work; if you wish to drive in this state, you must abide by this state‘s driving laws. What an inauspicious beginning to your holiday! This type of scenario is similar to that of seeking licensure in another state. State and local regulations govern the necessary requirements of teachers and administrators in the public schools, and the federal government has been involved with educational policy since 1867 when the original Department of Education was created (U.S. Department of Education: The Federal Role in Education). The impact of the national Elementary and Secondary Education Act (ESEA) of 1965 was built upon four basic tenets which included teacher/school accountability, a broader base of options for parents, increased flexibility and control at the state and local levels, and adherence to proven scientific methodology (U.S. Department of Education: Elementary and Secondary Education Act). The No Child Left Behind (NCLB) Act of 2001, a revision of The Elementary and Secondary Education Act (ESEA), is the primary federal law currently influencing education in public educational policies (U.S. Department of Education: Executive Summary Archived Information). With the augmented authority, states have modified the requirements for teachers and administrators to ensure that optimal answerability is in effect. However, a critical need for qualified educators can impose ―band-aid‖ measures that can serve as an expedient resolution. One of the most convenient stop-gap procedures is that of alternative licensure.
ALTERNATIVE LICENSURE
The licensure of teachers and administrators can be an overwhelming challenge. There are professional licenses, provisional licenses, supplemental licenses, alternative certificates, and other licenses that bear similar names. A professional license is one for which all the required criteria have been met, and a provisional or conditional license may have a component missing which must be achieved within a specific amount of time. A supplemental license is basically an endorsement in another

The Dilemma of Licensing Alternatives and Reciprocities for Teachers and Administrators
42
subject area than the person holding a professional license already has obtained; additional courses and requirements are necessary for this kind of certification. An alternative license is the term generally utilized to denote various pathways for individuals with a bachelor‘s degree (for teachers) or a master‘s degree (for administrators) to apply life experiences and expertise in lieu of education courses for obtaining certification (National Center for Education Information). For teachers, an alternative license can be obtained by someone who wants to teach in the public school system, but has an undergraduate degree in another field of study. Instead of earning another undergraduate degree in education, the prospective teacher can teach while acquiring an alternative license by fulfilling explicit licensure prerequisites. The alternative teaching license can be an extensive muddle of chaos and confusion because it circumvents fundamental undergraduate requirements necessary to meet state/national standards for basic educational licensure. Whether one is a novice teacher or a seasoned educator, the implications and ramifications are the same. One of the main reasons for this turmoil surrounding alternative licenses was addressed by the Institute of Education Sciences (2002):
Sometimes arguments for or against alternative certification are made on the basis of comparisons of teachers with certificates, including alternative certificates, with teachers working with provisional or temporary licenses… the definitions and requirements for licensure and certification differ substantially from state to state, and sometimes within jurisdictions within the same state. These differences make it difficult to know exactly what is being compared when data are aggregated across states and jurisdictions.
http://ies.ed.gov/director/speeches2002/03_05/2002_03_05b.asp This lack of continuity results in inconsistent quality which, in turn, generates irreconcilable test scores needed for state and federally-authorized funding under mandated programs. Some institutions have taken advantage of this ambiguity by establishing a process called a diploma mill. The Merriam-Webster Online Dictionary defines a diploma mill as ―a usually unregulated institution of higher education granting degrees with few or no academic requirements.‖ The U. S. Department of Education warns prospective teachers and aspiring administrators against these unauthorized agencies that promote fraudulent accreditation, and suggests that communication with state regulatory departments be made for clarification. However, the same U. S. Department of Education endorses a broad spectrum of alternative measures to lessen the impact of educator shortages. The concept is idealistic in the promotion of professionals in other fields who can bring their expertise to a school or classroom ―right after a short period of training‖ (Innovations in Education: Alternative Routes to Teacher Certification; p. 1). The same resource suggests that applicants could use the alternative licensure procedure as a means to ―rule out the slower traditional route to teaching‖ (Innovations in Education: Alternative Routes to Teacher Certification; p. 1). These shortcuts are an insult to those who truly wish to seek a quality education and are willing to expend the time, money, and effort to do so. A case in point is a university that offers a degree for an individualized bachelor‘s program in which no specific requirements are necessary except for a few core courses. The individualized plan is submitted by the student for academic approval. A student can take a specified number of education courses that does not include student teaching, language arts/social studies methodology, or diagnosis/evaluation in education; moreover, unrelated courses to education such as aerobics and cheerleading can be used to fulfill the credit-hour requirement for an alternative license. Once the degree is obtained, the person can be gainfully employed as a teacher in a public school, but this placement raises several critical issues:
1. On-the-job training is not an element of a qualified teacher; 2. Developmentally-appropriate practices as espoused by nationally-recognized organizations including the National
Association of the Education of Young Children (NAEYC) (Bredekamp and Copple, 1997) and best practices in education advocated the National Education Association (NEA) are not evident because critical courses, such as student teaching, have been omitted from the individual‘s instructional program; and
3. Adequate analysis and appraisal cannot be accurately performed because insufficient training in the field of education has transpired.
Certified teachers have expressed indignation and outrage, but their protests to the bureaucracy are often met with the consolation that this arrangement is feasible because it is, after all, an alternative license. The utilization of life experiences as a substitute for accredited courses also presents a profusion of difficulties. Consider the high-school graduate with six children and 19 grandchildren; does her life experience make her eligible for alternative

G. Esch and B. Cox IHART - Volume 16 (2011)
43
licensure? The retired nuclear physicist may be an expert in the field of science, but does this qualify him to be able to teach sixth graders? The U.S. Department of Education (Prepare for My Future) advises prospective teachers to be forewarned of enterprises that claim to substitute life experiences for credit hours and degree requirements; a primary reason for this is that no reliable or valid statistical measures exist to determine the award with variants of time served in different occupations. Similarly, alternative routes to administrative certification raise equally confusing issues. As one illustration, at least eleven states offer substitute methods to state licensing for principals and superintendents, including California, Idaho, Kentucky, Maryland, Massachusetts, Minnesota, Mississippi, New Hampshire, Ohio, Tennessee, and Texas (Meyer & Feistritzer, 2003, p. 31). These processes allow nontraditional candidates to enter administration, in most instances, without completing a university-based preparation program. To add to the uncertainty, individuals without any educational credentials whatsoever are being hired as superintendents in school districts across the country (Eisinger & Hula, 2003, p. 623). According to Darling Hammond (2000), changes in educational policies involve modifications which can be unpleasant because they draw attention to discrepancies in current guiding principles. She opined:
Similar efforts to avoid the discomforts of change associated with higher standards have occurred with regard to teacher education accreditation. As NCATE has raised its standards, alternative accreditation proposals have been put forward to allow schools to continue to practice with the imprimatur [official license] of accreditation, without having to meet external, rigorous, profession-wide standards… A key question is whether other states and communities are willing to invest in these kinds of strategies in lieu of lowering standards for the teachers of the most vulnerable and least powerful students. (p. 11)
Our nation‘s children are our country‘s most valuable resource, and they deserve to receive an excellent education by those most qualified to teach them. Loopholes, ambiguities, excuses, and exemptions are becoming a viable means of consideration for quality in education, and these justifications must stop.
CERTIFICATION RECIPROCITY
Some states are implementing stringent requirements as a means to obtain high levels of teacher effectiveness and efficiency. When states raise the expected qualifications of educators to promote a higher rate of accountability, the issue of reciprocity becomes a dilemma. Reciprocity means that one state‘s educational licensing system will accept a teacher‘s or administrator‘s qualifications with a licensing credential from another state that has similar accreditation requirements without additional prerequisites. An ongoing scarcity of qualified teachers and administrators indicates that certified educators are in demand. Nonetheless, according to the SHEEO (State Higher Education Executive Officers) report (Curran, Abrahams, & Clarke; 2001), actual reciprocity is atypical. Additionally, the perception of certification reciprocity varies greatly in its practical application as well as its conceptual foundation. The basis for the recruitment of highly qualified educators can depend on economics, politics, or patronage. The employment of accredited teachers and administrators in public schools is a legal necessity; however, certification can be comprised of a wide range of components and requirements. Resolving some of the limitations of these requirements is critical to the growing problem of educator shortages. For instance, several state education departments maintain awkward and burdensome practices in which impediments are incorporated to hinder resourceful hiring. Because a majority of legislators do not possess expertise or experience in the vocation of education and are reluctant or disinclined to seek counsel from professionals in the field, governmental mandates often promote their own educator shortages due to unrealistic expectations. A time-consuming progression of trying to fulfill requirements, some of which are redundant, overwhelm some highly qualified educators who seek other more accessible avenues of employment. Moreover, some educational systems employ nepotism, cronyism, patronage, and benefactor methods as a means of filling vacancies (Darling-Hammond, 2000). These approaches limit the employment of proficient and skilled professionals. As a result, teachers and administrators leave the field, which exacerbates the necessity for high-quality educators. Research by Guarino, Santibañez, and Daley (2006) found that simplified channels to state reciprocity of professional accreditation actually offered a greater inducement for teaching than the financial compensation. This information clearly negates the conviction of legislators who feel that money is the primary resolution for the problem of teacher shortages.
The Dilemma of Licensing Alternatives and Reciprocities for Teachers and Administrators
44
However, these agreements do contain loopholes which enable the ―receiving‖ state to legally endorse the educator while compelling additional prerequisites. This means that these agreements are not totally reciprocal in the full sense of the word; the ―receiving‖ state does not automatically accept the standards from the ―sending‖ state. One method of resolving this matter is provided by the National Association of State Directors of Teacher Education and Certification (NASDTEC), an organization that embodies state departments of education in every state and territory of the United States as well as professional regulations councils of the educational workforce. The purpose of this assembly is to facilitate the interchange of educators from one location to another while honoring the licensure standards that educators already possess. This interstate coalition consists of over 50 individual accords which outline the exact specifications of acceptable certification criteria. This group advocates for an agreement form that is straightforward, thereby affording the easy and successful transfer for educators from one geographic area to another (NASDTEC Interstate Educator Certification/Licensure Agreement 2005-2010). For example, under SECTION III: Establishing Eligibility for Certification or Licensure under the NASDTEC Interstate Agreement in subsection A1: Bases for eligibility common to all parties under this Agreement, the form provides:
Completion of an approved program: an applicant shall be entitled to certification based upon completion of an approved program if the applicant presents reasonable proof to the receiving Member that the following requirements have been met: c. compliance with all recency requirements of the receiving Member
(NASDTEC Interstate Educator Certification/Licensure Agreement 2005-2010). The term ―recency‖ is subject to interpretation. The document itself defines ―recency requirement‖ as a device that regulates the extent of time between attainment of the achievement for certification in one state and petition for certification.in another state. The time between these two events can provide discrepancies for actual performance. It could mean that the qualifying degree of the educator must have been obtained within a specific time frame, thus excluding experienced educators. Another interpretation could be that an educator must have attained certification in the recent past which might eliminate someone who decided to stay at home to raise children. Thus, although this agreement is legally binding, the manner in which specific interpretation is construed is nebulous. Research by Kane, Rockoff, and Staiger (2006) indicated that teachers with similar licensure rank demonstrate a wide assortment of variances in professional efficacy. These data propose that the first two years of teaching experience signifies a greater and more dependable influence on educator achievement than does adherence to licensure standards. In spite of these findings, legislation such as No Child Left Behind does not consider teaching experience to be a valuable attribute, but relies on test scores for certification success. Again, professional educators are basically voiceless in their efforts to enact significant educational reform because their expertise and proficiencies are neither solicited nor desired.
RECOMMENDATIONS
Educational reform is in a constant state of flux. The newest federal incentive is a program entitled Race to the Top, a component of The American Recovery and Reinvestment Act of 2009 (ARRA). In order to be eligible for these funds, each state must submit documentation that includes citations of the specific factors that are comprised of the State Fiscal Stabilization Fund (SFSF), Title I, Part A of the Elementary and Secondary Education Act (Title I), and the Individuals with Disabilities Education Act (IDEA), Part B (U.S. Department of Education: The American Recovery and Reinvestment Act of 2009: Saving and Creating Jobs and Reforming Education). The documentation is to revolve around the following principles:
1. Espousing ideologies and evaluations that equip students for success in contending in the worldwide workplace; 2. Developing information systems that analyze student progress and achievement, and recommending to educators how
performance can be advanced; 3. Engaging, compensating, and keeping effectual educators and administrators; and 4. Restructuring the schools with the lowest accomplishments. (U.S. Department of Education: Race to the Top Fund)
This type of competition and the inducements of this legislation will certainly impact the issues of licensure and reciprocity. Many states will do whatever it takes to be able to partake of these federal funds, and the requirements for teachers and administrators will grow exponentially. One of the most problematic and disturbing issues is the component that allows teacher and administrator pay to be based on student test performance. Immediate warning signs appear for those in the education profession. Some states require more stringent standards than others in how test scores are tabulated. Does this mean that teachers who are educating non-English speaking children or students with special needs will be censured because of the caliber or capabilities of learners? How does this measure bode
G. Esch and B. Cox IHART - Volume 16 (2011)
45
for teachers seeking tenure? How will the calculations translate for teachers and administrators who are attempting to obtain licensure in another state? The time has come for educators to have a voice in legislative policy that affects their profession. A partnership is essential between those who establish the laws and mete out the funding to collaborate with those recipients who are adhering to the established standards. Without mutual communication regarding the complex issues of licensure and reciprocity, both educators and students will be the ultimate pawns in a situational chessboard. Teachers and administrators are viable players who can participate in the game by offering beneficial cooperation, innovative ideas, and constructive resolutions.
REFERENCES
Bredekamp, S., & Copple, C. (1997). Developmentally appropriate practice in early childhood programs. Washington, D.C.: National Association of the Education of Young Children.
Curran, B., Abrahams, C, & Clarke, T. (2001). Solving teacher shortages through license reciprocity: A report of the SHEEO project. Retrieved-December 13, 2009, from http://www.sheeo.org/quality/mobility/reciprocity.
Darling-Hammond, L. (2000). Solving the dilemmas of teacher supply, demand, and standards: How we can ensure a competent, caring., and qualified teacher for every child. Washington, DC: National Commission on Teaching and America's Future.
Eisinger, P. & Hula, R. (2004). Gunslinger school administrators: nontraditional leadership in urban school systems in the United States. Urban Education, 39(6), 621-637.
Guarino, C., Santibañez, L., & Daley, G. (2006). Teacher recruitment and retention: A review of the recent empirical literature. Review of Educational Research 76(2), No. 2, 173–208.
Institute of Education Sciences. (2002). Characteristics of effective teachers. Retrieved December 12, 2009, from http://ies.ed.gov/director/speeches2002/03_05/2002_03_05b.asp.
Kane, T, Rockoff, J. & Staiger, D. (2006). What Does Certification Tell Us About Teacher Effectiveness? Evidence from New York City. Retrieved-December 13, 2009, from http://gseweb.harvard.edu/news/features/kane/nycfellowsmarch2006.pdf.
Kelley, B. (2007). Teacher Recruitment, Preparation, Induction, Retention, and Distribution in Wehling, R. (ed) Building a 21st Century U.S. Education System. Washington, D.C.: National Commission on Teaching and America‘s Future.
Merriam-Webster Online Dictionary. (2009). Diploma mill. Retrieved December 12, 2009, from http://www.merriam-webster.com/dictionary/diploma+mill.
Meyer, L. & Feistritzer,E. (2003). Better leaders for America‘s schools: A manifesto. Washington, DC: The National Center for Education Information.
NASDTEC (2006). The NASDTEC interstate agreement facilitating mobility of educational personnel. Retrieved December 18, 2009, from http://www.nasdtec.org/agreement.php.
NASDTEC Interstate Educator Certification/Licensure Agreement 2005-2010. Retrieved December 18, 2009, from http://www.nasdtec.org/docs/NIC_2005-2010.doc.
National Center for Education Information. Alternative routes to teacher education. Retrieved April 16, 2010, from http://www.ncei.com/Alt-Teacher-Cert.htm.
National Education Association. Research spotlight on best practices in education. Retrieved-December 26, 2009, from http://www.nea.org/tools/17073.htm.
U.S. Department of Education. Elementary and secondary education act. Retrieved December 18, 2009, from http://answers.ed.gov/cgi-bin/education.cfg/php/enduser/std_adp.php?p_faqid=4
U.S. Department of Education: Executive summary archived information. Retrieved December 18, 2009. from http://www.ed.gov/nclb/overview/intro/execsumm.html.
U.S. Department of Education. Innovations in education: Alternative routes to teacher certification. Retrieved December 13, 2009, from http://www.ed.gov/admins/tchrqual/recruit/altroutes/index.html.
U.S. Department of Education. Prepare for my future: Diploma mills and accreditation. Retrieved December 15, 2009, from http://www.ed.gov/students/prep/college/diplomamills/diploma-mills.html.
U.S. Department of Education: The Federal Role in Education. Retrieved December 18, 2009, from http://www.ed.gov/about/overview/fed/role.html.
U.S. Department of Education: Letters to chief state school officers regarding an update on several NCLB cornerstones. Retrieved December 18, 2009, from http://www.ed.gov/about/overview/fed/role.html.
U.S. Department of Education. Race to the top fund. Retrieved December 22, 2009, from http://www.ed.gov/programs/racetothetop/index.html.
U.S. Department of Education, The American Recovery and Reinvestment Act of 2009: Saving and Creating Jobs and Reforming Education. Retrieved December 22, 2009, from http://www.ed.gov/policy/gen/leg/recovery/implementation.html.
V. Freeman IHART - Volume 16 (2011)
46
EDUCATION LEADERSHIP: EXPLORING PERSONALITY STYLES: DISC “HIGH I” AND COLORS
Virgil Freeman
Northwest Missouri State University, USA
ABSTRACT
It is a discussion that in educational organizations there is an assumption that leaders of educational change should be both leaders and managers. They must know the people they are working with as well as who they are with their leadership style. These successful leaders of educational change have in common six characteristics: being visionary, believing that schools are for learning, valuing human resources, communicating and listening effectively, being proactive, and taking risks. All areas are part of the personality of the leader. Furthermore, these characteristics are indicative of these educational leaders‘ successful performance in the two dimensions considered necessary for effective leadership—initiating structure, which is primarily concern for organizational tasks, and consideration, which is the concern for individuals and the interpersonal relations between them. Knowing the personality styles of the individuals they have on their staff will be of benefit for this leadership.
OVERVIEW
Leadership requires vision. It is a force that provides meaning and purpose to the work of an organization. Leaders of change are visionary leaders, and vision is the basis of their work. Leaders of educational change illustrate this with their vision and belief that the purpose of schools is students‘ learning. Valuing human resources as well as communicating and listening are directly associated with the dimension of consideration. Being a proactive leader and a risk taker demonstrate the dimension of initiating structure. Leaders of educational change respond to the human as well as the task aspects of their schools and districts. Effective change leaders have a belief that the purpose of their school system is to meet the instructional needs of students. Leaders for change recognize that the people in the organization are its greatest resource and knowing their personality styles will benefit the change. A successful leader values the professional contributions of the staff, have an ability to relate to people, and can foster collaborative relationships. They form teams, support team efforts, develop the skills that groups and individuals need, and provide the necessary human and material resources to realize the school or district vision. Leaders of change provide the needed stimulus for change. They also have to be able to understand who will benefit the entire district. Calling attention to the possibilities, they take risks and encourage others to initiate change. School leaders encourage their staff to experiment with various instructional methods to meet the academic needs of the students. They guide and provoke the staff to explore options that more adequately address the needs of their students and provide the environment that makes risk-taking safer. They provide their staff with opportunities to consider and implement curriculum changes as well as encourage experimentation with different arrangements of organizational structures, such as schedules and class size. In the current era of accountability, strong leadership is necessary for high levels of student achievement. District and school leaders must be actively involved in designing improvement, allocating resources, and developing and monitoring accountability processes. Leaders should also guide teachers in developing their own leadership abilities, implementing new practices, and using assessment to improve instruction.
EXPLORING PERSONALITY STYLES: DISC “HIGH I” AND COLORS
Finding the right person for the job can sometimes be a challenge. According to Hurst (2006), ―There is solid evidence suggesting that defining an employee‘s or candidates natural instincts will often provide the information you need to make your best job placement decision‖. A leader needs to look at all personality areas and realize that these styles will make a difference in the district. There are many personality assessment tools available to help with this task. This discussion will take a look at personality styles using the DISC Inventory and Colors of Hue-man Traits. The DISC is a four quadrant behavioral model. All four styles are equally important and most people are a blend of all four styles. A person‘s work style is also influenced by other factors beyond DISC, such as life experiences, education and maturity. The four quadrants include:

V. Freeman IHART - Volume 16 (2011)
47
1. Dominance: These people are direct and decisive. They are very active in dealing with problems and challenges, while those with low dominance scores are people who want to do more research before committing to a decision. A high dominance person is described as demanding, forceful, egocentric, strong willed, driving, determined, ambitious, aggressive, and pioneering. A low Dominance person is described as those who are conservative, low key, cooperative, calculating, undemanding, cautious, mild, agreeable, modest, and peaceful.
2. Influence: People with high influence, influence others through talking and activity and tend to be emotional. They are described as convincing, magnetic, political, enthusiastic, persuasive, warm, demonstrative, trusting, and optimistic. Those with low influence style are influenced more by data and facts, and not with feeling. They are described as reflective, factual, calculating, skeptical, logical, suspicious, matter of fact, pessimistic, and critical.
3. Steadiness: People who are high is steadiness traits want a steady pace, security, and do not like sudden change. High steadiness individuals are calm, cooperative, relaxed, patient, possessive, predictable, stable, consistent, and tend to be unemotional. People with low steadiness scores are those who like change and variety. These people are described as restless, demonstrative, impatient, eager or impulsive.
4. Conscientiousness: People in this category adhere to rules, regulations, and structure. They like to do quality work and do it right the first time. They are careful, cautious, exacting, neat, systematic, diplomatic, accurate and tactful. Those with low conscientiousness ratings challenge the rules and want interdependence and are described as self-willed, stubborn, opinionated, unsystematic, arbitrary, and careless with details.
The Hue-man Traits uses color as a metaphor for understanding human characteristics and how intrinsic behavior must be rewarded differently to create success and attain self-esteem (Vandel). One of four colors are used to represent personality types, which include:
1. Nurturer Blue- The Blue type individual is sensitive to others needs, sincere, cooperative, caring and a team player. They are a people person who engages others. This type is idealistic and loyal and seeks unity.
2. Adventurous Orange- People who score high as the orange type are action oriented, quick-witted and spontaneous. They like to have fun in their work and are risk-takers. These people are good multi-taskers, enjoys problem solving and performs well under pressure.
3. Traditional Gold- Gold personalities respect authority, rules, routines and policies. They are dependable, prepared and efficient. Work comes before play for these people. There is a right way to do everything according to the gold way of thinking. Stable, organized, punctual and helpful also describe this personality.
4. Visionary Green- Describing words of the green personality include intellectual, inquisitive, impartial, improvement oriented, persistent, systematic, logical, inventive and self-sufficient. These people are careful planners and enlivened by work. They look forward and can see impact of actions taken. They also explore all facets before deciding and check for accuracy.
Which personality type is the most effective? The answer according to Bowlby (2007) is that each of us is effective with different people, problem, and situations. One is not better than another and it is also important to realize most people do not function as strictly one type. Most of us are a combination of types. The ―Pure High I‖ personality makes up only 1% of the population. This means a person‘s core behaviors are consistent with the ―I‖ traits. The general characteristics of this person are enthusiastic, trusting, optimistic, persuasive, talkative, impulsive and emotional. ―I‖ individuals bring enthusiasm to a group and are creative problem solvers. They motivate other towards a goal and have a positive sense of humor. Being a team player and ability to negotiate conflict are a strength for these folks. Some of the downfalls of the ―I‖ is they can act impulsively and not pay attention to detail. Sometimes they have difficulty planning and controlling time. People who show higher ―I‖ have a greater tendency to trust others. To be effective, these people need to interact and verbalize with others. They need freedom from control and details and freedom of movement. Ideal tasks would include motivating groups and establishing a network of contacts. The ―Pure High I‖ personality of the DISC is similar to the ―orange‖ Hue-man description. These individuals too are seen as problem solvers. They are flexible, energetic, perform well under pressure and welcome change. They often expect people to make it fun! There are many different personality types. Personality impacts who we are, how we act and why we do what we do. It influences decision making, affects the way we learn, and contribute to stress and tension. It determines our perception of time and how we manage it. None of the personality types are better or worse than the others. (Witt). Knowing your own personality and those of others can be used to your advantage as a leader. A personality profile can be used to improve communication, build effective teams and help people reach their full potential. Understanding your own personality better can make you more effective when working with others. The more you know about yourself, the better you will become more effective when working with others (Ritberger). Knowing about yourself and others helps to perfect the art of management. Applying what you know

Education Leadership: Exploring Personality Styles: DISC ―High I‖ and Colors
48
about personality and using it in a way that uses people‘s talents and strengths creates an environment where everyone wants to succeed. Effectively placing people to work together in a cooperative manner, placing the right people in the right jobs minimize power struggles due to personal differences. A lot of time and energy is lost when we don‘t understand the important role that personality plays.
REFERENCES
Bowlby, D. (2007). 4 Personality Types: Who is the most effective? March 23 http://www.buzzle.com/articles/4-personality-types-who-is-most -effective.html
Hurst, E. (2006). Right person for the job. Landscape Management. Oct.106-108. Ritberger, C. (2007). Managing people: what‘s personality got to do with it? Hay House Inc. Vandel, D. Hue-Man Traits Personality Types http://www.wining-solutions.com/Traiings/True_Colors/truecolor.html Witt, C. The ―I‖ Personality Type Influence, Image, Enthusiasm http://www.wittcom.com/DISC_I_personality.htm
A. Finch, E. Rahim and D. N. Burrell IHART - Volume 16 (2011)
49
MULTIFACETED ASSESSMENT OF ADULT LEARNING STYLES AND TECHNOLOGY-DRIVEN LEARNING FOR ONLINE STUDENTS
Aikyna Finch1, Emad Rahim2,3,4 and Darrell Norman Burrell5,6,7
1Strayer University, USA, 2Walden University, USA, 3Kaplan University, USA, 4Morrisville State College, USA, 5Virginia International University, USA, 6A.T. Still University, USA
and 7Marylhurst University, USA
ABSTRACT
Education and online technology are merging to create a new mode of learning for students. This new learning mode allows many adult learners the opportunity to achieve at a level that has not been reached in traditional learning environments. The collaboration of different learning styles and the use of technology enhance this process. Now that online education is growing rapidly with the support of online universities and for-profit institutions, it is necessary to explore the benefits of integrating different technology resources to support adult learning styles.
INTRODUCTION
The growing crisis in the U.S. has caused many traditional colleges and universities to consider new ways to ensure economic competitiveness and continued financial growth without increasing the size and overhead of their campus.. Universities like Upper Iowa, University Bates College in Maine, and Ball State University in Indiana have begun to offer three-year undergraduate degrees and provide online courses to save students both time and money (Pope, 2009). Several colleges in Colorado are considering the option of moving from a traditional undergraduate classroom format to adding online courses as a means to raise revenue and increase student enrollment. Because learning styles and technology utilization are areas of high interest, it is essential to conduct an analysis of adult learning theory and teaching styles. This paper examines relevant literature to understand the connections and differences between adult learning styles and teaching styles in traditional classrooms and in online classrooms. By exploring these phenomena, we will shed light on successful methods and approaches that can influence best practices for online instruction. Emerging trends in traditional higher education support this growing demand for online college degree programs. The following data highlight the urgency we are seeing in the restructuring of traditional degree-offering and learning platforms:
Senior administrative officials at the University of Tennessee are recommending abolishing roughly 800 positions, increasing tuition and eliminating academic programs to counteract waning state revenues due to the fledgling U.S. economy (Mansfield, 2009).
Northeastern Louisiana‘s three academic institutions are planning to cut 255 jobs and reduce more than $21 million from their budgets next year, also due to the economic crisis that has caused the state to have a projected $1.4 billion budget deficit (Hillburn, 2009).
The University of Washington eradicated 1,000 employee positions in 2009 in response to anticipated severe higher education budget cuts from the state legislature, which is facing a $9 billion state budget shortfall (Easton, 2009).
Wellesley College is cutting its workforce by 80 employees to save money as it becomes the latest institution of higher education forced to make momentous budget cuts (Terris, 2009).
Since about 1970 it has been a common trend for traditional colleges and universities to recruit adult learners. In 1972, the Commission on Non-traditional Study asked the Center for Research and Development in Higher Education at the University of California at Berkeley to survey two- and four-year colleges and universities concerning the education of adults that work (Ruyle and Geiselman, 1974). At that time, between 1,000 and 1,400 American colleges and universities offered degree programs that were considered ―nontraditional‖ in the sense that they served adult learners through evening or correspondence learning courses. The study provided interesting data on the growth in lifelong learning. According to the results of the study, 7% of the programs were more than 10 years old, which provides some early evidence that colleges and universities are altering the nature and delivery of traditional programs to appeal to and serve adult students. According to Steinbech (2000), consideration of learning styles has always been critically important to teaching and learning. Similarly, researching learning styles of adults in the context of a technology-driven learning community can provide awareness

Multifaceted Assessment of Adult Learning Styles and Technology-Driven Learning for Online Students
50
of what has to occur to make the learning experience comprehensive and rich for adult students. Knowledge of compatible learning and teaching styles is essential to the development of course content, teaching approaches, and learning assessments. Administrators, faculty members, and course developers who shape adult learning styles can influence knowledge acquisition, transfer, and application when teaching adult students (Steinbech, 2000). Developing an understanding of adult learning styles is important in face-to-face classrooms in general, but using technology to deliver course content online adds another dimension and challenge to student success. Mackeracher (2003) outlined that students grasp and retain information more effectively and efficiently when they are taught with methods that match their preferred learning styles. Through the use of particular teaching methodologies geared toward the specific learning styles of adults enrolled in online technology-driven courses, it may be possible to enhance the learning experiences of adult students. Developing staff, faculty, and organizational dexterity in understanding adult learning styles is critical for colleges and universities that are moving from serving traditional-age college students to working adult students (Mackeracher, 2003). Working adult students or adult learners are not characterized by age but are identified by adult learner traits: self motivation, curiosity about learning, extensive work and life experiences, critical thinking skills, the aptitude to learn in groups, the capability to engage in reflection and introspection, the capacity to engage in self-directed learning, and the ability to articulate and apply their perspectives and experiences to course content. These characteristics make teaching them both challenging and unique (Wynn, 2006). Adult learners share similar personas; they approach their learning with dissimilar backgrounds and levels of preparedness (Diaz and Cartnal, 1999). In addition, adults connect to their learning experiences based on their learning preferences and learning styles (Diaz and Cartnal, 1999; Claxton and Murrell, 1987). These learning traits make it difficult for adult learners to study in a traditional educational setting. This is why the technology-driven online course atmosphere was designed to be adaptable (Buckle and Smith, 2007). The question is: when is the right time to transition from the teaching of the traditional school to the technology atmosphere of the corporate world? According to Diaz and Cartnal (1999), a successful transformation from a traditional classroom-based learning community for recent high school graduates to a technology-driven learning community offering online courses to working adults is critical. Such a transformation is needed to understand the range of variables and teaching methods adult students need to be engaged and connected. As faculty and curriculum developers move from traditional face-to-face classrooms to technologically driven online classroom delivery methods, they must pay considerable attention to community teaching and instructional approaches. Gee (1990) outlined that several studies have supported that student engagement and success is positively influenced when teaching approaches are geared toward preferred learning styles.
LITERATURE REVIEW
Learning style is described by Merriam and Caffarella (1991) as an ―individual‘s characteristic ways of processing information, feeling, and behaving in a learning situation‖ (p. 176). Diaz and Cartnal (1999) asserted that a learning style is a student‘s preferred way of absorbing and understanding new information: ―It does not have anything to do with how intelligent you are or what skills you possess; it had to do with how your brain works most effectively to learn new information‖ (p. 130). In brief, a student‘s learning style is determined by the means in which new data attainment is maximized, retained, and comprehended most successfully (James and Gardner, 1995, p.21). Knowing the learning style of the adult learner and adapting the material accordingly will bring forth ultimate understanding.
ADULT LEARNING
One of the most influential theorists on adult learning is Malcolm Knowles, who developed the concept called andragogy. His conceptual framework distinguishes the key differences between how adults learn and how children learn. His theory of andragogy could be defined as the proficiency and discipline of how adults learn; it can be contrasted with pedagogy, which considers how children learn (Knowles, 1984). According to Knowles (1984), in the pedagogic model, teachers presuppose the duty for making decisions concerning what will be learned, the method used for learning, and the timing of the learning process. Under this approach, teachers tightly control all aspects and variables of the learning process. Pedagogy is considered teacher-directed instruction, which places the student in a docile position necessitating deference to the teacher's directives. This method for teaching children assumes that students‘ minds are like an empty pitcher into which the teacher pours knowledge and information. The result is a teaching and

A. Finch, E. Rahim and D. N. Burrell IHART - Volume 16 (2011)
51
learning state of affairs that keenly endorses heavy reliance and dependency on the teacher. In many ways the pedagogical model does not work well for teaching adults (Knowles, 1984, p. 43). According to Knowles (1984), andragogy is based on a number of beliefs about adult learners:
1. As a person matures, his or her self concept moves from that of a dependent personality toward one of an independent and self-directed person.
2. An adult‘s collective life and professional experiences are a rich resource for knowledge transfer and learning. 3. The motivations and readiness of an adult to learn are closely related to developmental tasks that include successes and
lessons learned from his or her social role. 4. There is a change in time perspective in learning as people evolve and mature in the manner that newly gained
knowledge and theory can have the ability to be immediately applied in real world problem solving and analysis (Knowles, 1984, pp. 44-45).
5. The most powerful motivations for learning and the desire for knowledge acquisition are internal rather than external (Knowles, 1984).
6. Adults need to understand the applicability and practicality of why they need to learn something (Knowles, 1984). In a similar vain to Knowles, John Sperling (1989) outlined important theories about how adults learn in relation to younger students and used these principles to develop and create the University of Phoenix. His premise is based on the belief that at traditional universities all knowledge is assumed to reside with the professor, whose job is to transmit it to the passive and inexperienced students. This traditional form of teaching consists of a faculty lecture where students take notes to prepare for exams where the students are expected to regurgitate back to the professors his/her own words on an exam as a determination of the student‘s learning (Sperling, 1989, p. 73). While this method may be acceptable for youthful students with little professional experience, it frustrates and hampers the motivation of working adult students because the method discounts the knowledge and experience that they can add to the discussion (Sperling, 1989, p. 73). ―Because of their broad professional work experience, adult learners react with frustration or boredom or antagonism to teachers that have spent their academic lives in a professional cocoon of just being on campus, doing research, and not working professionally in the fields that they teach in. Knowing little of the related professional activities in the professional practice world beyond the campus walls, and lacking real world reference points, faculty present knowledge of their discipline in an academic vacuum; what is being taught frequently has no application to what is happening in the working world. Applied knowledge is not viewed as important as theoretical knowledge, and there is no requirement to apply theoretical knowledge to the world beyond the academy. Rather than viewing the academic disciplines as tools to solve practical, interdisciplinary problems, professors view mastery of a discipline as an end in itself (Sperling, 1989, p. 73). Kemp, Morrison, and Ross (1998) noted that the andragogical model of instruction is heavily focused on presenting methods for assisting students with the acquisition and retention of new knowledge and skills. In this mode, the teacher arranges a set of activities for engaging students with strategies that include establishing a community favorable to learning; devising content that will facilitate education; crafting a blueprint of learning experiences; performing these learning occurrences with appropriate procedures and content; and appraising the accomplishment of learning results and revising approaches as necessary. According to Gibson (1998) a prominent factor in teaching successfully online for adults is making sure that ―the learner is in charge of what gets learned‖ (p. 65).
ADVANCED ADULT LEARNING STYLE THEORIES
Learning styles are so assorted that no solitary theory can sufficiently tackle the diverse perspective adults bring to a learning community. However, this has not prevented theorists from offering their own perspectives to the discussions about the nature and nuances of adult learning styles.
KOLB
Kolb (1985) provided a framework in accordance with four categories of adult learning styles: convergers, divergers, assimilators, and accommodators. Convergers collect knowledge by thinking and evaluating and then practically applying new ideas and perspectives. The aptitude to practically apply fresh concepts is this learner‘s maximum competence. Convergers classify data through hypothetical deductive and logical-oriented interpretation (Kolb, 1985).

Multifaceted Assessment of Adult Learning Styles and Technology-Driven Learning for Online Students
52
Divergers acquire new data via their own insight and intuition. Individuals with this chosen style of learning draw upon their imaginative competence and their aptitude to observe multifaceted circumstances from a mixture of vantage points and contexts. Divergers also enjoy the ability to effectively amalgamate information into coupled contexts. Their imaginative talent is their utmost learning proficiency (Kolb, 1985). Assimilators possess significant capacity to construct theoretical models and critically think inductively. They learn most effectively by thinking, assessing, reflecting, and planning. Assimilators focus chiefly on the expansion of constructs and theories to a spot that often ignores facts that contradict the foundations of those theories and constructs (Kolb, 1985). Accommodators, unlike assimilators, cast off constructs and theories if the facts do not match. These learners do exceptionally well in scenarios where they have to apply constructs to a specific state of affairs. Their peak strength is their ability to complete tasks and to become fully involved in fresh occurrences. Accommodators approach problems in an intuitive, trial-and-error manner, and they obtain information from others rather than from their own critical assessment capabilities (Kolb, 1985). Kolb's learning model sets out four distinct styles which are based on a four-stage learning cycle that offers a way to understand different learning styles. He believed that the four-stage cycle of learning was a central principle of his experiential learning model. In this cycle the learner goes through the following four stages: experiencing, reflecting, thinking, and acting. Each of the stages depends on the next to achieve the optimum experience (Kolb, 1985). Kolb's (1985) model therefore works on two levels: - a four-stage cycle:
1. Concrete Experience - (CE) 2. Reflective Observation - (RO) 3. Abstract Conceptualization - (AC) 4. Active Experimentation - (AE)
- and a four-type definition of learning styles:
1. Diverging (CE/RO) 2. Assimilating (AC/RO) 3. Converging (AC/AE) 4. Accommodating (CE/AE)
DUNN AND DUNN
This is a learning model based on environmental preferences that are necessary to produce optimum retention for the learner. Rita and Kenneth Dunn developed the Dunn and Dunn Learning Style Model in 1978. It consists of 21 elements compiled into five strands that affect each individual's learning:
1. Environmental – Light, Sound, Temperature, Design 2. Emotional – Motivation, Persistence, Responsibility, Structure 3. Sociological – Self, Pair, Peer, Team, Adult 4. Physiological – Perceptual, Intake, Time, Mobility 5. Psychological – Global, Analytic, Hemispheric, Impulsive, Reflective
Each of the elements come together to create the optimum learning environment. Because every learner is different, each of these strands addresses the separate needs that must be met to achieve optimum retention. Once the adult learner and the instructor are aware of the needs, they can come up with a plan to adapt the material if necessary. The Dunn and Dunn learning model is administered on two different levels:
1. K-12 Students – Dunn and Dunn Learning Styles Inventory 2. Adult Students – Productivity Environmental Preference Survey
GREGORC
The Mind Styles model was developed by Anthony Gregorc (1982). Based on research of brain hemispheres, it states that the adult learners have two perceptual qualities (concrete and abstract) and two ordering abilities (random and sequential).

A. Finch, E. Rahim and D. N. Burrell IHART - Volume 16 (2011)
53
There are four combinations of perceptual qualities and ordering abilities based on dominance:
1. Concrete Sequential – The learner prefers hands-on instruction and real-life examples 2. Abstract Random – The learner prefers visual instruction and reflection time. 3. Abstract Sequential – The learner prefers verbal method and well organized material. 4. Concrete Random – The learner prefers trial and error and needs stimulation.
The assessment tool, the Gregorc Style Delineator, identifies the mediation abilities that develop into the individual‘s learning style (Gregorc, 1982). The tool uses a word matrix that is ranked and calculated for each learning style. A score of 27 or more concludes that the adult learner is dominant in that particular learning style (Sadowski, Birchman, and Harris, 2006).
MYERS-BRIGGS
The Myers-Briggs personality indicator is based on Carl Jung‘s learning model. This indicator has been used in educational settings to find the best instructional fit for the adult learner. The results of the indicator are broken down into four personality stages and each stage is broken down into two opposites to create one of 16 combinations (Baron, 1998). The Myers-Briggs stages are as follows:
Extraversion Introversion Sensing iNtuition Thinking Feeling Judging Perceiving
The Myers-Briggs combinations are as follows:
ISTJ ISFJ INFJ INTJ
ISTP ISFP INFP INTP
ESTP ESFP ENFP ENTP
ESTJ ESFJ ENFJ ENTJ
The way that the adult learner rates on the stages of Myers-Briggs will determine how they will react in the world. Educators are encouraged to tailor the delivery of the material to the student‘s identifier because learning will be halted if the delivery is not compatible (Baron, 1998).
Aslanian and Brickell (1980) outlined that adults do not learn for learning‘s sake, but they do so in order to adapt to change and to be more competitive professionally. The more life-changing events that adults encounter, the more motivated they are to seek new learning experiences. Keefe (1989) outlined adult learning styles into four distinct categories: cognitive styles, affective styles, physiological styles, and interpersonal styles. Cognitive styles relate to receiving, forming, and retaining information. Affective styles refer to attention and motives for learning. Physiological styles refer to learning behaviors related to physical or physiological factors. Interpersonal styles refer to learning behaviors related to social or relational variables. All of these categories contribute to the learning styles of adults in their own respective areas.
DISTANCE LEARNING
Distance learning has become more common for adult learners as a tool to address the diversity and constraints of adult learners. Because of the lack of face–to-face interaction, there are certain teaching and learning variables that must always be considered (Rybarczyk, 2007). It is important to be clear when it comes to distance learning due to the fact that environment is often driven by self-directed and self-motivated learners (Dobrovolny, 2006). Self-directed learning (SDL) occurs when the adult learner directs his or her own learning. It is the goal of SDL to allow students to charter the accomplishment of some of their own personal learning outcome objectives (Dynan, Cate, and Rhee, 2008). While technology provides the platform for online discussion, to get full benefit of distance learning adult students require engagement in exercises and activities that appeal to their learning preferences and are relevant to their experiences According to Gulati (2008), adult learners differ in their approach to learning.

Multifaceted Assessment of Adult Learning Styles and Technology-Driven Learning for Online Students
54
Practical learning experiences rate high in the process of adult learning, and many adult learners fall into one of three categories: Navigators, Problem Solvers, and Engagers. Navigators are alert and ordered learners. Problem Solvers are critical thinkers who seek to discover constructive and efficient choices and solutions. Engagers function best when they are dynamically engaged in gaining and comprehending new knowledge. Adult learning is based on the proactive and learner-centered approach. This approach stimulates the student through the development of theory-to-application content that teaches critical thinking and problem solving in the context of the subject matter of the course and the method of course delivery (McCoy, 2006).
LEARNING STYLES AND ONLINE LEARNING
Instructors need to consider learning styles because technology is part of the educational environment (Buch and Bartley, 2002). The instructor needs to know the learning style of the students in order to effectively deliver the course content. The instructors also need to utilize a variety of teaching, learning, and assessment methods to enhance new knowledge development (Zapalska and Brozik, 2007). According to Kelly (2006), when it comes to teaching adults, the instructor needs to be flexible and be able to adapt the material to real-life examples that the adult learners can relate to. There are six factors that motivate adult learners: attitude, need, stimulation, affect, competence, and reinforcement (Kelly, 2006).
Technology is enhancing access to learning for students (Li and Edmonds, 2005). As a result of online learning, many adult learners are benefiting from being educated through technology (Taylor, 2006). Although there are many positives to technology, there has been negative feedback concerning the introduction of technology to education according to Buckley and Smith (2008). Acceptance of technology in various academic communities has been varied. While some colleges have embraced online learning as an innovative wave of the future, others have questioned its value and credibility (Buckley and Smith, 2008). There have been concerns regarding cost and complications of technology (Gibson, Harris, and Colaric, 2008).
Technology is advancing at such a rapid rate that it is a necessity for colleges to stay competitive in their ability to provide educational opportunities to the most diverse spectrum of students. Technology is not cheap, and it is tapping into the limited resources of colleges and universities (Gibson, Harris, and Colaric, 2008). There is a need for better planning and collaboration to stay current with not just technology but the best ways to reach and teach adult students.
In addition to the business side of education, the academic side has had negative feedback toward technology in education. The virtual environment has issues that cause a negative experience for both the instructor and the student. Consistency, clarity, and knowledge are just a few areas that are critical for a virtual environment to work. However, in most cases these are the same areas that are lacking in the classroom environment (Dykman and Davis, 2008).
Though inquiry and inductive techniques have been promoted for many years, new technologies give learners options in implementing these approaches that were unavailable to teachers as recently as a decade ago. These techniques require learners to have access to large quantities of specific information. Today, the World Wide Web provides opportunities for learners to access information available at locations throughout the globe. With proper training, learners can engage in incredibly diverse activities. For example, teachers can involve learners in reading speeches from Martin Luther King, Jr.; view paintings housed in museums in France; and even download voice and music files from the 1950s. When instructors engage adult learners in technology-driven learning approaches in this new environment, they do not act as an assembler and presenter of information. Rather, they facilitate learning by requiring students to find creative and innovative solutions from new and different paradigms.
TECHNOLOGY AND THE ADULT LEARNER
According to Gold (2005), adult learners have many technical challenges compared to their traditional learner counterparts. Many adults have barriers such as lifestyle, work, and time constraints that keep them from learning how to use technology. Anxiety has proved to be one of the major obstacles for adult learners when embracing technology and online learning (Gold, 2005). The best way to approach technical anxiety is to understand the student‘s expectations and make the curriculum interactive (Gold, 2005). Making support available and providing structure that allows the student to grow are critical to relieving student anxiety (Fidishun, 2000).
TYPES OF TECHNOLOGY BEING USED TO EDUCATE ADULTS
Technology has made a great impact on education in the 21st century. Adult learners use a combination of print, data, video, and voice technology to attain vast amounts of training and degrees. Technology is used in two instructional categories: synchronous and asynchronous (Diaz and Cartnal, 1999).

A. Finch, E. Rahim and D. N. Burrell IHART - Volume 16 (2011)
55
Synchronous instruction occurs when students participate at the same time. Using this type of instruction, the instructor can simulate the real-time environment of the traditional classroom setting. This form of instruction works well during chat sessions and conferencing via telephone or web. Many discussion periods are enhanced by using this method because students benefit from the value of immediate reactions and answers that participants would not receive from other technology, such as online threads (Diaz and Cartnal, 1999). Asynchronous instruction occurs when students participate at their own rate. Using this type of instruction, the instructor can present the material and the student can take time to absorb new information. This form of instruction works well for correspondence and web-based courses. Many adults choose this style of instruction because they can fit learning into their busy schedules (Diaz and Cartnal, 1999).
CONCLUSION
The partnership between education and technology has made a great impact on the lives of many students. People once called hopeless in the traditional education environment now excel above because technology can be structured to the individual student on a level that traditional education cannot reach. There are many technology-based curricula — enough to enhance every learning style. Some respond to the student‘s every learning need; others cater to a broader audience. Whether the student needs stimulation, motivation, or clarification, technology can be designed to shape and mold the student in a way that can only be done by innovation. Technology is only going to improve in its presence and function in the education field. As curriculum developers and online designers become more innovative in their approaches to tailoring to adult learning styles, these scenarios will only enhance the learning options for adult students in print, data, video, or voice. When instructors use new technologies to develop learners' capacities as researchers, there are opportunities to accommodate their individual learning styles and preferences. For example, instructors can provide alternative suggestions to adult students who, respectively, prefer to learn (1) by reading materials, (2) by watching video clips on YouTube, or (3) by hearing speeches. Educational specialists who advocate using new technology for this purpose point out that learners find this kind of intellectual engagement motivating (Merrow, 2001).
REFERENCES
Aslanian, C.B., and Brickell, H.M. (1980). Americans in Transition: Life Changes as Reasons for Adult Learning. New York, NY: College Entrance Examination Board.
Baron, Renee. (1998). What Type Am I?: The Myers-Brigg Type Indication Made Easy. London: Penguin Publishing. Buch, Kim, and Bartley, Susan. (2002). Learning style and training delivery mode preference. Journal of Workplace Learning,
14(1/2), 5. Buckley, Wendy, and Smith, Alexandra. (2007). Application of Multimedia Technologies to Enhance Distance Learning.
Review, 39(2), 57. Cercone, K. (2008). Characteristics of adult learners with implications for online learning design, AACE Journal, 16(2), 137-
159. Chiou, Wen-Bin (2008). College Students' Role Models, Learning Style Preferences and Academic Achievement in
Collaborative Teaching: Absolute Versus Relativistic Thinking. Adolescence, 43(169), 129. Claxton, C.S., and Murrell, P.H. (1987). Learning Styles: Implications for Improving Educational Practices. ASHE-ERIC Higher
Education Report No. 4, 1987. Diaz, D. P., and Cartnal, R. B. (1999). Students' learning styles in two classes: Online Distance Learning and Equivalent On-
campus. College Teaching 47(4), 130-135. Dobrovolny, Jackie (2006). How Adults Learn from Self-Paced, Technology-Based Corporate Training: New Focus for
Learners, New Focus for Designers. Distance Education, 27(2), 155. Dunn, R., and Dunn, K. (1978). Teaching Students through their Individual Learning Style: A Practical Approach. Reston, VA:
Reston Publishing. Dykman, Charlene A., and Davis, Charles K. (2008). Part One - The Shift Toward Online Education. Journal of Information
Systems Education, 19(1), 11. Dynan, Linda, Cate, Tom and Rhee, Kenneth. (2008). The Impact of Learning Structure on Students‘ Readiness for Self-Directed Learning. Journal of Education for Business, 96-100 Eaton, Nick (2009), UW to eliminate about 1,000 jobs by May 1. Seattle Post Intelligencer. Retrieved April 14, 2009 from
http://www.seattlepi.com/local/405144_uwlayoffs15.html

Multifaceted Assessment of Adult Learning Styles and Technology-Driven Learning for Online Students
56
Education Place website (1999). Retrieved in December 17, 2008, from geocities.com/ educationplace/basic.html Fidishun, Dolores. (2000). Teaching adult students to use computerized resources: Utilizing Lawler's keys to adult learning to
make instruction more effective. Information Technology and Libraries, 19(3), 157. Fidishun, Dolores. (2000). Andragogy and Technology: Integrating Adult Learning Theory As We Teach With Technology.
Retrieved in December 17, 2008 from frank.mtsu.edu/~itconf/proceed00/ fidishun.htm Gardner, H. (2001) Jerome S. Bruner in J. A. Palmer (ed.) Fifty Modern Thinkers on Education. From Piaget to the present.
London: Routledge. Gee, D. G. (1990). The Impact of Students‘ Preferred Learning Styles Variables in a Distance Education Course. A Case
Study. Portales, NM: Eastern New Mexico University. Gibson, C. C. (1998). The distance learners‘ academic self-concept. In C. Gibson (Ed.) Distance learners in higher education:
Institutional responses for quality outcomes. pp. 65-76. Madison, WI: Atwood. Gibson, Shanan G., Harris, Michael L., and Colaric, Susan M. (2008). Technology Acceptance in an Academic Context:
Faculty Acceptance of Online Education. Journal of Education for Business, 83(6), 355. Gold, Helene E. (2005). Engaging the Adult Learner: Creating Effective Library Instruction
portal: Libraries and the Academy - Volume 5, Number 4, October 2005, pp. 467-481 Gregorc, A. (1982). Gregorc style delineator: development, technical and administration manual. Columbia, Connecticut:
Gregorc Associates, Inc. Gulati, Shalni. (2008). Compulsory participation in online discussions: is this constructivism or normalization of learning?
Innovations in Education and Teaching International, v45 n2 May 2008, p183-192 Hanna, D.E. (1998). Higher Education in an Era of Digital Competition; Emerging Organizational Models. Journal of
Asynchronous Learning Networks, Vol 2, Issue 1. March 1998, p66-95 Hillburn, Greg (2009). Area Universities Project Loss of 255 Jobs. The News star. Retrieved April 22, 2009 from
http://www.universitybusiness.com/newssummary.aspx?news=yes&postid=18918 Imel, Susan. (1998). Technology and Adult Learning: Current Perspectives. Retrieved December 17, 2008, from
ericdigests.org/1999-2/current.htm James, W. B. and Gardner, D. L. (1995). Learning styles: Implications for distance learning. (ERIC Document Reproduction
Service No. EJ 514 356). Keefe, J.W. (1989). Learning Style Profile Handbook. Accommodating Perceptual, Study and Instructional Preferences. Vol. II.
Reston, VA: National Association of Secondary School Principals. Kelly, Michelle H. (2006). Teach an Old Dog New Tricks: Training Techniques for the Adult Learner. Professional Safety, 51(8),
44. Kemp, J. E., Morrison, G. R., and Ross, S. M. (1998). Designing effective instruction (2nd ed.). Upper Saddle River, NJ. Kolb, D.A. (1985). Experiential Learning Experience as the Source of Learning Development. Englewood Cliffs, NJ: Prentice
Hall. Kostovich, Carol T., Poradzisz, Michele, Wood, Karen and O'Brien, Karen L. (2007). Learning Style Preference and Student
Aptitude for Concept Maps. Journal of Nursing Education, 46(5), 225. Knowles, Malcolm. (1984). The Adult Learner: A Neglected Species (3rd ed.). Houston, TX: Gulf Publishing. Li, Qing , and Edmonds, K. A. (2005). Mathematics and At-Risk Adult Learners: Would Technology Help? Journal of Research
on Technology in Education, 38(2), 143. Mackeracher, D. (2003). Making Sense of Adult Learning. Toronto: University of Toronto Press. Mansfield, Duncan. (February 27, 2009). UT Looks to Raise Tuition, Cut 777 jobs. The Associated Press. McCoy, Mark R. (2006). Teaching style and the application of adult learning principles by police instructors. Policing, 29(1), 77. Merriam, S.B., and Caffarella, R.S. (1991). Learning in Adulthood. San Francisco, CA: Jossey Bass. Merrow, J. (2001). Choosing excellence: ‗Good enough‘ schools are not good enough. Landham, MD: Scarecrow Press. National Center for Education Statistics. (August 6, 1979). News Release: Adult and Continuing Education in Colleges and
Universities. Washington, D.C.: Office of Education, U.S. Department of Health, Education, and Welfare. O‘Conner, Terry. (2008). Retrieved December 17, 2008, from iod.unh.edu/EE/articles/learning-styles.html Orr, Claudia, Allen, David, and Poindexter, Sandra (2001). The effect of individual differences on computer attitudes: An
empirical study. Journal of End User Computing, 13(2), 26. Pope, J. (February 24, 2009). Some colleges offering 3-year bachelor's degrees. USA Today The Associated Press. Retrieved
August 8, 2009 from: http://www.usatoday.com/news/education/2009-02-24-three-year-degrees_N.htm Ruyle, J., and Geiselman, L. A. (1974). Non-traditional Opportunities and Programs. In K. P. Cross, J. R. Valley, and
Associates, Planning Non-traditional Programs: An Analysis of the Issues for Postsecondary Education. San Francisco: Jossey-Bass.
Rybarczyk, Brian J. (2007). Tools of Engagement: Using Case Studies in Synchronous Distance-Learning Environments. Journal of College Science Teaching, 37(1), 31.

A. Finch, E. Rahim and D. N. Burrell IHART - Volume 16 (2011)
57
Sacramento County Office of Education. (2005). What is distance Learning, Retrieved December 17, 2008, from cdlponline.org/index.cfm?fuseaction=whatisandpg=2
Sadowski, M. A., Birchman, J.A. & Harris, L.V., (2006) An Assessment of Graphics Faculty and Student Learning Styles. Engineering Design Graphics Journal. 70, (2).
Smith, M. K. (2002) 'Malcolm Knowles, informal adult education, self-direction and anadragogy', the encyclopedia of informal education, www.infed.org/thinkers/et-knowl.htm.
Sosdian, C. P. (1978). External Degrees: Program and Student Characteristics. Washington, D.C.: National Institute of Education.
Sperling, John. (1989). Against All Odds. Phoenix, AZ: Apollo Press. Steinbach, R. (2000) Successful Lifelong Learning. Menlopark, CA: Crisp Learning. Taylor, Maurice C. (2006). Informal adult learning and everyday literacy practices. Journal of Adolescent and Adult Literacy. 49,
6; Research Library pg. 500 Terris, Ben. (April 10, 2009). Wellesley College cuts 80 non-faculty jobs. The Boston Globe. U.S. Bureau of the Census. (1979). School Enrollment—Social and Economic Characteristics of Students: October 1978.
Current Population Reports, Series P-20, No. 335. Superintendent of Documents, U.S. Government Printing Office, Washington, D.C.
Wynn, S. (2006). Using Standards to Design Differentiated Learning Environments. Boston, MA: Person Custom Publishing. Zapalska, Alina, and Brozik, Dallas. (2007). Learning styles and online education. Campus - Wide Information Systems, 24(1),
6. Zhang, Li-fang (2008). Teachers' Styles of Thinking: An Exploratory Study. The Journal of Psychology, 142(1), 37.
D. N. Burrell, A. Finch, M. E. Dawson Jr. and J. Fisher IHART - Volume 16 (2011)
58
THE USE OF CASE STUDIES, VIDEOS, NEW TEACHING APPROACHES, AND STORYTELLING IN CLASSROOM TEACHING TO IMPROVE THE LEARNING
EXPERIENCES FOR MILLENNIAL GRADUATE STUDENTS
Darrell Norman Burrell1,2,3, Aikyna Finch4, Maurice Eugene Dawson Jr.5,6,7 and Joann Fisher8 1Virginia International University, USA, 2A.T. Still University, USA, 3Marylhurst University, USA,
4Strayer University, USA, 5Alabama A &M University, USA, 6Morgan State University, USA, 7Capella University, USA and 8Nova Southeastern University, USA
ABSTRACT
The invention and active use of PowerPoint in university classroom has transitioned academic teaching from transparencies and overhead projectors into new ages of teaching and learning. The next challenge for professionals has been the appropriate and effective use of PowerPoint and lectures as it relates to working adults when there exists differing schools of thought on if lecturing through 50 to 100 PowerPoint slides is the effective way to engage graduate students. Progressive professors are using new tools that offer stories that provide context, relevance, and handles for knowledge retention for graduate students through the use of case studies, simulations, and videos including Donald Trump‘s the Apprentice. This paper provides contextual examples about how to use real world stories as a means of to engage graduate students, connect with them, and provide opportunities for the practical application of course content.
OVERVIEW
A current trend is for mature students to find their way back to university. This may be in a full time capacity, taking a few years out of work, as a part time student, or even though easier access programs such as the programs offered by the University of Phoenix that offers in line education internationally (Sperling, 2000, Tucker and Sperling, 1996). For adults different approaches are often more effective than what is utilized for the younger students. The reason for the learning is often different for a working adult student. Adult students are there by choice therefore, motivation is not the problem. It has been argued that the best way of ensuring that adults learn in a way that they can apply the knowledge is practicing the skills, rather than simply hearing the theory and writing about them in essay notes(Sperling, 2000, Tucker and Sperling, 1996). It is for these reasons that faculty that can bring rich stories of the corporate real world to the adult classroom. The trainer or the teacher needs to be able to provide this (Taylor et al, 2000). It is accepted knowledge that the level of immersion of a student in a subject will impact on the amount they take in and can apply practically (Sperling, 2000, Tucker and Sperling, 1996. As a rule, education is supposed to teach practices and activities required in the real world. Nevertheless, traditional education is often accused of teaching things in a way that students find it difficult to apply their knowledge to the complex problems of everyday life (Tynjälä et al., 2001). Constructivist learning theories have sought to create learning environments that come closer to real life environments. As a result, constructivist educational methods have long been applied especially in medicine, engineering and architecture. Knowledge in modern constructivist learning theories is seen essentially as a social phenomenon; a social construct. Because the learner builds on his prior knowledge and beliefs as well as on the knowledge and beliefs (and actions) of others, learning needs to be scrutinized in its social, cultural and historical context (Piaget, 1975, 1982; Vygotsky, 1969; Leontjev, 1977; Engeström, 1987; Tynjälä, 1999; Järvinen, 2001). The constructivist approach suits admirably to technology learning, too, because technological knowledge is created rather than discovered. According to Järvinen (2001:40-41), learning about technology or/and through technology supports "naturally" learning by manipulation (e.g. trial and error), comparison and problem solving in a non-prescriptive real-world-like context that leaves room for creative thinking and innovation. Complexity is a persistent characteristic of contemporary life. This is especially true for social systems in which stakeholders both influence and are influenced by the system. Since, complexity is not an objective parameter, it is necessary to inquire into the nature and the peculiarities of complex systems by engaging in classroom activities that are similar to real life or sharing the stories of faculty members with rich stories that can compare and contrast the textbook with the real world. The applied nature of instruction increases the understanding and the ability to transfer the skills and benefits of practice in solving problems by creating a synergy between things learned in the class with things that can be instantly applied at work the next day. The reasons for this ability to develop transferable skills may directly relate to the way in which a course is taught and

D. N. Burrell, A. Finch, M. E. Dawson Jr. and J. Fisher IHART - Volume 16 (2011)
59
how professionals use their stories enhance the classroom learning experience. The practical teaching and classroom storytelling allows different types of student to learn as well as make use of the four main factors that dictate the conditions for successful learning; inclusion, safety, involvement, and community (Strange et al, 2000). When these conditions are met there is also an additional factor that can be taken into consideration with the more mature students. Mature students come into the classroom with a greater degree of experience of life and may have already faced situation that they may find relevant, direct or indirect, with the lessons they are learning. These may include interpersonal skill and the ability to develop leadership skills in a safe environment. This will draw on past experience, possibly increasing the insight with which past experiences are seen, the learning may then be retrospective as well as current when the lessons take place (Wray et al, 1995). Since, organizational change is the dominant characteristic of most facets of today's business world, students need an appropriate educational means to cope with it. This knowledge can be gained through the benefit of stories from faculty with extensive real world work experience. Wals and Jickling (2002) stress the critical role of institutions of higher education in cultivating diversity of thought within processes of solving complex real-world problems such as sustainable development. For this to occur effectively university teaching approaches should emphasize using the experiences and stories of faculty members that equip students with knowledge with strong real-world implications over analyzing systems from a more or less theoretical and distanced point of view. This puts a greater emphasis on combining practical experience with educational instruction (Scholz et al. 2002). Moreover, group (as opposed to individual) problem-solving capabilities become increasingly important in order to provide the required competences needed to work on complex real-world problems and the stories of both faculty members and students with extensive work experience can provide a platform for critical knowledge exchange between faculty, students, and classmates. If we look at the way people learn, and variety of different methods should be used to cope with the different learning styles. There is a model of different type of learning style, it is interesting that with all of these the practical experience will add value to the lessons; these are also applicable to all ages and cultures. In the 1950‘s Steven Corey‘s under took "action research", it was this research that has formed the basis of the Learning Style Inventory (Corey, 1954, quoted in Bell, 1998). He divided the students into three groups of learning styles; visual, auditory and tactile. The research went on to assess the final result of the different types of students, there was a significant difference, and visual learners gained the highest grades than both tactile and auditory. The lesson to be gained from this research must be there will be a split of the different types of pupil in a class of numbers. This means that nature of organizational stories and how faculty and students share them can appeal to a variety of learning styles. In creating the visual stimulus exercises such as group presentations and pieces of work where there is a need for input that creates a sight, alternatively exercises in observation, such as watching a video and analyzing the events and the actions of those in the video. All of these may be seen as increasing the learning experience and the transferability for the skills. Consider the way that many business schools are teaching with the use of case studies that allow for practical application in the classroom. Business school case studies are essentially rich stories that are developed from real world events, actions, experiences, and activities. Progressive university programs for working professional students are offering tailored, goal-oriented curricula that are driven by the experiences and the stories of the experiences that both students and faculty bring into the classroom. Ideally, they allow working professional students to harness the best work experience stories, which can enhance theoretical textbook models (Tucker and Sperling, 1996). Auditory pupils need a different type of stimulation, although this does not mean they will not benefit from the visual stimuli as well. Discussions and verbal reinforcement of point made will be of benefit here; group activities and again the reading of assignments aloud will also help the learning process (Vincent & Ross, 1996 quoted in Bell, 1998). In terms of practical development there is the ability to use scenario planning, simulation situations, such as face-to-face interviews or another circumstances where listening is the key. Therefore the practical ability here may be seen as being gained from some of the same methods as the visual learners. The application of this can be seen in the way it is applied to all of their levels. Not only in the organizational setting (Wray et al, 1995). Tactile learners also know as kinesthetic learners, these are the doers of society, they learn with hands on activities (Kanar, 1995 quoted in Bell, 1998) This aspect tactile learning will be the hardest need to fulfill in a verbal based tradition of lecture. Group work will be of great benefit, as will collaboration on assignments if suitable to the subject and allows students a forum or a means to mutually share their professional and organizational stories and experiences (Tucker and Sperling, 1996). A practical example of the use of this would be the brining in of external items, for example in a marketing class the actual good to be analyzed or even practical experience where there is a need to touch and do, rather than just listen ad say.

The Use of Case Studies, Videos, New Teaching Approaches, and Storytelling in Classroom Teaching to Improve the Learning Experiences for Millennial Graduate Students
60
Therefore if a variety of methods are used the benefit can be gained by all students, whilst concurrently there is assurance that the lesson is not becoming boring or tedious to the students, and where interest levels remain high the interest level is often reflected in the acquisition of transferrable skills that allow students to learn from the stories and experiences of others and their organizations (Tucker and Sperling, 1996). The value of transferable skills developed from experiential stories gained from life and work experiences. The practical application of knowledge and the stories of the successes and failure of strategy and approach add richness to the nature of learning. The effect is a compounding enhancement in the way information is retained and shared in the classroom (Simonite, 1997). Therefore, when a working adult student or faculty member with professional work experiences enters the classroom their stories are assimilated into the learning community. The use of these stories not only increases skills, but also increases awareness on the part of students. This is a different way of teaching, but it is valid. There is the need to transfer knowledge, but in adapting the practical application to the course there is the same theory of doing and learning used for all levels of employment entrance and attainment (Greenan, 1997). The practical here does not always have to be simulated. For example, in a business studies course, the case studies and stories used will be real and become tools that can transfer knowledge. Where the case studies and storytelling take place in a classroom group there is also the additional ability to create the community as well as develop peer interaction that is not available to the same extent in individual study (Strange et al, 2000). Early and traditional teaching methods were developed from a framework that was solely theoretical and textbook driven with a focus on singular skills in a narrow stovepipe fashion that were narrow in only engaged in a singular discipline. Therefore learning singular skills and specialized knowledge was the key to a good degree (Tomlin, 1997). However, as the employment environment has changed become more complex, diverse, global, and technologically advanced it are not only the knowledge that is important, but also the ability to apply knowledge and become adaptable across a variety of skills? Whereas MBA students can arguably benefit as much from understanding the origins and theoretical frameworks of management science and organizational behavior, they also must recognize that employers are going to hire them to apply knowledge and problem solving activities not exposure theoretical theories in their work environments. Schools that understand the value of real world management experience look to hire faculty that have one foot in academia and the other foot in a real world corporate leadership position (Tucker and Sperling, 1996). The idea of university has been seen as developing the intellect. Therefore if we are to assume that the increased development of intelligence is the key value of a university education, teaching methods must also include developing problem-solving skills that will allow professionals to adapt to the changing nature of real organizational problems (Sternberg & Wagner, 1995 quoted in Shepard et al 1999).
REFERENCES
Engeström, Y. (1987), Learning by Expanding. Orienta-Konsultit Oy, Helsinki. Greenan Kate; Humphreys Paul; McIlveen Heather. (1997, June), Developing work-based transferable skills for mature
students. Journal of Further and Higher Education, v21 n2 p193 (12) Kanet, J.J. and Barut, M. (2003), "Problem-Based Learning for Production and Operations Management". Decision Sciences. A
Journal of Innovative Education. Volume 1, Number 1, Spring 2003, pp. 99-114. Piaget, J. (1982), The Essential Piaget. Routledge, Kegan & Paul, London. Rosson M. and Carroll J., Rodi C. (2004), "Case Studies for Teaching Usability Engineering," in the Proceedings of the 35th
SIGCSE Technical Symposium on Computer Science Education, Norfolk, Virginia, USA, 2004, pp. 36-40 Scholz, R.W. and Tietje, O. (2002), Embedded Case Study Methods, Integrating Quantitative and Qualitative Knowledge,
Sage, London. Simonite Vanessa. (1997, June), Academic achievement of mature students on a modular degree course. Journal of Further
and Higher Education, v21 n2 p241(9) Sperling John G. (2000), Rebel With a Cause: The Entrepreneur Who Created the University of Phoenix and the For-Profit
Revolution in Higher Education, John Wiley & Sons Strange C. Carney, Banning James Delworth H., Ursula, (2000), Educating by Design: Creating Campus Learning
Environments That Work, Jossey-Bass Taylor Kathleen, Marienau Catherine, Fiddler Morris (2000), Developing Adult Learners: Strategies for Teachers and Trainers,
Jossey-Bass Tomlin Michael E. (1997, May-August), Changing what and how we teach for a changing world. Adult Learning, v8 n5-6 p19(3)

D. N. Burrell, A. Finch, M. E. Dawson Jr. and J. Fisher IHART - Volume 16 (2011)
61
Tucker Robert W. Sperling John G. (1996), For-Profit Higher Education: Developing a World-Class Workforce, Transaction Pub.
Tynjälä, P. and L. Helle, K. Lonka, M. Murtonen, J. Mäkinen, Olkinuora, E. (2001), "A University Studies Perspectives into the Development of Professional Expertise," in Pantzar, E. and R. Savolainen, P. Tynjala (eds.), In Search for a Human-Centred Information Society. Tampere University Press, Tampere, pp. 143-170.
Wals, A. and Jickling, B. (2002), "'Sustainability' in higher education - from doublethink and newspeak to critical thinking and meaningful learning", International Journal of Sustainability in Higher Education, Vol. 3 No. 3, pp. 221-32.
Wray Ralph D. Luft Roger L. Highland Patrick J. (1995), Fundamentals of Human Relations: Applications for Life and Work, South-Western Thomson Learning
N. Faulk IHART - Volume 16 (2011)
62
PERCEPTIONS OF ARIZONA AND NEW MEXICO PUBLIC SCHOOL SUPERINTENDENTS REGARDING ONLINE TEACHER EDUCATION COURSES
Neil Faulk
McNeese State University, USA
ABSTRACT
This study examined Arizona and New Mexico public school superintendents perceptions of online teacher education. Of primary concern were superintendents beliefs and opinions of online education as it exists today. Data for the study were collected through the use of a survey questionnaire. The survey consisted of nine items where participants were asked to respond to questions placed in a Likert scale format and one open-ended question asking participants for suggestions or comments regarding online teacher education as it exists today. The researcher used regular and electronic mail to survey one-hundred superintendents within the two states. A random sample of seventy-three superintendents was chosen from a population of two-hundred thirty nine superintendents within the state of Arizona. A random sample of twenty seven superintendents was chosen from a population of eighty nine superintendents within the state of New Mexico. Both samples represented thirty percent of the superintendents within the two states respectively. The response rate for the two states was forty percent. Forty surveys were returned from a total of one hundred that were sent to the respective district superintendents within both states. The Arizona return rate was forty-two percent with thirty-one of the seventy-three superintendents returning the surveys. The New Mexico return rate was thirty three percent with nine of the twenty-seven surveys being returned. The researcher waited five weeks for surveys to be returned and also contacted superintendents via electronic mail in order to encourage participation and cooperation. The results of the study within the two southwestern states of Arizona and New Mexico were very similar to results found in five other states. It appears that superintendents do not have full confidence that online courses and programs will adequately prepare future teachers for the demanding job tasks that teaching in the schools now presents. Superintendents did not believe that teachers would be prepared for the necessary people skills of classroom management and social aspects of teaching that are now required. Superintendents did feel that online teacher education had some utility if combined with face to face real instruction where best practices of teaching could be learned through modeling and social interaction. Several administrators noted that online courses should involve a real teacher performing the act of teaching so aspiring teachers could actually view a real successful skilled teacher rather than just do assignments sent via electronic means. Superintendents appeared to be willing to use the electronic technology but still did not appear to have total confidence in the online format as it exists today. More research needs to be done as the technology quickly evolves. It appears that university administrators are promoting the online format without having consulted the consumers of the product.
INTRODUCTION
Recent years have witnessed a tremendous growth throughout the country involving online education at all levels. The colleges and universities have also been a part of this massive recent trend. University deans and vice presidents are demanding that many courses and programs be offered through the electronic medium of the computer and the internet. Some of this demand has apparently been due to budget shortfalls and economic considerations. Eastman and Swift (2001) noted that almost all universities were attempting to develop online programs and courses as quickly as possible. Money was noted as being the prime motivation behind this pattern. Santilli & Beck (2005) also noted that universities were rapidly expanding online courses and programs. The interesting point concerning this rapid expansion is that little if any empirical research has been completed regarding the effects of teaching through the electronic medium versus the traditional medium of face to face. No doubt there are many that do not feel that the online methodology is superior to the traditional methodology. University administrators have apparently turned a blind eye and not even attempted to pursue research comparing or investigating the two different methodologies. Fields of study such as teacher education have always relied on a strong face to face traditional teaching model since modeling and personal interaction were major objectives within most teacher education programs. Despite this traditional emphasis on modeling of best practices the university administrators have simply plowed straight ahead and expanded online teacher education as rapid as possible. This study attempts to add to the sparse body of knowledge concerning the effects of online teacher education upon the field of teaching. The consumers of the product have not been consulted regarding the preparation or the end results of the product. This topic must be investigated and reported on since our public schools are such an integral part of our educational system. The manner in which teachers are prepared should be of paramount importance and not just left to whatever is financially advantageous to the universities and colleges.
N. Faulk IHART - Volume 16 (2011)
63
LITERATURE REVIEW
It is rather difficult task to write a literature review on this topic due to the fact that there is little if any research despite the rapid expansion of the new online electronic methodology of teaching future teachers. Perhaps there have been only three empirical studies specifically detailing perceptions of public school personnel regarding the effects of online teacher education upon the future teachers. In 2007 Huss surveyed principals in the three different states of Kentucky, Ohio, and Virginia regarding online teacher education and its effects upon public education. The principals of these three states strongly disfavored the use of online teacher education. Ninety nine percent of the principals surveyed preferred to not hire those teachers prepared through the online electronic medium. Principals simply did not believe that online courses would prepare teachers for the human interaction skills needed to teach in the public schools of our society. There were major concerns that online prepared teachers would not be able to cope with and teach the youth of today since there was little real human interaction sitting at a computer within the comfort zone of one's home. Huss also noted that there was little if any empirical research pertaining to this important topic. Another study was conducted by Faulk in 2010. This study surveyed the principals and superintendents within the state of Louisiana. Faulk concluded that approximately ninety percent of the principals and superintendents had moderate to strong reservations regarding the hiring of online prepared teachers. Once again the major weakness of online prepared teachers according to the Louisiana public school administrators would be human interaction skills and the all important skills of classroom management and discipline. A large majority of the Louisiana administrators simply had no faith in the online methodology in terms of preparing future teachers for the real world classrooms and real live students that they would later face. Some principals questioned the initiative of teacher candidates that could not simply drive to a nearby university since a large majority of the population of Louisiana resides within fifteen miles of a university. Louisiana administrators did feel that online teacher education would be possible in terms of preparing future teachers in areas of learning theories and principles. It must still be mentioned that nearly ninety percent had moderate to strong reservations in hiring online prepared teachers unless there was no other option. It appears that Louisiana public school administrators believe that teaching and managing children would more likely be learned in a real classroom setting rather than sitting in front of a computer. In 2011 Faulk continued to study perceptions of school administrators regarding online teacher education. Texas superintendents were surveyed regarding this important topic. The results of the Texas study were very similar to the Louisiana study. Over seventy percent of the superintendents surveyed had strong to moderate reservations regarding the hiring of online prepared teachers. People skills, classroom management skills , and speaking/ presenting skills were mentioned as being weak in terms of online teacher preparation. Texas superintendents did agree with Louisiana administrators in that the area of learning theories could possibly be learned online. Texas superintendents as a whole did not feel that online prepared teachers would endure the classrooms and challenges that teachers now face in our schools. The Texas superintendents were open-minded and in agreement with the Louisiana administrators in that they felt that online preparation had some use even though it was limited. Both Louisiana and Texas superintendents by a slight majority felt that the online format was useful in teaching the future teachers the necessary learning theories and principles. Several Texas superintendents noted that this topic needed to be addressed and brought forth into the light since so many universities had ignored or refused to do research and simply expanded programs without real intellectual discussion and/or empiricism. Several superintendents also noted that universities should require more real classroom setting experience to be combined with the online courses so that future teachers would not be shocked once entering the reality that our schools present. There also appeared to be some disappointment within the superintendent profession that a person could become fully certified simply by staying home and completing assignments on the computer. Several superintendents simply stated that some online courses and programs would not add to the professional ambiance that teaching should carry and be associated with. Despite the prior mentioned results and conclusions it still appears that university administrators simply cannot satisfy their appetite for more and more online courses at all levels of higher education. This is a very hypocritical stance since research has revealed that higher education administrators do not perceive that online courses are comparable to the traditional face to face courses. Guyton(2009) surveyed university deans and vice presidents within the nation and found that one-hundred percent of the administrators perceived that the face to face traditional courses were superior in terms of learning and achievement. Guyton also noted that these same university administrators were doing all they could to grow and expand the online courses and programs. It is rather apparent that the administrators have not read the sparse but important literature on this topic. Gallagher and Poroy (2005) had found that university students throughout the nation had also felt that the online format was not superior to the traditional format. Despite some research refuting the superiority of online courses it appears the avalanche of online courses and programs will continue. It is imperative that more empirical research be conducted to shine more light on this new methodology so that it can either be discontinued or simply improved. This would be what would happen in any other field. Before a new drug, technique or process is adopted in other fields there is a call and a need for research and discussion. The field of education should be an example of this empiricism and intellectual discussion rather than just another
Perceptions of Arizona and New Mexico Public School Superintendents Regarding Online Teacher Education Courses
64
money drawing tool for universities at the cost of professionalism. Our students in the public schools need teachers who are really prepared and not just money sources for administrative purposes.
METHODS
Selection of a Population
This research project involved public school superintendents within the states of Arizona and New Mexico. One-hundred superintendents were surveyed from the two states. A computer generated table of random numbers was used to randomly select thirty percent of the superintendents within each state. Seventy three superintendents from Arizona and twenty seven superintendent represented thirty percent from each state respectively. Thirty one of the seventy three superintendents responded from Arizona which represented a forty two percent response rate. Nine of the twenty seven principals from New Mexico responded which represented a thirty three percent response rate from New Mexico. Department of Education websites from both states were used to locate and identify the superintendents. The one hundred superintendents were contacted by regular mail with the surveys. A self addressed stamped envelope was included within the packet containing the surveys. Superintendents were also contacted via electronic mail in an attempt to encourage them to complete the survey and return it in a timely manner. The researcher waited five weeks after the initial mailing of survey packets until data was compiled and tabulated.
Data- Gathering Instrument
The researcher developed a survey questionnaire that attempted to determine administrator perceptions of online teacher education. Validation of the instrument involved three phases. Twenty university catalogues were used to determine course offerings that were common to all degree programs within Curriculum and Instruction and/or Teacher Education programs. It was determined that the areas of teacher methodology/pedagogy, diversity and special needs, learning theories/principles, and classroom behavior management were the most common course themes within all of the university catalogues. Two university professors having experience with online teacher instruction and one former public school administrator served as a panel that were consulted regarding the questions that were placed on the survey. The professors and the administrator agreed upon specific questions that were based from the common areas of most teacher education programs. The panel did point out that the survey should define online teacher education so that respondents could adequately identify the construct and thus give accurate responses to the questions. The third phase involved consulting with two university English professors so that the wording of the questions was correct and unbiased. Only slight changes were made. Reliability of the instrument was measured by the test-retest method. Nine recently retired principals and two professors of educational administration were surveyed twice within a two week lapse between the first and second administration. Pearson correlation coefficient was used on the two sets of data. The results of the statistical procedure revealed a statistic of .94 in temporal stability. Internal consistency of the instrument was not an issue since the questions had been derived from common courses within degree plans of twenty universities. The survey had nine questions that asked the respondents to respond to a Likert scale format and one question that asked respondents to make open-ended suggestions or comments regarding online teacher education.
RESULTS
The major purpose of this study was to determine administrator perceptions of online teacher education. Nine Likert scale questions and one open-ended question were asked within a survey questionnaire in an attempt to determine perceptions of online teacher education. Forty of the one hundred superintendents responded to the survey which represented a forty percent response rate. The first question of the survey was stated: What is your opinion of online teacher education/preparation. Sixty percent of the superintendents responded by answering very unacceptable or slightly unacceptable to this question. SLIGHTLY NEGATIVE . The second question of the survey was stated: What is your opinion of online teacher education in terms of preparing future teachers in classroom management? Sixty-eight percent of the superintendents responded by answering very unacceptable or slightly unacceptable to this question. STRONGLY NEGATIVE The third question of the survey was stated: What is your opinion of online teacher education in terms of preparing future teachers in methodology/pedagogy of teaching? Sixty percent of the superintendents responded by answering highly desirable or desirable to this question. SLIGHTLY POSITIVE

N. Faulk IHART - Volume 16 (2011)
65
The fourth question of the survey was stated: What is your opinion of online teacher education in terms of preparing future teachers for student diversity and special needs? Sixty-three percent of the superintendents responded by answering very unacceptable or slightly unacceptable to this question. MODERATELY NEGATIVE The fifth question of the survey was stated: What is your opinion of online teacher education in terms of preparing future teachers in learning theories and principles? Sixty-three percent of the superintendents responded by answering highly desirable or desirable to this question. MODERATELY POSITIVE The sixth question of the survey was stated: What is your opinion of online teacher education in terms of preparing future teachers for the social aspects of teaching? Seventy percent of the superintendents responded by answering very unacceptable or slightly unacceptable to this question. STRONGLY NEGATIVE The seventh question of the survey was stated: Would you have any reservations in hiring future teachers within your district/school that have been trained primarily using online teacher education? Seventy-five percent of the superintendents responded by answering strong to moderate reservations to this question. STRONGLY NEGATIVE The eighth question of the survey was stated: What is your perception of the academic security and academic integrity of online teacher education courses currently offered? Twenty five percent of the superintendents responded by answering High levels of security exist. Fifty-eight percent of the superintendents responded by answering that Slight to Moderate levels of security existed. Seventeen percent of the superintendents responded by answering that Little to No levels of security existed. SLIGHTLY POSITIVE The ninth question of the survey was stated: What is your present level of knowledge concerning the use of online teacher education? Ninety five percent of superintendents responded by answering high to moderate knowledge. Five percent of superintendents responded by answering little level of knowledge present. STRONGLY POSITIVE The final part of the survey asked the administrators for any suggestions or comments regarding the use of online teacher education. A large majority of the comments or suggestions were negative regarding online teacher education. Below are some of the actual comments and suggestions made by principals and superintendents.
Comments/Suggestions
You cannot expect a teacher to be competent if they did not interact in a class with students.
Field experiences are vital to teacher training.
Nothing beats practical experience . We learn by doing.
Online is convenient but face to face social aspects are still critical.
Thank you for bringing light to this issue. More thought needs to go into this online teaching.
There should be a balance between online and traditional face to face.
The key is to have the ability to see examples of teaching, ask questions and get some hands on training.
I am not in favor of removing the first hand personal contact between instructor and student.
Teacher training requires more time in the classroom and more face to face interaction and more feedback than is present in most teacher prep programs.
We are progressive tech wise but lots of quick credits are a long way from quality.
Teachers need more on the job training and more student teaching. Modeling of good teaching is what is needed. Cannot see how that would be done other than in a real classroom.
CONCLUSIONS
It should be rather apparent to even the casual observer of this research that school administrators are not confident that online prepared teachers will be able to handle all of the different tasks that teaching in today's schools requires. School administrators do not feel that online prepared teachers are ready and prepared for the all important teaching tasks of classroom management and the social aspects of teaching in the public schools. If teachers cannot handle the classroom management and social aspects demanded of them then there is no possible way to succeed as a teacher today. The schools of today are much different than schools of yesteryear in the 1950s. So much of the task of teaching is simply to capture the attention of the students and to keep the attention of the students within a world of ever increasing information accessibility. The teacher of today must be able to do this yet still obtain and maintain a respectful orderly classroom environment. So much of the job of the teacher is not just giving information but having and using the people skills to manage human behavior. These

Perceptions of Arizona and New Mexico Public School Superintendents Regarding Online Teacher Education Courses
66
skills can simply not be learned by sitting at a computer .These people management skills can only be learned through observation of professors , interaction with peers in a real classroom setting and then eventually practiced and reflected upon by the learning teacher himself. One simply learns to deal with people by dealing with people. Reading and doing assignments sitting at a computer can be quite an intellectual experience but will not prepare future teachers for the people and social skills necessary to survive and succeed. This research noted that a large majority of the superintendents simply did not want to hire those individuals having trained primarily online. One may still pose an argument that online learning in terms of teacher education is the future. If we do indeed respect our most professional public school personnel and the vast experience they have it seems imperative that we be very cautious with this rapid expansion of online teacher education. Perhaps university administrators should take note that the consumers of the product and the evaluators of the product are not enthusiastic concerning how the product is being prepared. The results of this study agree with studies done within five other states. Time after time it appears that school administrators are not confident that online teacher education will fully prepare future teachers in the most critical aspect of teaching. It is recommended that further research be conducted within other states. It is also recommended that some type of longitudinal studies be done to determine the durability of online prepared teachers versus traditional prepared teachers. It may also be of interest to determine if students actually achieve and learn when taught by online prepared teachers as compared to the traditionally prepared teachers. There would be many variables to consider and attempt to control in these types of research studies. Nevertheless, it appears that public school administrators prefer to not hire those trained primarily online. This presents two problems for the online trained teacher--perhaps he is not prepared and no doubt the people doing the hiring would prefer not to hire him.
REFERENCES
Eastman, J., & Swift, C. (2001). New horizons in distance education: The online leaner-centered marketing class. Journal of Marketing Education, 23(1), 25-34.
Faulk, N. (2010). Online teacher education--what are the results. Contemporary Issues in Education Research, 11(3), 21-29. Faulk, N. (2011). Perceptions of Texas public school superintendents regarding online teacher education. Journal of College
Teaching and Learning, 8(5), 25-30. Gallagher, S., & Poroy, B. (2005). Assessing consumer attitudes towards online education. Boston, MA: Eduventures. Gayton, J. (2009). Analyzing online education through the lens of institutional theory and practice: The need for research based
and validated framework for planning, designing, delivering, and assessing online instruction. Delta Pi Epsilon Journal, 51(2), 62-75.
Huss, J. (2007). Attitudes of middle grade principals toward online teacher preparation programs in middle grades education: Are administrators pushing "delete"? Research in Middle Level Education, 30(7), 1-12.
Santilli, S., & Beck, V. (2005). Graduate faculty perceptions of online teaching. Quarterly Review of Distance Education, 6(2), 155-160.
C. Fairchild IHART - Volume 16 (2011)
67
THE CROSS-CULTURAL EFFECTS OF RESCALING VERBAL AND NUMERIC RATING SCALES USING CORRESPONDENCE ANALYSIS
Chris Fairchild
Nova Southeastern University, USA
ABSTRACT
This research-in-progress is focused on the cross-cultural effects of rescaling ordinal data to interval data using correspondence analysis. It has been in common in research to assume that data collected using rating scales is interval in nature, allowing for the calculation of means and standard deviations. Unfortunately, that assumption may not be a fair one. Rescaling the data using correspondence analysis is one option to ensure that the use of means and standard deviations is acceptable. This is especially important in cross-cultural research where response bias is often corrected for using standardization procedures. These standardization procedures use means and standard deviations; thus, interval level data is a requirement. This research will be completed using previously collected data from call centers located in five different countries. The data was collected using both verbal and numeric rating scales to measure the impact of stress in call centers. Positioning and patterning effects will be analyzed using the traditional standardization methods. They will also be analyzed using the proposed chi-squared analysis and correspondence analysis method. Comparisons of the two methods will be made in order to establish if differences exist with the use of verbal scales or numeric scales. Finally, the consequences of these differences in multicultural differences in scale usage, if any, will be investigated. Keywords: Correspondence Analysis, Cross-cultural Research, Rating Scales, Rescaling, Response Bias.
INTRODUCTION
Multiple disciplines of academic research embrace the use of rating scales (Bendixen & Sandler, 1995; Göb, McCollin, & Ramalhoto, 2007; Stacey, 2005). Extremely common in social science and marketing literature, these scales were designed to measure individuals‘ attitudes (Bendixen, 1996; Göb, et al., 2007; Jamieson, 2004) towards such items as quality (Allen & Seaman, 2007) or preference (Göb, et al., 2007). Ratings scales have also been used to measure levels or impact of stress (Callahan & Sashin, 1990). Whereas there is nothing inherently wrong with the use of these rating scales, the statistical methods applied to the data collected in this manner have been called into question as a result of the paper by Stevens (1946). Stevens (1946) published an article related to scales and measurement. In this work he discussed the four scales of measurement: nominal, ordinal, interval, and ratio. He also listed the permissible ―statistical manipulations‖ for each scale (p. 677). Stevens‘ (1946) research, especially as it related to the ordinal and interval scales of measurement and the appropriate statistical methods for those levels of data, sparked great debate in the academic community. Many scholars agreed with Stevens (1946) and readily applied his suggestions, but many other scholars questioned the appropriateness of both the definitions and the prescribed statistical methods. Despite Stevens‘ (1946) guidance that many statistical methods are not proper for ordinal level data, researchers have, and continue to, apply methods that ―imply a knowledge of something more than the relative rank-order of data‖ (p. 679) without even so much as a note mentioned about this research decision and its possible effects that could range from unintentionally misleading to intentional misrepresentation (Allen & Seaman, 2007; Bendixen & Sandler, 1995; Göb, et al., 2007; Harwell & Gatti, 2001; Jamieson, 2004; Winship & Mare, 1984). It would seem that researchers who have elected to use analytical methods suited to interval or ratio level data on ordinal data often defend their methodology by quoting Stevens (1946) when he reported that calculating means and standard deviations for ordinal level data was inappropriate except that ―on the other hand, for this ‗illegal‘ statisticizing there can be invoked a kind of pragmatic sanction: In numerous instances it leads to fruitful results‖ (p. 679). Unfortunately, this quotation reports only part of Stevens‘ (1946) comment on the matter. The remainder of the quotation is as follows:
While the outlawing of this procedure would probably serve no good purpose, it is proper to point out that means and standard deviations computed on an ordinal scale are in error to the extent that the successive intervals on the scale are unequal in size. When only the rank-order of data is known, we should proceed cautiously with our statistics, and especially with the conclusions we draw from them. (p. 679)
The Cross-Cultural Effects of Rescaling Verbal and Numeric Rating Scales Using Correspondence Analysis
68
Therefore, it would seem that despite the fact that this practice ―leads to fruitful results‖ (p. 679), researchers need to be careful with the conclusions based on ordinal level data that was analyzed with statistical methods that require interval data.
In an effort to avoid the debate regarding what methods of analysis may be used with ordinal scale data, researchers have two options: apply only the statistical methods appropriate to ordinal level data (Allen & Seaman, 2007; Göb, et al., 2007; Jamieson, 2004; Kim, 1975; Knapp, 1990; Stevens, 1946; Winship & Mare, 1984) or rescale their data to the interval level which would allow them to apply the methods proper for that level of data (Bendixen, 1996; Bendixen & Sandler, 1995; Bendixen & Yurova, 2011; Harwell & Gatti, 2001; Stacey, 2005). As a result of the common practice of collecting ordinal data with plans to use interval level statistical methods like means or standard deviations, rescaling ordinal data to interval level data may be necessary so that the desired statistical methods may be safely applied and key conclusions can be reached.
Pancultural, intracultural, and cross-cultural analyses using rating scales to aid in the discovery of emic dimensions as well as ratings scales used in individual analysis aimed at the discovery of etic dimensions may be greatly impacted by this issue (Leung & Bond, 1989). In particular, the methods to address response bias and the procedure to transform data to the individual level are affected. It is common practice to standardize data within-subject and within-culture using means and standard deviations (Fischer, 2004; Hanges, 2004; Hanges & Dickson, 2004; Leung & Bond, 1989; Triandis, 1994). Applying the strictest definition by Stevens (1946), the standardization process would require interval data. Unfortunately, the standardization procedures tacitly assume the need for interval level data and many researchers seem to ignore this requirement.
A number of researchers have proposed methods for rescaling ordinal level data to interval level data (Bendixen, 1996; Bendixen & Sandler, 1995; Bendixen & Yurova, 2011; Dawes, 2008; Harwell & Gatti, 2001; Stacey, 2005). Unfortunately, some of them have fallen short of ideal for one reason or another. Young, Takane, and de Leeuw (1978) offered their proposed method for rescaling using ―PRINCIPALS (principal components analysis by alternating least squares)‖ (p. 280). Unfortunately, this method is quite complex and best completed using specialized computer software. Guttman (1941) rescaled using dual (or optimal) scaling. Hill (1973) reported rescaling attempts through reciprocal averaging. Greenacre (1984, 2007) was able to demonstrate that both dual scaling and reciprocal averaging are essentially the same as using just the first principal axis of correspondence analysis.
Bendixen and Sandler (1995) furthered the research of Greenacre (1984). Their research demonstrated rescaling using correspondence analysis in two dimensions. They also showed how to use chi-squared trees analysis (Bendixen, 1995; Bendixen & Sandler, 1995; Bendixen & Yurova, 2011; Greenacre, 1988; Hirotsu, 1983) to combine similar values and bootstrapping to test the model. Lee and Soutar (2010) highlighted the value of this method in its simplicity. Additional attempts at rescaling include the work of Stacey (2005), which seems best suited for normally distributed data, and Dawes (2008), which may be too simplistic in its approach.
Correspondence analysis as employed in Bendixen and Sandler (1995), Bendixen and Yurova (2011), and Lee and Soutar (2010) seems to be the simplest method of rescaling that is widely applicable. It also seems to have helped the researchers find some interesting results, conclusions, and opportunities for future research. Heimerl (as cited in Bendixen & Sandler, 1995) concluded ―that different rescaling applied to urban black and urban white respondents‖ (p. 43). Similarly, Lee & Soutar (2010) found that values reported between different countries resulted in different rescaling. Dawes (2008), although using a different form of rescaling, determined that respondents used scales with different numbers of response categories differently. Accordingly, an opportunity exists to research how different cultures use the same scales and what, if any, the consequences are. Therefore, the purpose of this research is to explore the differences in and consequences of how respondents from different countries use the same scales over the same scale items.
BACKGROUND
A thorough review of the existing literature is a requirement of this study. Specifically, literature related to cross-cultural research, response bias, and standardization will need to be reviewed and synthesized. Then, rescaling, correspondence analysis, and the delta chi-square procedure will be highlighted. These topics represent the key concepts and tools that will be utilized in completing this research. Finally, the research questions will be presented.
Multicultural Research
The volume of multicultural research continues to grow (van de Vijver & Leung, 1997). As a result, many different areas of multicultural research are being undertaken. Two key factors that must be addressed in multicultural research are the level of analysis and data equivalence. Multicultural research is broken down into four levels of analysis: pancultural, intracultural,

C. Fairchild IHART - Volume 16 (2011)
69
cross-cultural, and individual (Leung & Bond, 1989). The level of analysis constrains what type of dimensions may be discovered, emic or etic. True cross-cultural research works with emic dimensions. Despite the fact that pancultural analysis addresses all respondents regardless of culture, it is not a proper level of analysis for determining etic dimensions based on individuals. In fact, Leung and Bond (1989) demonstrated that pancultural analysis may provide ―a conservative substitute‖ for cross-cultural analysis when sample size is an issue (p. 143). Only individual level analysis is suitable for determining etic dimensions based on individuals. Another issue of particular concern in multicultural research is the issue of data equivalence (Fischer, 2004; Hult et al., 2008; Mullen, 1995; Myers, Calatone, Page, & Taylor, 2000; Salzberger & Sinkovics, 1999, 2006; Triandis, 1994; van de Vijver & Leung, 1997). ―Data equivalence refers to the extent to which the elements of a research design have the same meaning, and can be applied in the same way, in different cultural contexts‖ (Hult, et al., 2008, p. 1027). The threat to equivalence is bias, which comes in many forms, and it is essential to address equivalence and bias issues prior to reaching conclusions in cross-cultural research (Fischer, 2004; van de Vijver & Leung, 1997).
Response Bias
Scalar equivalence is concerned with how ratings scales are actually used and if the scores provided are actually the true scores (Hui & Triandis, 1985; Hult, et al., 2008; Mullen, 1995; Myers, et al., 2000). The absence of scalar equivalence can be a result of response bias, which is often based on cultural factors (Fischer, 2004; Hanges, 2004; Hui & Triandis, 1985; Hult, et al., 2008; Leung, 1989; Mullen, 1995; Myers, et al., 2000; Sekaran, 1983; Steenkamp & Baumgartner, 1998; Triandis, 1994; van de Vijver & Leung, 1997). It has been demonstrated through research that certain respondents are more apt to use the extreme ends of rating scales, while others seem to prefer the middle values of ratings scales (Baumgartner & Steenkamp, 2001; Fischer, 2004; Hanges, 2004; Hult, et al., 2008; Leung, 1989; Leung & Bond, 1989; Mullen, 1995; Myers, et al., 2000; Triandis, 1994; van de Vijver & Leung, 1997). Still other cultures retain a focus on one end of the rating scale (Fischer, 2004) or respond in a way that may be socially desirable (Baumgartner & Steenkamp, 2001; Hult, et al., 2008; Mullen, 1995; Myers, et al., 2000; Sekaran, 1983; Triandis, 1994; van de Vijver & Leung, 1997). Response bias is reflected through the effects that culture has on the use of rating scales: positioning and patterning (Leung & Bond, 1989). The impact of this response bias significantly increases the difficulty of reaching conclusions based on true scores to rating scales. Researchers continue to develop methods to address the problem of response bias so that cultures can be truly compared (Fischer, 2004; Triandis, 1994; van de Vijver & Leung, 1997). In fact, van de Vijver and Leung (1997) stated that ―procedures to detect and overcome these types of bias are so varied that they cannot be adequately discussed in a single chapter‖ (p. 10). They devoted portions of three chapters to the highlighting of some techniques for detecting and overcoming various biases, including response bias.
Standardization
This research is concerned with methods for overcoming response bias. One of the most common methods is standardization or ipsatization (Bond, 1988; Fischer, 2004; Hanges, 2004; Hanges & Dickson, 2004; Leung & Bond, 1989; Triandis, 1994). Triandis (1994) suggested that z-scores can help adjust subject scores if the survey instrument is large and heterogeneous. Both Triandis (1994) and van de Vijver and Leung (1997) pointed to the presentation of standardization and double standardization in the work of Leung and Bond (1989). Standardization may be applied to each of previously described levels of analysis. Fischer (2004) presented the most common methods of standardization using means, standard deviation, both means and standard deviations, or covariates for the within-subject, within-group, and within-culture levels. Leung and Bond (1989), having established that cross-cultural and pancultural analyses are tied to the cultural or societal level of analysis, prescribed the use of within-subject standardization using both subject means and standard deviations. This standardization allows for the analysis of positioning effects. Hanges (2004) described standardization in the same manner. He also added that one of the weaknesses of this method was that the standardized data no longer fit the original scale. He then described a procedure using regression to rescale the new values back to the original scale. Leung and Bond (1989) did not conclude their research at that point. They proposed a method of using double standardization to reach the individual level of analysis. This would control for the positioning effect and allow researchers to review the patterning effect. Following the within-subject standardization described above, a within-culture standardization is processed where ―the mean on each item is set to zero and its standard deviation is set to one‖ (Leung & Bond, 1989, p. 145). Once the individual level of analysis is attained, the etic dimensions of a study may be detected.
The Cross-Cultural Effects of Rescaling Verbal and Numeric Rating Scales Using Correspondence Analysis
70
Rescaling
However, the aforementioned standardization procedures do not directly address the use of ordinal or interval data. Under the guidance of Stevens (1946), means and standard deviations should not be calculated on ordinal level data. Accordingly, in order to remove response bias through standardization (Fischer, 2004; Leung & Bond, 1989) interval level data is required. Most common rating scales, such as Likert scales, produce ordinal level data, leaving the researcher with two choices: use only the statistical methods appropriate for ordinal data (Allen & Seaman, 2007; Göb, et al., 2007; Jamieson, 2004; Kim, 1975; Knapp, 1990; Stevens, 1946; Winship & Mare, 1984) and do not standardize data using means and standard deviations or rescale the data (Bendixen, 1996; Bendixen & Sandler, 1995; Bendixen & Yurova, 2011; Harwell & Gatti, 2001; Stacey, 2005). Alternatively, they can ignore the advice of Stevens (1946), at their own peril, and simply assume the data behaves in an interval fashion.
Correspondence Analysis
The correspondence analysis method demonstrated in Bendixen and Sandler (1995), Bendixen and Yurova (2011), and Lee and Soutar (2010) appears to be the most broadly applicable and relatively simple method for rescaling ordinal data to an interval scale. Correspondence analysis is a methodology that displays the relationship between the rows and columns of a contingency table in low-dimension space (Bendixen, 1995, 1996; Bendixen & Sandler, 1995; Bendixen & Yurova, 2011; Carroll, Green, & Schaffer, 1986; Clausen, 1988; Greenacre, 1984, 1988, 2007; Greenacre & Hastie, 1987; Higgs, 1990; Hoffman & Franke, 1986; Lee & Soutar, 2010; Tenenhaus & Young, 1985; Torres & Greenacre, 2002). The resulting graphical solution or map is usually a one- or two-dimensional display which aids in the understanding and interpretation of the dependency between the rows and columns. The mathematics of the method are complex and beyond the scope of this research project, but can be best studied in the work of Greenacre (1984, 2007). The arch effect of the correspondence analysis solution is a key component to rescaling. Greenacre (1984, 2007) explained that when correspondence analysis is applied to a contingency table of frequency of response data from the rating scales of a survey the correspondence analysis solution has an arch effect, which is commonly referred to as the horseshoe. The reason the scale points in the profile space form a horseshoe is that they are displayed in a simplex. The simplex is a restricted space causing points that may have formed a line to instead form a curve. The extremes sit at the highest points on the ends of the curve. Bendixen and Sandler (1995) added that these extremes are ―bunched on the first principal axis‖ (p. 38) shifting their focus from simply the first dimension to the first two dimensions (Bendixen & Yurova, 2011). Bendixen and Sandler (1995) also described how the correspondence analysis solution could be used in rescaling ordinal level data to interval level data. Following hints from Greenacre (1984) and Higgs (1990) that this possibility existed, Bendixen and Sandler (1995) demonstrated the process of going from a 5-point scale that was ordinal in nature to a 5-point interval scale.
Delta Chi-Square
Bendixen and Yurova (2010) expanded on an essential step of the rescaling process: the delta chi-square procedure. This process may be necessary prior to analyzing a contingency table with correspondence analysis (Bendixen, 1995, 1996; Bendixen & Sandler, 1995; Bendixen & Yurova, 2011). The focus of the delta chi-square procedure is to determine if the rows or columns of a contingency table need to be combined (Greenacre, 1988; Hirotsu, 1983). The combining of two rows implies that ―respondents were not able to discriminate between scale categories‖ (Bendixen & Yurova, 2010, Scale Usage section, para. 2). This may be necessary in order to preserve the horseshoe effect of correspondence analysis, which is an essential element of the rescaling process.
RESEARCH IN PROGRESS
Based on this review of literature, the following research questions are presented:
Q1: Is there a difference in the way in which different cultures use the same verbal rating scales? (Bendixen & Yurova, 2011; Lee & Soutar, 2010)
Q2: Is there a difference in the way in which different cultures use the same numeric rating scales? (Bendixen & Yurova, 2011; Dawes, 2008)
Q3: What are the consequences of any multicultural differences in scale usage? (Fischer, 2004; Leung & Bond, 1989) This study is focused on both of the ways culture can affect how an individual uses rating scales: positioning and patterning (Leung & Bond, 1989). Both the positioning and patterning effects are related to response bias. Accordingly, the methods used

C. Fairchild IHART - Volume 16 (2011)
71
in this study will also have two parts. The first part of the study is designed with a primary focus on answering the first two research questions related to the positioning effect culture has on the ways rating scales are used. The second part, designed to address the third research question, is focused on the patterning effect culture has on rating scales usage. This study will be completed using previously collected data. Two data sets were collected using a questionnaire designed to measure the impact of stress in call centers. One set was collected by Michael Bendixen and Peter Zeidler from a multinational organization. The sample was collected from the following four countries: Canada (3,557 usable responses), the Philippines (10,276 usable responses), the United Kingdom (356 usable responses), and the United States (5,252 usable responses). The second data set was collected by Michael Bendixen from differing call center operations located in South Africa (399 usable responses) and the United States (238 usable responses). Random samples of approximately 375 responses will be selected from the samples containing more than 375 usable responses; otherwise, the entire sample of usable responses will be utilized. It is ideal in pancultural and individual analysis to use ―an equal number of subjects from each culture (Leung & Bond, 1989, p. 144). Responses to both verbal and numeric scales will be analyzed. Fourteen variables were collected using verbal rating scales that pertained to stress: hyper-stress (PER), hypo-stress (PO), and somatic symptoms (SOM). Thirteen variables were collected using numeric rating scales. The scales ran from one to ten. The questions related to stressors: role ambiguity (RA), role conflict (RC), work overload (WO), and work-family conflict (WF). The data will be analyzed using a number of pieces of software. First, Microsoft Excel (2007) and XLSTAT ("XLSTAT," Version 2010.4.01) will be used to aid in the delta chi-square and correspondence analysis rescaling. Microsoft Excel (2007) will also be used to process the standardization procedures. Finally, SPSS (PASW Statistics GradPack 17.0 Release 17.0.2) will be used to process the factor analyses that will be completed in this study.
Positioning
The first part of this study is focused on the positioning effect. The position is ―the relative location of the responses made by the average individual from a particular culture‖ (Leung & Bond, 1989, p. 141). It is a societal or cultural level concept that with standardization may aid in the discovery of an emic dynamic(s). This study will be completed using means and dispersion as was done by Leung and Bond (1989). The standardized score for each individual subject will be calculated by taking the original score for each item and subtracting the individual‘s mean across all items and then dividing by the individual‘s standard deviation across all items. This process helps to isolate part of the response bias and allows for societal or cultural level analysis. Unfortunately, the scores standardized in this manner are no longer tied to the original scale (Hanges, 2004). In order to be compared to the proposed method, the standardized scores will need to be rescaled. This issue is overcome by using regression to rescale the newly standardized scores back to the original scale. The proposed new method of handling this issue is to use the delta chi-square/correspondence analysis rescaling. The raw data will be rescaled within each culture. First, the delta chi-square procedure will be run in order to see which, if any, scale points need to be combined. Next, correspondence analysis will be run on the raw data and Euclidean distances measured. The proportions of distances will then be applied to the scale being utilized. The means generated by the within-subject standardization and by the delta chi-square correspondence analysis methods will then be compared. This will be applied separately to both the verbal and numeric scales in order to address both types of commonly used scales. In addition to the analysis related to positioning, the results of the proposed delta chi-square/correspondence analysis rescaling method will also be decomposed to reveal the elements of the differences in means. This is another proposed advantage of this new method. In this manner the proportional effects of rescaling and cultural differences can be determined.
Patterning
The pattern effect is how the items are related (Leung & Bond, 1989). Variables may be related positively, negatively, or have nonlinear relationships. This study will use Leung and Bond‘s (1989) proposed method for achieving the individual level for analysis: double standardization. The data will undergo within-subject standardization as discussed above. Then, a within-culture standardization will be applied by setting the item means to zero and item standard deviations to one for each cultural

The Cross-Cultural Effects of Rescaling Verbal and Numeric Rating Scales Using Correspondence Analysis
72
group (Fischer, 2004; Leung & Bond, 1989). Finally, a factor analysis will be conducted with the newly double standardized data to aid in the discovery of etic dimensions. This accepted method will be compared to the new proposed method using delta chi-square/correspondence analysis rescaling as well as a factor analysis of the raw data. The proposed delta chi-square/correspondence analysis method will also be adjusted for the individual level. The rescaling is a substitute for the within-subject standardization as discussed in the positioning section, but will still need to have the within-culture standardization as discussed by Leung and Bond (1989) in order to achieve the individual level and isolate the patterning effects. The method will be completed as discussed above. A factor analysis will then be processed. A factor analysis will also be run for the raw data. The factor structures determined by the three tests will then be discussed. Similarities will be highlighted by correlating the factors of each method. These tests will be completed using both the verbal and numeric rating scale data. Finally, the robustness of the results will be checked by comparing the two samples from the United States. If the proposed method is robust, the differences in rescaling should be negligible and any cultural differences should be attributed to organizational culture rather than national culture.
Limitations
This study will be delimited in an effort to focus the research. This research project does not attempt to resolve the debate regarding whether ordinal data must be rescaled to interval level data before calculating means or standard deviations. This research project is not designed to determine which method of rescaling is the most ideal. In addition, this research project will not seek to determine why different cultures use similar scales in different manners. These issues may be discussed, but the focus of this research is to explore the differences in how different cultures use rating scales through the use of correspondence analysis rescaling. Certain limitations on methodology and research constraints also need to be highlighted. This particular quantitative research methodology, as with many rescaling methodologies, is limited in its current practice. Similarly, the other methodological techniques that will be utilized are little used, customized, or created for the purposes of this project. The research constraints are primarily related to the sample. This study will make use of a sample drawn from just a few organizations across only five countries. The sample size is large, 375 responses per country, but the countries and organizations represented are limited.
REFERENCES
Allen, I. E., & Seaman, C. A. (2007). Likert scales and data analyses. Quality Progress, 40(7), 64-65. Retrieved from http://www.asq.org/qualityprogress/index.html
Baumgartner, H., & Steenkamp, J.-B. E. M. (2001). Response styles in marketing research: A cross-national investigation. Journal of Marketing Research, 38(2), 143-156. doi: 10.1509/jmkr.38.2.143.18840
Bendixen, M. T. (1995). Compositional perceptual mapping using chi-squared trees analysis and correspondence analysis. Journal of Marketing Management, 11(6), 571-581. Retrieved from http://www.westburnpublishers.com/journals/journal-of-marketing-management.aspx
Bendixen, M. T. (1996). A practical guide to the use of correspondence analysis in marketing research. Marketing Research On-Line, 1, 16-38. Retrieved from http://pandora.nla.gov.au/nph-arch/O1998-Nov-30/http://msc.city.unisa.edu.au/msc/JE MS/MRO_Articles.html
Bendixen, M. T., & Sandler, M. (1995). Converting verbal scales to interval scales using correspondence analysis. Management Dynamics: Contemporary Research, 4(1), 31-49. Retrieved from http://www.journals.co.za/ej/ejour_mandyn.html
Bendixen, M. T., & Yurova, Y. V. (2011). How respondents use verbal and numeric rating scales: A case for rescaling. International Journal of Market Research, forthcoming.
Bond, M. H. (1988). Finding universal dimensions of individual variation in multicultural studies of values: The Rokeach and Chinese Value Surveys. Journal of Personality and Social Psychology, 55(6), 1009-1015. Retrieved from http://www.apa.org/pubs/journals/psp/
Callahan, J., & Sashin, J. I. (1990). Predictive models in psychoanalysis. Behavioral Science, 35(1), 60-76. doi: 10.1002/bs.3830350107
Carroll, J. D., Green, P. E., & Schaffer, C. M. (1986). The interpoint distance interpretation in correspondence analysis. Journal of Marketing Research, 23(3), 271-280. Retrieved from http://www.marketingpower.com/AboutAMA/Pages/AMA%20Publi cations/AMA%20Journals/Journal%20of%20Marketing%20research/JournalofMarketingresearch.aspx

C. Fairchild IHART - Volume 16 (2011)
73
Clausen, S.-E. (1988). Applied correspondence analysis: An introduction. Sage University Papers Series on Quantitative Applications in the Social Sciences, 07-121. Thousand Oaks, CA: Sage.
Dawes, J. (2008). Do data characteristics change according to the number of scale points used? An experiment using 5-point, 7-point, and 10-point scales. International Journal of Market Research, 50(1), 61-77. Retrieved from http://www.ijmr.com/
Fischer, R. (2004). Standardization to account for cross-cultural response bias. Journal of Cross-Cultural Psychology, 35(3), 263-282. doi: 10.1177/0022022104264122
Göb, R., McCollin, C., & Ramalhoto, M. F. (2007). Ordinal methodology in the analysis of Likert scales. Quality & Quantity, 41(5), 601-626. doi: 10.1007/s11135-007-9089-z
Greenacre, M. J. (1984). Theory and Applications of Correspondence Analysis. London: Academic Press. Greenacre, M. J. (1988). Clustering the rows and columns of a contingency table. Journal of Classification, 5(1), 39-51.
Retrieved from http://www.springer.com/statistics/statistical+theory+and+methods/journal/357 Greenacre, M. J. (2007). Correspondence Analysis in Practice. Boca Raton: Chapman & Hall/CRC. Greenacre, M. J., & Hastie, T. (1987). The geometric interpretation of correspondence analysis. Journal of the American
Statistical Association, 82(398), 437-447. Retrieved from http://pubs.amstat.org/loi/jasa Guttman, L. (1941). The quantification of class attributes: A theory and method of scale construction. In P. Horst (Ed.), The
prediction of personal adjustment (pp. 319-348). New York: Social Science Research Council. Hanges, P. J. (2004). Response bias correction procedure used in GLOBE. In R. J. House, P. J. Hanges, M. Javidan, P. W.
Dorfman & V. Gupta (Eds.), Culture, leadership, and organization: The GLOBE study of 62 societies (pp. 737-751). Thousand Oaks, CA: Sage Publications.
Hanges, P. J., & Dickson, M. W. (2004). The development and validation of the GLOBE culture and leadership scales. In R. J. House, P. J. Hanges, M. Javidan, P. W. Dorfman & V. Gupta (Eds.), Culture, leadership, and organizations: The GLOBE study of 62 societies (pp. 122-177). Thousand Oaks, CA: Sage Publications.
Harwell, M. R., & Gatti, G. G. (2001). Rescaling ordinal data to interval data in educational research. Review of Educational Research, 71(1), 105-131. Retrieved from http://rer.sagepub.com/
Higgs, N. T. (1990). Practical and innovative uses of correspondence analysis. The Statistician, 40(2), 183-194. Retrieved from http://www3.interscience.wiley.com/journal/120094253/home
Hill, M. O. (1973). Reciprocal averaging: An eigenvector method of ordination. Journal of Ecology, 61(1), 237-249. Retrieved from http://www.journalofecology.org/view/0/index.html
Hirotsu, C. (1983). Defining the pattern of association in two-way contingency tables. Biometrika, 70(3), 579-589. doi: 10.1093/biomet/70.3.579
Hoffman, D. L., & Franke, G. R. (1986). Correspondence analysis: Graphical representation of categorical data in marketing research. Journal of Marketing Research, 23(3), 213-227. Retrieved from http://www.marketingpower.com/AboutAMA/Pag es/AMA%20Publications/AMA%20Journals/Journal%20of%20Marketing%20research/JournalofMarketingresearch.aspx
Hui, C. H., & Triandis, H. C. (1985). Measurement in cross-cultural psychology: A review and comparison of strategies. Journal of Cross-Cultural Psychology, 16(2), 131-152. doi: 10.1177/0022002185016002001
Hult, G. T. M., Ketchen, D. J., Jr., Griffith, D. A., Finnegan, C. A., Gonzalez-Padron, T., Harmancioglu, N., . . . Cavusgil, S. T. (2008). Data equivalence in cross-cultural international business research: Assessment and guidelines. Journal of International Business Studies, 39(6), 1027-1044. doi: 10.1057/palgrave.jibs.8400396
Jamieson, S. (2004). Likert scales: How to (ab)use them. Medical Education, 38(12), 1217-1218. doi: 10.1111/j.1365-2929.2004.02012.x
Kim, J. (1975). Multivariate analysis of ordinal variables. The American Journal of Sociology, 81(2), 261-298. Retrieved from http://www.journals.uchicago.edu/toc/ajs/current
Knapp, T. R. (1990). Treating ordinal scales as interval scales: An attempt to resolve the controversy. Nursing Research, 39(2), 121-123. Retrieved from http://journals.lww.com/nursingresearchonline/pages/default.aspx
Lee, J. A., & Soutar, G. (2010). Is Schwartz's value survey an interval scale, and does it really matter? Journal of Cross-Cultural Psychology, 41(1), 76-86. doi: 10.1177/0022022109348920
Leung, K. (1989). Cross-cultural differences: Individual-level vs. culture-level analysis. International Journal of Psychology, 24(1), 703-719. doi: 10.1080/00207598908246807
Leung, K., & Bond, M. H. (1989). On the empirical identification of dimensions for cross-cultural comparisons. Journal of Cross-Cultural Psychology, 20(2), 133-151. doi: 10.177/2255255489202002
Mullen, M. R. (1995). Diagnosing measurement equivalence in cross-national research. Journal of International Business Studies, 26(3), 573-596. doi: 10.1057/palgrave.jibs.8490187
Myers, M. B., Calatone, R. J., Page, T. J., Jr., & Taylor, C. R. (2000). An application of multiple-group causal models in assessing cross-cultural measurement equivalence. Journal of International Marketing, 8(4), 108-121. doi: 10.1509/jimk.8.4.108.19790

The Cross-Cultural Effects of Rescaling Verbal and Numeric Rating Scales Using Correspondence Analysis
74
Salzberger, T., & Sinkovics, R. R. (1999). Data equivalence in cross-cultural research: A comparison of classical test theory and latent trait theory based approaches. Australasian Marketing Journal, 7(2), 23-38. doi: 10.1016/S1441-3582(99)70213-2
Salzberger, T., & Sinkovics, R. R. (2006). Reconsidering the problem of data equivalence in international marketing research: Contrasting approaches based on CFA and the Rasch model for measurement. International Marketing Review, 23(4), 390-417. doi: 10.1108/02651330610678976
Sekaran, U. (1983). Methodological and theoretical issues and advancements in cross-cultural research. Journal of International Business Studies, 14(2), 61-73. doi: 10.1057/palgrave.jibs.8490519
Stacey, A. G. (2005). The reliability and validity of the item means and standard deviations of ordinal level response data. Management Dynamics, 14(3), 2-25. Retrieved from http://www.journals.co.za/ej/ejour_mandyn.html
Steenkamp, J.-B. E. M., & Baumgartner, H. (1998). Assessing measurement invariance in cross-national consumer research. The Journal of Consumer Research, 25(1), 78-90. doi: 10.1086/209528
Stevens, S. S. (1946). On the theory of scales of measurement. Science, 103(2684), 677-680. doi: 10.1126/science.103.2684.677
Tenenhaus, M., & Young, F. W. (1985). An analysis and synthesis of multiple correspondence analysis, optimal scaling, dual scaling, homogeneity analysis and other methods for quantifying categorical multivariate data Psychometrika, 50(1), 91-119. doi: 10.1007/BF02294151
Torres, A., & Greenacre, M. J. (2002). Dual scaling and correspondence analysis of preferences, paired comparisons and ratings International Journal of Research in Marketing, 19(4), 401-405. doi: 10.1016/S0167-8116(02)00101-5
Triandis, H. C. (1994). Cross-cultural industrial and organizational psychology. In H. C. Triandis, M. D. Dunnette & L. M. Hough (Eds.), Handbook of industrial and organizational psychology (2 ed., Vol. 4, pp. 103-172). Palo Alto, CA: Consulting Psychologists Press.
van de Vijver, F., & Leung, K. (1997). Methods and data analysis for cross-cultural research. Thousand Oaks, CA: Sage Publications.
Winship, C., & Mare, R. D. (1984). Regression models with ordinal variables. American Sociological Review, 49(4), 512-525. Retrieved from http://www.asanet.org/journals/asr/
XLSTAT (Version 2010.4.01) [Computer Software]. New York, NY: Addinsoft. Young, F. W., Takane, Y., & de Leeuw, J. (1978). The principal components of mixed measurement level multivariate data: An
alternating least squares method with optimal scaling features. Psychometrika, 43(2), 279-281. Retrieved from http://www.psychometrika.org

J. L. Bonenfant IHART - Volume 16 (2011)
75
LINGUISTIC LINK BETWEEN HAITIAN-CREOLE AND ENGLISH
Jacques L. Bonenfant Florida Memorial University, USA
ABSTRACT
This paper provides an overview of the history of the Haitian-Creole language developed by enslaved West African in the plantation. Linguistic research in this paper reveals that the Haitian-Creole has influenced by some West African languages especially EWE and indo-European language such as French, English, and Spanish since Haiti was colonized by France, England and Spain. Due the linguistic influence of other languages, the native language of the enslaved West Africans was developed as a pidgin, lingua franca and Creole. Based on many lexicons that are closed to English used by Haitians, the author feels there is a linguistic link between their native language and the one of Shakespeare.
HISTORY OF THE HAITIAN-CREOLE: FROM PIDGIN TO LINGUA FRANCA
The history of the Haitian-Creole language has proven that the existence of this language is uncertain during the pre-Columbian era, because the Taino Indians who walked from India to Haiti (Quisqueyah) were the first inhabitants of this island. The Taino Indians had their own version of language, which is totally different from the Haitian-Creole even though few Indian words such as roukou (wookoo), banbou (bamboo) mabouya (mabooya) are still used in the language (Haitian-Creole) developed by the enslaved West African people. Previllon (1987) argue that from a linguistically point of view; therefore, the indigenous language of modern Haiti is Haitian, which is a member of the world family of languages called Creole. This observation elevates Haitian from the status of adjective (a qualifier) to that of noun (a substantive). By giving Haitian an independent status, we bring it fully into the family of official languages such as English, German, French, and Spanish. Haitian-Creole was pidginized due to the mixture of different West African languages brought or spoken by the enslaved in the plantation of Haiti. The pidgin has not yet developed as a native language in the plantation; however, the enslaved West Africans used it for communication. Lefevre (2010) argue that the history and structure and Creole languages are characterized by the following features. First, as was pointed out by Whinnon (1971), these languages are only developed in multilingual communities. Second, communities where pidgin and Creole languages emerge generally involve several substratum languages spoken by the majority of the population and a superstratum language spoken by a relatively small but economically powerful social group. Third, in communities where Creole languages emerge, speakers of the substratum languages generally have very little access to the superstratum language (Thomason and Kaufman, 1991). After the pidginization, the Haitian-Creole was a lingua franca for the enslaved West Africans in the plantation. Lefevre and Lumsden (1989) state that an optimal theory of creole genesis must account for the fact that Creole languages emerge in multilingual contexts where there is a need for a lingua franca and where the speakers of the substratum languages have little access to the superstratum language. It must account for the fact that Creole languages tend to be isolating languages even when they emerge from contact situations involving only agglutinative languages.
ENGLISH INFLUENCE ON HAITIAN-CREOLE
According to Bretons (1996) the Haitian Creole language was developed by the enslaved West Africans in order to communicate among themselves. This means that the enslaved West Africans were not able to understand the different languages (French, Spanish and English) used by slave owners, so they developed a metalinguistic feature that first generate a pidgin. Later, Bretons (1996) stated that ―Haiti was first a colony of Spain, then England and finally France. A misunderstood word in French, English or Spanish became a word in Creole. For example, the word ―bucket‖ in English becomes ―bokit‖ in Creole. This reveals the linguistic link between Haitian Creole and English can be found in semantics, morphology, phonology and lexicon. St-Fort (2000) argues that‖ historically, it is difficult to say precisely when HC appeared… The French take charge of the operations of the slave trade and the needs to communicate between slave and masters will give rise to a new language‖(p2). Further, St-Fort points out that‖ Haitian-Creole is a member of the group of French-based creoles because an important part of

Linguistic Link between Haitian-Creole and English
76
its lexicon or comes from directly from French. However, its syntax, its semantic and its morphology differ considerably from French‖(p2). According to Smith (1999)…‖ Creole can be considered the linguistic product of two or more languages that have combined to form a language that enables people from different language groups to communicate.‖ When Haiti was a colony of England, there was a linguistic communication between the slave owners and the enslaved West African people. The enslaved West Africans had developed ―a pidgin language that is not the native language of anyone but is used an auxiliary or supplemental language between two mutually unintelligible speech communities‖ (Smith p1). We can conclude that the pidgin language of the enslaved West Africans in Haiti has borrowed many words from the English language or many words in the Haitian Creole language are derived from English. Words such as bokit (bucket), kanniste (can) have their roots in the English language. Hartman (1998) argued that ―it is easy to make the mistake of thinking that Creole is a ― primitive‖ language or a corruption of English because so many of the words sounds or look similar to related English words.‖ The linguistic link between Haitian Creole and English may not be similar to the derivation of a great deal of vocabulary from French, Latin, and Greek to English; however, it embraces sociolinguistics not in terms of bilingualism between a primary and secondary group, but it encompasses the function of communication between two groups socially, racially, and linguistically diverse. We understand that multilingualism may generate code switching as a willingness of bilingualism; however, this linguistic feature cannot apply to Haitian Creole because the language did not exist before the genesis of the slave trade era. The linguistic link between Haitian Creole and English has occurred not in terms of social interaction, but as a way of communication between the linguistically diverse enslaved West Africans in Haiti since they came from different countries, tribes and regions in West Africa. Winford (1999) revealed that ―these Creole languages are a blend of mostly European vocabulary with a grammar representing a compromise between that of the West African substrate and that of the European substrate. Creoles differ primarily in the extent of one or the other of these influences on their grammar.‖ Many Haitian Creole lexicons have their roots in the language of Shakespeare; however, the syntactic features come from the West African languages mainly EWE. The Haitian Creole; furthermore, has different dialects like English. The segregation of enslaved West Africans from identical tribes by English conquerors in order to avoid communication and revolution has an impact of the English influence towards the Haitian Creole language. This generates a high degree of mixing code between the West African languages and English to develop Haitian Creole. Later, Winford (1999) argued that ―the ability to manipulate two codes can lead to very intricate patterns of code altercation and code mixture.‖ This linguistic aspect presented by Winford is not present in Haitian Creole for the following reasons:
1. The language did not exist before Trans-Atlantic Slave Trade 2. Enslaved West African people were linguistically diverse 3. English masters of the enslaved West Africans people did not speak or understand the different West African languages
and dialects of the enslaved West Africans. However, after the development of Haitian Creole by enslaved West Africans, there was a linguistic link between Haitian Creole and English not in terms of diglossia, but as a spoken language that generates in the beginning function words, morphology, syntax, semantics, lexicon morphemes and other linguistic features. The linguistic influence of English over Haitian -Creole occurs due to sociolinguistics, but in terms of power of the English masters over the enslaved West Africans as far as speaking English to the enslaved even though they had language barrier or they did not understand English. The linguistic link between Haitian Creole and is not the result of diglossia, but it generates a certain type of morphology that creates a difference in phonology like in Spanish and Portuguese. According to Blake (1999)….observing and analyzing several Creole features, several studies provide evidence that dispels myths about… Creole, as opposed to a linguistic descent of… English.‖ The Haitian Creole language developed by linguistically diverse enslaved West Africans in the plantation has a long history like the English language. First of all, the Haitian Creole was a pidgin, lingua franca and then developed as a language. The pidgin has many English words such as ―bokit (bucket) and kaniste (root word: can (container). These English words used in pidgin make the lexicon and morphology for the Haitian-Creole language. The Haitian Creole language is the linguistic horizon of the Haitian people. In the past, various linguistic anthropologists felt the interest in conducting research about the Haitian Creole in order to address and relate to the language universals components of the Haitian tongue. Today, the Haitian Creole language has English phonetic rather than a French one. With this phonetic link and other linguistic features that relate Haitian Creole and English, teachers of Haitian English language learners can differentiate the phonemic awareness and identify some cognates of both languages. The awareness of linguistic link that exists between English and Haitian-Creole can effectively guide teachers of Haitian children in developing new didactic strategies that can respond to their students‘ academic needs and success in the learning process.

J. L. Bonenfant IHART - Volume 16 (2011)
77
REFERENCES
Blake, R. (1999). Barbadian Creole English: Insights into Class and Race Identity. New York, New York. Bretons, W. (1999). The origin of Haitian Creole. New York, New York. Hartman, J. (1999). Words & Stuff. New York, New York. Previllon, J. (1993). What‘s in a Name: An Awakening of the Haitian Linguistic Consciousness (An Argument for Haitian as the
Native Language of Haitians). Lefevre, C. (2010). Creole Genesis and the Acquisition of Grammar: The Case of Haitian Creole, Cambridge University Press. Smith, S. (1999). Understanding Haiti. Multicultural Review V4n1. St-Fort, H. (1998) What is Haitian Creole. The Creole Connection. Windford, D. (1999). Haitians- Their Language and Culture. RSC Refugee Service Center: New York, New York. Thomason, G.T. & Kaufman, T. (1991). Language Contact, Creolization and Genetic Linguistics, University of California Press,
Berkeley and Los Angeles, CA.
P. K. Miller IHART - Volume 16 (2011)
78
FAMOUS LAST WORKS: MORTALITY AND MUSIC IN THE FINAL CHORALES JOHANNES BRAHMS UND DIE ELF CHORALE VORSPIELE
Peter K. Miller
Indiana Wesleyan University, USA
ABSTRACT
The inevitable reality of death is as much a part of life as our inward being and daily striving to find purpose and meaning for that which we seek to accomplish. How each of us is able to accept, cope with or express our own mortality is often best communicated through our art forms. Music may, perhaps, be the best medium to convey human emotions associated with pain, sorrow, grief, death, and dying when spoken language is unable to verbalize these feelings. This paper will describe one composer's preoccupation with transience and study compositions created at the end of his life which reflect personal attitudes and societal practices concerning mortality. This will be achieved through analysis of musical examples, uses of text painting, as well as interpretation of personal letters and memoirs. Keywords: Organ Music, Chorale Prelude, Absolute Music, Text Painting, Mortality, Afterlife.
INTUITION AND INDIVIDUALIZATION
Foundational elements of Brahms's life, personality, and art were shaped by 19th century musical thought and practice as well as personal circumstances (the majority beyond his control) which were to determine the direction his path and processes would follow. For example, as a nine-year-old boy, because of his family's financial struggles, he was pressed into service playing the piano in less than desirable riverfront bars and prostitution houses of Hamburg. Later in life, recollections of this intolerable situation, from which there seemed to be no escape, brought embarrassment and shame. "Between dances, the notorious Singing Girls of the St. Pauli quarter used to sing their obscene songs to his accompaniment and then, half-clad, take the nine-year-old pianist on their laps, and show a wanton pleasure in rousing his first erotic impulses. Small wonder, then that this species of premature introduction to the mysteries of sex helped to give little Johannes an infantile bias in favour of prostitutes from which he never recovered" (Schauffler, P. 258). These experiences scarred Johannes and left him with a permanent caustic, sarcastic cynicism regarding life, friendships and relationships. Even in adulthood, "he frequented the same type of brothels he had played the piano in as a boy. He sometimes seemed to be ashamed that he preferred this sort of activity to a more long-lasting relationship, but he was apparently unable to maintain sexual intimacy with women he loved and respected."(Getzinger, p.65-66) As a result, Brahms never married. In his youth, Johannes could easily have been characterized as a typical lonely, surly teenager whose acquaintances were not of similar intellectual standards. However, this all began to change by the time he reached age twenty, as he began to develop and maintain lifelong friendships with the men and women who most closely echoed his musical and philosophical sentiments. These included Eduard Remenyi and Joseph Joachim (Hungarian violinists with whom Brahms toured and accompanied), Albert Dietrich (composer/conductor), Robert and Clara Schumann, Fritz Simrock (Brahms' music publisher), Julius Otto Grimm (teacher/composer), Eduard Hanslick (music critic), Karl Tausig (pianist), Hermine Spies and Elisabet von Stockhausen (sopranos), Johann Strauss, Jr. (the "Waltz King"), and Hans von Bulow (conductor). These friendships provided Brahms with creativity, encouragement, affection and emotional stability.
INTIMACY AND INFLUENCE
It should come as no surprise that Brahms' closest personal friends were musicians. These intimate associations provided the motivation and artistic inspiration he needed to develop his talents and pursue his passions in the areas of piano performance, orchestral conducting, and, most arduously, composition. In this last discipline, Brahms may be regarded as a 'romantic classicist' (a term formulated from my observations, study, and research). The 'progressive programmatics' (another one of my creative labels) of the New German School such as Liszt, Mahler, Tchaikovsky, Verdi, Wagner and Wolf had little respect for him or his style. By the same token, their musical ideas and creativity were completely foreign to him. He never attempted to compose even one phrase of program music. Brahms' conservative works dominated the latter half of the 19th century much as the music of Beethoven, Schumann and Mendelssohn significantly impacted the first half. All were content with the inherited large classical forms and demonstrated comfort and excellence composing in the confines of their abstract structures. The symphony, in the gifted hands of these three

P. K. Miller IHART - Volume 16 (2011)
79
great Romantic masters and Brahms, their most influential heir, was cultivated to its highest standards, developed to its structural limits, and formally brought a significant epoch of tonal music to a dramatic conclusion. Like Bach, Brahms signaled the end of an era. He was a master in every genre except opera, which he never composed. His four symphonies rival Beethoven's nine in popularity on concert series and orchestral programs while his Violin Concerto, Double Concerto, chamber music, two piano concerti, solo piano sonatas and intermezzi, organ works, and over 260 German art songs are staples of the repertory. The genius of Beethoven provided, perhaps, the most stimulation if not the greatest challenges to Brahms' compositional mindset. Traditional music audiences envisioned him as the rightful heir to Beethoven's symphonic legacy. For Brahms, this was a resounding affirmation but also a tremendous responsibility to engender. "He wanted his work to be uniquely his and feared that, if measured against Beethoven's indisputable genius, his own music would be found forever lacking" (Getzinger, p. 12). As earlier published music became more accessible to students, a broader knowledge of the evolution of compositional techniques and musical style periods developed. Brahms, who was primarily self-taught, and other young musicians benefited from the analysis and study of the works of the great masters. "But, on a less positive note, new composers also had to contend with the massive weight of the achievements made by their predecessors. Brahms ... was aware of the extreme heights his work would have to reach to be considered among the greatest" (Ibid, p. 20). In addition to the reference to Brahms as 'little Beethoven' by King George V of Hanover, Robert's Schumann lavished praise upon him in an article titled Neue Bahnen (New Paths) for the Neue Zeitschrift fur Musik which reads,
" ... sooner or later ... someone would and must appear, fated to give us the ideal expression of the times, one who would not gain his mastery by gradual stages, but rather would spring fully armed like Minerva ... His name is Johannes Brahms ... He carries all the marks of one who has received a call. When he waves his magic wand where the power of great orchestral and choral masses will aid him, then we shall be shown still more wonderful glimpses into the spirit-world" (MacDonald, p. 18).
Though Brahms lived a simple, frugal life, he garnered considerable wealth from the success of his compositions. He called Vienna his home from 1862 until his death, though he stayed in hotel rooms and occasionally with friends until nearly a decade later. When he did become a permanent resident in May 1871, he quickly made a resounding impression upon the artistic life of the "City of Music." " ... there were many who pointed out the resemblances with Beethoven (could Brahms have played these up?): both were short men, both loved the country, both had fierce tempers, both were bachelors. They even had a similar way of walking, head forward and hands clasped behind the back" (Schoenberg, P. 277). His apartment contained only a few necessary items of furniture, the grand piano owned by Robert Schumann, and a bust of Beethoven mounted on a high shelf. Even there, the shadow of the legendary composer looked down and brooded over Brahms' work.
Famous Last Works: Mortality and Music in the Final Chorales Johannes Brahms und die Elf Chorale Vorspiele
80
MUSICAL INSPIRATION, INSIGHT, AND INVENTION
The immense popularity of Brahms' compositions from premier to the present day has been the sheer inventive nature of their construction. During the years he had lived with the Schumanns, around the time of Robert's mental illness and death, he had spent a great deal of time organizing and immersing himself in their vast music library. He voraciously analyzed and studied the scores of Bach, Haydn, Mozart, Beethoven and Mendelssohn in an attempt to discover the structural intricacies of these works. Until the Classical style period, all instrumental music. was written for dancing. Franz Josef Haydn was the first to compose chamber orchestral music purely for the listening pleasure of an audience. The "father" of the classical symphony developed and expanded the sonata form, composing 104 of these works. Mozart raised the standard of symphonic form, lengthening and perfecting it, especially with the final three, #39, 40, and 41. Ultimately, he set the bar for future, aspiring symphonists. At the time of Brahms' 43rd birthday on May 7, 1876, he had not yet completed his first symphony. By this point in life, Beethoven had already composed eight of his nine. Being largely self-taught, Brahms simply had not had enough experience with orchestration or composing for a large complement of instruments. In order to truly become Beethoven's successor, he felt that he would be obliged to compose a sequel to the great, unconquerable Ninth. Brahms completed his First Symphony in August of that year. The spirit of Beethoven permeated this weighty work which even hinted at a quotation of the "Ode to Joy" theme in its final movement. Hans von Bülow, the conductor who championed Brahms' work dubbed it "Beethoven's Tenth". He also wrote, "You know how much I think of Brahms; after Bach and Beethoven he is the greatest, the most exalted of all composers" (Musgrave, P. 36). Three more symphonic masterpieces followed to standing ovations which were identified as "unqualified successes" by critic Eduard Hanslick.
INADEQUACY AND INFERIORITY
Three unmistakable, distinguishable compositional style periods mark Brahms' career (reminiscent of the great Beethoven). Music from his early period (prior to 1860) radiates a passion for Gypsy and German folk song melodies, scherzo-like dances, driving rhythms, pounding octave bass lines, and an almost compulsive conformity to form. These musical characteristics of his earliest works were mixed with a fair dose of preoccupation with Beethoven, young Brahms' virtuosic display as a concert pianist, the flowering of his creations with his personal life and emotions as well as exhibiting the instinctively German-born traits of perfectionism, seriousness of purpose, and low self-esteem (What a combination! I can personally relate to the ways in which these co-exist). What results is music which is fresh, original and creative, but at the same time a bit clumsy, turgid, and overly self-expressive. His oeuvre from this period includes sonatas and a scherzo for solo piano, sets of piano variations, chamber music, Lieder, vocal duets and choral music, two orchestral serenades, and a first attempt at a large-scale orchestral work. Brahms conceived the Sonata for Two Pianos in d minor in 1854, shortly after Robert Schumann's attempted suicide and committal to an asylum. Brahms intended to expand the work into his first symphony, perhaps in an attempt to live up to Schumann's Neue Bahnen accolades. He simply didn't have the musical arsenal to compose a symphony at this point in his career. Brahms later abandoned this idea, as well as the Finale, scherzo, and slow movement from the original work and fashioned his new ideas into the Piano Concerto in d minor (1857) which he dedicated to honor Schumann, his friend and mentor, who had died the year before. Reminiscing about seeing him shortly after he had passed away, Brahms recalled, "He looked calm in death ... What a blessing this was. If I set aside the crude facts, you can imagine for yourself how sad, how beautiful, how deeply touching this death was. To me Schumann's memory is holy. The noble pure artist forever remains a model and an ideal. I will hardly be privileged to love a better person (Musgrave, p. 23-5). The overwhelming turbulence of the first movement is filled with anguish and grief. "According to Joachim, this theme reflected Brahms' state of mind on hearing that Schumann had thrown himself into the Rhine ..." (MacDonald, p. 100). Brahms described the Adagio second movement as a portrait of Clara while the third movement Finale recalls Beethoven's Piano Concerto in c minor. This was the first of many works in which Brahms would personally and openly express pain and loss in his life. Despite Brahms' initial, youthful attempts at composing in the Classical forms, what emerges is the obvious genius of masterful composition. His developing understanding of these models, prepares us for a piano concerto and sonatas the likes of which had not been created since Beethoven, chamber music comparable to that of Mozart, Beethoven, Schubert and Mendelssohn, a gift of producing art songs of equal mastery with those of Schubert and Schumann, and choral music in the fine tradition of Palestrina, Isaak, J. S. Bach, Handel as well as other Renaissance and Baroque masters.
P. K. Miller IHART - Volume 16 (2011)
81
INFUSION, INTRIGUE, AND INSCRUTABILITY
Brahms' middle period comprises the music written between 1861 and 1882. His output during this part of his life displays a maturity not present in his earlier works. He dispensed with incorporating acrostics, games, puzzles, tricks, and clever devices into his music. No longer did he allow his works to be a window on his personal life or an avenue for expressing his own emotions. His compositions focused primarily on eliciting romantic thought and feeling from the individual listener. "There is more security, confidence, and ebullience; more brilliance without any concession to frivolity ... The early works of Brahms are too serious to be graceful, but in the middle period music he is infinitely more relaxed, and a quality of unexpected charm can be felt." (Schoenberg, p. 285-286) But his music also became a clever disguise to conceal the sincerity of his innermost feelings deep within. Works from this period are represented by Variations on a Theme of Haydn, Hungarian Dances, Symphony #1 and 2, Academic Festival and Tragic Overtures, Violin Concerto, Second Piano Concerto, three string quartets, a violin sonata, piano quartets and quintets, numerous other chamber works, Eight Piano Pieces, op. 76, and Two Rhapsodies, op. 79, Liebeslieder Waltzes, A German Requiem, The Alto Rhapsody, many other choral works, and dozens of German art songs. The death of his mother, Christiane, on February 2, 1865, was Brahms' first personal experience with the loss of a member of his immediate family. She had been, by far, the primary spiritual mentor and influence in his life. During the last week of January, she had composed a sorrowful letter describing the emotionally and verbally abusive conditions of her marriage to Brahms' father, Johann Jakob, and the related struggles, both known and unknown, which the family had endured during Brahms' childhood and since his departure to Vienna. He received the letter just prior to the news of her fatal stroke but failed to make it back to Hamburg in time to see her again before she died. Brahms' recollection of the funeral left him with pleasant memories, " ... a great many young musicians escorted my mother on her last journey. Many were the flowers and wreaths that adorned her coffin, and in spite of the grim cold weather, music provided the last farewell." (Avins, p.318) however, his mother's death proved to be quite devastating psychologically. After she was buried, Brahms returned to Vienna. One day, he received a visit from his cellist friend, Josef Gansbacher who "found him practicing Bach keyboard music; Brahms told him of his loss with tears streaming down his cheeks, but never stopped his playing. Clearly, creative work was the only possible solace ... Almost immediately, it seems, he began a new work under the impact of the loss he had suffered."(MacDonald, P. 132) The music he was about to create was A German Requiem. Brahms had long planned to write a German text requiem, perhaps since the death of Robert Schumann. Numerous other composers, from Heinrich Schütz to Schumann himself, had either toyed with or followed through on the same idea. Brahms biographer Florence May quotes Clara Schumann "'We all think he wrote it in her memory, though he has never expressly said so.'" (Avins, P.320) There is also some speculation that it originated from the continuing grief over Schumann's death nine years before. It was indeed enlightening to discover that the principal theme of the discarded scherzo from the Sonata for Two Pianos in d minor (1854) found new life as the basis for the second movement March of the German Requiem. "The harmonic and contrapuntal art learnt by Brahms in the school of Bach and inspired by him with the living breath of the present, almost recedes for the listener behind the mounting expression from touching lament to annihilating death shudder [in the funeral march of the second movement]" (Musgrave, p. 224). The work is theistic but not explicitly Christian (according to Karl Reinthaler, orchestral conductor and chorus master for the Bremen Cathedral premier in April 1868) humanistic but not nationalistic; scriptural but not liturgical. Brahms would have been perfectly content to title his composition A Human Requiem. He knew and understood Scripture intimately but "was suspicious of religious dogma and was not a churchgoer. His position was that of a freethinking German Protestant, closer to a humanist in today's terms. Brahms appears to have had only passing interest in philosophy, not least that of his time; he was introduced to the writings of Arthur Schopenhauer in 1863 and later those of Friedrich Nietzsche, who took a brief interest in his music ... He rather regarded the Bible ... as a repository of wisdom and experience as well as of great literature and he often chose texts from outside of the 'official' texts of the Old and New Testaments, referring to his 'heathen' tendencies in so doing" (Musgrave, p. 45).
The text, which Brahms assembled himself with great skill out of diverse passages from the Old and New Testaments and the Apochrypha, essentially addresses the feelings of the bereaved, in a consolotary manner on the common destiny of the dead and the living. The poignant contrast, so central to Brahms' thought in almost all his choral works, between those already in a state of grace and those barred from it and afflicted with the sense of mortality, is fully explored .. .it was the first [requiem in German] in which a composer had selected and shaped his text, for essentially personal resonances, to speak to a contemporary audience in a shared tongue, transcending the constraints of ritual:

Famous Last Works: Mortality and Music in the Final Chorales Johannes Brahms und die Elf Chorale Vorspiele
82
a prophetic sermon from individual experience, with universal application. Patience brings dignity and perspective to the mysteries of life and death, and instills a conviction of the immortality of the spirit; if there is a God, this is how he has made things, for reasons we cannot require of Him but in whose fitness we must repose some trust ... the requiem encircles the secret province of the extreme good ... The whole grand design is introduced and rounded off by the two meditative, ternary-form choruses which propose the constant theme (no.1 , 'Blessed are they that mourn') and point the final consolatory parallel (no. 7, 'Blessed are they that die in the Lord') (MacDonald, p. 195-196, 199)
Johannes himself was not extremely devout or religious and this upset his friends who were deeply spiritual. "'Such a great man! Such a great soul! And he believes in nothing!' lamented the appalled Dvorak" (Schoenberg, p. 283). Brahms achieved his first resounding compositional success with the completion of the German Requiem in August 1866 and eventual premier of the entire work in Bremen. At the conclusion of the performance, Reinthaler admitted to the audience, "What we have heard today is a great and beautiful work, deep and intense in feeling, ideal and lofty in conception. Yes, one may call it an epoch-making work" (Getzinger, p. 97). Brahms conveyed another sort of grief in several other compositions from the middle period. I have previously discussed Johannes' childhood experiences and his avoidance of permanent or intimate relationships with women. During the summer of 1858, while staying with his friend Otto Grimm in Göttingen, Brahms became romantically involved with a young soprano in Grimm's choir named Agathe von Siebold. The love songs he composed for her would eventually become his Opus 14 Lieder. In January 1859 he asked her to marry him. Less than a month later, he broke off the engagement. Some of the grief over the lack of permanence in his life was expressed in letters to several close friends who had announced wedding plans or that they were expecting a child. He also wrote music to express his longing and pain. The Sextet #2 in G Major (1864) is actually a lament about his inability to commit to a lasting relationship, composed as a result of his sorrow over the loss of Agathe (even though he was responsible for their separation). In the climax of the work, Brahms uses melodic pitches to spell out the letters of her first name and near the end of the piece, repetition of the notes A, D, E represent his musical attempt at a final farewell to the' only woman to whom he would ever propose marriage. A clandestine infatuation with Clara's daughter Julie from 1866-69 and the resulting marriage to someone else inspired Brahms to compose the Alto Rhapsody. "This work overflows with all of life's heartaches. The G Major Sextet may have been a farewell to Agathe, but the Alto Rhapsody was a farewell to love altogether. He would never write such an aching piece of music because he would never fall in love with another woman. He proclaimed himself to be a determined bachelor" (Getzinger, p. 102). Through it all, he was never without the admiration and affection of Clara Schumann. The lifelong exchange of letters between Johannes and Clara documents the depths of the love they shared through hand-written and musically created love notes as well as on-going collaborative performances and Brahms' dedication of significant compositions in her honor. "I believe that I do not respect and admire her as much as I love her and am under her spell. I must often restrain myself from just quietly putting my arms around her and even-1 don't know, it seems to me so natural that she would not take it ill. I think I can no longer love a young girl. At least I have quite forgotten about them. They but promise heaven while Clara reveals it to us." (Musgrave, P-48-49) He had fancied himself with many other women during his lifetime but the platonic love which Brahms and Clara shared was perhaps the only constant in his life. Johannes would always return to Clara, and she would always be there when he needed someone.
INTERNALIZATION AND INTROSPECTION
Characteristics of Brahms' third and final compositional phase can be traced from 1883 and clearly permeated his works throughout the later years. Many biographers, theorists and musicologists have described the repertoire from this period of his life as 'autumnal'. Most of his composing occurred during summers at rural, rustic or mountain hideaways and resorts. He toured the remainder of the year with the ultimate goal of programming his music on concerts for audience exposure. As he personally grew more introverted, isolated and secluded from the public, his music became increasingly personal, reflective, and introspective, noticeably so after the Fourth Symphony (1885). While many composers become more bold, expansive, experimental, intense, and passionate with age, Brahms seemed more and more at ease and his music increasingly gentle and relaxed.
In his last years, wrote a very tender, personal kind of music. That does not mean the music lacks tension. But such works as the D minor Violin Sonata, the Clarinet Quintet, the Intermezzi for piano, and his very last work, a set of eleven chorale preludes for organ, have a kind of serenity unique in the work of any composer. The late Haydn

P. K. Miller IHART - Volume 16 (2011)
83
symphonies, for instance, could still be the product of a young man, but there is nothing suggesting youth or ardor in the late music of Brahms. It is the twilight of romanticism, and the peculiar glow of this setting sun is hard to describe. It beams a steady warm light ... It is the music of a creative mind completely sure of its materials, and it combines technique with a mellow, golden glow ... the music of Brahms continued to represent in an intensified way what it had always represented - integrity, the spirit of Beethoven and Schumann, the attitude of the pure and serious musician interested only in creating a series of abstract sounds in forms best realized to enhance those sounds (Schoenberg, p. 288).
Johannes Brahms in 1894. (Photograph by Maria Fellinger, courtesy of Gesellschaft der Musikfreunde, Vienna.)
Significant compositions include the Third and Fourth Symphony, Double Concerto in A minor, chamber music, a trio and a quintet for clarinet and strings, the later piano pieces, op. 116-119, choral music, Lieder and Folksong arrangements for voice and piano, vocal duets and quartets with piano, two sonatas for clarinet and piano, op. 120, Vier Ernste Gesange for bass voice and piano, op. 121, and the Eleven Chorale Preludes for organ, op. 122. Beginning in 1883, Brahms also experienced the loss of many colleagues, friends, and family members with whom he had had close relationships. The world mourned the death of Richard Wagner early in 1883. Though Brahms did not whole-heartedly agree with his musical ideas he did respect his creativity and talent. Of Wagner he said, "Today we sing no more. A master has died." (Getzinger, p. 116) In July 1886, another genius of the New German School passed away. Brahms eulogized Franz Liszt with this description, "Whoever has not heard Liszt cannot even speak of piano playing. He comes first and then for a long space nobody follows". (Ibid, P.119) In the summer of 1891, within a few weeks of each other, Brahms lost his sister Elise as well as soprano and former sweetheart Elisabet von Stockhausen. In 1893, the lovely soprano, Hermine Spies died at a young age. The following year, three more dear friends were gone, one of them the staunch ally and champion of his works, conductor, Hans von Bulow. His passionate desire to compose began to wane a bit and he produced no new works in 1895. However, news of his dearest friend Clara Schumann's incapacitating stroke late in March of 1896 rekindled his desire to express himself through his music. Though sketches for a vocal work, a scriptural song-cycle, were begun in 1892 it was the inevitable reality of Clara's impending death which jarred his creativity once again. "For some reason the work did not progress until 1896, when under the pressure of Clara Schumann's illness it found the proper form as the "Vier ernste Gesange" (MacDonald, p. 377-378). Brahms completed the songs on May 7th. Clara passed away on the 20th. He recounted, "Now I have nobody left to lose" (Swafford, p. 612).
"These astonishing songs stand alone in Brahms' output, yet sum up much of what his music represents. They have sometimes been called the swansong of the German Lied, yet they are also a new beginning, bringing to the voice and piano medium a formal concentration and philosophical profundity from which many twentieth-century vocal masterpieces derive their ancestry. Moreover, as the final work he published, they occupy a powerfully symbolic position as premonitions of his own death, and testaments of the faith (in humanity, if not Divinity) that survives even unbelief (MacDonald, p. 378).

Famous Last Works: Mortality and Music in the Final Chorales Johannes Brahms und die Elf Chorale Vorspiele
84
INCARNATION AND IMMORTALIZATION
Johannes Brahms's remaining work, the set of Eleven Chorale Preludes. op. 122 for organ, were destined to evolve under equally symbolic circumstances. Inspired by 1) C. F. Peters' release of the first publication of the complete organ works of J. S. Bach in 1844-72) the intense interest in and study of early music .and polyphonic compositional techniques promoted by his mentor Robert Schumann 3) regular letter correspondence with Joseph Joachim and Clara Schumann which encouraged Brahms to actively pursue contrapuntal study and develop skills in organ technique and 4) performing on and writing music for the organ in solo and accompanimental situations, offered Brahms the hands on experience he needed to produce four early solo works for the instrument between 1856 and 1858 - 2 Preludes and Fugues, one in G minor and one in A minor, a Fugue in A-flat minor and the Chorale Prelude and Fugue on O Traurigkeit, O Herzeleid Brahms would not compose another piece for the organ for nearly forty years. After Clara's funeral, while at Ischl in late May and June, 1896, he started to work on the chorale preludes. But unknowingly his own physical health had begun to deteriorate. Cancer of the liver was diagnosed in September. He'd had many opportunities to ponder mortality in recent years. Now the inevitable reality of his death preoccupied his music, thoughts and processes. Many question why he returned to the organ as the musical medium for his final compositions.
These eleven preludes written at Ischl in May and June, 1896, are the composer's last completed work and his only posthumous publication. His genius when he wrote them was at its mellowest; his creative power, though now working on a small scale, still in trim; he authorized no dotages. Marked as he knew, for death, why did he turn to the organ? Surely because he had something to say which could best be said in its language. All instruments have the defects of their qualities; for some good musicians the organ's imperfect sensibility discounts its command of weight, volume and colour, and even its matchless sostenuto. But in its distinctive language Bach wrote realms of great music; Handel, Franck, and a host of composers far from negligible, endured its limitations. Clearly for Brahms, too, its virtues prevailed; or, with his artistic conscience, he would not have written for it. He held its language worthy of the things he had to say (Roberts, p. 104).
As a proponent of early music, a serious student of J. S. Bach and his works, a descendant of the North German Lutheran liturgical tradition, a follower of the German classic style, and a human being aware of the immediacy of his fleeting days, it makes perfect sense that Brahms should employ the organ and Lutheran chorales of the 16th century as a vehicle for his musical expression. In the op. 122, he ultimately proved his command of these types of settings. They are intimate personal genius in which the refined contrapuntal techniques of the Baroque masters are infused with the most uniquely Brahmsian elements of his mature musical vocabulary. Each chorale speaks eloquently for itself as his personal epitaph, unique in repertoire of music for the organ.
Elf Chorale Vorspiele, op. 122 (veröffentlicht 1902) 1. Mein Jesu, der du·mich zum Lustspiel ewiglich dir hast erwählet
(My Jesus, who has chosen me to share the eternal joy)
The first chorale prelude is the second longest in the set and by far the most complex texturally. Its model is that of a chorale fantasia, a rather improvisatory form of the chorale prelude cultivated by the three generations of composers of the early and middle Baroque North German Organ School (1) Scheidemann and Jacob Praetorius (2) Tunder and Weckmann (3) Bruhns, Buxtehude and Lübeck, Central German composer, Johann Pachelbel, and ultimately perfected by J. S. Bach who was by far the most powerful influence on Brahms' contrapuntal writing. "Such a work is enormously hard to do, but I am very interested in it, apart from the technicalities involved, especially for the sake of enhancing and beautifying the melody" (Owen, p. 89).

P. K. Miller IHART - Volume 16 (2011)
85
Johannes was fascinated with resplendent counterpoint throughout his life. Whether this piece originated in 1896 or is a reworking of an earlier draft has not yet been determined and may never be known for certain. Close analysis reveals it bears more similarities to Brahms' earlier organ work Chorale Prelude and Fugue on O Traurigkeit, O Herzeleid Wo07 of 1858 with its treatment of the unornamented cantus firmus in chant-like pedal tones. Indeed, in both the O Traurigkeit fugue and Mein Jesu der du mich, the chorale melody appears in the pedal in long notes. The chorale text expresses praise to God the Son for offering the joy of salvation to the believer who has accepted the gift of grace, referring to the afterlife, but in a hopefully optimistic manner. Textbook vorimitation technique in the manuals, which contains, specific motivic material of the melodic lines, prefaces each phrase of the chorale. "Such compositions can be broken down into a series of fughettas, each based on the chorale phrase that follows, and linked to the next by a brief episode. Mein Jesu consists of six such fughettas, the subjects of which enter alternately in the soprano and tenor lines. Brahms varies the treatment of each subject" (Owen, p. 90). He also chooses to notate a quieter registration or softer manual contrast for fughettas three and four, where the text states, you have chosen the one whom you have created… "Bach and Romanticism indeed seem to entwine in Brahms' treatment of the last two phrases [des grossen Brautgams Ruhm so gern erzählet], a literal translation of which is 'The great Bridegroom's praise thus gladly tell'" (Ibid, p. 91). Mein Jesu, which begins in e minor concludes majestically in E Major.
2. Herzliebster Jesu, was hast du verbrochen (Dearest Jesus, what crimes have you committed?)
"No other prelude of the sedes assimilates Bach's music so completely; no other is such perfect organ music." (Roberts, P.109) It is not known why Brahms chose to pencil in the text of Herzliebster Jesu over the soprano cantus firmus of this chorale prelude but not the others1. This was a rather familiar Passiontide melody. Today, it can be found in many hymnals as Ah, Dearest (Holy) Jesus, how hast Thou offended. Indeed it appears in J. S. Bach's St. John and St. Matthew Passion (the latter Brahms conducted in the 1875 concert series of the Gesellschaft der Musikfreunde). Coincidentally, the St. Matthew Passion also includes settings of the melodies used in several other Brahms Chorale Preludes, specifically nos. 3, 9, 10, and 11. Some have identified the Brahms, op. 122 Chorale Preludes as the OrgelBüchlein of the Romantic period. Others have compared Herzliebster Jesu with the first chorale setting in Bach's OrgelBüchlein collection, Nun komm, der Heiden Heiland. Both works employ an ascending second/descending fourth motif to conclude each chorale phrase. The text is a reference to Christ's sentencing to death by Crucifixion at the hands of Pontius Pilate. The suffering of Jesus is depicted in the manuals by rising and falling groups of three eighth-note sighs spaced by an eighth rest while in the bass (pedal line), descending half note minor seconds and jagged eighth/quarter note, tritone and perfect fifth, downward leaps portray the lament of His suffering and death. A quieter manual change suggested by a softer dynamic marking (Brahms' own) contrasts the third line of the chorale, "Was ist die Schuld? In was für Missetaten (What is Your guilt; for what must You confess?) with phrases one, two and four."The flowing lines and expressive chromaticism make it clear that this is no pale imitation; this ability to successfully cast new music

Famous Last Works: Mortality and Music in the Final Chorales Johannes Brahms und die Elf Chorale Vorspiele
86
in old forms was a unique aspect of Brahms' genius" (Owen, p. 93). Once again, we cannot be certain if Herzliebster Jesu was sketched at an earlier date and revised in 1896 or if it was conceived as a brand new composition for the collection.
3. O Welt, ich muss dich lassen (O World, I must forsake Thee)
Brahms set this chorale twice in the op. 122 preludes in nos. 3 and 11. The melody is associated with both a sacred (O Welt, ich muss dich lassen) and a secular text (Innsbruck, ich muss dich lassen) as well as an isometric and an irregular rhythmic pattern. The secular text was created first by Heinrich Isaak and published in Nurnberg in 1539. It was typically sung using the irregular rhythmic structure. The sacred text, though it does address spiritual matters related to the finality of our earthly life, does so in the context of hope and entrusting the hereafter to a loving God. It appeared in Protestant hymnals in 1598 and was adapted to the isometric version by J. S. Bach and others. Brahms, however, chose to combine the sacred text with the irregular rhythm in no. 3 and the sacred text with the isometric version in no. 11. This could explain why in the brief nineteen bars of the first setting, Brahms shifts between duple and triple meter a total of ten times while in the second, he remains in common time throughout. The melodic characteristics of no, 3 bear numerous similarities to the chorus which concludes the opening part of Bach's St. Matthew Passion and O Lamm Gottes Unschuldig but is even more analogous with the opening section of the seventh movement of Brahms' own Deutsches Requiem, sharing the same F Major tonality as well as the undulating groups of paired eighth notes in the accompanying figures. As in Herzliebster Jesu, the cantus firmus appears ever-so-sparingly ornamented in the soprano voice which uses only slightly longer note values. Whispers of vorimitation prefigure each line of the chorale and the impulse of the sigh motive which is first introduced in measure five is fully developed in the third phrase which states, "ins ew'ge Vaterland" (into my Father's land). A quieter manual change is possible during the rest in measure 13 but not critical (no dynamic marking is indicated by Brahms). If a softer registration is used, it should be tactful and not an extreme contrast. The final cadence is typically Brahmsian, as the soprano, tenor and bass voices sustain the root of the tonic chord, while the inner voices surround it with chains of ascending and descending thirds in contrary motion. Brahms uses this technique as the final cadential formula of nos. 2, 6, and 7 as well.

P. K. Miller IHART - Volume 16 (2011)
87
4. Herzlich tut mich erfreuen (I Rejoice with Heartfelt Pleasure)
As in O Welt, ich muss dich lassen, Herzlich tut mich erfreuen traces its origins to both sacred and secular texts from the mid-1500'S. Brahms uniquely combines his passion for chorale and folk song in this, the most exuberant of the op. 122 chorales. The secular text is a panegyric to the lovely month of May, the time of late spring's full flowering. It is filled with descriptions of birds, flowers, trees and the joy of nature in all its grandeur. Perhaps Brahms chose to set this melody because it wistfully recalled fond memories coinciding with the month of his own birth. In any event, it represents the final expression of his zealous love of nature. The sacred text begins with the same first sentence as the secular version but instead divulges an escatological exegesis of Rebirth and Springtime. "And I saw a new heaven and a new earth; for the first heaven and the first earth had passed away, and the sea was no more" (Revelation 21:1, KJV). The last phrase of the first verse poetry states "all Kreatur soll werden, ganz herrlich, hübsch und klar" (all creation shall become completely bright, beautiful and pure). Brahms' setting represents a "signal triumph over depression [in which he] attunes his mind to the blithe melody and the swing of the chorale that started life as a folk-song telling of the joys of summer" (Roberts, p. 108). Brahms copied both versions of this melody as a young student. The manuscripts in his own hand have been preserved. His earliest folksong settings date back to the 1850'S. Therefore, the likelihood that this chorale was conceived prior to 1896 is a strong possibility. However, his use of descending arpeggiated patterns reflects the pianistic style of the op. 116-119 Klavierstucke combined with the deep artistic satisfaction of keyboard improvisation. These figurations are similar to those Bach used in his OrgeIBüchlein setting of Ich ruf zu Dir, Herr Jesu Christ. Vorimitation with a single motive in the tenor line, in the dominant, prepares the first two chorale phrases while the third vorimitation, also in the dominant, infuses the subject material in the tenor with inversion in the alto. "The introduction to the final phrase, in the subdominant, breaks the pattern with the melodic phrases outlined by legato slurs in the upper line. Here the broken chord accompanimental material, with its skipping, off-the-beat tenor part and rests under most of the strong beats, serves to further emphasize the melodic line ... " (Owen, p. 97). Manual I should be employed for the actual presentations of the chorale, as they are marked forte and contain the only pedal writing in the piece. It is entirely possible that Brahms intended this chorale for an instrument with three separate divisions.

Famous Last Works: Mortality and Music in the Final Chorales Johannes Brahms und die Elf Chorale Vorspiele
88
5· Schmücke dich, o liebe Seele (Thee adorn, o dearest Soul)
The sacred Lutheran Communion chorale which Brahms set for no. 5 is attributed to Johann Crüger and is found his 1649 publication Geistliche Kirchen Melodien (sacred church melodies). Schmücke dich is still included in a majority of Protestant hymnals. The text has both a rhythmic and an isorhythmic version. Brahms uses the latter form for his setting. The harmonic texture is three-part with the chorale tune in the soprano in long, steady quarter notes over a peaceful, quietly undulating, delicately woven two-part contrapuntal fabric of eighth and sixteenth notes in the alto and bass voices. The melody is figuratively and "literally adorned with added polyphonic voices which imitate the opening phrase throughout in diminution and inversion" (MacDonald, p. 380).
Chorale writing in this style is reminiscent of Bach's OrgeIBüchlein setting of Jesu, Meine Freude (Bach, however, used a four-voice texture) but has its origins in the mid-seventeenth century works of Scheidemann and Scheidt (about the time of Crüger's tune) and later in the chorale settings of Johann Pachelbel. Fragmentation and diminution of the cantus firmus ornament the lower two voices throughout, and the final cadential formula contains an introspective use of syncopation, inversion, contrary motion, and the brief appearance of a fourth voice which conclude the prelude in a quiet stillness.
Schmucke dich is a manualiter composition to be specifically performed on a single manual without pedal. Brahms did not intend for the chorale tune to be highlighted on another division or in the pedal, nor was the setting conceived as a trio-sonata. The fermata at the end of each phrase implies an opportunity for a poetic lift or breath space rather than a stop and hold. This chorale provides no references to grief, suffering, death, or afterlife, only that Brahms' setting is twenty-one measures in length (a multiple of the spiritually significant number 'seven').
6. O wie selig seid ihr doch, ihr Frommen (O how blessed are you, then, you Faithful Ones)

P. K. Miller IHART - Volume 16 (2011)
89
Brahms often paired his compositions. Quite frequently they were diametrically opposed. "Thus there were, only a few years apart( two sextets, two quartets, the two most famous sets of piano variations, two orchestral serenades, two sets of vocal waltzes, two overtures (the Tragic and the Academic Festival), two clarinet sonatas, two piano quartets, two symphonies [and then two more]. As he wrote the first, he seemed to get interested in the problems and they overflowed into a companion work. He kept this habit up to the very end" (Schoenberg, p. 286). The fact that Brahms set two consecutive preludes (nos. 5 and 6) from Johann Crüger's 1649 Geistliche Kirchen Melodien, might indicate that these two pieces were composed at about the same time. The pair illustrates an obvious contrast of styles but a marked similarity of other musical elements. Parallels of Schmücke dich and O wie selig include, 1) both pieces are for manuals only (except for the tonic pedal point at the final cadence in O wie selig - just as a point of reference, the use of a 16' pedal stop here is totally out of character as is any attempt to solo out the melody in the pedal or on another division). 2) the use of a fermata over the last chord of each chorale phrase (see p. 19 which appears in none of the other chorale settings. 3) the absence of slurs or phrase markings. 4) the use of the word dolce to describe the composer's wishes for dynamic shading and expressive color. Only no. 6 contains the tempo marking molto moderato. O wie selig seid ihr doch, ihr Frommen is the shortest setting in the Eleven Chorale Preludes. Its fourteen bars (another possible reference to the number seven) are resoundingly tonal despite the intensity of chromatic expression Brahms uses to color his descriptions of the words 'selig' (blessed), 'Tod' (death), 'entgangen aller Not' (released from all trials and suffering) and 'die noch uns halt gefangen' (which still hold us captive) This hymn was often sung on All Saints' Day (historically, November 1st in the liturgical calendar) because it identifies the souls of the departed as the Faithful Ones. This chorale reminds us once again of the text from the seventh movement of A German Requiem, 'Blessed are they that die in the Lord', "and Brahms provides an unbroken stream of pastoral 12/8 in contemplation of a paradisal state that appears very nearly to be a static, featureless Nirvana" (MacDonald, p. 380). Indeed, Crüger's chorale and J. S. Bach's harmonization are in 4/4 time, but Brahms' setting is in 12/8 meter so that he might adorn the dotted half and dotted quarter note cantus firmus with chains of ascending and descending triplet thirds, much as he did in the O Traurigkeit prelude. The hemiola figures in the last three measures heighten the climax of the last line of the chorale which is an ascending melodic minor scale. Brahms' crescendo in the same bars would seem to indicate performance of this prelude on a division under expression and the gradual opening of the swell shades.
7. O Gott, du frommer Gott (O God, Thou faithful God)
o Gott, dufrommer Gott, like nos. 5 and 6, is a manualiter chorale setting. It is written primarily in three-voice texture for the first fifty measures, four-voice texture for the next seven, and expanded to six-part writing with the bass line placed in the pedal for only the remaining five bars. The text does not describe or allude to any hint of pain, sorrow, or death. Rather it is an exhortation to a chaste, Godly and healthy life. The chorale is a hymn of praise traditionally sung during the Trinity season. The

Famous Last Works: Mortality and Music in the Final Chorales Johannes Brahms und die Elf Chorale Vorspiele
90
melody from the Neu Ordentlich Gesang-Buch (1646) and the harmonization by J. S. Bach are the basis of this op. 122 prelude. Bach composed a set of nine partitas on this hymn early in his life, BWV 767. It is likely that Brahms was familiar with this work. "It is one of the more complex and extended pieces in the set and is rich in the contrapuntal devices of imitation, diminution, and inversion."(Owen, p. 101) Brahms' alternate placement of the dynamic markings forte and piano in his score as well as his indication of Manual II at the first diminutive entrance prescribes that two contrasting divisions will interplay throughout. Motivation for this type of formal structure may well have been influenced by the alternatim practice of the Renaissance and Baroque era which intentionally alternated voices and organ in phrases of the Mass in the Roman liturgy and in the verses of hymns and settings of the Magnificat in the Lutheran tradition. "To our certain knowledge it was employed as early as the fourteenth century and continued until the early years of the twentieth. It is essential to understand that the practice was not one in which the organ provided preludes, interludes, and postludes, leaving the liturgical text complete; rather it was a practice in which half the text was subsumed by the 'versets' played by the organist, and where therefore the organ was an essential partner in the complete presentation of the text‖ (Thistlewaite & Webber, p. 132). In Brahms' setting, the forte introduction, interludes and final phrase of the chorale depict the organ 'versets' and the intervening piano phrases represent the 'congregational singing'. In the lengthy introduction a recurring descending sigh motive of a minor third (which occasionally ascends) accompanies the vorimitation - the first four notes of the first phrase. This material is presented forte on Manual I and repeated piano on Manual II. The first two phrases of the unornamented chorale melody are indicated on the quieter division and by the word 'Chorale'; but the interludes are to be played on the fuller manual. This section is then repeated in its entirety. The second section begins with austere trombone quartet-like chords (reminiscent of movements from Brahms' first and third symphonies.) The ensuing chorale phrases are alternately placed in the tenor, then in the soprano voice. Perhaps this is the reason Brahms felt it necessary to pencil in the word 'Chorale' at the appropriate entrances. This should not, however, compel the performer to isolate the chorale tune from the rest of the texture. This does a great disservice to the music. Rather, careful phrasing and articulation, a keen listener's ear, and an attention focused on the melody will result in the most successful presentation of the cantus firmus bathed in the other voices of the texture. The statement of the final phrase of the chorale is assigned triumphantly to Manual I and pedal with the soprano and bass moving steadily in half notes, and the four inner voices combining in a group of three-eighth note sigh motive very similar to the one in the alto and tenor voices of no. 2, Herzliebster Jesu.
8. Es ist ein Ros' entsprungen (A Rose has sprung Forth)
Perhaps the best known and most loved chorale prelude in the collection is Brahms' setting of the familiar carol Es ist ein Ros' entsprungen (Lo, how a Rose e'er Blooming). Initial documentation indicates its original source is the Speirisches Gesang-Buch (1599) Brahms uses the Michael Praetorius harmonization (1609) for his setting of the chorale. "[It] again shows us a Brahms free from preoccupation from his coming fate. A pure miniature, twenty bars without pedals, it is set to a rhythm more gracious and flowing than Praetorius could command. Round the tune a tissue of leaning-notes is woven, tender as the stalks of flowers. And over the sequence of soft harmonic clashes, which give savour to the texture, new blooms of melody appear ... " (Roberts, p. 108).

P. K. Miller IHART - Volume 16 (2011)
91
It is unique in the op. 122 in that it is the only hymn chosen to represent the Advent/Christmas season, the only musical example with primarily homophonic texture, and the only chorale which Brahms set that does not follow the intended phrase structure of the original melody. The melodic outline of the four phrases of Es ist ein Ros' ent sprungen is AABA. Brahms, rather, chose to repeat the last two lines of the chorale as well, which results in an AABABA structure. The tune is ingeniously concealed in an inner voice. The repeat of each section is clothed with a slightly different harmonization each time. Historians argue over the date of this piece. Some are convinced it was the last chorale Brahms composed. Others say it was among the earliest of the set. Brahms had a particular love of the Christmas season but Es ist ein Ros is his only purely instrumental Christmas offering. Moreover, if this chorale prelude is in fact an early work, it may well be the earliest example of an organ prelude based on this well-loved sixteenth century melody. Many have been composed since, but for Brahms to have chosen it when he did, alongside the more standard chorale prelude subjects that he set, only adds to its mystery" (Owen, p. 104). Though Brahms himself indicates Manual I and II, the distinctions of sound quality should be of color rather than dynamics. A solo 8 foot flue of contrasting timbre on each division is recommended for the manual changes with the repeated echoes of melodic material relegated to the quieter Manual II. This is the last of the chorale preludes subjected to cantus firmus tampering over the years since the 1902 publication date. All temptations to highlight the melody on a louder stop or division or transpose the chorale melody to the pedals should be avoided.
9 and 10. Herzlich tut mich verlangen (9. Isometric Version)
(10. Rhythmic Version)

Famous Last Works: Mortality and Music in the Final Chorales Johannes Brahms und die Elf Chorale Vorspiele
92
Brahms apparently planned double settings for the final three chorales of the collection. Nos. 9 and 10 are an intentionally contrasting pair set to the melody of the sacred chorale Herzlich tut mich verlangen. The verse which Brahms chose admits a weariness of the mundane existence of life and longs for a peaceful release in the hope of a blessed end. Later associated with Paul Gerhardt's Passion Chorale, O Haupt voll Blut und Wunden it can be found in the hymnal of nearly every denomination as O Sacred Head Surrounded or Now Wounded. Brahms used both the isorhythmic (no. 9) and the rhythmic (no. 10) versions for his renditions of the chorale. Stylistically and texturally, the two chorale preludes are vastly different. The former presents the melody with ornamentation in the soprano in a polyphonic setting. The latter casts the unaltered cantus firmus in long notes in the bass (pedal) in a predominantly chordal texture. No. 9 begins in the same manner as no. 7 with a mournful, solitary E5 to A5 perfect 4th in the soprano. The bass line also resembles Herzliebster Jesu with its recurring eighth-quarter note rhythmic pattern in the pedal. In no. 2, the figure is represented by the melodic interval of a tritone or perfect 5th, in no. 9 it is an ascending (or occasionally a descending) minor 2nd. The first setting of Herzlich tut mich verlangen also resembles Herzliebster Jesu in that its third phrase is conceived in a slightly different texture and hints at employing another division or at least a contrasting color shading. A manual change is not specifically indicated by the composer, but forte versus piano dynamic markings, a meter signature shift from 4/4 to 6/8 (and back again) and eighth rests between sections would certainly suggest that approach. In addition, both chorales use the contrapuntal techniques of motivic repetition throughout and direct inversion, specifically for no. 9 in bars one, five and twelve. This three-eighth-note melodic gesture resembles a similar germ in the inner voices of Herzliebster Jesu as well. Brahms' forte dynamic indication for chorale phrases one, two, and four should not be taken by the performer as a carte blanche statement to register these sections using full organ. A robust 8' and 4' principal and a contrasting, quieter 8' and 4' color on a different division would be more in keeping with the composer's sentiments. In the second treatment of Herzlich tut mich verlangen Brahms spins for us a restless, undulating sixteenth note pattern of 'verlangen' (unfulfilled desire, longing) in the right hand throughout and in the left hand for chorale phrase one in measures 3-5 and the note-for-note repetition of chorale phrase two in bars 8-10. The manual counterpoint in these same measures demonstrates a clever use of the 'Krebs' technique. The cantus firmus is in unornamented long notes in the pedal. Because the composer specifies a solo 8' stop for this line, the chorale tune most often is found in the middle of the texture. Perhaps the most impressive sociological lament symbolism used in any of the preludes is the steady, repeated bass notes found in the lowest manual voice. By far, the relentless A3 in bars 3-4, 7-10, and 16-18 is grimly gripping, representing so clearly for Brahms and myself "the Totentrommel - the drumbeat that for centuries set the pace for German funeral processions" (Owen, p. 109). The quieter middle section is only slightly less mournful with lighter colors and less dense textures. Similar, but in metric mirror to no. 9 is the time signature shift from 6/4 to 4/4 in bar 12 and back to 6/4 again in bar 17.
11. O Welt, ich muss dich lassen (see no. 3)
In Brahms' second setting of O Welt, ich muss dich lassen, we are presented with one last glimpse of the composer's inner world. It is a valedictory statement that surmises his beliefs, philosophy, and humanistic approach to earthly life in the most strictly homophonic setting of the collection. Brahms' sketch (never completed in final form) indicates performance on a three-manual organ, each manual change from forte to piano to pianissimo echoing a picture of forsaking this life but mixed with a fleeting desire to remain. "But it was indeed time to leave the world, and O Welt, ich muss dich lassen was, with moving and perhaps conscious appropriateness, the last music Brahms ever wrote. Whether or not he realized how short a span was left to him before he must personally confront the mystery of death, in the Chorale Preludes he had created - in a form so time-hallowed it was almost impersonal- a uniquely personal testament to his craft, his historical insight, and his passionate belief in the spiritual value of his art" (MacDonald, p. 381).

P. K. Miller IHART - Volume 16 (2011)
93
Prelude No. 11 - Brahms' last composition.

Famous Last Works: Mortality and Music in the Final Chorales Johannes Brahms und die Elf Chorale Vorspiele
94
BIBLIOGRAPHY
Works cited in this paper: Avins, Styra. Johannes Brahms: Life and Letters. Oxford, England, 1997 Geringer, Karl. Brahms: His Life and Work. New York, 1982 Getzinger, Donna and Felsenfeld, Daniel. Johannes Brahms and the Twilight of Romanticism. Greensboro, North Carolina,
2004 Herl, Joseph. Neither Voice nor Heart Alone: German Lutheran Theology of Music in the Age of the Baroque. University of
Illinois, 1994 MacDonald, Malcolm, Brahms. New York, 1990 Miller, Max. The Brahms Chorale Preludes: Master Lesson. American Organist, 13/4 (April 1979): 43-47 Minear, Paul. Death set to Music, Atlanta, 1987 Musgrave, Michael. A Brahms Reader, New Haven, CT, 2000 Owen, Barbara, The Organ Music of ,Johannes Brahms, Oxford, England, 2007 Roberts, W. Wright. Brahms: The Organ Works. Music and Letters, 14/2 (April 1933): 104-111 Schauffler, Robert Haven. The Unknown Brahms. New York, 1940 Schoenberg, Harold C. The Lives of the Great Composers. New York, 1970 Swafford, Jan. Johannes Brahms: A Biography. New York, 1997 Thistlewaite, N. & Webber, G, The Cambridge Companion to the Organ. Cambridge, England, 1986
DISCOGRAPHY
Recordings referenced in this paper: Kevin Bowyer. Brahms: Complete Organ Works, Organ of Odense Cathedral (Nimbus NI5262) Rudolf Innig. Johannes Brahms Samtliche Orgelwerke. Klais-Orgel von St. Dionysius in Rheine (Musikproduktion Dabringhaus
und Grimm MD + G L 3137) Kurt Rapf. Brahms: The Complete Works for Organ. Grand Organ of the Ursulineklosters of Vienna (Turnabout Vox TV-S 34
422) Ernest White. Eleven Chorale-Preludes op. 122. The Church of St, Mary the Virgin, NY (Mercury MG 10070

V. Freeman and J. Klein IHART - Volume 16 (2011)
95
BUILDING A GREENER SCHOOL WITH LEED CERTIFICATION
Virgil Freeman1 and Jeff Klein2 1Northwest Missouri State University, USA and 2Park Hill School District, USA
ABSTRACT
The purpose of this study was to investigate the Green school. Specifically, a sustainable school is going to use less energy and is going to cost less in the long term. If you are saving money on your operational costs, you then have more money to spend on teacher salaries, technology, and equipment in the school. A ―Green school‖ provides an environment that is more conducive to learning with better lighting and acoustics that will allow for better communication and more effective engagement with technology. Technology is important to a green school because it allows the building to educate us about how that building is being green. If you have more information about what your building is doing you may be able to change behavior. Parents and patrons of school districts are demanding green buildings in their districts. They want that healthier environment for their children and the students of the district. Parents are looking for the schools to be in a green environment. There is not a school district in the nation that is not pressed in some fashion for its operating dollars. They are not going to be funded in the regular way. Everybody is going to have to do business in a different paradigm and the superintendents and business officials in our school districts are looking at the connection to ―Green schools‖ as a way to make savings of value to everyone involved with the school district.
BUILDING A GREENER SCHOOL WITH LEED CERTIFICATION
When school administrators and school boards find themselves in the position of building a new school, one question they are increasingly likely to face is: Should we build green? Agron stated in 2006 that ―more institutions are incorporating into their projects principles of sustainability, energy efficiency, and environmental stewardship‖ and that LEED certification ―has been growing in influence among schools and universities‖ (p. 6). This trend has continued, particularly for LEED certification. Korte (2010) recently said that ―an increasing number of districts and campuses require LEED certification for major construction projects.‖ (p. 32). Green construction is certainly becoming more and more common for school construction, and increased availability of green products and green building expertise has made doing so easier and more cost-effective. (Gutter and Knupp, 2010; Wilkinson, 2009) What is LEED? According to the United States Green Building Council (http://www.usgbc.org), the organization that administers the LEED program:
―LEED is an internationally recognized green building certification system, providing third-party verification that a building or community was designed and built using strategies aimed at improving performance across all the metrics that matter most: energy savings, water efficiency, CO2 emissions reduction, improved indoor environmental quality, and stewardship of resources and sensitivity to their impacts…LEED is intended to provide building owners and operators a concise framework for identifying and implementing practical and measurable green building design, construction, operations and maintenance solutions.‖
Although LEED was not originally focused on elementary and secondary schools, recent versions of LEED have included the LEED for Schools Rating System which has specific criteria that considers the unique characteristics of schools. For example, specific issues that LEED for Schools focuses on include site assessment, classroom acoustics, mold prevention, and master planning. As of August 2010, 303 schools were LEED certified and 1707 were registered for potential certification (Gutter and Knupp, 2010). LEED (Leadership in Energy and Environmental Design) began in 2000, following a pilot program that started in 1998 which was used to determine how the rating system should be developed. The original requirements were revised and released as LEED version 2 in 2005, now with incorporation of specific certification for K-12 schools. The current version 3 of the LEED measurement and rating system (called LEED 2009) was released in 2009. With each new revision, the requirements for certification have become more comprehensive and rigorous. As a result, it is more difficult for a school to achieve certification than it was in 2000.

Building a Greener School with LEED Certification
96
LEED certification can be achieved in nine different categories that have been expanded with subsequent revisions so that LEED 2009 includes: LEED for New Construction LEED for Core & Shell Development LEED for Schools LEED for Retail: New Construction and Major Renovations LEED for Healthcare LEED for Retail: Commercial Interiors LEED for Existing Buildings: Operations & Maintenance LEED for Neighborhood Development LEED for Homes
For each certification category there are now 100 points possible with 10 additional points for innovation and regional concerns (http://www.usgbc.org). Of these 100 points possible, 40 are required to achieve basic certification. Projects need to earn at least 50 points to achieve Silver certification, 60 points for Gold certification, and 80 points for Platinum certification. Although there are 110 total points possible, very few projects have the possibility of achieving all points due to varying circumstances associated with each project. Research by the United States Green Building Council has demonstrated multiple types of benefits reaped from LEED certification. USGBC research indicates that LEED certification results in schools that are ―healthy for students, comfortable for teachers, and cost-effective‖ (http://www.usgbc.org). Environmental benefits are central to the criteria. ―A LEED certified building is designed to save energy, use water efficiently, reduce carbon-dioxide emissions, improve indoor environmental quality, and promote stewardship of natural resources‖ (Korte, 2010, p. 35). Agron (2006) states that LEED certification has a ―positive impact on occupant health and performance, energy expenditures, life-cycle operation and maintenance costs, and the environment‖ (p. 6). Gutter and Knupp (2010) report that ―improved acoustics, good indoor air quality, and thermal comfort have been shown to improve performance, reduce absenteeism, and increase productivity‖ (p. 13). Research has also made a connection between greener schools and improved student learning. ―Green school facilities function as living laboratories for project-based learning, increasing students‘ environmental literacy and encouraging them to explore the connectivity between nature and the built environment‖ (Gutter and Knupp, 2010, p. 16). LEED certified schools are believed to result in a better learning environment for both teachers and students. Benefits are recognized by some patrons as well. In some cases, LEED certification may be a deciding factor for individuals seeking to locate their residence or business in a school‘s attendance area. Gutter and Knupp (2010) say that green schools have a ―triple bottom line.‖ The three prongs of benefit are people, planet, and prosperity. The connection between LEED certification and occupant health, as well as conservation of resources, is well-accepted. However, agreement is less common regarding the costs and payback of LEED certification, particularly for gold and platinum levels. According to Korte (2010), ―Many institutions still object to LEED certification because they believe it will cost more to construct and certify‖ (p. 32). Experts on green construction indicate that there are many no-cost or low-cost energy savings strategies that will earn LEED points and have a payback within three to five years (Wilkinson, 2009). Agron (2006) indicates that many LEED principles will add little or no cost to construction but will improve performance and save money in the long run. Gutter and Knupp (2010) are even more aggressive, saying that green schools have ―costs comparable to conventionally designed schools within the same region‖ (p. 12). Once the school is built, it begins to yield financial benefits. ―Green schools use up to 50 percent less energy and 40 percent less water than their conventional counterparts and divert thousands of tons of waste from landfills‖ (Gutter and Knupp, 2010, p. 13). The United States Green Building Council claims that a new LEED certified school saves an average of $100,000 in operating costs (http://www.usgbc.org). However, not all professionals are as aggressive in their claims about the financial payback. Korte (2010), a LEED certified professional, states that LEED certified schools may come in under budget or may cost one to two percent more, which may be recouped either completely or partially with a few years. While some green school advocates indicate that all costs associated with greening a school will be recouped, many industry professionals suggest that some green school strategies will never have a financial payback (K. Horner, personal communication, January 13, 2011). To be fiscally responsible, the same principles that are used to manage construction budgets for conventional construction need to be used when designing and building a LEED certified building (Korte, 2010).

V. Freeman and J. Klein IHART - Volume 16 (2011)
97
As with any project, success results from effective management of the project. District leadership needs to commit to LEED certification from the beginning (Korte, 2010). For example, Chicago Public Schools has committed to LEED certification for all of their new schools and renovations (Gutter and Knupp, 2010). Districts will need to work with designers and construction managers that are experienced with LEED projects in order to get the maximum benefits without excessive costs. The contractor plays a large role in the success of a LEED project. Many of the LEED points and efficiencies come directly from the work done by the contractor (Korte, 2010). For school districts that are new to green construction, Gutter and Knupp (2010) suggest starting with a smaller scale pilot project such as a renovation or a smaller school. Celebrating success from the pilot project can create a sense of confidence for future LEED projects. For those with limited funds to invest in greener buildings, Gutter and Knupp (2010) suggest a paid-from-savings approach. Savings from no-cost or low-cost energy efficiency efforts can be banked for investment in additional energy efficiency strategies. As paybacks continue to be cashed in, larger projects such as a LEED certified new school can be funded out of savings. The United States Green Building Council provides a variety of resources for schools wanting to reduce energy usage and operating costs, regardless of their interest in pursuing LEED certification. One resource is the Existing Schools Toolkit, which provides self-assessment tools and guidance for improving existing buildings (U.S. Green Building Council, 2011) While there are other green building standards that can be used, LEED certification offers school districts an internationally-recognized stamp of approval. Although a lack of consensus exists about the nature and timing of the financial payback, it is clear than many of the points earned in the LEED system have either a neutral or positive long-term financial impact. In addition, benefits for students, teachers, and the overall learning environment are well supported. Ultimately, it is the role of the superintendent to take the lead in planning for financial efficiency and energy stewardship. The superintendent can create a culture that supports energy conservation and responsible behavior, a culture that communicates to taxpayers that their funds are in good hands. For many school superintendents, LEED certification is part of that culture.
REFERENCES
Agron, J. (2010) LEEDing the way. American School and University, 78(11), 6. Gutter, R. & Knupp, E. (2010) The road to a green district. School Administrator, 67(7), 12-18. Korte, D. (2010) Planning green. American School and University, 83(2), 32-35. Wilkinson, R. (2009) Fitting LEED certification into a capital plan. American School and University, 81(12), 19-21.
R. L. Poulson, J. T. Smith, D. S. Hood, C. G. Arthur and K. F. Bazemore IHART - Volume 16 (2011)
98
THE IMPACT OF GENDER ON PREFERENCES FOR TRANSACTIONAL VERSUS TRANSFORMATIONAL PROFESSORIAL LEADERSHIP STYLES:
AN EMPIRICAL ANALYSIS
Ronald L. Poulson1, Joy T. Smith1, David S. Hood2, Christon G. Arthur3 and Kimberly F. Bazemore1
1Elizabeth City State University, USA, 2North Carolina Central University, USA and 3Andrews University, USA
ABSTRACT
The present study examined whether women or men reported a higher evaluation of and appreciation for transformational leadership style versus transactional leadership style among their college professors. Data obtained from an ―accidental‖ sample consisting of 233 students was analyzed. Results revealed that women tended to rate characteristics associated with transformational leadership style higher than did men. However, both men and women tended to show a higher evaluation of and appreciation for the transformational approach to college instruction as opposed to the more traditional transactional approach. Implications of findings and future research are discussed. Keywords: Transformational, Transactional, Leadership, Gender, Education.
INTRODUCTION
There has been an increase in the number of studies (e.g. Bolkan & Goodboy, 2009; Chory & McCroskey, 1999) designed to examine the relationship between students‘ academic performance and teachers‘ classroom leadership style. This line of research is built upon the idea that classrooms represent a type of organization structure and are therefore amenable to the principles of organizational leadership (McCroskey, 1992). Much of the research conducted on organizational leadership has focused on ‗transactional‘ versus ‗transformational‘ leadership styles (Hood, Poulson, Mason, Walker & Dixon, 2009). At present, researchers are linking teacher leadership to a number a factors including student performance (Bolkan & Goodboy, 2009). For example, Pounder (2003) concluded that student instruction and performance is clearly affected by the teachers‘ style of leadership. And, Stewart (2006) concluded that students‘ performance on tests has traditionally been viewed as an indicator of the quality of classroom instruction and leadership style. To this end, the present study seeks to examine the relative preferences held by each gender for the two styles (transactional versus transformational) of professorial leadership. Understanding the impact of each style of leadership may make it possible to shape the classroom experience and enhance the performance and the retention rate of students.
I. TRANSFORMATIONAL AND TRANSACTIONAL LEADERSHIP STYLE
Leadership at its most basic level can be categorized as transformational or transactional in nature (Burns, 1978). Most of the existing research draws the conclusion that transformational leaders also are individuals who possess a great deal of charisma, vision, intellectual stimulation and creativity (Komives, 1991). Therefore, the professor in a transformational classroom setting is expected to be dynamic, flexible, stimulating, and encouraging (Bolkan & Goodboy, 2009; Hood, et al. 2009). The professor who employs a transformational leadership style will challenge students intellectually to find new solutions to existing problems, and seek to increase the ambitions of those they instruct, empowering them to attain personal goals and expected outcomes (Bass, 1985; Burns, 1978; Harter & Bass, 1987; Komives, 1991; Roueche, Baker, & Rose, 1989; Tichy & Ulrich, 1984). Rewards in a transformational system are more likely to be intrinsic, such as goal achievement or internal feelings of empowerment and self-improvement (Bolkan & Goodboy, 2009). Transactional leaders are believed to have a greater impact on the ―skill set‖ of followers (Komives, 1991; House, Woycke & Fodor, 1988). Transactional leadership is grounded in the concept of bureaucratic authority and authenticity (Burns, 1978; Hinkin & Tracey, 1998). Burns (1978) reported that transactional leaders focused more on course work, task-oriented goals and work standards. Additionally, transactional leaders place their energies on ensuring that students complete assignments and comply with the demands of the organization (Hinkin & Tracey, 1998; Hood, et al, 2009). Burns (1978) also found that in systems that subscribe to the transactional theory of leadership, factions (i.e. students) are rewarded for their performance on tests, assignments and projects with a high letter grade. In a transactional system, rewards are extrinsic and may come in the

R. L. Poulson, J. T. Smith, D. S. Hood, C. G. Arthur and K. F. Bazemore IHART - Volume 16 (2011)
99
form of positive ratings or grades or exemptions from tasks viewed as undesirable. For example, instructors may exempt students from taking a final exam because of their performance on assignments throughout the semester (Hood, et al., 2009). Burns (1978) findings were also supported in later work by Stewart (2006) who concluded that dedicated and successful professors in an organization that embraces transactional leadership are often rewarded with an increase in salary, tenure, and promotion. The transactional leadership model, according to Stewart (2006), is grounded in the process of the professor establishing, evaluating and modifying measurable goals and objectives with minimal input from the individuals responsible for completing the work. A relevant example of this in practice is the course syllabus, which is traditionally developed in isolation by the professor with little input from the actual students who will be taking the course (Hood, et al. 2009; Leithwood, 1992). According to Stewart (2006), the central purpose of the syllabus is to ensure that students work assiduously to ensure that their efforts meet expectations of the established objectives. For that work, they are rewarded with good grades, which contribute to high GPAs – a well recognized sign of their academic success (Stewart, 2006). Those GPAs are then used, in part, to secure graduate school admission, and in turn, future economic stability. This external value of GPAs ensures that students work zealously to meet the expectations established in course syllabi (Stewart, 2006). The core principles of transactional leadership are centered on followers (i.e. students) working to meet predetermined expectations to circumvent penalties (e.g., low grades and low GPAs) (Hinkin & Tracey, 1998; Hood, et al. 2009; Leithwood, 1992; Stewart, 2006). Professors who embody the transformational style of classroom leadership assist students in understanding the importance of assignments, courses and the college experience as well as their relevance to the students‘ present life situation and the impact on their future and even their children‘s future (Hallinger, 2003). Kinkead (2006) concluded that transformational leaders legitimately seek to benefit followers and believe that higher education presents the best forum for doing so. Transformational leadership is believed to produce benefits for both the leader and follower; leaders are transformed into change agents and followers are developed into leaders (Bass, 1990; Burns, 1978; Leithwood, 1992; Stewart, 2006). These leaders seek to motivate individuals by tapping into the individuals‘ desire for personal development and connecting to their established value system (Burns, 1978). It is imperative that transformational leaders display the ability to articulate their ideas for the organizations that they lead and also must be received by their followers as creditable sources of information (Bass, 1990; Burns, 1978). Komives (1991) reported that transformational leaders generally function from two motivations of power: personalized and socialized. Personalized transformational leaders are focused on a single vision and desire their followers to be dependent and submissive (Bass, 1990; Burns, 1978). In contrast, socialized transformational leaders seek to empower their followers, develop shared vision and value independence. Kinkead (2006) concluded that transformational leadership was not accomplished through the action or deeds of a single individual in the institution; however it was paramount in the success of first year students at colleges and universities. Research conducted by Bass (1990) supported the idea that transformational leadership was valuable and is capable of motivating individuals beyond what is expected. The model of transformational leadership can be applied in various settings, including the educational setting (Bass, 1990; Burns, 1978; Leithwood, 1992; Stewart, 2006). Kilpatrick and Locke (1996) conducted a study involving business students, in which they manipulated vision, vision implementation through task cues, and communication style of charismatic/transformational leadership. Their study showed that vision and vision implementation affected the students‘ performance outcomes and attitudes. However, the leaders‘ charismatic delivery method had a profound impact on the students‘ perception of charisma (Kirkpatrick and Locke, 1996). It is believed that transformational leadership produces a change that impacts the relationship and the resources of those involved (Stewart, 2006). Transformational leadership should profoundly impact the commitment level and ability for one to achieve their mutual purpose (Jantzi and Leithwood, 1995). Siegrist (1999) reported that transformational education in the classroom required creative and moral/ethical leadership. Johnson-Bailey and Alfred (2006) reported that ―most educators profess to value social justice, fairness, and equity and claim to demonstrate such values in their teaching‖ (p. 55). According to Mezirow (2000), the professed values of teachers are not always evident in their classroom behavior, therefore; it may be critically important for teachers/professors to it take an introspective look at the type of leadership they provide for their students.
The Impact of Gender on Preferences for Transactional Versus Transformational Professorial Leadership Styles: An Empirical Analysis
100
II. FEMALE VS. MALE STUDENTS
To examine the relative preferences held by each gender, the first step is to determine whether men as compared to women view professorial leadership styles differently. On the basis of the Myers-Briggs Type Indicator (MBTI) scale, it is evident that women tend to gravitate toward the feeling preference while males tend to be more likely to gravitate toward the thinking preference (Kelley, 1997). Therefore, men may not be receptive to instruction that goes beyond what is found in the printed text (Hood, et al. 2009). Professors who possess all the characteristics of a transformational leader may not meet the learning styles of the male student as a result. Transformational leadership character traits further may prove to be distracting to men as opposed to women (Hood, et al. 2009). This distraction is consistent with prior research suggesting that men may prefer to remain focused on the course objectives and content, receive the reward of a grade and move on in their studies (Hood, et al. 2009). According to Bass and Avolio (2000), both transformational and transactional leadership constructs are dynamic and viable forms of leadership styles. Young‘s (2004) study of leaders in higher education validated these findings by revealing that leaders typically exhibited equal amounts on transformational and transactional leadership traits in their communications with subordinates during their first year in leadership positions. If these findings hold true in the classroom setting, we may discover that students‘ preferences may require professors to display a blend of both of the aforementioned leadership styles. These preferences for leadership styles, and indeed the connection to the professor, may be reflected in the way that the students evaluate the professor. This suggests that professors who teach in a style that better matches student expectations will be evaluated more favorably as well as being preferred by the students. Hull and Hull (1988) expanded this body of research to include the effects of lecture style on learning and preferences for a teacher. As well, Politis‘ (2004) research indicated that the charisma of the professor suggests that learning is improved when the professor has a personal regard for his or her students. Sherman and Blackburn‘s (1975) research indicated that college teachers receiving high ratings were dynamic, pragmatic, amicable and intellectually competent. Bennett (1982) found that highly rated instructors were warm, nonauthoritarian, self-assured, personally charismatic, organized, structured and controlled in their teaching style. Consequently, multiple findings suggests that students value both the traditional, assertive, content-oriented style of teaching (transactional leadership style) and the charismatic, flexible, encouraging, stimulating (transformational leadership style Based on a systematic review of the literature and the specific focus of the present study, we were able to exact seven specific hypotheses relative to gender and its influence on the evaluation or professorial leadership styles.
Hypothesis 1: Men students will prefer a course that is transactional to women students.
Hypothesis 2: Men students will prefer a course that is low in flexibility to women students.
Hypothesis 3: Men students will be exhibit stronger grade orientation than will women students.
Hypothesis 4: Women students will prefer a charismatic professorial style to men students.
Hypothesis 5: Men will prefer leadership styles based in positive visions of the future less than women students.
Hypothesis 6: Women students will prefer intellectual stimulation in the classroom to men students.
Hypothesis 7: Women students will prefer creativity in coursework to men students.
III. METHODOLOGY
A. Participants
An accidental or convenience sample of 233 participants from the general student population at a college in the rural southeastern region of the United States participated in our investigation. Respondents in the study were college students who volunteered to participate; they received neither remuneration nor course credit for their participation. In the present study, there were 169 (72.8%) women and 63 (27.2%) men. The mean age was 23.22, with a range from 18 to 59 years of age. All selection and methodological procedures were approved by the Human Subjects Review Committee (HSRC) and were in accord with the ethical standards and requirements set by the overall college committee.
B. Materials
A critical aspect of this study was to measure how women and men perceived and evaluated professorial leadership styles from both a transformational and transactional perspective. Most of the previous research conducted on leadership styles had featured scales that were not amenable to the specific focus of the present study. Therefore, the first author developed a
R. L. Poulson, J. T. Smith, D. S. Hood, C. G. Arthur and K. F. Bazemore IHART - Volume 16 (2011)
101
survey entitled the Professorial Leadership Style Questionnaire (PLSQ). The survey was designed around characteristics featured in both transformational and transactional leadership research. Once the survey was developed, it was pilot-tested. The survey was then presented to both faculty and students to examine for face validity. Following these iterations, a final number of 52 Likert Scale items (very much – to not at all) were included in the PLSQ (for copies and a full and detailed discussion of the PLSQ, please contact the first author).
C. The Professorial Leadership Style Questionnaire (PLSQ)
In the present study, transformational leadership style was measured as follows. Vision: Vision is defined as having ideas and a clear sense of direction, communicating the ideas, and developing enthusiasm towards accomplishing the goals (Politis, 2004). This study featured four questions that dealt directly with the professor‘s vision for the course. For example, question 5 asked: To what degree do you believe that your college professors should possess a positive vision about your future chances in life? Charisma: Charisma is associated with creating and developing enthusiasm through the power of personal regard for their students (Politis, 2004). For example, question 43 asks: On a scale of 1 to 7, how much do you appreciate professors who are full of energy and drive about transforming the lives of their students? Intellectual stimulation: Inspiring students to want to go beyond being and doing average work; inspiring students to want to be more critical in their thinking and engage in critical debate about various topics which in turn will help to transform their lives (Politis, 2004). For example, question 19 asks: how important is it to you that college helps to transform your way of thinking as to better ensure your success in life? Creativity: Creativity is developing a new way of doing old things. Employing new strategies to attack old problems; use creativity to get students to go the extra mile. Creating new ways of measuring performance; thinking and doing outside of the traditional box (Politis, 2004). For example, question 23 asks: on a scale of 1 to 7, how important is it to you that professors start to give credit to students for their creativeness in addition to their correctness on exam essay questions and question 20 asks: how important is it to you that college helps you to develop new ways of thinking about old problems?
IV. MEASURES OF TRANSACTIONAL LEADERSHIP STYLE
In contrast with these concepts/factors that have been associated with transformational leadership style, there are other factors that have a more traditional association with transactional leadership style. For example, transactional leaders employ a strong degree of structure in order to reach their goals. In this study, a series of questions were created that were designed to assess some of the traditional beliefs underlying the education process. One of the traditional beliefs is that student performance is best measured by letter grades. Letter grades, in return, either serve as a positive reinforcement or a as a punisher. The student will either modify his or her behavior or maintain similar behavior depending upon their mid-term grades. For example, there were 12 questions that dealt with student‘s preoccupation with letter grades as opposed to the values of learning. Grade Orientation: There are 12 questions that were designed to assess a student‘s orientation toward letter grades. For instance, questions15 and 16 respectively ask: How important is it for you to earn a grade of B or better in a class? And, how important is it for you to learn from the class rather than what grade you earn in the class? Instructor/Course Flexibility: In addition to grade orientation, four questions were asked that dealt with course flexibility. The idea is that the student who is more oriented towards the transactional leadership style will be opposed to professors who deviate from their course syllabus; even if it means bringing more relevant information into the actual course. An example of these questions is found in question 27 which ask: on a scale of 1 to 7, how much do you dislike it when a professor deviates from the syllabus in order to introduce additionally relevant information?
V. PROCEDURE
In an attempt to make sure that a reasonable cross-section of participants occurred in the present study, various faculty members were approached to see if they would assist in administering the survey. Clear attempts were made by the researcher to approach faculty members who are teaching primarily freshman as well as senior level courses. This process was repeated for each of the four levels of students (i.e., freshman, sophomore, junior, senior). Each participant was given a copy of a consent form that clearly described the nature of the present study. Both the senior researcher and the participant signed a consent form before the survey was administered. The consent form was then placed in a separate envelope, sealed

The Impact of Gender on Preferences for Transactional Versus Transformational Professorial Leadership Styles: An Empirical Analysis
102
by the participant, and then placed in a separate box. The sealed envelope was signed with the corresponding year (i.e., 2009) in a manner that covered both the flap and the envelope itself. At the end of each testing session, consent forms were placed into a locked file cabinet. Upon their agreeing to participate in the study, each participant was seated in an area where no other participants could either observe their answers or communicate with them about the study. A researcher was present in the classroom throughout the testing session. The average time for completion of the survey was 27 minutes. After completing the survey, each participant was asked to place it in a sealed envelope and to write 2008 across the seal. Any survey that may show signs of being tampered with was removed from the study. At the end of each testing session, a senior researcher placed the completed surveys into a locked file cabinet.
VI. THE PROFESSORIAL LEADERSHIP STYLE QUESTIONNAIRE
The goal in this study was to discover which questions/variables featured in the survey would serve to form an identifiable and coherent subset of questions/variables that were independent of one another. Responses to particular questions featured in the survey that were correlated with one another but were mostly uncorrelated with other subsets of responses were combined into factors. The derived factors are believed to show the underlying processes that have created the shown correlations among variables (Tabachnick & Fidell, 2007). In order to examine the structure of the PLSQ scale, various analytical methods were used. A single item measure of mutuality of learning was used as a proxy for the difference between transactional and transformational teaching practices overall. This measure was selected because it taps into the difference between the command and control, transactional view in which the professor imparts the information to the student, and the collaborative, transformational view, where both professors and students learn from each other. The scale for flexibility originally was composed of four items. The Cronbach‘s Alpha on this scale did not approach reliability so the scale was reduced to two items to improve reliability. Both of these items focused on the integration of the experiences of the students into the lectures by the professors. The Cronbach‘s Alpha for this scale was calculated to be 0.867, which is sufficiently reliable for further use. The subscale focusing on grade orientation originally was composed of twelve items. Reliability testing of the original scale indicated a lack of internal reliability so items contributing the least to the scale were deleted in order to increase the Cronbach‘s Alpha of that scale. The remaining scale consisted of six items. Sample items are ―How important is it that your professors provide specific study guides for upcoming exams?‖ and ―How important is it that professors give you constant feedback about how you are doing in the class?‖ The Cronbach‘s Alpha for this scale was calculated as 0.807, which shows adequate reliability. The subscale for charisma originally consisted of eight items. Sample items from that scale ―How much do you like your professors who work hard to inspire you to do your best on his or her exam?‖ and ―How much do you appreciate professors who are full of energy and drive about transforming students‘ lives?‖ The Cronbach‘s Alpha for that scale was calculated as 0.670, suggesting inadequate reliability for use (Nunnally, 1978). As a result, one item was removed, increasing the Cronbach‘s Alpha to 0.703, which barely exceeds the threshold for such reliability. In addition, a second measure, the first of the above questions was also tested as a single item measure because that question taps more closely into the relationship between the professor and the student and not simply the behaviors of the professor. The subscale focusing on whether the professor showed a vision of a positive future for the student originally contained four items. One of those items, however, was assessed in a binary fashion rather than by using a Likert-type scale. That item was removed and the Cronbach‘s Alpha was calculated to be 0.529 for the remaining items. As such, it was inappropriate for use as a scale. However, a single item measure – ―To what degree should your professors possess a positive vision about your future chances in life?‖ – was substituted to capture this element. The subscale for stimulating the intellectual transformation of the students originally consisted of five items. However, the Cronbach‘s Alpha for that scale did not approach acceptable reliability. Scale reliability analysis testing reduced that scale to two items: ―How important is it for you that your professors work hard to motivate you to learn the course materials?‖ and ―To what degree do you believe that your college education is designed to help transform you into being a better person?‖ The Cronbach‘s Alpha for this scale was calculated to be 0.834, suggesting that the scale provided sufficient reliability. An additional item taken from the initial scale was included to measure whether the underlying assumption – that students feel that college should be a time to learn important life lessons – was also included.
R. L. Poulson, J. T. Smith, D. S. Hood, C. G. Arthur and K. F. Bazemore IHART - Volume 16 (2011)
103
The subscale focusing on creativity of the faculty in course design contained eight items originally. However, the Cronbach‘s Alpha for that scale was well below the 0.70 threshold for usefulness (Nunnally, 1978). As a result, the scale was trimmed to enhance reliability. The final scale included five items. A sample items from that scale is ―To what degree would you appreciate a course that has a person come in as a motivational coach?‖ The Cronbach‘s Alpha for the final version scale was 0.655, which was still below the minimum threshold for reliability (Nunnally, 1978). Thus the scale was not suitable for use. However, given the structure of the argument, the single item noted above was retained for testing since it directly focused on creative teaching techniques and did not bring in any of the elements of grading or content mastery. A second single measure was also used to represent a different side of creativity. This measure focused on the recognition of individual differences and individual needs of the students. This recognition presumes that when professors recognize the individual differences among their students that they will craft the course in such a way as to reach all of those students in a way that suits their individual differences.
VII. EMPIRICAL FINDINGS AND DISCUSSION
Hypothesis 1 focused on mutuality of learning. The genders were found to be significantly different in their desire for mutual learning at the .005 level (F=8.780; ρ=.003). Comparing the means for males and females, females were found to appreciate and evaluate mutuality of learning (5.84 vs. 5.17) higher than did males. Thus, Hypothesis 1 was confirmed. This finding suggests that women value the interchange that is critical in transformation leadership more strongly than do men. It is important to note that neither of the means indicated that the gender did not value mutual learning, just that the preference for it was stronger in women. Hypothesis 2 focused on the level of flexibility in the course. For this hypothesis, there was no significant difference found between the genders for the flexibility scale (F=0.246; ρ=.620). A further look at the means for each gender shows that flexibility is favored by both genders, with a mean across genders of 4.87/7.00. The flexibility scale looked primarily at the incorporation of personal experiences into classes, where the personal experiences used came from both the professor and the students. While the mean for the group as a whole was slightly positive, each gender may have its own reasons for having a lower interest in this behavior. Men, for example, may not want to have their actions challenged as they are in the process of creating their identities (Erikson, 1968). Women may not want their experiences to separate them from the whole (Tannen, 1998). Thus, despite the connection between transactional leadership and flexibility in the classroom, the gender difference may have been overridden by personal needs. The genders did not differ significantly on the grade orientation scale that was used to operationalize hypothesis 3 (F=2.435; ρ=.120). The overall mean for this scale was 5.69/7.00, indicating that grades are important to members of both genders. While grades were viewed as relatively important for both genders, neither gender seemed view grading as being inextricably linked to transactional or transformational professorial style. Another possible explanation for this finding is the ever increasing number of women entering the workforce; the message that grades are directly related to job opportunities has impacted the genders equally and overrides any gender-based connection to transactional or transformational leadership. With respect to Hypothesis 4, the charisma scale just failed to rise to the minimum of significance (F=3.764; ρ=.054). Given the mean across genders of 5.78, this suggests that both genders value professors who show an interest in their subject and in their students as part of the learning experience. However, the single item measure not only captured the essence of the argument, but was also significant at the .05 level (F=4.404; ρ=.037). In comparing the means of the two genders, the means for the women were higher than the means for the men, indicating that women liked professors who worked hard to inspire them better than did men. This seems to tentatively suggest that the relationship between student and professor is more important to women than to men. Thus hypothesis 4 is partially confirmed. Hypothesis 5 yielded significance at the .01 level (F= 7.367; ρ=.007) on the single item measure focusing on professors having a positive vision of student success possibilities. Comparing the means of the two genders, women once again felt that it was more important for their professors to believe that their students could succeed. This is consistent with women preferring a more nurturing style of leadership (Wilson, 1995; Baird and Bradley, 1979). Hypothesis 5 thus is confirmed. Taking hypotheses 4 and 5 together, women place a higher value on professors who work hard to inspire them and who have a positive vision for their potential success. This value recognition may derive from an acknowledgement of the outlay of effort by the professor and an interpretation of that effort as an attempt on the part of the professor to relate to them more strongly, a behavior which is valued by that gender (Tannen, 1998). Men, on the other hand, may view the same behaviors as an attempt to shape the way that their identity is formed and may reject those efforts as a result (Erikson, 1968). This suggests that

The Impact of Gender on Preferences for Transactional Versus Transformational Professorial Leadership Styles: An Empirical Analysis
104
professors who seek to use these individualized approaches with men would perhaps do well to shape their conversations around the goals and dreams espoused by the students rather than in trying to introduce the student to areas in which the professor believes the student can excel. From a classroom perspective, this may also mean that students are given choices of types of assignments in order to show mastery and play to their strengths. . With respect to Hypothesis 6, the scale version of stimulating the transformation of the students was not significant (F=1.793; ρ=.182). Given the mean of 6.19 for the item, this suggests that both men and women find it essential that their academic life both transform them as people and prepare them for success. This preparation for success may be viewed differently across genders, however. The single item measure that tapped into whether the individual believed that college was a time to learn valuable life lessons – whether or not they came from the professorate – was significant at the .01 level (F=7.333; ρ=.007). Comparing the means for men and women, the men reported weaker beliefs that college was a time to learn valuable life lessons than did the women (5.84 vs. 5.17). Thus hypothesis 6 is partially confirmed. Hypothesis 7 focuses on the creativity of the assignments for the course and the recognition of individual differences. Significant differences between the genders were shown with both the measure focused on the use of creative means of teaching, which was significant at the .05 level (F=4.726; ρ=.031), and the measure focused on recognition of individual differences, which was significant at the .01 level (F=7.850; ρ=.006). In both cases the means were higher for females than for males (5.52 vs. 5.02/7.00 for the teaching measure and 5.86 vs. 5.22/7.00 for the individual differences measure). Thus, hypothesis 7 is confirmed. Overall, the confirmation of hypothesis 1 suggests that there are indeed differences across genders in the preference for transactional and transformational professorial styles. The mixed results for the elements typically associated with transactional and transformational professorial styles, however, suggest that, at least across genders, some of the elements of each style are valued regardless of the overall style preference held by the student. What this means is that some elements of education are sufficiently important to both genders that they value them despite an association between that element and a professorial style that is not preferred.
VIII. IMPLICATIONS AND SUGGESTIONS FOR FUTURE RESEARCH
These findings raise an interesting question. With the current pedagogical trends appearing to lean in the direction of transformational professorial styles, one could reasonably ask whether the increase in the percent of women in academic institutions a reflection of teaching practices that are more inclusive of women and learning styles favored by women? As we continue to explore the two models of leadership, transformational versus transactional, it would behoove us to consider another possibility. It may support the notion that the greatest level of student success is achieved when professors embody characteristics of both transformational and transactional leadership. Careful examination of current research shows that most leaders embody characteristics of both transactional and transformational leadership (Bass and Avolio, 2002). The two leadership styles do not exist in isolation of one another. Furthermore, according to Bass and Avolio (2000) both transformational and transactional leadership constructs are dynamic and viable forms of leadership styles. In addition, to become more balanced and not rely on preferences, leaders should make the conscious effort to posses other styles of leadership (Kelley, 1997). Young‘s (2004) study of leaders in higher education validated these findings by revealing that leaders typically exhibited equal amounts on transformational and transactional leadership traits in their communications with subordinates during their first year in leadership positions. If these findings hold true in the classroom setting, we may discover that students‘ preference may require professors to display a blend of both of the aforementioned leadership styles. A second line of inquiry that may be fruitful is to assess the psychological contracts of the students. These contracts tap into the unspoken assumptions regarding what they expect to do in a classroom and what they expect to receive in return (Smith, 2006). Assessing the terms of these contracts may yield further information regarding the differences between the genders and their relative preferences for transactional and transformational professorial leadership styles.
IX. CONCLUSION
A majority of the existing research on transformational and transactional leadership is related to corporate America and the leaders in that system. Many businesses and corporations have reaped benefits when their leaders successfully implement
R. L. Poulson, J. T. Smith, D. S. Hood, C. G. Arthur and K. F. Bazemore IHART - Volume 16 (2011)
105
these strategies of transactional and transformational leadership. We believe that the same benefits can be realized in college and university classrooms.
X. REFERENCES
Baird, J. M and Bradley, P. H. (1979). ―Styles of Management and Communication: A Comparitive Study of Men and Women‖, Communication Monographs, 46, 101-111.
Bass, B. M. (1985). Leadership and performance beyond expectation. New York: Free Press. Bass, B. M., (1990). From Transactional to Transformational Leadership: Learning to Share the Vision. Organizational
Dynamics, 18, 19-36. Bass, B.M., & Avolio, B.J. (2000). Multifactor Leadership Questionnaire. Mind Garden, Redwood City, CA. Bennett, S. K. (1982) Student Perceptions of and Expectations for Male and Female Instructors: Evidence Relating to the
Question of Gender Bias in Teaching Evaluation. Journal of Educational Psychology, 74, 170-179. Bolkan, S. and Goodboy, A.K. (2009) Transformational leadership in the classroom: fostering student learning, student
participation, and teacher credibility. Journal of Instructional Psychology, 36, 296-307. Burns, J. M. (1978). Leadership. New York: Harper and Row. Chory, R. M., & McCroskey, J. C. (1999). The relationship between teacher management communication style and affective
learning. Communication Quarterly, 47,1-11. Erikson, E. H. (1968). Identity: Youth and crisis. New York: W. W. Norton. Hallinger, P. (2003). School leadership development: Global challenges and opportunities. In P. Hallinger (Ed.), Reshaping the
landscape of school leadership development: A global perspective. Lisse, Netherlands: Swets & Zeitlinger. Harter, J.J. & Bass, B.M. (1987). Supervisors evaluations and subordinates‘ perceptions of transformational and transactional
leadership. Unpublished manuscript, State University of New York, School of Management, Binghamton, NY. Hinkin, T. R., and Tracey, J. B. (1999). The relevance of transformational leadership in stable organizations. Journal of
Organizational Change Management, 12, 105-119. Hood, J. D., Poulson, R. L., Mason, S. A., Walker T. C. & Dixon, J., Jr. (2009).An examination of traditional and nontraditional
students‘ evaluations of professorial leadership styles: transformation versus transactional approach. Journal of the Scholarship of Teaching and Learning, 9(1), 1-12.
House, R.J., Woycke, J., & Fodor, E.M. (1988). Charismatic and noncharismatic leaders: Differences in behavior and effectiveness in J.A. Conger, R.N. Kanungo, & Associates (Eds.), Charismatic leadership: The elusive factor of organizational effectiveness (pp. 98-121). San Fransico: Jossey-Bass.
Hull.D.B., & Hull.J.H.(1988). Effects of Lecture Style on Learning and Preferences for a Teacher. Sex Roles, 18 (7/8), 489. Jantzi, D. & Leithwood, K. (1995). Toward an Explanation of How Teachers Perceptions of Transformational School Leadership
Are Formed. Paper presented at the Annual Meeting of the American Research Association, San Francisco, CA. (Eric Document Reproduction Service No. ED386785)
Johnson-Bailey, J & Alfred, M. (2006). Transformative teaching and the practices of Black women adult educators. In E.W. Taylor, Fostering transformative learning in the classroom: Challenges and innovations. New Directions for Adult and Continuing Education, No. 102. San Francisco: Jossey-Bass, 49-58.
Kelley, M.J.M. (1997). Gender Differences and Leadership. Maxwell Airforce Base, Alabama: Air War College. Kinkead, J.C. (2006). Transformational Leadership: A Practice Needed for First Year Success. (Eric Document Reproduction
Service No. ED492009) Kirkpatrick, S. A., & Locke, E. A. (1996). Direct and indirect effects of three core charismatic leadership components on
performance and attitudes. Journal of Applied Psychology, 81, 36-51. Komives, Susan R. (1991). Gender Differences in the Relationship of Hall Directors‘ Student Transformational and
Transactional Leadership and Achieving Styles. Journal of College Student Development, 32, 155-165. Leithwood, K. (1992). Transformational leadership: Where does it stand? Educational Leadership, 49, 8-12. Mezirow, J. ―Learning to Think Like an Adult: Core Concepts of Transformation Learning.‖ In J. Mezirow and Associates (Eds.),
Learning as Transformation: Critical Perspective on a Theory in Progress. San Francisco: Jossey-Bass, 2000. Nunnally, J. C. (1978). Psychometric Theory. New York: McGraw-Hill. Politis, J. D. (2004). ―Transformational and Transactional Leadership Predictors of the ‗Stimulant‘ Determinants to Creativity in
Organisational Work Environments.‖ The Electronic Journal of Knowledge Management, 2(2), 23-34. Pounder, J.S. (2003). Employing Transformational Leadership to Enhance the Quality of Management Development
Instruction. Journal of Management Development, 22, 1 - 13. Roueche, J.E., Baker III, G.A., & Rose, R.R. (1989). Shared vision: Transformational leadership in American community
colleges. Alexandria, VA: American Association of Community and Junior Colleges. Sherman, B.R. & Blackburn, R.T. (1975). Personal characteristics and teaching effectiveness of college faculty. Journal of
Educational Psychology, 67, 124-131.

The Impact of Gender on Preferences for Transactional Versus Transformational Professorial Leadership Styles: An Empirical Analysis
106
Siegrist, G. (1999). Education Must Move Beyond Management Training to Visionary and Transformational Leadership. Education, 120, 297-303.
Smith, J. T. (2006). ―On my honor I will try…‖, presented at the Lilly South Conference on College and University Teaching, Greensboro, North Carolina.
Stewart, J. (2006). Transformational leadership: An evolving concept examined through the works of Burns, Bass, Avolio, and Leithwood. Canadian Journal of Educational Administration and Policy, 54, Retrieved March 5, 2007 from http://www.umanitoba.ca/publications/cjeap.
Tabachnick, B. G., & Fidell, L. S. (2007). Using multivariate statistics (5th ed.). Boston, MA: Allyn & Bacon. Tannen, D. J. (1998). The argument culture: Stopping America‘s war of words. New York: Ballantine Books. Tichy, N.M. & Ulrich, D.O. (1984). The leadership challenge-A call for the transformational leader. Sloan Management Review,
26(1), 59-68. Wilson, F. M. (1995). Organizational Behaviour and Gender. London: McGraw-Hill Book Company International (UK) Limited. Young, P. (2004) Leadership and Gender in Higher Education: a case study. Journal of Further and Higher Education, 28, 95-
106.
XI. AUTHOR‟S NOTES
Dr. Ronald L. Poulson is an Associate Professor in the School of Education and Psychology at Elizabeth City State University. Dr. Joy T. Smith is a Professor in the School of Business and Economics at Elizabeth City State University. Dr. David S. Hood is the Associate Dean of the University College at North Carolina Central University. Dr. Christon Arthur is the Dean of Graduate Studies at Andrews University. Dr. Kimberly Fitchett-Bazemore is an Assistant Professor in the School of Education and Psychology at Elizabeth City State University. We would like to thank Mr. George Cox and Mr. Jeremiah Hodges for their tireless efforts with compiling relevant literature and reviewing drafts of this manuscript. Any questions regarding this research should be directed to Dr. Ronald L. Poulson.

O. A. Owolabi IHART - Volume 16 (2011)
107
DEVELOPMENT AND MANAGEMENT OF URBAN AND RURAL INFRASTRUCTURES IN OSUN STATE, NIGERIA: ROADS, DRAINAGE, WATER, ETC.
Oludare A. Owolabi
Morgan State University, USA
ABSTRACT
Condition surveys of basic infrastructures in Osun State, Nigeria were carried out. The nature of investigation was basically through reconnaissance survey, visual inspection, traffic studies, collection of samples and interviews with the monitoring government agents. Results show that most urban and rural infrastructures in Osun State are in deplorable conditions due to failure to efficiently follow the underlying principles required for the provision of workable and sustainable infrastructure, from the context of design through construction to the operation and maintenance stages. The paper concludes by giving recommendations for effective design, construction and maintenance of engineering infrastructure that ensures improved life-expectance and reduced overall cost. Keywords: Design, Construction, Operation, Use, Maintenance and Infrastructure.
1. INTRODUCTION
The recent dilapidation of most urban and rural infrastructures constitute a major environmental hazard in the country, it also retards the technological and economical advancement of the nation. Thus provision of adequate infrastructural facilities is very crucial to the improvement of environmental, economical, political, social and cultural lives of the citizens. The dwindling resources, high cost of spares coupled with mismanagement and high level of corruption has drastically reduced the life expectancy of many infrastructures. The paper begins by identifying the underlying principles that ought to have been efficiently followed during the cause of the provision of the infrastructures in Osun State, from the context of design through construction to the operation and maintenance stages. It then takes a look at the present condition of most infrastructures in the state with a view to suggesting solutions. The paper finally gives recommendations for effective design, construction and maintenance of engineering infrastructure that ensures improved life expectance and reduced overall cost.
2. STEPS IN THE PROVISION OF SUSTAINABLE PHYSICAL INFRASTRUCTURES
The context in which a facility succeeds is determined by its design, manufacture/construction, operation/use and maintenance. These correspond to four functions they are the determinants of facility success. Figure 1 shows the sequence.
Figure 1: Phases of provision of physical facilities
The design stage which is the first stage where great thought is given to functions and expected operations of the facility to be constructed and thereby the method of putting the materials and components together to affect such an operation is conceptualized. Design of physical facilities like roads, dams, drains, water works etc. needs to be put into writing in the forms
DESIGN
MANUFACTURING/ CONSTRUCTION
OPERATION/ USE
MAINTENANCE

Development and Management of Urban and Rural Infrastructures in Osun State, Nigeria: Roads, Drainage, Water, Etc.
108
of drawings and specifications (1). This is to ensure two things, one, that the concept of the design is generally understood by all concerned and secondly it affords an opportunity for deciding the best method of erecting the physical facilities and the
operation of what is to be constructed. Design is the least expensive phase of construction but is the essential foundation on which all other things are built. The design stage, as it is generally agreed, must integrate considerations and constraints expected at usage and maintenance stages. It is only when this integration is not properly done that problems develop almost immediately after project completion. According to Okafor and Ndubusi (2) project design and implementation must:
(a) use qualified experts tested in the field of interest, (b) ensure detailed study of operational pattern and usage, (c) employ design tools to simulate the effect of in proposed design, (d) adequately test system in real life environment to ensure that it satisfies desired goals, (e) guarantee maintainability.
The short-fall in life expectancy could be traced to how poor the design stage is handled. The second stage is the construction stage, this involves the procurement of the materials, equipment and necessary labour; skilled or unskilled for the physical realization of the design; and the crowning glory of construction which is the installation or the putting into place all the procured items in accordance with the guidelines of the design to produce the physical realization of the schemes or project (1). This phase is usually the bottleneck that causes the dilapidation of the facilities arising from low quality materials and poor installation. Unfortunately, because of financial constraints, inadequacies in personal expertise and corruption, projects get into the hands of inexperienced contractors. Again, the lack of accountability by all involved in the construction stage has created avenues for undercutting design goals in order to embezzle money. The third stage is the operation/use, this is the phase where the facility is put to use by the public. The misuse of the facility causes the facility to break down immediately after use, since a protection against misuse is not included in the design goals. Also in this stage the appropriate personnel keeps the system functioning. The maintenance phase comprises of those activities required to keep a facility in; as build, condition and therefore continuing to have its original productive capacity. This stage is a combination of actions carried out in order to replace, repair, service (or modify) the components, or some identifiable grouping of components of a manufacturing plant/facility so that it will continue to operate to an acceptable condition, to a specified time. There is a wide difference in maintenance standards, and expenditures vary from state to state. This is due not only to environmental factors but also to human and organizational influences. There is no coherent policy on maintenance and documentation on maintenance activities is inconsistent and often fragmentary. Decisions on maintenance seem to be based mostly on subjective judgment rather than objective and rational considerations. In fact, there are very few places where maintenance activities are regarded as vital in protecting the facility investment. More often, maintenance activities are under-financed, make little use of research and are under-mechanized. Available resources are often devoted to purposes with a more immediate public appeal or political considerations. Part of the problem is due to lack of maintenance culture when in the country. People and apparently the various governments of the Federation do not appreciate the need for a good system of road maintenance (3). There is a careless and costly attitude toward timely maintenance. From the foregoing all the four stages form a diamond as shown in figure 2 and they are interrelated as any inadequacy in any undermined the success of the facility (4). The arrows in the figure show the interactions among all four functions. The maintenance function influences the design function and vice-versa. If the design is faulty, the facility dilapidates at a fast rate thus requiring a huge amount of money to bring it to the acceptable standard. Similarly, maintenance influences and is in turn influenced by production (construction/manufacture). The diamond also shows that maintenance affects operation just as operation affects maintenance. Hence, the maintenance personnel need to be conversant with operation, construction, and design.

O. A. Owolabi IHART - Volume 16 (2011)
109
Figure 2: Determinants of facility success
3. EXISTING CONDITION OF URBAN AND RURAL INFRASTRUCTURE IN OSUN STATE
The majority of the basic infrastructures are in deplorable conditions as a result of failure and inadequacies in all the four functions relevant for the provision of physical facilities that were earlier on identified. Condition surveys of basic infrastructures in Osun State were carried out. The methodology of investigation was basically through reconnaissance survey, visual inspection, traffic studies, collection of samples and interviews with the monitoring government agents. The results of the conditions of each facility are presented below.
3.1 Roads
From the condition survey carried out on some major township road networks in Osogbo, Ede, Ikirun, Ilesa, Ife-Ife and Iwo; results reveal that the major road defects are potholes, cracks, rutting, edge damage, erosion gullies, corrugation, silting, bleeding, honeycombs, overgrown vegetation, loss of aggregates of shoulder, erosion and washout of shoulders. The critical sections showing the most severe occurrence of the several distress categories especially potholes were closely studied on each of the following roads:
(i) Station Road Osogbo, (ii) Aiyetoro Road Osogbo, (iii) Iwo Road Osogbo, (iv) Station Road Ede, (v) Oyo Road (Opposite First Baptist Vhurch) Iwo, (vi) Oba Agun Road Ikkirun, (vii) Oke-Afo Road Ikirun, (viii) Alamisi Market Ikirun, (ix) Oranyan Road Ife-Ife, (x) Oke-Isa Road (Before the recent resurfacing).
Results show that the pothole depth ranges from 20cm to about 50cm at Oyo Road in Iwo. The distress length varies from 50m to 100m with the maximum distress width reaching up to 7.3m which is the total width of the carriage way. It was revealed from the study that most roads were not constructed to specification. The wearing course, which was supposed to be 50mm, was 10mm thick in some cases. In some cases there were no base and sub-base. Also observation showed that patching of potholes when done at all, were poorly executed and no resealing of cracks was undertaken. In some sections of the road network there was no shoulder. Generally, observation revealed low quality of construction materials, inadequacy of construction methods, faulty design, high load repetitions, environmental factors, construction errors and untimely maintenance were the causes of the pavement failures. The official of our various ministries of works usually wait for small potholes to deteriorate into craters and become death traps before they think of remedial actions. Another major problem identified is the lack of database for the roads in Osun State as there is no adequate information about the road network vis-à-vis maintenance history, pavement performance, riding quality of the pavement, pavement geometry etc. A good database normally aids in the development and management of the road network.
3.2 Drainage
The failure types and severity levels of the distress on the entire road network in Osun State reveal the poor drainage condition of the road network.
DESIGN
OPERATION/ USE
MAINTENANCE PRODUCTION

Development and Management of Urban and Rural Infrastructures in Osun State, Nigeria: Roads, Drainage, Water, Etc.
110
Generally the entire sections of most of the roads are poorly drained with no side slope, sufficient cambering of pavement surfaces and side drains. Some of the road sections are even slightly lower than or close in level to the surrounding terrain. Example is the section of Ede Road at Christ Apostolic Church (Mount Bethel) along Obafemi Awolowo University Gate to Mayfair. This condition makes the road non-motorable during any down pour; as water remains on the carriage way and many sections are bath tubed. The water weakens the loose and resilient subgrade soils in the area. No matter any corrective measure done on the pavement structure without raising the section above the surrounding terrain the problem will persist. The sides and edges of many sections of the road have been eroded due to the absence of side drains. Most culverts were inadequately sized and wrongly placed, these resulted in their failure and such defects like silting, sanding, blockage, erosion of stream, bed of culvert outlet and development of pool and structural failure of culvert. In some areas flooding was experienced as a result of the blockage of the drainage facilities by refuse, untimely maintenance of drains, high ground gradient, associated with high intensity rainfall, inadequate determination/estimation of runoff, poor construction methods and faulty design. The deck of the bridge along Ede Road (very close to O.A.U Gate) has developed a big crater, which will give way very soon. From close observation of the bridge slab it was discovered that iron mesh was used as the reinforcement instead of a 20mm high yield steel.
3.3 Water Supply
The major water supply scheme in Osun is the New Ede Works, which was constructed by Constain and commissioned in 1991. The water scheme comprises of five major pumping stations/mains serving various communities in the state. They are as follows:
(1) The Oloki pump which serves Ife-Ife, Ipetumodu, Origbo, Akoda, Sekona, Gbongan, Odeomu, Modakeke and other towns within Ife district,
(2) The Ede pump serving Ede and its environs, (3) The Osogbo pum serving Osogbo, Ido Osun, Ofatedo, (4) Alarasan pump serving Ejigno, Ageri, Ara, (5) Ifon/Ilobu pump serving Ifon, Ilobu and Erin.
Of all the service pumping stations none is presently yielding up to 25 percent of its expected output. Only one out of the four highlift pumps in the Osogbo station is functioning presently, while out of the three in Ede service lane only one is working. Similarly only one highlight pump out of the two of the Alarasan pumping station is functioning while two are working out of the three of the Ifon Ilobu pumping station. Similarly out of the two wash-water pumps only one is working. The above anomalies are due to the aging of the equipment and poor maintenance. At the treatment works in Ede, two out of the four lowlife pumps are functioning. This is due to the non-availability of the contractor (a major component of the pump panel) to replace the faulty component. Equally the coils of the pumps are burnt. Although there is sufficient water available for treatment as there is a gigantic dam at Okini, but the major problems lie with the treatment works. The outlet main that conveys water from the lowlift pump to the aeration unit is blocked due to the malfunctioning of the wash-water pumps. The clarifiers are not so efficient because of poor maintenance. Out of the fourteen filter beds only eight are in good condition as they are muddy. The filter sands are long overdue for replacement. As a result of low residual head in the distribution network some areas do not get water at all. The pipes are already old and any excess pressure will burst them. There has been a lot of damage on the secondary distribution network due to excessive traffic loading. Due to the inefficiency of the whole system the consumers are not ready to pay their water rates, also the distribution of water bills takes a longer period about four months prolonged more than necessary.

O. A. Owolabi IHART - Volume 16 (2011)
111
There are also other mini schemes in Osun State like the Ifetedo, Garage Olode, Iyanfoworogi and its environs. The scheme also has its attendant problems ranging from low rate of work of the lowlift pump through to the inadequate size of the clear water well that serves the population, to the epileptic power supply and non-availability of diesel oil. Since the commissioning in 1997 the highlight pump never successfully lifted water to the reservoir this is due to blockage of the pumped water mains. Presently Ilesha and its environs have no specific water scheme since the equipment for the scheme was stolen during the Asejire scandal. The yield from most of the borehole schemes in the state is too low to supply the intended population.
4.0 TOWARDS AN IMPROVED AND SUSTAINABLE BASIC INFRASTRUCTURES IN OSUN STATE
As earlier on discussed the development and management infrastructure depends solely on the efficiency of the four functions of design, manufacture/construction, operation/use and maintenance. The solutions to the dilapidation of the infrastructures in Osun State shall be reviewed in the light of the success of these four underlying factors in the provision of engineering infrastructure.
4.1 Design
To meet the normal design objectives of all the infrastructures the following four designing considerations must be properly addressed:
(i) Formulating the right problem – ensuring that the objectives and requirements of the device, equipment, machine or facility are right,
(ii) Designing an appropriate solution – ensuring that the system is not only technically excellent but also appropriate and successful,
(iii) Developing it to perform well – ensuring that it can be operated with satisfactory results, maintain with satisfactory results and supported for example with fuel, spare parts and competent personnel
(iv) Assuring user satisfaction – ensuring that the users achieve the benefits for which the system is being designed. Generally the engineer must aim at providing a workable design of a thoroughly functional system, and producing the required satisfaction at a very reasonable cost.
4.2 Construction
As earlier on highlighted the operable condition of most of the basic infrastructures is due to the poor quality of the construction materials and the wide deviations from design specifications. It is therefore imperative that sanity is brought into the construction industry and a high level of accountability developed by all parties involved in project implementation. The public should rise against any corrupt part.
4.3 Operation/Use
The short fall in life expectancy can also be traced to how our infrastructural facilities are being misused. Lack of use results in total neglect while overuse or improper usage all contribute to abuse of infrastructural facilities and installations. To ensure proper usage, operating guide must be provided. There should also be levels of protection that insulate infrastructures from abuse in any form. It may not be out of place to specify matching penalties for any form of wrong usage or abuse. Regular checks must ensure that operation is under specified conditions. With adequate staff training (for installations requiring human interface) and close monitoring, most of the huge expenses on maintenance become avoidable.
4.4 Maintenance
The maintenance activities must be well planned to achieve the objective of maximum satisfaction at minimum cost. This global objective, which van be pursued via a number of target objectives, which could be unit or system oriented, such as
(a) Prevent deterioration of design reliability and safety level (b) Restore to design reliability and safety levels by replacement

Development and Management of Urban and Rural Infrastructures in Osun State, Nigeria: Roads, Drainage, Water, Etc.
112
(c) Replace failed unit with new or refurbished unit (d) Increase the design reliability and safety levels by redesign.
It is imperative that an effective maintenance program must be based on well conceived and laid out strategies hinged on equipment utilization and their behavior, production requirements and policies, as well as long-range corporate objectives. The various technological strategies that are applicable to maintenance can be treated in three broad categories namely (4):
(i) Breakdown (or corrective) maintenance (ii) Preventive maintenance (iii) Design – out (or improvement) maintenance
Preventive can further be divided into three major categories as follows:
(i) Time based on scheduled (preventive) maintenance (ii) Condition monitor (preventive) maintenance (iii) Condition based (preventive) maintenance
Figure 3 shows the three broad categories with preventive maintenance, split up into its three major (sub) categories. All the strategies can be said to have been arranged in ascending order of effectiveness.
Figure 3: Five Categories of Maintenance
Source: (3)
It is believed that if as these four functions are thoroughly and rigorously pursued the identified problems shall be a thing of the past. However peculiar solutions to each infrastructure‘s inadequacies are briefly given below.
Road and Drainage:
Roads improvement in Osun State shall involve the reconstruction or surfacing of important sections of the road network with priority being given to those sections with severe distress and the sections which provide important linkages or constitute critical bottlenecks in the urban transportation system. The vertical and horizontal alignments of some roads shall be changed in order to meet the service requirements. Structural improvements and provision of road furniture and amenities shall be included in the development plan. Pavement evaluation study shall be carried out and a road database created for Osun State. This will aid the maintenance and management of the road. The various government arms must establish the maintenance and management of the road. The various government arms must establish rapid teams to tackle road maintenance problems at the embryo stage. The stormwater drainage improvement shall involve the provision – or upgrading of primary drainage systems within the state so that major flooding experience in the past in the various locations could be avoided. Also there are some tendencies of dumping refuse and solid wastes into the drains causing blockages. The routine maintenance is needed to deal with the removal of such deposited solids in the drainage bed to keep drainage channels free of obstruction so that they are capable of carrying the stormwater after a heavy rain in concentrated areas. Most open drains shall be covered.
Maintenance
Preventive Maintenance
Breakdown Maintenance
Design – out Based
Maintenance
Time Based or
Scheduled MTCE
Condition Monitor
MTCT
Condition Based
MTCE
1 2 3 4 5

O. A. Owolabi IHART - Volume 16 (2011)
113
Finally in places where the design objective of the drainage system is not achieved a redesign and reconstruction shall be undertaken.
Water Supply
A total overhauling of the water supply schemes shall be made with a view to ensuring the provision of a workable design of a thoroughly functional system that produces the required total water demand at a very reasonable cost. This shall entail adequate estimation of the water demand, proper design and construction of the treatment works and the distribution network. Timely maintenance and better operational strategies must be adopted.
5.0 CONCLUSION
It is the belief of this presentation that the route to the effective development and management of Urban and Rural infrastructure lies in ensuring the provision of only quality infrastructure from the concept of the underlying principles, closely monitored from design through to the construction, operation and maintenance stages. The two tiers of governments in the state should ensure the provision of workable designs of thoroughly functional systems that provide the maximum satisfaction at a very reasonable cost. The ideas presented if closely followed shall yield durable and more serviceable infrastructure.
REFERENCES
1. Olugbekan, O.O.: ―The Construction Industry and the Nigerian Engineer‖. The Tenth NSE October Lecture (1991). 2. Okafor, C.L. and Ndubisi, S.N.: ―Sustainable Development of Engineering Infrastructures Design, Implementation, and
Maintenance Strategies‖. Proceedings of the 1995 conference of NSE or engineering a creative profession for the sustainable development, Owerri; Dec. 1995, 184-188 (1995).
3. Adeyeri, J.B.: Rational Approach to the Maintenance of Highways‖. Proceedings of the 1995 conference of NSE or engineering a creative profession for the sustainable development, Owerri; Dec. 1995, pp 57-82 (1995).
4. Okah – Avea, B.E.: ―The Science of Industrial Machinery and Systems Maintenance‖ Spectrum Books Ltd. Ibadan. 1995. 5. Abejide, O.S.: ―Failure Analysis of a Road Pavement‖. NSE Technical Transactions. Vol 34, No 3, July-September, pp 47-
52. 1999. 6. Oluka, S.O., Onwualu, A. and Enoch, I.I. (1999): ―Engineer in Society‖. SNAAP Printers and Publishers, Enugu (1999).
C. Ogbonna and E. Martin IHART - Volume 16 (2011)
114
THE CORRELATION BETWEEN CAMPAIGN CONTRIBUTIONS AND LEGISLATION AUTHORED IN THE TENNESSEE GENERAL ASSEMBLY
Chinyere Ogbonna and Eric Martin
Austin Peay State University, USA
ABSTRACT
Political campaign financing has always been a mainstay of the current United States political arena, but the Supreme Court‘s decision in Citizens United versus Federal Election commission in 2010, recently highlighted the contentious issue of election campaign funding. In the case, the Supreme Court held that the first amendment precluded limitation of corporate funding of independent political broadcasts in candidates elections. This means that there is now greater latitude with regards to extent of funding of political candidates by corporations. Opponents believe the decision will lead to political beneficiaries of such corporate largess (if they win election) to author legislations that would benefit their corporate benefactors. Proponents of the ruling believe that it provides corporations with the opportunity to have a voice within the political process. Nonetheless, this decision created a firestorm both from supporters and opponents of the Supreme court ruling, but one issue remains clear, the issue of political campaign financing will continue to bear on the political process within United States of America. This research is aimed at analyzing the relationship between campaign contributions in Tennessee and specific authored legislation within the Tennessee general Assembly. The research will indicate if campaign contributions had a direct correlation to subsequent authored legislation within the Tennessee General assembly, as such, five specific, authored legislation would be examined. Keywords: Campaign Finance, Campaign Spending, Citizens United, Presidential Election, Political Action Committees,
Elected Officials, Federal Election Committees.
THE CORRELATION BETWEEN CAMPAIGN CONTRIBUTIONS AND LEGISLATION AUTHORED IN THE TENNESSEE GENERAL ASSEMBLY
The signing of the Declaration of Independence in 1776, created a democratic system of government in United States of America (USA) that was designed to establish a government, ―By the people, for the people and of the people.‖ But the United States Constitution, created a system of governance by elected officials, whom are charged with representing the citizenry in creating the laws of the land. These elected officials are supposed to serve the needs of the electorate that put them in office. Thus, USA‘s governance is classified as a republic. The elections of these officials, whether for federal, state, or local office, have become increasingly more complex during the 236 years since the signing of the Declaration of Independence. One of the most complex aspects of elections is the way they are financed. Campaign finance, and campaign finance reform, has played a major role in the legislative arena for years. This is a very complicated issue as proponents for campaign finance reform feel that the election process would be more fair and balanced if issues can be debated and discussed without the overarching influence of special interest groups. Opponents of campaign reform on the other hand deem reform as an attack on free speech. There are both advocates and opponents for campaign finance reform within the two major political parties in United States. The passage in 1867 of a Naval Appropriations bill,1 marked the onset of federal government regulation of campaign financing as a means of preventing monetary donations from exerting undue influence on elections, and subsequently on the actions of elected officials. The primary sources of campaign funds for USA political candidates are individuals and political action committees, also known as ―outside organizations.‖ Contributions from both are regulated by a government entity known as the Federal Election Commission. The Federal Election Commission is an independent federal agency that was created in 1974 as a direct result of amendments to Federal Election Campaign Act (FECA).2 The Federal Election Campaign Act is a federal law that increased disclosure requirements for federal campaigns contributions. It was amended in 1974 to place legal limits on political campaign contributions.
1 The Naval Appropriation bill, prohibited officers and government officials from seeking donations from naval yard workers. 2 The Federal Election Commission was an agency thus created to serve as enforcer of the enabling (FECA) act.
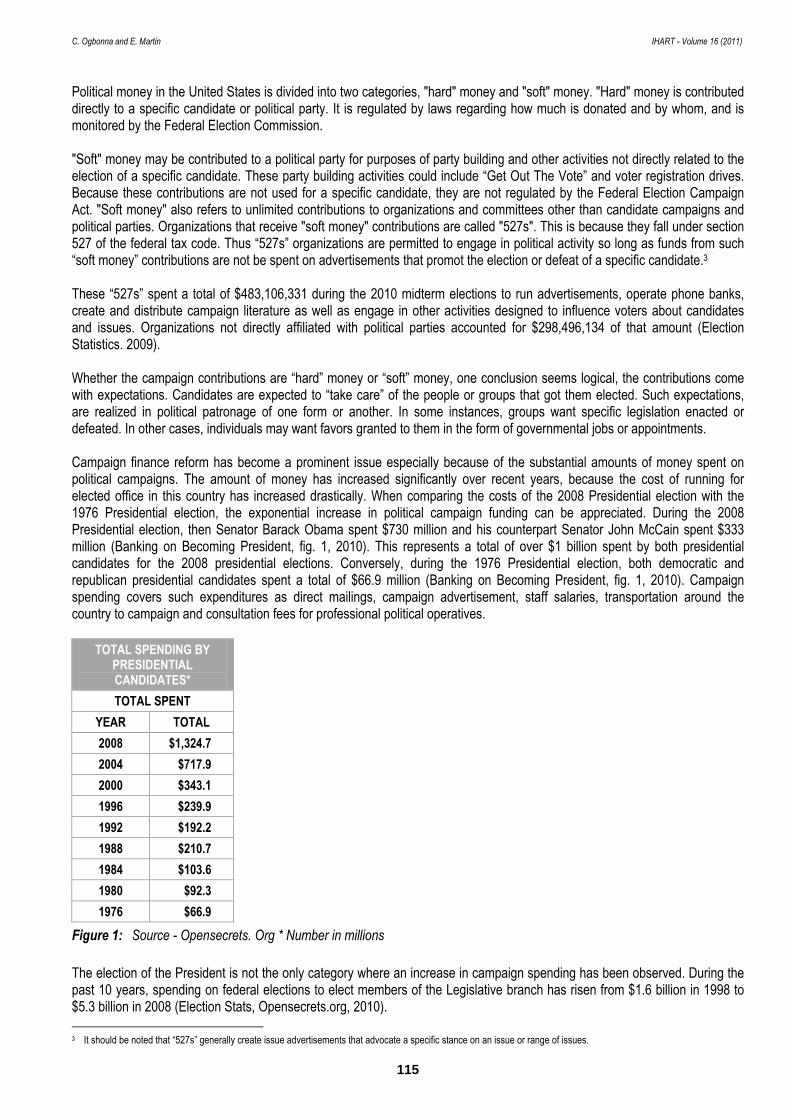
C. Ogbonna and E. Martin IHART - Volume 16 (2011)
115
Political money in the United States is divided into two categories, "hard" money and "soft" money. "Hard" money is contributed directly to a specific candidate or political party. It is regulated by laws regarding how much is donated and by whom, and is monitored by the Federal Election Commission. "Soft" money may be contributed to a political party for purposes of party building and other activities not directly related to the election of a specific candidate. These party building activities could include ―Get Out The Vote‖ and voter registration drives. Because these contributions are not used for a specific candidate, they are not regulated by the Federal Election Campaign Act. "Soft money" also refers to unlimited contributions to organizations and committees other than candidate campaigns and political parties. Organizations that receive "soft money" contributions are called "527s". This is because they fall under section 527 of the federal tax code. Thus ―527s‖ organizations are permitted to engage in political activity so long as funds from such ―soft money‖ contributions are not be spent on advertisements that promot the election or defeat of a specific candidate.3 These ―527s‖ spent a total of $483,106,331 during the 2010 midterm elections to run advertisements, operate phone banks, create and distribute campaign literature as well as engage in other activities designed to influence voters about candidates and issues. Organizations not directly affiliated with political parties accounted for $298,496,134 of that amount (Election Statistics. 2009). Whether the campaign contributions are ―hard‖ money or ―soft‖ money, one conclusion seems logical, the contributions come with expectations. Candidates are expected to ―take care‖ of the people or groups that got them elected. Such expectations, are realized in political patronage of one form or another. In some instances, groups want specific legislation enacted or defeated. In other cases, individuals may want favors granted to them in the form of governmental jobs or appointments. Campaign finance reform has become a prominent issue especially because of the substantial amounts of money spent on political campaigns. The amount of money has increased significantly over recent years, because the cost of running for elected office in this country has increased drastically. When comparing the costs of the 2008 Presidential election with the 1976 Presidential election, the exponential increase in political campaign funding can be appreciated. During the 2008 Presidential election, then Senator Barack Obama spent $730 million and his counterpart Senator John McCain spent $333 million (Banking on Becoming President, fig. 1, 2010). This represents a total of over $1 billion spent by both presidential candidates for the 2008 presidential elections. Conversely, during the 1976 Presidential election, both democratic and republican presidential candidates spent a total of $66.9 million (Banking on Becoming President, fig. 1, 2010). Campaign spending covers such expenditures as direct mailings, campaign advertisement, staff salaries, transportation around the country to campaign and consultation fees for professional political operatives.
TOTAL SPENDING BY PRESIDENTIAL CANDIDATES*
TOTAL SPENT
YEAR TOTAL
2008 $1,324.7
2004 $717.9
2000 $343.1
1996 $239.9
1992 $192.2
1988 $210.7
1984 $103.6
1980 $92.3
1976 $66.9
Figure 1: Source - Opensecrets. Org * Number in millions
The election of the President is not the only category where an increase in campaign spending has been observed. During the past 10 years, spending on federal elections to elect members of the Legislative branch has risen from $1.6 billion in 1998 to $5.3 billion in 2008 (Election Stats, Opensecrets.org, 2010).
3 It should be noted that ―527s‖ generally create issue advertisements that advocate a specific stance on an issue or range of issues.

The Correlation between Campaign Contributions and Legislation Authored in the Tennessee General Assembly
116
Cycle Total Cost of Election
2008* $5,285,680,883
2006 $2,852,658,140
2004* $4,147,304,003
2002 $2,181,682,066
2000* $3,082,340,937
1998 $1,618,936,265
*Presidential election cycle
Figure 2: Source Opensecrets.org
The National Center for Responsive Politics culled historical election expenditure data from 1980 through the 2008 Presidential election, and their data suggest that the cost of getting elected in this country has risen by staggering amounts. In 2008, the average amount spent on winning a House campaign was $1,372,539. In 1990, that amount was $407,956. The average winning Senate campaign spent about $8,531,267 in 2008 compared to $3,870,621 in 1990. The least expensive winning House race in 1990 cost $6,766, but that number rose to $94,049 in 2008. The lease expensive winning Senate race in 1990 cost $533,632, but that number rose to $1,981,441 in 2008, (National Center for Responsive Politics, 2011). In the instances where the least amount of money was spent, the candidates had the distinct advantage of living in a district that was decidedly at one end of the political ideological spectrum or the other. Likewise, all of the winners in the least expensive races ran for office in districts that did not have any major media markets, since major media markets, significantly drive up the costs of campaign advertising. During the 2010 midterm elections, general elections candidates spent about 3.7 billion dollars to run for office (Levinthal, 2010). This number is an appreciable increase from $153.5 million spent on general elections 22 years ago in 1978 (Geraci, 2008). That represents about a 414% increase. While the bulk of existing data regarding campaign finance focus on federal elections and federal campaign finance disclosure, elected officials at the state level face the same fundraising challenges as federal officials. One survey in the United States found that 23% of State candidates for political office, indicated that they spent more than half of their time fundraising. Over half of all respondents spent at least 1/4 of their time raising money (Campaigns and Elections, 2010). Thus it is clearly apparent that candidates must work harder to raise money necessary to run for office. With this increased effort, comes the concern about the possibility of corruption as politicians become more and more indebted to big contributors. Americans believe that most contributors give money to support candidates that they are in agreement with on one or more issues. There is likewise general public opinion that donors expect government favors in return, such as specific legislation being enacted or defeated. Thus, many have come to think of campaign finance as being in the same category as political corruption and bribery. Historically, political circumstances have lent some credence to the notion. For instance, in 1757, prior to the declaration of independence, George Washington was charged with ―a kind of campaign spending irregularity in his race for a seat in the Virginia House of Burgess because he was said to have purchased and distributed more than a quart of rum, beer, and hard cider per the 391 voters in the district during the campaign‖ (Geraci, 2002). Likewise, during the 1872 Presidential campaign, one contributor was responsible for contributing about one quarter of the total campaign finances to Ulysses S. Grant‘s presidential bid and thus, Grant became known as ―the president under the greatest obligation to men of wealth‖ (Federal Election Commission,2008). Also during the 1938 New York Mayor‘s race, people were paid $22.00 for an uncommitted vote (Geraci, 2008). For the 1972 Presidential election, the Nixon campaign received millions of dollars in undocumented campaign contributions including $100,000 that was left in a safe deposit box by Howard Hughes and $200,000 that was delivered in a briefcase by Robert Vesco ( Gerraci, 2008). These examples showcase how political candidates manage to circumvent or in some cases violate campaign finance regulations. Annually, legislation is introduced at the federal, state, and local level regarding campaign finance reform but such legislation are almost always defeated.
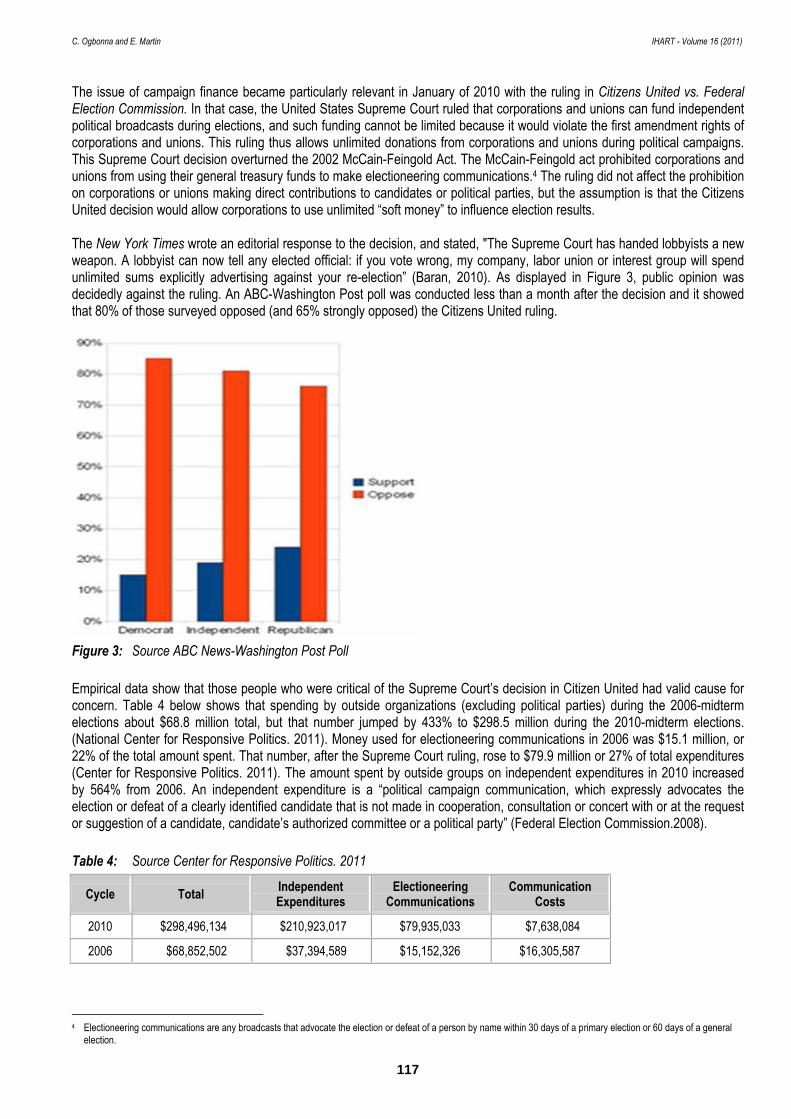
C. Ogbonna and E. Martin IHART - Volume 16 (2011)
117
The issue of campaign finance became particularly relevant in January of 2010 with the ruling in Citizens United vs. Federal Election Commission. In that case, the United States Supreme Court ruled that corporations and unions can fund independent political broadcasts during elections, and such funding cannot be limited because it would violate the first amendment rights of corporations and unions. This ruling thus allows unlimited donations from corporations and unions during political campaigns. This Supreme Court decision overturned the 2002 McCain-Feingold Act. The McCain-Feingold act prohibited corporations and unions from using their general treasury funds to make electioneering communications.4 The ruling did not affect the prohibition on corporations or unions making direct contributions to candidates or political parties, but the assumption is that the Citizens United decision would allow corporations to use unlimited ―soft money‖ to influence election results. The New York Times wrote an editorial response to the decision, and stated, "The Supreme Court has handed lobbyists a new weapon. A lobbyist can now tell any elected official: if you vote wrong, my company, labor union or interest group will spend unlimited sums explicitly advertising against your re-election‖ (Baran, 2010). As displayed in Figure 3, public opinion was decidedly against the ruling. An ABC-Washington Post poll was conducted less than a month after the decision and it showed that 80% of those surveyed opposed (and 65% strongly opposed) the Citizens United ruling.
Figure 3: Source ABC News-Washington Post Poll
Empirical data show that those people who were critical of the Supreme Court‘s decision in Citizen United had valid cause for concern. Table 4 below shows that spending by outside organizations (excluding political parties) during the 2006-midterm elections about $68.8 million total, but that number jumped by 433% to $298.5 million during the 2010-midterm elections. (National Center for Responsive Politics. 2011). Money used for electioneering communications in 2006 was $15.1 million, or 22% of the total amount spent. That number, after the Supreme Court ruling, rose to $79.9 million or 27% of total expenditures (Center for Responsive Politics. 2011). The amount spent by outside groups on independent expenditures in 2010 increased by 564% from 2006. An independent expenditure is a ―political campaign communication, which expressly advocates the election or defeat of a clearly identified candidate that is not made in cooperation, consultation or concert with or at the request or suggestion of a candidate, candidate‘s authorized committee or a political party‖ (Federal Election Commission.2008).
Table 4: Source Center for Responsive Politics. 2011
Cycle Total Independent Expenditures
Electioneering Communications
Communication Costs
2010 $298,496,134 $210,923,017 $79,935,033 $7,638,084
2006 $68,852,502 $37,394,589 $15,152,326 $16,305,587
4 Electioneering communications are any broadcasts that advocate the election or defeat of a person by name within 30 days of a primary election or 60 days of a general
election.
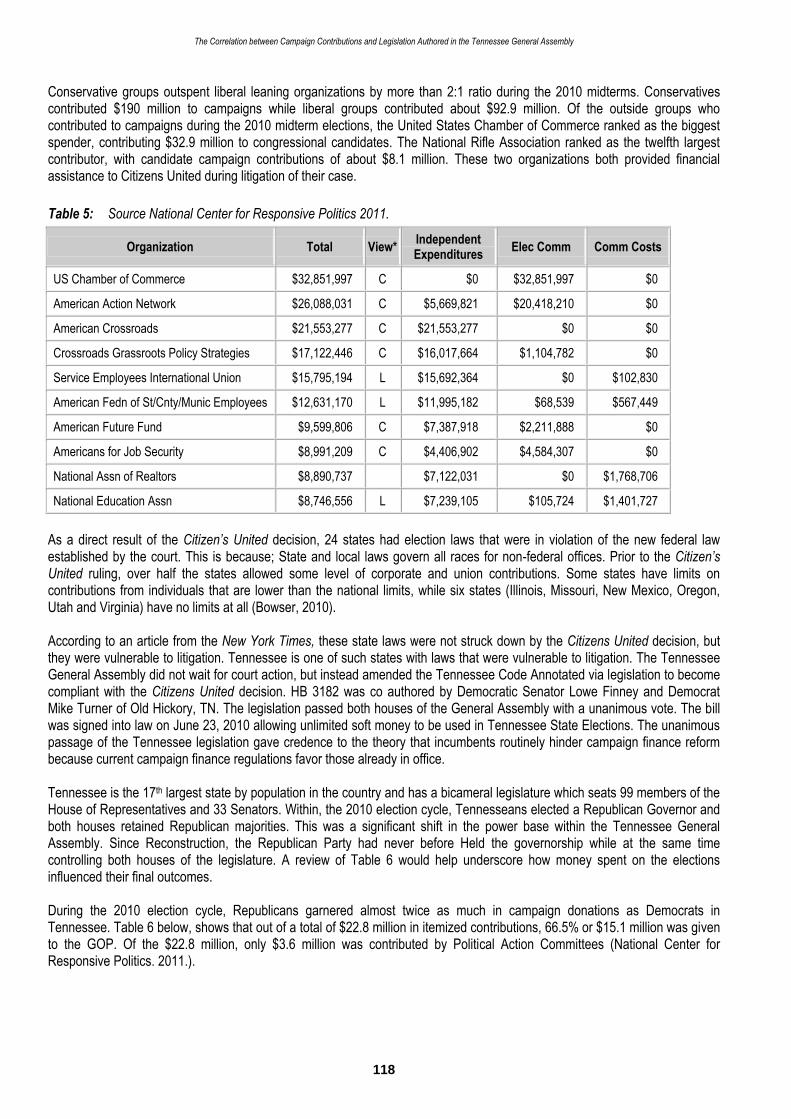
The Correlation between Campaign Contributions and Legislation Authored in the Tennessee General Assembly
118
Conservative groups outspent liberal leaning organizations by more than 2:1 ratio during the 2010 midterms. Conservatives contributed $190 million to campaigns while liberal groups contributed about $92.9 million. Of the outside groups who contributed to campaigns during the 2010 midterm elections, the United States Chamber of Commerce ranked as the biggest spender, contributing $32.9 million to congressional candidates. The National Rifle Association ranked as the twelfth largest contributor, with candidate campaign contributions of about $8.1 million. These two organizations both provided financial assistance to Citizens United during litigation of their case.
Table 5: Source National Center for Responsive Politics 2011.
Organization Total View* Independent Expenditures
Elec Comm Comm Costs
US Chamber of Commerce $32,851,997 C $0 $32,851,997 $0
American Action Network $26,088,031 C $5,669,821 $20,418,210 $0
American Crossroads $21,553,277 C $21,553,277 $0 $0
Crossroads Grassroots Policy Strategies $17,122,446 C $16,017,664 $1,104,782 $0
Service Employees International Union $15,795,194 L $15,692,364 $0 $102,830
American Fedn of St/Cnty/Munic Employees $12,631,170 L $11,995,182 $68,539 $567,449
American Future Fund $9,599,806 C $7,387,918 $2,211,888 $0
Americans for Job Security $8,991,209 C $4,406,902 $4,584,307 $0
National Assn of Realtors $8,890,737
$7,122,031 $0 $1,768,706
National Education Assn $8,746,556 L $7,239,105 $105,724 $1,401,727
As a direct result of the Citizen‘s United decision, 24 states had election laws that were in violation of the new federal law established by the court. This is because; State and local laws govern all races for non-federal offices. Prior to the Citizen‘s United ruling, over half the states allowed some level of corporate and union contributions. Some states have limits on contributions from individuals that are lower than the national limits, while six states (Illinois, Missouri, New Mexico, Oregon, Utah and Virginia) have no limits at all (Bowser, 2010). According to an article from the New York Times, these state laws were not struck down by the Citizens United decision, but they were vulnerable to litigation. Tennessee is one of such states with laws that were vulnerable to litigation. The Tennessee General Assembly did not wait for court action, but instead amended the Tennessee Code Annotated via legislation to become compliant with the Citizens United decision. HB 3182 was co authored by Democratic Senator Lowe Finney and Democrat Mike Turner of Old Hickory, TN. The legislation passed both houses of the General Assembly with a unanimous vote. The bill was signed into law on June 23, 2010 allowing unlimited soft money to be used in Tennessee State Elections. The unanimous passage of the Tennessee legislation gave credence to the theory that incumbents routinely hinder campaign finance reform because current campaign finance regulations favor those already in office. Tennessee is the 17th largest state by population in the country and has a bicameral legislature which seats 99 members of the House of Representatives and 33 Senators. Within, the 2010 election cycle, Tennesseans elected a Republican Governor and both houses retained Republican majorities. This was a significant shift in the power base within the Tennessee General Assembly. Since Reconstruction, the Republican Party had never before Held the governorship while at the same time controlling both houses of the legislature. A review of Table 6 would help underscore how money spent on the elections influenced their final outcomes. During the 2010 election cycle, Republicans garnered almost twice as much in campaign donations as Democrats in Tennessee. Table 6 below, shows that out of a total of $22.8 million in itemized contributions, 66.5% or $15.1 million was given to the GOP. Of the $22.8 million, only $3.6 million was contributed by Political Action Committees (National Center for Responsive Politics. 2011.).
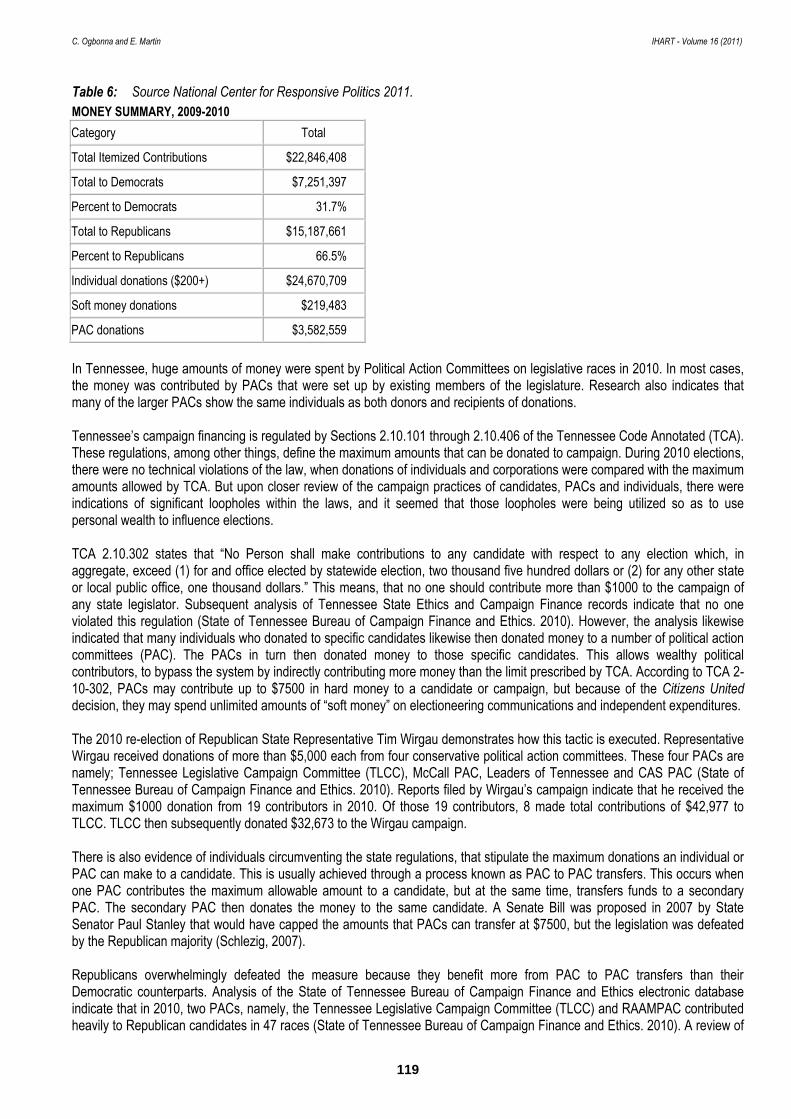
C. Ogbonna and E. Martin IHART - Volume 16 (2011)
119
Table 6: Source National Center for Responsive Politics 2011.
MONEY SUMMARY, 2009-2010
Category Total
Total Itemized Contributions $22,846,408
Total to Democrats $7,251,397
Percent to Democrats 31.7%
Total to Republicans $15,187,661
Percent to Republicans 66.5%
Individual donations ($200+) $24,670,709
Soft money donations $219,483
PAC donations $3,582,559
In Tennessee, huge amounts of money were spent by Political Action Committees on legislative races in 2010. In most cases, the money was contributed by PACs that were set up by existing members of the legislature. Research also indicates that many of the larger PACs show the same individuals as both donors and recipients of donations. Tennessee‘s campaign financing is regulated by Sections 2.10.101 through 2.10.406 of the Tennessee Code Annotated (TCA). These regulations, among other things, define the maximum amounts that can be donated to campaign. During 2010 elections, there were no technical violations of the law, when donations of individuals and corporations were compared with the maximum amounts allowed by TCA. But upon closer review of the campaign practices of candidates, PACs and individuals, there were indications of significant loopholes within the laws, and it seemed that those loopholes were being utilized so as to use personal wealth to influence elections. TCA 2.10.302 states that ―No Person shall make contributions to any candidate with respect to any election which, in aggregate, exceed (1) for and office elected by statewide election, two thousand five hundred dollars or (2) for any other state or local public office, one thousand dollars.‖ This means, that no one should contribute more than $1000 to the campaign of any state legislator. Subsequent analysis of Tennessee State Ethics and Campaign Finance records indicate that no one violated this regulation (State of Tennessee Bureau of Campaign Finance and Ethics. 2010). However, the analysis likewise indicated that many individuals who donated to specific candidates likewise then donated money to a number of political action committees (PAC). The PACs in turn then donated money to those specific candidates. This allows wealthy political contributors, to bypass the system by indirectly contributing more money than the limit prescribed by TCA. According to TCA 2-10-302, PACs may contribute up to $7500 in hard money to a candidate or campaign, but because of the Citizens United decision, they may spend unlimited amounts of ―soft money‖ on electioneering communications and independent expenditures. The 2010 re-election of Republican State Representative Tim Wirgau demonstrates how this tactic is executed. Representative Wirgau received donations of more than $5,000 each from four conservative political action committees. These four PACs are namely; Tennessee Legislative Campaign Committee (TLCC), McCall PAC, Leaders of Tennessee and CAS PAC (State of Tennessee Bureau of Campaign Finance and Ethics. 2010). Reports filed by Wirgau‘s campaign indicate that he received the maximum $1000 donation from 19 contributors in 2010. Of those 19 contributors, 8 made total contributions of $42,977 to TLCC. TLCC then subsequently donated $32,673 to the Wirgau campaign. There is also evidence of individuals circumventing the state regulations, that stipulate the maximum donations an individual or PAC can make to a candidate. This is usually achieved through a process known as PAC to PAC transfers. This occurs when one PAC contributes the maximum allowable amount to a candidate, but at the same time, transfers funds to a secondary PAC. The secondary PAC then donates the money to the same candidate. A Senate Bill was proposed in 2007 by State Senator Paul Stanley that would have capped the amounts that PACs can transfer at $7500, but the legislation was defeated by the Republican majority (Schlezig, 2007). Republicans overwhelmingly defeated the measure because they benefit more from PAC to PAC transfers than their Democratic counterparts. Analysis of the State of Tennessee Bureau of Campaign Finance and Ethics electronic database indicate that in 2010, two PACs, namely, the Tennessee Legislative Campaign Committee (TLCC) and RAAMPAC contributed heavily to Republican candidates in 47 races (State of Tennessee Bureau of Campaign Finance and Ethics. 2010). A review of

The Correlation between Campaign Contributions and Legislation Authored in the Tennessee General Assembly
120
campaign financial disclosures likewise indicate that in 2010, RAAMPAC donated a total of $55,000 to TLCC and during that period, 6 of the 14 candidates who were supported by RAAMPAC also received donations from TLCC totaling $112,770. Invariably a total of 58 PACs donated $837,611 to TLCC (State of Tennessee Bureau of Campaign Finance and Ethics. 2010). The huge amounts of special interest money spent electing both Republican and Democrats to the state legislature provides a reason for concern about the possible effects that these donations have on legislative direction of the state. This is especially true of the Republican majorities elected currently to the state legislature. By examining pieces of legislation authored during the 107th General Assembly, there appears to be a correlation between campaign contributions and nature of the laws proposed by elected legislators. Research data indicate that candidates are inclined to pass or defeat legislation that is most closely aligned with legislative priorities of their campaign financiers. A review of five specific bills authored within the current session of the General Assembly demonstrates that indication. There have been a total of 2152 pieces of legislation proposed within the Tennessee State House of Representatives and 2110 within the Senate (State of Tennessee. 2011). For each bill introduced in the House of Representatives, a companion bill is also introduced in the State Senate. The legislations proposed within this General Assembly has covered a broad spectrum of categories, but for purposes of this research, legislation that will be reviewed are ones that concerning teacher tenure, gun rights, health care, immigration reform and alcohol regulations. The reform of teacher tenure in Tennessee was at the top of the legislative agenda for newly elected Governor Bill Haslam‘s education reforms. As such the Governor wanted to revamp tenure laws in Tennessee. Similar such educational tenure reforms are currently pending in New Jersey, Idaho, Nevada, Florida and Indiana. All the states considering such changes in tenure laws have Republican governors. Tenure laws were originally passed in 1909 in New Jersey to protect teachers from terminations based on race, sex or political views. Public school teachers typically are granted tenure after three to five years of probation. Once tenured, teachers have the right to a due-process hearing before they can be terminated. This makes it both expensive and time consuming to proceed with separation. As such, the legislation passed in Tennessee creates two major changes to existing teacher tenure laws. The first shift in policy is that teachers will have to be rehired within the same school system for five consecutive years in order to be granted tenure. Prior to being granted tenure, educators are considered to be in a probationary period and are hired for one year contract periods. When those periods are up, they may at the discretion of the Local Education Association, be rehired. Tenure laws prior to the proposed reform legislation stipulate that teachers must only be rehired for three years. According to the National Education Association, three to five years is the national United States standard for a teacher to attain tenure. The second major change to current policy is that when a tenured teacher is scored as ―inefficient‖ for two years, they lose their tenure and may then be terminated without cause and without ―due process hearing.‖ Once a teacher loses tenure, they must then successfully complete the probationary period again for five consecutive years within the same school system in order to regain their tenure. The teacher tenure reform legislation (HB 2012) was sponsored on 17th of February, 2011, by 19 Republican representatives. Likewise 15 Republican senators sponsored the corresponding SB 1528 on the same day. The primary sponsor of the house bill was Gerald McCormick, and Mark Norris authored the bill in the senate. The legislation passed the Senate on a partisan vote of 21-12 and the House by 65-32, along party lines. McCormick, who is a four term Republican from the 26th District, represents Chattanooga and sits on the House Government Operations, Ways & Means, State & Local Government, Calendar & Rules Committees and also serves as the Majority Leader within the house. While not serving in the legislature, he is a commercial real estate broker. During the 2011 legislative session, he had authored 96 bills covering a broad range of issues. Of the 96 bills, only three deal with education. The other two education bills focus on administrative changes to job description of the State Education Commissioner (State of Tennessee. 2011). Norris is a two term Republican from the 32nd District and represents citizens in Dyer, Lauderdale, Tipton and parts of Shelby Counties. He currently serves on the Senate Rules, Calendar, Ethics, Delayed Bills, Ways & Means, and State & Local Government Committees and also serves as the Majority Leader in the senate. He is an attorney and farmer. During the 2011 legislative session, he authored 97 bills, of which four pertained to education. Neither of the above mentioned authors serve on any Education committee or subcommittee within the legislature, nor do they serve on any advisory boards within their districts that deal with public education (State of Tennessee. 2011). Norris is on the board of directors for a private school in Shelbyville. This lack of involvement by the authors of the teacher‘s reform bill, with regards tp public education policy creation at the state or local level is important to note.

C. Ogbonna and E. Martin IHART - Volume 16 (2011)
121
While the legislation had no primary support from any individual corporation or political action committee, a concurrent effect of the legislation is the weakening of teachers unions. If more authority is given to administrators, and due process hearings are not needed to terminate educators, then there is less of a need for teachers unions. The Tennessee Education Association (TEA), a 52,000 union member organization that represents 64,000 public school teachers stand to be negatively impacted by the new legislation. During debate on the legislation, Democrats accused Republicans of trying to harm TEA and subsequently decreasing TEA‘s political ability to support Democrats during future elections. There is also legislation pending before the General Assembly that would abolish the ability of TEA to collectively bargain. This provides some credence to the theory that there is an organized effort to diminish political abilities of TEA. TEA is a branch of the National Education Association, that traditionally supports Democratic candidates, and 2010 campaign finance disclosures indicated that they did not donate to the campaigns of any of the 34 legislators who sponsored or co-sponsored the bill (State of Tennessee. 2011). It is important to note that conservative PACs as well as Republicans stand to gain the most political ground from passage of HB 2012/SB 1528 and as such they donated heavily to the campaigns of the 34 sponsors and co-sponsors of the teachers‘ reform bill. According to individual campaign disclosure forms, conservative PACs donated a total of $200, 464 to the 19 house sponsors (State of Tennessee Bureau of Campaign Finance and Ethics. 2010). Appendix A, provides a summary of political donations with regards to the teacher tenure reform bill. The Appendix indicates that large sums of money were donated to such representatives, by PACs who had ideologies that were opposite to that of the TEA. The representatives who got campaign donations delivered the votes to pass the legislation. While teacher tenure garnered the most coverage of any legislation during the current session, the rights of gun owners to carry handguns in bars and restaurants that serve alcohol was the most widely publicized issue of the previous General Assembly. Last year, Tennessee became just one of four states that allow individuals with a handgun permit to carry weapons into bars and restaurants that serve alcohol. Tennessee has over 300,000 citizens in possession of handgun carry permits (Malcolm, 2010). Both houses of the legislature voted to override the veto of then Governor Bredesen in passing HB 3125/SB3012. The law stipulates that if there is no posted prohibition of weapons, an individual with a permit to carry handgun can possess a handgun within an establishment where alcohol is served, provided the individual does not consume alcohol. When the bill was vetoed, it was reintroduced with an amendment which would still have allowed guns in restaurants but not bars, but the National Rifle Association (NRA) opposed the amendment to the bill. Thus, NRA lobbied legislators to override the veto instead. The override of the Governor‘s veto came after a two week blitz, during which NRA lobbied members of the assembly very hard. In an unprecedented move, an NRA lobbyist attended a closed door session of the Republican Caucus to inform members that the NRA considered the defeat of the amendment a ―weighted issue that would figure into the gun lobby‘s endorsements during the following year‘s elections‖ (Locker, 2010). After the meeting, eight Republicans and one Democrat changed their vote to approve the new legislation with the amendment and likewise voted to table the new bill. All nine then voted to override the Governor‘s veto on the original bill. The NRA has approximately 4 million members and members of Congress have ranked the NRA as the most powerful lobbying organization in the country several years in a row. The NRA has a lot of political clout, because prior to each election, the NRA publishes their favored voting recommendations for their members based on the potential candidates‘ firearms related voting records (Fortune. 1999). In response to the new law, a waiter at a Nashville restaurant filed a complaint with the Tennessee Occupational Health and Safety Administration claiming that the presence of firearms created an unsafe work environment. The claim was denied by the Administration. In response to that single claim, the Tennessee General Assembly passed legislation during the current session that specified ―an employer permitting a person with a handgun carry permit to carry a handgun on the employer‘s property does not constitute an occupational safety and health hazard to the employees‖ (State of Tennessee. 2011.). HB 0283 was proposed by Rep Vance Dennis, a two-term Republican who represents Hardin, McNairy and part of Decatur Counties. Dennis, an attorney, serves on the House Judiciary and House Health & Human resources Committees. Dennis had authored 72 bills this session, and most of the bills relate to tort reform. HB0283 is the only legislation written by Dennis dealing with firearms.
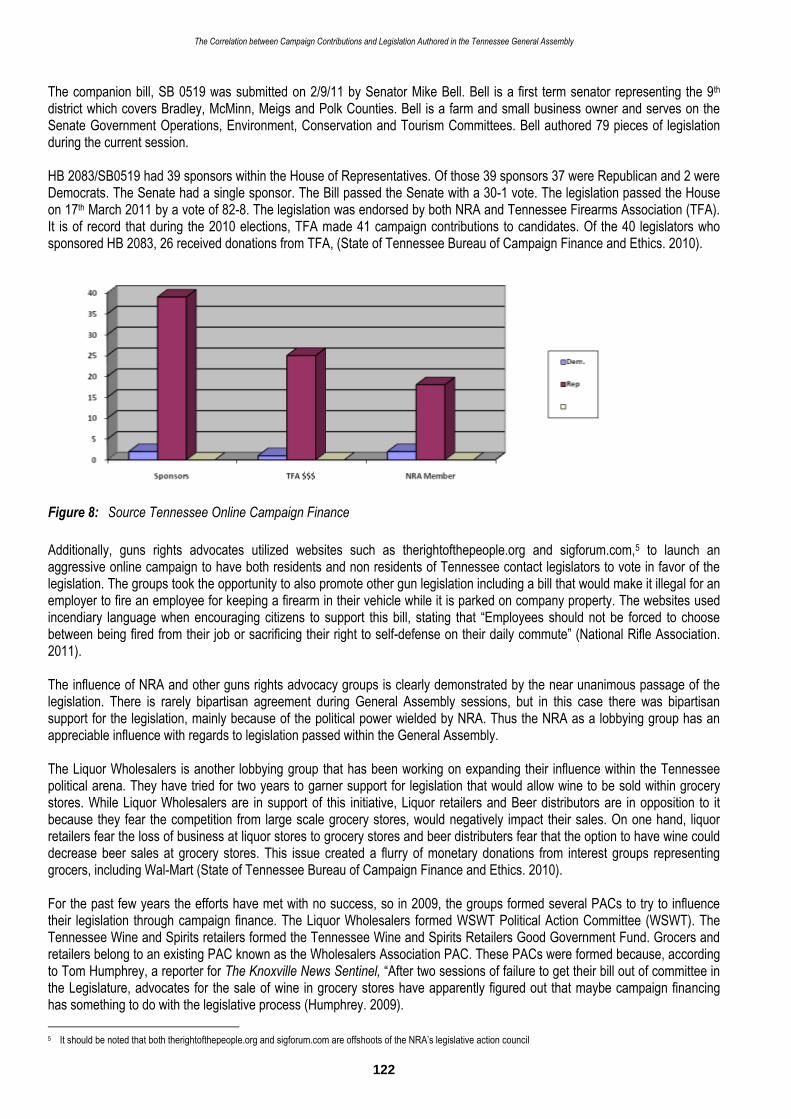
The Correlation between Campaign Contributions and Legislation Authored in the Tennessee General Assembly
122
The companion bill, SB 0519 was submitted on 2/9/11 by Senator Mike Bell. Bell is a first term senator representing the 9th district which covers Bradley, McMinn, Meigs and Polk Counties. Bell is a farm and small business owner and serves on the Senate Government Operations, Environment, Conservation and Tourism Committees. Bell authored 79 pieces of legislation during the current session. HB 2083/SB0519 had 39 sponsors within the House of Representatives. Of those 39 sponsors 37 were Republican and 2 were Democrats. The Senate had a single sponsor. The Bill passed the Senate with a 30-1 vote. The legislation passed the House on 17th March 2011 by a vote of 82-8. The legislation was endorsed by both NRA and Tennessee Firearms Association (TFA). It is of record that during the 2010 elections, TFA made 41 campaign contributions to candidates. Of the 40 legislators who sponsored HB 2083, 26 received donations from TFA, (State of Tennessee Bureau of Campaign Finance and Ethics. 2010).
Figure 8: Source Tennessee Online Campaign Finance
Additionally, guns rights advocates utilized websites such as therightofthepeople.org and sigforum.com,5 to launch an aggressive online campaign to have both residents and non residents of Tennessee contact legislators to vote in favor of the legislation. The groups took the opportunity to also promote other gun legislation including a bill that would make it illegal for an employer to fire an employee for keeping a firearm in their vehicle while it is parked on company property. The websites used incendiary language when encouraging citizens to support this bill, stating that ―Employees should not be forced to choose between being fired from their job or sacrificing their right to self-defense on their daily commute‖ (National Rifle Association. 2011). The influence of NRA and other guns rights advocacy groups is clearly demonstrated by the near unanimous passage of the legislation. There is rarely bipartisan agreement during General Assembly sessions, but in this case there was bipartisan support for the legislation, mainly because of the political power wielded by NRA. Thus the NRA as a lobbying group has an appreciable influence with regards to legislation passed within the General Assembly. The Liquor Wholesalers is another lobbying group that has been working on expanding their influence within the Tennessee political arena. They have tried for two years to garner support for legislation that would allow wine to be sold within grocery stores. While Liquor Wholesalers are in support of this initiative, Liquor retailers and Beer distributors are in opposition to it because they fear the competition from large scale grocery stores, would negatively impact their sales. On one hand, liquor retailers fear the loss of business at liquor stores to grocery stores and beer distributers fear that the option to have wine could decrease beer sales at grocery stores. This issue created a flurry of monetary donations from interest groups representing grocers, including Wal-Mart (State of Tennessee Bureau of Campaign Finance and Ethics. 2010). For the past few years the efforts have met with no success, so in 2009, the groups formed several PACs to try to influence their legislation through campaign finance. The Liquor Wholesalers formed WSWT Political Action Committee (WSWT). The Tennessee Wine and Spirits retailers formed the Tennessee Wine and Spirits Retailers Good Government Fund. Grocers and retailers belong to an existing PAC known as the Wholesalers Association PAC. These PACs were formed because, according to Tom Humphrey, a reporter for The Knoxville News Sentinel, ―After two sessions of failure to get their bill out of committee in the Legislature, advocates for the sale of wine in grocery stores have apparently figured out that maybe campaign financing has something to do with the legislative process (Humphrey. 2009).
5 It should be noted that both therightofthepeople.org and sigforum.com are offshoots of the NRA‘s legislative action council
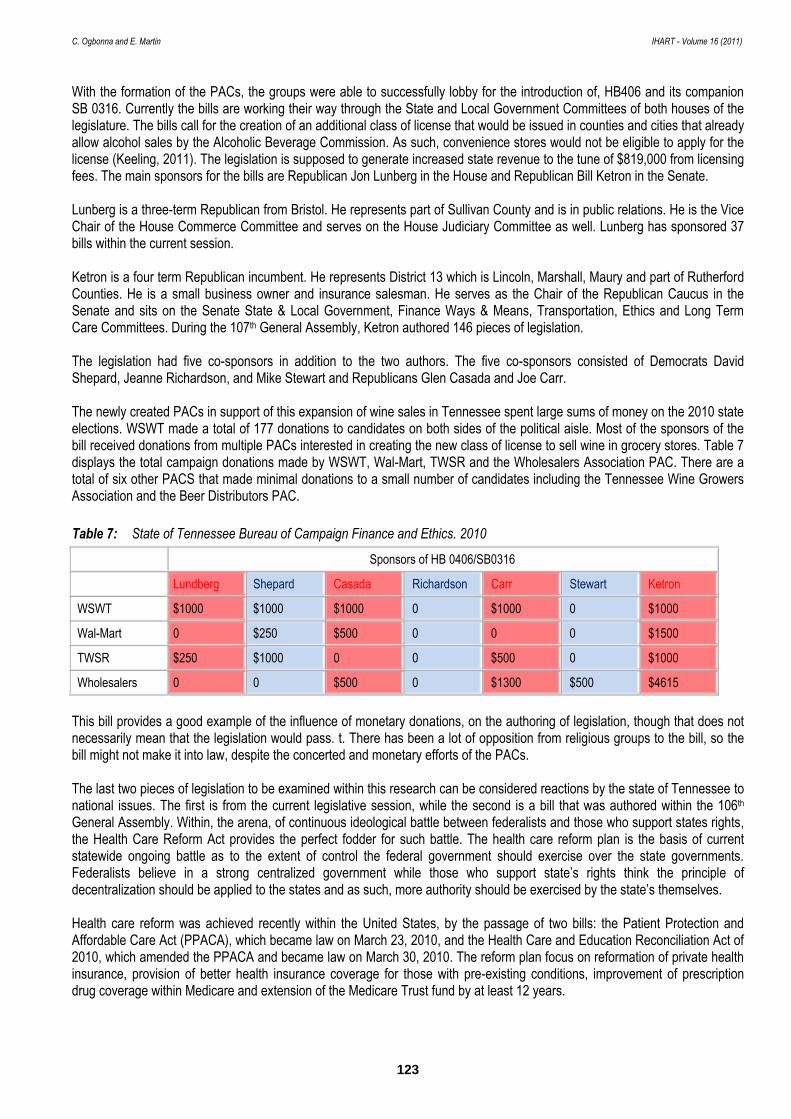
C. Ogbonna and E. Martin IHART - Volume 16 (2011)
123
With the formation of the PACs, the groups were able to successfully lobby for the introduction of, HB406 and its companion SB 0316. Currently the bills are working their way through the State and Local Government Committees of both houses of the legislature. The bills call for the creation of an additional class of license that would be issued in counties and cities that already allow alcohol sales by the Alcoholic Beverage Commission. As such, convenience stores would not be eligible to apply for the license (Keeling, 2011). The legislation is supposed to generate increased state revenue to the tune of $819,000 from licensing fees. The main sponsors for the bills are Republican Jon Lunberg in the House and Republican Bill Ketron in the Senate. Lunberg is a three-term Republican from Bristol. He represents part of Sullivan County and is in public relations. He is the Vice Chair of the House Commerce Committee and serves on the House Judiciary Committee as well. Lunberg has sponsored 37 bills within the current session. Ketron is a four term Republican incumbent. He represents District 13 which is Lincoln, Marshall, Maury and part of Rutherford Counties. He is a small business owner and insurance salesman. He serves as the Chair of the Republican Caucus in the Senate and sits on the Senate State & Local Government, Finance Ways & Means, Transportation, Ethics and Long Term Care Committees. During the 107th General Assembly, Ketron authored 146 pieces of legislation. The legislation had five co-sponsors in addition to the two authors. The five co-sponsors consisted of Democrats David Shepard, Jeanne Richardson, and Mike Stewart and Republicans Glen Casada and Joe Carr. The newly created PACs in support of this expansion of wine sales in Tennessee spent large sums of money on the 2010 state elections. WSWT made a total of 177 donations to candidates on both sides of the political aisle. Most of the sponsors of the bill received donations from multiple PACs interested in creating the new class of license to sell wine in grocery stores. Table 7 displays the total campaign donations made by WSWT, Wal-Mart, TWSR and the Wholesalers Association PAC. There are a total of six other PACS that made minimal donations to a small number of candidates including the Tennessee Wine Growers Association and the Beer Distributors PAC.
Table 7: State of Tennessee Bureau of Campaign Finance and Ethics. 2010
Sponsors of HB 0406/SB0316
Lundberg Shepard Casada Richardson Carr Stewart Ketron
WSWT $1000 $1000 $1000 0 $1000 0 $1000
Wal-Mart 0 $250 $500 0 0 0 $1500
TWSR $250 $1000 0 0 $500 0 $1000
Wholesalers 0 0 $500 0 $1300 $500 $4615
This bill provides a good example of the influence of monetary donations, on the authoring of legislation, though that does not necessarily mean that the legislation would pass. t. There has been a lot of opposition from religious groups to the bill, so the bill might not make it into law, despite the concerted and monetary efforts of the PACs. The last two pieces of legislation to be examined within this research can be considered reactions by the state of Tennessee to national issues. The first is from the current legislative session, while the second is a bill that was authored within the 106th General Assembly. Within, the arena, of continuous ideological battle between federalists and those who support states rights, the Health Care Reform Act provides the perfect fodder for such battle. The health care reform plan is the basis of current statewide ongoing battle as to the extent of control the federal government should exercise over the state governments. Federalists believe in a strong centralized government while those who support state‘s rights think the principle of decentralization should be applied to the states and as such, more authority should be exercised by the state‘s themselves. Health care reform was achieved recently within the United States, by the passage of two bills: the Patient Protection and Affordable Care Act (PPACA), which became law on March 23, 2010, and the Health Care and Education Reconciliation Act of 2010, which amended the PPACA and became law on March 30, 2010. The reform plan focus on reformation of private health insurance, provision of better health insurance coverage for those with pre-existing conditions, improvement of prescription drug coverage within Medicare and extension of the Medicare Trust fund by at least 12 years.
The Correlation between Campaign Contributions and Legislation Authored in the Tennessee General Assembly
124
The comprehensive Affordable Care Act makes health insurance affordable for millions of Americans and protects them against potentially catastrophic medical expenses. This law has become the subject of several lawsuits challenging the constitutionality of the Act, specifically the provision that requires eligible Americans to maintain basic health insurance coverage. This is commonly referred to as the imposition of ―individual mandates‖ to maintain insurance. If an individual, under the new law, fails to obtain insurance, they must pay a fine. Six state attorneys general have filed lawsuits in federal courts to exempt their states from participating in the new federal healthcare Act. The state of Tennessee filed a brief with the state attorney general; however, the Attorney general did not proceed with the lawsuit. Thus, the General Assembly introduced legislation this session to combat PPACA. The legislation is HB0369 and its companion in the senate is SB0326. The bill creates a multi-state organization called a Health Care Compact. The Compact would exist to ―study the issues of health care regulation of particular concern to member states, such as the elimination of interstate barriers to the provision of health care. After consideration, the commission may make nonbinding recommendations to the member states. Additionally, the commission would collect information and data to assist the member states in their regulation of health care, including assessing the performance of various state health care programs and compiling information on the cost of health care. The commission would make this information available to the legislatures of the member states‖ (State of Tennessee. 2011). The measure authorizes Tennessee's participation in a multi-state compact, which would not become effective until the plan is approved at the federal level by Congress. If Congress approves, each member state in the compact would be granted a waiver from all current rules for spending federal health care dollars sent to the states. It would also allow states to opt out of the national health care reform law enacted last year. The legislation is currently wending through Health and Human Resources Committees of both houses of the legislature. The primary sponsor in the Senate is Republican Mae Beavers. Beavers is a two term incumbent who represents Cannon, Clay, DeKalb, Macon, Smith Counties as well as parts of Sumner, Trousdale and Wilson Counties in the 17th District. She is a businesswoman and serves as the Chair of the Senate Judiciary Committee as well as a member of the Commerce, Labor & Agriculture and Transportation Committees. Beavers is the treasurer of the Senate Republican Caucus, and has authored a total of 75 bills during the current legislative session, although this is the only bill that deals with public health. The primary sponsor in the House is Republican Mark White a two term incumbent and business man who represents part of Shelby County in the 83rd District. He serves on the House Children & Family Affairs, Consumer &Employee Affairs, and Health & Human Resources Committees. White has sponsored 28 pieces of legislation and two of the bills are related to public health. PACs opposed to PPACA spent large sums of money on campaigns for the two primary sponsors during the 2010 election cycle. As Table 8 shows, Beavers received a total of $48,750 in campaign contributions from PACs in opposition to the federal legislation. This amount accounted for 19% of the $263,125 that Beavers accepted from PACs in addition to the $60,000 she received from the Senate Republican Caucus, an organization in which she serves as treasurer (State of TN, 2011). Beavers accepted a total of 215 separate donations from special interest groups within the 2010 election cycle. White received nine donations from such PACs totaling $6,050 which represented 37.8% of the $16,000 special interest money he accepted in 2010. Table 9 details the breakdown of donations to the White campaign by PACs within the medical and insurance fields.
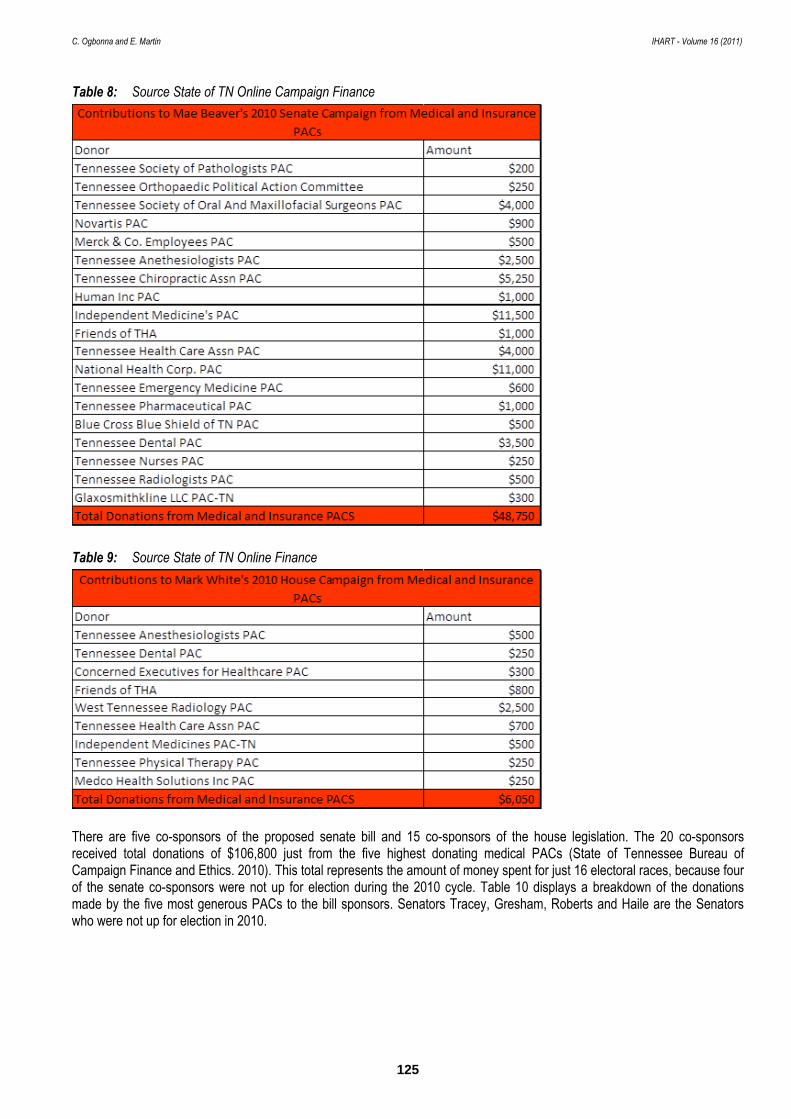
C. Ogbonna and E. Martin IHART - Volume 16 (2011)
125
Table 8: Source State of TN Online Campaign Finance
Table 9: Source State of TN Online Finance
There are five co-sponsors of the proposed senate bill and 15 co-sponsors of the house legislation. The 20 co-sponsors received total donations of $106,800 just from the five highest donating medical PACs (State of Tennessee Bureau of Campaign Finance and Ethics. 2010). This total represents the amount of money spent for just 16 electoral races, because four of the senate co-sponsors were not up for election during the 2010 cycle. Table 10 displays a breakdown of the donations made by the five most generous PACs to the bill sponsors. Senators Tracey, Gresham, Roberts and Haile are the Senators who were not up for election in 2010.
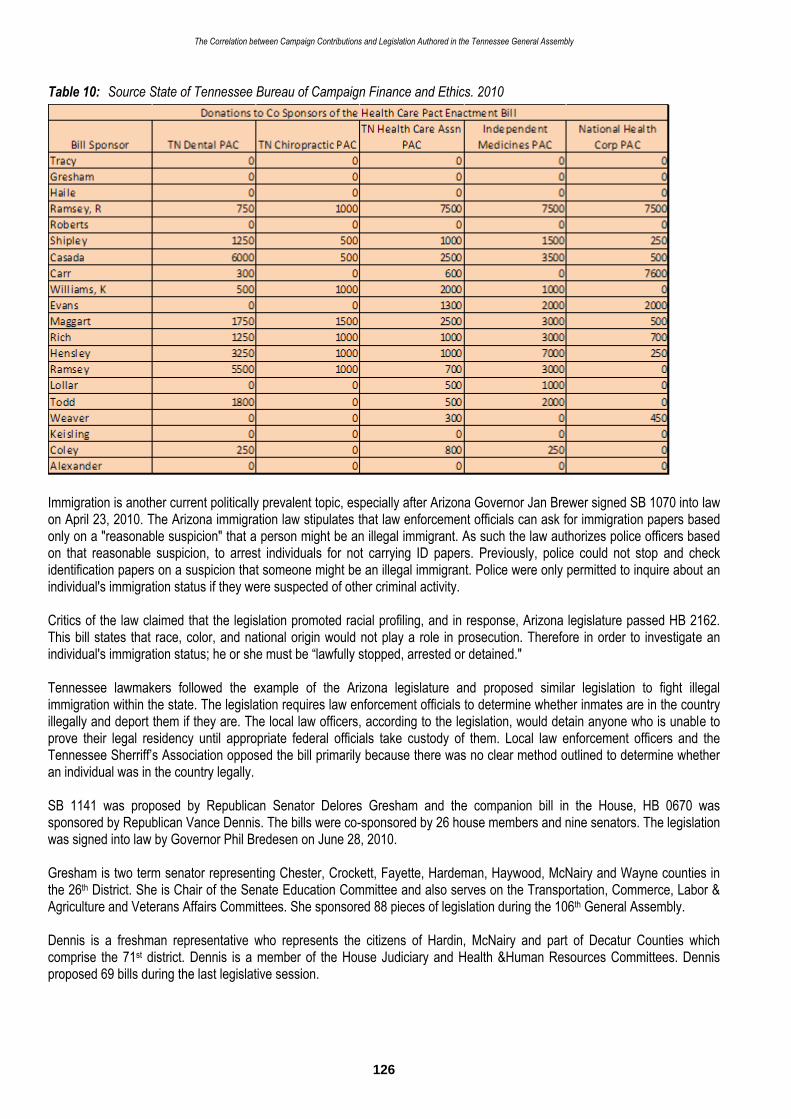
The Correlation between Campaign Contributions and Legislation Authored in the Tennessee General Assembly
126
Table 10: Source State of Tennessee Bureau of Campaign Finance and Ethics. 2010
Immigration is another current politically prevalent topic, especially after Arizona Governor Jan Brewer signed SB 1070 into law on April 23, 2010. The Arizona immigration law stipulates that law enforcement officials can ask for immigration papers based only on a "reasonable suspicion" that a person might be an illegal immigrant. As such the law authorizes police officers based on that reasonable suspicion, to arrest individuals for not carrying ID papers. Previously, police could not stop and check identification papers on a suspicion that someone might be an illegal immigrant. Police were only permitted to inquire about an individual's immigration status if they were suspected of other criminal activity. Critics of the law claimed that the legislation promoted racial profiling, and in response, Arizona legislature passed HB 2162. This bill states that race, color, and national origin would not play a role in prosecution. Therefore in order to investigate an individual's immigration status; he or she must be ―lawfully stopped, arrested or detained." Tennessee lawmakers followed the example of the Arizona legislature and proposed similar legislation to fight illegal immigration within the state. The legislation requires law enforcement officials to determine whether inmates are in the country illegally and deport them if they are. The local law officers, according to the legislation, would detain anyone who is unable to prove their legal residency until appropriate federal officials take custody of them. Local law enforcement officers and the Tennessee Sherriff‘s Association opposed the bill primarily because there was no clear method outlined to determine whether an individual was in the country legally. SB 1141 was proposed by Republican Senator Delores Gresham and the companion bill in the House, HB 0670 was sponsored by Republican Vance Dennis. The bills were co-sponsored by 26 house members and nine senators. The legislation was signed into law by Governor Phil Bredesen on June 28, 2010. Gresham is two term senator representing Chester, Crockett, Fayette, Hardeman, Haywood, McNairy and Wayne counties in the 26th District. She is Chair of the Senate Education Committee and also serves on the Transportation, Commerce, Labor & Agriculture and Veterans Affairs Committees. She sponsored 88 pieces of legislation during the 106th General Assembly. Dennis is a freshman representative who represents the citizens of Hardin, McNairy and part of Decatur Counties which comprise the 71st district. Dennis is a member of the House Judiciary and Health &Human Resources Committees. Dennis proposed 69 bills during the last legislative session.
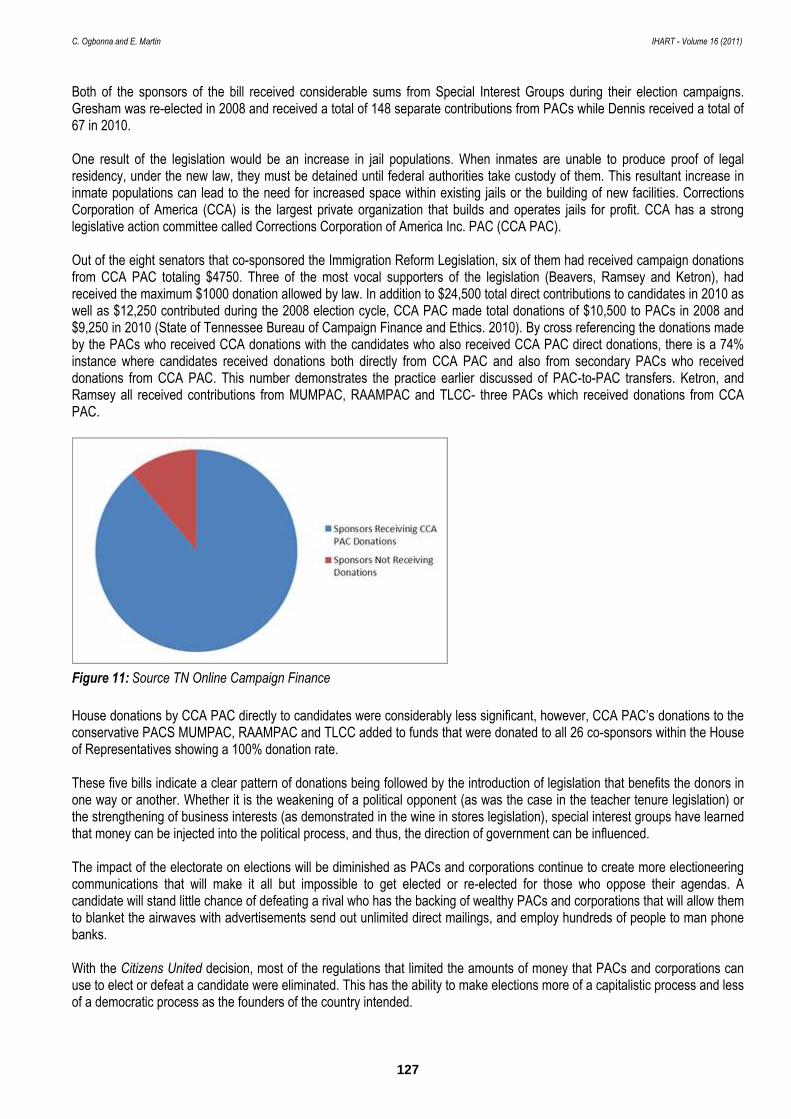
C. Ogbonna and E. Martin IHART - Volume 16 (2011)
127
Both of the sponsors of the bill received considerable sums from Special Interest Groups during their election campaigns. Gresham was re-elected in 2008 and received a total of 148 separate contributions from PACs while Dennis received a total of 67 in 2010. One result of the legislation would be an increase in jail populations. When inmates are unable to produce proof of legal residency, under the new law, they must be detained until federal authorities take custody of them. This resultant increase in inmate populations can lead to the need for increased space within existing jails or the building of new facilities. Corrections Corporation of America (CCA) is the largest private organization that builds and operates jails for profit. CCA has a strong legislative action committee called Corrections Corporation of America Inc. PAC (CCA PAC). Out of the eight senators that co-sponsored the Immigration Reform Legislation, six of them had received campaign donations from CCA PAC totaling $4750. Three of the most vocal supporters of the legislation (Beavers, Ramsey and Ketron), had received the maximum $1000 donation allowed by law. In addition to $24,500 total direct contributions to candidates in 2010 as well as $12,250 contributed during the 2008 election cycle, CCA PAC made total donations of $10,500 to PACs in 2008 and $9,250 in 2010 (State of Tennessee Bureau of Campaign Finance and Ethics. 2010). By cross referencing the donations made by the PACs who received CCA donations with the candidates who also received CCA PAC direct donations, there is a 74% instance where candidates received donations both directly from CCA PAC and also from secondary PACs who received donations from CCA PAC. This number demonstrates the practice earlier discussed of PAC-to-PAC transfers. Ketron, and Ramsey all received contributions from MUMPAC, RAAMPAC and TLCC- three PACs which received donations from CCA PAC.
Figure 11: Source TN Online Campaign Finance
House donations by CCA PAC directly to candidates were considerably less significant, however, CCA PAC‘s donations to the conservative PACS MUMPAC, RAAMPAC and TLCC added to funds that were donated to all 26 co-sponsors within the House of Representatives showing a 100% donation rate. These five bills indicate a clear pattern of donations being followed by the introduction of legislation that benefits the donors in one way or another. Whether it is the weakening of a political opponent (as was the case in the teacher tenure legislation) or the strengthening of business interests (as demonstrated in the wine in stores legislation), special interest groups have learned that money can be injected into the political process, and thus, the direction of government can be influenced. The impact of the electorate on elections will be diminished as PACs and corporations continue to create more electioneering communications that will make it all but impossible to get elected or re-elected for those who oppose their agendas. A candidate will stand little chance of defeating a rival who has the backing of wealthy PACs and corporations that will allow them to blanket the airwaves with advertisements send out unlimited direct mailings, and employ hundreds of people to man phone banks. With the Citizens United decision, most of the regulations that limited the amounts of money that PACs and corporations can use to elect or defeat a candidate were eliminated. This has the ability to make elections more of a capitalistic process and less of a democratic process as the founders of the country intended.

The Correlation between Campaign Contributions and Legislation Authored in the Tennessee General Assembly
128
The theory of Capitalism is one where the means of production are privately owned and are operated to create a profit. With unlimited money, corporate and special interest money now flowing into elections at all levels of government, officials must pander to those who can afford to re-elect or defeat them. When this happens, what is best for the people may be superseded by what is best for the donors.
REFERENCES
Geraci, V. "CAMPAIGN FINANCE Historical Timeline". Connecticut Public Affairs Network.2008. http://www.ctn.state.ct.us/civics/campaign_finance/Support%20Materials/Campaign%20Finacne%20Timeline.pdf. Retrieved 4-15-2011.
Bowser, J. National Conference of State Legislatures. 2010. "Contribution Limits: An Overview". http://www.ncsl.org/default.aspx?tabid=16594. Retrieved 4-15-2011.
―The Money behind the Elections.‖ National Center for Responsive Politics. 2011. http://www.opensecrets.org/bigpicture/index.php. Retrieved 4-16-2011.
"Begging for Bucks." Campaigns and Elections. 5-5-2010. http://www.findarticles.com/p/articles/mi_m2519/is_2_22/ai_74410584. Retrieved 4-15-2011.
―Banking on Becoming President‖. National Center for Responsive Politics. 10-27-2008. http://www.opensecrets.org/pres08/. Retrieved 4-16-2011
―The Federal Election Campaign Laws: A Short History‖. Federal Election Commission.2008. http://fec.gov/info/appfour.htm. Retrieved 4-16-2011
―Outside Spending.‖ National Center for Responsive Politics. 2011. http://www.opensecrets.org/outsidespending/index.php. Retrieved 4-18-2011.
Baran, Jan Witold. "Stampede Toward Democracy". The New York Times. 1-25-2010. http://www.nytimes.com/2010/01/26/opinion/26baran.html. Retrieved 4-16-2011.
―Coordinated Communications and Independent Expenditures Brochure.‖ Federal Election Commission. Updated 2-2011. http://www.fec.gov/pages/brochures/indexp.shtml#IE. Retrieved 4-16-2011.
Urbina, Ian. "24 States' Laws Open to Attack After Campaign Finance Ruling". New York Times. 1-22-2010. http://www.nytimes.com/2010/01/23/us/politics/23states.html. Retrieved 04-18-2011.
―States Summary – Tennessee‖. National Center for Responsive Politics. 2011. http://www.opensecrets.org/states/summary.php?state=TN. Retrieved 4-16-2011.
Schlezig, Erik ―Republicans Kill Limits on PAC Transfers‖. The Tennessean. 4/26/2007. http://www.paulstanley.org/press/07/04-26-07b.htm. Retrieved 4-16-2011.
―State of Tennessee Online Campaign Finance Database‖. State of Tennessee Bureau of Campaign Finance and Ethics. 2010. https://apps.tn.gov/tncamp-app/public/search.htm. Retrieved 4-12-2011.
―Tennessee General Assembly Mainpage‖. State of Tennessee. 2011. http://www.capitol.tn.gov/ . Retrieved 4-17-2011. Gay, Malcolm. ―More States Allowing Guns in Bars‖. The New York Times. 10-3-2010.
http://www.nytimes.com/2010/10/04/us/04guns.html. Retrieved 4-24-2011. Locker, Richard. ―NRA Lobbyist‘s visit persuaded 9 Tennessee Lawmaker to flip votes‖. The Commercial Appeal. 05-08-10.
http://www.commercialappeal.com/news/2010/may/08/nra-lobbyists-visit-persuaded-9-to-flip-votes/. Retrieved 4-24-11. Birnbaum, Jeff. "Fortune Releases Annual Survey of Most Powerful Lobbying Organizations". Fortune Magazine in association
with Timewarner.com. 11-15-1999. http://www.timewarner.com/corp/newsroom/pr/0,20812,667546,00.html. Retrieved 04-24-2011.
―New gun Laws for Tennessee‖. Sigforum.com in association with National Rifle Association. 4-8-2011. http://sigforum.com/eve/forums/a/tpc/f/320601935/m/4280025742. Retrieved 4-26-2011.
―Humphrey, Tom. ―Wine in groceries campaign adds PAC to PR effort.‖ The Knoxville News Sentinel. 10-8-2009. http://blogs.knoxnews.com/humphrey/2009/10/after-two-sessions-of-failure.html. Retrieved 4-26-11.
Keeling, Jeff. ―Tennessee Consumers may tilt balance in favor of wine sales at grocery stores.‖ The Times News. 03/15/2011. http://www.timesnews.net/article.php?id=9005556. Retrieved 4-26-2011.

C. Ogbonna and E. Martin IHART - Volume 16 (2011)
129
APPENDIX A
Contributions from Conservative Political Action Committees to House Sponsors of Tennessee Teacher Tenure Reform
Legislator Political Action Committee Campaign Contribution
Dunn TN Firearms Legislative Action Committee $110
Dunn Tennessee First $250
Dunn Tennessee Banker's Association PAC $1,250
Campbell KPAC $5,000
Campbell Tennesseans For Better Leadership PAC $1,000
Campbell Tennessee Volunteer PAC $500
Campbell CAS PAC $500
Campbell Tennessee Chamber of Commerce PAC $250
Campbell Core Leadership Fund $250
Campbell East Tennessee GOP $700
Campbell AM Good Government PAC $250
Campbell PAC Able Tennessee $250
Lundberg Eastman PAC $500
Lundberg Tennessee Volunteer PAC $500
Lundberg Tennessee First $500
White Mumpac $1,000
White Harwell PAC $1,000
White Tennessee First $250
Brooks TN Firearms Legislative Action Committee $110
Brooks Tennessee First $250
Brooks Tennessee Banker's Association PAC $1,250
Haynes Tennessee Banker's Association PAC $250
Haynes Tennessee First $500
Sargent Tennessee First $1,000
Sargent Tennessee Banker's Association PAC $1,500
Sargent Tennessee Chamber of Commerce PAC $500
Gotto Harwell PAC $1,000
Gotto CAS PAC $10,000
Gotto Tennessee Young Republicans $1,500
Gotto East Tennessee GOP $1,000
Gotto Leaders of Tennessee $5,000
Gotto Tennessee Legislative Campaign Committee $14,215
Hall CAS PAC $5,000
Hall AM Good Government PAC $250
Hall Volunteer Republican Women's Club $100
Miller Core Leadership Fund $250
Miller CAS PAC $2,500
Miller Tennessee Legislative Campaign Committee $8,135
Miller Tennessee Federation of Republican Women $500
Sexton Tennessee Chamber of Commerce PAC $500
Sexton AM Good Government PAC $250
Sexton CAS PAC $5,000
Sexton East Tennessee GOP $1,700
Sexton Eastman PAC $250
Sexton House Republican Caucus $5,500
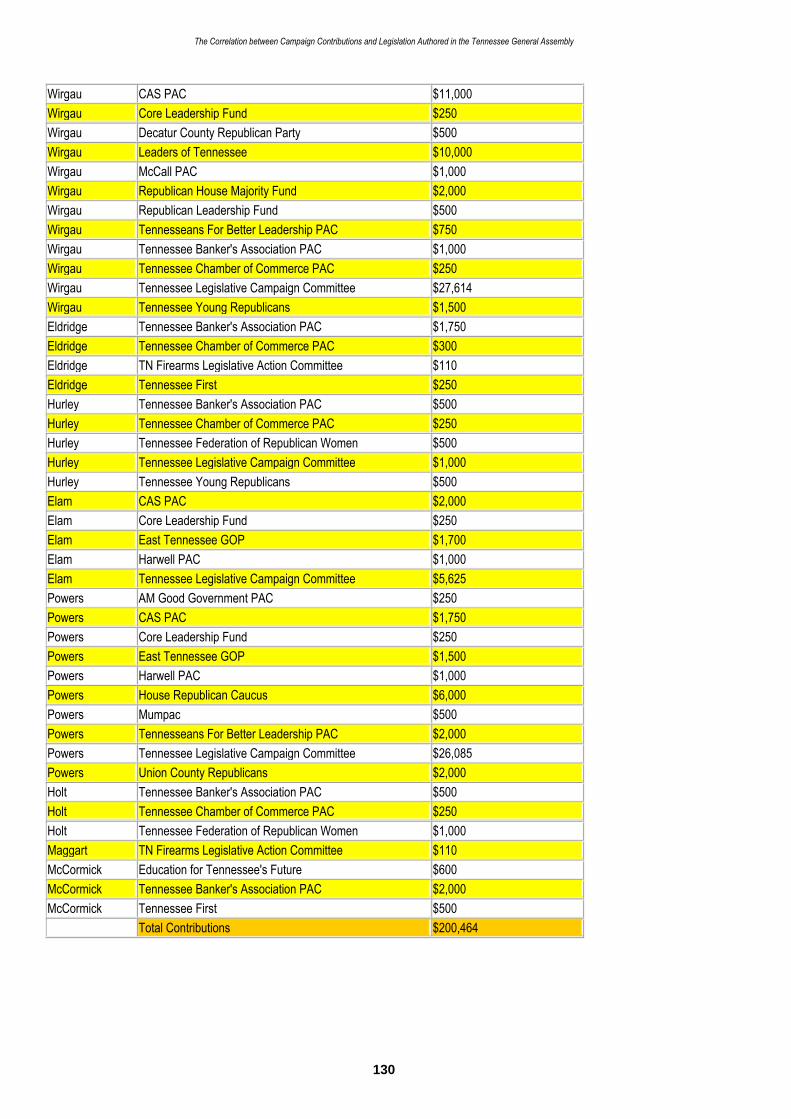
The Correlation between Campaign Contributions and Legislation Authored in the Tennessee General Assembly
130
Wirgau CAS PAC $11,000
Wirgau Core Leadership Fund $250
Wirgau Decatur County Republican Party $500
Wirgau Leaders of Tennessee $10,000
Wirgau McCall PAC $1,000
Wirgau Republican House Majority Fund $2,000
Wirgau Republican Leadership Fund $500
Wirgau Tennesseans For Better Leadership PAC $750
Wirgau Tennessee Banker's Association PAC $1,000
Wirgau Tennessee Chamber of Commerce PAC $250
Wirgau Tennessee Legislative Campaign Committee $27,614
Wirgau Tennessee Young Republicans $1,500
Eldridge Tennessee Banker's Association PAC $1,750
Eldridge Tennessee Chamber of Commerce PAC $300
Eldridge TN Firearms Legislative Action Committee $110
Eldridge Tennessee First $250
Hurley Tennessee Banker's Association PAC $500
Hurley Tennessee Chamber of Commerce PAC $250
Hurley Tennessee Federation of Republican Women $500
Hurley Tennessee Legislative Campaign Committee $1,000
Hurley Tennessee Young Republicans $500
Elam CAS PAC $2,000
Elam Core Leadership Fund $250
Elam East Tennessee GOP $1,700
Elam Harwell PAC $1,000
Elam Tennessee Legislative Campaign Committee $5,625
Powers AM Good Government PAC $250
Powers CAS PAC $1,750
Powers Core Leadership Fund $250
Powers East Tennessee GOP $1,500
Powers Harwell PAC $1,000
Powers House Republican Caucus $6,000
Powers Mumpac $500
Powers Tennesseans For Better Leadership PAC $2,000
Powers Tennessee Legislative Campaign Committee $26,085
Powers Union County Republicans $2,000
Holt Tennessee Banker's Association PAC $500
Holt Tennessee Chamber of Commerce PAC $250
Holt Tennessee Federation of Republican Women $1,000
Maggart TN Firearms Legislative Action Committee $110
McCormick Education for Tennessee's Future $600
McCormick Tennessee Banker's Association PAC $2,000
McCormick Tennessee First $500
Total Contributions $200,464
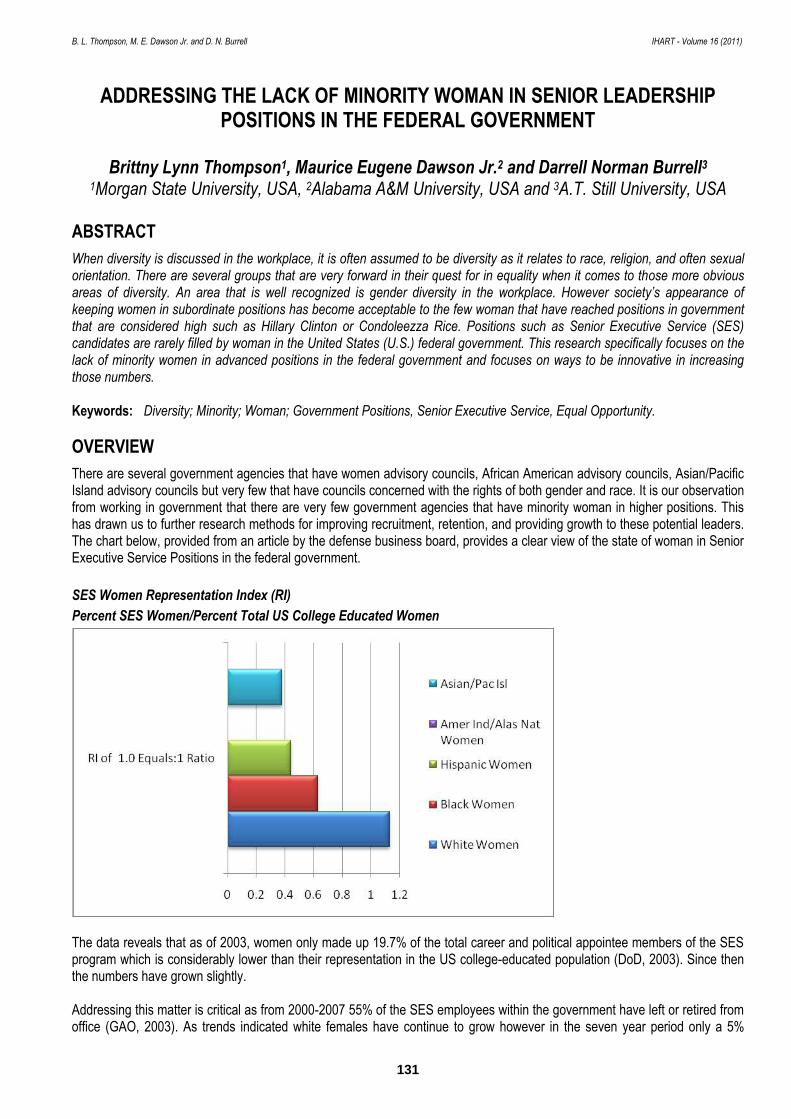
B. L. Thompson, M. E. Dawson Jr. and D. N. Burrell IHART - Volume 16 (2011)
131
ADDRESSING THE LACK OF MINORITY WOMAN IN SENIOR LEADERSHIP POSITIONS IN THE FEDERAL GOVERNMENT
Brittny Lynn Thompson1, Maurice Eugene Dawson Jr.2 and Darrell Norman Burrell3
1Morgan State University, USA, 2Alabama A&M University, USA and 3A.T. Still University, USA
ABSTRACT
When diversity is discussed in the workplace, it is often assumed to be diversity as it relates to race, religion, and often sexual orientation. There are several groups that are very forward in their quest for in equality when it comes to those more obvious areas of diversity. An area that is well recognized is gender diversity in the workplace. However society‘s appearance of keeping women in subordinate positions has become acceptable to the few woman that have reached positions in government that are considered high such as Hillary Clinton or Condoleezza Rice. Positions such as Senior Executive Service (SES) candidates are rarely filled by woman in the United States (U.S.) federal government. This research specifically focuses on the lack of minority women in advanced positions in the federal government and focuses on ways to be innovative in increasing those numbers. Keywords: Diversity; Minority; Woman; Government Positions, Senior Executive Service, Equal Opportunity.
OVERVIEW
There are several government agencies that have women advisory councils, African American advisory councils, Asian/Pacific Island advisory councils but very few that have councils concerned with the rights of both gender and race. It is our observation from working in government that there are very few government agencies that have minority woman in higher positions. This has drawn us to further research methods for improving recruitment, retention, and providing growth to these potential leaders. The chart below, provided from an article by the defense business board, provides a clear view of the state of woman in Senior Executive Service Positions in the federal government.
SES Women Representation Index (RI)
Percent SES Women/Percent Total US College Educated Women
The data reveals that as of 2003, women only made up 19.7% of the total career and political appointee members of the SES program which is considerably lower than their representation in the US college-educated population (DoD, 2003). Since then the numbers have grown slightly. Addressing this matter is critical as from 2000-2007 55% of the SES employees within the government have left or retired from office (GAO, 2003). As trends indicated white females have continue to grow however in the seven year period only a 5%

Addressing the Lack of Minority Woman in Senior Leadership Positions in the Federal Government
132
growth occurred for minority women while 28.1% growth occurred for women in general. The government agencies with significant numbers of women being 30 or more were the Health and Human Services (HHS), National Science Foundation (NSF), Office of Personnel Management (OPM), Small Business Administration (SBA), and Social Security Administration (SSA) (GAO, 2003).
REFERENCES
DoD. (2003). Defense business record. Retrieved from http://www.defense.gov/ GAO. (2003, October 15). Senior executive service enhanced agency efforts needed to improve diversity as the senior corps
turns ove. Retrieved from http://www.gao.gov/new.items/d04123t.pdf
J. Hester, Y. Bolen, L. Hyde and B. Thomas IHART - Volume 16 (2011)
133
PERCEPTIONS OF BULLYING A IN NEWLY BUILT, SPACIOUS SCHOOL FACILITY
Jackie Hester1, Yvette Bolen2, Lisa Hyde2 and Bruce Thomas2 1Buckhorn Middle, USA and 2Athens State University, USA
OVERVIEW
Bullying is a pervasive problem that has seeped into the lives of 36% to 43% of our nation‘s middle school-aged youth (DeVoe & Bauer, 2010). Espelage and Swearer, 2010, enhance the understanding of bullying with the use of an acronym PIC which stands for purposeful, imbalance and continual. Generally a bully commits a bullying act on purpose, an imbalance exists as a result of the bully having more influence and power over another student, and a bullying act us generally continual, meaning it occurs more than once. A study of elementary, middle, and high school students conducted by Gendron, Williams, & Guerra, 2011 revealed negative perceptions of school climate, an environment described as a ―poor‖ school climate, resulted in higher levels of bullying incidences. In reaction to the rising number of bullying incidents and victims that have come forward in the past decade, there has also been a tenfold rise in research that is available about the possible causes of bullying (Graham, 2010). However, little research exists about the impact of a school‘s environment on the causation of bullying. The purpose of the study was to determine the student perception of bullying in a newly built, spacious middle school facility. These students gained larger space availability in each classroom, wider halls, and larger square footage in all school areas in general as compared to a former older, crowded middle school. Specifically, this study was designed to investigate if students of different gender (M vs. F), grade level (7th vs. 8th) and class type (collaborative, regular or advanced) perceive bullying differently. Since bullying can be decreased by the presence of high teacher morale, positive learning climate, and organizational structure of the learning environment (Yoneyama & Rigby, 2006), creating these conditions is highly recommended. Implementation of anti-bullying programs, workshops for teachers on how to handle bullying in the classroom, and system-wide mandates such as the zero-tolerance policy are established methods of controlling bullying (Skiba, 2010, p. 28). Eliot, Cornell, Gregory, and Xitao, 2010, identified a supportive climate provided by school staff as a ―valuable strategy‖ in the prevention of violence and bullying events and as a means of including students in this effort. In this new school setting, approximately two-thirds of the eighth grade population attended a one-and-a-half hour anti-bullying presentation which included a variety of strategies to assist in the prevention of bulling incidences. The total number of eighth grade students that were subjected to the presentation was 262. There were three collaborative language arts blocks containing 80 students, three advanced language arts blocks containing 92 students, and three regular language arts blocks containing 90 students that received the presentation. Three collaborative classes utilize two teachers within the classroom, a general education teacher and a special education teacher. The advanced classes are composed of those students who have either been identified as ―gifted‖ or have scored in the 90th percentile on the Stanford Achievement Tests and/or scored a 4 on the Alabama Reading and Math Test. The presentation consisted of detailing various definitions of bullying behaviors, verbal examples of bullying, video samples of bullying, types of anti-bullying strategies that are ineffective, the importance of being a by-stander, and the repercussions if bullying is allowed to continue. Various strategies that were used were small group discussion, turn and talk, journaling, and individual feedback. At the end of the presentation the students were asked to anonymously respond to four open-ended questions that were related to why individuals choose to bully, methods of how to report bullying, and current situations that need to be investigated. Following the bullying intervention presentation, the survey instrument (B-Index) (Hoy, n.d.) was administered to 475 seventh and eighth grade students in their language arts block (Table 1). In each grade level, there were three collaborative blocks, six regular blocks, and three advanced blocks. This eleven item questionnaire utilized a 6-point Likert scale, with the scores for items 4, 9, and 11 inverted and the highest point total (66) indicates a school environment which encourages bullying.

Perceptions of Bullying in a Newly Built, Spacious School Facility
134
Table 1
Descriptive statistics (number of subjects, means, and standard deviations) were determined along gender lines , grade levels, class types (collaborative, regular, and advanced), and between students who received bullying strategy intervention versus those who received no intervention. Findings are presented in Table 2. Results were Gender (Males=229, Mean =39.26, SD=8.2; Females=246. Mean=39.0, SD=9.2), Grade Level (7th=210, Mean=38.59, SD=9.4; 8TH=265 Mean=39.58, SD=8.1), Class Types (Collaborative=104, Mean=39.48, SD=8.1); Regular=252, Mean=39.22, SD=88; and Advanced=119, Mean=38.68, SD=9.09), Bullying Strategy Intervention (Intervention=210, Mean =39.3, SD=7.8; No Intervention=267, Mean=39.0, SD=9.4).
Table 2
Number of Subjects Mean Standard Deviation
Gender Male Female
N = 229 N = 246
M = 39.26 M = 39.0
SD = 8.2 SD = 9.2
Grade Level 7th 8th
N = 210 N = 265
M = 38.59 M = 39.58
SD = 9.4 SD = 8.1
Class Type Collaborative Regular Advanced
N = 104 N = 252 N = 119
M = 39.48 M = 39.22 M = 38.68
SD = 8.1 SD = 8.8 SD = 9.09
Bullying Strategy Intervention No intervention
N = 210 N = 267
M = 39.3 M = 39.0
SD = 7.8 SD = 9.4
B-INDEX QUESTIONNAIRE Please circle the box that applies MALE FEMALE Age ______ Directions: The following are statements about your school. Please indicated the extent to which you agree with each of the following
statements along a scale from strongly disagree to strongly agree. You answers are confidential.
Strongly Disagree
Disagree Somewhat Disagree
Somewhat Agree
Agree Strongly Agree
1. Students in this school fear other students. ________ ________ ________ ________ ________ ________
2. Bullying students is commonplace in this school. ________ ________ ________ ________ ________ ________
3. Teachers in this school generally overlook student bullying.
________ ________ ________ ________ ________ ________
4. Teachers in this school reach out to help students who are harassed by other students.
________ ________ ________ ________ ________ ________
5. Students in this school make fun of other students. ________ ________ ________ ________ ________ ________
6. In this school, teachers ignore students intimidating other students.
________ ________ ________ ________ ________ ________
7. Students in this school threaten others with physical harm.
________ ________ ________ ________ ________ ________
8. Students threaten other students in this school. ________ ________ ________ ________ ________ ________
9. In this school, students‘ intimidating other students is not permitted.
________ ________ ________ ________ ________ ________
10. Rowdy student behavior is common in this school. ________ ________ ________ ________ ________ ________
11. In this school, teachers try to protect students who are different.
________ ________ ________ ________ ________ ________

J. Hester, Y. Bolen, L. Hyde and B. Thomas IHART - Volume 16 (2011)
135
Additionally, independent t-tests were performed to investigate differences that exist when viewing bullying perceptions between gender, grade level, and bullying strategy group (intervention vs. no intervention), and a one-way Analysis of Variance (ANOVA) was utilized to determine differences that exist between class type (collaborative, regular, and advanced). The t-test results revealed non-significant differences existed when studying the perception of bullying between gender (male = 39.26 vs. female = 39.0, t = .276, df = 473, p > .05), grade level (7th = 38.59 vs. 8th = 39.58, t = 1.22, df = 473, p > .05), and bullying strategy group (intervention = 39.3 vs. no intervention = 39.0, t = .369, df = 475, p > .05). ANOVA results revealed a non-significant difference when studying bullying perception between class type, F (2, 472) = .256, p > .05. While non-significance was determined when comparing data between the various groups it is quite likely that with a change in school environment (older crowded middle school facility vs. modern, spacious middle school facility) a change in student‘s perceptions of bullying will result. It can be concluded that students of different ages, grade levels, and in different class types may perceive bullying slightly differently. The largest difference existed between the groups of student who received bullying intervention as compared to those who did not. Bullying is a nation-wide issue that will continue to warrant further study. A comprehensive intervention program will be a necessity at all school levels. An investigation is necessary to provide insight into the differences that may exist between the bullying perception of students in this study while being taught in an older, crowded school as compared to perceptions after being relocated to larger classes with larger and school spaces. Keywords: Bullying, New School Facility, School Climate.
REFERENCES
DeVoe, J. R., & Bauer, L (2010). Student victimization in U.S. schools: Results from the 2007 School Crime Supplement to the National Crime Victimization Survey (NCES 2010-319). Washington, DC: National Center For Educational Statistics, Institute of Education Sciences, U.S. Department of Education.
Eliot, M., Cornell, D., Gregory, A. & Xitao, F. (2010). Supportive school climate and student willingness to seek help for bullying and threats of violence. Journal of School Psychology, 48(6), 533-553.
Espelage D.& Swearer, S. (2010). 2nd ed. Bullying in north american schools. Routledge Publishing. 228. Graham, S. (2010). What educators need to know about bullying behaviors. Phi Delta Kappan, 92(1), 66-69. Gendron, B. P., Williams, K. R. & Guerra, N. G. (2011). An analysis of bullying among students within schools: Estimating the
effects of individual normative beliefs, self-esteem, and school climate. Journal of School Violence, 10(2), 150-164. Hoy, W. K. (n.d.) Retrieved from www.waynekhoy.com/bully_index.html Skiba, R. (2010). Zero tolerance and alternative discipline strategies. National Association of School Psychologists, 39(1), 28. Yoneyama, S. & Rigby, K. (2006). Bully/victim students & classroom climate. Youth Studies Australia, 25(3), 34-41.

D. Allbright IHART - Volume 16 (2011)
136
ALERT FOR NEW PROFESSORS: CLASSROOM MANAGEMENT CONSIDERATIONS
David Allbright Eastern Michigan University, USA
INTRODUCTION
This article submits a heuristic list of classroom management (CM) issues that can serve as a cautionary alert for folks who are relatively new to teaching at a university level. We provide a short list of CM topics and considerations that incoming instructors may overlook during course design. And, we invite discussion and suggestions for additions to the list. Freshly-minted PhD's often accept positions to teach at university without having a great deal of prior experience in actually leading a classroom. Unfortunately, many doctoral programs have "research-focused" tracks in which students may facilitate only a few (if any) university-level courses before they are deemed "ready" to join an institution of higher-learning. This may leave some entering faculty rather unprepared to face many complex challenges involved in leading today's classroom. Likewise, many Colleges of Business recruit part-time instructors and non-tenure track lecturers who are "professionally qualified" to teach at a university based on their corporate or entrepreneurial experiences. While these excellent faculty can bring a wealth of business experience, and perhaps possess skill in making presentations and facilitating "training" seminars, still, some business instructors may enter campus with limited actual experience in leading a group of university students. As a result, neophyte professors and instructors may simply be "thrown into" an unfamiliar classroom engagement that can present both joyful excitement as well as insidious danger. In particular, today's university student may chose to present several challenges to any faculty member who endeavors earnestly to promote and maintain positive comportment. Unfortunately, many newly-entering faculty have limited exposure to daunting student behaviors that may surface to disrupt the "focus and flow" of shared learning activities in the classroom. More importantly, less experienced and developing faculty may have limited awareness of possible negative outcomes that may result from actually implementing classroom management protocols within the context of institutional administrative oversight. So, folks relatively new to university-level teaching are alerted to the following short list of relevant topics regarding classroom management (CM) they may wish to consider as they design each course and devise policies to be included in each syllabus.
NEGATIVE IMPACTS UPON SHARED FOCUS AND FLOW
Not Present for Collaborative Learning Activities
Absences
Tardiness
Exiting Class In-Progress
Lack of Shared Focus / Attention
Not staying focused on current learning topic / activity - strive to contribute to shared focus of class
Inattentive / distracting non-verbal behaviors / not looking at speakers / reading / doing outside work
Not offering FULL ATTENTION to classmates / professor / learning activities when class in-progress
Non-cooperative or Bullying Attitude / Tone
Evasive, uncooperative or non-responsive to direct questions received from professor
Arguing / resisting in-class evaluations - without keeping "open mind" to constructive criticism
Sarcastic "snarky" affronts to professor or peers / purposeful obfuscations, deflections and vaguerties
Dominating the collaborative discourse / taking more than one's share of the group's "air time"
"Grandstanding" by endeavoring to "speak for the class" by publicly discussing complaints / frustrations
Unwillingness to apologize for minor indiscretions (issue apology to class, we all may quickly move on)

Alert for New Professors: Classroom Management Considerations
137
Distracting Movements and Noise
SIDEBARS (talking / listening to side-talkers / whispering / socializing) if class in-progress / and during rolecall
When entering late, noisily unpacking / greeting or whispering to neighbors / other distractions
Exiting class in-progress during a discussion / activity / presentation (be discrete / wait for breaks)
Packing belongings early to prepare to leave before professor dismisses class
Eating / drinking (except water) in class (avoid stains, spills and distracting smells / packaging noise)
Electronic Distractions
TEXT-MESSAGING / READING electronic messages during class / failing to mute ringtones
Using a laptop in class without instructor's permission.... also, do not websurf, email, message or game
Using other electronics without permission / headphones / music listening activities
Avoidance of Interaction
Sleeping / placing head down on desk / closing eyes to "catnap" in class (please go home to rest)
Using a hat, hood, sunglasses or hands in order to nap / or to avoid participation or eye contact
During tests - using a hat, hood, sunglasses or hands in ways that the professor cannot see eyes
ADDRESSING DISTRACTIONS TO FOCUS AND FLOW
You need to have a plan BEFORE the disruption occurs.
What do you do "in the moment" that the distraction occurs?
Address now vs. ignore?
Talk in generalities to entire class vs. address distracting student directly?
Address later? HOW do you get a student to meet outside of class? Do you believe private meet is a good idea?
When addressing disruptions, HOW do you address "the behavior" vs. address the student?
FEAR OF NEGATIVE OUTCOMES
Agitated / aggressive students who may "act out" negatively in a classroom
Stalking and physical violence from disturbed students
Insinuations by students / administrators regarding instructor's character and professional reputation
Perceived inability to "appropriately" manage classroom (i.e., judgmental peers and administrators)
Perceived as a "control freak" or "jerk" (by students and/or peers)
Low student evaluations (some perceive as "treating adult students like children")
Indignant students file complaints with administrators (often include egregiously false misrepresentations)
Retributions from administrators taking sides with students (beware the "customer service" mentality)
Requirements for participation in formal "grievance" reviews / student conduct justice review procedures
Low performance reviews... loss of "perks"... negative impact on tenure and promotion
COMMON DEFENSIVE ROUTINES
Avoid negative student evaluations due to "student annoyance" over maintaining classroom comportment?
Design "groupwork" / breakout sessions / interactive pedagogy to help students stay focused and occupied?
Just let students do what they want?
Don't take attendance... don't monitor presence... just let them enter/exit as they please?
Ignore classroom distractions / disruptions... don't address distractions "in the moment?"
Just let students use cell phones / laptops as they wish - exit class to text/phone as they wish?
Don't report student disruptions to administrators?
Deal with your own problems without administrative help? (so as to avoid their judgments / harassments)
Avoid challenging students in front of peers... don't ask them to provide deeper analysis?
Design superficial interactions in classrooms... don't delve into controversial topics?
Don't offer direct feedback in class regarding student "front-of'-class" presentations?
"Inflate" grades and/or... avoid subjective evaluation criteria (i.e., stick with objective tests - multiple choice)?

J. Robinson and M. E. Dawson Jr. IHART - Volume 16 (2011)
138
UTILIZATION OF OPEN SOURCE SOFTWARE (OSS) TOOLS TO ALLEVIATE A PROJECT‟S COST
Joshua Robinson1 and Maurice Eugene Dawson Jr.1,2
1Morgan State University, USA and 2Alabama A & M University, USA
ABSTRACT
The mission of the Project Management Department at the university is to properly equip future project managers with the in depth knowledge of how to plan, organize, and manage the project lifecycle. In this economy, employees who can save their employers money are highly regarded and will potentially be in line for further career advancement. Using open source technology is one great way to assist an organization is lowering costs across the board. As the acquisition community within the Defense Acquisition University (DAU) has identified as software as a major driving factor in program cost we can focus on methods to reduce those associated costs. If the project manager wants to provide the end user a quality product and reduce tool cost then it essential that open source alternatives are taught and implemented at the university level. Keywords: Project Management; Cost, Open Source Tools, Ubuntu, Project Planning, Project Scheduling.
OVERVIEW
Open Source Software (OSS) is a term that describes practices in production and development that gives access to an end product‘s source code with little to no associated cost. OSS was selected as an alternative as these products provide source material, documentation, and the blueprints for design. This knowledge is essential as many government and commercial ran programs the driving cost is software. Obtaining a software package such as Microsoft Project Professional 2010 will cost an organization approximately $999.95. If an organization needed 100 copies then that cost is $99,995.00 to provide that. However, if an OSS such as Task Juggler was utilized instead then the cost to simply obtain that software would be free. The downfall may be potential limitations such as server integration however since the source code is provided internal engineers could provide customizations themselves. In Figure 1: Task Juggler Screenshot displayed is a Virtual Machine (VM) with Task Jugglers within the Ubuntu Operating System (OS). This is one of the OSSs used to teach the future project managers how to utilize freely available tools to manage the SDLC. The open source project planner tool allowed the students to understand how to develop project charts, track resources, and manage tasks. This tool allowed for the students to have the ability to manipulate software that provided similar capability to Microsoft Project. Other OSS was tools that further enhanced project collaboration, software development, enterprise architecture, and financial reporting.
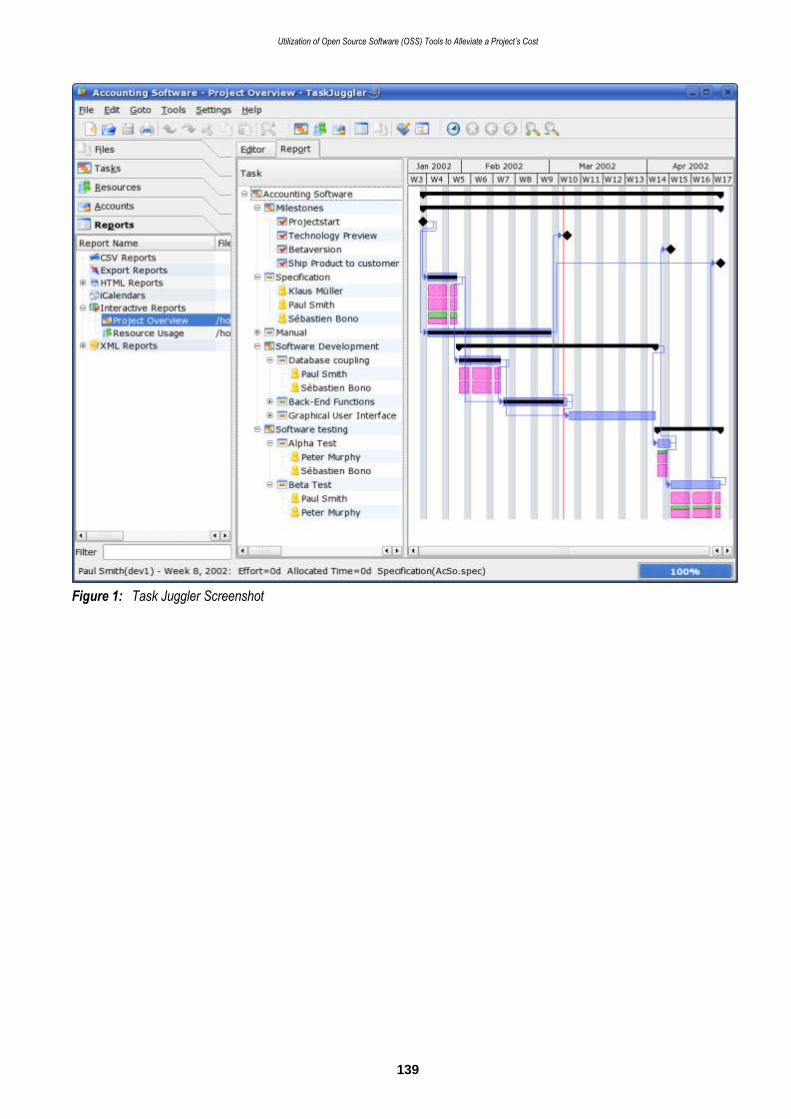
Utilization of Open Source Software (OSS) Tools to Alleviate a Project‘s Cost
139
Figure 1: Task Juggler Screenshot

J. B. Pennington, F. O. Olorunniwo and M. J. Montgomery IHART - Volume 16 (2011)
140
TIME MANAGEMENT PRACTICES ACROSS ALL COLLEGE STUDENTS‟ CLASSIFICATIONS – IMPACT ON PERSISTENCE
J. Byron Pennington, Festus O. Olorunniwo and Michael J. Montgomery
Tennessee State University, USA
ABSTRACT
This study examined time management of university freshmen, sophomores, and upper classmen and how this may have influenced their grades, academic performance, and rates of retention. The case study is based on classroom surveys of 329 business students in the Fall semester of 2010 at an Historically Black College or University (HBCU). Results of our analysis reveal, among other things, that students engaged in extracurricular activities stay in school longer and have better grades; those who work stay in school longer but have lower grades. The likelihood of transferring to another school was significantly affected by gender, classification, and work hours. The results further indicate extracurricular activities should be strongly encouraged to improve academic performance and rates of retention, and work should be encouraged to improve retention rates, but this may be at the expense of academic performance. A number of the findings agree with prior studies and others will require further research. Implications of the findings for student persistence are highlighted. Keywords: Business Education, Campus Life, Retention, Student Activities, Time Management.

J. H. Kwon and T. M. Brinthaupt IHART - Volume 16 (2011)
141
THE INTEGRATION OF FASHION AND CULTURE IN AN APPAREL DESIGN AND MERCHANDISING COURSE
Jasmin Hyunju Kwon and Thomas M. Brinthaupt
Middle Tennessee State University, USA
PURPOSE AND RATIONALE
Fashion is going global. Apparel manufacturing and retailing engage in global sourcing and in global marketing. These changes highlight the need to expose today‘s fashion students to the complexity of the global textile and apparel marketplace and the issues that exist in the profession they are preparing to enter (Kunz & Garner, 2007). . In this paper, we describe the development and evaluation of a cross-cultural fashion project for a Social Aspects of Clothing course.
METHODOLOGY
The Social Aspects of Clothing is a junior-level, 3-credit course that is required for apparel design and merchandising majors. The objectives of the course are: 1) to develop an understanding of the interdisciplinary nature of clothing and clothing-related research; and 2) to develop an understanding and appreciation of the cultural, social, psychological, aesthetics, physical, and economic influences which shape human behavior and consumption related to clothing. The course requirements are fashion branding and retail personality assignments, a cross-cultural fashion project, and two tests. For the final project, students complete a cross-cultural fashion project. The purpose of the project is to understand the relationship between clothing and culture and develop an appreciation of culture. The project pairs U.S. students with international students. The benefits for both partners include an opportunity to develop more open attitudes toward a culture different from their own and an opportunity to be an expert on their own culture. Gurung and Prieto (2009) emphasized teaching students about cultural diversity and cultural differences, and eliminate cultural ignorance, stereotyping, and prejudice. The project requires three reports which include general information about the partner‘s culture, consumer behavior, and fashion industry information on the partner‘s home country. Students submit their PowerPoint presentations summarizing their experiences using various visual sources for the final project.
FINDINGS/CONCLUSION
Students‘ (N=53) evaluations of the project indicated that it broadened their perspectives on the global fashion industry, and was especially effective in moderating stereotyping and prejudice. A sample student comment was ―This project has been a very enlightening experience and was very enjoyable to complete. From my perspective the information gained from this project will be help in future endeavors.‖ Additional results, student feedback, and details about the structure and implementation of the cross-cultural fashion project will be presented.

K. Bista IHART - Volume 16 (2011)
142
SILENCE IN TEACHING AND LEARNING: PERCEPTIONS OF FOREIGN STUDENTS IN AMERICAN CLASSROOM
Krishna Bista
Arkansas State University, USA
ABSTRACT
Silence among international students can be a major concern for instructors who want students to orally participate in class for learning. The nature of silence is complex in any classroom with foreign or domestic students. Instructors, sometimes, fail to recognize the nature of the silence of foreign students unlike their native counterparts. With an emic perspective in a narrative voice by the author, this paper explores the nature of silence among international students by examining the existing body of literature relating to cultural norms. It also suggests a number of ways of dealing with silent students in a diverse classroom setting.

SECTION 2
BUSINESS & MANAGEMENT
Default Externalities – Is There an Optimal Quantity of Defaults? Harrison C. Hartman .................................................................................................................................................................... 144
The Empowerment, Ongoing Limits and Consequences in Financial Services Reza Shafiezadehgarousi ............................................................................................................................................................ 153
Pride Versus Profit, Can Capitalism Solve Our Socioeconomic Problems? Reza Varjavand ........................................................................................................................................................................... 167
Vital Collaboratives, Alliances and Partnerships: A Search for Key Elements of an Effective Public-Private Partnership Charles Keith Young, Donald W. Good and Catherine Glascock ................................................................................................ 174
A Quantitative Analysis of the Public Administrator‘s Likely Use of Eminent Domain after Kelo Carl J. Franklin ............................................................................................................................................................................. 181
Leaning the Work Place and Change Management: Some Successful Case Implementations Nesa L‘abbe Wu, Yana Parfenyuk, Anita S. Craig and Mayble E. Craig ..................................................................................... 189
Applying Traditional Risk Assessment Models to Information Assurance: A New Domain Not a New Paradigm Prince G. Adu and Kerry W. Ward ............................................................................................................................................... 203
Country vs. Industry Effect on Board Structures Ravi Jain and Dev Prasad ........................................................................................................................................................... 209
The Impact Human Resources has on Strategic Planning Matthew Kaufman ........................................................................................................................................................................ 216
The Bigger the Carrot: Cognizant Compensation for Effective Human Resource Management Milton A. Walters, Sr. ................................................................................................................................................................... 226
Viable Frameworks of Effective Organizational Planning and Sustainability Strategic Planning Approaches at U.S. Universities Darrell Norman Burrell, Megan Anderson and Dustin Bessette ................................................................................................... 229
Snapshot of the Global Wine Market Matthew Kaufman ........................................................................................................................................................................ 240
ABSTRACTS
Where do Millennials stand on the Market System? William C. Ingram ......................................................................................................................................................................... 246
Leading Business Intelligence Initiatives Jonathan Abramson, Ashley Pierre and Jeffery Stevens ............................................................................................................. 247
How Economic Theory may Explain Frequency Collision Avoidance Behaviour among High Frequency International Broadcasters Jerry Plummer and Howard Cochran ........................................................................................................................................... 248
Utilizing Project Management Tools to Improve Project Performance in Africa Phyllis Kariuki ............................................................................................................................................................................... 249
Dismantling Barriers to the Free Flow of Commerce in the European Union: A Prescription for Political Failure John Wrieden ............................................................................................................................................................................... 251
H. C. Hartman IHART - Volume 16 (2011)
144
DEFAULT EXTERNALITIES – IS THERE AN OPTIMAL QUANTITY OF DEFAULTS?
Harrison C. Hartman Georgia State University, USA
ABSTRACT
This paper aims to provide a preliminary analysis of how to find the optimal quantity of loan defaults assuming that defaults lead to negative externalities or spillover costs. This paper assumes that borrowers and lenders fail to consider how defaults have a negative impact on the financial system and the overall economy by increasing the probability of a financial crisis and a loss of output. To achieve the optimal quantity of defaults from the perspective of the overall economy, the economy would allow defaults if the marginal social benefit of allowing the defaults was at least as large as the marginal social cost of the defaults. Keywords: Financial Crisis, Negative Externalities, Defaults, Monetary Economics, Macroeconomics
INTRODUCTION: LOANS OR DEFAULTS AS NEGATIVE EXTERNALITIES
An externality in economics refers to an unintended impact on one or more people not directly involved in a transaction. When externalities lead to third parties benefiting, the externalities are called positive externalities or spillover benefits. When third parties suffer from externalities, the externalities are called negative externalities or spillover costs. Pollution is often given as an example of a cause of a negative externality because people who are neither the producers of a product (where the production leads to pollution) nor consumers of that product can be impacted negatively by the byproduct - pollution. Education is frequently mentioned as a cause of positive externalities. A more educated person, for example, is more informed and could make better decisions impacting third parties. For more general information about externalities, see Krugman and Wells (2009). Bianchi (2010) discusses externalities associated with loans, with one of the findings being that the amount of debt accumulation in an economy is not optimal from the perspective of the overall economy. According to Bianchi (2010), studies have found that the reason is that people do not realize that higher net wealth for them creates an increase in the net wealth of other individuals and organizations. Thus, too many loans are issued. For more and for associated references, see Bianchi (2010). In discussing capital requirements for banks, Seabright (2010) similarly views the assumption of risk by financial organizations as leading to spillover costs. However, credit (or debt from the opposite side of the transaction) has clear spillover benefits. Access to credit has an important impact on spending in the economy. (Burton and Lombra, 2006) Therefore, all other things equal, more credit extended in the economy would lead to higher sales revenue for at least some firms. Not only may consumption decrease when access to credit decreases, but firms‘ investment in physical capital may also decrease. Hence, reducing the amount of loans is not necessarily an appropriate goal. However, this follows not only from the loss of spending that would likely be associated with a decrease in loans. Additionally, higher costs of borrowing imposed on lenders to try to internalize the negative externality that appears to arise only from defaulting (and not from the actual borrowing or lending) could cause more cautious borrowers who are less likely to default to scale back disproportionately on borrowing. Paradoxically, the percentage of borrowers who are greater risk-takers may actually increase (and thus increase the probability of a financial crisis) if an effort to internalize potential spillover costs would be placed on borrowers. Thus, the present study asks not whether too many loans granted but rather if too many defaults occur during financial crises.
HOW PROBLEMS SPREAD
Neither borrowers nor lenders likely consider that a default by the borrower on a mutually agreed-upon loan creates a negative externality or spillover cost by increasing the probability of a financial crisis, although the increase in probability in most cases is extremely small. Yet, when financial claims are layered as discussed in Burton and Lombra (2006), a number of defaults on loans made by Bank A, for example, could cause Bank A to default on a loan made to Bank A by Bank B. The default of Bank A could cause Bank B to default on a loan made to Bank B by Bank C, and so on. With loans that are much larger in size, the increase in the probability of a financial crisis that arises due to a default is larger and may be more easily seen by the borrower, the lender, and others.

H. C. Hartman IHART - Volume 16 (2011)
145
However, defaults on smaller loans contribute to the problem also. Many, if not most, borrowers probably do not realize that their defaults on loans could contribute to financial difficulties beyond themselves and their lenders. Based on the recent financial crisis in the United States, it is likely that many lenders viewed small loans similarly to the way that borrowers viewed them, in that the lenders did not consider the potential spillover impact except on themselves or the financial situation of the borrowers. Yet, according to wikipedia, large numbers of mortgage defaults (many relatively small in size) appeared to be one of the first steps, if not the first step, in the financial crisis. (en.wikipedia.org/wiki/Subprime_mortgage_crisis) To help show how problems can spread, consider that in 2004, the percentage of new mortgages that were subprime approximately doubled, followed by an approximate doubling by early 2008 of the percentage of subprime mortgage payments that were late (from the average level between 1998 and 2006). (en.wikipedia.org/wiki/Financial_crisis_of_2007-2010) The problem likely spread in part due to layering. According to Al Yoon (2008), late payments on at least some prime mortgages were rising more rapidly than increases in late payments on subprime mortgages by July 2008. (www.reuters.com/article/2008/08/22/usa-mortgages-delinquencies-idUSN2256391220080822) Financial innovations likely exacerbated the situation. Many question whether people adequately understood the risk involved with relatively new financial instruments such as collateralized debt obligations and mortgage backed securities. (en.wikipedia.org/wiki/Financial_crisis_of_2007-2010) As Hartman (2009) noted, the television program ―60 Minutes‖ (2009) reported that at least some who sold credit default swaps evidently failed to hold money for the purpose of paying those making claims on the credit default swaps in the event of mortgage defaults.
MACROECONOMIC COSTS
Financial crises, in turn, can exert a spillover cost to the macroeconomy. Quarterly (but reported on an annualized basis), seasonally-adjusted data for real GDP reached a local maximum of 13,363.5 billion chained 2005 dollars in the fourth quarter of 2007. Afterward, real GDP decreased for five out of the next six quarters, reaching a local minimum of 12,810.0 billion chained 2005 dollars in the second quarter of 2009. (research.stlouisfed.org/fred2/data/GDPC1.txt) This represents a loss of real GDP of roughly four per cent. One of the main causes for this loss of production was the financial crisis. Real GDP surpassed its local maximum from the fourth quarter of 2007 in the fourth quarter of 2010 at an estimated value of 13,380.7 billion chained 2005 dollars. (research.stlouisfed.org/fred2/data/GDPC1.txt) However, this is far below what economists would call potential real GDP because it amounts to growth of only about 0.13 per cent over three years, or roughly 0.04 per cent per year. The loss of real GDP was associated with a loss of employment. According to the Bureau of Labor Statistics web page, the unemployment rate (seasonally adjusted) trended upward from 4.4 per cent in May 2007 to 10.1 per cent in October 2009 and stood at 9.0 per cent in April 2011. (data.bls.gov/timeseries/LNS14000000) Obviously, financial crises and their costs are not limited to the United States. Burton and Lombra (2006) list Argentina, Russia, and Mexico as countries that have experienced financial crises.
INTERNALIZING THE EXTERNALITIES WITH LEGAL RIGHTS: PRACTICAL IN ALL CASES?
Textbook solutions for dealing with externalities involve at least minimal government action (for example, establishing legal rights) to get market participants to ―internalize‖ the spillovers. Without at least minimal government policy, it is unlikely that markets alone will lead to the socially optimal amount of the externality. However, as Ronald Coase (1960) showed through the Coase theorem, the combination of legal rights and sufficiently low transactions costs can lead to the socially optimal amount of an externality. In the case of negative externalities, this result holds regardless of whether those whose actions lead to negative externalities have the legal right to perform those actions leading to spillover costs or whether those who are adversely impacted have the legal right to prevent those actions from occurring. If those who commit actions leading to spillover costs have the legal right perform those actions, then those who suffer from the spillover costs could pay those who commit the spillover-inducing actions to reduce the actions causing the spillover costs. Conversely, if people who suffer from spillover costs have the legal right to prevent the actions leading to spillover costs from occurring, those whose actions lead to negative externalities could pay those who are adversely impacted for them to be willing to accept some amount of the spillover costs. With clear legal rights and sufficiently low transactions costs, the work of Coase (1960) showed that in either case, the same amount of negative externalities would be present. In cases where millions of people take actions that cause negative externalities and millions of people suffer from negative externalities, it would be difficult to conduct a negotiation process that would lead to the socially optimal amount of the negative
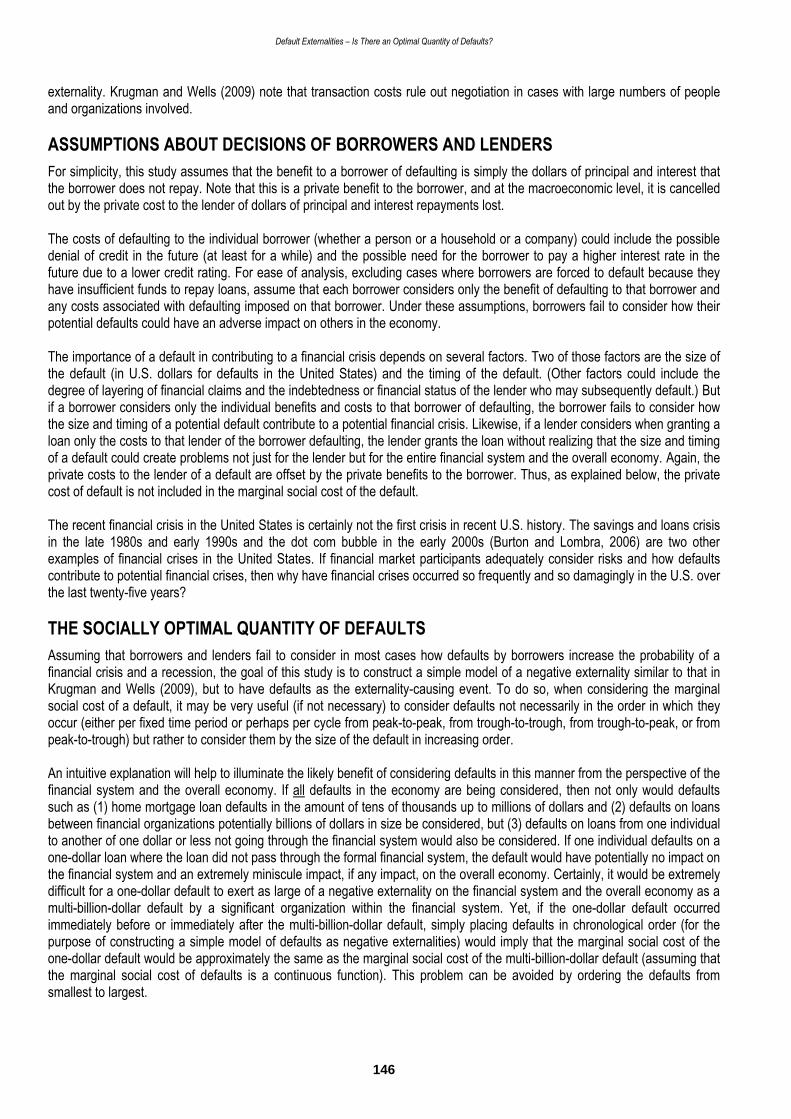
Default Externalities – Is There an Optimal Quantity of Defaults?
146
externality. Krugman and Wells (2009) note that transaction costs rule out negotiation in cases with large numbers of people and organizations involved.
ASSUMPTIONS ABOUT DECISIONS OF BORROWERS AND LENDERS
For simplicity, this study assumes that the benefit to a borrower of defaulting is simply the dollars of principal and interest that the borrower does not repay. Note that this is a private benefit to the borrower, and at the macroeconomic level, it is cancelled out by the private cost to the lender of dollars of principal and interest repayments lost. The costs of defaulting to the individual borrower (whether a person or a household or a company) could include the possible denial of credit in the future (at least for a while) and the possible need for the borrower to pay a higher interest rate in the future due to a lower credit rating. For ease of analysis, excluding cases where borrowers are forced to default because they have insufficient funds to repay loans, assume that each borrower considers only the benefit of defaulting to that borrower and any costs associated with defaulting imposed on that borrower. Under these assumptions, borrowers fail to consider how their potential defaults could have an adverse impact on others in the economy. The importance of a default in contributing to a financial crisis depends on several factors. Two of those factors are the size of the default (in U.S. dollars for defaults in the United States) and the timing of the default. (Other factors could include the degree of layering of financial claims and the indebtedness or financial status of the lender who may subsequently default.) But if a borrower considers only the individual benefits and costs to that borrower of defaulting, the borrower fails to consider how the size and timing of a potential default contribute to a potential financial crisis. Likewise, if a lender considers when granting a loan only the costs to that lender of the borrower defaulting, the lender grants the loan without realizing that the size and timing of a default could create problems not just for the lender but for the entire financial system and the overall economy. Again, the private costs to the lender of a default are offset by the private benefits to the borrower. Thus, as explained below, the private cost of default is not included in the marginal social cost of the default. The recent financial crisis in the United States is certainly not the first crisis in recent U.S. history. The savings and loans crisis in the late 1980s and early 1990s and the dot com bubble in the early 2000s (Burton and Lombra, 2006) are two other examples of financial crises in the United States. If financial market participants adequately consider risks and how defaults contribute to potential financial crises, then why have financial crises occurred so frequently and so damagingly in the U.S. over the last twenty-five years?
THE SOCIALLY OPTIMAL QUANTITY OF DEFAULTS
Assuming that borrowers and lenders fail to consider in most cases how defaults by borrowers increase the probability of a financial crisis and a recession, the goal of this study is to construct a simple model of a negative externality similar to that in Krugman and Wells (2009), but to have defaults as the externality-causing event. To do so, when considering the marginal social cost of a default, it may be very useful (if not necessary) to consider defaults not necessarily in the order in which they occur (either per fixed time period or perhaps per cycle from peak-to-peak, from trough-to-trough, from trough-to-peak, or from peak-to-trough) but rather to consider them by the size of the default in increasing order. An intuitive explanation will help to illuminate the likely benefit of considering defaults in this manner from the perspective of the financial system and the overall economy. If all defaults in the economy are being considered, then not only would defaults such as (1) home mortgage loan defaults in the amount of tens of thousands up to millions of dollars and (2) defaults on loans between financial organizations potentially billions of dollars in size be considered, but (3) defaults on loans from one individual to another of one dollar or less not going through the financial system would also be considered. If one individual defaults on a one-dollar loan where the loan did not pass through the formal financial system, the default would have potentially no impact on the financial system and an extremely miniscule impact, if any impact, on the overall economy. Certainly, it would be extremely difficult for a one-dollar default to exert as large of a negative externality on the financial system and the overall economy as a multi-billion-dollar default by a significant organization within the financial system. Yet, if the one-dollar default occurred immediately before or immediately after the multi-billion-dollar default, simply placing defaults in chronological order (for the purpose of constructing a simple model of defaults as negative externalities) would imply that the marginal social cost of the one-dollar default would be approximately the same as the marginal social cost of the multi-billion-dollar default (assuming that the marginal social cost of defaults is a continuous function). This problem can be avoided by ordering the defaults from smallest to largest.

H. C. Hartman IHART - Volume 16 (2011)
147
Further, as explained below, it would also require a significant amount of resources (at least in terms of dollars of defaults prevented) to stop all defaults including small defaults on loans not originating in the formal financial system. In fact, a clear benefit to allowing some defaults, particularly small defaults, exists in that monetary and non-monetary resources that would be assigned to preventing even the smallest defaults could be assigned to other productive tasks that are probably higher valued rather than being assigned to preventing the smallest defaults. From the perspective of the overall economy, the benefit of allowing much larger defaults decreases. Because the size and timing of defaults can significantly impact the probability of a financial crisis from the perspective of the overall economy, the following analysis will order defaults each year from the smallest to the largest (in U.S. dollar amounts). If two or more defaults are of equal size, the defaults will be placed in order of increasing marginal social cost, where the marginal social cost is defined below. As noted above, if borrowers and lenders take into account only the benefits and costs to themselves, they do not consider how the magnitude or timing of defaults can cause a financial crisis. Yet, from the perspective of the overall economy, this artificial ordering of defaults helps to analyze the benefits and costs to society of defaulting, many of which are considered insufficiently, if at all, by borrowers and lenders. This study assumes that the marginal social benefit of allowing a default does not include the marginal private benefit to the borrower who defaults for two reasons. First, this study assumes that the marginal social benefit of allowing a default is the value to the overall economy of freeing up (for other productive uses) resources that would have been assigned to preventing defaults. Second, the marginal private benefit of a default for the borrower (defined as the number of dollars of principal and interest that the borrower does not need to repay) is offset by the loss of the lender which this study assumes is not included in the marginal social cost function. At the macroeconomic level, this could possibly be considered a zero sum transaction. Similar to the analysis of pollution in Krugman and Wells (2009), the author assumes that the marginal social benefit function of a negative externality such as the one caused by defaults is downward-sloping, meaning that the marginal social benefit of an extra unit of the negative externality is less than the marginal social benefit of the previous unit of that externality. The author also assumes that the marginal social cost function of a negative externality like the one arising from defaults is upward-sloping in that the more of the negative externality present, the greater is the marginal social cost of the last unit of the negative externality. Just as pollution reduction would necessitate the use of resources that could have been assigned to other activities that may have had more value to the economy, reducing defaults comes at a cost to society. In the extreme case, reducing defaults to zero per year in the United States economy would necessitate vast sums of money and non-monetary resources to be diverted away from other productive uses into default reduction. As a hypothetical example, suppose that an economy seriously attempts to have zero dollars of defaults per year. In that case, people may be assigned to scrutinize more carefully each loan application to try to prevent a possible default. The benefits of allowing a few dollars of loans to go into default would be much larger as the number of dollars worth of defaults approaches zero because a larger number of people would be assigned away from other productive activities to loan application scrutiny and attempting to monitor even the smallest loans of one dollar or less that did not originate in the formal financial system. With a large number of defaults, the benefit of releasing people away from loan application evaluation and default prevention to other activities is lower. (At the extreme case of no loan application evaluation, the economy would need to take workers who may be most productive at evaluating loan applications and assign them to produce other goods where their production is lower.) Thus, the marginal social benefit of an additional dollar of defaults is much lower with a large number of defaults. To clarify, rather than aiming to have zero defaults, it would be beneficial to allow at least a few dollars of defaults to free up resources to produce other goods. Resources would likely flow to other higher-valued activities. Thus, the marginal social benefit of the first dollar of defaults would likely be high. However, with a much larger number of defaults, as few resources would be assigned to preventing defaults, the marginal social benefit of the last dollar of defaults would be lower. With a very large number of defaults, fewer resources would be assigned to scrutinizing loan applications to prevent possible defaults. For simplicity, assume that the marginal social cost of a default is the negative externality of the potential loss not to the lender who directly granted the loan that went into default but the potential and actual losses of lenders indirectly impacted by the default plus the losses to the overall economy of lower real GDP and lower employment. All other things equal, these costs increase as the number of dollars of defaults increases. The private cost of the default to the lender who granted the loan is not included in the marginal social cost of the loan in this study for simplicity. The private cost to the lender as defined equals the private benefit to the borrower as defined. Thus, in a sense, at the economy-wide level, the private benefit to the borrower of a default cancels out the private cost to the lender.

Default Externalities – Is There an Optimal Quantity of Defaults?
148
However, by the definition of a negative externality and the assumption that a default leads to negative externalities, any costs of defaults incurred by third parties who are neither the borrowers nor the direct lenders would be included in the marginal social cost of a default. For example, if Bank A defaults on a loan made to Bank A by Bank B and the default of Bank A causes Bank B to default on a loan made to Bank B by Bank C, the costs to Bank C resulting from the default of Bank A (not Bank B) would be included in the marginal social cost of the default of Bank A. Even if Bank B does not default on the loan made by Bank C to Bank B (because of the default of Bank A), any costs incurred by Bank C due to the default of Bank A in this simplified example would count toward the marginal social cost of the default. In the context of this simplified example, future work could address if Bank C subsequently defaults on a loan made by Bank D at least in part due to the default of Bank A on its loan from Bank B whether the losses of Bank D (and beyond) are part of the marginal social cost of the default of Bank A. Obviously, the potential losses of employment and real GDP due to a default would count toward the marginal social cost of the default. One may argue that if Bank C lends to Bank B and Bank B lends to Bank A, it is as if Bank C loaned funds to Bank A and thus there is no negative externality. However, that reasoning appears inconsistent with the definition of a negative externality because Bank C did not directly lend funds to Bank A. Further, in the view of the author, if ―indirect lenders‖ (i.e. Bank C in the example) are deemed not suffer spillover costs due to defaults because of their indirect participation in the loans, it becomes very difficult to identify any negative externalities or spillover costs due to defaults because households and firms that may suffer from losses of real GDP and employment could be deemed as indirectly lending funds to people, banks, or other organizations eventually defaulting. Future work could further define the marginal social benefit and the marginal social cost of defaults. The marginal social cost of defaulting increases as the number of dollars of defaults increases. All other things equal, with more dollars of defaults, the probability of a greater financial crisis adversely impacting more people increases. Hence, the marginal social cost of defaults increases. According to wikipedia, the Bankruptcy Abuse Prevention and Consumer Protection Act was passed in 2005. (en.wikipedia.org/wiki/Bankruptcy_Abuse_Prevention_and_Consumer_Protection_Act) A possible goal of the legislation was to reduce bankruptcy filings due to higher costs associated with increasing defaults. What number of defaults would be optimal? To maximize overall well-being in the economy, the economy would allow defaults to occur as long as the marginal social benefit of a default was greater than or equal to the marginal social cost of a default. In Figure 1 below, this quantity of defaults is Dopt in the diagram. At the last default allowed, the marginal social benefit and the marginal social cost of the default equal Vopt as shown in Figure 1. The reader should recall that actual defaults in the economy will almost certainly not occur in the order assumed in Figure 1 where defaults are ordered from smallest to largest and then in increasing order of marginal social cost. However, policymakers can still use the same benefit/cost analysis on a case-by-case basis when assessing whether or not to allow a default. During a financial crisis, it is likely that the number of defaults would exceed Dopt and could reach Dcrisis as shown in Figure 1. Large numbers of borrowers may simply have insufficient funds to repay loans and thus may be forced to default without considering even the private benefits and private costs, let alone social benefits and social costs. At this quantity of defaults, the marginal social benefit of the last default, MSBcrisis, is less than the marginal social cost of the last default, MSCcrisis. Thus, the overall economy would clearly benefit from a smaller number of defaults.

H. C. Hartman IHART - Volume 16 (2011)
149
Figure 1: The socially optimal quantity of defaults versus the number of defaults during a crisis
It is possible that during either a normal economy or a boom, the number of defaults could be less than Dopt. However, it is possible that the degree to which the MSCcrisis exceeds the MSBcrisis during financial crises dominates any times when the marginal social cost of defaults during a boom is less than the marginal social benefit of defaults. This would result in an overall net loss of social welfare due to default externalities. But how could the spillover costs of defaults be internalized?
A LOAN TAX?
With many negative externalities, a tax could be used to internalize the spillover costs of the negative externality and reduce the amount of the negative externality toward the socially optimal quantity. However, uncommon if not unique features of defaults prevent this. A tax on defaulting to be paid by the borrower in the event of an involuntary default is not feasible because the borrower by involuntarily defaulting demonstrates that that the borrower does not have the ability to pay the tax. In that case, imposing a tax on the defaulter would reduce the amount the lender receives, thus further increasing the probability of a financial crisis. Another approach would be to tax the interest rate on loans. Consider a supply of loanable funds and demand for loanable funds model as in Burton and Lombra (2006). In Figure 2 below, Dlf represents the demand for loanable funds and Slfp represents the private supply of loanable funds. Without a loan tax, the equilibrium quantity of loans per month would be Lp and the equilibrium interest rate would be Rp. When lenders and borrowers interact and thus determine the equilibrium interest rate, it is likely that in most cases, neither the lender nor the borrower considers how a default on the loan could contribute to a financial crisis. The upward-sloping supply of loanable funds function shows at each interest rate the total quantity of funds that lenders are willing and able to lend. While a lender may possibly consider the impact of a default by the borrower on the ability of that lender to pay its liabilities, what if lenders fail to consider how defaults on loans that they make could hinder not only their own ability to repay any funds they
MSBdefault
MSCdefault
Vopt
Marginal Benefit and Marginal Cost of Defaults
Dollars of Defaults Per Year
MSCcrisis
MSBcrisis
Dopt Dcrisis

Default Externalities – Is There an Optimal Quantity of Defaults?
150
borrowed but also subsequently the ability of others to repay loans? In other words, what if the supply of loanable funds function reflects only the private costs of and risks to the lenders (such as liquidity risk and interest-rate risk) and neglects any spillover costs of defaults? And what if demanders of loanable funds fail to consider how their potential defaults could contribute to a financial crisis when deciding on the number of dollars they want to borrow at each nominal interest rate? As mentioned earlier, Burton and Lombra (2006) discuss the layering of financial claims. To provide a simplified example, if many who borrowed from Bank A default on loans made by Bank A, the defaults could cause Bank A to default on a loan made to Bank A by Bank B. If Bank A defaults on a loan made by Bank B, the default could hinder the ability of Bank B to repay a loan from Bank C. If Bank C is not repaid on time by Bank B, that could cause Bank C to default on a loan made by Bank D. Given the recent events of the global financial crisis, it is reasonable to ask whether a borrower when applying for a loan or a lender when granting a loan considers the degree to which a default on the loan granted by that lender to that borrower contributes beyond the ability of that lender to pay its own liabilities to the possibility of a financial crisis and a recession. A social supply of loanable funds function (Slfs) that reflects not only private costs and risks but also the negative externalities of defaults would be located to the left of or above the private supply of loanable funds function. This would imply fewer loans being granted at each nominal interest rate and a higher interest rate charged for each quantity of funds loaned, both due to the internalization of spillover costs associated with defaulting. At the socially optimal equilibrium, the quantity of funds loaned would decrease to Lopt, with the goal of fewer loans granted leading to fewer defaults (barring a large adverse selection problem where the smaller quantity of loans would be made disproportionately to greater risk takers). Further, equilibrium interest rates would increase to Ropt reflecting the internalization of negative externalities associated with the risk of default. One solution to move the economy toward the socially optimal equilibrium would be that a loan tax could be used to achieve this result of shifting the supply of loanable funds leftward. The loan tax would help for borrowers to internalize the cost of defaults because they would have to make higher repayments. The government sector could collect the loan tax as an additional form of insurance. Of course, deposit insurance applies only to some types of bank deposits and clearly fails to cover financial innovations such as credit default swaps and other forms of securitization. These financial innovations likely have increased the degree of layering and thus the chances of a financial crisis in the event of defaults. Hence, the social supply of loanable funds curve may have shifted further to the left of the private supply of loanable funds function. The revenue collected from the loan tax could be saved by the government sector to guard against financial crises. However, a major drawback of a loan tax that probably prohibits the use of a loan tax as the only measure needed to internalize the externality is that by forcing borrowers to pay higher interest rates, it could potentially cause borrowers to default who would not have defaulted with loans not subject to the tax. Another major problem is that lenders would receive less than without a loan tax if the government sector collects the tax. Thus, if some of their borrowers begin to default, the lenders are at a greater disadvantage than without the loan tax because they would have received less from borrowers who repaid. Further, the imposition of a loan tax could exacerbate the adverse selection problem, where after a loan tax is placed in effect, the percentage of loan applicants who are greater risk takers may increase. (For more on adverse selection, see Burton and Lombra (2006) and Mishkin (2004).) Perhaps improved regulation would provide a better solution.
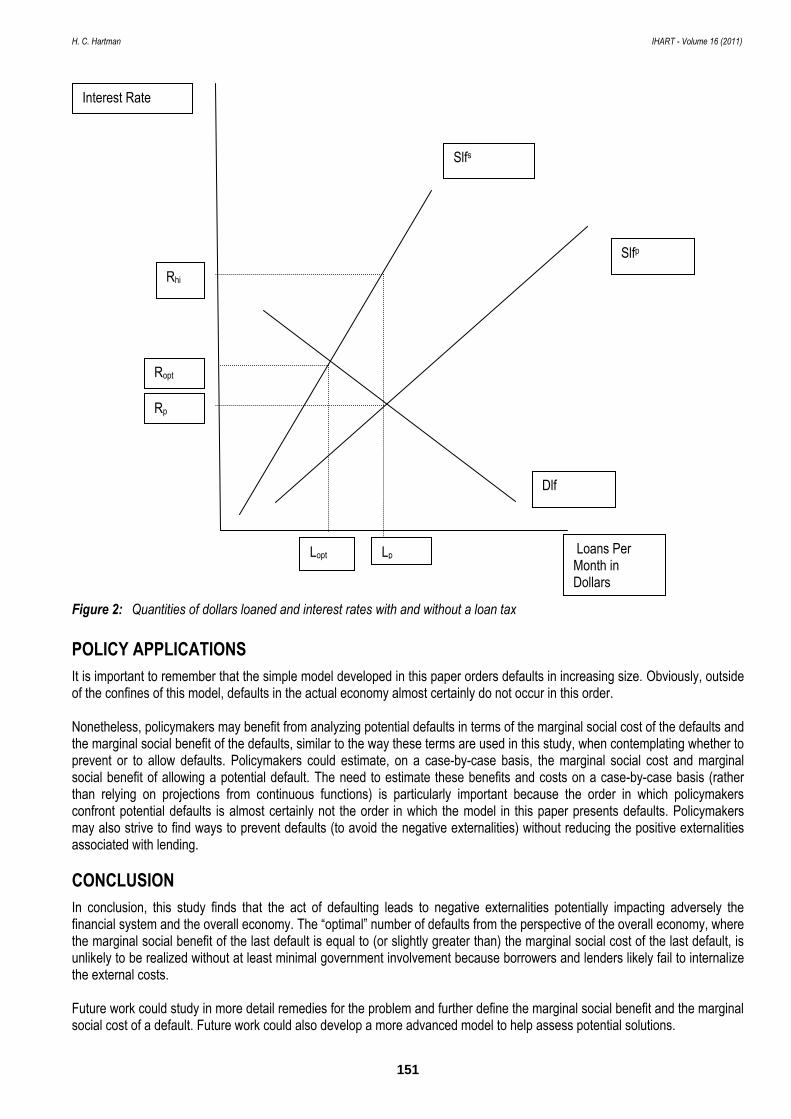
H. C. Hartman IHART - Volume 16 (2011)
151
Figure 2: Quantities of dollars loaned and interest rates with and without a loan tax
POLICY APPLICATIONS
It is important to remember that the simple model developed in this paper orders defaults in increasing size. Obviously, outside of the confines of this model, defaults in the actual economy almost certainly do not occur in this order. Nonetheless, policymakers may benefit from analyzing potential defaults in terms of the marginal social cost of the defaults and the marginal social benefit of the defaults, similar to the way these terms are used in this study, when contemplating whether to prevent or to allow defaults. Policymakers could estimate, on a case-by-case basis, the marginal social cost and marginal social benefit of allowing a potential default. The need to estimate these benefits and costs on a case-by-case basis (rather than relying on projections from continuous functions) is particularly important because the order in which policymakers confront potential defaults is almost certainly not the order in which the model in this paper presents defaults. Policymakers may also strive to find ways to prevent defaults (to avoid the negative externalities) without reducing the positive externalities associated with lending.
CONCLUSION
In conclusion, this study finds that the act of defaulting leads to negative externalities potentially impacting adversely the financial system and the overall economy. The ―optimal‖ number of defaults from the perspective of the overall economy, where the marginal social benefit of the last default is equal to (or slightly greater than) the marginal social cost of the last default, is unlikely to be realized without at least minimal government involvement because borrowers and lenders likely fail to internalize the external costs. Future work could study in more detail remedies for the problem and further define the marginal social benefit and the marginal social cost of a default. Future work could also develop a more advanced model to help assess potential solutions.
Slfp
Dlf
Slfs
Ropt
Interest Rate
Rp
Rhi
Loans Per Month in Dollars
Lp Lopt

Default Externalities – Is There an Optimal Quantity of Defaults?
152
REFERENCES
Bianchi, J. (2010). Credit externalities: macroeconomic effects and policy implications. American Economic Review, 100(2), pp. 398-402.
Burton, M. E. and Lombra, R. E. (2006). The Financial System and the Economy: Principles of Money and Banking, Mason, Ohio: Thomson Southwestern, pp. 51-2, 116-24, 214, 246, 282-6.
Coase, R.. (1960). The problem of social cost. Journal of Law and Economics, 3(1), pp 1-44. data.bls.gov/timeseries/LNS14000000. Viewed May 6, 2011. en.wikipedia.org/wiki/Bankruptcy_abuse_prevention_and_consumer_protection_act. Viewed May 6, 2011. en.wikipedia.org/wiki/Financial_crisis_of_2007-2010. Viewed May 6, 2011. en.wikipedia.org/wiki/Subprime_mortgage_crisis . Viewed May 6, 2011. Hartman, H. C. (2009). Do changes in regulation have an impact on the number of bank failures? International Journal of
Accounting Information Science & Leadership, 2(4), pp. 40-50. Krugman, P. and Wells, R. (2009). Economics. New York: Worth Publishing, pp. 433-54. Mishkin, F. (2004). The Economics of Money, Banking, and Financial Markets. Boston: Pearson Addison Wesley, p. 31. research.stlouisfed.org/fred2/data/GDPC1.txt. Viewed May 6, 2011. Seabright. P. Aug 22, 2010. ―Do new bank-capital requirements pose a risk to growth?‖ Economics by invitation
www.economist.com/economics/by-invitation/contributors/Paul%20Seabright. Viewed May 5, 2011. 60 Minutes. (2009). broadcast August 30, Available online at
www.cbsnews.com/stories/2008/10/26/60minutes/main4546199.shtml. Viewed May 6, 2011. Yoon, A. (2008). www.reuters.com/article/2008/08/22/usa-mortgages-delinquencies-idUSN2256391220080822. Viewed on
May 6, 2011.
R. Shafiezadehgarousi IHART - Volume 16 (2011)
153
THE EMPOWERMENT, ONGOING LIMITS AND CONSEQUENCES IN FINANCIAL SERVICES
Reza Shafiezadehgarousi Islamic Azad University, Iran
ABSTRACT
Empowerment may be one of the answers to the growing competition and increasingly demanding customers in the financial retail sector, but the relation between empowerment and profit-oriented behaviour at the service encounter has been only sparsely documented. This article offers a comparative empirical analysis of the conditions and impact of empowerment and related activities in Iranian financial institutions, with a focus on semi-standardised frontline jobs. The results indicate that granting decision-making authority and autonomy to the individual front-line employees has often been a powerful step in the efforts of the financial service companies to increase their competitiveness. In the change process, formal participation has only a moderate supportive impact on performance while changes initiated at the branch offices and the linking of rewards with performance, both have a notably positive impact on the competitiveness and profit-oriented behaviour of front-line employees.
Keywords: Empowerment; Financial Services; Implementation; Profit Orientation; Service Quality.
1. INTRODUCTION
Despite a general trend towards delegation and empowerment in service companies, there is still some uncertainty about the impact of empowerment, and even about what it actually consists of (Bowen, 2006). In the prescriptive literature of human resource management, this popular term has been used rather loosely (Wilkinson, 2002), and researchers have not reached any general *Corresponding author. However, it has long been recognised that empowerment is more than a simple managerial technique for delegation (Conger & Kanungo, 1988). As a motivational construct it also represents a complicated process, and in analysing its effects on performance in financial services, sufficient attention should be paid to the context in which the empowerment occurs. In our approach we stress that the employees‘ power to make decisions during the service encounter is at the core of empowerment. But empowerment is also a change process involving the participation of front-line employees, and its impact cannot be understood unless it is regarded as a change in the formal authority and in the state of mind. Several managerial initiatives such as the application of rules, the formulation of quality measures, and training activities are included in our analysis, in order to establish the connection between empowerment and performance indicators. The main purpose of the paper is to explore the impact on performance in a comparative analysis based on the perceptions of front-line employees in financial service companies in Iran, using both survey data and interviews. Special attention is attached to the question of whether empowerment merely fosters friendliness and service quality, or whether it can be related to a type of profit-oriented behaviour that would be more challenging to the norms prevailing among employees in financial branch offices. Thus, it is a central point in recent prescriptive literature that quality at the service encounter does pay and that a ‗service profit chain‘ can be identified in which employee satisfaction leads to customer satisfaction, which in turn leads to customer retention and profit (Heskett, Sasser, & Schlesinger, 2004). The evidence and conditions of such relationships form the point of departure for our analysis, since this focuses on a part of the service profit chain. Is it possible to establish the linkage between the formal core of empowerment and the delivery of competitive service in financial service companies? Does empowerment make employees feel able to produce results for customers or would a production-line approach be just as good (Bowen, 2006; Bowen & Youngdahl, 2006)? Employees enjoying appropriate decision-making power will probably provide a better quality of service (Flohr, 2000), but are such initiatives also linked to profit-oriented behaviour? Our results indicate that granting decision-making authority and autonomy to the individual front-line employees is a powerful ingredient in the financial service retailers‘ efforts to be competitive, but that training and guidelines concerning service encounters appear to offer a high degree of support. In the process of change, the participation in itself is less likely to foster the intended change. In particular, changes initiated in the branch offices did seem to have a positive impact on the competitiveness and profit-oriented behaviour of front-line employees.
The Empowerment, Ongoing Limits and Consequences in Financial Services
154
2. EMPOWERMENT AND PERFORMANCE IN FINANCIAL COMPANIES
2.1. The Concept of Empowerment
Empowerment sounds good. Few would argue against something that is closely related to western cultural norms and is believed to support organizational performance. Unfortunately, it is a rather general term and not just a managerial technique that can be used without any reservations. Only recently has it received rigorous conceptualisation and measurement, and recognition as an intrinsic motivational construct at the level of the individual (Conger & Kanungo, 1988; Thomas & Velthouse, 2002; Spreitzer, 2006). Empirical research on the antecedents and consequences of empowerment is still in its infancy (Spreitzer, 2006). Nevertheless, empowerment is only one of several labels used in describing the kind of organisational power-sharing in which discretion is passed on to subordinates. ‗‗Employee Empowerment‘‘ (McClelland, 1975; Kanter, 1979, 1983; Conger & Kanungo, 1988) may be seen as part of the broader concept of ‗‗Employee Involvement‘‘ (Lawler et al., 1992; Cummings & Worley, 2002) which also includes ‗‗Participative Management‘‘ (McGregor, 1960; Likert, 1961; Argyris, 1964), ‗‗Job Enrichment‘‘ (Hackman & Oldham, 2000), ‗‗Industrial Democracy‘‘ (Poole, 1986) and ‗‗Quality of Work Life‘‘ (Davis, 1957; Trist, 1963; Emery & Trist, 1965). In particular, it should be recognised that research in participation and job enrichment is of relevance to empowermentFsomething that is often disregarded. Basically, empowerment is seen as a broad motivational process (Conger & Kanungo, 1988; Cummings & Worley, 2002; Thomas & Velthouse, 2002; Spreitzer, 2006; Quinn & Spreitzer, 2006). From this perspective, empowerment is defined as ‗‗ya process of enhancing feelings of self-efficacy among organizational members through the identification of conditions that foster powerlessness and through their removal by both formal organizational practices and informal techniques of providing efficacy information‘‘ (Conger & Kanungo, 1988, p.474). Closely related to this definition are approaches of a more psychological kind that attempt to analyse, measure and explain feelings of empowerment, as well as examining the sources of powerlessness (Conger & Kanungo, 1988; Thomas & Velthouse, 2002; Spreitzer, 2006). It is recognised that empowerment is both a process and the resulting state of mind. However, such approaches often stress empowerment as a goal in itself, and in the more popular versions can turn into a perception of empowerment as incompatible with control. Hence, programmes characterised by management-defined performance goals may foster external commitment, but are assumed to contradict the internal commitment associated with empowerment (Argyris, 1998). Such claims lack supporting evidence, and are hardly relevant to the more specific commitment to strategies and initiatives. On the motivational impact of specific commitment the literature is still sparse (Becker, 2002; Becker, Billings, Eveleth, & Gilbert, 2004). From a management point of view other approaches seem more relevant. They have dealt less with the nature of the underlying cognitive processes and more with the managerial techniques and actual interventions. Empowerment may still be perceived as a state of mind, but the focus is shifted to the organizational arrangements that allow employees more autonomy, discretion and unsupervised decision-making responsibility (Buchanan & Huczynsky, 2005). Thus, the involvement resulting from the decentralisation of power and the relevant supporting systems come into the focus of attention (Lawler, Mohrman, & Ledford, 2002; Bowen 2006). Bowen (2006) simply describe empowerment as a state of mind produced by high-involvement management practices. These practical approaches in recent service literature tend to focus on decisionmaking power at the point of contact between organisation and customer, and the use of empowerment as a central concept in the analysis of the role of front-line employees (Bowen ,2006). The context of empowerment, at any rate, differs from the political supportive context of the earlier Scandinavian experiments in participation and industrial democracy, in that it springs from business considerations and customer-related strategies. It is directed more towards individuals and small groups than to the participative schemes based on consultative committees (Wilkinson, 2002). In analysing front-line jobs in financial services in which decision-making power and autonomy are of central importance, we suggest that the nature of the job in terms of job enrichment should be seen as the core condition of empowerment, a view that coincides with a psychological approach (Conger & Kanungo, 1988; Spreitzer, 2006). However, it is still only the core of the concept. As Bowen (2006) note in their prescriptions, empowerment may include sharing information, providing knowledge and rewarding performance Fall elements that are necessary to the whole: if employees are to be granted greater discretion to act appropriately at their service encounters it surely behoves management to provide them with the necessary skills, information and rewards.
R. Shafiezadehgarousi IHART - Volume 16 (2011)
155
In our approach we suggest that the core of empowerment may be reinforced by the other organisational arrangements that support an empowered state of mind among front-line employees. Added to which, explanations of mainly structural kind should also pay attention to the process of empowerment: Will employee participation in implementing recent organisational changes in human resources, structure or technology serve to reinforce this sense of empowerment? Or is participation, which could be included in the concept of empowerment, less relevant to the impact?
2.2. Empowerment and Performance
Hence, in analysing the consequences of empowerment it is important to note how narrowly the concept is defined, because the empirical evidence regarding the impact on employee satisfaction and performance may be heavily dependent on this definition. When a recent review of the literature concludes that participation has only a moderate Falbeit positiveFimpact on performance (Wagner, 1994), it could be argued that the weakness of the reported effect is only to be expected, because participation is defined narrowly as ‗‗a process of influence sharing‘‘. Reported effects would probably be stronger, if appropriate rewards, communication practices, training and selection practices were included (Ledford & Lawler, 2002). Broader concepts of participation and empowerment may thus be relevant explanatory factors. Our analytical approach comes close to this view, as we use rather a narrow concept but take related initiatives into account. We address the question of the direct impact of empowerment as well as mapping important confounding modifications. Such an approach is particularly important since we are observing mixed situations including both routine and non-routine tasks. Although organic and empowered organisations seem appropriate for the management of the non-routine parts, they are not easy to combine with the bureaucratic features that are appropriate to the routine parts. However, bureaucracy and formalization do not necessarily entail a mechanistic and coercive organisation that hinders motivation. Bureaucracy can possess enabling features as well (Adler & Borys,2004). The idea of improving performance in service delivery is a strong driving-force behind moves towards empowerment. Improving service quality and profitability through empowerment can even be regarded as a strategic imperative. At the same time various steps are being taken in financial service companies with a view to encouraging a market orientation and performance through central control, often supported by the use of yet more sophisticated information technology. Such initiatives appear under various labels: Total Quality Management, Business Process Reengineering, the centralisation of routine tasks, the segmentation of customers and so on. If we are to understand the impact of empowerment, the concept has to be considered within this broader context. Our framework is illustrated in Fig. 1, which draws on the concept of empowerment as used by Bowen (2006), and the model reflects the view that job enrichment drives performance (Hackman & Oldham, 2000). The dependent variables are performance in terms of perceived service quality, price competitiveness and profit orientation in customer interactions. These will be addressed separately below. As regards service quality, some recent research in financial service companies indicates that the effect of empowerment is positive or mixed. Studies reported by Schneider and Bowen (2006) generally showed a positive relationship between what employees reported about their experience as empowered employees and what the customers experienced as service consumers. However, some of the authors‘ data on banks did not. The explanation could be that empowerment favours warm and courteous service delivery, while the customers set greater store by the speed and reliability of the service. Thus, it is well documented that reliability is the most important service quality dimension as perceived by bank customers (Zeithaml, Parasuraman, & Berry, 1998). According to these arguments, empowerment could be dangerous as it can create friendly but unprofitable employees who do not fulfil important customer needs such as reliability, professional advice (assurance) and responsiveness. Eager to be friendly to everybody, such employees may even lose potentially profitable customers. However, it has been shown that delegation may be linked to reliable service delivery in banks (Flohr, 2000). It can then be argued further that delegation fosters empowerment and helps employees to finish their work on their own, to meet deadlines, and to keeptheir promises to the customers.
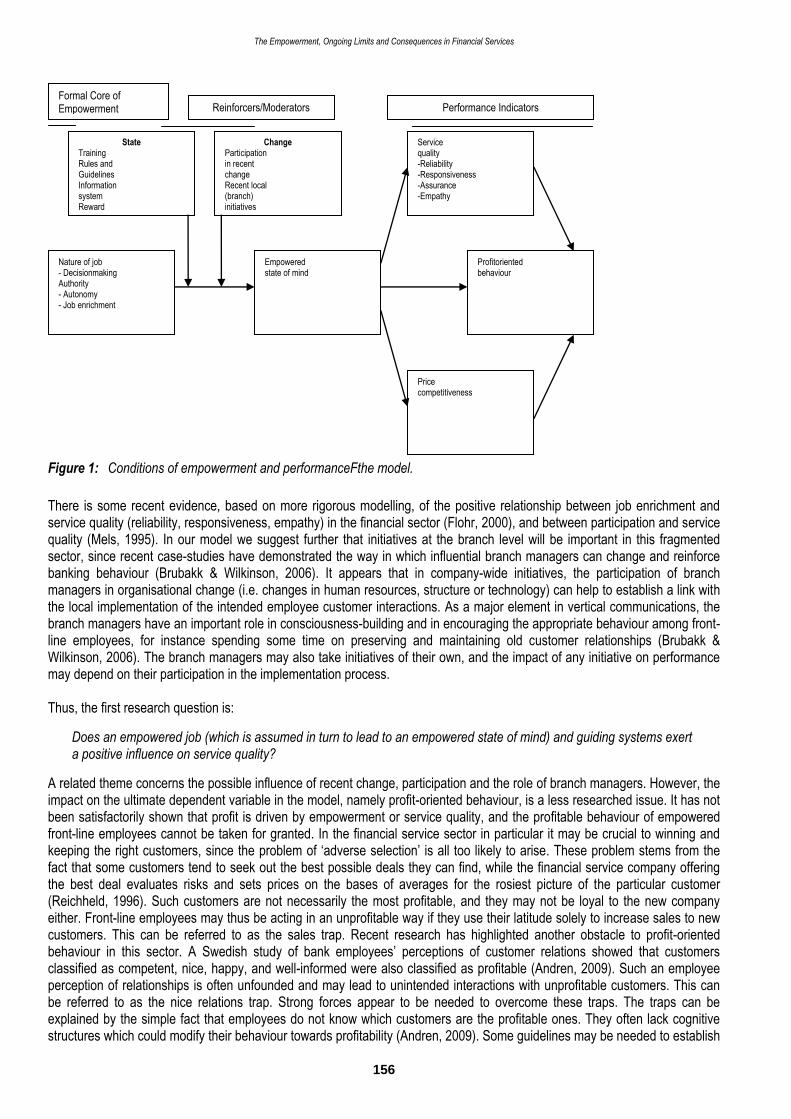
The Empowerment, Ongoing Limits and Consequences in Financial Services
156
Figure 1: Conditions of empowerment and performanceFthe model.
There is some recent evidence, based on more rigorous modelling, of the positive relationship between job enrichment and service quality (reliability, responsiveness, empathy) in the financial sector (Flohr, 2000), and between participation and service quality (Mels, 1995). In our model we suggest further that initiatives at the branch level will be important in this fragmented sector, since recent case-studies have demonstrated the way in which influential branch managers can change and reinforce banking behaviour (Brubakk & Wilkinson, 2006). It appears that in company-wide initiatives, the participation of branch managers in organisational change (i.e. changes in human resources, structure or technology) can help to establish a link with the local implementation of the intended employee customer interactions. As a major element in vertical communications, the branch managers have an important role in consciousness-building and in encouraging the appropriate behaviour among front-line employees, for instance spending some time on preserving and maintaining old customer relationships (Brubakk & Wilkinson, 2006). The branch managers may also take initiatives of their own, and the impact of any initiative on performance may depend on their participation in the implementation process. Thus, the first research question is:
Does an empowered job (which is assumed in turn to lead to an empowered state of mind) and guiding systems exert a positive influence on service quality?
A related theme concerns the possible influence of recent change, participation and the role of branch managers. However, the impact on the ultimate dependent variable in the model, namely profit-oriented behaviour, is a less researched issue. It has not been satisfactorily shown that profit is driven by empowerment or service quality, and the profitable behaviour of empowered front-line employees cannot be taken for granted. In the financial service sector in particular it may be crucial to winning and keeping the right customers, since the problem of ‗adverse selection‘ is all too likely to arise. These problem stems from the fact that some customers tend to seek out the best possible deals they can find, while the financial service company offering the best deal evaluates risks and sets prices on the bases of averages for the rosiest picture of the particular customer (Reichheld, 1996). Such customers are not necessarily the most profitable, and they may not be loyal to the new company either. Front-line employees may thus be acting in an unprofitable way if they use their latitude solely to increase sales to new customers. This can be referred to as the sales trap. Recent research has highlighted another obstacle to profit-oriented behaviour in this sector. A Swedish study of bank employees‘ perceptions of customer relations showed that customers classified as competent, nice, happy, and well-informed were also classified as profitable (Andren, 2009). Such an employee perception of relationships is often unfounded and may lead to unintended interactions with unprofitable customers. This can be referred to as the nice relations trap. Strong forces appear to be needed to overcome these traps. The traps can be explained by the simple fact that employees do not know which customers are the profitable ones. They often lack cognitive structures which could modify their behaviour towards profitability (Andren, 2009). Some guidelines may be needed to establish
State Training Rules and Guidelines Information system Reward system
Change Participation in recent change Recent local (branch) initiatives
Nature of job - Decisionmaking Authority - Autonomy - Job enrichment
Empowered state of mind
Price competitiveness
Service quality -Reliability -Responsiveness -Assurance -Empathy
Profitoriented behaviour
Performance Indicators Reinforcers/Moderators Formal Core of Empowerment
R. Shafiezadehgarousi IHART - Volume 16 (2011)
157
cognitions associated with meaningfulness and competence that are central to the intrinsic task motivation of empowerment (Thomas & Velthouse, 2002). Training, information systems and even rules may help, even though they could be formally aimed at service quality. Reward systems may help, even though they are often focussed on sales. Participating branch managers and action taken at the branch level may have a direct impact on the profit orientation of front-line employees. Thus the second, and central, research question is: Does an empowered job (which is in turn assumed to lead to an empowered state of mind) and guiding systems exert a positive influence on profit orientation? A related theme also concerns the possible influence of recent change and the participation and role of branch managers. And further, how do service quality and price competitiveness, which we expected to be more directly linked to formal decision-making authority, influence profit orientation? We expected both empowerment, service quality and competitive prices to be positively related to profit-oriented behaviour, even though profit-oriented behaviour is narrowly defined as being selective and pro-active in sales and services focussing on existing customers.
3. METHODS
A nationwide survey constitutes the first part of the study. The survey was conducted during the spring of 1998, when questionnaires were sent to all Iranian banks (65), insurance companies (27) and mortgage credit institutes (6) with more than 30 employees. In the part of the survey reported in this article, pre-tested questionnaires were mailed to a randomly selected branch office in all the 88 companies that possessed branch offices. In each of these branch offices the manager and one randomly selected front-line employee who performed retail-customer advisory tasks received a questionnaire. A total of 59 per cent of the branch managers and 69 per cent of the front-line employees answered the questionnaire. Although response rates varied slightly between the available groupings according to job type, organisation size and type, our analysis showed significant differences only in the case of size, since the larger companies were slightly over-represented. As the study was explorative, the interpretation of survey data was linked to subsequent interviews. Thus the research shares certain features with methodological triangulation (Ronald, 2008), in that structured open-ended interviews were used to enrich the questionnaire data. In three successful organisations of varying size general interviews were made at different levels to explore control. A total of seven people were interviewed at the branch level in this part of the study. In 1999 ten front-line employees randomly chosen from among the front-line respondents of the survey were also interviewed by telephone, to enable a more direct follow-up of the survey. These interviews focussed on employee perceptions of actual work conditions and customer-related behaviour. While the survey was geared mainly to correlation analyses of the variables in pairs, our interviews were intended to provide a deeper understanding of the respondents‘ everyday activities. Ideally, individual or organisational behaviour should be perceived not only as the outcome of a finite set of discrete variables, but also as a complex issue allowing for qualitative approaches that give a more holistic view of the actual situations and include the respondents‘ own perspective (Cassell & Symon, 2004). Even so, the employee interview diverged very little from the structured, standardised interviews suited to a more rigorous qualification of results (Ronald, 2008). The measures used in the survey section of the study are shown in Tables 1 and 2. The variables are only partially based on constructs whose reliability has been proved in advance. However, in measuring job design we used a reduced 8-item version of the Motivating Potential Score including skill variety, task identity, task significance, autonomy and feedback and computed as proposed by Hackman and Oldham (2000). Service quality related to the fulfillment of customers‘ expectations is the first-level dependent variable. The survey relies on front-line employee perceptions and the concept is described by fewer relevant items of the instrument, and only the most comparable process-oriented dimensions are included in this analysis:
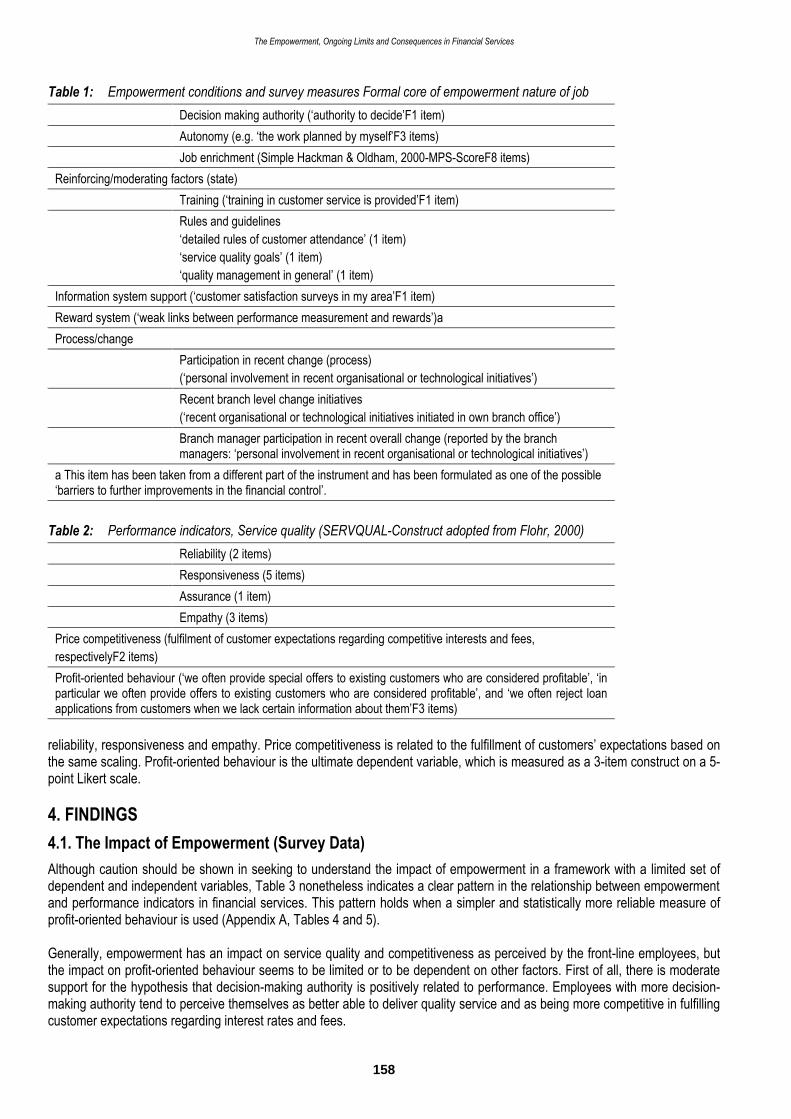
The Empowerment, Ongoing Limits and Consequences in Financial Services
158
Table 1: Empowerment conditions and survey measures Formal core of empowerment nature of job
Decision making authority (‗authority to decide‘F1 item)
Autonomy (e.g. ‗the work planned by myself‘F3 items)
Job enrichment (Simple Hackman & Oldham, 2000-MPS-ScoreF8 items)
Reinforcing/moderating factors (state)
Training (‗training in customer service is provided‘F1 item)
Rules and guidelines
‗detailed rules of customer attendance‘ (1 item)
‗service quality goals‘ (1 item)
‗quality management in general‘ (1 item)
Information system support (‗customer satisfaction surveys in my area‘F1 item)
Reward system (‗weak links between performance measurement and rewards‘)a
Process/change
Participation in recent change (process)
(‗personal involvement in recent organisational or technological initiatives‘)
Recent branch level change initiatives
(‗recent organisational or technological initiatives initiated in own branch office‘)
Branch manager participation in recent overall change (reported by the branch managers: ‗personal involvement in recent organisational or technological initiatives‘)
a This item has been taken from a different part of the instrument and has been formulated as one of the possible ‗barriers to further improvements in the financial control‘.
Table 2: Performance indicators, Service quality (SERVQUAL-Construct adopted from Flohr, 2000)
Reliability (2 items)
Responsiveness (5 items)
Assurance (1 item)
Empathy (3 items)
Price competitiveness (fulfilment of customer expectations regarding competitive interests and fees,
respectivelyF2 items)
Profit-oriented behaviour (‗we often provide special offers to existing customers who are considered profitable‘, ‗in particular we often provide offers to existing customers who are considered profitable‘, and ‗we often reject loan applications from customers when we lack certain information about them‘F3 items)
reliability, responsiveness and empathy. Price competitiveness is related to the fulfillment of customers‘ expectations based on the same scaling. Profit-oriented behaviour is the ultimate dependent variable, which is measured as a 3-item construct on a 5-point Likert scale.
4. FINDINGS
4.1. The Impact of Empowerment (Survey Data)
Although caution should be shown in seeking to understand the impact of empowerment in a framework with a limited set of dependent and independent variables, Table 3 nonetheless indicates a clear pattern in the relationship between empowerment and performance indicators in financial services. This pattern holds when a simpler and statistically more reliable measure of profit-oriented behaviour is used (Appendix A, Tables 4 and 5). Generally, empowerment has an impact on service quality and competitiveness as perceived by the front-line employees, but the impact on profit-oriented behaviour seems to be limited or to be dependent on other factors. First of all, there is moderate support for the hypothesis that decision-making authority is positively related to performance. Employees with more decision-making authority tend to perceive themselves as better able to deliver quality service and as being more competitive in fulfilling customer expectations regarding interest rates and fees.
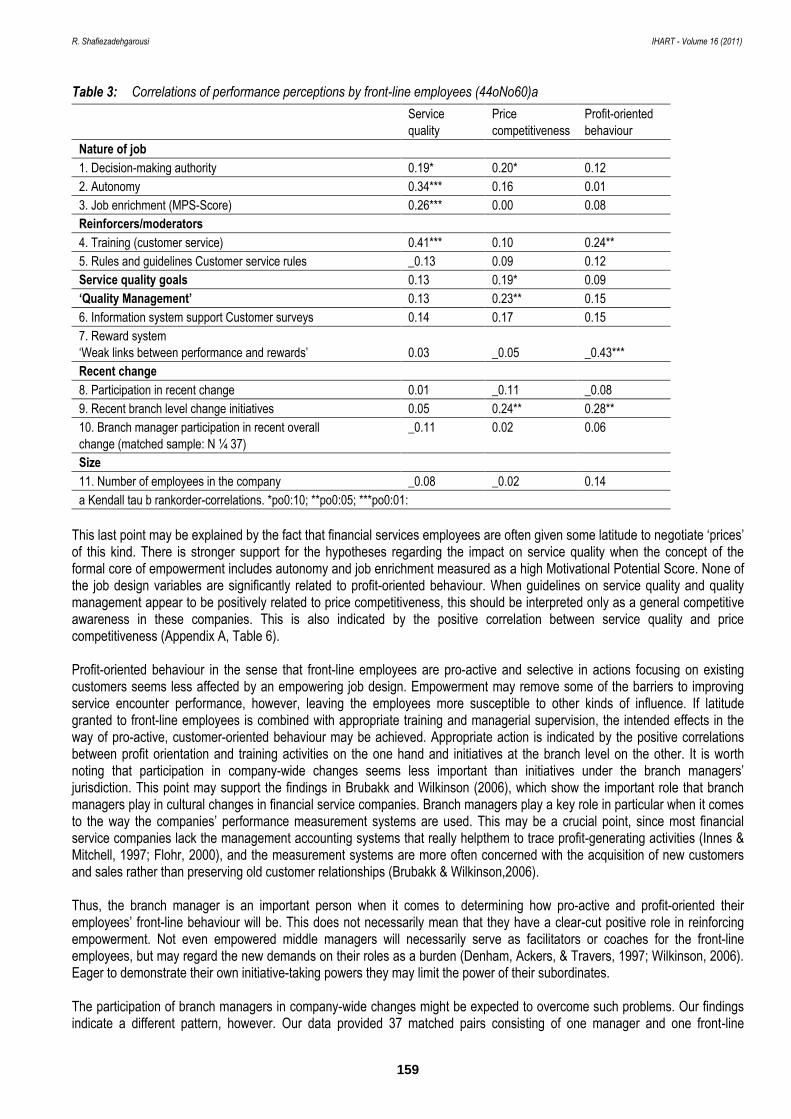
R. Shafiezadehgarousi IHART - Volume 16 (2011)
159
Table 3: Correlations of performance perceptions by front-line employees (44oNo60)a
Service
quality
Price
competitiveness
Profit-oriented
behaviour
Nature of job
1. Decision-making authority 0.19* 0.20* 0.12
2. Autonomy 0.34*** 0.16 0.01
3. Job enrichment (MPS-Score) 0.26*** 0.00 0.08
Reinforcers/moderators
4. Training (customer service) 0.41*** 0.10 0.24**
5. Rules and guidelines Customer service rules _0.13 0.09 0.12
Service quality goals 0.13 0.19* 0.09
„Quality Management‟ 0.13 0.23** 0.15
6. Information system support Customer surveys 0.14 0.17 0.15
7. Reward system
‗Weak links between performance and rewards‘
0.03
_0.05
_0.43***
Recent change
8. Participation in recent change 0.01 _0.11 _0.08
9. Recent branch level change initiatives 0.05 0.24** 0.28**
10. Branch manager participation in recent overall
change (matched sample: N ¼ 37)
_0.11 0.02 0.06
Size
11. Number of employees in the company _0.08 _0.02 0.14
a Kendall tau b rankorder-correlations. *po0:10; **po0:05; ***po0:01:
This last point may be explained by the fact that financial services employees are often given some latitude to negotiate ‗prices‘ of this kind. There is stronger support for the hypotheses regarding the impact on service quality when the concept of the formal core of empowerment includes autonomy and job enrichment measured as a high Motivational Potential Score. None of the job design variables are significantly related to profit-oriented behaviour. When guidelines on service quality and quality management appear to be positively related to price competitiveness, this should be interpreted only as a general competitive awareness in these companies. This is also indicated by the positive correlation between service quality and price competitiveness (Appendix A, Table 6). Profit-oriented behaviour in the sense that front-line employees are pro-active and selective in actions focusing on existing customers seems less affected by an empowering job design. Empowerment may remove some of the barriers to improving service encounter performance, however, leaving the employees more susceptible to other kinds of influence. If latitude granted to front-line employees is combined with appropriate training and managerial supervision, the intended effects in the way of pro-active, customer-oriented behaviour may be achieved. Appropriate action is indicated by the positive correlations between profit orientation and training activities on the one hand and initiatives at the branch level on the other. It is worth noting that participation in company-wide changes seems less important than initiatives under the branch managers‘ jurisdiction. This point may support the findings in Brubakk and Wilkinson (2006), which show the important role that branch managers play in cultural changes in financial service companies. Branch managers play a key role in particular when it comes to the way the companies‘ performance measurement systems are used. This may be a crucial point, since most financial service companies lack the management accounting systems that really helpthem to trace profit-generating activities (Innes & Mitchell, 1997; Flohr, 2000), and the measurement systems are more often concerned with the acquisition of new customers and sales rather than preserving old customer relationships (Brubakk & Wilkinson,2006). Thus, the branch manager is an important person when it comes to determining how pro-active and profit-oriented their employees‘ front-line behaviour will be. This does not necessarily mean that they have a clear-cut positive role in reinforcing empowerment. Not even empowered middle managers will necessarily serve as facilitators or coaches for the front-line employees, but may regard the new demands on their roles as a burden (Denham, Ackers, & Travers, 1997; Wilkinson, 2006). Eager to demonstrate their own initiative-taking powers they may limit the power of their subordinates. The participation of branch managers in company-wide changes might be expected to overcome such problems. Our findings indicate a different pattern, however. Our data provided 37 matched pairs consisting of one manager and one front-line
The Empowerment, Ongoing Limits and Consequences in Financial Services
160
employee from the same branch office, but there were no significant relationships between self-reported branch manager participation and the indicators of service encounter performance reported by the front-line employees (last row in Table 3). This is in line with our other results. Independent initiatives at the branch level do seem powerful while participation in overall changes is less important.
4.2. Control and „Enabling Bureaucracy‟
In order to understand how the formal organisation establishes the boundaries of front-line behaviour, we also analysed the difference between large and small financial service companies. In organisational research it has long been well established that size correlates with formalisation and centralisation (Pugh, Hickson, Hinings, & Turner, 1969; Daft, 1998), and in financial services the larger companies are more inclined to use sophisticated control and information systems to support and control service encounter performance. Recently it has been shown that large Iranian financial service companies make considerable efforts to trace profitable customer segments with the help of their management accounting systems, whereas smaller companies assign less importance to such activities (Flohr, 2000). Nevertheless, our present survey findings show no significant difference between large and small companies, either in the perceived price competitiveness or in the perceived quality of the service delivered. There seems to be slightly more emphasis on profit orientation in the reports from the larger companies. Front-line employees who demand formal authority and the abolition of rules now seem to appear mainly in small companies. Since a comparable study based on data from 1994 indicated that front-line employees in the smaller companies felt more competitive (Flohr, 2000), perhaps the larger companies may have improved their positions in the keen competition. And yet small banks seem to be surprisingly profitable, and recent customer surveys indicate that they still have the most loyal customers (Greens, 1999). Thus, empowerment in small and in large companies seems to follow different roads. Some of the large companies at least have reached a stage at which a connection between empowerment and performance by means of advanced support systems has been indicated. And perhaps the challenge is greatest in small companies, because they fall behind when it comes to support functions, and performance-related empowerment does not fit well with their banking-for-all culture. Profit-oriented behaviour of a more obvious kind makes their employees feel uncomfortable and may hurt their relationship–marketing and their customers‘ word-of-mouth communication. It is particularly under these circumstances that branch managers may hold the key to supporting or blocking the further developments that would entail employees showing more personal initiative and even going beyond compliance with the administrative rules.
4.3. A Quest for an Enabling Bureaucracy? Results from the Interviews
The interviews were held in order to supplement the correlation analyses, and to take a closer look at actual situations and the way these might influence behaviour. The present analysis focuses on those interviewees who proclaimed well-articulated attitudes or who had experience from different organisations. Only to a small degree has the data been analysed by quasi-quantification. However, it is important to note the general picture of existing empowerment as reported in the interviews: most employees now seem to have all the decision-making authority they need in the service encounters. But such latitude has its pitfalls, and restrictions and support mechanisms were both central themes in the interviews. The few interviews in the first round at the upper levels followed the pattern indicated in the survey. Central actions in the large company were aimed at supporting front-line employees by way of credit scoring systems and systematic segmentation. In one small bank this was done less systematically, leaving more atitude to empowered branch managers who are concerned about branch profit, who act independently and who seek autonomy. A branch manager in this bank expressed his opinion of head office as follows: "I am responsible for the bottom line result, but they‘re not going to meddle with the way I achieve it" [On segmentation of the customers:] We have discussed this in relation to [the new computer system], because it gives us even better opportunities, but we have chosen not to do so. But my claim is that we do in fact do it in our everyday life we have made a harsh grading of our customers. I don‘t want us to waste time on [the unprofitable group of customers] But none of this happens very systematically‘‘. In fact it is hard to find any boundaries for empowerment in this organisation. The manager and his front-line employees both often overstep the bounds of their formal authority. The interviews held in the second round gave a stronger impression of the difficulties perceived by the front-line employees. Too little clarity and too much negotiating about interest rates can complicate a positive relationship between employee and customer. ‗‗It is important that the [offered] interest rate is right the first time‘‘, as
R. Shafiezadehgarousi IHART - Volume 16 (2011)
161
one of our respondents put it. The result can either mean heavy demands the employee‘s judgement or fixed rates. In connection with this and other crucial service encounter issues, few front-line employees found their latitude to be insufficient and some asked for more guidelines. As regards profit orientation, we did find some examples of larger companies placing considerable reliance on their information systems to identify the contribution margin of their different customers, and this did have some consequences for the front-line, at least that the employees tended to calculate the profitability of their more important customer accounts. This established a point of departure for their price bargaining, and they felt that they had the necessary authority to bargain with the customer. In smaller companies we found examples of the opposite, whereby the employees do seem to possess some intimate knowledge of their customers, and a few of them emphasise that they reveal the potential of specific customers by way of personal contact. Prices and the price bargaining seem to be less important in these companies, and it is worth noting that some employees felt a lack of authority for bargaining and making decisions about customer engagements. One respondent spoke of the difficulty in arguing for a fixed interest rate in front of the customer. The support and discretion aspects are both reflected in a certain ambivalence among our front-line respondents. One employee interviewed, who had experience from two very different companies, put it rather clearly. He was very positive in his description of the well-established routines, and especially the information technology support in the company he had just left: ‗[This bank] was an information Mecca‘. He appreciated the knowledge about his customers that the customer profitability analyses gave him. Nonetheless, he preferred to work in the smaller bank, even though you can ‗open an account for anyone‘ and the profitability analyses were not adequate for tracing the true profitability of a customer relationship. He claimed that extreme ‗price shoppers‘ were avoided, because the bank gave high priority to the personal relationship and the professional advice. Prices are thus of minor importance, so long as the customer‘s ‗pain threshold‘ is not exceeded. Another respondent, who had also left the same larger bank, particularly valued the flexibility and fast decision-making in the smaller bank, but he admitted to missing sufficient guidelines and well-established procedures. One of the few respondents who found her decision-making authority insufficient, also wanted more guidelines. In this small savings bank they ‗‗cannot conduct any analyses at all‘‘ on customer profitability, and there are no explicit goals concerning service quality. This rather widespread ambivalence may challenge the view that formalization is an obstacle to achieving the benefits of empowerment, at least when the formalisation is of an enabling type rather than the coercive type that is normally assumed. Under these circumstances formalisation thus provides needed guidance and clarifies responsibilities, thereby helping individuals to be and to feel more effective (Adler & Borys, 2004). The use of control systems may also be seen in this light. To find a suitable balance between empowerment and control, companies have to look for boundary-setting and supportive control systems. In some companies diagnostic control systems that are used to monitor goals and profitability (Simons, 1995), do seem to be related to improved measures and analyses, which may provide information allowing the branches to control themselves better. Larger financial service companies make extensive use of customer and employee surveys, but the impact of these appears to be limited, and few companies have exploited them in the service of removing barriers to customer orientation. They are seldom ‗dialogue supporting systems‘. Thus, poor participation technology provides one explanation of the moderate effect of employee participation in the change processes. In terms of change, companies and branches in a competitive area may often develop their profitability, but it would be difficult without proper information channels. Our results can also offer a balanced view of reward systems. As the study reported in Davoodi(2009) has also shown In financial services in Iran, extrinsic motivation by way of performance-related increases in salary, bonuses or fringe benefits do not seem to have any positive impact on service quality in the financial service sector. Intrinsic motivation by way of job enrichment is then all the more important. But when it comes to profit-oriented behaviour, the perceived link between performance measurement and rewards does appear to be crucial. To make this linkage is no easy task, and our interviews indicate some of the pitfalls. Performance is generally rewarded to some degree within the existing systems, and most respondents are sceptical about a closer link with objective measures. They doubt that it will be possible to trace the contributions actually made by individuals, and they feel that rewards will be biased towards sales.
5. CONCLUSION AND IMPLICATIONS
Our findings from the financial service sector support the general argument that empowerment in the form of the delegation of more formal authority to the employee does have a positive impact on service quality and profit orientation, at least to a certain degree of empowerment. Further, guidelines and techniques such as Total Quality Management, customer segmentation and
The Empowerment, Ongoing Limits and Consequences in Financial Services
162
other programmes based on management-defined performance goals may reinforce the positive impact of empowerment on performance. Entrepreneurial branch managers may also have a considerable impact, while participation in the form of formal committees seems unimportant. Thus, bureaucracy of an enabling character (Adler & Borys, 2004) does not seem to counteract the internal commitment connected with empowerment. Even extrinsic rewards can be supportive. In this sector at least, with its semi-professional and routine tasks, our findings seem to accord with the argument presented in Ledford and Lawler (2002), namely that educational support and appropriate reward systems provide the conditions for successful participative endeavours. Empowerment may not merely be the best approach when a service firm wants to establish a relationshipwith its customers (Bowen, 2006). It may also be profitable. Delegating formal authority and enriching the front-line jobs seem to be the important antecedents if management initiatives should result in improved service quality at ‗bureaucratic encounters‘ (Flohr ,2000) as well as in profit-oriented behaviour. In explaining profit orientation, delegation on its own is not sufficient and supplementing factors become more important. Our study suggests that an important task for practitioners is to find ways of providing branches with sufficient information to control their own operations. This calls for better information services provided from the central offices, and a better use of customer and employee surveys. This last point in particular, which is related to the ‗upward problem-solving‘ aspect of empowerment (Wilkinson, 2006), deserves more attention. Further, establishing links between reward systems and performance seems to be an important step in overcoming the barriers to market orientation, but the pitfall may be that sales rather than profit are rewarded, due for instance to the absence of appropriate measurement systems (Brubakk & Wilkinson, 2006; Flohr., 2000). In future research a more rigorous testing of our model would be possible in the financial service sector, because of the rare opportunities of comparative analysis. International comparisons can be included. However, although the present study is limited to organisations within a single country, the findings are hardly specific to this particular Middle-East context, with its extensive branch network. Empowerment is closely related to global managerial intentions regarding support for task performance and market orientation. Even in the different contexts of the USA, companies seems to follow similar patterns when it comes to market orientation (Selnes, Jaworski, & Kohli, 1996). In future front-line employees will be facing a further challenge in this process: they will have to act within limits set by customer demands for personal advice and low-cost transactions combined with the more widespread use of highly developed self-service and information technology. To cope with these challenges, the technology of empowerment will probably also have to be developed further.
REFERENCES
Adler, P. S., & Borys, B. (2004). Two types of bureaucracy: enabling and coercive. Administrative Science Quarterly, 41, 61-89 Argyris, C. (1964). Integrating the individual and the organization. New York: Wiley. Argyris, C. (1998). Empowerment: the emperor‘s new clothes. Harvard Business Review, 76(3), 98–105. Becker, T. E. (2002). Foci and bases of commitment: are they distinctions worth making. Academy of Management Journal,
35(1), 232–244. Becker, T. E., Billings, R. S., Eveleth, D. M., & Gilbert, N. L. (2004). Foci and bases of employee commitment: implications for
job performance. Academy of Management Journal, 39(2), 464–482. Boshoff, C., & Mels, G. (1995). A causal model to evaluate the relationships among supervision, role stress, organizational
commitment and internal service quality. European Journal of Marketing, 29(2),23–43. Davoodi, C, A. (2009). Quality perceptions in the financial services sector in Iran: the potential impact of internal marketing.
International Journal of Industry Management, 7(5), 5–31. Bowen, D. E., & Lawler III, E. E. (2006). The empowerment of service workers: what, why, how and when. Sloan Management
Review, 33(3), 31–40. Bowen, D. E.(2006). Organising for service: empowerment or production line? In W. J. Glynn, & J. G. Barnes (Eds.),
Understanding service management: integrating marketing, organisational behaviour, operations and human resource management. Chicester: Wiley.
Bowen, D. E., (2006). Empowering service employees. Sloan Management Review, 36(4), 73–84. Bowen, D. E., & Youngdahl, W. E. (2006). Lean service: in defence of a production-line approach. International Journal of
Service Industry Management, 9(3), 207–225. Brubakk, B., & Wilkinson, A. (2006). Agents of change? Bank branch managers and the management of corporate culture
change. International Journal of Service Industry Management, 7(2), 21–43. Buchanan, D., & Huczynsky, A. (2005). Organizational behaviour. An introductory text (3rd Ed.). Hemel Hempstead: Prentice
Hall Europe. Cassell, C., & Symon, G. (2004). Qualitative research in work contexts. In C. Cassell, & G. Symon (Eds.), Qualitative methods
in organizational research. London: Sage.

R. Shafiezadehgarousi IHART - Volume 16 (2011)
163
Conger, J. A., & Kanungo, R. N. (1988). The empowerment process: integrating theory and practice. Academy of management review, 13(3), 471–482.
Cummings, T. G., & Worley, C. G. (2002). Organization development and change (6th Ed.). Cincinnati:South Western College Publishing.
Daft, R. L. (1998). Organization theory and design (6th Ed.). Cincinnati: South Western College Publishing. Davis, L. E. (1957). Job design and productivity: a new approach. Personnel, 33, 418–430. Denham, N., Ackers, P., & Travers, C. (1997). Doing yourself out of a job? How middle managers cope with empowerment.
Employee Relations, 19(2), 147–159. Ronald, N. K. (2008). The research act: a theoretical introduction to sociological methods. New York: McGraw-Hill. Emery, F., & Trist, E. (1965). The causal texture of organizational environments. Human Relations, 18, 21–32. Flohr, J. (2000). Organizing for quality in Iranian retail banking. In Workshop on Quality Management in Services V
(Proceedings Part II) (pp. 411–426). Tilburg: European Institute for Advanced Studies in Management. Flohr, J., Bukh, P. N. D., & Mols, N. P. (2000). Barriers to customer-oriented control in financial services. Working Paper 1999-
9, Department of Management, University of Aarhus. 82 J.F. Nielsen, C.P. Pedersen / Scand. J. Mgmt. 19 (2003) 63–83 Flohr, J., & H_st, V. (2000). The path to service encounter performance in public and private ‗bureaucracies‘. The Service
Industries Journal, 20(1), 41–61 (forthcoming). Greens Analyseinstitut. (1999). Danskerne st!crkt nationale i valget af bank. General customer survey published in B. orsen
Weekend, November 19, pp. 2–3. Hackman, J. R., & Oldham, G. R. (2000). Development of the job diagnostic survey. Journal of Applied Psychology, 60(2),
159–170. Hackman, J. R., & Oldham, G. R. (2000). Work redesign. Reading, MA: Addison-Wesley. Heskett, J. L., Sasser, W. E., & Schlesinger, L. A. (2004). The service profit chain. How leading companies link profit and
growth to loyalty, satisfaction and value. New York: Free Press. Innes, J., & Mitchell, F. (1997). The application of activity-based costing in the United Kingdom‘s largest financial institutions.
The Service Industries Journal, 17(1), 190–203. Kanter, R. M. (1979). Power failure in management circuits. Harvard Business Review, 57(4), 65–75. Kanter, R. M. (1983). The change mastersFcorporate entrepreneurs at work. London: Unwin. Lawler, E. E., Mohrman, S. A., & Ledford, G. E. (1992). Employee involvement and total quality management. San Francisco:
Jossey-Bass. Ledford, G., & Lawler, E. (2002). Research on employee participation: beating a dead horse? Academy of Management
Review, 19(4), 633–636. Likert, R. (1961). New patterns of management. New York: Mcgraw-Hill. McClelland, D. C. (1975). The achievement motive. New York: Halsted Press. McGregor, D. M. (1960). The human side of enterprise. New York: McGraw Hill. Poole, M. (1986). Workers participation in industry. London: Routledge. Pugh, D. S., Hickson, D. J., Hinings, C. R., & Turner, C. (1969). The context of organization structures. Administrative Science
Quarterly, 14(1), 91–114. Quinn, R. E., & Spreitzer, G. M. (2006). The road to empowerment: seven questions every leader should consider.
Organization Dynamics, 26(2), 37–49. Reichheld, F. F. (1996). The loyalty effect. The hidden force behind growth, profits, and lasting value. Harvard Business School
Press, Boston, MA: Bain & Company. Schneider, B., & Bowen, D. E. (2006). The service organization: human resources management is crucial. Organizational
Dynamics, 21(4), 39–52. Selnes, F., Jaworski, B. J., & Kohli, A. K. (1996). Market orientation in United States and Scandinavian companies: a cross
cultural study. Scandinavian Journal of Management, 12(2), 139–157. Simons, R. (1995). Control in an age of empowerment. Harvard Business Review, 23(4), 80–88. Spreitzer, G. M. (2006). Psychological empowerment in the workplace: dimensions, measurement, and validation. Academy of
Management Journal, 38(5), 1442–1465. Spreitzer, G. M. (2006). Social structural characteristics of psychological empowerment. Academy of Management Journal,
39(2), 483–504. Thomas, K. W., & Velthouse, B. A. (2002). Cognitive elements of empowerment: an ‗‗interpretive‘‘ model of intrinsic task
motivation. Academy of Management Review, 15(4), 666–681.Trist, E. (1963). Organizational choice. London: Tavistock. Wagner, J. A. (1994). Participation‘s effects on performance and satisfaction: a reconsideration of research evidence. Academy
of Management Review, 19(2), 312–330. Wilkinson, A. (2002). Empowerment: theory and practice. Personnel Review, 27(1), 40–56. Zeithaml, V. A., Parasuraman, A., & Berry, L. L. (1998). Delivering quality service: balancing customer perceptions and expectations. New York: The Free Press.

The Empowerment, Ongoing Limits and Consequences in Financial Services
164
APPENDIX A
Reliability of performance measures (‗dependent variables‘), correlations of perceptions of profit-oriented behaviour, correlations between performance indicators (the ‗dependent‘ variables) and correlations between the ‗independent‘ variables (44oNo60) are shown in Tables 4–7.
Table 4: Reliability of performance measures (the ‗dependent variables‘)
Construct Cronbach coefficient alpha
Correlation
with total
Alpha when
item deleted
Service quality
(Construct adopted from Flohr, 2000)
0.67
(Standardized: 0.68)
Reliability (2 items) 0.43 0.62
Responsiveness (5 items) 0.51 0.58
Assurance (1 item) 0.36 0.68
Empathy (3 items) 0.55 0.54
Price competitiveness 0.65
(Standardized: 0.67)
Fulfilment of customer expectations on competitive interests 0.50 --
Fulfilment of customer expectations on competitive fees 0.50 --
Profit-oriented behaviour 0.63
(Standardized: 0.61)
‗We often provide special offers to existing customers who are considered profitable‘
0.60 0.23
‗Particularly often we provide offers to existing customers who are considered profitable‘
0.65 0.14
‗We often reject loan applications from customers when we miss certain information about thema
0.11 0.90
a In order to improve the alpha coefficient this item is deleted from the construct in the table below
(Appendix A, Table 5).
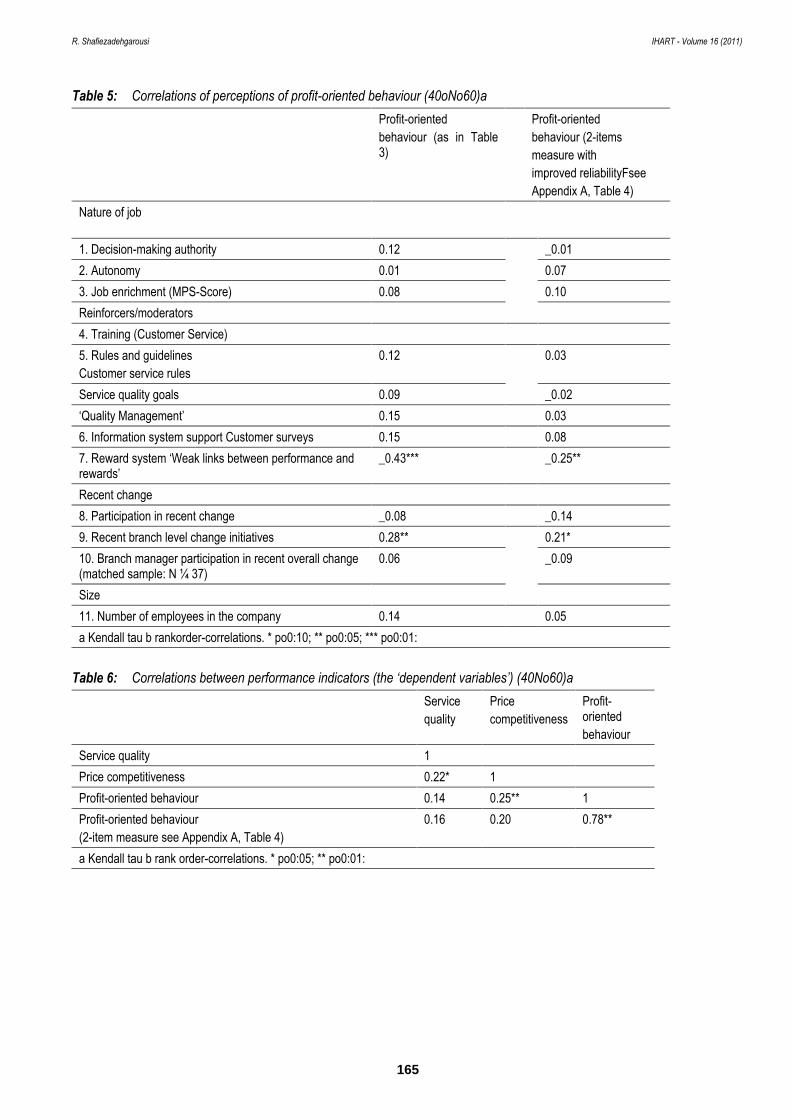
R. Shafiezadehgarousi IHART - Volume 16 (2011)
165
Table 5: Correlations of perceptions of profit-oriented behaviour (40oNo60)a
Profit-oriented
behaviour (as in Table 3)
Profit-oriented
behaviour (2-items
measure with
improved reliabilityFsee
Appendix A, Table 4)
Nature of job
1. Decision-making authority 0.12 _0.01
2. Autonomy 0.01 0.07
3. Job enrichment (MPS-Score) 0.08 0.10
Reinforcers/moderators
4. Training (Customer Service)
5. Rules and guidelines
Customer service rules
0.12 0.03
Service quality goals 0.09 _0.02
‗Quality Management‘ 0.15 0.03
6. Information system support Customer surveys 0.15 0.08
7. Reward system ‗Weak links between performance and rewards‘
_0.43*** _0.25**
Recent change
8. Participation in recent change _0.08 _0.14
9. Recent branch level change initiatives 0.28** 0.21*
10. Branch manager participation in recent overall change (matched sample: N ¼ 37)
0.06 _0.09
Size
11. Number of employees in the company 0.14 0.05
a Kendall tau b rankorder-correlations. * po0:10; ** po0:05; *** po0:01:
Table 6: Correlations between performance indicators (the ‗dependent variables‘) (40No60)a
Service
quality
Price
competitiveness
Profit-oriented
behaviour
Service quality 1
Price competitiveness 0.22* 1
Profit-oriented behaviour 0.14 0.25** 1
Profit-oriented behaviour
(2-item measure see Appendix A, Table 4)
0.16 0.20 0.78**
a Kendall tau b rank order-correlations. * po0:05; ** po0:01:

The Empowerment, Ongoing Limits and Consequences in Financial Services
166
Table 7: Correlations between the ‗independent‘ variables (44No60)a
1 2 3 4 5a 5b 5c 4 7 8 9 10 11
1. Decision-making authority
1
2. Autonomy 0.25* 1
3. Job enrichment (MPS-Score)
0.23* 0.33** 1
Reinforcers/moderators
4. Training (Customer Service)
0.36** 0.17 0.24** 1
5. Rules and guidelines
(a) Customer service rules
_0.04 _0.04 0.01 _0.04 1
(b) Service quality goals
0.18 0.02 0.30** 0.36** 0.10 1
(c) ‗Quality Management‘
0.35** 0.12 0.34** 0.31** 0.15 0.57** 1
6. Information system support
Customer surveys
0.25* _0.10 0.07 0.33** 0.20 0.35** 0.31** 1
7. Reward system
‗Weak links between performance
and rewards
0.02 0.11 _0.12 _0.08 _0.06 _0.19 _0.11 0.04 1
8. Participation in recent change
0.43** 0.04 0.13 0.20 0.11 0.16 0.30* 0.14 _0.11 1
9. Recent branch level change initiatives
0.15 _0.09 _0.18 _0.01 _0.01 _0.07 _0.04 0.14 0.13 0.11 1
10. Branch manager participation in
recent overall change (N ¼ 37)
0.30* 0.03 _0.01 _0.02 0.10 _0.03 _0.03 0.11 _0.03 0.30 0.08 1
Size
11. Numbers of employees in
the company
_0.05 _0.12 0.03 0.20 0.07 0.15 0.04 0.22 0.13 _0.07 0.01 0.07 1
aKendall tau b rankorder-correlations. * po0:05; ** po0:01:
R. Varjavand IHART - Volume 16 (2011)
167
PRIDE VERSUS PROFIT, CAN CAPITALISM SOLVE OUR SOCIOECONOMIC PROBLEMS?
Reza Varjavand
Saint Xavier University, USA
OVERVIEW
There is growing evidence that the poor and unprivileged are being ignored by unfettered capitalism and have no adequate access to the benefits of economic prosperity. Poverty statistics are very disturbing, especially in the least developed countries. Even in developed countries, the number of people living at or below poverty line is hard to fathom such as 14.3% in the United States, the economic power house of the world, according the latest information from the US Census Bureau. And the gap between the poor and rich is not shrinking; it is rather widening. As chronicled evidence shows, capitalism has not only been ineffective in alleviating poverty and income inequality nationally and worldwide, it has also failed to address social problems successfully. Capitalism, as such, has contributed to the deterioration of the environment, wasteful use of precious scarce resources, and has created dissension, divisiveness, and apprehension. Especially, we have not made much progress in bringing economic prosperity to the poorest regions of the world, especially to African nations desperately in need of basic necessities and essential services. Palpably, since the advent of globalization, the state of global poverty has become increasingly dire. The gay between poor and rich is not getting any narrower, it is widening. There are still many unanswered questions in the forefront of people‘s minds. Why, for instance, after many decades of tremendous economic progress, are social problems still lingering? Is there something fundamentally wrong with capitalism that has led to its current broad-based failure? Have there been structural changes in the world economic paradigm that render capitalism no longer applicable? Why are the conventional theories we have taught at universities and have relied upon for so many decades because they seemed to have worked successfully no longer fully operational? Are there any inherent aspects of capitalism that make it apathetic to the plight of the poor, aggravate inequality, sanction exploitation, and create the temptations of corruption and reckless behavior? The popular response to these and similar questions seems to be that if capitalism is kept under meticulous government oversight and regulated properly, it will lead to wonderful things for the society. Its material outcome may not be evenly distributed to all but that seems to be understandable, albeit not acceptable to many politicians, economists, and social activists. Conversely, if capitalism is left unregulated, it may become vulnerable to manipulation, misuse, and deceitful practices by greedy entrepreneurs. Such a tendency has been even more pronounced in recent years owing not only to lax regulatory systems, but also globalization, and the ensuing surge in economic interconnectedness among nations. Under such conditions, government efforts to stabilize the economy through traditional fiscal or monetary policies become less effective. When motivated solely by self interest, profit seeking entrepreneurs may engage in reckless business conducts that are harmful to the environment such as establishing unsafe plants in poor countries just to exploit cheap local resources, especially labor, or emitting harmful substances into vital resources such as air, soil, and water, or producing and selling harmful products such as faulty automobiles, and harmful prescription drugs. Most recently, we have the case of the environmental disaster created by the British Petroleum Company in the United States. It is tempting to argue that poor people will be economically worse off without these factories because they create jobs for them at decent wage. However, when all the economic and social costs of such factories are added up, these countries will end up paying dearly, monetarily and otherwise, for each job created. In addition, such factories may create products that are neither life-enhancing nor useful to the middle class since they usually cater to high income consumers with no evidence of trickle down effects to the rest of the population. Demand for such products is strongly income sensitive, implying that only rich people can afford to pay for them. In addition, the resources devoted to production of such high-priced products have been tremendously costly for the local economy, especially in less developed countries, because these resources could have been used to produce more essential goods and services such as food, healthcare, and education. Imagine how much money some poor people spend on high-tech products like wireless service, which is not innately needed, and consequently do not have enough money to spend on good quality, healthy food. This misguided spending may be harmful if done excessively. Without a doubt, the current gloomy world economic outlook seems to indicate that neither capitalism nor profit-seeking business enterprises genuinely care about non-profit issues such as poverty, equity, and environmental degradation. We need

Pride Versus Profit, Can Capitalism Solve Our Socioeconomic Problems?
168
fresh creative initiatives that can help us to alleviating these problems. Here are some common misconceptions about capitalism that need to be scrutinized with an aspiration of finding workable alternatives:
People are motivated only by profit, seems to work fine, however, it may lead to objectionable outcome
If you lose your job during an economic downturn, you should wait until someone (the government) creates jobs, hence sources of income and spending for you. Only certain individuals with innate talents can become successful entrepreneurs. Poor people do not have that talent hence they cannot be the winning business managers.
False generalizations of economic principles fool us into missing the tangible realities of other countries that may not be the ardent subscriber to capitalism, especially the less developed nations.
Individuals are only economic agents; consumers, investors, units of labor, and not human beings. They behave in selfish ways when it comes to economic decisions.
IS GOVERNMENT A PANACEA?
As most of us know, there are several channels though which government can influence the economy, often effectively but occasionally unsuccessfully. While discussion about the rationale for government involvement and types of interventions is out of the scope of this paper, the outcome of government involvement is not. According to some schools of thought, it is imperative for government to use its perpetual economic and financial power to influence the outcome of the market system for the betterment of those who could not attain their fair share without such interventions. ―It is hard to accept that the optimal solution to this coordination failure [mismatch between aggregate supply and aggregate demand] should come from a government that capitalists would prefer to keep out of all other dimensions of their business. What we must understand though, is that no one is arguing that government is the best entity to fix the coordination problem. Rather, it is the only entity with the creditability to pull off the coordination in this most peculiar and rate time‖ argues Colin Read, an economist and author of a newly published book, ―Global Financial Meltdown‖. Obviously, it is expected that government steps in when catastrophic disasters, natural or man-made, strike. When it comes to economic matters, government can play a successful role, especially with respect to more equitable distribution of income, alleviating poverty, and generating economic opportunities. To be effective, government must protect economic freedom and espouse an environment that is conducive to the proliferation of worry-free investment opportunities and the flourishing of entrepreneurial talents. Free from interest groups and cronyism, a well-intentioned government can often provide good solutions to social and economic problems. However, given the inherent inefficiency of government stemming from pervasive bureaucracy, the lack of expertise, the culture of bribery and corruption, and the possibility of conflict between politics and the public interest, government cannot always be a Nirvana. This is especially true in many less developed countries with a network of government enterprises that lack accountability and a proper system of assessment with checks and balances. It is also a known fact that many people in less developed countries who work for government, even in high level positions, may accomplish minimally or nothing at all. They are, in other words, inefficient, the disguised unemployed. However, their positions are kept open despite the heavy cost. In addition, government is not good at ending things it started, even when these things are no longer needed or affordable. A case in point is the widespread government subsidy programs implemented by governments in many countries, including Iran, (quote from WSJ) and the protective tariffs that support domestic industries. In addition to promoting inefficiency and distorting the intended effects of such programs, government is unable to terminate them despite the fact they heavily burden the government budget. Even if government does terminate such programs, the unavoidable consequences would be skyrocketing prices of staple food items and other basic necessities and imminent inflation. It is like pulling those who have depended on such systems for so long off their life support system. Massive public dissatisfaction, and even uprisings, would also likely result. The best we can expect is that government be an impartial, watchful guardian of the private sector. Historically, benevolent governments in various countries, particularly in industrialized nations, have tried to address social and economic problems quite successfully using a variety of tools at their disposal. In the United States for example, government has done a decent job of regulating private industries. A sound regulatory scheme has functioned as a vital catalyst for the smooth operation of the free enterprise system in these countries for many decades. Without such a trusted system, individual entrepreneurs are predisposed to engage in tactics that may be contrary to the interests of the economy at large and the consuming public. Justifiably, we need government to step in any time the private sector lacks a strong enough motive to act, initiate, or respond to a situation that warrants our immediate attention. This was underscored when presidential candidate Obama campaigned successfully on the platform of regulatory overhaul especially aimed at commercial banks and other financial institutions.

R. Varjavand IHART - Volume 16 (2011)
169
However, with globalization and the information revolution it seems that government attempts to fix economic problems through traditional means is becoming futile. Stated otherwise, government can no longer influence the private sector through traditional economic polices the way it used to simply because of the openness of the economy and its vulnerability to manipulation and external shocks. Under such circumstances, the only thing government may be able to do successfully is to put in place a sophisticated regulatory system and/or overhaul the existing system to suit the complicated 21st century business environment. It can also use its discretionary power to implement selective policies designed to achieve a macroeconomic goal. For instance, under the Obama administration, ―Cash for Clunkers‖ and a handsome tax credit for first time home buyers proved to be really successful in achieving their goals. One instructive lesson to be learned from the current economic turmoil is that neither government nor the private sector per se can deal effectively with socioeconomic problems but must work in tandem and with mutual cooperation. Government plans to provide solutions to social problems, including poverty, must be accompanied by private initiatives. Likewise, non-profit institutions in the form of charitable foundations, philanthropic organizations, humanitarian associations, and volunteer groups can supplement government efforts when it comes to solving social and economic problems. Universities can play an effective role when it comes to dealing with socioeconomic issues by providing an environment that is conducive to constructive discourse and providing rationale as well as a philosophical foundation for social organizations and similar initiatives. More importantly, universities can take a deep critical look at theoretical foundation of capitalism with the aim of developing a new economic paradigm, one that can work in the 21st century, especially for less developed countries. The aforementioned organizations can even be started in a very simple form, small scale, by university students at the local level and be generalized to the national level if successful. Today‘s students are very practical oriented, self-motivated, and creative when it comes to initiating and implementing community-based business projects. Such projects can be promoted and sponsored by non-profit organizations including the most well-known non-profit organization in the United Sates, Students in Free Enterprise (SIFE). Thus far, this organization has established more than 1,300 chapters in American colleges and universities and exists in about thirty other countries. Working as a team, students who are members of this organization work tirelessly throughout the academic year to help people and businesses in their surrounding or distant communities through creative means. Likewise, religion can certainly play a part by inspiring the followers and encouraging them to care not only about their needy neighbors but also the entire community at large. The teachings of Christianity place a crucial emphasis on a communitarian vision, charitable giving, and caring for poor and unfortunate people. Even though non-profit organizations are helpful, they are not without shortcomings, especially in less developed countries. Lack of funding, inadequate organizational and managerial skills, lack of tax incentives for charitable contributions, and possible fraud and mismanagement are examples of such deficiencies that tend to intensify during an economic downturn. Also, adequate resources for successful operation of these institutions may not be available or may be hard to mobilize. Even if such organizations are relatively successful in dealing with poverty, they do not tackle the root causes of the problem: the lack of personal skills—social, technical, financial and other expertise, or inadequate career and business opportunities, or simply the lack of auspicious economic and social infrastructures that are conducive to production and free trade. Even supranational organizations such as the World Bank have not been successful in eradicating poverty or making a big difference because of similar inadequacies.
HUMANITARIAN ENTERPRISES
In a recently published book entitled Creating a World Without Poverty, Dr. Mohammad Yunus, an economist and a 2005 recipient of the Nobel Peace Prize, has laid down the theoretical foundation as well as practical framework for what he calls ―social businesses‖. The success of his own Grameen Bank, which is now a multidimensional institution with a number of affiliate companies, has encouraged him to put forward his unorthodox theory of social businesses, the kind of business firms that are not solely concerned with profit maximization, they rather generate enough revenue to cover all the costs. They are primarily concerned with serving the poor by either providing them the financial recourse lack of which is considered the main reason why the poor people cannot reap the fruits of their own skills or produce for them the basic necessities. The long term goal of such enterprises is to tackle poverty by enabling poor people to start a business and/or utilize the skills they already possess. These businesses also create and sell affordable and useful products to needy households. He argues that the assumption of profit maximization, one of the pillars of capitalism, is based on the erroneous notion that individuals are one-dimensional and the only thing that motives them to act, or not to, is profit. Accordingly, individuals do not undertake any business project unless the expected pecuniary rewards outweigh the costs. This does not, however, apply to social enterprises that only operate to serve needy families and society as a whole with the ultimate goal of eliminating poverty. Grameen Bank, founded by Dr. Yunus, is the primary example of such enterprises that has also created a huge network of affiliated social businesses. In his book, Dr. Yunus explains how Grameen Bank operates and how it has changed the lives of
Pride Versus Profit, Can Capitalism Solve Our Socioeconomic Problems?
170
millions of families in Bangladesh for the better by providing them with money they need at low cost to start their own business and the ultimate goal of providing them with a decent level of living and reducing poverty in that country. Axiomatic under current economic theory, Dr. Yunus argues, is the assumption that individuals are only after one thing when it comes to economic activities and that is profit. They strive to earn as much profit as possible because they believe profitability is the key to their long term survival and that is, of course, the legitimate concern under capitalism. Consequently, ―businesses remain incapable of addressing many of our pressing social problems.‖ His alternative business model is founded on the understanding that individuals are multidimensional and altruistic enough to form businesses, or undertake projects, with the sole objective of serving social and environmental needs instead of focusing on accumulating profit. He argues: ―A social business is a company that is cause driven rather than profit-driven, with a potential to act as a change agent for the world.‖ A different breed of business-organizers, social entrepreneurs are passionate individuals with a mission of producing beneficial products and services for low-income families, and in the process of serving and producing such products, they strive to alleviate social and environmental problems. Although an old concept, the concept of corporate social responsibility has gained some momentum in recent years in the academic world. While a well intentioned idea, in most cases corporate social responsibility amounts to feeble undertakings such as sponsoring projects like academic researches, responsible advertizing and labeling, or helping humanitarian causes mainly to improve their corporate image thus reinforce their long term profit prospect. Even tobacco companies, for example, have launched a socially responsible advertising campaign to discourage young smokers and warn the public about the health hazards of smoking despite the fact that they continue to manufacture harmful products. Social responsibility did not prevent the auto industry from making and selling gas guzzling SUVs, or emitting pollutants into the air and other vital resources. The massive pollution of the Gulf of Mexico and destruction of its wildlife created by the British Petroleum oil disaster is the most recent evidence of the mayhem that an unfettered profiteering motives can inflict on our environment. Many business companies exercise unfair labor practices by utilizing technology to boost their profit at the expense of eliminating thousands of jobs and employment opportunities, or they locate factories in poor countries to exploit cheap labor and other resources. These companies, especially the giant multinational enterprises, are mutually interdependent. They are calculating rivals that are engaged in playing a game of strategies. A business firm operating under such conditions does not want to be outdone. It will imitate what its rivals are doing regardless of the cost or the possible wasteful outcomes of their strategies. In Summary, Dr. Yunus questions the appropriateness of the self-interest assumption and its applicability to countries overwhelmed by poverty. He believes that we should abandon this assumption that has dominated capitalism for so long and replace it with social welfare maximization as the goal of social business firms. Evidently, he does not suggest that firms completely discard the quest to make a profit. Even social business firms can make a profit, however, it should be used, however, to pay dividends to poor people, who are supposedly the owners of these companies or invest in social projects that benefit them. He would argue that a business no longer be constructed merely for the purpose of profit-making but also for serving society. Undoubtedly, excessive fascination with profit-making can be counterproductive. It may even derail the whole economic system by directing it toward greed and deceitful tactics to amass profit. Fixation with profit maximization will lead to the concentration of wealth in the hands of a few wealthy individuals and institutions. This may eventually clog the healthy circulation of money in the economy and set off the imminent demise of the middle class which is the driving force for economic activity in market economies. Moreover, profit maximization is a short term objective that if not achieved appropriately will undermine the long term viability of business enterprises. In other words, business firms may do things to boost their short term profit at the expense of sacrificing their long term viability. Obviously, the success of the whole idea of social businesses hinges on the hope that we can detach the entrepreneur from the popular notion of self interest. This can be done by appealing to altruistic inclinations, offering tax incentives, or invoking religious convictions. Religion can indeed be an inspiring and powerful motivator for doing social and economic good and should not be marginalized to purely ritualistic endeavors. Unfortunately, often the mentality that the American way of doing things is best has precluded people in the Unites States from seeking alternatives or questioning the universal applicability of their conventional perception. Such an arrogant way of thinking has given Americans the illusion that there is no feasible alternative to capitalism. While there is no question about the effectiveness of self-interest and monetary incentives, the more important question is whether remunerations are the only means through which we can motivate people. I tend to believe that disconnecting capitalism from monetary incentives is difficult, if not impossible. There is a very slim chance that a successful business model can be constructed if it is not based on some kind of pecuniary reward. Thus, any reform aimed at sustaining capitalism requires attention to incentives. However, we can argue that incentives are not limited to monetary; there are other incentives that may work just as well, including social and moral incentives. Understandably, pious people who resist worldly temptations and have no expectation of pecuniary gain can
R. Varjavand IHART - Volume 16 (2011)
171
do good things for others. Successful implementation of social business theory, as Dr. Yunus would suggest, necessitates changing the character of the entrepreneur from a profit seeking guru to a selfless philanthropist which can be a formidable task. It seems we, the human beings, are born with a natural penchant to pursue self-interest and there is nothing wrong with that as long as self-interest is not our only obsession. What is the guarantee that social businesses can survive in an environment in which they have to compete with profit-seeking counterparts? Dr. Yunus argues that social business firms have price advantage. They are designed to sell low-price products, providing them with leverage. Plus, they sell basic necessities having stable and strong demand. In addition, their products are sold mostly to local consumers who live in rural areas. As such, there is no need for costly advertisement, marketing promotion, and fancy packaging. The resulting cost savings allow social businesses to gain competitive advantages. A helpful attribute of these firms is that they do not have ambitions to maximize profit or compete for market share so there is no rivalry. They can remain friends with competitors instead of creating foes and instead of resorting to deceptive tactics for the company‘s gain; they can develop creative means to serve social causes. However, charitable giving to the poor is not what social businesses are all about because outright charity is counterproductive. It makes the poor dependent and undermines their sense of responsibility, discipline, and commitment to work and obligations. By giving them loans instead, as Grameen Bank does, the poor feel obligated to do something to repay the loan which unleashes their potential and gives them a sense of pride and personal accomplishment. Unlike ordinary businesses, social businesses have their own unique characteristics:
They are not universally successful but are more successful in particular fields such as basic food items, essential services such as utilities and healthcare, waste management, and certain other markets.
They strive to cover their total costs instead of maximizing profit. In other words, they operate to breakeven.
They focus on social objectives with the long term goal of eliminating poverty.
They may make a profit but not for the sake of paying dividends to shareholders, they pay no dividends. They channel excess profit back into the business or use it to finance projects that help the poor, especially those living in rural areas.
Social businesses are usually small thus owner-operated companies. As a result, there is no principle-agent problem which is usually a problem for big companies in which non-owner managers often pursue objectives that are not in the best interest of the business and its owners.
Social businesses are less vulnerable to economic downturn because they produce and sell necessities with stable demand. Likewise, they do not contribute to economic recession- which is often triggered by overreaction by entrepreneurs to specific economic/market condition- as do profit maximizing businesses.
You may ask, why would anyone invest money in social businesses if there is no competitive return? The answer seems to be that people invest money in such businesses for altruistic reasons and not for maximum return, the same reasons they invest in non-profit organizations or give money to charity. In other words, they are motivated by non-monetary motives and possibly tax incentives. They also have the satisfaction that they own a piece of the company. Grameen Bank is almost entirely owned by its customers who are also the owners/investors. If they wish to be successful in alleviating poverty in less developed countries, social businesses must meet certain requirements including the following:
They should be properly targeted.
They must emphasize the inclusion of women.
They must be creative and cater to a specific situation, if existing projects do not work, they have already failed and must be abandoned.
Their outcome should be perpetual.
They should have long term objectives and be supplemented by other projects such as lifting the level of education, building or upgrading the infrastructures.
Let the individuals, subjects, find their own way out of poverty. The baby-sitting approach such as giving the poor handouts does not serve them well.
Gradually remove the stigmas attached to being a poor person such as condemning them to the bottom of the social scale. Give them the God-given dignity they merit by virtue of being human beings.
Projects should be local and near poor areas. You cannot learn why people are poor unless you get geographically close to them.
CONCLUDING REMARKS
It seems that the time of straightforwardness and respect for integrity and sacred traditions is long gone. Our life is being continuously assaulted by the efforts of business profiteers who seek to reinforce our ―animal spirit‖, control our values and our

Pride Versus Profit, Can Capitalism Solve Our Socioeconomic Problems?
172
priorities, and reshape the bedrock of our culture. We are lured to believe that fulfillment and success are quantified by worldly possessions. Our quality of life and standard of living depends on material success. Capitalism, as argued above, preaches selfishness by telling people that their welfare depends on material possession. Individuals, then, become the custodian of their own satisfaction with little or no regard for the public interest. They often sacrifice the long term common good for their short term gratification by over-consuming, wasteful use of resources, and endangering the public welfare by engaging in reckless behavior. Eventually, industrialized capitalist nations reach a stage in their saturated economies where exploitation becomes the only way out and advertisement becomes the exploitive instrument. To sell goods and services in intensely competitive markets, manufacturers have to be creative and consumers have to have two things: a desire to buy and the ability to pay. We consumers hope that the second requirement poses no problem for us. The United States is after all one of the most affluent nations in the world with most lucrative market. Even if you don‘t have enough income and wish to purchase something you cannot afford, relax, you can still buy it. Borrowing comes to the rescue. Borrowing is a regrettable necessity for most contemporary consumers in America. How can we borrow so much money given the fact that the rate of saving is so low for the US economy? Two explanations; first our commercial banks are really good at creating money out of thin air because of fractional reserve banking and because of creative accounting gimmicks, and second we can spend beyond our means as long as some foreign countries are willing to lend us money. Currently more than 25% of the US total debt is financed by external sources. We have an endless craving for product variations be they SUVs, electronics, simple products like ice cream and yogurt, and even Beanie Babies. No matter how many different versions of a product are already on the market, it seems manufacturers always have newer ones to offer and consumers have an insatiable desire to buy them. One of the costly consequences of this tendency is obsolescence and disposability. People in affluent nations dispose of everything from cheap to pricey items. Even books are becoming disposable. You buy a textbook at a hefty price this semester and it becomes outdated the next. Obsolescence is an immensely costly proposition and a wasteful use of God-given resources. But it seems we, the compulsive consumers, are unconcerned about this social problem as long as we can afford it. Frankly, some of the things we buy don‘t even have any useful application or life-enhancing benefits. Some, in fact, may even be public nuisances, implying that our welfare may actually benefit if we get rid of them. But we buy them anyway simply because we are told by manufacturers/advertisers that they are good for us. It is, of course, a well known fact that simplicity and going back to the basics are more relaxing; however, we are persuaded by greedy entrepreneurs that complexity is better for us. Or, perhaps we have a false sense of well being. Our ever-expanding longing for consumption is indeed needed to subsidize the advertising industry. That, in turn, sparks efforts to create or stimulate demand. Demand is no longer originated by supply, the productive efforts of entrepreneurs, as Jaen Batiste Say postulated centuries ago so persuasively. It is now created by promotional efforts of producers/sellers through advertising and force-feeding the consumers excessive information, and whether accurate or false, it does not matter. Consumption then becomes the driving force of capitalism and advertising its dispersion mechanism, transmitting the forces of demand to the consumers. How does this argument relate to the theme of this paper? Consumerism contaminates our daily behavior and economic choices we make. It changes our state of mind, the key component of the human spirit. It weakens an individual‘s moral values by altering one‘s character. Materialistic ideas, although appealing, are not morally defensible and they disserve society by leaving appalling shallow marks on the character of individuals. The vulgarities of material life in modern societies undermine the spirituality and ethical values. One of the cherished dividends of globalization is the universality of norms and values and codes of morality. As current popular uprising in Middle Eat indicates, the public awareness of economic rights, social justice, issues related to human dignity and the intrinsic worth of individuals is at all time high. I believe invoking ethical values play an empowering inspirational role in combating the false idolatry of consumerism. They can also provide the leadership and modeling needed to more effectively address the economic and spiritual plight of the poor in our world. Core moral values can be invoked to incentivize individuals to carry out good deeds not only for themselves but also for the sake of the local and broader community. There is no question that universities can foster global understanding among nations through productive dialogue, ethical-based dialogues based on inclusion, freedom of speech, and mutual respect for adherents to different ways of thinking. By doing so, we will allow the debris and differences that have caused division and territoriality to fall into the ―trash bin‖ of history. The dire need for an unambiguous perception of the global common good is blatantly evident. And, it is the task of colleges, universities, to promote an environment that is conducive to a dialogical approach.
BIBLIOGRAPHY
Aslan, Reza, ―How to Win A Cosmic War, God, Globalization, and the End of War on Terror‖, Random House, New York, 2009

R. Varjavand IHART - Volume 16 (2011)
173
Landy, Thomas, Editor, ―As Leaven in the World‖, Catholic Prospective on Faith, Vocation, and Intellectual Life‖, Sheed and Ward, 2001
Krugman, ―The Return of Depression Economics and the Crisis of 2008‖, W. W. Norton & Company, 2009 Miller, Matt, ―The Tyranny of the Dead Ideas, Letting Go of the Old Ways of Thinking to Unleash A New Prosperity‖, Times
Book, 2009 Read, Colin, ―Global Financial Meltdownm How We Can Avoid the Next Economic Crisis‖, 2009, Palgrave Macmillan. Reich, Robert, ―Aftershock, The Next Economy and America‘s Future‖, 2010, Alfred A. Knopf. Woods Jr., Thomas E., Meltdown, A Free-Market Look at Why the Stock Market Collapsed, the Economy Tanked, and
Government Bailouts Will Make Things Worse‖, Regnery Publishing Inc., 2009 Yunus, Muhammad, ―Creating a World Without Poverty, Social Business and the Future of Capitalism‖, Public Affair, New York,
2007.
C. K. Young, D. W. Good and C. Glascock IHART - Volume 16 (2011)
174
VITAL COLLABORATIVES, ALLIANCES AND PARTNERSHIPS: A SEARCH FOR KEY ELEMENTS OF AN EFFECTIVE PUBLIC-PRIVATE PARTNERSHIP
Charles Keith Young1, Donald W. Good2 and Catherine Glascock2
1Northeast State Technical Community College, USA and 2East Tennessee State University, USA
ABSTRACT
Owing to the significant structural changes that have occurred in the global marketplace over the past two decades, a corresponding increase of public-private partnerships has been established among the business sector, local governments, and public community colleges. This qualitative project seeks to identify and substantiate key elements that may be common to the formation, implementation, and maintenance stages of public-private partnerships. Who or what minimum conditions are necessary to the successful navigation of each stage? What obstacles typically arise during each stage, and how are they managed or circumvented? What sorts of benefits are generated through these partnerships and what measures may be applied to determine whether a partnership is meeting its mission objectives or not? To investigate these elements, the researcher interviewed eighteen key stakeholders directly involved with one or more partnerships between a one or more divisions of a community college located in Tennessee (CCTN) and their respective for-profit private sector concerns. Data analysis suggested that visionary and innovative leadership was critical to the formation and implementation of partnerships; key themes of ―people,‖ ―training,‖ ―business,‖ and ―need‖ influenced the life cycle of the partnership; persons identified as ―champions‖ formed the ―critical mass‖ necessary to create and sustain partnerships; and both public and private sectors implemented informal and formal assessments, but differences existed in how and what they measured to determine the efficacy of each partnership.
Keywords: Public-Private Partnerships, Community College Collaboratives, Regional Economic Development, Workforce Development.
INTRODUCTION
Everybody has accepted by now that ‗change is unavoidable‘. But that still implies that change is like ‗death and taxes‘: it should be postponed as long as possible and no change would be vastly preferable. But in a period of upheaval, such as the one we are living in, change is the norm.
– Peter Drucker, Management Challenges for the 21st Century, p. 62
Some years ago, a popular light novel written in the 1940s introduced a craftsman whose beloved home country was shattered by World War I. To survive, he and his family managed to immigrate to the United States, arriving with little more than the clothes on their backs. To his dismay, the craftsman finds his once-revered skills at sword-making and hand-crafted riding crops utterly unappreciated in his new country. The remainder of the novel details a series of innocent, but comical cultural missteps, ―Forrest Gump‖ style, at each attempt to find work, adapt to his new home, and provide for his family (Papashvily & Papashvily, 1945).
Although the above storyline formed the basis of much humorous writing in response to the vast numbers of immigrants flooding into the United States and the cross-cultural conflicts that ensued during the first half of the last century, it is no laughing matter to many workers that have found their skills and knowledge becoming as obsolete with each succeeding year as the sword-maker did in his day (Casner-Lotto & Barrington, 2006). Not since the great Industrial Revolution and ever-increasing mechanization of manual labor have so many manufacturers, small businesses, employers and employees struggled to adapt to the rapid changes in technology. This unrelenting upheaval in the workforce threatens to make America‘s dominance in research and innovation as irrelevant and unsustainable as the independent, family farm of today (Fitzpatrick, 2007).
Statement of the Problem
This study investigated and identified key factors that have been common to the experience of a community college in Tennessee and private sector enterprise when entering into and maintaining public-private partnerships (Aydin, 2006). Critical to this study was the participation of a public community college that had an adequate range and quantity of partnerships with which to compare to data reported in currently available literature. The researcher studied a mature community college institution that had a relatively extensive history of participation in a number of public-private partnerships.
C. K. Young, D. W. Good and C. Glascock IHART - Volume 16 (2011)
175
The researcher received permission to conduct this study under the request to preserve anonymity. Therefore, descriptions of the community college and its personnel have been generalized. The Tennessee-based community college in question (CCTN) was initially organized as a technical institute, offering technical Associate of Science and Associate of Education degrees and certificates. Less than 13 years later, the Tennessee General Assembly enacted a bill that broadened the school‘s mission to offer courses suitable for transfer to four-year universities and to improve access to higher-education programming and services to citizens residing in its multi-county service area and a limited number of bordering counties in neighboring states. According to a recent catalog and handbook published by the institution of record, the college developed and maintained its partnerships through a continuing education center. The college, through this center, promoted its capacity to provide educational programming tailored to the needs of local business, industry, and governmental agencies. This close cooperation with the private sector for the past two decades suggested the continuing education center of CCTN was an appropriate choice for the study for how it initiated, implemented, and maintained various public-private partnerships.
RELATED LITERATURE
Numerous reports over the past 15 years have pointed to an array of global and societal trends that have contributed to an erosion of America‘s standing as a nation of innovators and thinkers (Uhalde, Strohl, & Simkins, 2006). The ―Boomer‖ generation born between the years of 1946-1964 is reaching retirement age in unprecedented numbers. Concurrently, fewer qualified workers have risen through the ranks to replace these influential Americans (The Conference Board, 2008). Since the mid-1980s, America‘s higher education system has produced fewer graduates annually as a percentage of its overall population in technical fields such as math, engineering, and science while many other industrialized nations have graduated more students with these skills (United States Department of Labor, 2007). Because fewer domestic graduates possessed current teaching credentials in technical fields, many secondary school systems have been forced to place lesser-qualified instructors before smaller classes of students, a circumstance that has exacerbated a broadening lag in technical skills across the nation. This situation has been intensified within locales dominated by minority populations (Callan & Cherry, 2006). Consequently, some studies have suggested the nation could experience a shortage of 10 to 14 million qualified workers by 2010 (ASTD Public Policy Council, 2006). Furthermore, advances in industrial manufacturing processes have continued to eliminate low-skill, labor-intensive jobs; the jobs that remain demand increasing familiarity and expertise in complex, technical skills to pay a living wage (Atkinson & Wial, 2008). Due to the broad technological shift in the workplace that has occurred over the past 15 years, a high school diploma no longer provides adequate entry credentials for most of the jobs being created (Jacobs & Voorhees, 2006). Facing a shortage of technically trained labor, domestic companies have been forced to rely on imported, skilled workers--a labor pool very difficult to secure due to the scarce supply of visas as a consequence of the 9-11 attacks (United States Department of Labor, 2007). As a result, more than 80% of leading manufacturers reported a significant shortage of adequately trained workers (Casner-Lotto & Barrington, 2006). Economists have suggested these pressures will increase in the foreseeable future as the BRIC (Brazil, Russia, India, China) economies continue expanding, some at double-digit rates (Lai, 2007). How is the American society to cope effectively with these challenges and prosper in the new Knowledge Economy? Numerous studies have suggested that America must now compete more vigorously and strategically than ever for its share of the global market (Uhalde, Strohl & Simkins, 2006). The U.S. Chamber of Commerce, the National Association of Manufacturing, the Business-Higher Education Forum, the American Council on Education, and many other groups have released reports over the past decade that consistently pointed to the necessity of increased business/higher education collaborations to improve the baseline skills of the American workforce (Business-Higher Education Forum, 2002). Unfortunately, due to the historically differing missions of public and private institutions, these alliances have been strained via numerous misunderstandings and divergent expectations (Smith, 2003). This inherent mismatch has made for uneasy relationships over the last two decades between private industry and public institutions of higher education, relationships which have been lauded and criticized by members of both institutions (Fitzpatrick, 2007). Despite these difficulties, business leaders, policy makers, and educators from around the United States have indicated that public-private partnerships may play a valuable role in securing the nation‘s place in the global marketplace (Tennessee Higher Education Commission, 2005). Not since the national frenzy over the launch of Sputnik in 1957 has the public eye been cast more intently on the public higher-education system in the United States (Malcom, Chubin, & Jessee, 2004). Increased global competition and a rapidly aging workforce have companies scrambling to find and develop employees capable of dealing with an ever-accelerating pace of change in the marketplace of globalized commerce (Clagett, 2006). At the same time, higher education institutions have experienced elevated levels of stress due to annual reductions in state and federal funding while demand for educational programming and services have continually increased. This duality of market pressures (increased demand for services and
Vital Collaboratives, Alliances and Partnerships: A Search for Key Elements of an Effective Public-Private Partnership
176
diminishing financial support) provided a keen impetus for private business and higher education institutions to forge unprecedented alliances in an effort to compete and thrive in the world-wide marketplace (Kisker & Carducci,2003)
METHODOLOGY
Research Questions
1. Who or what initiated the conversation regarding the establishment of the public-private training programs begun in CCTN‘s service area?
2. Which factors were most frequently present that influenced the progress, positive or negative, of the conversation during each stage?
3. Who were the minimum necessary partners (the critical mass) who supported and sustained each partnership through each stage?
4. Which measures were employed to determine the efficacy of the partnership from implementation to its current status?
Sources/Subject/Population/Sample
Because public-private partnerships tend to be complex structures, the researcher expected the stakeholder list to be relatively extensive. The prospective interviewee pool included, but was not limited to, the current director of the community education center, chief administrators at the CCTN main campus, local officials, state legislators, current students and graduates of the program, and human resources personnel that hired or advanced those graduates. Each interviewee, except for the initial contact, had to be recommended by a previous interviewee as a relevant resource. Prior to the commencement of the interview, the interviewee read and signed the Informed Consent Disclosure form and responded in the affirmative to the below criteria: 1. Has the participant directly participated in the formation or maintenance of a public/private partnership managed by the
continuing education division of CCTN? 2. Has the participant served either as an administrator, instructor, student, or employee of one of more of the private sector
business partners?
Data Collection Methods
The researcher contacted administrative members of the community education center via telephone and electronic mail and described the aims and scope of the research project in order to determine which industrial partnerships could provide adequate data to sufficiently inform the questions posited by the research project. The researcher also identified the appropriate authorities from both CCTN and the private sector partner(s), and secured the appropriate permissions and clearances necessary to expeditiously prosecute the research project. Furthermore, the interview was designed to be sufficiently unstructured to permit the discovery of unanticipated data as the researcher analyzes each subsequent interviewee‘s ―mental map‖ (Babbie, 2004). The researcher designed questions drawn from the literature review to procure specific types of data (Marshall & Rossman, 2006). To aid the analysis of the interview data collected, the researcher categorized the interview data under the following stages in one or more partnerships: The first stage (incipient) focused upon the initial ideas and conversations that coalesced into actions that served as the basis for the second stage. The second stage (implementation) encompassed those activities and conversations engendered by the initial conversation up to and including the actual launch of the partnership. The third stage (operational) encompassed the activities and conversations that occurred following the launch of the partnership to the current date or, in at least one case, the expiration of the partnership. The researcher was aware, however, that data collected via the interview process may be considered incomplete as the face- to-face interview process has significant inherent limitations (Creswell, 2003). Face-to-face interviews tended to be conducted outside of the context of the event being studied. Removed from the context, research data derived solely from interviewees‘ subjective memories may constitute a limited or inaccurate set of experiences. In addition, the very presence of an outside, unfamiliar observer (the researcher) may have had an unintended effect upon the data reported (Flick, 2006). The researcher attempted to corroborate or further inform understanding of the data collected by requesting access to additional resources appropriate to qualitative research. Appropriate sources included relevant document reviews, direct observations, and review of audiovisual materials (Babbie, 2004). Unfortunately, the interviewees and/or their respective organizations requested anonymity or restricted access to publicly available sources. The researcher‘s request for more

C. K. Young, D. W. Good and C. Glascock IHART - Volume 16 (2011)
177
informative and directly relevant documentation was denied. To counter this lack of access, the researcher interviewed as many willing participants whose experiences drew from as many relevant roles and expertise as was available.
Data Analysis Methods
Per Marshall and Rossman (2006), qualitative data analysis is a multi-phase process that extends from initial data collection to the actual writing of the report. All through the data collection activity, the researcher engaged in a continuous process of data evaluation and personal reflection in the form of memos or audio recordings. The thoughts recorded in these resources, considered alongside the recurrent themes and ideas thus identified or discarded along the way, formed the foundation for further evaluation and review of subsequent data (Babbie, 2004). When the researcher neared the conclusion of the analysis through extensive interpretations of the themes and considered a wide array of alternative perspectives, the researcher then posited the most likely perspectives, supported by rational, logically defensible treatment of the data (Marshall & Rossman, 2006). Patton, as cited in Marshall and Rossman, stated ―qualitative analysis transforms data into findings… [T]he final destination remains unique for each inquirer, known only when – and if – arrived at‖ (p. 157). Babbie (2004) reported this recursive process as a continual synthesizing and distillation of the vast volumes of data into discrete, meaningful themes made significant by their recurrence in one of several ways. Prominent frequency of occurrence identified certain themes. Data analysis also produced additional themes less frequent in number, but greater in magnitude of influence, positively or negatively, upon the life cycle of each partnership. Chronological patterns of data that consistently suggested a recognizable structure, process, causation, or outcome also emerged from the analysis. Babbie (2004) asserted the analysis capabilities of a commercially available qualitative computer program has the capacity to perform better coding and evaluation than that created by hand, a word processor, or a spreadsheet program. Therefore, the researcher employed a commercially available computer program (NVivo8) specifically designed for qualitative research to assist in the data analysis, coding, and theme recognition. The program enabled the researcher to perform multiple queries, cross-referencing, categorization, and reorganization of textual data efficiently and accurately.
FINDINGS
Research Question #1
Who or what initiated the conversation regarding the establishment of the public-private training programs begun in CCTN‘s service area? Essentially, each partnership began and continued through the efforts of one or more persons in a leadership role. The leader was a person of influence based on their credibility with other employees of the organization and who also had the capacity to allocate resources. In the cases mentioned for this study, the president of the community college was the initial mover, allocating personnel and financial resources in support of each partnership. The allocation of resources resulted in a sort of intensive marketing promotion, communicating to area businesses to perceive the college as ―your training partner‖. Nevertheless, partnerships were not initiated with the college until a private sector organization determined that a legitimate need existed. Persons of influence within the private –sector organization then approached their counterparts of similar leadership levels at the community college to present the need and begin discussions to determine if a partnership sufficient to meet the parameters of the issue might be created. Several months of meetings and discussions occurred within and between the leadership and their assigns of each partner organization until the partnership moved from the idea stage to implementation. Chief influences which required this extended period of time were the starkly differing cultures and often-conflicting policies that governed the practices of each organization. These differences required ―out-of-the-box thinking‖ and innovative solutions by multiple levels of each organization to forge a satisfactory agreement. Unsurprisingly, successful partnerships were best initiated and maintained if persons within each partnering organization were able to exercise sufficient leadership to ―make it happen‖.
Research Question #2
Which factors were most frequently present that influenced the progress, positive or negative, of the conversation during each stage? A word frequency analysis of the interview data yielded four primary terms which factored significantly in the progress, or decline in the partnerships. In order, starting with the most frequent term first, the terms were ―people,‖ ―training,‖ ―business,‖ and ―need(s)‖. Interestingly, the order and significance of the terms appeared to be suitable as a promotional slogan for a training organization. Of the four questions, this question yielded the greatest amount of data.

Vital Collaboratives, Alliances and Partnerships: A Search for Key Elements of an Effective Public-Private Partnership
178
Data analysis of the interview transcripts presented both the public- and private sector partners as people-centric organizations. However, their cultures, expectations, and practices were widely divergent and often at odds. Considerable investment of time and resources were leveraged to ―bridge‖ that divide. Many of the interviewees who spoke from a management perspective recounted the considerable positive effects upon trainees‘ careers and personal self worth as a direct result of successful completion of training offered through the partnership. Contrary to the traditional structure of inviting persons to attend college courses on the college campus, the president insisted upon offering customized training programming at a time and place convenient to the partnering organization. This divergence from the traditional campus-centric model created a ―business-friendly‖ perception by the community and local businesses that resulted in overtures from large and small-scale manufacturers to explore and establish training partnerships with the community college. Both the organizations and their respective employees benefited from participation in a successful partnership. From the private sector side, the organization benefited from improved efficiencies and productivity. When layoffs occurred, former employees were able to secure jobs in related industries due to the types of credentialed skills sets they possessed. For the public institution, a positive transformation of the culture was noted. As presented in the interviews, the ―business‖ term referred either to the culture or the influence of ―business decisions‖ upon the structure and operation of the partnerships. Much discussion was presented describing some of the frustration that occurred, particularly during the waning days of a partnership that concluded. Essentially, business decisions initiated the conversation that led to the partnership; business decisions formed its structure and operations; business decisions also factored heavily in its conclusion. As was mentioned earlier in this study, partnerships were initiated only after the private sector partner perceived a need relevant to the goals of the business. The primary motivation factor was the ―economic climate‖ that prevailed at the time. Two primary motivating factors were noted: lack of available skilled workers due to an aging workforce, and technological advances in industrial and communication processes. When the private sector partner responded to the community college‘s message of ―your training partner,‖ an extended period of negotiations and problem-solving was required by both sectors to ―build trust‖ and set mutually-agreed-upon goals and expectations of the partnership. From the data collected, the community college appeared to be the institution that altered its policies and procedures most profoundly. The stated objectives were to assist the private sector and to make whatever changes were possible within the prevailing policies that governed the college‘s activities. The college‘s stated goal was, ―we were going to do everything we could to meet their needs.‖ Additional factors which influenced the partnerships positively or negatively were noted. They included the employees‘ stress resulting from working full-time and taking classes, too. Adequate funding and community support were also presented. The partnering organizations also received numerous benefits: Private sector employees had greater morale and career opportunity; the community college enjoyed enhanced credibility and prestige as a provider of solutions to business‘s needs.
Research Question #3
Who were the minimum necessary partners (the critical mass) who supported and sustained each partnership through each stage? No specific position or role was indicated from an analysis of the interview data. Two general themes of characteristics of ―necessary‖ partners emerged from the data. One category was ―visionary,‖ persons who were not dissuaded by ―we‘ve never done it this way before‖. The other category was ―champion‖. This person, irrespective of title or rank, was a person who had ―influence with management and possess credibility with ‗employees or participants‘ in the private sector‖. Having two champions, one in the private sector and the other within the college, communicating and ―selling‖ the partnership, allocating resources and building relationships was the preferred situation. Partnerships ceased operations without effective champions energizing the initiative.
Research Question #4
Which measures were employed to determine the efficacy of the partnership from implementation to its current status? Interview data revealed that informal measures exceeded the use of formal measures in the partnerships studied. The private sector largely used performance-based criteria. In other words, can the employee perform the required skill at a proficient and productive level? When federally-funded programs were employed in the training, more formal measures were present. The community college generally applied traditional assessments, resulting in letter grades and pass/fail assessments. Most formal measures yielded data typical of institutional effectiveness reporting. Informal assessments resulted from regular, ongoing
C. K. Young, D. W. Good and C. Glascock IHART - Volume 16 (2011)
179
meetings between upper-level management drawn from both sectors. Consistent communication between decision-makers from both sectors was cited most frequently as a sufficient and reliable assessment of the performance of each partnership.
CONCLUSIONS AND IMPLICATIONS FOR PRACTICE
Conclusions
An in-depth analysis of relevant literature and interview data yielded several conclusions drawn from this study. The recommendations below are limited to the experiences of a community college within the borders of Tennessee.
1. Mutually beneficial public-private partnerships between a community college in Tennessee and for-profit businesses are complex entities that require visionary leadership and influential individuals capable of ―championing‖ the ideals and goals of the partnership.
2. Each partnership was unique in its ideation, implementation, and operation throughout its life cycle. 3. Mutually beneficial public-private partnerships possess great potential for increased efficiencies in both sectors by
leveraging the unique strengths and capabilities of each partner. 4. Formidable obstacles exist against creating and implementing an effective public-private partnership due to structural,
procedural, and political differences between the public and private sectors. 5. Continual challenges arose throughout the life cycle of each partnership that were solved by continuous negotiations
conducted in an atmosphere of trust and integrity. 6. When innovative means and methods were created to successfully navigate the obstacles and challenges as they
occurred, significant benefits were realized by the workers employed across most levels of each organization. 7. Even when a once-successful partnership concluded, its benefits to the employees and the surrounding community
continued to reverberate throughout the local economy for an extended period of time. 8. Success breeds success. A history of mutually-beneficial partnerships attracts additional attempts to create and maintain
present and future partnerships.
Implications for Practice
A review of available literature and analysis of interview data collected informed the recommendations which follow. Significant new literature has been published over the past few years that may provide significant guidance to community college leadership and their private sector counterparts interested in engaging in public-private partnerships. In conjunction with the emergence of recent literature, the researcher recommends the following general guidelines for public and private organizations operating within the boundaries of Tennessee.
1. Community colleges intending to engage in public-private partnerships should allocate resources to attract, develop, and retain innovative and visionary leaders who are capable of ―championing‖ the partnership concept.
2. Community colleges intending to engage in public-private partnerships should establish internal structures, modify policies, determine strengths, reward initiatives, and aggressively promote their capacity to act as ―solution providers‖ to their targeted private sector counterparts.
3. The TBR should create a formal mechanism that rewards, incentivizes, and/or recognizes community colleges and/or divisions within a community college which successfully operate beneficial public-private partnerships. Even though the TBR‘s 2000-2005 Strategic Plan promoted the cultivation and formation of public-private partnerships, no such formal reward mechanism was detected at the time of this study.
4. Both public and private partners must allocate resources and personnel sufficient to establish and maintain effective, consistent channels of communication as the hallmark of creating and implementing a public-private partnership. These communication structures should anticipate and solve challenges, establish realistic expectations, recognize limitations, determine financial responsibility, assess effectiveness, and inform stakeholders of issues and successes of the partnership.
5. When negotiating the structure of a partnership, it is essential that the partners determine a mutually acceptable exit strategy should economic conditions warrant a reduction, cessation, or significant modification of the partnership. A strategy of this type will limit the occurrence of frustrated expectations and ill will that may be created in employees who may have partially advanced through a training program, yet are unable to fulfill their commitment because a sufficient number of courses are no longer being offered.
6. Historically, the world of business and academia operate at vastly different rates of change. Modifications in structure and policy must be made by governing and accreditation agencies to permit the public community college to respond quickly and effectively to the perpetually changing culture of the private sector.

Vital Collaboratives, Alliances and Partnerships: A Search for Key Elements of an Effective Public-Private Partnership
180
Additionally, it may be instructive to survey all public-private partnerships currently in progress across the state of Tennessee and bordering states to determine the types of partnerships being created and managed, as well as calculating the fiscal and political resources necessary to maintain the efficacy of the partnerships. A survey of this type may be used to determine ―best practices‖ and develop or inform a model for other institutions, both public and private, to follow.
REFERENCES
ASTD Public Policy Council. (2006). Bridging the skills gap: How the skills shortage threatens growth and competitiveness…and what to do about it. [white paper]. American Society for Training and Development. Available from http://www.astd.org/NR/rdonlyres/ FB4AF179-B0C4-4764-9271-17FAF86A8E23/0/BridgingtheSkillsGap.pdf
Atkinson, R., & Wial, H. (2008). Boosting productivity, innovation and growth through a national innovation foundation. Washington, DC: Brookings-ITIF. Available from http://www.itif.org/files/NIFexecutivesummary.pdf
Aydin, N. (2006). ―Putting minds to work‖ pays big dividends! The impact of Florida community colleges on students‘ prosperity and the state‘s economy: A solid return on investment. Center for Educational Performance and Accountability. Available from http://www.floridataxwatch.org/resources/pdf/CommunityCollegeFINAL4506.pdf
Babbie, E. (2004). The practice of social research (10th ed.). Belmont, CA: Wadsworth. Business-Higher Education Forum. (2002). Investing in people: Developing all of America‘s talent on campus and in the
workplace. Washington, DC: ACE Fulfillment Service (ERIC Document Reproduction Service No. ED469590) Callan, P., & Cherry, J. D. (2006) Economic growth through increased college enrollment. BHEF 2006 Issue Brief. Available
from http://www.bhef.com/publications/Winter06IssueBrief1.pdf Casner-Lotto, J. & Barrington, L. (2006). Are they really ready to work?: Employer‘s perspectives on the basic knowledge and
applied skills of new entrants to the 21st century U. S. workforce. Available from http://www.conference-board.org Clagett, M. G. (2006). Workforce development in the United States: An overview. National Center on Education and the
Economy. Available from http://www.skillscommission.org/pdf/Staff Papers/ACII_WIA_Summary.pdf The Conference Board. (2008). The vital partnership: Focusing the collective strength of America. Available from
http://www.leadertoleader.org/ourwork/iaf_2007.pdf Creswell, J. W. (2003). Research design: Qualitative, quantitative, and mixed methods approaches. (2nd ed.). Thousand Oaks,
CA: Sage. Drucker, P. F. (1999). Management challenges for the 21st century. New York: Harper-Collins. Fitzpatrick, E. (2007). Innovation America: A public-private partnership. Retrieved from http://www.uschamber.com Flick, U. (2006). An introduction to qualitative research (3rd ed.). Thousand Oaks, CA: Sage. Jacobs, J. & Voorhees, R. A. (2006). The community college as a nexus for workforce transitions: A critical essay. Journal of
Applied Research in the Community College, 13(2), 133-139. Kisker, C. B., & Carducci, R. (2003). UCLA community college review: community college partnerships with the private
sector—organizational contexts and models for successful collaboration. Retrieved from http://findarticles.com/p/articles/ mi_m0HCZ/is_3_31/ai_114286876
Lai, K. (2007). Gartner debate: Will China or India--or a combined ―Chindia‖ – eclipse U.S. on IT? Retrieved from http://www.computerworld.com/action/article.do?command=viewArticleBasic&articleId=9017718&source=NLT_PM&nlid=8
Malcom, S. M, Chubin, D. E., & Jessee, J. K. (2004). Standing our ground: A guidebook for STEM educators in the post-Michigan era. New York: American Association for the Advancement of Science. Available from http://www.aaas.org/standingourground/PDFs/Standing_ Our_Ground. pdf.
Marshall, C., & Rossman, G. B. (2006). Designing qualitative research. (4th ed.). Thousand Oaks, CA: Sage. Papashvily, G. & Papashvily, H. (1945) Anything Can Happen. New York: Harper. Smith, L. D. (2003). Business-academic partnerships: Creating a curriculum that mirrors the real world. The Presidency.
Available from http://findarticles.com/p/articles/mi_qa3839/is_200304/ai_n9202335/ Tennessee Higher Education Commission. (2005). 2005-2010 Master plan for Tennessee higher education: Creating
partnerships for a better Tennessee. Available from http://tennessee.gov/thec/2004web/division_pages/ppr_pages/pdf s/Planning/2005-10%20master%20plan.pdf
Uhalde, R., Strohl, J., & Simkins, Z. (2006). America in the global economy: A background paper for the new commission on the skills of the workforce. National Center on Education and the Economy. Available from http://www.skillscommission.org/pdf/Staff%20Papers/America_Global_Economy.pdf
United States Department of Labor. (2007). The STEM workforce challenge: the role of the public workforce system in a national solution for a competitive science, technology, engineering, and mathematics (STEM) workforce. Available from http://www.doleta.gov/ Youth_services/pdf/STEM_Report_4%2007.pdf
C. J. Franklin IHART - Volume 16 (2011)
181
A QUANTITATIVE ANALYSIS OF THE PUBLIC ADMINISTRATOR‟S LIKELY USE OF EMINENT DOMAIN AFTER KELO
Carl J. Franklin
Southern Utah University, USA
ABSTRACT
In 2005, the Supreme Court of the United States amended more than two centuries of eminent domain law to allow the government to take private property for the purpose of economic development. For business, the legal change impacts the way managers plan for property ownership, including acquisition and long-term use. Quantitative methods were used to measure the degree of association between the specific characteristics of the municipal public administrator and the willingness of the administrator to use eminent domain for the purpose of economic development. Since the Kelo case, and the new legal standard it establishes, is so new, there is little empirical research which examines the relationship between the administrator‘s characteristics and the willingness to use eminent domain. The significance of this research is that it establishes a baseline for measuring the potential impact an administrator‘s understanding of eminent domain may have on the willingness to use eminent domain. For this study, the postulate is that an administrator has an increased likelihood in using eminent domain when they have a high level of knowledge about eminent domain. The research was conducted using survey methods to measure the characteristics of public administrators in a three-state region of the United States. The study revealed a strong association (r(130) = -.757, p < .05) between the administrator‘s level of knowledge about eminent domain and the willingness to use eminent domain; however, rather than the expected positive correlation the data revealed that the more education an administrator had the less likely they would be to use eminent domain. The significance of the research is that as a first line of empirical data in this area, the first steps have been taken in understanding the potential relationship between understanding and use when it comes to eminent domain under the Kelo decision. Keywords: Eminent Domain, Kelo, Takings, Constitution.
INTRODUCTION
Business managers make complicated plans for business growth and survival by measuring the impact of a number of factors including internal ability, economic conditions, cultural issues, and political-legal forces (Hellriegel, Jackson & Slocum, 2004). In 2005, the political-legal forces changed dramatically when the Supreme Court of the United States ruled that private property can be taken by government in order to meet proposed economic development measures (Kelo, 2005). For business, the legal change impacts the way managers plan for property ownership, including acquisition and long-term use.
PROBLEM STATEMENT
The political-legal changes brought by Kelo represent a significant shift in the application of eminent domain (Biais, 2007). Traditionally, business managers used the clearly definable public needs standard (Benson, 2008) to measure the potential for use of eminent domain by the government. With the Kelo decision, the government may now take property for less tangible reasons, which include the mere supposition of economic development (Christensen, 2005). The problem is that traditional means of measuring the possible use of eminent domain do not apply to the less concrete argument of economic development (Dana, 2007). Normally, public policy planning and government action only enter business planning when there is a direct link between the two (Hill & Jones, 2007). One area where this occurs is in property management and land use control. The business manager seeks to manage the business property effectively, allowing for the increase in profit (Wheelen & Hunger, 2007). At the same time, community land use falls under the domain of the government (Jacobs & Paulsen, 2009). The traditional rules for the use of eminent domain provided business managers a clear guide to be used when making decisions about business property (Dernbach, 2009). This changed with Kelo, and a gap in the knowledge used by business managers to measure the potential use of eminent domain was created (Costonis, 2010). To address this gap original research into the relationship between the public administrator‘s likely use of eminent domain and their understanding of eminent domain law has been conducted by the author.

A Quantitative Analysis of the Public Administrator‘s Likely Use of Eminent Domain after Kelo
182
RESEARCH QUESTION
This purpose of the original quantitative study was to examine the personal characteristics of public administrators; including the relationship between these characteristics and the willingness of the administrator to use eminent domain for economic development. The intent was to determine whether a sufficient correlation exist between the administrator's likely use of eminent domain and specific characteristics of the administrator. The following research question was designed to measure the variables of interest.
RQ1: To what extent does an administrator‘s knowledge of eminent domain law contribute to his or her use of eminent domain for economic development?
HYPOTHESES
Since Kelo is a relatively new case, and the standards for the application of Kelo are not well established, there is a chance that many administrators are either unfamiliar with the new law or uncertain of its application (Saginor & McDonald, 2009). This is an important consideration, and the conceptualization is that the administrator's characteristics, especially those relevant to the use of eminent domain, will be usable in the measurement of the government's intent to use eminent domain for economic development. The operationalization of this concept presents particular problems for translating the concept or construct into a functioning and operating reality (Bower & Scheidell, 2009; Zikmund, 2003).The research question focuses on the administrator's knowledge of current eminent domain law as the independent variable. The dependent variable is the administrator‘s potential to use Kelo for the purpose of economic development. It is proposed that where knowledge is high there is a greater likelihood that the administrator will use eminent domain for economic development. The phenomenon for observation is the level of knowledge as it correlates to the use of eminent domain. Based on this approach, the hypothesis (H1) is that where an administrator has a high level of knowledge about eminent domain, especially Kelo, there is a greater likelihood the administrator will use eminent domain for economic development. The research question is restated below along with a statement of the null hypothesis (H10) and alternative hypothesis (H1a):
RQ1: To what extent does an administrator‘s knowledge of eminent domain contribute to his or her use of eminent domain for economic development?
H10: When a public administrator has a high level of knowledge about eminent domain law there is an increased likelihood the administrator will use eminent domain for economic development.
H1a: When a public administrator has a high level of knowledge about eminent domain law there is a decreased likelihood the administrator will use eminent domain for the purpose of economic development.
RESEARCH DESIGN AND METHODS
A quantitative methodology was used to measure the relationship between characteristics of municipal public administrators and the use of eminent domain for economic development. The examination of the public administrator's personal characteristics for knowledge about eminent domain law and past use of eminent domain fit well with the choice to use a survey. By its design, the survey instrument allows the researcher to better control the type of data being gathered (Dillman, Smyth & Christian, 2009). In this study, the type of data measured related to the level of both formal and informal education. The formal education includes the level of college (undergraduate, graduate, and related majors or areas of emphasis) as well as the formal training the administrator has achieved. The level of informal education includes the reading of industry or scholarly journals, the choices of books or related guides for administration, and the involvement with professional organizations or associations. In evaluating the various research methods available the major question considered was the ability to accurately measure the potential for use of eminent domain. By limiting the study to municipal level administrators the potential for error due to different approaches to the application of eminent domain was reduced. The application at the municipal level tends to be very different from application by the state or at the federal level (Paul, 2008). For that reason, the use of a survey method allowed for the most accurate method to measure the concepts for study. The issue for this research was to define the measurement methods in such a way that a researcher can identify how much impact, if any, the independent variable may have on the dependent variable (Cohen, Cohen, West & Aiken, 2003). From the outset, it is clear that knowledge of other similar actions may be sufficient to prompt some administrators to act in analogous
C. J. Franklin IHART - Volume 16 (2011)
183
fashion (Arthurs, 2005). One can draw from related studies a number of similarities and distinctions that help shape this research (Donziger, 2007). Specifically, the use of eminent domain as a common means of meeting government needs has a long history in both American jurisprudence and public policy (Cohen, 2006). Based on this practice, the design of the instrument takes into account the expected level of knowledge which an administrator at the decision making level would have. This includes the expected amount and type of formal education as evaluated using triangulation of data with known levels of education or training (Cameron, 2009; Jick, 1979). The nature of the problem creates a complex and seemingly intractable barrier to accurate measurement (Cohen, 2006), primarily because of the inherent trade-offs between socio-political, environmental, ecological, and economic factors (Kiker, Bridges, Varghese, Seager, & Linkov, 2005). Similarly, the problems that arise in a study of this nature rely on a set of inherent trade-offs between the political-legal, public policy, and business planning areas (Boyd, Gove & Hitt, 2005). To address these problems the research method used a system of narrow definition of the characteristics of the individual participant. By better defining the participants as well as the variables the study has an increased possibility for success. By using a survey instrument, the potential for error in measuring the relationships between variables was reduced when compared to other forms of research (Cameron, 2009). The use of triangulation method as well as the identification of best practices in research design insured the validity and effectiveness of the study (Boyd, Gove & Hitt, 2005). The use of triangulation method, the process of taking information from multiple sources and disciplines in order to compare and measure the content, helped to provide a higher level of validity as well (Rodrigues, Piecyk, Potter, McKinnon, Naim & Edwards, 2010). Commonly associated with mixed-methods approaches, the use of triangulation is also applicable when creating a new instrument or when revalidating an instrument that has reached the end of its potential useful life (Groves, Fowler, Couper, Lepkowski, Singer & Tourangeau, 2009). The participants for this study were public administrators at the municipal level that have decision authority for the use of eminent domain. This included the chief administrative officer, normally identified as the city manager, the associate or assistant administrator, the chief financial officer, and the chief legal counsel for the municipality. These administrators were chosen because of the relative involvement in the decision process for the use of eminent domain. To ensure representativeness, the sample was drawn from a three state region from which archetypal communities exist, and to do this the study used data available from the national census (Census, 2007) as well as national registries for public administration. By using a regional population the potential for conflict was limited (Lehtonen & Pahkinen, 2007). This allows the selection of a population that provides better representation, which in turn provides for better measurement (Enticott & Walker, 2008).
FINDINGS
Once the population was identified, and the necessary number of responses essential to insure validity was ascertained, a means for selecting an appropriate random sample was employed to identify the members of the group for solicitation of responses. To accomplish this task, the members of the database were assigned appropriate identifying numbers to insure anonymity and then entered into Microsoft Excel. The Random Sampler routine from Excel was used to select a sample from the original population.
Descriptive Statistics for Survey Group
The participants in the survey included 117 (90%) male respondents and 13 female (10%). The age range of respondents was measured using six groupings from the lowest at 18 – 22 years of age and the highest at over 60 years of age. There were no respondents in the age category for 18 – 22. The category with the most responses was 50 – 59 with 52 (40%) respondents identifying themselves in this group. The smallest categories were the group for 23 – 29 years of age and the over 60 years of age group, each with 13 (10%) responses. The individual categories selected by respondents as well as corresponding values and percentages are shown in Table 1 below.
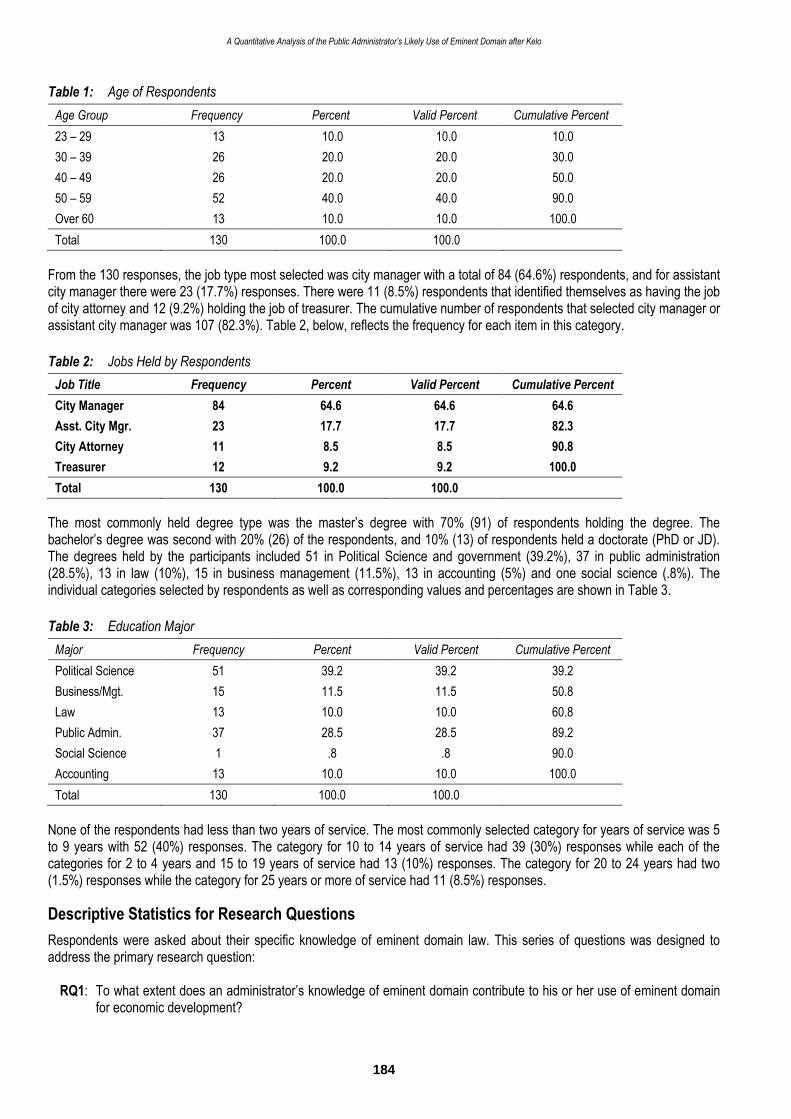
A Quantitative Analysis of the Public Administrator‘s Likely Use of Eminent Domain after Kelo
184
Table 1: Age of Respondents
Age Group Frequency Percent Valid Percent Cumulative Percent
23 – 29 13 10.0 10.0 10.0
30 – 39 26 20.0 20.0 30.0
40 – 49 26 20.0 20.0 50.0
50 – 59 52 40.0 40.0 90.0
Over 60 13 10.0 10.0 100.0
Total 130 100.0 100.0
From the 130 responses, the job type most selected was city manager with a total of 84 (64.6%) respondents, and for assistant city manager there were 23 (17.7%) responses. There were 11 (8.5%) respondents that identified themselves as having the job of city attorney and 12 (9.2%) holding the job of treasurer. The cumulative number of respondents that selected city manager or assistant city manager was 107 (82.3%). Table 2, below, reflects the frequency for each item in this category.
Table 2: Jobs Held by Respondents
Job Title Frequency Percent Valid Percent Cumulative Percent
City Manager 84 64.6 64.6 64.6
Asst. City Mgr. 23 17.7 17.7 82.3
City Attorney 11 8.5 8.5 90.8
Treasurer 12 9.2 9.2 100.0
Total 130 100.0 100.0
The most commonly held degree type was the master‘s degree with 70% (91) of respondents holding the degree. The bachelor‘s degree was second with 20% (26) of the respondents, and 10% (13) of respondents held a doctorate (PhD or JD). The degrees held by the participants included 51 in Political Science and government (39.2%), 37 in public administration (28.5%), 13 in law (10%), 15 in business management (11.5%), 13 in accounting (5%) and one social science (.8%). The individual categories selected by respondents as well as corresponding values and percentages are shown in Table 3.
Table 3: Education Major
Major Frequency Percent Valid Percent Cumulative Percent
Political Science 51 39.2 39.2 39.2
Business/Mgt. 15 11.5 11.5 50.8
Law 13 10.0 10.0 60.8
Public Admin. 37 28.5 28.5 89.2
Social Science 1 .8 .8 90.0
Accounting 13 10.0 10.0 100.0
Total 130 100.0 100.0
None of the respondents had less than two years of service. The most commonly selected category for years of service was 5 to 9 years with 52 (40%) responses. The category for 10 to 14 years of service had 39 (30%) responses while each of the categories for 2 to 4 years and 15 to 19 years of service had 13 (10%) responses. The category for 20 to 24 years had two (1.5%) responses while the category for 25 years or more of service had 11 (8.5%) responses.
Descriptive Statistics for Research Questions
Respondents were asked about their specific knowledge of eminent domain law. This series of questions was designed to address the primary research question:
RQ1: To what extent does an administrator‘s knowledge of eminent domain contribute to his or her use of eminent domain for economic development?
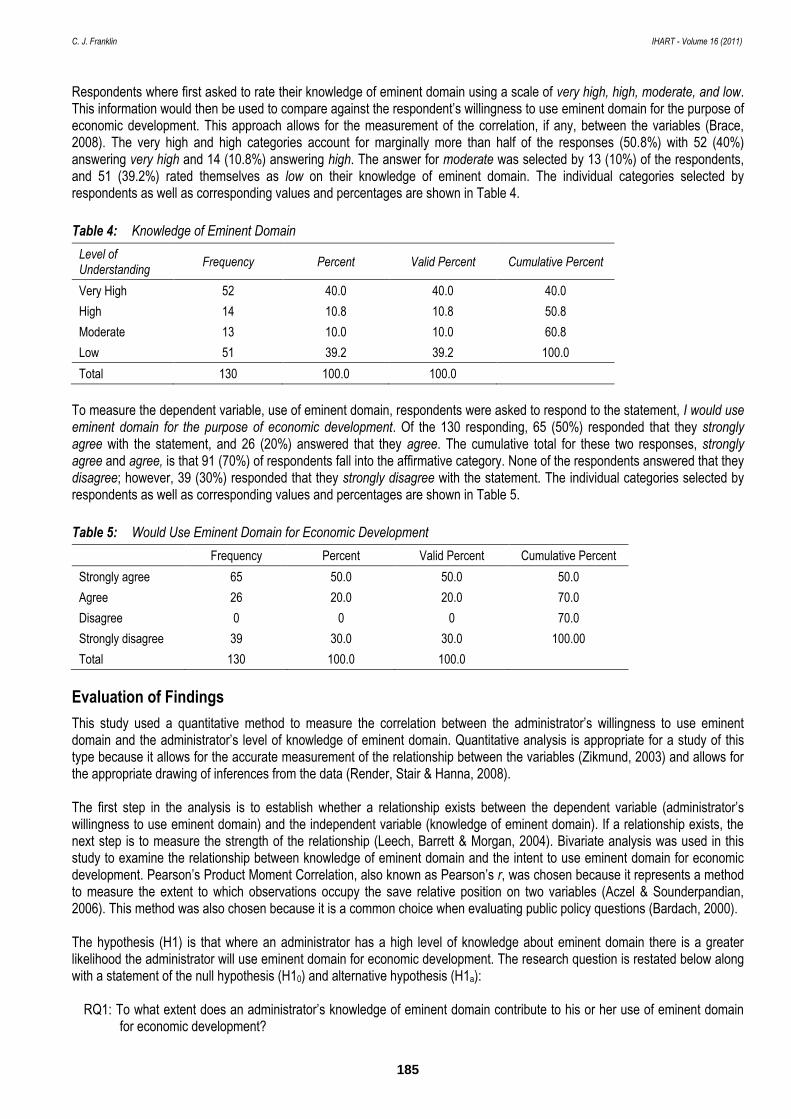
C. J. Franklin IHART - Volume 16 (2011)
185
Respondents where first asked to rate their knowledge of eminent domain using a scale of very high, high, moderate, and low. This information would then be used to compare against the respondent‘s willingness to use eminent domain for the purpose of economic development. This approach allows for the measurement of the correlation, if any, between the variables (Brace, 2008). The very high and high categories account for marginally more than half of the responses (50.8%) with 52 (40%) answering very high and 14 (10.8%) answering high. The answer for moderate was selected by 13 (10%) of the respondents, and 51 (39.2%) rated themselves as low on their knowledge of eminent domain. The individual categories selected by respondents as well as corresponding values and percentages are shown in Table 4.
Table 4: Knowledge of Eminent Domain
Level of Understanding
Frequency Percent Valid Percent Cumulative Percent
Very High 52 40.0 40.0 40.0
High 14 10.8 10.8 50.8
Moderate 13 10.0 10.0 60.8
Low 51 39.2 39.2 100.0
Total 130 100.0 100.0
To measure the dependent variable, use of eminent domain, respondents were asked to respond to the statement, I would use eminent domain for the purpose of economic development. Of the 130 responding, 65 (50%) responded that they strongly agree with the statement, and 26 (20%) answered that they agree. The cumulative total for these two responses, strongly agree and agree, is that 91 (70%) of respondents fall into the affirmative category. None of the respondents answered that they disagree; however, 39 (30%) responded that they strongly disagree with the statement. The individual categories selected by respondents as well as corresponding values and percentages are shown in Table 5.
Table 5: Would Use Eminent Domain for Economic Development
Frequency Percent Valid Percent Cumulative Percent
Strongly agree 65 50.0 50.0 50.0
Agree 26 20.0 20.0 70.0
Disagree 0 0 0 70.0
Strongly disagree 39 30.0 30.0 100.00
Total 130 100.0 100.0
Evaluation of Findings
This study used a quantitative method to measure the correlation between the administrator‘s willingness to use eminent domain and the administrator‘s level of knowledge of eminent domain. Quantitative analysis is appropriate for a study of this type because it allows for the accurate measurement of the relationship between the variables (Zikmund, 2003) and allows for the appropriate drawing of inferences from the data (Render, Stair & Hanna, 2008). The first step in the analysis is to establish whether a relationship exists between the dependent variable (administrator‘s willingness to use eminent domain) and the independent variable (knowledge of eminent domain). If a relationship exists, the next step is to measure the strength of the relationship (Leech, Barrett & Morgan, 2004). Bivariate analysis was used in this study to examine the relationship between knowledge of eminent domain and the intent to use eminent domain for economic development. Pearson‘s Product Moment Correlation, also known as Pearson‘s r, was chosen because it represents a method to measure the extent to which observations occupy the save relative position on two variables (Aczel & Sounderpandian, 2006). This method was also chosen because it is a common choice when evaluating public policy questions (Bardach, 2000). The hypothesis (H1) is that where an administrator has a high level of knowledge about eminent domain there is a greater likelihood the administrator will use eminent domain for economic development. The research question is restated below along with a statement of the null hypothesis (H10) and alternative hypothesis (H1a):
RQ1: To what extent does an administrator‘s knowledge of eminent domain contribute to his or her use of eminent domain for economic development?
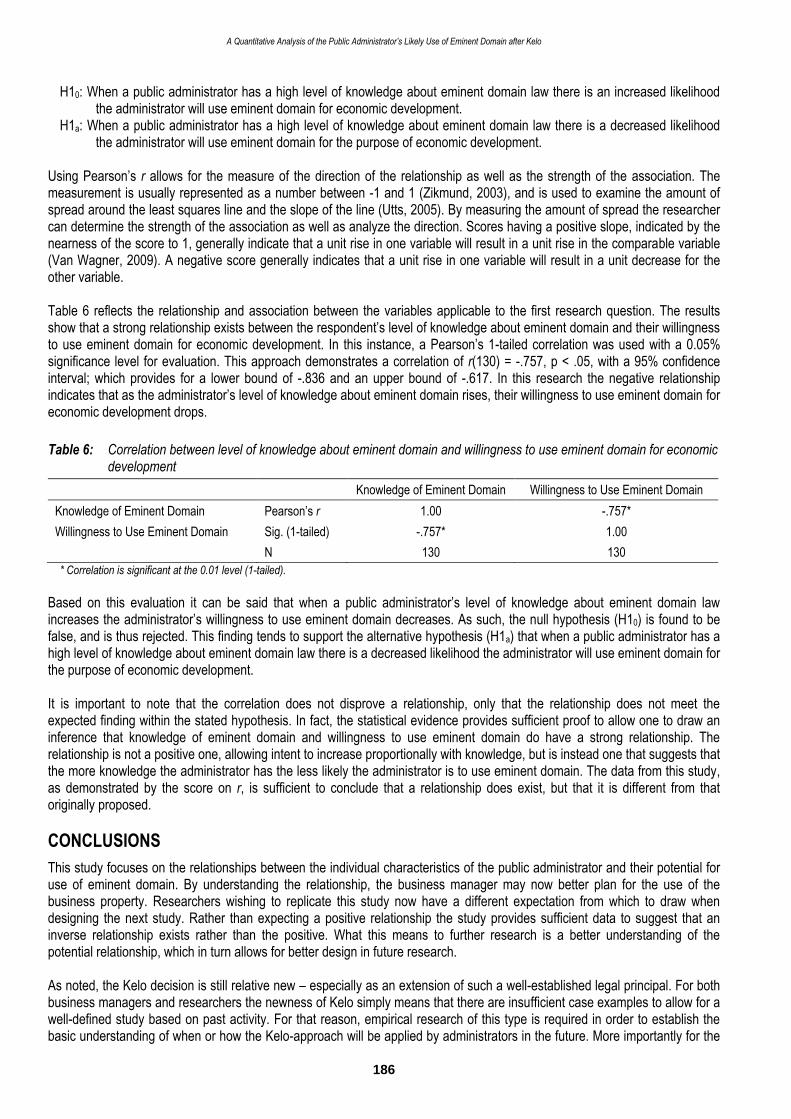
A Quantitative Analysis of the Public Administrator‘s Likely Use of Eminent Domain after Kelo
186
H10: When a public administrator has a high level of knowledge about eminent domain law there is an increased likelihood the administrator will use eminent domain for economic development.
H1a: When a public administrator has a high level of knowledge about eminent domain law there is a decreased likelihood the administrator will use eminent domain for the purpose of economic development.
Using Pearson‘s r allows for the measure of the direction of the relationship as well as the strength of the association. The measurement is usually represented as a number between -1 and 1 (Zikmund, 2003), and is used to examine the amount of spread around the least squares line and the slope of the line (Utts, 2005). By measuring the amount of spread the researcher can determine the strength of the association as well as analyze the direction. Scores having a positive slope, indicated by the nearness of the score to 1, generally indicate that a unit rise in one variable will result in a unit rise in the comparable variable (Van Wagner, 2009). A negative score generally indicates that a unit rise in one variable will result in a unit decrease for the other variable. Table 6 reflects the relationship and association between the variables applicable to the first research question. The results show that a strong relationship exists between the respondent‘s level of knowledge about eminent domain and their willingness to use eminent domain for economic development. In this instance, a Pearson‘s 1-tailed correlation was used with a 0.05% significance level for evaluation. This approach demonstrates a correlation of r(130) = -.757, p < .05, with a 95% confidence interval; which provides for a lower bound of -.836 and an upper bound of -.617. In this research the negative relationship indicates that as the administrator‘s level of knowledge about eminent domain rises, their willingness to use eminent domain for economic development drops.
Table 6: Correlation between level of knowledge about eminent domain and willingness to use eminent domain for economic development
Knowledge of Eminent Domain Willingness to Use Eminent Domain
Knowledge of Eminent Domain Pearson‘s r 1.00 -.757*
Willingness to Use Eminent Domain Sig. (1-tailed) -.757* 1.00
N 130 130
* Correlation is significant at the 0.01 level (1-tailed).
Based on this evaluation it can be said that when a public administrator‘s level of knowledge about eminent domain law increases the administrator‘s willingness to use eminent domain decreases. As such, the null hypothesis (H10) is found to be false, and is thus rejected. This finding tends to support the alternative hypothesis (H1a) that when a public administrator has a high level of knowledge about eminent domain law there is a decreased likelihood the administrator will use eminent domain for the purpose of economic development. It is important to note that the correlation does not disprove a relationship, only that the relationship does not meet the expected finding within the stated hypothesis. In fact, the statistical evidence provides sufficient proof to allow one to draw an inference that knowledge of eminent domain and willingness to use eminent domain do have a strong relationship. The relationship is not a positive one, allowing intent to increase proportionally with knowledge, but is instead one that suggests that the more knowledge the administrator has the less likely the administrator is to use eminent domain. The data from this study, as demonstrated by the score on r, is sufficient to conclude that a relationship does exist, but that it is different from that originally proposed.
CONCLUSIONS
This study focuses on the relationships between the individual characteristics of the public administrator and their potential for use of eminent domain. By understanding the relationship, the business manager may now better plan for the use of the business property. Researchers wishing to replicate this study now have a different expectation from which to draw when designing the next study. Rather than expecting a positive relationship the study provides sufficient data to suggest that an inverse relationship exists rather than the positive. What this means to further research is a better understanding of the potential relationship, which in turn allows for better design in future research. As noted, the Kelo decision is still relative new – especially as an extension of such a well-established legal principal. For both business managers and researchers the newness of Kelo simply means that there are insufficient case examples to allow for a well-defined study based on past activity. For that reason, empirical research of this type is required in order to establish the basic understanding of when or how the Kelo-approach will be applied by administrators in the future. More importantly for the

C. J. Franklin IHART - Volume 16 (2011)
187
business manager, the understanding of how the new approach to eminent domain may be used provides a new tool to the manager‘s strategic planning model.
REFERENCES
Abbott, P. (2008) The social contract in America: From the revolution to the present age. Lawrence, KS: University of Kansas. Aczel, A. D., & Sounderpandian, J. (2006) Complete business statistics (6th ed.) Chicago: McGraw-Hill Irwin. Arthurs, H. (2005) Public law in a neoliberal globalized world: The administrative state goes to market (and cries wee, wee,
wee all the way home) Univ. of Toronto Law Journal , 55, 797. Bardach, E. (2000) A practical guide for policy analysis: The eightfold path to more effective problem solving. Washington,
D.C.: CQ Press. Bell, A. & Parchomovsky, G. (2006) The Uselessness of Public Use, Columbia Law Review, 106 1412-1426. Benson, B. L. (2008) The evolution of eminent domain: A remedy for market failure or an effort to limit government power and
government failure? Independent Review, 12(3), 423-432. Biais, L. E. (2007) Urban Revitalisation in the Post-Kelo Era, 34 Fordham Urban Law Journal, 657, 680-81. Bonds, M. & Farmer-Hinton, R. L. (2009) Empowering neighborhoods via increased citizen participation or a trojan horse from
city hall: The neighborhood strategic planning (NSP) process in Milwaukee, Wisconsin. Journal of African American Studies, 13(1), 74-89.
Bower, R. S. & Scheidell, J. M. (2009) Operationalism in finance and economics. Journal of Financial and Quantitative Analysis, 5, 469-495.
Cameron, R. (2009) A sequential mixed model research design: Design, analytical and display issues. International Journal of Multiple Research Approaches, 3(2), 140-152.
Castle Coalition, 50 State Report Card: Tracking Eminent Domain Reform Legislation Since Kelo, at http://www.castlecoalition.org/pdf/publications/report_card/50_ State_Report.pdf (last viewed on Aug. 1, 2007)
Census of Governments. (2007) Governments integrated directory, census of governments. Retrieved on January 22, 2101, from http://www.census.gov/govs/www/gid2007.html?submit=Main+Menu
Christensen, T. (2005) From direct ―public use‖ to indirect ―public benefit‖: Kelo v. New London‘s bridge from rational basis to heightened scrutiny from eminent domain takings. Brigham Young University Law Review, 6, 1669-1714.
Citizens United. (2010) Citizens United v. Federal Election Commission. United States Supreme Court, slip opinion, No. 08–205. Argued March 24, 2009; reargued September 9, 2009; decided January 21, 2010. Retrieved on January 30, 2010, from http://www.supremecourtus.gov/opinions/09pdf/08-205.pdf
Cohen, C. E. (2006) Eminent domain after Kelo v. City of New London: An argument for banning economic development takings. Harvard Journal of Law and Public Policy 29, 491-568.
Cohen, J., Cohen, P., West, S.G., & Aiken, L.S. (2003) Applied Multiple Regression/Correlation Analysis for the Behavioral Sciences, 3rd ed. Mahwah, NJ: Erlbaum.
Creswell, J. W. (2003) Research design: Qualitative, quantitative, and mixed methods approaches. Thousand Oaks, CA: Sage Publications. .
Dana, D. A. (2007) Reframing eminent domain: Unsupported advocacy, ambiguous economics, and the case for a new public use test. Vermont Law Review, 32 129-147.
Dernbach, John C. (2009) Progress toward sustainability: A report card and a recommended agenda. Environmental Law Reporter, Vol. 39, 10276-10289.
Dillman, D. A., Smyth, J. D., & Christian, L. M. (2009) Internet, mail, and mixed-mode surveys: The tailored design method (3rd Ed.) Hoboken, NJ: Wiley.
Donziger, A. J. (2007) Property rights – the issue of eminent domain: A legal and constitutional analysis. Retrieved December 15, 2008, from http://sunzi1.lib.hku.hk/ER/detail/hkul/3847722
Eagle. S. J. (2009) Supreme court economic review symposium on post-Kelo reform: Kelo, directed growth, and municipal industrial policy. Supreme Court. Economic Review, 17, 63-95.
Eagle, S. J., & Perotti, L. A. (2008) Coping with Kelo: A potpourri of legislative and judicial responses. Real Property, Probate and Trust Journal, 42(4), 799-851.
Enticott, G. & Walker, R. M. (2008) Sustainability, performance and organizational strategy: An empirical analysis of public organizations. Business Strategy and the Environment, 17, 79-92.
Fowler, J. F. (2009) Survey research methods, 4th Ed. Thousand Oaks, CA: Sage. Garnett, N. S. (2007) The neglected political economy of eminent domain. Michigan Law Review, 90(2), 89-104. Gerston, L. N., & Sharpe, M. E. (1997) Public policy making: Process and principles. Armonk, NY: Questia Media. Groves, R. M., Fowler, F. J., Couper, M. P., Lepkowski, J. M., Singer, E., & Tourangeau, R. ( 2009) Suvey methodology, (2nd
Ed) Hoboken, NJ: Wiley.
A Quantitative Analysis of the Public Administrator‘s Likely Use of Eminent Domain after Kelo
188
Hill, C. & Jones, G. (2007) Strategic management: An integrated approach. Minneapolis, MN: South-Western College Publishers.
Hunsley, T. M. (1992) Social Policy in the Global Economy. School of Policy Studies Queen's University. Ontario: Canada. Jick, T. (1979) Mixing qualitative and quantitative methods: Triangulation in action. Administrative Science Quarterly, 24, 602-
611. Kelo v. City of New London, 545 U.S. 469 (2005) Kiker, G. A., Bridges, T. S., Varghese, A., Seager, T. P., & Linkov, I. (2005) Application of multicriteria decision analysis in
environmental decision making. Integrated Environmental Assessment and Management , 1 (2), 95–108. Lando, T. (2003) The public hearing process: a tool for citizen participation, or a path toward citizen alienation? National Civic
Review, 92(1), 73–82 Leech, N. L., Barrett, K. C., & Morgan, G. A. (2004) SPSS for immediate statistics: Use and interpretation (2nd ed.) Mahwah,
NJ: Lawrence Erlbaum Associates. McFarlane, A. G. (2009) Rebuilding the Public-Private City: Regulatory Taking's Anti-Subordination Insights for Eminent
Domain and Redevelopment. Indiana Law Review, 42, 97-119. Mihaly, M. (2007) Living in the past: The Kelo court and public-private economic redevelopment. Ecology Law Quarterly , 34
(1), 3-60. Morriss, A. P. (2009) Supreme court economic review symposium on post-Kelo reform: Symbol or substance? An empirical
assessment of state responses to Kelo. Supreme Court Economic Review, 17, 237-264. Nussbaum, M. (2004) Beyond the social contract: Capabilities and global justice. Oxford Development Studies, 32(1), 4-18. Olejarski, A. M. (2009) Whose Hand to Hold? How Administrators Understand Eminent Domain and Where They Turn for
Guidance. Retrieved on January 22, 2010, from http://scholar.lib.vt.edu/theses/available/etd-12182009-080440/unrestricted/Olejarski_AM_D_2009.pdf
Paul, E. F. (2008) Property Rights and eminent domain. Edison, NJ: Transaction Publishers. Pearce, J. & Robison, R. (2008) Strategic Management: Forumulation, Implementation, and Control. New York: McGraw-Hill. Render, B., Stair, R. M., & Hanna, M. E. (2008) Quantitative Analysis for Management, 10th Ed. New York: Prentice-Hall. Rodrigues, V. S., Piecyk, M, Potter, A. McKinnon, A., Naim, M. & Edwards, J. (2010) Assessing the application of focus groups
as a method for collecting data in logistics. International Journal of Logistics Research and Applications, 13(1), 75-94. Rohr, J. A. (1989) Ethics for bureaucrats: An essay on law and values. New York: Marcel Dekker, Inc. Salkin, P. (2006) Eminent Domain Legislation Post Kelo: A State of the States, Environmental Law Reporter, 36, 10864-10898. Simon, H. A. (1997) Administrative behavior: A study of decision-making processes in administrative organizations. New York,
NY: The Free Press. Staley, S. R. & Blair, J. P. (2005) Eminent domain, private property, and redevelopment: An economic development analysis.
Retrieved November 22, 2006, from http://www.reason.org/ps331.pdf Then, D. S. (2003)Integrated resources management structure for facilities provision and management. Journal of Performance
of Constructed Facilities, 17 (1), 34-43. Turabian, K. L. (2009) A manual for writers of research papers, theses, and dissertations, 7th Ed. Chicago: University of
Chicago Press. Utts, Jessica M. (2005) Seeing Through Statistics 3rd Edition, New York: Thomson Brooks/Cole. Van Wagner, K. (2009) Introduction to research methods. Retrieved May 14, 2010, from
http://psychology.about.com/od/researchmethods/ss/expdesintro_5.htm Wheeler, S. (2009) Using research: Supporting organizational change and improvement. Business Information Review, 26(2),
112-120. Zikmund, W. G. (2003) Business research methods. Mason, OH: Thomson South-Western.
N. L. Wu, Y. Parfenyuk, A. S. Craig and M. E. Craig IHART - Volume 16 (2011)
189
LEANING THE WORK PLACE AND CHANGE MANAGEMENT: SOME SUCCESSFUL CASE IMPLEMENTATIONS
Nesa L’abbe Wu1, Yana Parfenyuk2, Anita S. Craig3 and Mayble E. Craig4
1Eastern Michigan University, USA, 2Deloitte & Touche LLP, USA, 3University of Michigan Hospital, USA and 4Howard University Hospital, USA
ABSTRACT
Many companies have spent huge amounts of dollars in an effort to ―lean out‖ their businesses and their processes. They have not all been very successful, falling back into their old habits and ways of operation. This paper explores what makes lean implementation a success and presents guidelines to both the manufacturing and the service industry on how to successfully implement a 5S program and how to re-engineer a process. Though lean consultants agree that there is no ―cookie cutter‖ approach to lean out all organizations, their remarks and our study of a diverse set of successful implementations yield the following ingredients for success: change management, management leadership and support, team building and training, worker/management compromises, auditing by generating and analyzing improvement metrics and statistics, a continuous improvement process and financial resources. Because change management lies at the heart of this success, its obstacles that must be overcome are explored and discussed. How to implement change management, together with other key components for success, are presented. The paper narrates to the reader five diverse, somewhat unusual successful case applications that followed these established guidelines (a 5S implementation in a mining company to better manage and control inventory; an implementation of lean principles at Kreisler Manufacturing to improve quality and productivity; a re-engineering of an admission process at the U of M Hospital via VSM; a 5S implementation to reduce nursing documentation; and a 5S implementation and process re-engineering via VSM to improve and consolidate maintenance planning in a multiple location time share resort company) and references a novel, thought provoking implementation of the 5S program for thought organization/proposal formulation. Keywords: Lean Principles, 5S Program, Value Stream Mapping, Change Management, Six Sigma, Process Re-
Engineering, Management Leadership, Lean Case Implementations, Hospital Process Improvement, Nursing Document Reduction.
INTRODUCTION
Whether it is an office or a manufacturing floor, a work place needs to be organized. A work area should be laid out properly and standardized work procedures followed so that all employees can perform their jobs in the most efficient manner. If not, some type of non-value added activity could be identified. Hence, all employees ought to perform their jobs using the principles of a lean work place: a workplace that is organized; that is properly laid out; that has lean standardized work procedures or process steps; and that exhibits respect towards the workforce.
Work Place Organization
Work place organization is defined as a safe, clean, neat arrangement of the work place. One must provide for a specific location for everything that is needed and we must eliminate anything that is not required to do the job. The principles used for the organization of the work place are defined by the 5S program or system. The 5S program was initially introduced in Japan and represents five Japanese words: seiri for sort, seiton for straighten, simplify or set in order, seiso for shine or scrub, seiketsu for standardize, and shitsuke for sustain or self-discipline. They relate to housekeeping: organizing, cleaning, maintaining and sustaining a clean workplace. This deceptively simple, yet very powerful, program is supposed to work as follows. Sort what is needed and what is not needed. What is not needed must be eliminated from the work place. When you are in doubt, throw it out. When implementing this principle you will get rid of excess waste, thus gaining significant space. In order to separate the needed items from the unneeded items you can use red, green and yellow tags. Use the red tags for unneeded items (these are the items that need to be eliminated, tossed out); use the green tags for items that are needed and must be kept in the immediate area; and use the yellow tags for items you do not need all the time and must not be kept in the immediate area. You must designate a person to organize this activity and to manage the consolidation.

Leaning the Work Place and Change Management: Some Successful Case Implementations
190
Set in order what must be kept. Make what is kept visible and self-explanatory, so everyone knows where everything goes. There must be a designated place for everything and everything must be set in its place. Use an appropriate and logical filing system for your paper work and organize your physical inventory so it can easily be retrieved, used and put away. Organize your inventory so that the first-in-first-out (FIFO) rule can be used. Place all items close to point of use. Vertical storage is preferred over horizontal storage; store similar items together and different items on different levels. Consider color coding and labels. Scrub and Shine everything that remains. Like you clean equipment and tools, clean the work place and keep it shining. This leads to Standardization. Standardization requires discipline, sticking to the rules of organization and making these rules a habit. Set up some standardized procedures to sort and straighten in a timely fashion, so that the above 3Ss can be maintained. It will be necessary to schedule this into regularly assigned work duties. A proper standardized procedure will prevent unneeded items to accumulate and thus falling back into unacceptable habits. Sustain, through self-discipline, an organized workplace to avoid future problems. Do not allow yourself to fall back into old habits. You may want to use visuals to sustain the 5S program: label filing cabinets, restrict the space of labeled inventory areas, etc. Unless time is integrated into the work schedule, the 5S program will fall apart. Management must support this effort, perform regular audits and recognize great efforts through a reward system. This 5S system is a powerful system that companies around the world are using to eliminate waste, dirt, clutter, inefficiency and other stumbling blocks to excellence. This system is not just about housekeeping. Implementing it is not easy and requires a thoughtful process, good leadership and management capabilities. Both companies and the workers benefit from a good 5S program. Workers find they are working in a more pleasant work environment and find their jobs more satisfying. This gives them more pride in the workplace and generates a positive mental attitude. Their jobs become easier to execute because the procedures make sense. The bottom line is that the workers are spending less time on tasks and are able to perform tasks to perfection. Companies will experience improved maintenance and increased work quality. These generate cost reductions and increased profitability. It ultimately leads to increased customer satisfaction.
Standardized Work Procedures and Process Re-engineering
The work place principle of standardized work requires that operations be safely carried out with all tasks organized in the best-known sequence and by using the most efficient and effective combination of resources. Resources include, but are not limited to people, materials, methods and machines. In other words, the way all operators are performing their tasks must be standardized. This implies that the best way to perform a task or execute a process must be determined. In determining the best way, one must focus on eliminating non-value-added tasks, while improving customer satisfaction. Once this best method is determined all operators involved in performing the tasks must be trained. This leads to standardized work. Standardized work procedures require the performance of work studies. Work study is, first of all, the systematic investigation and analysis of contemplated and present work systems and methods in order to formulate the most effective systems and methods for achieving necessary functions. It is also the establishment of measurement standards by which this work may be planned, scheduled and controlled (Reuter, 180, p. 1). It includes work measurement, motion time study, methods engineering, work simplification, work design and value stream mapping. Its objectives are to search for the best methods, to determine operation time standards and above all to improve customer satisfaction. Work study and measurement are necessary to aid in determining manpower requirements, to evaluate plant or department efficiency, to calculate productivity indexes, to determine machine/operator utility, to establish time standards and time allowances, to allocate cost, to schedule work, to evaluate alternate methods of operation, to define an acceptable day's work, to balance operations and work and to lean out the productive system while focusing on customer satisfaction. Introduction of standardized work procedures dates back to the early 1900s when Frederick W. Taylor, who is believed to be the father of scientific management, introduced standardized work procedures at Midvale Steel Company, where at the age of thirty-one, he became chief engineer. He strongly believed that it was the responsibility of management to develop spirit and hearty cooperation between workers and management to develop and sustain standard work procedures. He also suggested that the greatest obstacle to harmonious cooperation between the workman and the management lay in the ignorance of
N. L. Wu, Y. Parfenyuk, A. S. Craig and M. E. Craig IHART - Volume 16 (2011)
191
management as to what really constitutes a proper day's work for a workman (Taylor, 1929, p. 52). In an attempt to improve the spirit and hearty cooperation between workers and management, Taylor received permission and financial support to conduct a scientific study of the time required to do various kinds of work in the Midvale Steel Company. Taylor's main objective in this study was to ―learn what really constituted a full day's work for a first class man; the best day's work that a man could properly do year in and year out, and still thrive.‖ Successful implementations of a 5S improvement program; standardized work; and re-engineering processes require the implementation of change management. It is commonly known that organizations that have introduced the lean principles of workplace organization and change management have re-engineered many of their processes, thus significantly improving the level of their product/service quality. These are the companies who were also able to introduce and implemented lean six sigma (LSS).
CHANGE MANAGEMENT
An organization undertaking the implementation of improvement programs based on lean principles should recognize that, while it may seem easy enough to contemplate changes to a factory layout or changes in a process or procedure, those changes will affect all the employees who work in or interface with that place or process. As such, the opportunity for successfully implementing an improvement program will be increased if thought and planning regarding change management take place at the very beginning. APICS defines change management as a ―business process that coordinates and monitors all changes to the business process and applications operated by the business as well as to their internal equipment, recourses, operating systems, and procedures.‖ Its purpose is to ―minimize the risk of problems that will affect the operating environment and service delivery to the users‖ (APICS, 2010, p. 22). To successfully implement change the organization must overcome obstacles because of the legal environment of the operations; financial situations and economic conditions; company policies and procedures; the organizational structure and culture; the IT environment; and people‘s natural resistance and tolerance level to change. Legal Environment. Organizations operate in an environment where legal or institutionalized constraints may slow down the change. If the environment is unionized, the labor contract may stipulate that any change to the nature and scope of work must be negotiated with the union. Although, respecting any contractual requirements to ―meet and confer‖ are mandatory, union‘s interest is usually to protect and preserve jobs, and they recognize that staying competitive in a globalizing environment is necessary if they are going to succeed in their mission. Financial Situation and Economic Conditions. Recent changes in regulations of financial activities impact change management. As a response to accounting scandals such as Enron and WorldCom, Congress enacted the Sarbanes-Oxley Act of 2002, which is the most important and influential security legislation since the Security Exchange Act of 1934 (Nazareth, 2006, p. 134). Since the inception of this legislation, sections 302 and 404 of the Act have influenced organizations‘ operations and triggered the need for changes in public companies. Section 302 requires the CEO and the CFO of public companies to certify the appropriateness and fairness of financial statements and disclosures (Marden, 2003, p. 36), while section 404 requires management of public companies to perform assessments of their internal controls and control environment. For many organizations conformance with those requirements, in short term, means an increase of paperwork and implementation of additional activities, which interfere with the principles of lean manufacturing and the concept of non-value added activities elimination. However, in the long run, developing a strong control environment may contribute towards achieving standardization and simplification of the processes and thus indirectly contributes to sustaining a lean business. A strong, as well as a weak economy may influence change management: on one hand it may slow down change, and on the other hand it may increase the need for change. When the economy is strong, management focuses on developing strategic goals, increasing market share, implementing new technologies, and introducing new products. These translate into an increase of complexity of operations as well as a need for change (deCamara, 2008). It is relatively easy to promote ideas and justify budgets for change implementation when the economy is strong. However, the complexity of the operating environment may slow down change and increases the need for financial resources required for implementation. Since all organizations have limited resources, financial implications of the changes need to be considered, and a cost-benefit analysis for all changes should be performed at the onset of the implementation stage. During tight times, businesses must focus on simplification to stay competitive (deCamara, 2008). Currently the economy is in one of the longest recessions since the Great Depression. In February 2009 consumer confidence level in the United States decreased to 25.0 from an average of 58.0 in 2008 (1985=100) (Kutyla, 2009, p. 4). For many companies it means decrease in

Leaning the Work Place and Change Management: Some Successful Case Implementations
192
sales, operations, and income, and increase in inventory. In this situation, many organizations shift their focus to survival and ―freeze‖ implementation of the change until ―better times.‖ However, slow time is the best time for the change implementation. During the recession, operations are at the lowest point, which means that some resources can be allocated to the change implementation effort without the need to compromise current production activities. For example, average capacity utilization in U.S. manufacturing industry in February 2009 was 66.7 percent as compared to an average of 78.9 percent in 2008 (Kutyla, 2009, p. 4). Low utilization provides flexibility, reduction in lead time, and opportunity for change and process improvement. Also, difficult financial situations may trigger the need for change in some organizations. For example, realignments and structural changes in companies may increase the need for process change due to lack of personnel. This is often labeled ―spontaneous‖ change management. If it is handled in an organized manner, it can improve processes and contribute to enlargement or empowerment of the jobs. Policies and Procedures. Policies and procedures are the rule of organization‘s operations. They should be communicated to the personnel of the company to ensure that people understand their roles and that processes are carried out consistently throughout the organization. Policies and procedures may impact change management in following ways. Firstly, existing rules may slow down the change. For example, governmental and quasi-public non-profit organizations (special districts, hospitals, public universities) often have policies and procedures in place that slow down the pace of change, because citizens generally don‘t want a rapidly changing government. These types of constraints may take forms such as public bidding procedures; system of purchases or contract approvals over a certain amount by the governing board; laws that allow any action by a board to the contested within 30 days, or laws that any new ordinance (law) passed by a board may not go into effect for 60 days. In fact, in addition to their role as public policy makers, the significant other role of public institution boards is to provide fiduciary oversight to the organization, and this is usually focused on constraining anyone in the organization from doing anything too crazy too quickly. Secondly, absence of documented policies and procedures may restrict a company‘s ability to implement change successfully. Formulating and documenting of policies and procedures may be a time-consuming process, but it is a prerequisite for standardization. Unfortunately, some companies undervalue the importance of developing documented policies and rely on oral agreements about operations, which may lead to confusion amongst the participants of the process. Change management starts with realizing that there is a need for change. Documented policies and procedures are essential during this stage. They reflect the current processes and can be used as a starting point for change. It is very hard to change the processes if it is unclear what the processes are. Organizational Structure. Organizational structure may significantly impact change management. For successful implementation of change appropriate authorities must be granted. A hierarchical corporate structure may delay the implementation of change and negatively impact the effectiveness of change management. For example, to purchase new tooling equipment which is required for the change implementation the U.S. subsidiary company may have to send a request to the foreign parent corporation. It usually takes 6-8 months to get approval for the purchase, and the project may be delayed. To compete in a fast-paced environment, companies should reduce the lead time and eliminate delays in change implementation by providing necessary authorities to the change management team and flatten the organization structure. The cultural differences also play an important role in change management. For example, in collective cultures such as Japanese, workers are more submissive to the ideas than those in individual cultures such as American, which slows the process of change implementation. The drawback of high level of submissiveness is that the change may not be challenged at early stages and some opportunities for improvement may be missed. IT Environment. The IT environment needs to be considered during the change implementation as well. One of the common mistakes made by manufacturing departments is planning change and deploying lean without getting IT involved. The non-involvement of IT can contribute to ―lean dip‖ or stagnation of the continuous improvement process. The role of the IT function is to support the operations and generate statistical information for analysis. Companies practicing the kaizen philosophy sometimes undervalue the importance of the IT department in change management due to the supporting nature of the function (Katz, 2008, p. 33). Human Factors. The human factor is the key to change management. In general, people do not like the uncertainty surrounding any change. Workers may resist change because they do not understand the objectives of change or how it will impact their job. However, people operate on a continuum of change tolerance. It is important to note that while some employees will embrace and even drive change; others will resist change, even to the point of leaving if the changes are too dramatic and/or happening too fast. Minimizing the loss of such employees is very important, because recruitment is one of the
N. L. Wu, Y. Parfenyuk, A. S. Craig and M. E. Craig IHART - Volume 16 (2011)
193
most disproportionally costly thing an organization can do, and that is not lean. So, the goal of change management is to go lean by achieving sustainable change while retaining employees. Many people have tried to change others, but have failed miserably doing so. The only reliable way to ―change people‖ is by helping them to learn so that they can change themselves. This is where training comes in. Good training in all aspects of the job in context of a lean, organized work place with standardized tools, methods and procedures is vital to accomplish this change. Sufficient time and resources must be allocated to such training. Every change involves two groups of people: the team, implementing change, and the users impacted by change (Grasley, 2007, p. 30). Top down changes are perceived to be easy, are common, and have the patina of being efficient. The problem is that they are not necessary any of those things. Change management ―will fail unless most of the organization understand, appreciate, commit and try to make the effort happen‖ (Stanleigh, 2008, p. 36). To succeed in the implementation process changes must be organic and grow from the ground up. Sustainable change that grows from the ground up is best accomplished through the formation of groups of diverse membership. Bringing the right team to the table is one of the key aspects of change management. A cross functional team serves this purpose best. The team should consist of managers of all departments which will be affected by the change. The change implementation effort should be supported by people who have the authority to implement change and people who have knowledge of the operations to ensure that change improves the process. Therefore, all personnel should be actively involved in the change implementation process for three reasons. Firstly, floor workers are the people, who understand the process best. They perform tasks on a routine basis and can be very helpful in identifying the weaknesses and non-value added activities of current processes. Secondly, ―you can lead a horse to water, but you cannot make it drink.‖ The team should ensure that changes are carried out consistently throughout the organization. However, it is the workers who will have to actually implement change and incorporate it in everyday activities. Thirdly, people are more likely to accept change if they are part of that change. The employee job satisfaction is directly correlated with how much of a sense of control they have about their work and their work environment. Involving workers in the change implementation process will contribute to empowerment of the jobs and will make change implementation organic.
IMPLEMENTING CHANGE MANAGEMENT
There are many ways to implement change. One of the most effective approaches today is the ADKAR model developed by Prosci. The ADKAR model for change management consists of five elements: Awareness, Desire, Knowledge, Ability, and Reinforcement. Each element is critical for success of change implementation. It is important to ensure that sufficient attention is given to each aspect of the model. People in the organization need to be aware of change. They need to understand the reasons for change and its benefits to be willing to accept change. Appropriate information and skills as well as practical ability must be possessed by the team and people who will be affected by change. Reinforcement of change must be performed by the team (Sande, 2009, p. 29). Vision is the roadmap that ―clarifies the direction in which an organization needs to move‖ (Kotter, 1995, p. 63). The role of the leader is to articulate the vision for the future, which should include change implementation steps that are in alignment with overall organization goals (Stanleigh, 2008, p. 36), while the role of the team is to figure out how to get there. The team leader must ensure that the impact of change is identified, that change is communicated to all levels of employees, and that organizational alignment is gained (Grasley, 2007, p. 30). Trust is a key predictor in the success of change implementation (Long, 2008, p. 30). Furthermore, the leader should inspire people and ensure that the team and employees are confident about change. Once the teams understand what the vision state looks like and embrace it, they will probably be more creative, more effective, and more committed to creating that vision than anything management could accomplish with a top-down change mandate. This is when employees really feel empowered in their jobs! The role of the team is to reinforce cooperation with timely and practical messages (Gotsill, 2007, p. 26). The implementation of change does not happen overnight. The team needs to ensure that key people in the change implementation process are freed up from existing responsibilities so they can concentrate on the new effort. It is the job of the team to manage the budget and find ways to remove obstacles, which may impact the change implementation process (Stanleigh, 2008, p. 37). Additionally, continuous monitoring of the implementation process is necessary. The team needs to ensure that a feedback system that provides information from the floor is in place (Gotsill, 2007, p. 26); that analysis of the collected data is performed; and that corrective actions are taken in a timely fashion.
Leaning the Work Place and Change Management: Some Successful Case Implementations
194
Research by PricewaterhouseCoopers cites that the lack of change management skills in middle management, the core of the change team, is indicated as a barrier to change by 66 percent of executives (Woodward, 2007, p. 65). It must be understood that people can change things, but they cannot change other people. The only reliable way to ―change people‖ is by helping them to learn so that they can change themselves. Training is the key in this process. According to the American Society from Training and Development (ASTD), U.S. companies spent on average 2 percent of their payroll on training and education (Maylett, 2007, p. 58). Successful organizations allocate between nine and 17 percent of their payroll for training and change management (Gotsill, 2007, p. 27). In our modern fast-paced business environment, companies realize that skilled and knowledgeable employees and managers with strong problem-solving abilities are key for success in the market place. However, training and education expenses are sensitive to economic and financial fluctuations, and they are one of the first expense categories which organizations cut during downtime. When a company is in a tight financial situation, the goal of management is to find alternative cost-effective ways to provide necessary tools and knowledge to the employees. For example, organizations can focus on training programs by providing relatively cheap online courses or encourage self-study sessions of relevant educational materials. Good training in all aspects of the job in context of a lean, organized work place with standardized tools, methods and procedures is vital to accomplish the change. Therefore, organizations must realize the importance of such training and allocate sufficient time and resources to accommodate for change management. Recovery should be an integral part of any change management implementation process and should not be skipped. Just like your muscles that break down and sustain damage because of an intense workout need a day of rest to recover and rebuild stronger before the next workout. So does the organization undergoing change needs a recovery period. Sustained continuous change without respite will do more damage than a period of intense change followed by a period of status quo.
LEAN SIX SIGMA AND QUALITY MANAGEMENT
In the early 1950s, as W. Edwards Deming shifted the focus of mass production from quantity to quality he was regarded as the father of total quality management (TQM). Throughout the 80s the effectiveness of TQM was improved upon through the implementation of the six sigma process that was created by Dr. Mikel Harry. This six sigma process is a disciplined application of statistical problem solving tools that points towards wasteful costs and provides for precise steps for improvement. The six sigma process is designed to reduce costs that are associated with waste and defects in product or processes. Cost reduction is achieved by quantifiably identifying all factors that lead to defects, so that they can be adjusted and a near perfect level of quality can be achieved. APICS defines six sigma as ―a methodology that furnishes tools for the improvement of business processes. The intent is to decrease process variation and improve product quality‖ (APICS, 2010, p.140). Six sigma represents an extreme level of high quality. It aims at virtually eliminating defects from every product and process within an organization. Six sigma (6σ) stands for optimal quality, such as 3.4 defects per million. The Greek symbol ―σ‖ represents the variation, or the number of standard deviations, from the specification limits to the mean of a process. The number of allowable defects per million items produced decreases, as the number of sigma‘s increases. Original statistical control charts for variable and attribute control are based on the concept that customers‘ specifications are within three standard deviations of the mean. In other words, variation in production is controlled within 3 standard deviations (3σ) of the mean. For attribute sampling this means that approximately 668,076 defects are acceptable in one million parts. In the 80s, so called ‗average‘ companies started to operate at about four sigma (4σ), or approximately at 6,210 defects per million. The level of improvement that occurs between the ‗average‘ company of the 80s and the company that is at six sigma is astounding: 3.4 defects versus 6,210 defects per million. Six sigma was first implemented in the early 1980s at Motorola. With an amazing return on investment Motorola claimed that six sigma reduced in-process defect levels by a factor of 200 and that it reduced manufacturing costs by 1.4 billion dollars. The stockholders saw a fourfold increase in their share value. Other companies, such as Texas Instruments, Nokia, General Electric, Allied Signal, DuPont, and Sony, soon recognized Motorola‘s success and they too started to implement six sigma with amazing returns on investment. Quality at the six sigma level -together with streamlined processes, work place organization, standardized work procedures and other lean principles- improved yield, decreased operating expenses and increased market share. The six sigma process provides for constantly measuring, continuously reducing defect levels, enhancing process capabilities and thus ensuring continuous improvement. The ultimate benefit of the six sigma and lean methodologies are increased customer satisfaction. For the company it fuels company growth, increased operating margins, expanded cash flow and reduced working capital requirements. It also frees up production capacity and enhances growth when the economy is not doing well.

N. L. Wu, Y. Parfenyuk, A. S. Craig and M. E. Craig IHART - Volume 16 (2011)
195
Regardless of its application, the successful 5S program implementation approach requires a well thought out six sigma level process improvement plan. The development of that process is key to the success and sustainment of the 5S program
PROGRAM IMPLEMENTATION GUIDELINES FOR LEANING THE WORKPLACE
Lean consultants agree that there is no cookie cutter approach or set process that works for all organizations. Lean consultants‘ remarks and the study of various successful implementations of lean principles yield the following implementation guidelines. These implementation guidelines have not only been proven to be very successful in manufacturing companies, but have also been highly effective in service companies. They have been used by practitioners as a first step towards leaning out various companies such as: processing plants, parts and tool manufacturers, mining companies, assembly plants, hospitals, medical offices, resorts, hotels, etc. Some of these implementations are briefly described in this paper.
5S Program Implementation Guidelines
Before implementing a 5S system a company must set objectives, build teams and train these teams.
The ultimate goal that companies must set is that personnel are maintaining all 5S standards with no direction from their supervisors and they are active in devising ways to improve workplace organization. Implementations attempts showing any other reasonable lower level goal, like where Sort, Straighten and Shine requirements are met and where personnel are maintaining all 5S standards with direction from their supervisors have lead towards failure of the 5S implementation System.
In order to attain the high level of success following requirements must be met: management leadership and support; change management; worker/management compromises; team building and training; auditing; financial resources; and creating and using lean metrics.
As it relates to implementing the 5S process Steve Lage, President of PDG Consultants, Inc defines leadership and management6 as follows. ―Leadership is the ability to communicate and inspire others towards vision for an improved future state. Leadership involves working on the process or status quo in an effort to improve it. It requires personal passion, courage, patience, and commitment‖. He says that ―leaders who embed 5S into the culture have demonstrated their ability to create employee mindsets that are aligned with ideals and principles that serve the organization and the customer. This is leadership in its purest form‖. He is talking about a ―5S system that people want to be part of‖. Lange says that ―Management is the skill to ensure that maximum results are obtained from the existing process or situation. It entails effectively setting expectations, establishing timely and accurate feedback systems, and having the discipline, tactfulness, and courage to respond quickly and appropriately to out-of-control situation. Management is all about working within the process or current situation. It requires discipline, courage, personal skill, and commitment‖.
A reasonable amount of training is necessary. Workers must be introduced at least to the concepts of Lean, waste reduction, Total Quality Management (TQM) and the 5S system. Appropriate teams must be formed.
A good auditing system, with the aim to continuously improve the system if needed, is essential for a successful implementation. This can be aided by developing good lean metrics. APICS define lean metrics as ―a metric that permits a balanced evaluation and response-quality without sacrificing quantity objectives‖. These metrics include financial, behavioral, as well as core-process performance metrics (APICS, 2010, p. 79).
Initially workers may not be very anxious in participating in a 5S process. It may be difficult for the company to break workers paradigms. However, after good training and involvement of managers and supervisors will the workers understand the importance of the process and become committed to the task. After the formation of teams and at the conclusion of their training schedules for the implementation must be developed for each of the five phases of the program.
Phase 1: Sort what is needed and what is not needed. The main objectives of this phase are to identify all items that are not required to do the job and to remove these items from the work environment, so that work can now be performed without obstacles or unnecessary delays.
This housekeeping activity places items in the ‗necessary‘ and the ‗unnecessary‘ categories. For the ‗necessary‘ group a ‗goal number‘ must be set (allowing for a maximum number of items to be present). The practical approach here is to remove any item that would not be used within a certain number of days.
6 Based on email correspondence 9/8/2009 -12/8/2009.
Leaning the Work Place and Change Management: Some Successful Case Implementations
196
For physical inventory this can be accomplished using a ‗Team Blitz System‘ and a ‗Red/Green/Yellow Tag Event‘. The ‗Team Blitz System‘ requires that all personnel work as a team as they try to identify excess supplies, obsolete forms and materials, broken or excess tools, broken or unused gauges, outdated work instructions, defective parts, excess furniture, excess or obsolete equipment, unused cleaning materials, trash, etc... Companies often underestimate the critical nature of an effective, ongoing Red Tag process. It is very hard for some people to part with items they believe have value, even though that value may not pertain to the area undergoing a 5S process. A working Red/Green/Yellow Tag process offers these folks a means for getting the item out of their area, while still recycling it to a place where it can add value. A predetermined amount of time must be given to the teams to place green/red/yellow tags on the items in various areas. At the end of the period all red tagged items must be removed and disposed of with the supervisor‘s approval. Yellow tagged items normally require more investigation before removal is approved (Brimeyer, 2008). Phase 2: Set in Order what must be kept. The objective here is to place every item in its place. This implies that the team, after removing unnecessary items from the workplace, has to place and demarcate all necessary items in the workplace; has to label all shelves and storage units; has to arrange all items so that they can easily be found, used and replaced. All users of these items must be informed and trained on the storage system in use, the labeling system introduced, and the procedures for storing and selecting items for use. Brimeyer suggests that ―Leaving more space than required to store only necessary items is a frequent oversight with the Set in Order phase. There‘s some truth which can be applied to the work area from Boston‘s Irreversible Law of Clutter which states, ‗In any household, junk accumulates to fit the space available for its storage‘‖ (Brimeyer, 2008). As part of the housekeeping activity of Sort the team must assign a ‗goal number‘ to the ‗necessary‘ group or the items that are kept in their work space. In other words one must define the maximum amount of items to be present in their space. Additionally they must place and demarcate all items so that they can easily be found, used and replaced (shelves are labeled). Phase 3: Scrub and Shine everything that remains. The objective here is to get a clean, safe and comfortable workplace, so that the production of goods and services are facilitated. At the same time machines, equipment and tools must be evaluated for quality performance and if deemed necessary maintenance must be performed. Phase 4: Standardize. The objectives here are to establish and standardize the procedures and routines of daily maintenance of the workplace, its equipment, machinery, and others; to have the opportunity to participate and collaborate with individual and collective creativity to improve the quality and safety of the work environment; and to establish a quick and effective visual control of the conditions of the workplace, equipment and machines. Standards cannot be vague so they are only useful to its author. Visual controls can be used as examples showing what is acceptable and what is not. In order to implement standardized routines for areas common to more than one group (specialty tool areas, file storage rooms, hazardous materials rooms, computer software, files and break areas, etc.) the various teams must have meetings to assign responsibilities to these areas. A chart must be developed listing these common areas and responsibilities must be assigned on a rotating basis. In order to facilitate rotation and minimize effort, names that can easily be removed for rotation purposes must be applied to the chart (this can be done by using Velcro). Phase 5: Sustain through self-discipline. The objectives of this phase are to get everybody on board to practice the previous steps on an ongoing basis; to motivate all workers to sustain the accomplishments through creation of a high culture of cooperation and teamwork aimed at doing things right and better all the time; and to have management and supervisors show leadership through their good examples. Because of the importance of this phase, auditing and a policy of housekeeping must be introduced. Initially this may consist of the following: a 5 minute, twice a week team meeting to recall the concepts of the 5S system; monthly rotation of responsible people and adjustments of the charts; weekly three hour housekeeping of selected areas with participation of plant manager, supervisors, area workers and invited workers from other areas. An auditing team must be formed for each area and each area must initially be audited on a weekly basis. Over time the auditing frequency can be reduced. The auditing system is based on the previously listed four areas of workplace organization. The auditing team preferably consists of at least the division manager, area supervisor, and one area worker. Remember, though, that these audits are a waste of time if supervisors and managers have not been able to change behaviors through changing the way employees think. Anything short of this will result in managers being busy fire fighting to comply with change.
N. L. Wu, Y. Parfenyuk, A. S. Craig and M. E. Craig IHART - Volume 16 (2011)
197
It helps if the auditing process implements a recognition program. Most companies that successfully implement a 5S system recognize all their participants during a special public event. At that time the general manager of the company may award a special price to all outstanding participants. When asked about best practice when it comes to starting a 5Ss program Steve Lang suggests the following: ―Start small, keep the focus tight and confined to one manageable area. Go an inch wide and a mile deep. Raise the level of 5S so high that people can‘t help but notice. Develop and practice sustainment skills before you begin work in the next area. It does you no good to run rampant through the factory or office if you can‘t sustain. Use your success to set 5S expectations for all areas of the business and move through the entire company one step at a time‖. ―Remember‖, he says, ―the most challenging and important part of 5S is to change behavior‖.7
Re-engineering Implementation Guidelines
One of the most valuable lean tools used for re-engineering inefficient processes and procedures is value stream mapping (VSM). VSM has been used in all industries, both manufacturing and service industries, and is now being used on a large scale in hospitals for improving their processes and procedures. It is a process utilized to steer from a current inefficient process to a future lean process environment. The process of value stream mapping begins by documenting the flows (both material and information flows) of the existing process in a ―current state map‖. Analyzing this current state map, while implementing lean improvement techniques leads towards a ―future state map‖. These maps are visual representations of the processes and procedures necessary to execute a series of goal oriented tasks. A VSM shows ―why‖ things are happening in the process sequence, rather than ―what‖ and ―where‖ things are happening like in a detailed flow process chart. Improvements are made by addressing the ―five whys‖. According to APICS: ‖Common practice in total quality management is to ask ―why‖ five times when confronted with a problem. By the time the answer to the fifth ―why‖ is found, the ultimate causes of the problem is identified‖ (APICS, 2010, p.57). Just like for the 5S improvement system, successful implementation of process improvement via value stream mapping require team building and training; change management; management leadership and support; worker/management compromises; auditing by generating and analyzing improvement metrics and statistics; and financial resources.
SOME SUCCESSFUL CASE IMPLEMENTATIONS
Here we will briefly present some highlights of diverse and successful implementations of the 5S system and the re-engineering of processes via VSM that used the implementation guidelines that are highlighted in this paper.
A Mining Company8: 5S Implementation to Better Manage and Control Inventory.
A mining company producing copper concentrate in their processing plant implemented the 5S system. Its purpose was to better manage and reduce its inventory on the shop floor. Here are some of the highlights of their implementation. Their 5S system implementation went through various phases: Setting an objective, team building and training; Classifying so they could sort out and keep what is needed; Creating order resulting in straightening what must be kept; Cleaning and shining the worksite; Standardizing; Sustaining through self-discipline; Auditing through visual inspection; Rewarding at project closure; and Implementing a continuous improvement program. In order to achieve the highest level of success, management was committed to show leadership and support, was willing to compromise, introduced change management, created an auditing system, and contributed financial resources. Additionally workers were introduced to the concept of total quality management (TQM) and the 5S system. Four teams, consisting of people from maintenance and operations, received two days of introductory training, followed by two months of detailed training. Once people were committed to start the implementation process, schedules were developed. Initially workers were not very keen on participating in this process. It was difficult for the company to break workers paradigms. Only after good training and involvement of managers and supervisors did the workers understand the importance of the process and became committed to the task. They used the ‗Team Blitz System‘ to successfully perform all phases of the program.
7 Based on email correspondence 5/1/2009. 8 Based on an unpublished research paper; upon request author and company name are not mentioned.

Leaning the Work Place and Change Management: Some Successful Case Implementations
198
An auditing team was formed to sustain the 5S System. Initially each area was audited once a week and after the auditing process got improved it was done once a month. Their auditing team consists of the plant manager, area supervisor, metallurgist, a safety advisor and one area worker. At the conclusion, during a public event, the general manager of the company recognized all the workers at the plant and a special price was given to each of them.
Kreisler Manufacturing9: To Improve Quality and Productivity.
Kreisler Manufacturing is a Family owned company with a long history of success and problems. In 1914 the company began doing business as a fine jewelry manufacturer selling to upscale jewelry and department stores throughout the country. The company was founded by Marcus Stern and Jacques Kreisler. When the depression hit in 1932 the company closed its doors. The company started up again the following year manufacturing watchbands, with as primary customer Bulova Watch Company. During the second war, in 1941, Kreisler started manufacturing parts for cathode ray tubes and various war related products such as aircraft tubes and manifold assemblies. After the war they went back to producing watches and briefly got involved in a new product line of writing instruments. After closing its jewelry division in 1979 Kreisler Industrial Corp. became the sole operating subsidiary of Kreisler Manufacturing Corp. A complete history of the company can be found on the internet. According to William Green (Green, 1997) Kreisler Manufacturing Corp. was in trouble in 1996. It had lost $923,000 in fiscal 1996 and had losses for the past five years. With poor sales and dwindling cash reserves, the company did not have enough business to keep going. Miraculously, demand for aircraft engines surged in 1997, just in time to save the company. The company prides itself on quality performance in all aspects of design, process planning and manufacturing. They ―have manufactured precision components for the aerospace industry for over half a century by delivering a consistently high quality product and helping our customer solve complex engineering and manufacturing challenges‖. ―The company‘s technical capability is complemented by continuous improvement efforts and certified quality systems that help improve quality and reliability‖.10 Two of the Stern‘s sons have significantly improved productivity of the company and they pride themselves in properly implementing the 5S system with weekly 5S cleanliness audits.
The U of M Hospital: Re-Engineering an Admissions‟ Process using VSM.
Around 2005 University of Michigan Hospitals began an initiative to bring Lean problem solving methods and culture to the Health System. As part of that initiative grants and Lean coaching support was made available to a number of projects in both the inpatient and outpatient settings. The Department of Physical Medicine and Rehabilitation received such a grant in 2007 to address the issue of timeliness of patient transfer to the rehabilitation floor. The transfer of a patient from an acute medical service to the rehabilitation service requires coordination between both physicians and nurses on the sending and receiving services, housekeeping to prepare the beds, transport, and multiple steps required to obtain insurance approval for the transfer. Delays in transfer resulted in lack of therapies the first day of transfer and both patient and staff dissatisfaction. Additionally, with the rise in acute medical census any delay in discharge of patients to the rehabilitation unit potentially could cause delays in admissions of patients from the emergency department or postoperative holding. The issue of delayed admissions had been a long standing problem, and previous attempts to improve the process were ineffective. Through the UMHS grant, the Department of PMR received a Lean coach to assist with the process and educate all participants in Lean principles. After an initial scoping phase, a two day workshop was convened to analyze the current process through value stream mapping and to formulate a future state map and develop an implementation plan. The group assembled included representatives from all steps in the transfer process, including physicians, nurses from both the rehabilitation floor and from acute medical floors, therapists, discharge coordinators, and the rehabilitation floor admission coordinator. Key deliverables and metrics were identified to bring the desired process change and specific individuals or groups were tasked with implementation of those changes, with specific time frames and regular progress meetings. At the end of the workshop the findings and implementation plan was presented to hospital administration to get leadership by-in to the project. Another key strategy for process change was close monitoring of key time goals for every admission with analysis of events that fell outside of goal time lines. This allowed daily feedback and early identification of areas for improvement. Results from the project have been quite dramatic. Prior to initiation of the project in early 2008 only 18% of patients arrived to the floor by 1 pm (average admission time 4:30) and no patients received therapies on the day of admission. By early 2010 65% of patients were physically on the rehabilitation unit by 1 pm and 92% of patients did receive therapies on that day of
9 Based on http://www.Kreisler-ind.com/ retrieved 4/20/2009 and ―Fasten Your Seat Belts‖, by William Green, Forbes Magazine, December 15, 1997. 10 http://www.Kreisler-ind.com/markets.html retrieved 4/20/2009.

N. L. Wu, Y. Parfenyuk, A. S. Craig and M. E. Craig IHART - Volume 16 (2011)
199
admission. In addition to achieving the goals set out by this project, it served as an example of the power of Lean process re-engineering to bring meaningful change and became a springboard for other projects in the Department of PMR.
Hospital: 5S Implementation to Reduce Time Spent on Patient Care Documentation.
The literature tells us that as much as 40% of a staff nurse's work time is spent in documentation. Whether electronic or manual, documentation is an essential component of a nurse's responsibilities. It provides for a more consistent approach to patient care as practitioners share information about their patients with other clinicians. Also, documentations regarding care giver observations, treatments/medications administered and the patients' responses are important in order to maintain continuity of care and to track patients' progress and daily status. Furthermore, documentation on the patient's records is essential to meet regulatory agencies requirements and to provide lawyers in litigation investigations a record of the patient care that was rendered. Notwithstanding documentation's importance, added efficiency and cost savings would result if the percentage of time spent by professional nurses in documentation could be reduced by even a fraction. Reducing documentation time without sacrificing any of the important qualitative objectives of said documentation is a challenge that when addressed satisfactorily would allow professional nurses additional time in actual direct care activities. These enhanced direct care activities could include patient and family education, comprehensive discharge planning and participation in patient care team conferences. One way an organization can embark on this goal is through the use of the 5S System for work place organization. Following is a sample of how an organization can utilize the 5S System in order to reduce nursing documentation time. To achieve success in this endeavor, an organization would do well to designate one person to coordinate the process from beginning to the final stage. At the project's conclusion, a permanent overseer should be appointed to avoid reverting back to previous behaviors of adding additional forms in the workplace without due process. Step # 1 Sort (Housekeeping). This is the step in which the project manager, in consultation with his/her work teams decides what forms contain information that is needed and which forms can be safely discarded . Eliminating forms at this juncture eliminates the needs for storing excessive inventory of paper and/or allow for the reduction of screens nurses check when doing electronic documentation. This step can take significant time as the project manager needs to make sure they have collected and assessed all the forms/screens currently in use by at least one nursing department in the organization. This includes the Emergency Department, the Preoperative Services, the Outpatient and Inpatient Services and any additional specialty area that may exist in the organization. While this is a big undertaking, it is nevertheless an essential step in the overall process. Step # 2 Set in Order (Organization). After non essential forms have been purged, further reductions are achieved by the organization of the remaining forms through, condensing, consolidating, and eliminating duplications. This is where the teams are most active as they determine how to succinctly combine forms and make them both user friendly , simple to use and inclusive . During this stage, teams may take two or more forms and reduce them to one form that contains the essential data from the initial variety of forms. During this stage, 'experts' from the Nursing Departments as well as the Quality Department, Medical Records, Compliance, Risk Management, IT etc. are asked to review the newly condensed forms. These experts will check to make sure critical elements have not been inadvertently omitted and new regulatory requirements are included. At this time, these experts may recommend even more forms merging, combining, condensing. Step # 3 Shine (Cleanup). This is where the forms and screens are prepared for review by each institution‘s designated approving body and/or where those doing electronic documentation can work with their vendor or in house experts to incorporate any new desired changes to the screens. At this point, the forms are prepared for final printing. Step # 4 Standardized (Keep cleanliness). Training on the proper use of the forms/screens is done at this stage in order to maximize the proper use of the newly revised, simplified, condensed forms. It is important that all parts of the organization receive consistent training on all shifts. Additionally, it is also essential that the work place is 'cleaned' of any of the old forms that may be in any decentralized location so that there is no error in their continued use. Only the new forms should now be available in the organization's inventory. Step # 5 Sustain (Discipline). During this final stage, monitoring on the proper use of the forms/screens is done. This could be done in any number of ways including concurrent or retrospective audits of an established aforetime % of the weekly or monthly charts. Ongoing monitoring can be reduced in frequency based on the degree of compliance observed. The best of all systems need periodic reviews, enhancements so this process becomes a cyclical undertaking with the goal of continuous process improvement.
Leaning the Work Place and Change Management: Some Successful Case Implementations
200
Mrs. Mayble E. Craig, MS, RN, consultant to Howard University Hospital, implements this 5 step process everywhere she works, primarily to improve patient flow in emergency departments. It is a process that greatly benefits nursing services decision making.
An International Vacation Time Share Company11: 5S Implementation and Process Re-Engineering via VSM to Improve and Consolidate Maintenance Planning.
Early 2006 a methodology for assessing lean operations in small to midsize service companies was developed by Wu/Walker (Wu, Walker, pp.211-222). This methodology requires the calculation of a ‗lean office score‘ based on four surveys. It not only measures the level in which each operation is lean, but also points out the areas of deficit, so improvements can be suggested and made. This methodology has been applied to a multiple location Time Share Company that will be referred to as TSC. The application involved an initial analysis of its main office operations followed by an evaluation of three of its multiple time-share locations in Mexico. The workplace organization in the main office of TSC exhibited all of the 5S lean principles. As you walk in this office you immediately notice that everything that is needed is sorted, organized and given a place. What is needed and kept is visible and self-explanatory so everyone knows where it goes. The office is clean and exhibits no clutter. This organizational discipline is spread to all areas of the office because of its open cellular layout. This has lead to standardization that requires discipline, sticking to the rules and making the rules a habit. The principle of standardized work at TSC manifests itself when one looks at the procedures that have been established over the years with input from all employees; and the technology all workers have been trained for to perform all activities in a most optimal way. Many processes are computer driven, which makes cross training easy. Furthermore, many of the activities/processes are well documented and easy accessible and known by all members of the office staff, including the president. Upon the request of its Board of Directors, the maintenance management function at three of their nine resorts in Mexico was evaluated. We will refer to these locations as A, B and C. A 5S score card, capturing maintenance specific entities was developed. Location B received the best average score (3.9 out of 5), whereas locations A and C received poor average scores (2.8 and 2.4 respectively) (for more detailed results see Wu/Walker, pp. 220). It was suggested that location C needed to implement the 5S program of work place organization first, before implementing and executing various aspects of Total Productive Maintenance (such as visual scheduling and control of preventive and routine maintenance) that was being developed for all locations. With proper training, help from the supervisor of location B, support of all maintenance workers and good leadership of Management the ‗the dirty dungeon‘ of a maintenance office got transformed into a ―spic and span‖ well organized area, where all 5S principles became and still are visible. What was helpful in this implementation of the 5S principles was that any change that was made to the office and its organization was made with the active involvement of its supervisor. People like to feel they have a say in what they do and how they do it. This ownership helped sustain the organization that was put in place at this location. In developing the 5S score card it was also clear that all locations had designed their own order forms and inspection forms. It was suggested that the maintenance supervisors consolidate these forms and generate a set of forms that could be used at each location. Again, with proper training and leadership of management it was agreed that the work order generation forms and inspection forms of location B could serve as a initial blue print for this endeavor; and that all maintenance supervisors would get involved in the creation of common maintenance forms. Additionally, each location had developed its own tedious, inefficient way of tracking and planning routine and preventive maintenance activities. Maintenance supervisors were spending an enormous amount of time going through files, data forms, past work done and other documents to ensure the timely execution of all future inspections, PM and RM activities. This process got re-engineered using VSM and with the help of maintenance supervisors routine and preventive maintenance systems (RM/PM) with visual controls were developed. These visual controls significantly improved the scheduling and the control of RM/PM work. The system got computerized and eliminated bundles of paper work, thus freeing up space and clutter in the maintenance office.
11 Based on the request of the President and its board, this company will be referred to TSC (Time Share Company)
N. L. Wu, Y. Parfenyuk, A. S. Craig and M. E. Craig IHART - Volume 16 (2011)
201
Thought Organization/Proposal Formulation: A 5S Implementation
In a chapter in a recently published book ―Driving Operational Excellence: Successful Lean Six Sigma Secrets to Improve the Botom Line‖ Joann Parinder proposes the use of the 5S principles as a process for thought organization/proposal formulation (Parinder, 2010). The 5Ss principles of Lean thinking, originally implemented to leaning out the workplace, applied to the ―Idea Development Lifecycle Process‖ certainly is very novel, thought provoking, and demonstrates that the sky is the limit when it comes to applying principles of lean thinking. The explanation of the 5Ss as it relates to the process of ―Developing an Idea‖ from ―sorting out and communicating your idea from a high-level, big picture‖ to ―sustaining your idea‘s essence while allowing for changes to improve the baseline‖ is clear, complete, very much to the point and speaks to all who wish to develop professional ideas and thoughts. What she proposes follows the basic guidelines that are offered in this paper. We highly recommend that this welcome professional expose be read by professionals seeking aid with the process of proper idea generation. She presents two cases that demonstrate this extreme, yet unique application of the 5S lean principle.
CONCLUDING REMARKS
Here are some of the reasons why many implementations of lean principles have failed: not enough attention is given to incorporate all parties involved; there is not enough leadership and management support; the needed promised financial support gets cut midstream because of budgetary reductions; the diverse group implementing the change does not get sufficient training to accomplish the enormous task; no metrics are set to measure success which is a pre-requisite to sustaining change; and many other reasons. Yet, the sustainability and profitability of many companies mandate continuous improvement of their processes, reduction in inventory and clutter, and above all improvement of customer satisfaction. The recognition for the need of improving customer satisfaction explains why many hospitals get their patients involved when re-engineering their many processes; some patients become temporary members of the improvement team. The guidelines offered in this paper may help our industry move towards a higher level of success, profitability and quality, while improving the quality of the product or service for the customer.
BIBLIOGRAPHY
APICS Dictionary, Thirteenth Ed., 2010. Brimeyer, Rick , ―How to Avoid Common 5S Mistakes – Six lessons learned from a proven Lean leader‖,
www.pdgconsultants.com, 2008 PDG, Inc. Copley, F. G., Frederick W. Taylor, Harper & Bros., New York, 1923, Volume II. deCamara, D., ―To Survive or Thrive?‖, Chief Executive, March 6, 2008. http://www.deloitte.com/dtt/cda/doc/content//To%20Survive%20or%20Thrive%20-
%20Gaining%20Competitive%20Advantage%20in%20an%20Economic%20Downturn.pdf Green, William, ―Fasten Your Seat Belts‖, Forbes Magazine, December 15, 1997. Gotsill, G. and M. Natchez, ―From
Resistance to Acceptance: How to Implement Change Management‖, T+D, Vol. 61, Iss. 11, November 2007. Grasley, M., ―Changing a process? Ask MOM for help‖, Control Engineering, Vol. 54, Iss. 5 May 2007. Katz, J., ―Bridging the Great Divide‖, Industry Week, Vol. 256, Iss. 8, August 2007. Kotter, J.P., ―Leading Change: Why Transformation Efforts Fail‖, Harvard Business Review March/April, 1995. Kutyla, D. M., ―Economic Update. It‘s Spring. Things Have Sprung!‖, Deloitte, March, 2009.
http://www.deloitte.com/dtt/cda/doc/content/us_CB_EconomicUpdate0309.pdf Long, S. and D.G. Sputlock, ―Motivation and Stakeholder Acceptance in Technology-driven Change Management: Implications
for the Engineering Manager‖, Engineering Management Journal, Vol. 20, No. 2, June 2008. Marden, R.E., R.K. Edwards, and W.D. Stout, ―The CEO CFO certification requirement,‖ The CPA Journal, Vol. 73, Iss. 7, July
2003. Maylett, T. and K. Vitasek, ―For Closer Collaboration, Try Education‖, Supply Chain Management Review, Vol. 11, Iss. 1,
January 2007. Nazareth, A.L., ―Keeping SarbOx Is Crucial,‖ Business Week, Iss. 4009, November 13, 2006. Parrinder, Joann O., ‖Lean Thinking Applied in Your Idea Development Lifecycle‖, Chapter 18, pp. 237-250, Driving
Operational Excellence: Successful Lean Six Sigma Secrets to Improve the Botton Line, Ron Crabtree, editor, MetaOps Publishing LLC, Livonia, MI, 2010.
Reuter, Vincent G., ―A Productivity Implementation Plan‖, Industrial Management, September-October, 1980.

Leaning the Work Place and Change Management: Some Successful Case Implementations
202
Sande, T., ―Taking charge of change with confidence‖, Strategic Communication Management, Vol. 13, Iss. 1, December/January 2009.
Stanleigh, M., ―Effecting successful change management initiatives‖, Industrial and Commercial Training, Vol. 40, No. 1, 2008. Taylor, Frederick W., The Principles of Scientific Management, Harper and Bros., New York, 1929. Woodward, N.H.,―To Make Change, Manage Them‖, HRMagazine, Vol. 52, No. 5, May 2007. Wu, Nesa L‘abbé, Production/Operations Management –Applying Lean Principles- From Design to Shop Floor Control, Mc
Graw Hill Learning Solutions, 2nd edition, 2010. Wu, Nesa L‘abbe and C. Walker, ―Assessing Lean Operations: Methodology for the Service Industry‖, Productivitry, Vol. 47,
No. 3, October-December, 2006. www.Kreisler-ind.com/ retrieved 4/20/2009.
P. G. Adu and K. W. Ward IHART - Volume 16 (2011)
203
APPLYING TRADITIONAL RISK ASSESSMENT MODELS TO INFORMATION ASSURANCE: A NEW DOMAIN NOT A NEW PARADIGM
Prince G. Adu and Kerry W. Ward
University of Nebraska at Omaha, USA
ABSTRACT
As organizations become increasingly reliant on information, managing the risk related to the loss of this information has likewise increased in importance. Traditionally, organizations have protected themselves from the loss associated with destruction of valuable assets by applying risk assessment models to identify potential threats and to predict the likelihood that those threats will occur. The intangible nature of information and the unknown threats to such information assets have given rise to questions concerning whether the application of these traditional risk assessment models is sufficient for the domain of information assurance. This paper discusses the issues raised in applying traditional risk models to assess risks in the domain of information assurance and concludes that while the issues are valid concerns, they are a function of the age of information assurance as a risk management domain and not a change in the risk management paradigm that invalidates the traditional risk assessment models. The key issue is not whether the traditional models apply but where the field is in terms of having the knowledge to apply the models to the domain. The lack of knowledge about the threats and values involved are a factor of being early in the application to the domain, lacking actuarial data, and not an altered paradigm in which the traditional model no longer applies as some have argued. As we gain a better understanding of the threats, historical data related to likelihood of occurrence and the loss of value related to information assets, we will be able to better apply the traditional risk models. Keywords: Risk Management, Risk Assessment Models, Information Assurance.
INTRODUCTION
With the global expansion of markets and the evolution of the information age, organizations are increasingly information dependent and vulnerable to the loss of their information assets. The increasing vulnerability of information assets necessitates increasing efforts to protect these valuable assets. Traditionally, the approach to managing threats to valuable assets has been referred to as risk management and the process of protecting information assets is referred to as information assurance (IA). There has, however, been much discussion as to whether traditional approaches to risk management and in particular the assessment of risks adequately address risk in the information assurance domain (See for example, Blackley, McDermott, and Geer 2002; Covert and Nielsen 2005; Layton and Wagner 2007; Sun, Srivastava and Mock 2006). This paper begins by introducing the key concepts of risk management and information assurance and then examines the main arguments put forth by those who question the applicability of the traditional risk assessment models to the information assurance domain. Then we discuss why these arguments are a function of the immaturity of the information assurance domain with regard to the application of the risk assessment models and not an altered paradigm in which the traditional risk management approach no longer applies.
RISK MANAGEMENT
Risk management is the active process of controlling risk with the objective of limiting or reducing the negative impact on the organization that could result from the loss of or harm to valuable assets. Risk management includes the identification of threats (risk assessment) and taking actions to eliminate or minimize the threats (risk mitigation). It is the risk assessment phase that is the focus of this paper. Risk assessment has traditionally been conducted and managed via the application of risk assessment models. Risk assessment models can be classified as quantitative or qualitative. Generally, quantitative approaches follow a basic formula that identifies assets, threats to those assets, assigns a probability to a threats‘ occurrence and then multiplies this probability by the an asset valuation. The sum of this formula provides a basic calculation which factors in the likelihood of a loss and the value of the loss if it occurs. Many modern day quantitative approaches have become sophisticated actuarial models with the application of historical occurrence data to determine the likelihood of an event occurring.

Applying Traditional Risk Assessment Models to Information Assurance: A New Domain Not a New Paradigm
204
Qualitative approaches to risk tend to be applied to those risks that are difficult to quantify. Qualitative approaches replace the quantitative values by assigning a subjectively determined value such as high, medium, or low. Note that theoretically, even qualitative models apply the basic formula to risk: determine the risk, determine its likelihood of occurrence, and determine the potential loss. The primary difference between the quantitative and qualitative models is the subjectivity of determining the likelihood of threats (Harris 2005; Emblemsvag and Kjolstad 2006).
APPLICABILITY OF TRADITIONAL RISK ASSESSMENT MODELS TO INFORMATION ASSURANCE
Information assurance is the protection of information systems and traditionally focuses on protecting the confidentiality, integrity, and availability of information. In terms of information assurance, the objective of risk management is to enable the organization to achieve its goals by providing secure information (Stoneburner, Goguen and Feringa 2007). There is a lot of discussion arguing that the traditional risk assessment models are not adequate for application to the information assurance domain (See for example, Blackley et al. 2002; Covert and Nielsen 2005; Layton and Wagner, 2007; Sun et al. 2006). The applicability of the traditional models as they apply to information assurance is challenged in all three processes: identifying threats, determining the likelihood of occurrence, and in determining the value of losses. In the following section we examine the main arguments against applying the traditional risk models to information assurance in all three processes beginning with threat identification.
Threat Identification
As noted, the first step in applying traditional risk assessment models is the identification of threats. With the emergence of information technology, increasingly complex and valuable information can be collected, stored, and analyzed by organizations, and the threats to this information is often poorly understood or simply unknown. The critics question how traditional risk assessment models can apply to IA if the threats are unknown or cannot accurately be identified? There are three main issues raised regarding the inability to identify threats. First, the interconnected nature of modern business relationships creates additional exposure from outside the firm to information assets that traditionally remained inside the firm, such as financial information, production information, etc. The information revolution coupled with increased reliance upon global interconnected systems provides new and improved capabilities to decision-making that are vulnerable to potential attack and faced with the dispersed threat of globally compromised data (Hamill, Deckro, and Kloeber Jr. 2005; Harland, Brenchley, and Walker 2003). For instance, there may be a substantial distance between the perpetrator of a threat to information and the business which is dependent on the security of that information (Gordon, Loeb and Sohail 2003). Second, the interaction of software, hardware, and people create complex interactions that are difficult to secure. The interactions of systems, designed to openly create and move information allows for a multitude of unknown exploits to exist in any given system. Consider for example the number of attack points routinely discovered to Microsoft‘s operating systems. Frequently these exploits are only discovered after someone has compromised them - illustrating the point that in the IA domain, the risks are often unknown until they are exploited. Third, malicious attackers, both internal and external to the organization, are an adaptive threat. They learn from past mistakes and failures and continue to seek out new modes of attack and new vulnerabilities. So in the above scenario regarding Microsoft‘s operating system, after the previously unknown vulnerability is identified and ―patched‖, the attackers adapt their tactics. There is evidence that patches simply provide additional information to the attackers (Arora, Nandkumar, & Telang 2006) on how to adapt their attacks. If the patch does stop the attack, the attackers move on to find the next, as yet, unidentified weakness in the system. This, the critics argue, illustrates how assessing threats in the information assurance domain differs from assessing threats in other domains such as assessing the threats to buildings and other tangible property from well know and easily identifiable threats (i.e. hurricanes, fires, tornados, etc.).
Applicability of the Likelihood of Threat Occurrence
Recall that after the threats are identified, the traditional models require an estimate of the likelihood of the occurrence of the threats. If the likelihood of occurrence is based on past experience, managers cannot account for new types of attacks or vulnerabilities that have not yet been discovered, the so called ―zero-frequency‖ problem (Hope, Lavenhar, and Peterson 2005). The probabilities of many security incidents are virtually unknown and the likelihood of potential security breach or
P. G. Adu and K. W. Ward IHART - Volume 16 (2011)
205
damage is very difficult to quantify. Thus it is unlikely to accurately reflect the probability of a threat in the information assurance domain (Black 2003). This leads to the question: how can we apply traditional models of risk based on probability when no data to calculate the likelihood of occurrence exists (Covert and Nielsen 2005; Blackley et al. 2002)?
Assigning Value to Information Assets
Finally, even if we can identify the threats and provide some likelihood of them occurring, there is still an issue of assigning value to the information asset. In the past, most valued assets in an organization were typically something physical, like inventory, machinery, or buildings. Such physical assets are relatively easy to assign a value to, in large part due to the ability to replace the assets. Today, however, the most valuable assets are frequently intangible, such as intellectual property or information (Parker 2001). For example, consider a retail store. Most retail stores have merchandise that is at risk of loss due to theft, fire, and many other sources. However, the value of this merchandise is easily calculated by replacement and readily covered by insurance to protect the company from the loss of the merchandise. But consider the valuation for customer information stored on a server related to web site purchases. How can a company value the customer information and value related to mining the data for future sales? More important, how does the company value the potential lost sales due to a lost in customer trust after the customer finds out a hacker has stolen their personal information from the company‘s server? These arguments illustrate that there are reasons to be concerned with applying traditional risk assessment models to the information assurance domain. Many sophisticated attempts have been made to apply risk assessment models to information assurance (see for example Gordon and Loeb 2002; Guarro 1987; Sun, Srivastava and Mock 2006 among others) but have fallen short in terms of being considered effective and being widely adopted. Despite the concerns, we caution against drawing the conclusion that the traditional risk assessment models no longer apply when it comes to information assurance.
INFORMATION ASSURANCE: A NEW DOMAIN, NOT A NEW PARADIGM
While we recognize the above issues as important and difficult to overcome, these arguments are not the result of a paradigmatic shift in which the traditional risk assessment models no longer apply. Instead the issues raised can be viewed as a function of the maturity of the information assurance domain in which the lack of information concerning the nature of the threats, the likelihood of their occurrence, and the potential loss is caused by the immaturity of the information assurance domain. The concept of risk has been around for hundreds of years with the basic model of risk assessment emerging just after the French Renaissance period. From its inception, risk assessment has been about using the past to predict what might happen in the future. In particular it was the work of Blaise Pascal and Pierre de Fermat and their development of probability theory that provided the foundation for the basic risk assessment model and the focus on the likelihood of occurrence as a probability function (Beattie 2008; Bernstein 1996). This basic formula for risk assessment is independent of the domain to which is applied to and, as such, is not in itself an issue. If the model itself is not the issue, then the next step is to consider the application of the traditional risk assessment model to the specific domain – in this case information assurance. And it does appear that it is at this point that the identified arguments against the traditional risk model to IA are made. The underlying logic of all of the above arguments is that information assurance is inherently different from other domains the traditional model has been applied to and therefore the model does not function appropriately in this application. But is the proliferation of information technology and the need to secure it so different as to represent such a paradigmatic shift in risk assessment? Looking back through history, there are many examples of risk being applied to new domains where similar issues have been raised. Consider the early days of automobiles. Automobiles were considered to be ―a gasoline can on wheels‖ and insurance companies avoided insuring them due to a lack of understanding of the risks assoicated with them (Bogardus & Moore, 2004). Similar to the domain of information assurance, the risks associated with automobiles was not understood because it was a new technology in which no prior knowledge of the related risks existed. Over time, however, automobiles proliferated and knowledge of the risks was accumulated. In fact this new technology of automobiles, which was once thought so risky that no one would insure it, has grown into a mulit-billion dollar insurance industry with sophisticated acurrial models for assessing risk and determining premiums. In retrospect, we can now conclude that the issue in applying risk assessment to the automobile was not whether the traditional risk assessment model applied, but whether the information existed to apply it. Continued proliferation and the passage of time solved the application problem by allowing the development of knowledge about the risks and historical data to determine both

Applying Traditional Risk Assessment Models to Information Assurance: A New Domain Not a New Paradigm
206
the likelihood of the risks and resulting losses. This cycle of application of the traditional risk assessment model can be seen throughout history in the application to new domains (see for example, the airline industry or risk application to the US after the industrial revolution among others)(Bogardus and Moore 2005). The issue of an adaptive enemy also needs to be examined in light of the historical context of risk. Again the concerns of an adaptive enemy are valid and pose a difficult issue. There is little doubt that adaptive enemies are constantly adjusting their tactics as a result of what they have learned from their previous attacks or in respone to actions taken to counter their activities. But again, this is not an unpreccedented aspect of risk resulting from the age of information technology. Consider one of the first applications of the traditional risk assessment model - the domain of shipping. A major threat to early shipping was the threat of attack by pirates. Similar to modern day hackers and crackers, pirates adapted their strategies and tactics for attacking ships as captains and crews learned from prior attacks and took steps to counter them. Pirates have proven to be such an adaptive enemy that despite hundreds of years, they are still an active threat to shipping as seen by the recent series of attacks in the horn of Africa (Keyser 2008). It is interesting to note that not only were pirates not a hindrance to the application of risk assessment models to shipping, the adaptive pirates and the potential losses they represented were one of the drivers for the need to manage risk. The comparison of the historical context of applying the traditional risk assessment model to prior domains provides support for the proposition that current issues are related the immaturity of the IA domain. But this still leaves open the issue of assigning value to the potential loss of information. At least with shipping, the value of the ship and its contents were easily quantifiable. The ship and its cargo were tangible assets. As noted, this is not the case with information. While it is difficult to assign value to information it is not impossible. Consider patents, trademarks, goodwill and other such intangible assets. Despite the fact that there is some uncertainty involved, making the valuation of intangible assets difficult, situations such as the sale of a company or court cases routinely require a value to be placed on such intangible assets. The same approaches to the valuation of tangible assets can be applied to intangibles including: the market approach, the income approach, and the cost approach (Pratt, Reilly, & Schweihs, 2000). In addition to applying formal approaches to valuing intangible information, an entire black market has emerged where stolen personal information, such as credit card numbers, social security numbers, and other confidential information can be bought and sold. For example, an individual known as ―Zoomer‖ offered people‘s credit card information for sale at price of $100 per card number through the web site International Association for the Advancement of Criminal Activity (www.iaaca.com) (Zeller 2005). Additionally the credit card validation value (CVV), the extra three or four digits number found on a credit card that proves the physical possession of the card, can be purchased at the TalkCash.net website for $3 per CVV. For $20 you can purchase everything you need to make fraudulent charges on a credit card including credit card number, CVV and victim‘s date of birth (Kirkpatrick 2006). The Federal Trade Commission has estimated cost of misused and pilfered personal information of millions of Americans to be approximately $5 billion for consumers and $48 billion for businesses annually (Zeller 2005). The point is simply this: while it is more difficult to value intangible assets, it is not impossible and the more experience we gain with valuing intangible information assets the more accurate those estimates will become. By looking at the historical application of the traditional risk assessment model to other domains, the lesson is that information assurance should not be viewed as a new paradigm, but merely a new domain for the application of risk assessment. Risk assessment from its inception has been about using that past to consider what might happen in the future and, based on this knowledge of the past, make the best estimate of what might happen in the future. By its very nature and definition, however, the future is unknown and all attempts to predict it are flawed, it is merely a function of the sophistication of the application and knowledge of the past we have to apply that differentiates the accuracy and thus value of applying the traditional risk assessment models to different domains. The fact that threats to the information assurance domain have been difficult to identify and are still viewed by some as largely unknown is not equivalent to concluding that threats to information assurance assets can never be identified adequately to apply the traditional risk models. Instead, the current difficulty in applying the traditional risk assessment models is a function the maturity of the domain and resulting lack of historical data. Ironically it is a lack of information that limits the application of traditional risk assessment models to information assurance (Arora et al. 2006; Blakley et al. 2001). It is the immaturity and resulting high uncertainty that makes the application of the traditional risk model all that more important to ensure we work towards managing the risks. Ultimately the key to successfully applying the traditional risk assessment model to information assurance domain is a function of the development of appropriate metrics derived from accumulated historical data. The key, therefore, is not in searching for a new risk assessment model but
P. G. Adu and K. W. Ward IHART - Volume 16 (2011)
207
in accumulating enough reliable, historical data on the new domain to be able to scrutinize the past to accurately determine and predict the threats of the future and the related potential losses. The good news is that the development of the data required to apply traditional risk assessment models to IA, while still in its infancy, is underway. Several organizations have been tracking threats and trends (see for example the FBI, CERT and CSI). In fact the Computer Security Institute (CSI) boast of being the longest running project (13 consecutive years) to collect data on information-related security and crime (Richardson 2008). And there is evidence that, despite the rhetoric concerning the failure of the traditional risk assessment models, organizations are moving forward with managing the risks associated with information assurance. A 2001 survey of CIOs indicated that 73% of companies included protecting information assets as part of their overall risk management strategy (Alter 2006). In a more recent survey of U.S. headquartered firms, Rees and Allen (2008) found that firms are increasingly conducting risk assessments that follow the traditional risk model, including the use of quantitative measure of the likelihood of loss. Information assurance is not a new paradigm; it is simply a new domain that is in its infancy in terms of developing the historical data required to accurately assess and manage its risks. History indicates the application of the traditional risk assessment model to new domains is difficult at first, requiring an understanding of the threats and the likelihood of their occurrences that can only be developed over time as the new domain matures. And despite the difficulties in determine the value of intangible assets such as information, it is not impossible. Consistent with history, these metrics will develop and so it is best to acknowledge this and to start working towards identifying and developing the key metrics so the historical data can more rapidly be accumulated. As more and more information about risks in information assurance is accumulated and more accurate estimates of the potential losses are developed, it will be easier to understand, anticipate, and calculate the likelihood of occurrence of threats and the resulting losses. In other words, it is merely a function of time and development of the appropriate knowledge and data before the traditional risk assessment model can provide a better foundation for managing the risk in the information assurance domain.
CONCLUSION
The death of traditional risk assessment as applied to information assurance is greatly exaggerated. As in the past, each time a new domain requires managing the risk associated with it, there is a period where assessing risk is difficult if not initially perceived as impossible because of a lack of historical data to predict the threat occurrences. Further, as in the past, as information is gather over the passing of time, the data needed to assess the associated risks will be collected and the traditional risk assessment models will work just fine. This is the situation with information assurance. While the domain of IA is relatively new and it is difficult to assess the threats, the likelihood that threats will occur and the cost if they do occur, this is a function of being early in the application of the traditional risk models and not a paradigm shift that requires a new perspective on managing risk. Not only are the arguments against the application of the traditional risk assessment models to information assurance risks a function of the maturity of information assurance as a domain, the youth of information assurance is the best argument yet for applying risk management: for ironically, the more uncertain the risks and the greater the unknown potential for disaster to an organization, the greater the need to manage the risk. So not only does the traditional risk assessment model apply, it is essential to work towards its application in the information assurance domain - and the sooner the better. The greater the focus on the application of the traditional risk assessment models, the faster we will develop a consensus of the key metrics required for the management of information assurance risks and the historical data to do an increasingly accurate job of doing so. The conclusion is that those in the information assurance domain need to collect and share information about the threats to information and to create the data needed to apply the traditional risk models. And indeed this is already happening. CERT and other such groups have been collecting this data for some time and with each passing day we gain a better understand of how to manage the risks to information assurance.
REFERENCES
Alter, A. 2006 ‗Security and Risk‘, Ziff Davis CIO Insight – Special Issue Vol. 75 Arora, A., Nandkumar, A. & Telang 2006, ‗Does Information Security Attack Frequency Increase with Vulnerability Disclosure?
An Empirical Analysis‘. Information Systems Frontier vol. 8 pp. 350-362

Applying Traditional Risk Assessment Models to Information Assurance: A New Domain Not a New Paradigm
208
Beattie, A. 2008, ‗The history behind insurance‘, Investopedia. [Online] Available at http://www.investopedia.com/articles/08/history-of-insurance.asp
Berstein, P.L. 1996, ‗Against the Gods; the Remarkable Story of Risk‘, John Wiley & Sons, Inc. New York. Blakley, B., McDermott, E. and Geer, D. 2001, ‗Information Security is Information Risk Management‘, Proceedings of the 2001
Workshop on New Security Paradigms, Cloudcroft New Mexico, pp. 97-104. Black, R. 2003, ‗Quality Risk Analysis‘, Rex Black Consulting (RBC), [Online] Available at
http://www.rexblackconsulting.com/publications/Quality%20Risk%20Analysis1.pdf Bogardus, J. & Moore, R. 2004, ‗A Gasoline Can on Wheels – Spreading the Risks: Insuring the American Esperience‘.
IRMI.com [Online] Available at http://www.irmi.com/expert/Articles/2004/Bogardus01.aspx Covert, E., & Nielsen, F. 2005, ‗Measuring Risk Using Existing Frameworks,‖ EDPACS, Vol. 32, No. 10, pp. 1-7. Emblemsvag, J. & Kjolstad, L. E. 2006, ‗Qualitative Risk Analysis: Some Problems and Remedies‘, Management Decision, Vol.
44, No. 3, pp. 395-407. Fenner A. 2002, ‗ Placing value on information‘, Library Philosophy and Practice, Vol. 4, No. 2. Gordon, L.A., Loeb, M. P., & Sohail, T. 2003, ‗A Framework for Using Insurance for Cyber-risk management‘, Communications
of the ACM, Vol. 46, No. 3, PP. 81-85. Guarro, S.B. 1987, ‗Principles and Proceedures of the LRAM Approach to Information Systems Risk Analysis and
Management‘, Computers & Security, Vol. 6, pp. 493-504. Hamill J. T., Deckro, R. F. & Kloeber Jr. J. M. 2005, ‗Evaluating information assurance strategies‘, Decision Support Systems
Vol. 39, No. 3, pp. 463– 484. Harland, C., Brenchley, R. & Walker, H. 2003, ‗Risk in Supply Networks‘, Journal of Purchasing and Supply Management Vol.
9, No. 2, pp. 51-62. Hope, P., Lavenhar, S., & Peterson, G. 2005, ‗Architectural Risk Analysis,‖ U.S Department of Homeland Security, Build
Security in Setting a Higher Standard for Software Assurance‘, [Online] Available at https://buildsecurityin.us-cert.gov/daisy/bsi/articles/best-practices/architecture/10.html
Keyser J. 2008, ‗Guarded shipping corridor limiting Somali piracy‘, Associate Press. [Online] Available at http://news.yahoo.com/s/ap/20081110/ap_on_re_af/piracy
Kirkpatrick D. 2006, ‗The net's not-so-secret economy of crime‘, CNNMoney.com. [Online] Available at http://money.cnn.com/2006/05/11/technology/fastforward_fortune/index.htm
Layton, M., & Wagner, S. 2007, ‗Traditional Risk Management Inadequate To Deal with Today's Threats‘, International Risk Management Institute, [Online] Available at http://www.irmi.com/Expert/Articles/2007/Deloitte03.aspx
Parker, X. L. 2001, ‗Understanding Risk‘, The Internal Auditor Vol. 58, No. 1, pp. 61-65. Rees, J. & Allen, J. 2008, ‗The State of Risk Assessment Practices in Information Security: An Exploratory Investigation‘.
Journal of Organizational Computing and Electronic Commerce, Vol. 18, pp. 255-277 Stoneburner, G., Goguen, A. & Feringa, A. 2007, ‗Risk Management Guide for Information Technology Systems‘, NIST
(National Institute of Standards and Technology) Special Publication No. 800-30. Sun, L., Srivastava, R. P & Mock, T. J. 2006, ‗An Information Systems Security Risk Assessment Model Under the Dempster–
Shafer Theory of Belief Functions‘, Journal of Management Information Systems Vol. 22, No. 4, pp. 109–142. Zeller T., Jr. 2005, ‗Black market in stolen credit card data thrives on internet‘, New York Times. [Online] Available at
http://www.nytimes.com/2005/06/21/technology/21data.html?pagewanted=all

R. Jain and D. Prasad IHART - Volume 16 (2011)
209
COUNTRY VS. INDUSTRY EFFECT ON BOARD STRUCTURES
Ravi Jain and Dev Prasad University of Massachusetts Lowell, USA
ABSTRACT
We examine the board structures of US and Indian firms in two industries. We examine three aspects of board structures: board size, board independence, and board leadership. The two industries selected for analysis are information technology and capital goods. While Indian information technology firms have close ties to the American economy, capital goods firms have a domestic focus. Thus, we are able to analyze differences in board structures of firms in two countries and two industries one of which is closely related and the other relatively unrelated. We do not find any significant differences in board size and board leadership for US and Indian firms in either industry. However, we find that US boards are more independent than Indian firms, both for information technology firms and capital goods firms. These findings are more supportive of the country effect than for the industry effect on board structures.
INTRODUCTION
In a survey paper, Adams, Hermalin, and Weisbach (2009) state that ―The two questions most asked about boards are: ‗What determines their makeup and what determines their actions?‘‖ This study contributes to the literature by examining factors relating to the first issue, i.e., factors affecting board structures. We study this issue in a cross-country setting and compare board structures of US and Indian firms in two different industries: information technology and capital goods. We examine the three variables of ‗the number of directors,‘ ‗the percentage of independent directors,‘ and ‗the CEO also holding the chairperson position‘ to compare board size, board independence, and board leadership respectively. While the Indian information technology industry is closely related to the American economy, Indian capital goods firms operate with a domestic focus. Thus, we are able to examine difference in board structures across two countries and two industries where the industries are related at different levels between the two countries. If the country effect is more dominant in shaping boards then we expect to find differences in board structures of US and Indian firms irrespective of industry affiliation. However, if the industry effect is more dominant then we expect to find similar board structures for US firms and Indian technology firms, but not for US firms and Indian capital goods firms. Our findings are supportive of country effect being the more dominant force in shaping board structures. While we find that US firms and Indian firms are similar in board size and board leadership structures, we also find that Indian firms are less independent than US firms. This finding is true for both technology and capital goods firms. The rest of paper is organized as follows: section 2 discusses the earlier literature, section 3 describes the data and methodology; section 4 provides a discussion of the results, and section 5 presents the conclusions.
2. LITERATURE REVIEW
As stated earlier, the literature on boards can be broadly classified under two categories: determinants of board characteristics, and, the relation between board characteristics and board performance12. While several board characteristics have been studied, three characteristics are considered to be the most important: board size, board independence, and board leadership. Board size: Board size refers to the number of directors on the board. A larger board can provide bigger and more diverse talent pool. However, it can also introduce the free rider problem as well as bureaucratic problems. A free rider problem refers to the fact that if there are too many people involved in the process, there may be incentives for an individual member to avoid investing time and effort in collecting information and monitoring management. Yermack (1996) who studies domestic firms and Eisenberg, and Sundgren and Wells (1998) who study foreign firms find that firms with smaller boards are valued more highly.
12 Please refer to Adams, Hermalin, and Weisbach (2009) for a comprehensive review of literature related to the board of directors.

Country vs. Industry Effect on Board Structures
210
This is perhaps the most robust result in the literature on boards of directors. Their findings suggest that smaller boards are more efficient. Board independence: Board of directors is a body that supervises management on behalf of shareholders. It is imperative for them to be objective in assessing management and in their other roles. To be objective, it is important that they are not only capable but also independent of management‘s influence. Thus, independent boards can be expected to be more efficient. On the other side, board members who are not well informed about the business may not be as useful as people close to the business. Thus a debate has been going for some time, and over time a consensus is evolving that independence is a preferable board characteristic. The empirical evidence, however, is not very conclusive. While Rosentein and Wyatt (1990) find a statistically significant positive market reaction to addition of an outside director, Hermalin and Weibach (1991) and Bhagat and Black (2002) find no significant relationship between board independence and firm value. Board leadership: Board leadership relates to whether the CEO of a firm also holds the position of the chair of the board or not. As stated earlier, one of the most important roles of boards is to supervise the management team led by the CEO. A board that is led by a chairman who is also the CEO creates a potential conflict of interest. On the other hand, opponents of the separation of leadership issue (for example, Brickley, Coles and Jarell, 1997) argue that there are potential costs in separating the two posts. Overall, there seems to be a gap in the literature which relates to the impact of the home country of a firm and the impact of the industrial sector in which the firm operates on the firm‘s board size, board independence, and board leadership. This study attempts to fill that gap.
3. DATA AND METHODOLOGY
Our sample includes firms from two industries: information technology and capital goods. We select ten US firms and ten Indian firms in each of the two industries. We select the largest firms in each industry. We use Google Finance to identify largest US firms in these two industries. For Indian firms, we use BSE capital good index and BSE Tech Index to identify Indian firms13. Table 1 provides a list of forty firms and their financial variables. We report total assets, sales, and net income for the financial year ending 2008 or 2009. All financial information is sourced from latest annual reports we find on the firms‘ websites. US firms‘ figures are reported in US dollars and Indian firms‘ figures are reported in Indian Rupees14. As mentioned earlier, the primary objective of this study is to compare boards of firms in two different countries for two different industries, one that is closely related and one that is not. In this study, we focus on three board variables: board size, board independence, and board leadership which are defined as follows: Board size is defined as the number of directors on board, board independence is defined as the percentage of directors that are independent, and board leadership is a binary variable taking the value of ‗1‘ if the CEO is also the chairman of the board, and ‗0‘ if the two positions are split15.
Table 1: Descriptive Statistics
This table reports descriptive statistics for firms used in our analysis. Sample consists of forty firms. Panel A reports on twenty information technology firms: ten US firms and ten Indian firms. Panel B reports on twenty capital goods firms: ten US firms and ten Indian firms. Asset size, sales, and net income figures are from annual reports.
13 We use www.moneycontrol.com to get components of these two indices. 14 On December 8, 2009 $1 = Rs. 46.5 (approximately) 15 For Indian firms, sometimes CEO position is defined as Managing Director.

R. Jain and D. Prasad IHART - Volume 16 (2011)
211
Panel A: Information technology
US Firms
Year
end
Total
Assets
$
millions
Sales
$
millions
Net
Income
$
millions
Indian firms
Year
end
Total
Assets
Rupees
millions
Sales
Rupees
millions
Net
Income
Rupees
millions
Microsoft Corp. 06/30/09 77,888 58,437 14,569 Infosys 03/31/09 178,090 202,640 58,190
Google Inc. 12/31/08 31,768 21,795 4,227 Tata Consultancy 03/31/09 134,870 224,040 46,960
Apple Inc. 09/26/09 53,851 36,537 5,704 Bharti Airtel 03/31/09 353,580 340,480 77,440
IBM Corp. 12/31/08 109,524 103,630 12,334 Wipro 03/31/09 175,290 216,130 29,740
AT&T Inc. 12/31/08 265,245 124,028 12,867 Reliance Communications 03/31/09 825,940 150,870 48,020
Cisco Systems 07/25/09 68,128 36,117 6,134 HCL Technologies 06/30/09 40,020 46,750 9,970
Hewlett-Packard 10/31/08 113,331 118,364 8,329 Idea Cellular 03/31/08 100,610 67,120 10,440
Oracle Corp. 05/31/09 47,416 23,252 5,593 Mphasis 10/31/08 11,740 14,520 2,650
Intel Corporation 12/27/08 50,715 37,586 5,292 Siemens 09/30/08 20,700 86,100 5,930
Qualcomm Inc. 09/27/09 27,445 10,416 1,592 Tech Mahindra 03/31/09 18,810 43,580 9,870
Mean 84,531 57,016 7,664 Mean 185,965 139,223 29,921
Median 60,990 37,062 5,919 Median 117,740 118,485 20,090
Panel B: Capital Goods
US Firms
Year
end
Total
Assets
$
millions
Sales
$
millions
Net
Income
$
millions
Indian firms
Year
end
Total
Assets
Rupees
millions
Sales
Rupees
millions
Net
Income
Rupees
millions
United Technologies 12/31/08 56,469 58,681 4,689 BHEL 03/31/09 130,880 285,040 31,380
The Boeing Company 12/31/08 53,779 60,909 2,672 L&T 03/31/09 190,150 342,500 34,820
Caterpillar Inc. 12/31/08 67,782 51,324 3,557 ABB 12/31/08 21,190 73,710 5,470
Honeywell International 12/31/08 35,490 36,556 2,792
Crompton Greaves 03/31/09 12,960 49,720 3,970
Lockheed Martin 12/31/08 33,439 42,731 3,217 Bharat Electronics 03/31/09 38,080 46,270 7,460
General Dynamics 12/31/08 28,373 29,300 2,459 Suzlon Energy 03/31/09 139,100 72,540 (4,690)
Illinois Tool Works Inc. 12/31/08 15,213 15,869 1,519 Thermax 03/31/09 9,620 32,010 2,870
Deere & Company 10/31/08 38,734 28,437 2,052 Areva T&D 12/31/08 11,940 28,370 2,260
Raytheon Company 12/31/08 23,296 23,174 1,672 Punj Llyod 03/31/09 55,470 69,200 3,210
Northrop Grumman 12/31/08 30,197 33,887 (1,262) BEML Ltd 03/31/09 24,830 29,310 2,690
Mean 38,277 38,087 2,337 Mean 63,422 102,867 8,944
Median 34,465 35,222 2,566 Median 31,455 59,460 3,590
Table 2 reports on board size variable, Table 3 reports on board independence (percentage of independent directors), and Table 4 reports on board leadership. Both US firms and Indian firms have to report the number of independent directors on their boards as per listing requirements. We use proxy statements to obtain board information for US firms, and annual reports to obtain board information for Indian firms.
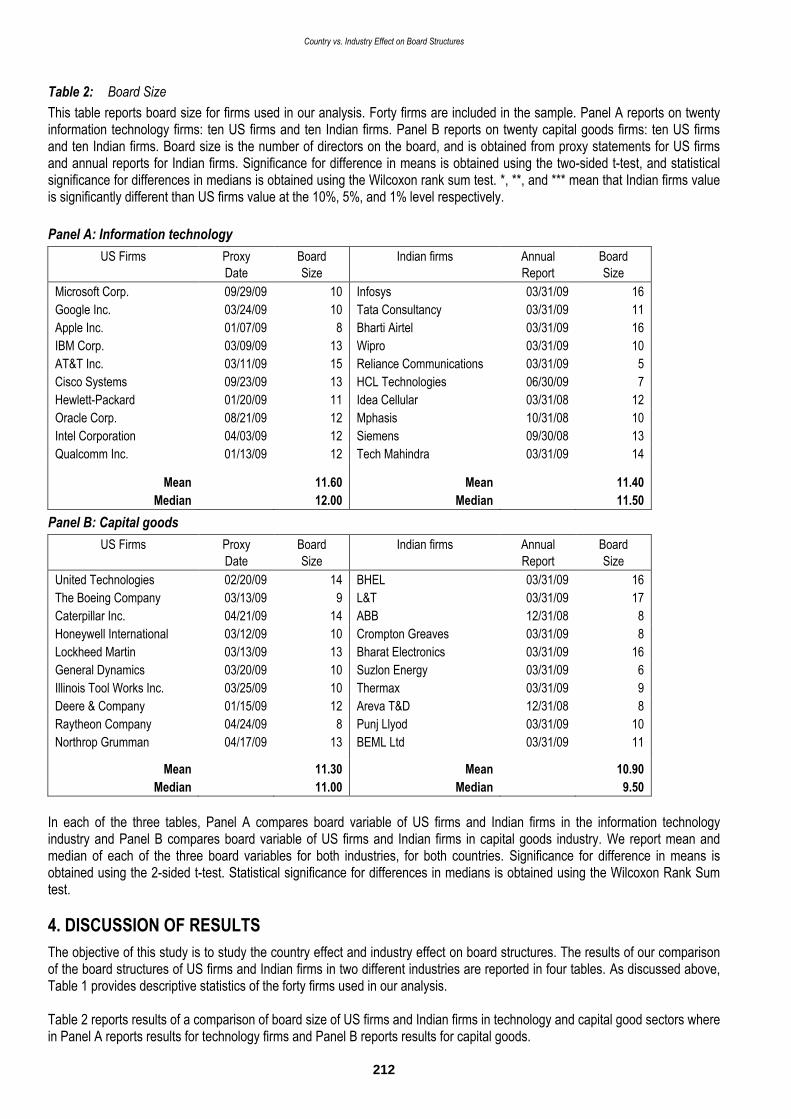
Country vs. Industry Effect on Board Structures
212
Table 2: Board Size
This table reports board size for firms used in our analysis. Forty firms are included in the sample. Panel A reports on twenty information technology firms: ten US firms and ten Indian firms. Panel B reports on twenty capital goods firms: ten US firms and ten Indian firms. Board size is the number of directors on the board, and is obtained from proxy statements for US firms and annual reports for Indian firms. Significance for difference in means is obtained using the two-sided t-test, and statistical significance for differences in medians is obtained using the Wilcoxon rank sum test. *, **, and *** mean that Indian firms value is significantly different than US firms value at the 10%, 5%, and 1% level respectively.
Panel A: Information technology
US Firms Proxy
Date
Board
Size
Indian firms Annual
Report
Board
Size
Microsoft Corp. 09/29/09 10 Infosys 03/31/09 16
Google Inc. 03/24/09 10 Tata Consultancy 03/31/09 11
Apple Inc. 01/07/09 8 Bharti Airtel 03/31/09 16
IBM Corp. 03/09/09 13 Wipro 03/31/09 10
AT&T Inc. 03/11/09 15 Reliance Communications 03/31/09 5
Cisco Systems 09/23/09 13 HCL Technologies 06/30/09 7
Hewlett-Packard 01/20/09 11 Idea Cellular 03/31/08 12
Oracle Corp. 08/21/09 12 Mphasis 10/31/08 10
Intel Corporation 04/03/09 12 Siemens 09/30/08 13
Qualcomm Inc. 01/13/09 12 Tech Mahindra 03/31/09 14
Mean 11.60 Mean 11.40
Median 12.00 Median 11.50
Panel B: Capital goods
US Firms Proxy
Date
Board
Size
Indian firms Annual
Report
Board
Size
United Technologies 02/20/09 14 BHEL 03/31/09 16
The Boeing Company 03/13/09 9 L&T 03/31/09 17
Caterpillar Inc. 04/21/09 14 ABB 12/31/08 8
Honeywell International 03/12/09 10 Crompton Greaves 03/31/09 8
Lockheed Martin 03/13/09 13 Bharat Electronics 03/31/09 16
General Dynamics 03/20/09 10 Suzlon Energy 03/31/09 6
Illinois Tool Works Inc. 03/25/09 10 Thermax 03/31/09 9
Deere & Company 01/15/09 12 Areva T&D 12/31/08 8
Raytheon Company 04/24/09 8 Punj Llyod 03/31/09 10
Northrop Grumman 04/17/09 13 BEML Ltd 03/31/09 11
Mean 11.30 Mean 10.90
Median 11.00 Median 9.50
In each of the three tables, Panel A compares board variable of US firms and Indian firms in the information technology industry and Panel B compares board variable of US firms and Indian firms in capital goods industry. We report mean and median of each of the three board variables for both industries, for both countries. Significance for difference in means is obtained using the 2-sided t-test. Statistical significance for differences in medians is obtained using the Wilcoxon Rank Sum test.
4. DISCUSSION OF RESULTS
The objective of this study is to study the country effect and industry effect on board structures. The results of our comparison of the board structures of US firms and Indian firms in two different industries are reported in four tables. As discussed above, Table 1 provides descriptive statistics of the forty firms used in our analysis. Table 2 reports results of a comparison of board size of US firms and Indian firms in technology and capital good sectors where in Panel A reports results for technology firms and Panel B reports results for capital goods.
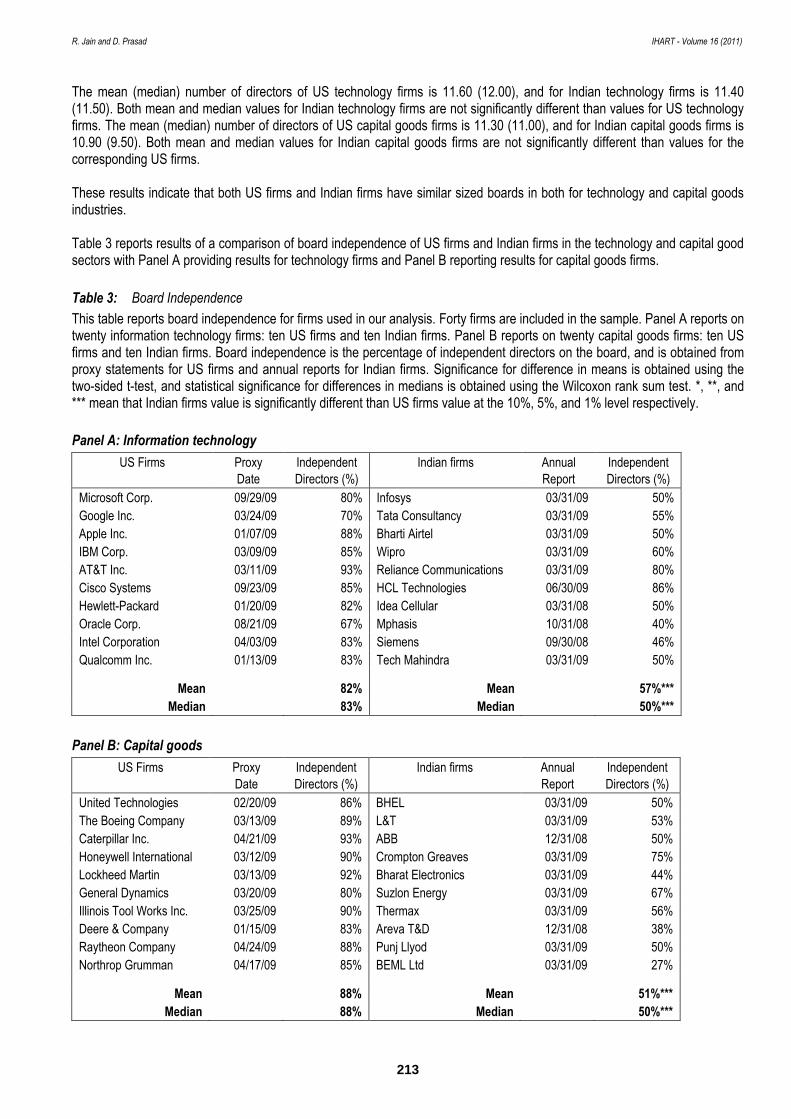
R. Jain and D. Prasad IHART - Volume 16 (2011)
213
The mean (median) number of directors of US technology firms is 11.60 (12.00), and for Indian technology firms is 11.40 (11.50). Both mean and median values for Indian technology firms are not significantly different than values for US technology firms. The mean (median) number of directors of US capital goods firms is 11.30 (11.00), and for Indian capital goods firms is 10.90 (9.50). Both mean and median values for Indian capital goods firms are not significantly different than values for the corresponding US firms. These results indicate that both US firms and Indian firms have similar sized boards in both for technology and capital goods industries. Table 3 reports results of a comparison of board independence of US firms and Indian firms in the technology and capital good sectors with Panel A providing results for technology firms and Panel B reporting results for capital goods firms.
Table 3: Board Independence
This table reports board independence for firms used in our analysis. Forty firms are included in the sample. Panel A reports on twenty information technology firms: ten US firms and ten Indian firms. Panel B reports on twenty capital goods firms: ten US firms and ten Indian firms. Board independence is the percentage of independent directors on the board, and is obtained from proxy statements for US firms and annual reports for Indian firms. Significance for difference in means is obtained using the two-sided t-test, and statistical significance for differences in medians is obtained using the Wilcoxon rank sum test. *, **, and *** mean that Indian firms value is significantly different than US firms value at the 10%, 5%, and 1% level respectively.
Panel A: Information technology
US Firms Proxy
Date
Independent
Directors (%)
Indian firms Annual
Report
Independent
Directors (%)
Microsoft Corp. 09/29/09 80% Infosys 03/31/09 50%
Google Inc. 03/24/09 70% Tata Consultancy 03/31/09 55%
Apple Inc. 01/07/09 88% Bharti Airtel 03/31/09 50%
IBM Corp. 03/09/09 85% Wipro 03/31/09 60%
AT&T Inc. 03/11/09 93% Reliance Communications 03/31/09 80%
Cisco Systems 09/23/09 85% HCL Technologies 06/30/09 86%
Hewlett-Packard 01/20/09 82% Idea Cellular 03/31/08 50%
Oracle Corp. 08/21/09 67% Mphasis 10/31/08 40%
Intel Corporation 04/03/09 83% Siemens 09/30/08 46%
Qualcomm Inc. 01/13/09 83% Tech Mahindra 03/31/09 50%
Mean 82% Mean 57%***
Median 83% Median 50%***
Panel B: Capital goods
US Firms Proxy
Date
Independent
Directors (%)
Indian firms Annual
Report
Independent
Directors (%)
United Technologies 02/20/09 86% BHEL 03/31/09 50%
The Boeing Company 03/13/09 89% L&T 03/31/09 53%
Caterpillar Inc. 04/21/09 93% ABB 12/31/08 50%
Honeywell International 03/12/09 90% Crompton Greaves 03/31/09 75%
Lockheed Martin 03/13/09 92% Bharat Electronics 03/31/09 44%
General Dynamics 03/20/09 80% Suzlon Energy 03/31/09 67%
Illinois Tool Works Inc. 03/25/09 90% Thermax 03/31/09 56%
Deere & Company 01/15/09 83% Areva T&D 12/31/08 38%
Raytheon Company 04/24/09 88% Punj Llyod 03/31/09 50%
Northrop Grumman 04/17/09 85% BEML Ltd 03/31/09 27%
Mean 88% Mean 51%***
Median 88% Median 50%***

Country vs. Industry Effect on Board Structures
214
The mean (median) percentage of independent directors of US technology firms is 82.0% (83.0%), and for Indian technology firms is 57.0% (50.0%). Both mean and median values for Indian firms are significantly different than values for US firms at the one percent level. The mean (median) number of directors of US capital goods firms is 88.0% (88.0%), and for Indian technology firms is 51.0% (50.0%). Both mean and median values for Indian firms are significantly different than values for US firms at the one percent level. These results indicate that Indian firms have less independent boards as compared to US firms in both for technology and capital goods sectors. Table 4 reports the results of a comparison of board leadership of US firms and Indian firms in both the technology and capital good sectors. If the CEO also holds the position of Chairman then we define the dual role as ‗1‘ and otherwise ‗0.‘ Panel A reports results for technology firms and Panel B reports results for capital goods.
Table 4: Board Leadership
This table reports board leadership for firms used in our analysis. Forty firms are included in the sample. Panel A reports on twenty information technology firms: ten US firms and ten Indian firms. Panel B reports on twenty capital goods firms: ten US firms and ten Indian firms. Dual role is equal to ‗1‘ if the CEO also holds the chairperson position and ‗0‘ otherwise. The information is obtained from proxy statements for US firms and annual reports for Indian firms. Significance for difference in means is obtained using the two-sided t-test, and statistical significance for differences in medians is obtained using the Wilcoxon rank sum test. *, **, and *** mean that Indian firms value is significantly different than US firms value at the 10%, 5%, and 1% level respectively.
Panel A: Information technology
US Firms Proxy
Date
Dual role
(0 or 1)
Indian firms Annual
Report
Dual role
(0 or 1)
Microsoft Corp. 09/29/09 0 Infosys 03/31/09 0
Google Inc. 03/24/09 1 Tata Consultancy 03/31/09 0
Apple Inc. 01/07/09 0 Bharti Airtel 03/31/09 1
IBM Corp. 03/09/09 1 Wipro 03/31/09 1
AT&T Inc. 03/11/09 1 Reliance Communications 03/31/09 0
Cisco Systems 09/23/09 1 HCL Technologies 06/30/09 1
Hewlett-Packard 01/20/09 1 Idea Cellular 03/31/08 0
Oracle Corp. 08/21/09 0 Mphasis 10/31/08 0
Intel Corporation 04/03/09 0 Siemens 09/30/08 0
Qualcomm Inc. 01/13/09 0 Tech Mahindra 03/31/09 0
Mean 0.50 Mean 0.30
Median 0.50 Median 0.00
Panel B: Capital goods
US Firms Proxy
Date
Dual role
(0 or 1)
Indian firms Annual
Report
Dual role
(0 or 1)
United Technologies 02/20/09 0 BHEL 03/31/09 1
The Boeing Company 03/13/09 1 L&T 03/31/09 1
Caterpillar Inc. 04/21/09 1 ABB 12/31/08 0
Honeywell International 03/12/09 1 Crompton Greaves 03/31/09 0
Lockheed Martin 03/13/09 1 Bharat Electronics 03/31/09 1
General Dynamics 03/20/09 0 Suzlon Energy 03/31/09 1
Illinois Tool Works Inc. 03/25/09 1 Thermax 03/31/09 0
Deere & Company 01/15/09 0 Areva T&D 12/31/08 0
Raytheon Company 04/24/09 1 Punj Llyod 03/31/09 1
Northrop Grumman 04/17/09 1 BEML Ltd 03/31/09 1
Mean 0.70 Mean 0.60
Median 1.00 Median 1.00
R. Jain and D. Prasad IHART - Volume 16 (2011)
215
The mean (median) value for board leadership of US technology firms is 0.50 (0.50), and for Indian technology firms is 0.30 (0.00). It indicates that fifty percent of US firms and thirty percent of Indian technology firms have a dual role for the CEO. However, these mean and median values for Indian firms are not significantly different than the values for US firms. The mean (median) value for board leadership of US capital goods firms is 0.70 (1.00), and for Indian capital goods firms is 0.60 (1.00). It indicates that seventy percent of US firms and sixty percent of Indian capital goods firms have a dual role for the CEO. These mean and median values for Indian firms are not significantly different than values for US firms either. These results indicate that US firms and Indian firms have similar board leadership structure for both technology firms and capital goods firms. To summarize, the results of a comparison of board structures of US firms and Indian firms suggests that Indian firms have similar board size and board leadership structure irrespective of the industry. However, Indian firms are less independent than US firms, whatever the industry, indicating that there is more of a country effect in the determination of board structures.
5. CONCLUSIONS
The Board of Directors is an important institution in the corporate governance of firms. Studies find that a relationship exists between board structures and board actions and imply that some board characteristics are more desirable than others. The three most important board characteristics identified in the literature are board size, board independence, and board leadership. Several studies have examined factors affecting the determination of these board characteristics. However, our study is expected to contribute to the existent literature since we examine the issue in an international setting. We analyze country and industry effects on board structures. We compare the board structures of large US firms and Indian firms in the technology and capital goods sectors. Our findings are supportive of the country effect being more than an industry effect. We find that US firms and Indian firms have similar board size and board leadership structures in both the technology and capital goods sectors. However, the boards of Indian firms have less independent members as compared to US firms be it the technology sector or the capital goods sector. Thus, there is a country effect for both industries. As companies become more international and operate under different regulatory and different corporate cultures across the globe, their boards will be affected. Our study examines a narrow area related to this discussion, and offers interesting avenues for further research. For example, it may be interesting to compare the board structure of companies which have expanded beyond their home countries with the board structure of purely domestic companies.
REFERENCES
Adams, R., Hermalin, B.E., and Weisbach, M.S., The Role of Board of Directors in Corporate Governance: A Conceptual Framework & Survey, working paper.
Bhagat, S., Black, B., 2002. The Non-Correlation Between Board Independence and Long-Term Firm Performance. Journal of Corporation Law, 27, 231-273
Brickley, J.A., Coles, J.L., Jarrell, G., 1997. Leadership Structure: Separating the CEO and the Chairman of the Board. Journal of Corporate Finance, 3, 189-220.
Eisenberg, T., Sundgren, S., and Wells, M.T., Larger Board Size and Decreasing Firm Value in Small Firms, Journal of Financial Economics, April 1998, 48 (1), 35–54.
Hermalin B.E., Weisbach M.S., 1991. The Effects of Board Composition and Direct Incentives on Firm Performance. Financial Management, 20, 101-112.
Hermalin B.E., Weisbach M.S., 1998. Endogenously Chosen Boards of Directors and Their Monitoring of the CEO. American Economic Review, 88, 96-118.
Rosenstein, S., Wyatt, J., 1990. Outside Directors, Board Independence, and Shareholder Wealth. Journal of Financial Economics, 26, 175 – 84.
Yermack D., 1996. Higher Valuation of Companies with a Small Board of Directors. Journal of Financial Economics, 40, 185-211.
M. Kaufman IHART - Volume 16 (2011)
216
THE IMPACT HUMAN RESOURCES HAS ON STRATEGIC PLANNING
Matthew Kaufman Nova Southeastern University, USA
ABSTRACT
This research paper analyzes the progression of Human Resources into the strategic decision making process. Over time, executives have come to understand the value Human Resources can bring to long term planning. While there are some forward thinking corporations there are still some that view Human Resources as HR and allow for limited impact. This paper will include examples of Human Resources contributing to strategic decision making and the positive outcomes and the times Human Resources is not included in the long range planning and the results of their exclusion. Retention, compensation packages, corporate culture, benefits and community involvement are just a few critical areas that fall under Human Resources‘ umbrella. This paper will explore how Human Resources can assist with competition. One of most effective ways to compete is to hire, develop and retain better employees. Since the business world has gone global in the last 20 years, Human Resources has become critical in incorporating all the different cultures, laws and languages to still keep it one corporation. Human Resources has become a major player in the metrics part of the business with surveys, reviews, leadership programs, mentor programs, exit interviews and other assessments to allow the executive to get a tangible understanding or snapshot of their current status. Human Resources provides information about performance and growth so management can evaluate their teams and develop employees into contributing members of the team
Keywords: Human Resources, Strategy, Balanced Scorecard, Competitive Advantage, CSR (Corporate Social Responsibility).
INTRODUCTION
When the words human resources are separated and looked at literally they can be defined as people of value. Interestingly enough that is not always how the Human Resources department is viewed. Human Resources has been prevalent for over 200 years. Their role in maintaining union relationships with management is documented. In 1900 BF Goodrich and American Cash Register in 1902 formed separate departments to employee related functions (Khilawala, 2011). In 1911 Frederick Taylor wrote his Scientific Management. Taylor advocated a rational goal-setting model that focused on fractionalization of jobs, tight control of workers and improved methods of employee selection, training and incentives (Langbert, 2002). Human Resources began to take shape after the Hawthorne studies in the 1930‘s and showed empirical value. Once the Congressional Acts of the 1960‘s and 1970‘s such as OSHA, the Civil Rights Act and the Equal Pay Act, Human Resources was now a must have for all corporations.
The purpose of this paper is to describe the role and relevance of Human Resources in strategic planning. There are several tools that can be used to assess and analyze the employees of a given company. Barney (1991) defines in detail what makes a resource valuable. Employees meet the above mentioned author‘s criteria for a valuable resource. This paper will go into further detail on how Human Resources provides the foundation for the attracting, assessing, hiring and retention of the employees.
Porter (1985) developed a value chain that broke down the primary and support activities of a company. Human Resources is listed as a contributor in the support activities sections. In his article he states that competitive advantage grows out of the entire system (Porter, 1996). One of the most well regarded business thinkers of this generation includes Human Resources in a model that is a critical strategic tool. This paper will elaborate on the role of Human Resources within the Value Chain model.
Schoemaker (1995) described scenario planning as a disciplined method for imagining possible futures that companies have applied to a great range of issues. Human Resources is the ideal group to provide information on potential responses or fallout regarding the employees. They are the closest to the unions, they hear the opinion of the workforce more regularly and they are the group providing the metrics for the productivity and personality of the staff. The paper will delve into this area and describe Human Resources‘ potential role in scenario analysis.
Kaplan and Norton (2001) developed the Balanced Scorecard and it has become a well known strategic tool. They specifically write that traditional Human Resource systems and processes played an essential role in enabling this transition. The transition is the result following the recommendations of the Balanced Scorecard results.
M. Kaufman IHART - Volume 16 (2011)
217
Ethical problems arise almost continuously in Human Resource Management (Hosmer, 1987). Since people are at the root of Human Resources is stands to reason that ethical dilemmas will be a major part of the division‘s day. Hosmer (1994) goes on to write another article about ethics and this time the article is wondering if corporate strategy should be built upon ethical reasoning. This paper will describe Human Resources‘ role in ethical decision making and how it affects strategy. Carroll (1979) wrote a business world changing article regarding corporate social responsiveness (CSR). Human Resources is heavily involved in the shaping of the culture within the corporation. According to Hanke and Starke (2009) the cultural perspective within a company will affect its innovation and the organization‘s development. They stress that Human Resources development is key to cultural perspective. Lastly, Yip et al (1997) wrote the first article connecting Human Resource Management statistically to global corporate performance. With the growth of multinational corporations there will be hiring overseas, cultural challenges, language barriers, benefit and government differences and a host of other situations. Human Resources will be at the forefront of these issues.
LITERATURE REVIEW
Scenario Planning
Among the many tools a manager can use for strategic planning, scenario planning stands out for its ability to capture a whole range of possibilities in rich detail (Schoemaker, 1995). Does Human Resources play a role within scenario planning? Horney et al (2010) describe how Human Resources has a significant impact on the agility of a corporation. According to the authors, the ability to make quick decisions while navigating a murky business environment is critical to the growth of the company. Scenario planning discussions provide a forum for indentifying the knowledge, skills, and attributes leaders need in new and different business environments (Horney et al, 2010). As Human Resource Development professionals grow in their scenario planning expertise, their ability to influence the strategy and overall planning of the organization constitutes a unique opportunity to influence decision making at the highest levels in organizations (Chermack & Nimon, 2008). According to the authors, Human Resources has been a heavy contributor in the future planning of the corporation and their involvement in scenario planning is not only logical, it‘s beneficial.
Balanced Scorecard
According to Kaplan and Norton (1996), a balanced scorecard augments traditional financial measures with benchmarks for performance in three key nonfinancial areas: a company‘s relationship with its customers, its key internal processes, and its learning and growth. Human Resources is involved with each of the three components. The authors go on to define how a balanced scorecard works referring to translating the vision, communicating and linking, business planning and feedback. These four areas reiterate how a balanced scorecard focuses on the melding of the more abstract business concepts with the quantitative side. In an article written 8 years later, Kaplan and Norton (2004) many of the human and organizational capital – skills, talents, knowledge, culture, leadership, alignment and teamwork have been measured in the ―learning and growth‖ perspective of the Balanced Scorecard. Ulrich (1997) takes it one step further stating that Human Resources has such a significant impact that it should be measured separately on its own scorecard. He questions the ability to measure Human Resources‘ contribution and offers three approaches: stakeholder, utility and relationship approach which will be explained later in the paper. Becker et al (2001) developed a process by which Human Resources has a strategic pathway or map to show how Human Resource activity contribute to Balanced Scorecard goals. The authors attempt to answer the question of how do Human Resources activities affect non Human Resources activities that affect the Balanced Scorecard. They use a specific example that will be detailed later in the paper to explain their idea.
Ethics
In 1987 LaRue Hosmer stated that ethical problems arise almost continually in Human Resource Management. He felt that since Human Resources was all about people and when people are harmed in some way there is an ethical problem that requires ethical analysis. Hosmer (1998) also wrote about the horrifying possible results of a limited Human Resource policy. The Exxon Valdez had a rule that there was to be no alcohol consumption 8 hours prior to working on a tanker. Unfortunately, that rule was never enforced. Hosmer (1994) wrote a landmark article asking the question, ―should the integrity of common purpose be included as an integral rather than a peripheral component in the strategic planning process‖?
The Impact Human Resources has on Strategic Planning
218
Kulkarni (2010) explores that concept of voice and freedom and how it relates to the fairness of a company. The research is valuable for Human Resource Management and strategy because freedom and the underlying justice considerations may influence employee trust, commitment, loyalty, effort and perhaps competitive advantage. The article discusses the persistence of justice in giving the employee a voice. This persistence sets the culture for the competitive advantage mentioned above. Caldwell et al (2011) defines ethical stewardship as a model of governance that models obligations due to the many stakeholders and that maximizes long-term organizational wealth creation. The authors go on to describe the importance of Human Resources in building this ethical stewardship. They connect the link and go into detail outlining how ethics build a stronger corporation and how Human Resources plays an influential role in this development. In fact, they clearly state that one of the three major factors for Human Resources to have an impact is the merger of Human Resources with the strategic function. Klebe Trevino et al (1999) write that Human Resources should have an expanded role in the ethics/compliance management because of the importance of issues such as employee fair treatment.
Corporate Social Responsibility
Carroll (1979) developed the first working model relating to Corporate Social Responsibility (CSR). 30 years ago he stated that his conceptual CSR model can show managers that social responsibility is not separate and distinct from economic performance. Hanke and Stark (2009) describe how corporate culture has an enormous impact on corporate citizenship. Human Resource programs and development provide learning processes driven by learning and empowerment. They continue to discuss how large a role Human Resource plays in creating an environment where innovation is encouraged and participation in the outside community is rewarded. Cruz Deniz-Deniz and De Saa-Perez (2003) researched the impact Human Resources has on employees in regards to corporate social responsiveness. They advocate a process designed to generate the highest levels of loyalty, satisfaction and commitment from the workforce through high performance Human Resource practices. The authors focus on a few areas that Human Resources can have an impact on corporate strategy: employee selection, training, job design, communications, appraisals, rewards and other. Sukserm and Takahashi (2010) wrote an in depth article describing a process they call Human Resource Development for corporate social responsibility. They use several studies as evidence of how this process would develop ―good people‖, provide profit and help to contribute socially to the world around them. The authors provide an eight step process to implement their program. Fuentes et al (2008) write an article from a European perspective. Their perspective describes the importance of corporate social responsibility internally and externally of the company. They provide four categories to clarify their thoughts: basic human rights, improving the quality of work, actions in the area of outsourcing and actions relating to company restructuring and social implications thereof.
Global Business Strategy
Conn and Yip (1997) wrote one of the first articles to make the statistical link between global human resources processes and superior corporate performance. They believe that the transfer of core competencies or capabilities is key to successful globalization. The authors state that Human Resources is the leading player in the transfer process. In a previous article, Yip (1989) discusses some of the drawbacks to globalization. He specifically mentions hiring additional staff, culture and morale concerns which are Human Resource related functions. Yip et al (1997) define global human resources as the use of managers outside of their home countries. In their study Human Resources does not have a statistically significant path in relation to global strategy but they do state that the nationality of the corporations does have an affect. European firms have a stronger statistical advantage over American firms due to their ability to integrate more efficiently than the American companies (Yip et al, 1997).
Value Chain
Porter (1985) developed the process of value chain analysis. He broke the activities into two categories: primary and support. He stated that each activity was critical to the validity and efficiency of the value chain. Human Resources is clearly shown in
M. Kaufman IHART - Volume 16 (2011)
219
the support activities. Strategic Human Resources practices are those practices specifically developed, implemented and executed based on a deliberate linkage to a company‘s strategy (Huselid et al 1997).
Resource Based View
The emergence of the Resource Based View (RBV) in the early 1990‘s provided an impetus for ―best practices‖ approaches in Human Resources Management from a typical inside out perspective (Boselie, 2009). The Resource Based View suggests that sources of sustained competitive advantage are firm resources that are valuable, rare, imperfectly imitable and non substitutable (Barney, 1991). Birdi et al (2008) developed a comprehensive study to show that Human Resource Management has a larger impact than operational practices such as just in time. They researched 308 companies and over 22 years of data to provide their results. Finally, the Resource Based View has significantly and independently influenced the fields of strategy and Strategic Human Resources Management. More importantly it has provided a theoretical bridge between the two (Wright et al, 2001).
ANALYSIS
Scenario Planning
Scenario planning is designed to recognize uncertainty in the business environment (Chermack & Nimon, 2008). Since Human Resources is based largely on people, their level of uncertainty is as high as any other business function. They are accustomed to uncertainty and work in an abstract world daily. They are constantly fielding questions from employees and executives regarding possible outcomes if they wanted to offer a new benefit, fired a particular employee, changed a policy or wanted to provide a reward. Human Resources‘ job, it could be argued, is a daily dose of scenario planning. At the core of linking scenario planning and learning is the notion that participants must challenge their assumptions about what is true and what is possible (Chermack, 2003). Learning is the operative word in his quote above. For someone to learn, someone else has to teach. Chermack (2004) writes that with current expertise about organizational learning, dialogue and the impact of these elements on firm performance, Human Resource professionals can offer much that is currently missing from strictly strategy based approaches to understanding scenario planning. The ideal teacher in scenario planning is Human Resources. Their role of being the liaison between executives and the staff allows them a rare insight into likely results of a situation. Human Resources touches every department of a corporation. They track development, training and employee reviews so they monitor the past. Human Resources also monitors trends in compensation, titles, recruiting and the shrinking or growing of talent pools. These trends translate to Human Resources looking to the future. Last but not least, Human Resources remains a current observer of the company‘s culture and employee relations so they have their finger on the pulse of the corporation today. It would be difficult to imagine a group would be better suited to be charged with scenario planning than Human Resources.
Balanced Scorecard
One thing we know from numerous studies of performance measurement and management is that measurement shapes behavior (Jennings, 2010). Another way to say it is ―what gets measured gets done‖. Corporations for years have been trying to find metrics that will allow them to assess the productivity or lack thereof within a specific area of their business. So much of business is abstract – reputation, goodwill, brand, culture and loyalty that it is becoming more and more important to nail down the quantifiable components. The Balanced Scorecard provides a tool that allows a corporation to take a snapshot of their current situation numerically. Kaplan and Norton (1996) state that the Balanced Scorecard provides three elements essential to strategic learning: communicates a holistic model that links individual efforts and accomplishments to business unit objectives, a strategic feedback system to test, validate and modify the hypotheses embedded in a business unit‘s strategy and facilities the strategy review that most companies do quarterly or annually. Considering this definition, who better to manage a process relating to a holistic model encompassing every division, a feedback system and corporate reviews than Human Resources? Becker, Huselid and Ulrich took the Balanced Scorecard one step closer to Human Resources. They wrote a book that introduced the HR Scorecard. According to their model there are 5 key elements (Becker et al, 2001):
Workforce Success. It asks: Has the workforce accomplished the key strategic objectives for the business?

The Impact Human Resources has on Strategic Planning
220
Right HR Costs. It asks: Is our total investment in the workforce (not just the HR function) appropriate (not just minimized)?
Right Types of HR Alignment. It asks: Are our HR practices aligned with the business strategy and differentiated across positions, where appropriate?
Right HR Practices. It asks: Have we designed and implemented world class HR management policies and practices throughout the business?
Right HR Professionals. It asks: Do our HR professionals have the skills they need to design and implement a world-class HR management system?
The model is built under a similar premise as the Balanced Scorecard. It forces the Human Resources group to ask some hard questions and listen to the answers. The authors make it clear throughout their writing that the HR Scorecard emphasizes and reinforces the firm‘s business strategy (Becker et al, 2001).
Ethics
All of the basic human resource processes – selection, training, evaluation and motivation – have some ethical content (Hosmer, 1987). Twenty-five years later ethics has become a major headline in the corporate world. Considering Enron, WorldCom, Adelphia, Arthur Andersen and HealthSouth the last decade or so has been littered with unethical behavior. During that time the public and the government have become more demanding for ethical corporate behavior. The media has become a watchdog and reports any impropriety immediately with round the clock news. Vickers (2005) states that Human Resources is now at the table and there is a role they must play in establishing an ethical culture. Clearly, someone has to lay a foundation of moral behavior for employees to follow. The difficult part is when times are difficult and there is enormous pressure how will people respond. According to Vickers (2005), a study by the Society of Human Resources Management (SHRM) and the Ethics Resource Center show that 49% of respondents felt that they were being pressured to follow their boss‘ directives and 48% felt pressure to behave questionably ethical due to overly aggressive business objectives. The conflict is almost impossible to avoid in today‘s fast paced and high pressured market. Human Resources needs to be a safe haven that employees can approach to convey unethical behavior. Kulkarni (2010) writes about the value of the employees having a voice and more importantly a voice of equal value to all employees. The question is what does Human Resources do with the information provided by an employee‘s voice? They have to hope that the executive management team or the Board are capable of being uncompromised. Luckily, the government provides a refuge to whistleblowers so there is some outlet. Vickers (2005) suggests four responsibilities in cultivating an ethical culture:
1. Human Resources must be an ethics champion for the company 2. Leadership selection and development will be instrumental and must include an ethical component. 3. Human Resources must be aware of all new government guidelines and develop the appropriate policies for guidance
and compliance. 4. Human Resources must remain aware of current trends outside the company to at least stay even with evolving unethical
behavior. He believes strongly that Human Resources not only has the ability but also the responsibility to ―take the mantle‖ of ethical leadership. A possibility in the future is a separate department within Human Resources focusing purely on ethics. The stakes have become so high. All someone has to look at is the mortgage industry or hedge funds to get a sense for how much of an impact unethical behavior can have on the business world.
Corporate Social Responsibility
In 1979 Archie Carroll wrote a ground breaking article relating to corporate social responsibility. In the next 30 years, CSR has become one of the more public and discussed components to business. Friedman has made his point clear that business should not be concerned with CSR and in fact is doing the company and business world a disservice just by participating (Carroll, 1979). At this time it would be difficult to go back to Friedman‘s business world in a vacuum mentality. Since CSR has become so prevalent, corporations have to put more time and resources into it. Human Resources is well suited to drive CSR. Lam and Khare (2010) write that Human Resources is the ideal group to manager corporate social responsibility.
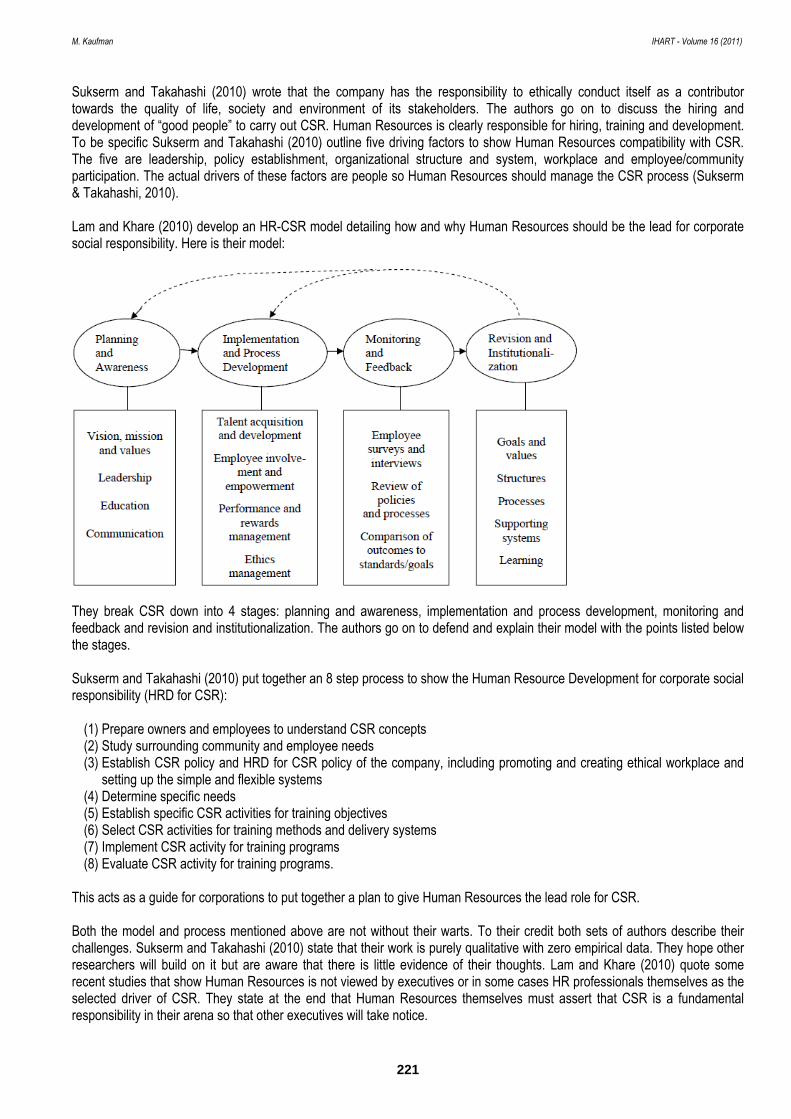
M. Kaufman IHART - Volume 16 (2011)
221
Sukserm and Takahashi (2010) wrote that the company has the responsibility to ethically conduct itself as a contributor towards the quality of life, society and environment of its stakeholders. The authors go on to discuss the hiring and development of ―good people‖ to carry out CSR. Human Resources is clearly responsible for hiring, training and development. To be specific Sukserm and Takahashi (2010) outline five driving factors to show Human Resources compatibility with CSR. The five are leadership, policy establishment, organizational structure and system, workplace and employee/community participation. The actual drivers of these factors are people so Human Resources should manage the CSR process (Sukserm & Takahashi, 2010). Lam and Khare (2010) develop an HR-CSR model detailing how and why Human Resources should be the lead for corporate social responsibility. Here is their model:
They break CSR down into 4 stages: planning and awareness, implementation and process development, monitoring and feedback and revision and institutionalization. The authors go on to defend and explain their model with the points listed below the stages. Sukserm and Takahashi (2010) put together an 8 step process to show the Human Resource Development for corporate social responsibility (HRD for CSR):
(1) Prepare owners and employees to understand CSR concepts (2) Study surrounding community and employee needs (3) Establish CSR policy and HRD for CSR policy of the company, including promoting and creating ethical workplace and
setting up the simple and flexible systems (4) Determine specific needs (5) Establish specific CSR activities for training objectives (6) Select CSR activities for training methods and delivery systems (7) Implement CSR activity for training programs (8) Evaluate CSR activity for training programs.
This acts as a guide for corporations to put together a plan to give Human Resources the lead role for CSR. Both the model and process mentioned above are not without their warts. To their credit both sets of authors describe their challenges. Sukserm and Takahashi (2010) state that their work is purely qualitative with zero empirical data. They hope other researchers will build on it but are aware that there is little evidence of their thoughts. Lam and Khare (2010) quote some recent studies that show Human Resources is not viewed by executives or in some cases HR professionals themselves as the selected driver of CSR. They state at the end that Human Resources themselves must assert that CSR is a fundamental responsibility in their arena so that other executives will take notice.
The Impact Human Resources has on Strategic Planning
222
There is a compelling case for Human Resources leading the development of CSR. There are many articles and authors that contributed to the articles mentioned here so the area is clearly being researched. The consensus is the same and it will be interesting to see if the authors are correct or the study quoted by Lam and Khare (2010) which stated that only 34% of Human Resource Managers that responded monitor the environmental aspect of the business(Fox, 2008).
Global Strategy
The business world certainly has flattened out in the last two decades. Multinational Enterprises (MNE‘s) have become prevalent and pervasive. Globalization strategy has become critical in this trend. Not too long ago, George Yip et al (1997) developed a model for global strategy including global Human Resources as a component. He performed a study attempting to analyze nationality effects in global strategy. At the time he found that Human Resources did not have a significant impact on global strategy. It is important to note that the data is over 15 years old. Three years later, Yip et al (2000) produced a more intricate model discussing the importance of commitment while implementing global strategy. One of the key cogs in his commitment category is Human Resources. Commitment to globalization is obviously critical in this setting. Human Resources has some challenges similar to some of the other divisions within an MNE regarding the centralization or localization of their control. Fenton-O‘Creevy et al (2008) researched the decision of centralized versus localized Human Resources. They wrote that MNE‘s would be better served having centralized Human Resources within the home country unless there are specific needs in a country such as labor unions. They conclude the article by stating the importance of Human Resources in global strategy no matter where the control is located (Fenton-O‘Creevy et al, 2008).
Value Chain
Porter (1985) gives credence to Human Resources by placing them for all to see in his model. While Human Resources is not a primary activity it still warrants consideration and lends value to the corporation. The connection Human Resources provides for all of the employees makes them a rather powerful link in the chain and as Porter (1985) states the chain is as strong as its strongest link. Ijose (2010) explored the impact of Human Resources within a partnership between a larger corporation and a Small to Medium Enterprise (SME). He specifically described how critical Human Resources is in the value chain and how much influence Human Resources can have on a strategic partnership or merger. In any integration of two groups of employees there will be people issues, cultural issues, payroll issues and several other Human Resource related responsibilities.
Resource Based View
Barney (1991) spotlights the importance of sustained competitive advantage through firm resources. His model and ideas forced companies to look internally and dissect exactly what assets were available to them. The definition of a valuable resource, according to Barney (1991) is one that is rare, inimitable, non substitutable and brings value to the company. Employees meet all the criteria described by Barney and Human Resources is at the forefront in that arena. Wright et al (2001) point to the development of Strategic Human Resource Management (SHRM) due to the emergence of Resource Based View (RBV) strategy. The authors state that the majority of articles written after 1991 discussing Human Resources‘ credibility include RBV as evidence. Knowledge is powerful in the RBV model and knowledge and learning have been topics in Human Resource literature for many years (Wright et al, 2001). Barney (1991) categorizes internal assets by breaking down the RBV model into 3 levels of sustainability: tangible, intangible and organizational. Tangible is the least sustainable and organizational is the most. Human Resources is responsible for a large portion of the intangible category, the people.
CONCLUSIONS
The purpose of this paper is to show how critical Human Resources is to the strategy process. Human Resources has been asking for a ―seat at the table‖ for years and according to the literature is getting closer. Still not there yet, though. This paper used seven well known components to strategic planning as examples of how Human Resources can contribute and in some cases lead during global strategic planning.
M. Kaufman IHART - Volume 16 (2011)
223
Scenario Planning is all about imagining possible outcomes to created situations. To do this, executives must have a solid understanding of their people, culture and current environment at their company. Human Resources is best poised to provide that data so they would be instrumental on that committee. The Balanced Scorecard acts as perpetual feedback system. Human Resources manages the quarterly and annual review processes in most companies so is well suited to support this project. In addition to the feedback, Human Resources has experience in collecting the data and turning it into metrics which provide executives with the snapshot they need to assess their company. Becker et al (2001) created the Human Resource Scorecard to act as a check and balance for their own department. This way someone is guarding the guardians. Today‘s headline leads to tomorrow‘s reduction in force. Ethics is such a sensitive issue today and with whistle blowing, watchdog advocacy groups and invasive investigative news it is rare for anything unethical to go unnoticed. Policies are put in place for a reason and Human Resources is normally tasked with devising, implementing and enforcing policies within the company. The policies help build an ethical culture that just becomes the norm for all employees. Corporate Social Responsibility is still emerging for Human Resources as shown by the study quoted in Lam and Khare (2010). The authors mentioned above and Sukserm and Takahashi outlined a plan and a model to follow to place Human Resources at the forefront of CSR. A company‘s reputation and identity, Whole Foods for example, can be based around CSR. They need a department spearheading those efforts and putting policies in place to reinforce employee behavior so it becomes natural for them to act and think socially responsible. The global aspect of strategic planning has come on lately like ethics and CSR. To compete or survive today many companies must go global. The strategy involved is so difficult because not only is there the decentralization of control there is also the integrating of new cultures. Human Resources is the leader in understanding the importance of respecting the communication style, benefits, lifestyle and mores or cultures outside of the home office. Many of the MNE‘s are so large that they have offices in dozens of countries. Human Resources is crucial in understanding the differences in employment laws from country to country. Retention, recruiting and reputation are obviously important and by making a company culturally sensitive Human Resources makes the corporation attractive to potential candidates and current employees. Porter‘s (1985) Value Chain emphasizes the importance of all departments contributing to the common goal. Human Resources, while a secondary activity, has an influential role as it touches every person and every department in the company. Hopefully, Human Resources will continue to evolve and become a primary activity. Lastly, the Resource Based View depends on Human Resources since the employees are such a critical part of the competitive advantage. Wright et al (2001) show the connection between RBV and SHRM and how they have become interdependent. At the end of the day, the rarest resource is the individual. RBV brings significant credibility to Human Resources by highlighting their strongest contribution.
RECOMMENDATIONS
Human Resources has developed into a strategic contributor. The gap that they are facing is how does Human Resources go from contributor to leader. Recently, Tobey and Benson (2009) wrote an article about the possible demise of current HRM and what Human Resources should do to counter the trend. They propose a theory of cognitive action which alters the role of HRM from managing practices to managing capabilities and mental capacity of the entire strategic value chain (Tobey & Benson, 2009). Human Resources should evolve into more of a proactive and cerebral type group instead of reactive and process oriented. Chadwick and Dabu (2009) suggest that Human Resources focus more on producing Ricardian rents or profit. They also feel that HRM should evolve and develop into something more than clinging to RBV or past models. Their argument is compelling and they give a significant amount of examples and evidence to show need for change. The common bond from Chadwick and Dabu (2009) article and the Tobey and Benson (2009) is that they are both current and both wanting to help Human Resources succeed. All of the articles mentioned above show that Human Resources is valuable and does bring an inimitable contribution to strategic planning. It is just that they are not as forward thinking as the two mentioned here at the end. Human Resources must continue to evolve as the business world changes. Their seat at the table is a tenuous one and they need to continue to earn their keep.

The Impact Human Resources has on Strategic Planning
224
REFERENCES
Barney, Jay. (1991). Firm resources and sustained competitive advantage. Journal of Management, 17(1), 99. Becker, B., Huselid, M. and Ulrich, D. (2001), The HR Scorecard: Linking People, Strategy and Performance. Boston: Harvard
Business School Press. Birdi, Kamal, Clegg,Chris, Patterson, Malcolm, Robinson, Andrew. (2008). The impact of human resource and operational
management practices on company productivity: A longitudinal study. Personnel Psychology,61(3), 467. Caldwell, Cam, Truong, Do X, Linh, Pham T, Tuan, Anh. (2011). Strategic Human Resource Management as Ethical
Stewardship. Journal of Business Ethics, 98(1), 171. Carroll, A. (1979). A three dimensional conceptual model of corporate performance. Academy of Management, 4(4), 17-26. Chadwick, Clint and Dabu, Adina. (2009). Human Resources, HRM, and Competitive Advantage. Organization Science, 20(1),
253–272. Chermack, Thomas J., Nimon, Kim. (2008). The effects of scenario planning on participant decision-making style. Human
Resource Development Quarterly,19(4), 351. Chermack, Thomas J. (2004). A Theoretical Model of Scenario Planning. Human Resource Development Review, 3(4), 301. Chermack, Thomas J. (2003). Decision-making expertise at the core of human resource development. Advances in Developing
Human Resources, 5(4), 365. Chermack, Thomas J. (2003). A Methodology for Assessing Performance-Based Scenario Planning. Journal of Leadership &
Organizational Studies,10(2), 55. Conn, Henry P, Yip, George S. (1997). Global transfer of critical capabilities. Business Horizons,40(1), 22. de la Cruz Deniz-Deniz, Maria and De Saa-Perez ,Petra. (2003). A resource-based view of corporate responsiveness toward
employees. Organization Studies, 24(2), 299. Fenton-O'Creevy, Mark, Gooderham, Paul, and Nordhaug, Odd. (2008). Human resource management in US subsidiaries in
Europe and Australia: centralisation or autonomy? Journal of International Business Studies,39(1), 151. Fox, A. (2008). Get in the business of being green. HR Magazine, 53(6), 44-50. Fuentes-García, Fernando, Núñez-Tabales, Julia M, Veroz-Herradón, Ricardo. (2008). Applicability of Corporate Social
Responsibility to Human Resources Management: Perspective from Spain. Journal of Business Ethics, 82(1), 27. Hanke, Thomas and Stark, Wolfgang. (2009). Strategy Development: Conceptual Framework on Corporate Social
Responsibility. Journal of Business Ethics, 85, 507. Horney, Nick, Pasmore, Bill, O'Shea, Tom. (2010). Leadership Agility: A Business Imperative for a VUCA World. People and
Strategy,33(4), 32. Hosmer, LaRue. (1987). The ethics of management. Homewood, IL: Richard D. Irwin. Hosmer, L.T. (1994). Strategic planning as if ethics mattered. Strategic Management Journal, Summer, 17-34. Hosmer, LaRue Tone. (1998). Lessons from the wreck of the Exxon Valdez: The need for imagination, empathy, and courage.
Ruffin Series in Business Ethics, 109. Huselid, M.A., Jackson, S.E., and Schuler, R.S. (1997). Technical and strategic human resource management effectiveness as
determinants of firm performance. Academy of Management Journal 40(199), 171-188. Ijose, Olumide. (2010). Strategic human resource management, small and medium sized enterprises and strategic partnership
capability. Journal of Management and Marketing Research, 5(1), 13. Jennings Jr., Edward J. (2010). Strategic Planning and Balanced Scorecards: Charting the Course to Policy Destinations.
Public Administration Review,70, 224. Kaplan, R.S. and Norton, D.P. (1996). Using the Balanced Scorecard as a strategic management system. Harvard Business
Review, January-February, 76. Kaplan, R.S. and Norton, D.P. (2004). Strategy Maps. Boston: Harvard Business School Press. Khilawala, Rashida. (2011). History of Human Resources. http://www.buzzle.com/articles/history-of-human-resource-
management.html Klebe Trevino, Linda, Weaver, Gary R., Gibson, David G., Ley Toffler, Barbara. (1999). Managing ethics and legal
compliance: What works and what hurts. California Management Review, 41(2),131. Kulkarni, Sobodh, P. (2010). Sustaining the equality of employee voice: a dynamic capability. International Journal of
Organizational Analysis, 18(4), 442. Lam, Helen and Khare, Anshuman. (2010). HR's crucial role for successful CSR. Journal of International Business Ethics, 3(2),
3. Langbert, Mitchell. 2002. Continuous improvement in the history of human resource management. Management Decision,
40(10), 932. Porter, M.E. (1996). What is strategy? Harvard Business Review, November-December, 61-78. Porter, M. (1985). Competitive Advantage. New York, NY: Free Press. Schoemaker, P. (1995). Scenario planning: A tool for strategic thinking, Sloan Management Review, 41-56.

M. Kaufman IHART - Volume 16 (2011)
225
Sukserm, Thumwimon and Takahashi ,Yoshi. (2010). A Prospective Process for Implementing Human Resource Development (HRD) for Corporate Social Responsibility (CSR). Interdisciplinary Journal of Contemporary Research In Business, 2(1), 10.
Tobey, David H., and Benson, Philip G. (2009). Aligning Performance: The End of Personnel and the Beginning of Guided Skilled Performance. Management Revue, 20(1), 70.
Ulrich, D. (1997). Measuring human resources: An overview of practice and a prescription for Results. Human Resource Management, 36(3), 303-20.
Vickers, Mark R. (2005). Business Ethics and the HR Role: Past, Present, and Future. Human Resource Planning, 28(1), 26. Waring, Peter and Edwards, Tony. (2008). Socially Responsible Investment: Explaining its Uneven Development and Human
Resource Management Consequences. Corporate Governance : An International Review,16(3),135. Wright, Patrick W., Dunford, Benjamin D., Snell, Scott A. (2001). Human resources and the resource based view of the firm.
Journal of Management, 27(6), 701. Yip, G. S. (1989). Global strategy in a world of nations. Sloan Management Review, Fall, 41-56. Yip, George S., Johansson, Johny K., and Roos, Johan. (1997). Effects of nationality on global strategy. Management
International Review,37(4), 365. Yip, George S., Gomez Biscarri, Javier, and Monti, Joseph A. (2000). The role of the internationalization process in the
performance of newly internationalizing firms. Journal of International Marketing, 8(3), 10.
M. A. Walters Sr. IHART - Volume 16 (2011)
226
THE BIGGER THE CARROT: COGNIZANT COMPENSATION FOR EFFECTIVE HUMAN RESOURCE MANAGEMENT
Milton A. Walters, Sr. Argosy University, USA
ABSTRACT
To maintain efficient and motivated human capital during times of global economic recession is not a simple task. Rather, it is one that requires a best practice approach utilizing a compensation methodology that considers the full impact of compensation beyond money (Dewhurst, Guthridge, & Mohr‘s 2010) to ensure that quality of individual performance is given proper weight in the remuneration equation. This paper briefly outlines a paradigm for what may be termed ―cognizant compensation,‖ to assist human capital professionals of all organizations in maximizing both Return on Investment (ROI) and ethical values. Keywords: Human Capital, Cognizant, Compensation, Motivation, Salary.
THE BIGGER THE CARROT: COGNIZANT COMPENSATION FOR EFFECTIVE HUMAN RESOURCE MANAGEMENT
While considerable attention has been paid to the impact of human capital compensation on performance to propel forward motion (Bower 2009, Dewhurst, Guthridge, & Mohr 2010, Frauenheim 2010, Nazemetz 2009, Prokesch 2009), an area deserving of further consideration is the relationship of compensation to individual performance as both motivator and ocular proof of an organization‘s commitment to core ethical values. Such a strategic commitment to demonstrating that leadership recognizes and rewards individual initiative and achievement may be termed cognizant compensation. The potential benefits for enhanced performance and increased stake-holder buy-in may best be appreciated in the journey of a typical firm‘s leadership and HR department from more traditional strategies toward a cognizant compensation approach. Considering that the cost of recruitment, selection, on-boarding and training of human capital often exceeds their total yearly compensation (Allen, Bryant, & Vardaman, 2010) the ability of organizations of all shape, sizes, goods and services to recognize the contributing factors that affect their overall human capital compensation structure is vital to propel forward motion. Organizational leadership is constantly reviewing internal and external factors that determine the compensation packages that affirmative enterprises offer their human capital in order to analyze what works well, and what requires retooling, to achieve synergy with sound management strategies to best fulfill the organization‘s mission. This paper therefore argues for what can be termed ―cognizant compensation‖ as a best practice simultaneously fostering two priorities: human capital buy-in and continued motivation, and explicit fairness in the rewarding of individual employees. To illustrate these factors, a hypothetical company, ―XYZ,‖ will be used. It is anticipated that the information gleaned here will be adaptable if not replicable by other organizations, and serve as a firm foundation for further research.
COMPENSATION: THE ROLE OF MONEY
While money should not be viewed as the sole motivator (valuebasedmanagement.net 2010) for creating the compensation structure at XYZ, it remains a vital ingredient to recruit and retain the best human capital who can work with management to propel forward motion. Given this, it is important to establish the role money plays in creating a competitive earnings structure (Chenevert & Tremblay 2009) for all levels of salary negotiation at XYZ to impede employee turnover (Allen, Bryant, & Vardaman, 2010). Best practice would not only provide human capital a living wage, but recognize and reward employee performance in a fair and equitable manner. Superior performance would therefore receive more money, in addition to earning other forms of what could be referred to as cognizant compensation, i.e., rewards conferred on an employee to demonstrate management‘s awareness, and appreciation, of outstanding effort, achievement, or improvement.
SALARY NEGOTIATIONS
XYZ‘s leadership, in partnership with the Human Resource Department, is fully aware that an employee‘s salary sends a signal to the employee regarding her/ his worth to the organization (Bohlander and Snell 2010). As such, salary negotiations are done following a twofold approach. 1) All salary negotiations for both hourly workers and salary workers are conducted on the ―Common-good approach‖ to ethics (scu.edu/ethics 2010) to ensure that all employees are shown that they treated with
M. A. Walters Sr. IHART - Volume 16 (2011)
227
fairness and equity during the process of becoming a valued member of the enterprise. 2) This process is conducted based on a quantitative market share analysis (dobney.com 2010) of job titles, skill set requirements, area cost of living data, and Shapiro‘s (1996) seminal ―Scarce goods have a cost -- there are no free lunches‖ construct regarding hiring and compensation for hard-to-fill positions. For example, a candidate with a Ph.D. in Nuclear Physics, based on the overall rarity of the specialization, will have more flexibility in salary negotiations than an hourly mailroom worker, although both employees will be able to contract for a living wage. It merits note that this approach is directly tied to XYZ‘s best practice performance-based compensation structure.
MONEY AND PERFORMANCE
In addition to a competitive salary, all XYZ employees can receive additional income above their set salaries and yearly raises based on respective job performance (opm.gov 2000). This methodology affords XYZ greater internal/external stakeholder engagement and employees a greater occasion to buy-in to the corporate mission (Strand 2008) by allowing them to present ideas to their immediate supervisor and senior management regarding areas to improve efficiency and improve services delivery while reducing operating cost. Employees who surpass objectives set by management are awarded performance incentives and their names and photos are displayed in various common areas throughout the organization, i.e. lunch rooms, conference rooms, their department, and on the Human Resource Department ―Wall of Pride.‖ Moreover, XYZ promotes a salary construct that promotes annual performance review increases, management evaluations for pay progression shift differential pay, national/ local holiday pay, flex time including work share in certain areas, telecommuting, and annual paid vacation leave. This brings into focus another XYZ best practice, that of employee and dependent wellness benefits.
EMPLOYEE/ DEPENDENT WELLNESS BENEFITS
Focused on promoting Painter-Morland‘s (2006) teachings on the ―Triple bottom- line‖ (p. 353), the XYZ Corporation is providing employee/dependent wellness benefits that have positive impact by promoting the overall health of the XYZ family. This process was created by HR as a best practice in response to a report (Shepherd 2008) which noted that corporate giant International Business Machines (IBM) recently created a program to offer a financial incentive for employees who use a user-friendly interactive online program to manage their family's eating and exercise regime. While XYZ‘s leadership fully respects the privacy of all of its employees and their freedom to choose how to live their lives, senior leadership is equally aware of the deleterious impact of a firm‘s not providing viable company-sponsored choices to its human capital to pursue healthy life styles. This is reinforced by Shepherd‘s unsettling reminder that over 60% of Americans are overweight and the obesity rate has reached above 25%, and Danyichuk and MacIntosh‘s (2009) warning that the lack of healthy lifestyles is escalating the employer‘s cost of doing business. Once again, therefore, a compensation strategy that is best practice for the employee is best practice for the employer as well.
EDUCATION AND NEW KNOWLEDGE OWNERSHIP
XYZ‘s leadership is attuned to the need to provide all non-probationary employees company-sponsored opportunities to augment their in-house Human Capital Training and Development (HCTD) as a means to advance their job-related new knowledge ownership opportunities (Bower 2009). XYZ achieves this by fully funding tuition in relevant studies at institutions of higher learning and by funding attendance at relevant professional conferences. XYZ‘s leadership holds that this employee benefit helps the company to attract and retain employees in a manner beyond the scope of financial rewards (Chenevert, & Tremblay 2009) by demonstrating it is willing to invest in the professional growth and development of its personnel, to the extent of ensuring that each employee is afforded the opportunity to be prepared for current and anticipated career advancement opportunities. Moreover, the value to the employer of ongoing education in relevant topics is evident to both the XYZ leadership and the HR department.
COGNIZANT COMPENSATION
The spectrum of rewards strategies available to organizations, as indicated above has great potential for human capital motivation. However, it will remain simply potential, and not evidence itself to the maximum degree, if whatever compensation used remains unfocused. Individual employee performance can best be enhanced if compensation is proportional to individual efforts, improvements, and achievement. Again, making human capital aware of, and indeed part of, this strategy is best practice when all employees understand that the performance of each employee is the yardstick for recognition and reward. The added benefit of this approach is that human capital appreciates the organization‘s attention to individual merit. It recognizes that HR and leadership cognizant of how each employee is doing, as a matter of fairness, uses this as the bases for compensation. Cognizant compensation thus becomes part of corporate values, consistent with the ―Common-good approach‖ to ethics (scu.edu/ethics 2010).
The Bigger the Carrot: Cognizant Compensation for Effective Human Resource Management
228
CONCLUSION
While the above exposition exists in the realm of the hypothetical, it does suggest that cognizant compensation merits careful field study employing both quantitative and qualitative methodologies. It should also be noted that, as with all best practices in shaping human capital motivators, cognizant compensation demands not only the right core values but their proper communication and execution (Ferguson and Milliman 2008). This cannot be achieved through either an ad hoc or a ―one size fits all‖ approach. Rather, the development and implementation of best practice employee remuneration approaches must give consideration to a spectrum of variables, including the nature of the work, skill set required, and current market analysis. This requires those responsible for the implementation of policies and procedures to be fully engaged not only in the plan‘s execution but also in its construction (Hrebiniak 2006) if long term success and employee motivation are to be realized, and if the benefits of the compensation strategy are to accrue to employer as well as employee.
REFERENCES
A framework for thinking ethically. (2010).Santa Clara University: The Jesuit University in Silicon Valley. Markkula center for applied ethics. Retrieved from www.scu.edu/ethics/practicing/decision/framework.html
Allen, D. G., Bryant, P. C., & Vardaman, J. M. (2010). Retaining talent: Replacing misconceptions with evidence-based strategies. Academy of Management Perspectives, 24(2), 48-64. Retrieved from, EBSCOhost database.
Bohlander, G. and Snell, S. (2010). Managing human resources. (15th ed.). Mason, OH: South-Western Cengage Learning Bower, M. (2009. Building a learning coalition. Chief Learning Officer, 8(1), 36-39. Retrieved from, Business Source Premier
database. Chenevert, D., & Tremblay, M. (2009). Fits in strategic human resource management and methodological challenge: Empirical
evidence of influence of empowerment and compensation practices on human resource performance in Canadian firms. International Journal of Human Resource Management, 20(4), 738-770. Retrieved from doi:10.1080/09585190902770547
Danyichuk, K. and MacIntosh, E. (2009). Food and non-alcoholic beverage sponsorship of sporting events: the link to the obesity issue. Sport Marketing Quarterly, 18(2), 69-80. Retrieved from EBSCOhost database.
Dewhurst, M., Guthridge, M., & Mohr, E. (2010). Motivating people: Getting beyond money. McKinsey Quarterly, (1), 12-15. Retrieved from, EBSCOhost database.
Dobney.com. (2010). Research for decisions. Quantitative research. Retrieved from www.dobney.com/Research/quantitative_research.htm
Frauenheim, E. (2010). Engaged, and at your service. Workforce Management, 89(3), 23-27. Retrieved, from Academic Search Complete database.
Ferguson, J., and Milliman, J. (2008). Creating effective core organizational values: A spiritual leadership approach. International Journal of Public Administration, 31(4), 439-459. Retrieved from doi: 10.1080/01900690701590835
Hrebiniak, L.G. (2006).Making strategy work: Leading effective execution and change. Upper Saddle, NJ: Wharton School Publishing.
Nazemetz, P. (2009). WorkForce 2020. Leadership Excellence, 26(2), 20. Retrieved, from MasterFILE Premier database. Painter-Morland, M. (2006). Triple bottom-line reporting as social grammar: integrating corporate social responsibility and
corporate codes of conduct. Business Ethics: A European Review, Retrieved from 15(4), 352-364. doi:10.1111/j.1467-8608.2006.00457.x
Prokesch, S. (2009). How GE teaches teams to lead change. Harvard Business Review, 87(1), 99-106. Retrieved, from Business Source Premier database.
Shapiro, D. (1996). Lecture 2. Aug. 26 - Chapter 1, part 2: The economic way of thinking. Retrieved April 7, 2011, from www. econ.la.psu.edu/~dshapiro/l02aug26.htm
Shepherd, L. (2008). Employees fight war against fat. Employee Benefit News, 22(1), 24-27. Retrieved from, EBSCOhost database.
Strand, R. (2008). The stakeholder dashboard. Greener Management International, Retrieved from, www. search.ebscohost.com
U.S. Office of Personnel Management. (2000). Performance management. Developing strategic compensation. Retrieved from www.opm.gov/perform/articles/2000/ fal00-4.asp
Value Based Management.Net. (2010). Two factor theory - Herzberg, Frederick. Retrieved from www.valuebasedmanagement.net/methods_herzberg_two _factor_theory.html

D. N. Burrell, M. Anderson, D. Bassette IHART - Volume 16 (2011)
229
VIABLE FRAMEWORKS OF EFFECTIVE ORGANIZATIONAL PLANNING AND SUSTAINABILITY STRATEGIC PLANNING APPROACHES AT U.S. UNIVERSITIES
Darrell Norman Burrell1,2,3, Megan Anderson2 and Dustin Bessette2
1Virginia International University, USA, 2Marylhurst University, USA, and 3A.T. Still University, USA
ABSTRACT
Current higher education universities do not offer the same benefit guarantee, or reliability as it once did. New concepts must be substituted in place of old tactics in order for US universities to compete with current rigorous standards and competition. There are many pressures that threaten the future of higher education in America as universities and colleges develop and find their place in this dynamic market. As pressures grow, management and leadership styles of the past are proving insufficient. Higher education administrators are inadequately prepared to deal with the future challenges facing universities and colleges. Strategic planning and systems thinking approaches are vital to the future health, growth, and vitality of higher education institutions. The potential benefits of sustainability planning and strategic actions that focus on economic, environmental, and social gains will also help to ensure the future growth, health, and survival of higher education.
INTRODUCTION
With growing business markets, an increasingly large pool of nontraditional students, company implemented diversity initiatives, and a dire need for a well-trained workforce; American institutions of higher learning are facing a huge challenge (Balderston, 1995). When it comes to the nuances of systems thinking and strategic planning, there is not much emphasis in higher education administration program curriculum on the relevance of teaching these approaches in the development of university and college administrators. Many private colleges and universities face disheartening financial challenges that could greatly influence their health, growth, and survival. These schools face tremendous perplexities in attracting new students, because they tend to cost more than state colleges and universities. The accelerating rate of change is producing an organizational environment in which traditional management approaches and organizations are increasingly insufficient. In the past, when changes could be made in small increments, experienced leadership was an adequate guide (Balderston, 1995). But intuitive and experience-only leadership-based strategic approaches have the propensity to be woefully inadequate when decisions have long-term consequences related to an organization‘s survival, health, growth, and longevity. In light of the discontinuous and large-scale changes facing the world; organizations will be required to undergo major strategic renovations and reorientations (Friedman, 2007). The strategic system adaptations will involve changes in service offerings, organizational structures, financial resource allocation, and human resources. Leaders and consultants have frequently limited their strategic approaches to the management of change (Birnbaum, 2000). Historic approaches to strategic change can be potentially limiting. Regardless of the nature of the problem, leaders and managers focus their analysis and planning only to a single organizational change mechanism; which could include restructuring the organization, changing staff, changing operations, or changing the assortment of services offered (Schein, 1999). This singular approach seems to be driven by the traditional perspective that analysis and planning is framed from one lens. That is, approaching strategic change as a simple technical problem, employee problem, or financial resources problem; instead of from a holistic/comprehensive/or systems thinking approach. According to Schein (1999), by restricting their viewpoint on traditional systems thinking approaches, leaders may limit the effective use of an assortment of potential and useful strategic change mechanisms. In order to use a systems thinking approach to strategically manage change, the following mechanisms may be effectively employed in the process:
1. External analysis- As the environment becomes more chaotic and volatile, the job of developing strategies and organizational strategic countermeasures can be more difficult to understand and predict which makes adaptability skills extremely important. It is tricky to map environmental pressures. The development of new environmental data analysis, forecasting, and trending processing capabilities is critical to the process.
2. Values and Mission- As financial, competitive, social, and political pressures increase, so does the need for the development and articulation of clear vision, value, and mission statements to guide the organization with strategic decisions.
3. Strategic Direction- The development of strategic approaches should be driven by organizational planning methods to benefit the collective knowledge, experience, and expertise of all levels of the organization. This requires the
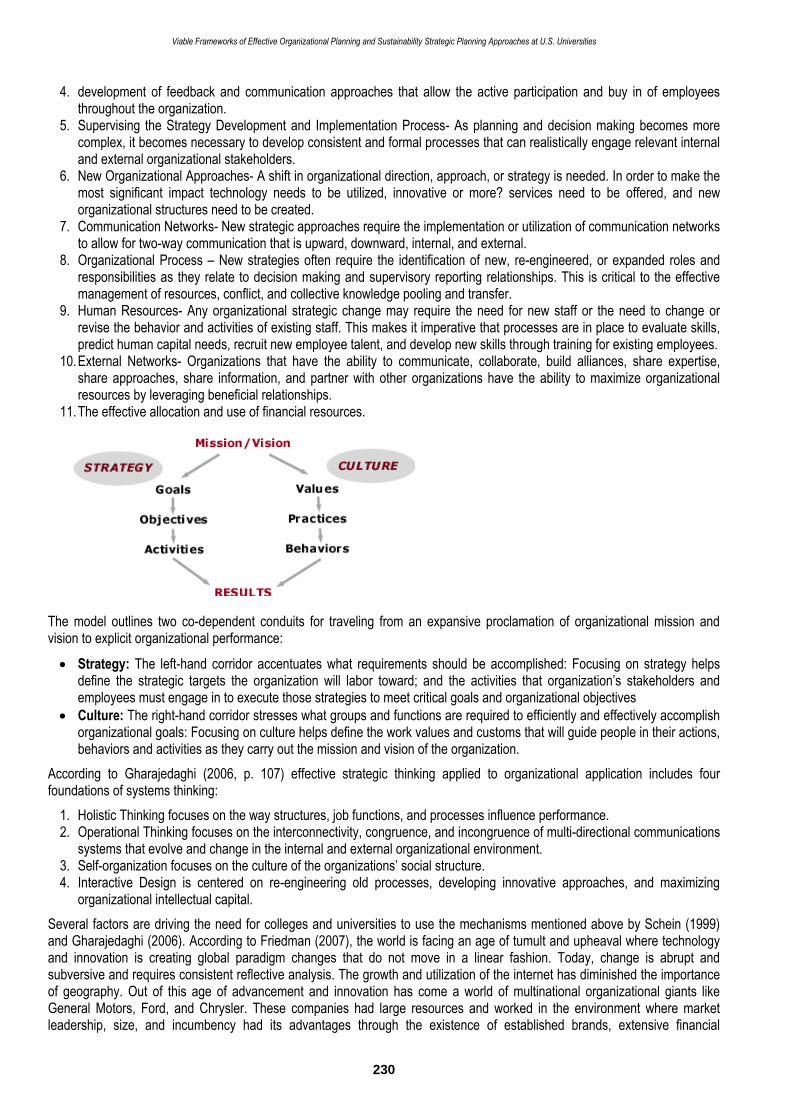
Viable Frameworks of Effective Organizational Planning and Sustainability Strategic Planning Approaches at U.S. Universities
230
4. development of feedback and communication approaches that allow the active participation and buy in of employees throughout the organization.
5. Supervising the Strategy Development and Implementation Process- As planning and decision making becomes more complex, it becomes necessary to develop consistent and formal processes that can realistically engage relevant internal and external organizational stakeholders.
6. New Organizational Approaches- A shift in organizational direction, approach, or strategy is needed. In order to make the most significant impact technology needs to be utilized, innovative or more? services need to be offered, and new organizational structures need to be created.
7. Communication Networks- New strategic approaches require the implementation or utilization of communication networks to allow for two-way communication that is upward, downward, internal, and external.
8. Organizational Process – New strategies often require the identification of new, re-engineered, or expanded roles and responsibilities as they relate to decision making and supervisory reporting relationships. This is critical to the effective management of resources, conflict, and collective knowledge pooling and transfer.
9. Human Resources- Any organizational strategic change may require the need for new staff or the need to change or revise the behavior and activities of existing staff. This makes it imperative that processes are in place to evaluate skills, predict human capital needs, recruit new employee talent, and develop new skills through training for existing employees.
10. External Networks- Organizations that have the ability to communicate, collaborate, build alliances, share expertise, share approaches, share information, and partner with other organizations have the ability to maximize organizational resources by leveraging beneficial relationships.
11. The effective allocation and use of financial resources.
The model outlines two co-dependent conduits for traveling from an expansive proclamation of organizational mission and vision to explicit organizational performance:
Strategy: The left-hand corridor accentuates what requirements should be accomplished: Focusing on strategy helps define the strategic targets the organization will labor toward; and the activities that organization‘s stakeholders and employees must engage in to execute those strategies to meet critical goals and organizational objectives
Culture: The right-hand corridor stresses what groups and functions are required to efficiently and effectively accomplish organizational goals: Focusing on culture helps define the work values and customs that will guide people in their actions, behaviors and activities as they carry out the mission and vision of the organization.
According to Gharajedaghi (2006, p. 107) effective strategic thinking applied to organizational application includes four foundations of systems thinking:
1. Holistic Thinking focuses on the way structures, job functions, and processes influence performance. 2. Operational Thinking focuses on the interconnectivity, congruence, and incongruence of multi-directional communications
systems that evolve and change in the internal and external organizational environment. 3. Self-organization focuses on the culture of the organizations‘ social structure. 4. Interactive Design is centered on re-engineering old processes, developing innovative approaches, and maximizing
organizational intellectual capital.
Several factors are driving the need for colleges and universities to use the mechanisms mentioned above by Schein (1999) and Gharajedaghi (2006). According to Friedman (2007), the world is facing an age of tumult and upheaval where technology and innovation is creating global paradigm changes that do not move in a linear fashion. Today, change is abrupt and subversive and requires consistent reflective analysis. The growth and utilization of the internet has diminished the importance of geography. Out of this age of advancement and innovation has come a world of multinational organizational giants like General Motors, Ford, and Chrysler. These companies had large resources and worked in the environment where market leadership, size, and incumbency had its advantages through the existence of established brands, extensive financial

D. N. Burrell, M. Anderson, D. Bassette IHART - Volume 16 (2011)
231
resources, global distribution, and access to first dibs on the most accomplished employee talent. These things provided a false sense of security, comfort, and blinders, and left these companies susceptible to the tremendous damages of marketing myopia and marketplace obsolescence. These same potential weaknesses have also taken place with long-established private colleges and universities as they relate to their health, growth, and survival. Many of these colleges and universities have histories that have endured 100 years of societal change. However, in the current climate, without strategic systems thinking changes, these organizations may have to close their doors.
SUSTAINABILITY
At a time where higher education across the US is suffering in tough economic times; changes that address societal pressures, environmental issues, and economic concerns will create sustainable solutions that greatly improve the future forecast of higher education. According to the Campus Consortium for Environmental Excellence (CCEE) (2006), sustainability is becoming an increasingly important topic within higher education. In 2006, over 4,100 universities and colleges in the United States had sustainability operations, which contributed over $300 billion in revenues, utilized over 3 million employees, and registered 15 million students (CCEE, 2006). In the past, sustainability efforts on college and university campuses, focused on initiatives that ―green the campus,‖ however sustainability is broadening to include ―economic, environmental, and social dimensions‖ of higher education (CCEE, 2006, pg. 7). A common term referred to in the sustainability business sector is the triple bottom line. Traditionally, organizations tend to focus on the economic bottom line to measure success and strategically plan for the future. The triple bottom line is an approach that comprehensively addresses the needs of an organization and its connections to society, the environment, and the economy. According to a Fortune 100 consulting firm, Sustainable Business Strategies (2009), a sustainable organization will become increasingly successful over time and will retain long-term success by developing strategies that integrate and connect business benefits with environmental and societal benefits. Societal pressures to address environmental issues on higher education campuses can be used to create advantages and economic gain for universities and colleges across the US. Growing pressures include meeting desired environmental protection, green design, and development standards; the obtainment of waste and energy reduction methods to reduce growing facility costs; the growing demand from higher education stakeholders (students, staff, faculty, local communities, governing bodies, alumni, etc.) that environmental expectations are met and sustainable models are taught and upheld at university standards; and the need to uphold a competitive reputation in order to attract and maintain qualified and desirable students and faculty (CCEE, 2006). Integrating sustainability and a triple bottom line approach into a university‘s strategic plan will allow the university to address the needs and benefits of the organization and come up with strategic moves to promote long-term growth, health, and financial savings. Some of the main avenues higher education can take to create a large impact on their triple bottom line include focusing on energy and waste reduction, alternative transportation, technology investment, and food purchasing and distribution. However, the scope of sustainability has the potential to reach many levels of a higher education institution. With a more in depth systems thinking approach to a university‘s strategic plan significant cost savings, environmental improvements, and social achievements can be made and long-term retention can be attained. Yeoman and Zoetmulder (2009), state that immediate action needs to be taken in higher education to connect sustainability principles with the financial plans that regulate universities and schools. For example, procurement or purchasing departments can help lead sustainability initiatives on higher education campuses by identifying savings and efficiencies and by greatly reducing waste (Yeoman & Zoetmulder, 2009). ―Eprocurement‖ or electronic based procurement systems eliminate the use of paper transactions, while also providing transparency and streamlining the purchasing process; which allows universities to recognize the large influence they can have on the market, allowing them to select green products and services (Yeoman & Zoetmulder, 2009, pg. 2). Universities can choose green products, which are lower in price than competitive non-green products when bought in bulk quantities at specified rates, and organize transport and shipping to minimize carbon emissions, energy use, and packaging (Yeoman & Zoetmulder, 2009). They can also negotiate other strategic moves that greatly improve not only the economic bottom line; but also the social and environmental standards that contribute to the long-term savings, growth, and health of an organization. Integrating sustainable procurement into a university‘s strategic plan is a ―resource multiplier‖ for a higher education institution (Yeoman & Zoetmulder, 2009, pg. 1). Strategic planning to integrate sustainability initiatives can help a university identify savings and benefits throughout its management and operations, and build upon these initiatives to foster further benefits and savings in the future. The triple bottom line integrates a systems thinking approach that allows an organization to strategically plan for long-term health,

Viable Frameworks of Effective Organizational Planning and Sustainability Strategic Planning Approaches at U.S. Universities
232
savings, and growth. As institutions of higher education identify and understand the connective nature of sustainability models and how strategic actions that integrate economic, social, and environmental benefits can multiply resources; sustainability could become a key value and core objective of universities and colleges throughout the US. According to Rees (2010), human nature, denial and cognition are the leading factors to this act of nature. Humans have to change the way they perform everyday activities towards earth if they do not want to mutate nature. Simple changes within each society will enable humans to live in better peace with business, the ecosystem, and the environment. ―Human activity is putting such a strain on the natural functions of the Earth that the ability of the planet‘s ecosystems to sustain future generations can no longer be taken for granted‖ (Rees, 2011). With minor changes within US universities, students and faculty have the ability to change the output and performance from universities all across the US. If US universities maintain their exact performance and functions, they will stand no chance in the way of future generations and the output brought by foreign and international universities. Not suggesting international universities and colleges are opposing enemies towards the national universities, but sustainable changes within these organizations are occurring faster than those of US universities. Rees concludes ―To achieve sustainability, the world community must write a new cultural narrative that is explicitly designed for living on a finite planet, a narrative that overrides humanity‘s outdated innate expansionist tendencies " (Rees, 2011). The only changes which will have an effect on the future are those revisions which humans are able to act upon presently. According to Lehrer (2010), setting up sustainable practices in colleges and universities is the initial step which dictates which universities choose to ensue the action. Enabling the definition to show what outside assistance is needed to administrators, committees, and faculty, is the initial step towards the entire process. Sustainability is constantly shifting such that the process to successfully and effectively ensure a US university is being sustainable is a contest. Setting up sustainable business in a college environment has two key prongs in the university setting (Lehrer, 2010). The first portion relates to how the professors and faculty address sustainability in their classroom and work environment. The higher possibility for students learning to change the environment, society, and business world, changes the professionals feeling for this practice. As the university sees this system working in many more environments, the more switches they will make in order for the students to gain better knowledge of this format. This in turn will change the way the neighboring universities and prestigious universities set this program up in their university. According to Rock (2011), even at this day and age we are beginning to see less and less of the unsustainable practices involved in business. This micro factor is a clue as to what is occurring currently in giant corporations. Those who choose to betray the unsustainable practices year ago were The significant connotation here is that strategic planning and strategic systems thinking are vital to ensure the viability of many colleges and universities. Whereas many institutions already have a mission, history, and structure in place, it is important for college and university leaders to have a pragmatic strategic systems awareness of their organization‘s true place in the market, accurate potential for future growth, and sound understanding of the potential threats to revenue sources (Higher Education Review, 2004, P. 10). To that end, organizations can survive financial turmoil and competitive environments when they effectively analyze their vulnerabilities, strengths, opportunities, and weaknesses in the context of this current global and technological environment (Van Der Werf, 2000). Over the years, institutions of higher learning have become very significant in the global economy with the growth of on-line bachelor, master‘s, and even doctoral programs where students from all over the world can pursue a degree at a university of choice and not be restricted or limited by national or international geography (Hanna, 1998). However, this growth of on-line learning has also introduced new competitors, even from outside the U.S. Traditional private colleges need to adjust their strategic approaches and plans to meet the requirements of a progressively global economy or anticipate its growing and intense competition. Higher education leaders must strategically develop alterations to teaching and programs, if there is an expectation to be competitive in technology driven environments as a means of entering new markets for students and tuition revenue (Hanna, 1998).
SYSTEMS THINKING
According to Grant (2008), strategic measurement can help in implementing and developing organizational tactical plans. Suitable analysis can provide a means for organizations to adapt to change, improve operations, and respond to the

D. N. Burrell, M. Anderson, D. Bassette IHART - Volume 16 (2011)
233
competition. Having regular engagement in strategic analysis may allow the organization to improve the effectiveness of their strategy through aligning and allocating resources where they have the propensity for maximum effectiveness. Strategic analysis results can include faster changes (both in strategic implementation, and in everyday work); greater accountability (since responsibilities are clarified by strategic measurement, people are naturally more accountable); and better communication of responsibilities (because the measures show what each group's primary responsibility is), which may reduce duplication of effort. A key component of strategic analysis is the engagement in strategic systems thinking (Johnson, 2007). According to Gharajedaghi (2006), systemic thinking means critically analyzing the cause-effect interaction of leadership and organizational decisions. In application, systemic thinking provides a planning and consideration framework for organizational alternative directions for the future. According to Gharajedaghi (2006), systems thinking are valuable because it can help organizations map out innovative and adaptive solutions to complex organizational problems. In its simplest sense, systems thinking give organizations a tool for planning so organizations can survive and prosper. Things that worked in the past may not work in the future, so organizations have to adapt to changing external environments, grow from lessons learned, and effectively make plans for an uncertain future. Systems thinking can play a pivotal role in this process. In the process of strategic planning and systems thinking, organizations can effectively engage in analysis using systems diagrams (Gharajedaghi, 2006). These diagrams can become a beginning framework for the strategic planning process in providing context for comprehension of how the organization works and what aspects can be changed to make the organization more effective and adaptive to future scenarios. Systems diagrams are particularly helpful in showing a leadership team how making one decision that changes a variable can influence or impact a variable somewhere else in the future. According to Littlejohn (1999), a system essentially has four things:
1. Objects – The pieces, factors, elements, or variables within the system. 2. Features – The traits of the system and its objects. 3. Internal relationships- The way pieces interact and communicate between each other. 4. Systems live in an atmosphere- Systems function as a set of pieces to function congruently and incongruently in an
interactive environment.
According to Littlejohn (1999), an effective systems diagram would look at an organizational system‘s strategic thinking analysis as an assessment of the recurrent phases of input, throughput (processing), and output yielding reviewable performance results.
SYSTEMS DIAGRAM CONCEPTUAL MODEL LITTLEJOHN (1999)
The problem with some small colleges and universities today, is an absence of strategic systems approach to organizational planning, program development, and marketing strategy (Burrell and Grizzell, 2008). Many of these colleges are tied to their original approach to operations, history, and mission, which limits the potential for an effective organizational environment. There is a scarcity of financial resources, increased technology, new global influences, and intense competition.

Viable Frameworks of Effective Organizational Planning and Sustainability Strategic Planning Approaches at U.S. Universities
234
Figure- Source: Infante (1997). Elaborated system perspective model which also provides an overview of a systems design model that can be used as a foundation for strategic planning. According to Gharajedaghi (2006), the application of strategic systems thinking approach requires the following aspects:
1. Recognizing the external and internal variables and the roles that each plays. 2. Strategic results can only be delivered through the analysis and management of the variables. 3. Organizational improvements require the integrated analysis and comprehensiveness of the interconnectivity of multiple
variables. 4. Assessment of progress and an altering of approaches if possible.
According to Infante‘s (1997) figure below, to develop an effective planning context that will yield longevity and survival, the most important variables must be recognized and evaluated in a context that considers their interconnectivity and influence. The approach to planning must be non-linear and address the organization as a whole.
Above figure: Infante (1997) According to Grant (2008), a systems thinking approach to a strategy analysis process should answer the following questions within the dimensions of the organization:

D. N. Burrell, M. Anderson, D. Bassette IHART - Volume 16 (2011)
235
1. What is the current state of the organization? (Growing? Shrinking? Financially healthy? Financially ill?) 2. What are the organizational values and beliefs? 3. What services should be offered, expanded, introduced, or discontinued? 4. What customers should be served? 5. What are the opportunities for growth? 6. What are the greatest organizational threats and how can these threats be resolved? 7. What are the greatest organizational opportunities and how they can be leveraged? 8. What are the greatest organizational strengths? 9. What are the greatest organizational weaknesses and how can these weaknesses be addressed? 10. What are the organization‘s competitive advantages? 11. What infrastructure and skills are needed to sustain operations, maximize competitive advantage, and implement new
opportunities? 12. What financial and non-financial results will be achieved? 13. What strategies have the potential to work? 14. Based on the current environment, what strategies can be immediately implemented?
STRATEGIC PLANNING AND ANALYSIS
According to Grant (2008), after the strategic analysis is turned into an actionable plan, there are potential strategy weaknesses that can hamper the strategy maximization process which include:
1. Not basing strategic decisions on a foundation of sound and comprehensive strategic analysis of the organizations current performance; current human and financial resources; and intelligence about the external environment, including the market and competition.
2. Not basing the strategy on emerging trends in the external environment. 3. Overly focusing the strategy on financials, rather than on decisions related to competitive advantages, services, and the
market. 4. Failing to act appropriately on strategic analysis results and to make tough strategic decisions (for example, making the
decision to exit markets where a competitive advantage cannot be gained, or failing to eliminate products or services that are not self-sustaining or do not add value to the organizational mission and strategy).
5. Failing to allow organizational stakeholders from a variety of levels to provide feedback, insight, and expertise to the process.
6. Failing to consider radical alternatives before settling on a strategic decision. 7. Wrongly categorizing strengths (what the organization is good at) as competitive advantages (the small set of strengths
that the make the organization superior in the marketplace). 8. Limiting the strategy only to the context of the historical mission, vision, and value statements that are non-specific
enough or current enough to drive daily, short-term, or long-term decision making. 9. Failing to develop a comprehensive, integrated, detailed, and manageable strategy implementation action plan that
outlines accountabilities, roles, responsibilities, and steps required for the strategy to move forward. 10. Not providing the human and financial resources necessary to successfully implement the strategy in a reasonable
amount of time. 11. Failing to clearly articulate strategy at all levels of the organization. 12. Failing to project or manage strategy implementation so that it remains under control and incorporates midcourse
alterations when needed. 13. Not linking the strategy to operational budgeting and planning. 14. Treating strategy formulation as a periodic, infrequent singular event rather than a continuous process. 15. Not considering the current organizational culture and its ability to hamper or enhance strategy development,
implementation, and success. 16. Not understanding the importance of strategic change management process in the strategy implementation process.
In addition to the need for correctly implementing strategy and identifying currently-emerging trends and planning according to the paths those trends are most likely to follow in the future, the organization also needs to find ways of competing in its industry in a way which sets it apart from the competition (Johnson, 2007; Kono and Antonucci, 2006, ). Achieving operational effectiveness is critical today, but many organizations confuse working for increased effectiveness and strategic positioning (Borden & Banta, 1994). Strategic positioning amounts to choosing to compete or provide services in a different way than competitors do. This is the best way to economically achieve future organizational plans because it provides a systematic approach to addressing current trends (Heim, 2002).
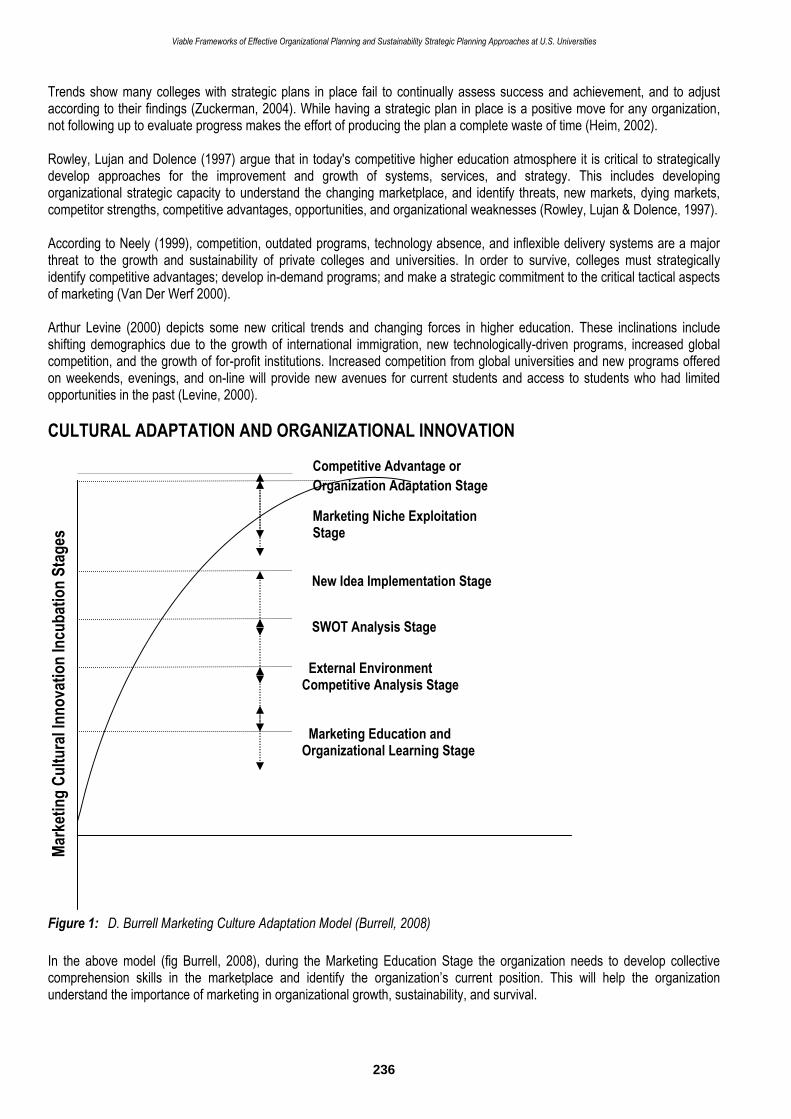
Viable Frameworks of Effective Organizational Planning and Sustainability Strategic Planning Approaches at U.S. Universities
236
Trends show many colleges with strategic plans in place fail to continually assess success and achievement, and to adjust according to their findings (Zuckerman, 2004). While having a strategic plan in place is a positive move for any organization, not following up to evaluate progress makes the effort of producing the plan a complete waste of time (Heim, 2002). Rowley, Lujan and Dolence (1997) argue that in today's competitive higher education atmosphere it is critical to strategically develop approaches for the improvement and growth of systems, services, and strategy. This includes developing organizational strategic capacity to understand the changing marketplace, and identify threats, new markets, dying markets, competitor strengths, competitive advantages, opportunities, and organizational weaknesses (Rowley, Lujan & Dolence, 1997). According to Neely (1999), competition, outdated programs, technology absence, and inflexible delivery systems are a major threat to the growth and sustainability of private colleges and universities. In order to survive, colleges must strategically identify competitive advantages; develop in-demand programs; and make a strategic commitment to the critical tactical aspects of marketing (Van Der Werf 2000). Arthur Levine (2000) depicts some new critical trends and changing forces in higher education. These inclinations include shifting demographics due to the growth of international immigration, new technologically-driven programs, increased global competition, and the growth of for-profit institutions. Increased competition from global universities and new programs offered on weekends, evenings, and on-line will provide new avenues for current students and access to students who had limited opportunities in the past (Levine, 2000).
CULTURAL ADAPTATION AND ORGANIZATIONAL INNOVATION
Figure 1: D. Burrell Marketing Culture Adaptation Model (Burrell, 2008)
In the above model (fig Burrell, 2008), during the Marketing Education Stage the organization needs to develop collective comprehension skills in the marketplace and identify the organization‘s current position. This will help the organization understand the importance of marketing in organizational growth, sustainability, and survival.
Mar
keti
ng
Cu
ltu
ral I
nn
ova
tio
n In
cub
atio
n S
tag
es
Marketing Education and Organizational Learning Stage
External Environment Competitive Analysis Stage
SWOT Analysis Stage
Organization Adaptation Stage
New Idea Implementation Stage
Competitive Advantage or Marketing Niche Exploitation Stage
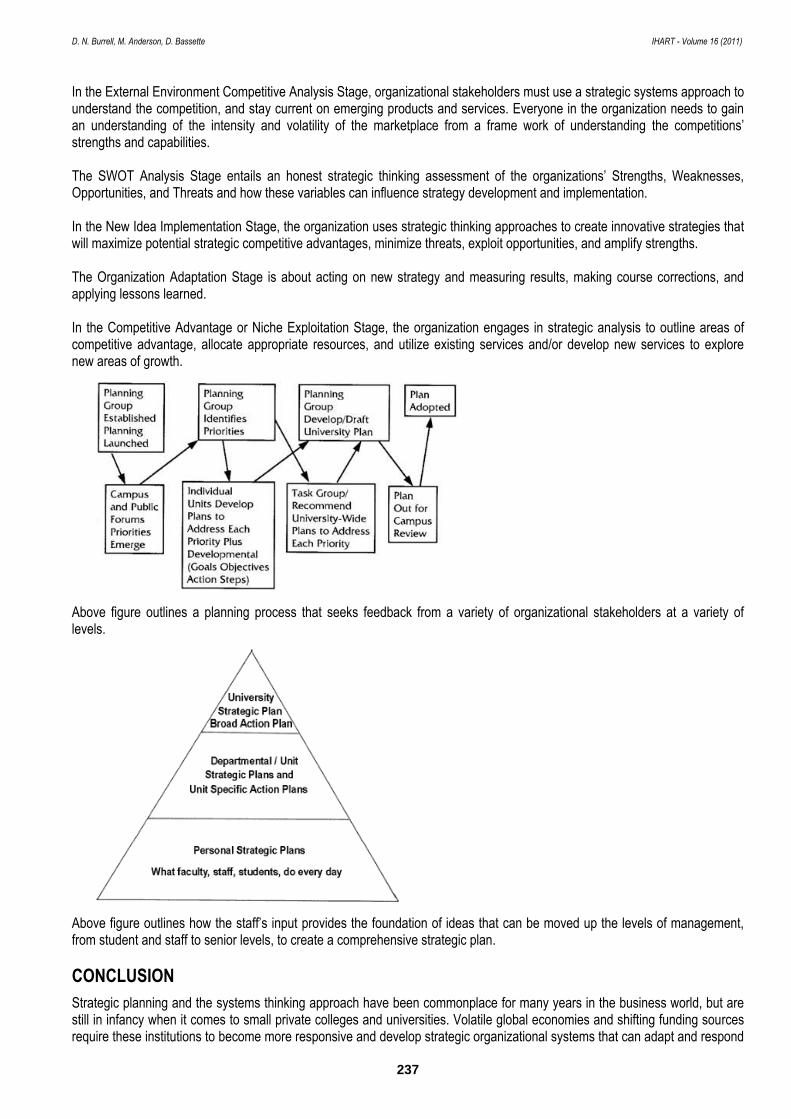
D. N. Burrell, M. Anderson, D. Bassette IHART - Volume 16 (2011)
237
In the External Environment Competitive Analysis Stage, organizational stakeholders must use a strategic systems approach to understand the competition, and stay current on emerging products and services. Everyone in the organization needs to gain an understanding of the intensity and volatility of the marketplace from a frame work of understanding the competitions‘ strengths and capabilities. The SWOT Analysis Stage entails an honest strategic thinking assessment of the organizations‘ Strengths, Weaknesses, Opportunities, and Threats and how these variables can influence strategy development and implementation. In the New Idea Implementation Stage, the organization uses strategic thinking approaches to create innovative strategies that will maximize potential strategic competitive advantages, minimize threats, exploit opportunities, and amplify strengths. The Organization Adaptation Stage is about acting on new strategy and measuring results, making course corrections, and applying lessons learned. In the Competitive Advantage or Niche Exploitation Stage, the organization engages in strategic analysis to outline areas of competitive advantage, allocate appropriate resources, and utilize existing services and/or develop new services to explore new areas of growth.
Above figure outlines a planning process that seeks feedback from a variety of organizational stakeholders at a variety of levels.
Above figure outlines how the staff‘s input provides the foundation of ideas that can be moved up the levels of management, from student and staff to senior levels, to create a comprehensive strategic plan.
CONCLUSION
Strategic planning and the systems thinking approach have been commonplace for many years in the business world, but are still in infancy when it comes to small private colleges and universities. Volatile global economies and shifting funding sources require these institutions to become more responsive and develop strategic organizational systems that can adapt and respond
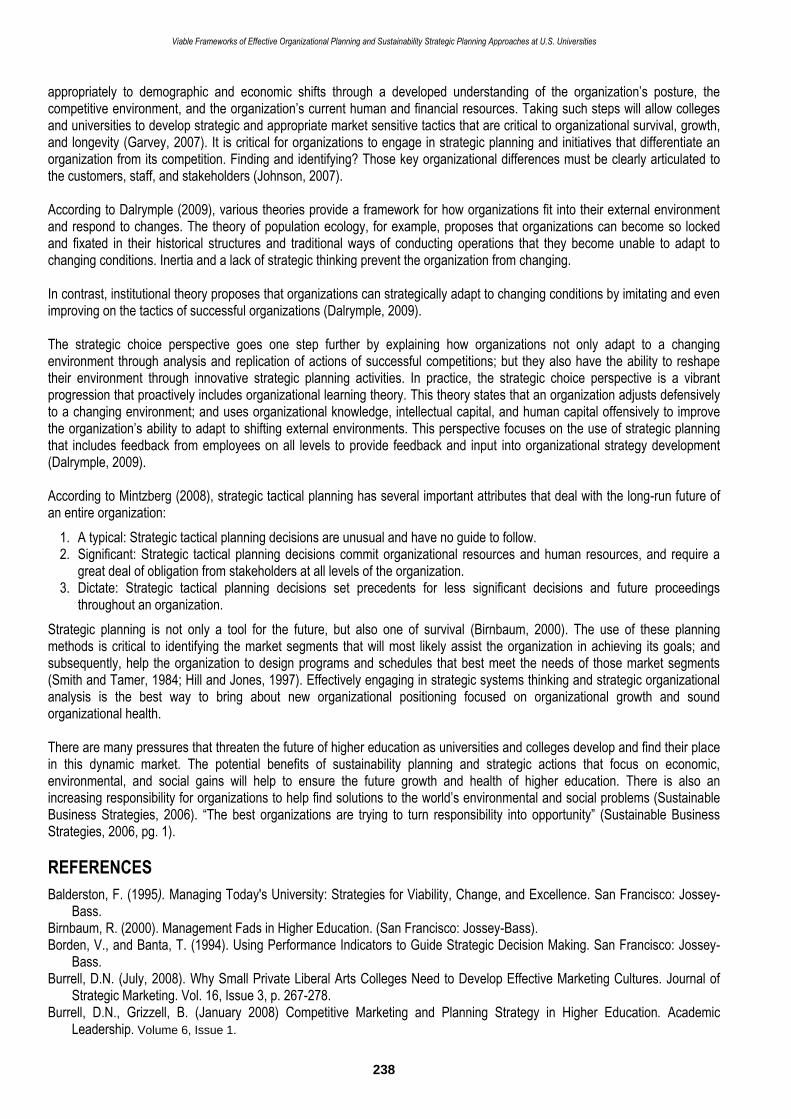
Viable Frameworks of Effective Organizational Planning and Sustainability Strategic Planning Approaches at U.S. Universities
238
appropriately to demographic and economic shifts through a developed understanding of the organization‘s posture, the competitive environment, and the organization‘s current human and financial resources. Taking such steps will allow colleges and universities to develop strategic and appropriate market sensitive tactics that are critical to organizational survival, growth, and longevity (Garvey, 2007). It is critical for organizations to engage in strategic planning and initiatives that differentiate an organization from its competition. Finding and identifying? Those key organizational differences must be clearly articulated to the customers, staff, and stakeholders (Johnson, 2007). According to Dalrymple (2009), various theories provide a framework for how organizations fit into their external environment and respond to changes. The theory of population ecology, for example, proposes that organizations can become so locked and fixated in their historical structures and traditional ways of conducting operations that they become unable to adapt to changing conditions. Inertia and a lack of strategic thinking prevent the organization from changing. In contrast, institutional theory proposes that organizations can strategically adapt to changing conditions by imitating and even improving on the tactics of successful organizations (Dalrymple, 2009). The strategic choice perspective goes one step further by explaining how organizations not only adapt to a changing environment through analysis and replication of actions of successful competitions; but they also have the ability to reshape their environment through innovative strategic planning activities. In practice, the strategic choice perspective is a vibrant progression that proactively includes organizational learning theory. This theory states that an organization adjusts defensively to a changing environment; and uses organizational knowledge, intellectual capital, and human capital offensively to improve the organization‘s ability to adapt to shifting external environments. This perspective focuses on the use of strategic planning that includes feedback from employees on all levels to provide feedback and input into organizational strategy development (Dalrymple, 2009). According to Mintzberg (2008), strategic tactical planning has several important attributes that deal with the long-run future of an entire organization:
1. A typical: Strategic tactical planning decisions are unusual and have no guide to follow. 2. Significant: Strategic tactical planning decisions commit organizational resources and human resources, and require a
great deal of obligation from stakeholders at all levels of the organization. 3. Dictate: Strategic tactical planning decisions set precedents for less significant decisions and future proceedings
throughout an organization.
Strategic planning is not only a tool for the future, but also one of survival (Birnbaum, 2000). The use of these planning methods is critical to identifying the market segments that will most likely assist the organization in achieving its goals; and subsequently, help the organization to design programs and schedules that best meet the needs of those market segments (Smith and Tamer, 1984; Hill and Jones, 1997). Effectively engaging in strategic systems thinking and strategic organizational analysis is the best way to bring about new organizational positioning focused on organizational growth and sound organizational health. There are many pressures that threaten the future of higher education as universities and colleges develop and find their place in this dynamic market. The potential benefits of sustainability planning and strategic actions that focus on economic, environmental, and social gains will help to ensure the future growth and health of higher education. There is also an increasing responsibility for organizations to help find solutions to the world‘s environmental and social problems (Sustainable Business Strategies, 2006). ―The best organizations are trying to turn responsibility into opportunity‖ (Sustainable Business Strategies, 2006, pg. 1).
REFERENCES
Balderston, F. (1995). Managing Today's University: Strategies for Viability, Change, and Excellence. San Francisco: Jossey-Bass.
Birnbaum, R. (2000). Management Fads in Higher Education. (San Francisco: Jossey-Bass). Borden, V., and Banta, T. (1994). Using Performance Indicators to Guide Strategic Decision Making. San Francisco: Jossey-
Bass. Burrell, D.N. (July, 2008). Why Small Private Liberal Arts Colleges Need to Develop Effective Marketing Cultures. Journal of
Strategic Marketing. Vol. 16, Issue 3, p. 267-278. Burrell, D.N., Grizzell, B. (January 2008) Competitive Marketing and Planning Strategy in Higher Education. Academic
Leadership. Volume 6, Issue 1.

D. N. Burrell, M. Anderson, D. Bassette IHART - Volume 16 (2011)
239
Campus Consortium of Environmental Excellence. (2006). A practical guide to hiring a sustainability professional for universities and colleges. Retrieved September 17, 2010 from http://www.c2e2.org/sustainability_guide.pdf
Dalrymple, M. (2009). Strategic Planning in Higher Education: Comparative Perspectives in Evaluation. Munich, Germany: VDM Verlag Dr. Müller.
Friedman, Thomas (2007). The World is Flat. New York, NY: Farrar, Straus, and Giroux. Garvey, J. (2007) Philadelphia University: The role of presidential leadership in market adaptation and evolution of mission
.Ed.D. dissertation, University of Pennsylvania, United States -- Pennsylvania. Gharajedaghi, Jamshid. (2006). Systems Thinking: Managing Chaos and Complexity: A Platform for Designing Business
Architecture. London: Elsevier Science & Technology Books. Gioia, D. (1998). What Does Organizational Identity Mean? Identity in Organizations: Building Theory
through Conversations. Thousand Oaks, CA: Sage Publications, Inc. Grant, Robert. (2008). Contemporary Strategic Analysis. Malden, MA: Blackwell Publishing. Hanna, D.E. (1998). Higher Education in an Era of Digital Competition; Emerging Organizational Models. Journal of
Asynchronous Learning Networks, Vol. 12, Issue 1. Heim, M. (2002) Business leaders evaluate the systemic planning process: Four organizations' experiences. Ph.D. dissertation,
Fielding Graduate Institute, United States – California. Higher Education Review. (2004). The Competitiveness of Higher Education in Scotland. Scottish Executive. Phase 3. St.
Andrew‘s House. Edinburgh. Hill, C., and Jones, G. (1997). Strategic Management an Integrated Approach. Boston: Houghton Mifflin Company. Hillburn, Greg (April 22, 2009). Area Universities Project Loss of 255 Jobs. The News star. Infante, D.A., Rancer, A.S. & Womack, D.F. (1997). Building communication theory. Prospect Heights: Illinois: Waveland
Press. Johnson. R. (2007). The Real Value of Strategic Planning. Supply House Times, 50(3), 88-89. Kono, K., and Antonucci, D. (2006, July). Sustainability of Cross-Functional Teams for Marketing Strategy Development and
Implementation. The Health Care Manager, 25(3), 267-276 Leslie, D. and Fretwell, E. (1996). Wise Moves in Hard Times: Creating and Managing Resilient Colleges and Universities. San
Francisco: Jossey-Bass. Levine, A. (2000). The future of colleges: 9 inevitable Changes. The Chronicle of Higher Education. Littlejohn, S.W. (1999). Theories of Human Communication. Belmont, CA: Wadsworth/ Thomson Learning. Mansfield, Duncan. (February 27, 2009). UT Looks to Raise Tuition, Cut 777 jobs. The Associated Press. Mintzberg, Henry. (2008). Tracking Strategies: Towards a General Theory of Strategy Formation. London: Oxford University
Press. Neely, Paul. (Winter 1999). The Threats to Liberal Arts Colleges, Daelalus, P. 128-133. Rowley, Daniel James, Herman D. Lujan and Michael G. Dolence (1997). Strategic Change in Colleges and Universities. San
Francisco: Jossey-Bass, Inc. Rowley, Daniel J. and Herbert Sherman (1998). From Strategy to Change. San Francisco: Jossey-Bass. Schein, Edgar. (1999). Process Consultant Revisited: Building the Helping Relationships. New York: Addison-Wesley. Schnidtlein, Frank A. and Toby H. Milton, eds. (1990). Adapting Strategic Planning to Campus Realities (New Directions for
Institutional Research, No. 67). San Francisco: Jossey-Bass. Smith, L. and Tamer, S. (1984). Marketing Planning for Colleges and Universities. Long Range Planning, 17(6), 104-117. Sustainable Business Strategies. (2009). Economic, environmental, social sustainability. Retrieved September 19, 2010 from
http://www.getsustainable.net/ Terris, Ben. (April 10, 2009). Wellesley College cuts 80 non-faculty jobs. The Boston Globe. Van Der Werf, Martin, (May 12, 2000) Death of a small college. The Chronicle of Higher Education. Yeoman, B. & Zoetmulder, E. (2009). Green procurement: Making sustainability viable in a tough economy. Retrieved
September 21, 2010 from http://www.universitybusiness.com/viewarticle.aspx?articleid=1326&p=1#0 Zhao, Yilo. (May 7, 2002). More Small Colleges Dropping Out. The New York Times, May 7, 2002. Zuckerman, A. (August 2004). The importance of being earnest about your business plan. Healthcare Financial Management,
58(8), 100-101. Lehrer, Jeremy (2010) Accelerating Sustainability on College Campuses, Retrieved on May 6th, 2011 from
http://www.livingprinciples.org/accelerating-sustainability-on-college-campuses/ Rees, William (2011), What‘s Blocking Sustainability?: Human Nature, Cognition, and Denial, Retrieved May 6th 2011 from
http://sustainablewealth.blogspot.com/2011/02/article-whats-blocking-sustainability.html

M. Kaufman IHART - Volume 16 (2011)
240
SNAPSHOT OF THE GLOBAL WINE MARKET
Matthew Kaufman Nova Southeastern University, USA
ABSTRACT
The wine industry has undergone tremendous change in the last 30 years. Countries have emerged to become major players in the market. Chile, Argentina, New Zealand, Australia, Spain and Portugal are some of the new players and have been able to compete with the old guard: Italy, France, Germany and the United States. New markets have also emerged such as China who is consuming more wine every year. Some of these have evolved slowly over time with careful cultivation and planning. Others have become popular in a rather short time that they have had trouble keeping up with demand. The supply and demand of the global wine market heavily affects price elasticity. The marketing research and advertising budgets have increased dramatically to keep up with the steady growth. There have been new varietals introduced to the market and new demographics that have shifted the pricing structure. This paper will introduce the major growing countries as well as the major consuming countries. It will also show the trends over the last several years to give an understanding of where the market is heading. It will show how each country‘s supply and demand affects the rest. Most importantly, it will show just how big a business wine has become. Keywords: Wine, Global, Marketing, Price Elasticity, Supply and Demand.
SNAPSHOT OF THE GLOBAL WINE MARKET
The wine market has developed at an accelerated rate over the last 25 years. New varietals, new geographies, new appreciation from a new demographic and possibly the most important piece is the access to information about wine. The average consumer is more educated about wine and in turn the industry has become more market sensitive. This growth has opened up markets for emerging areas such as South America (Chile and Argentina in particular), Europe (Spain and Portugal), Australia/New Zealand and the United States (Oregon and Washington). The more established areas have also grown such as France, Italy and California to keep up with the new competition. At one point in time wine was generally bought by the wealthy and the older population. Today wine has drawn the interest of the under 40 crowd and all income levels. Hence, there has become a need for different price points. Price elasticity plays a considerable role steering these multi billion dollar businesses marketing and pricing plans. The interesting part about price and wine is that like many luxury items it does not work like a commodity. If the price drops too low, consumers looking for quality begin to wonder ―why is this so cheap? It can‘t be good‖. Some of the factors that affect price will be covered in this paper. Supply and demand have a significant impact on price. The wine industry is interesting in that there are so many forces at work. Weather, government/politics, insects, fungus and consumer income levels just to name a few. Supply and demand determine availability which has a direct influence on price. If a wine is difficult to find the price normally increases. The opposite is certainly true as well when there is a surplus. Most explorations between wine quality and wine price appeal to hedonic pricing, where the price of a good is a function of its characteristics (Rosen, 1974). Wine pricing is less regulated by production costs as it is calculated by how a consumer values it. Zhao (2008) worded it well when he wrote that wine price is based on the intersubjective evaluation of a wine between a consumer and a winemaker. The relationship between the two is tenuous as there are many options today when purchasing a bottle of wine. In 2006 a study was completed regarding the wine industry in California. MFK Research LLC conducted the research and came up with a surprising number. California wine has $51.8 B impact on the state and a $125 B impact on the US economy (wineinstitute.org, 2009). Almost four years later and the California wine market continues to grow. The interesting development over that time is that the Washington, Oregon and New York wine markets have increased dramatically. The US exports close to $1 B in wine each year. This number has been growing steadily. The interesting trend is the slowing down of some markets and the dramatic increase in others. China, Hong Kong and Japan have had significant growth in their importing of American wine. Unfortunately, this growth is countered with decreases in imports in majority of the other countries. It would appear that there would be an Asia Pacific growth pattern but both Singapore and South Korea showed decreases.
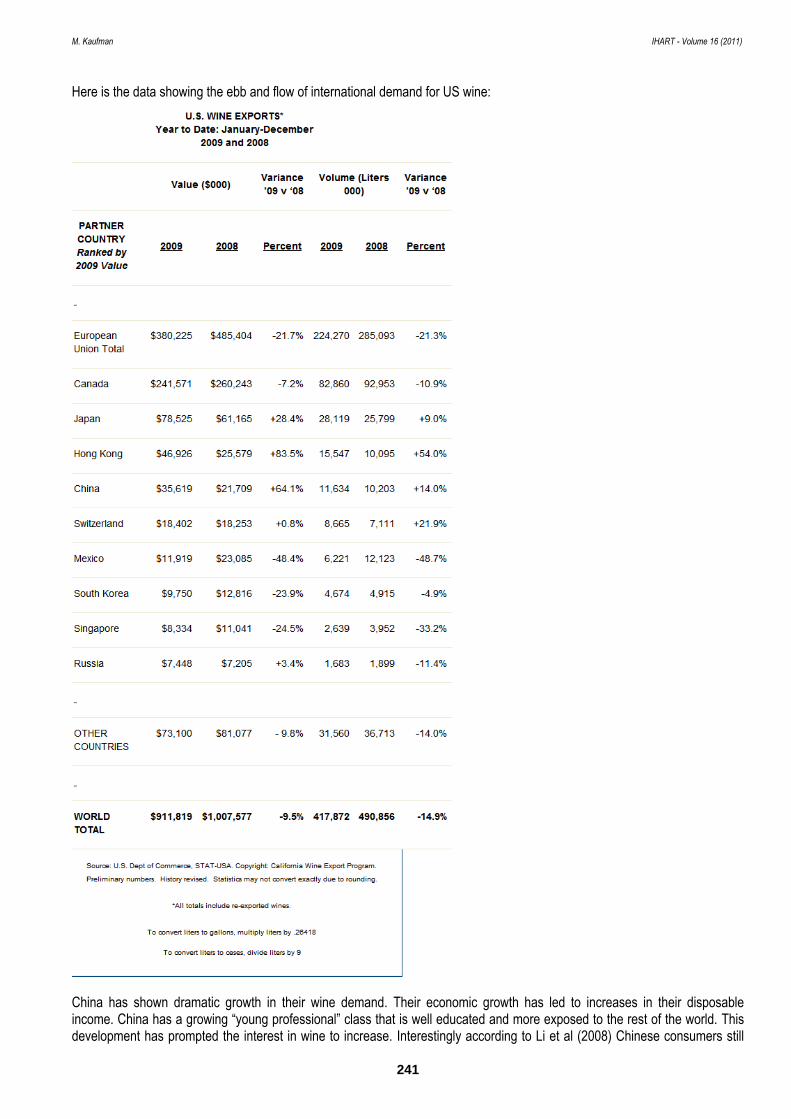
M. Kaufman IHART - Volume 16 (2011)
241
Here is the data showing the ebb and flow of international demand for US wine:
China has shown dramatic growth in their wine demand. Their economic growth has led to increases in their disposable income. China has a growing ―young professional‖ class that is well educated and more exposed to the rest of the world. This development has prompted the interest in wine to increase. Interestingly according to Li et al (2008) Chinese consumers still

Snapshot of the Global Wine Market
242
look to purchase wine from China 30% of the time and from France 20% of the time. Their survey reflected that the Chinese consumer thought the wines from their own country brought good quality or value in comparison to the cost. Extrapolating the growth curve for China‘s wine consumption it appears that American wine will become more pervasive over time. Cuellar et al (2009) performed the first in depth study of elasticity as it relates to varietal. They did not leave it at simply red and white; they dissected the two categories into twelve with the top six varietals in red and white wine. Just another example of the growing complexity of the wine market today. While much of the data was not statistically significant there were some interesting results. Two areas did not come as a total surprise. According to their findings, red wine drinkers are more willing to switch to white wine than vice versa. The usual progression upon being introduced to wine is to start with white wine which is sweet and then experiment with red adjusting to the taste. The second item is that consumers of more expensive wines are more willing to switch colors than consumers of wines less than $10. Consumers that are more experienced wine drinkers will likely be buying more expensive hence their openness to either red or white. It should be mentioned that Cuellar‘s data does not include purchases directly from the winery, restaurants or wine clubs. The data from the Cuellar study also mentions that the income elasticity is also higher for white wine. Again, it follows the same theory of new wine drinkers start with white. In this case as people begin earning more income they become exposed to wine and in the beginning start with white. Riesling, which is one of the sweeter of the white wines, has the highest income elasticity. Not surprisingly, pinot noir has the highest income elasticity of the reds. The grape is considered the most consumer friendly of the reds and it has grown in popularity since the movie ―Sideways‖ shined a light on it. Wine pricing in the US is by no means an exact science. Ernest and Julio Gallo (1994) wrote, ―One of the product attributes consumers are willing to pay for is ‗image‘, in other words, how they feel about the product.‖ Winemakers have to somehow calculate an abstract equation divining how much a consumer will be willing to pay based on a how a wine makes them feel. The wine industry is becoming more modern as of late and they certainly have complex marketing tools but that is more for the larger wineries with massive production. Their wines are more of a commodity and they focus on a certain price point. Smaller and midsized wineries need to be more theoretical as they approach pricing. This would also apply to larger wineries that produce a smaller special bottling such as a reserve. The evasive pricing becomes the slippery slope of price elasticity. Is the price more elastic when the cost is high or low? Is it more likely that the elasticity is different for each price point? Buccola and VanderZanden (1997) researched price elasticity for the wine market. They pulled their data from two separate studies. The elasticity for red was approximately -.81 and -.64 for white. After compiling their own data they found the elasticity to be a bit larger for white at -.85 while red was .08. They concluded with red wine prices are inelastic and white wine prices are elastic in 1993. Follows what was mentioned above about consumers willing to substitute one white for another and are less likely to substitute a red. Cross price elasticity is also relevant since there is so much competition in the wine market. It is so easy to find another similar bottle on the same shelf in just about any retail shop. The internet has opened doors on availability and has its own price wars. For lower priced wines the cross elasticity will be rather high. Consumers that are shopping on price will quickly change if the item they normally buy has increased their price. As an example in a small study, Cuellar and Lucey (2006) looked at an inexpensive merlot. They determined that the cross price elasticity was 5.76. The wine corporations at this price point have to be nimble. If a competitor quickly changes a price right before a major holiday it could mean millions in lost sales if they were caught flat footed. Income elasticity is playing a larger role than in the past in the wine market. This is mainly because the cost of wine is increasing. According to AC Nielsen the average price of a bottle of wine is now over $11. As wine prices increase income elasticity becomes higher. The more income someone makes the more they are willing to spend on a bottle of wine. Cuellar (2005) calculates that income elasticity for wine is .825. The overall number has some logic since the likelihood is that the income elasticity would be a good deal higher for the more expensive wines and negative for the inexpensive wines. A curious question and a thought for further research is do the lower priced wine companies market in relation to national income numbers and if so how do they plan to replace the consumers that will ―outgrow‖ their product? One of the more dynamic wine markets in the world is in Australia. Normally known as a beer drinking nation their wine consumption has increased considerably. More importantly though their wine production and the popularity of Australian wines around the world have made the other producing countries sit up and take notice. The Australian Bureau of Statistics (2009) compiled some numbers to give some insight into Australian wine production and sales.

M. Kaufman IHART - Volume 16 (2011)
243
WINE INDUSTRY 2008 - 2009
Value change in % from 2007
Imports of wine ($m) 473.3 9.7
Imports of wine (million L) 62.2 16.7
Exports of Australian wine ($m) 2 477.9 –7.6
Exports of Australian wine (million L) 752.1 5.2
Domestic sales value of Australian wine ($m) 1 962.2 –5.3
Domestic sales of Australian wine (million L) 429.9 0.6
Beverage wine inventories (million L) 1 879.3 0.1
Beverage wine production (million L) 1 182.6 –5.9
Fresh grapes crushed (t) 1 732 506.0 –5.4
Total winegrape production (t) 1 683 643.0 n/a
Area of bearing vines (ha) 157 290.0 n/a
Some interesting notes about these numbers. Australia has a sizeable imbalance between import and export. Australians prefer to drink their own wine. Incidentally they do drink a fair amount of wine from New Zealand. Outside of that, the majority of their wine consumption is local production. The import increased by a large amount so maybe their tastes are shifting. We shall see over time if the trend continues. The domestic sales number increased in the number of liters sold but the dollar amount decreased. At that time the Australian dollar dropped considerably from mid 2008 until the end of 2009. Clearly that would have an impact on pricing. The Bureau of Statistics (2009) goes on to show the meteoric growth of Australia‘s export of wine. In 1995 they exported approximately $400 million and last year it was $2.5 billion. Needless to say their demand has increased worldwide at a startling amount. The US and the UK have fueled a good portion of their growth. A combination of reasonable prices and consistent quality has made Australian wine popular. The Australian winemakers have done an excellent job of finding the correct price point for the masses. They also have higher end wines for the high income and more discriminating wine drinker. The United States and Great Britain account of 60% of the wine exported from Australia (2009). Edward Oczkowski has written about Australian wines for 20 years. In 2010 he did a hedonic pricing prediction and came up with the following results: The region is becoming more important to consumers and the winery is becoming less important. Australian winemakers and investors will certainly take note of where they will be planting in the future. Pricing will certainly start to change in relation to where it is grown. One particular story worth mentioning in regards to Australian wine is that of Yellow Tail. Bridewell and Cox (2007) researched how the company started from basically no sales in the US to become the largest imported wine brand. They understood price elasticity in the more inexpensive lines and coupled that with rather clever marketing campaigns. They underpriced the wine and built up a following that allowed them to slowly raise prices over time. Their rise was so dramatic that they were overwhelmed with demand within one year and had to quadruple their output. The largest and oldest wine producing region is clearly Europe. France and Italy have been stalwarts for well over one hundred years. Their history goes back much further than that as our founding fathers discussed an affinity for French wine. John Hailman (2006) wrote an entire book about Thomas Jefferson‘s interest in wine. Many historians can describe the depth of Ben Franklin‘s cellar and his love of French wine a well. Up until the 1980‘s French wine was by far the most popular wine in the US and it was synonymous with class. French wine can charge more than most other countries due to their reputation. French pricing is somewhat dictated by the French system appellation d‘origine controlee, or AOC (Chiffealou and Laporte, 2006). Their pricing is somewhat structured depending on where in France the winery is based. It is based heavily on the appellation and the varietal has considerably less impact. Zhao (2008) compared French to California wine and introduced some interesting theory. There has been the borrowing of French appellations with AVA (American Viticultural Area) in California. It has not worked as expected since Americans are less concerned about the specific area but it did allow for some foundation of infrastructure. On the other side of the pond, smaller French vintners from less well known appellations are following American practices of highlighting the varietal and the name of the winery. It is working as these wineries are being noticed and lauded. Ashenfelter (2008) describes in detail the inner workings of Bordeaux pricing. It has become a market unto itself. There are two forms of purchasing. One is for consumption today and the other is an investment or a prediction on how the wine will develop. This is based on the appellation, winery, vintage and weather that year. The pricing can increase considerably if the vintage receives critical acclaim. Bordeaux in particular is impacted heavily by an expert‘s rating. Robert Parker is one of the more well

Snapshot of the Global Wine Market
244
known wine critics in the world. He has been assessing wines for over 20 years. His scoring is published worldwide and has an enormous effect, positive or negative, on wine pricing. Elasticity would be affected as well depending on his score. Income elasticity would be higher for vintages that score well. The more valuable the bottle, the more someone would be willing to pay for it hence the need for higher income. The price would become more elastic. Consumers will buy the vintage that scores well whether the price drops, stays the same or increases. Bordeaux actually becomes a victim of conspicuous consumption to an extent. There is a market to trade Bordeaux futures and young wine bottles but it is also a status symbol. It would not be a stretch to think in some cases that Bordeaux purchases could be considered invidious. Dubois and Nuages (2010) performed an empirical study calculating the effect of Robert Parker‘s grade on a Bordeaux vintage. They concluded that Parker‘s grades have a considerable effect. Their results show a 1% increase in Parker‘s grade for a Bordeaux vintage could lead to as much as a 2.8% increase in price. Needless to say the winemakers pay close attention to Mr. Parker‘s commentary. He is similar to Alan Greenspan in his day. The interesting thought is Robert Parker will be 64 in 2011. Who will take his place when the time comes for him to hang up his glass? The wine industry must be wondering the same thing. Brentari and Levaggi (2010) have a working paper on the hedonic pricing of Italian wine. They focus on Italian consumer purchasing local product. Surprisingly the consumers are similar to France in that they are concerned about in which appellation the wine originated, but they also use alcoholic content as an indicator for purchase. As the authors note, it appears that the consumer do not seem overly focused on the wine quality itself. Wine has been a staple in Italy for hundreds of years and has become a major exporter over the last 25 years. Coldiretti is the largest farmer‘s union in Italy. According to their findings, Italy surpassed French wine production for the first time ever and remains the largest wine exporter to the US (2009). Italy has a similar model to Australia, perhaps that is why the two compete so heavily the US market with France third. The Italians have lower priced labels that they make in large quantities. The one advantage the Italians have over the Australians is the world‘s love of Italian food. The pairing is so natural that even the least informed of consumers will likely lean towards Italian wine if they are eating Italian food. The new player to watch in Europe is Spain. Demand for Spanish wine has skyrocketed as has their quality. Sellers-Rubio (2010) describes Spain as the third largest grower of wine in Europe but has the largest potential acreage available to grow wine on the continent. Spain also had a hedonic pricing study. Angulo et al (2000) researched all the regions throughout Spain. Their results follow France and Italy with the importance of the appellation. Spanish consumers also pay close attention to vintage and experts‘ ratings particularly for the more expensive bottlings. Spain continues to grow in the export market as well. As reported by Wines from Spain (2010), Spanish wines export to the US has increased close to 10% this year and the States are the #3 importer. France and Germany are the leaders and they have shown increases as well. Thach and Cuellar (2007) studied Spanish wine in the US. They note that in 2005 Spain was in 5th place on the US wine import list. By 2007 Spain has moved into 4th place over Chile. The also describe Spain‘s pricing strategy. Spain has differentiated itself from Australia and Italy by pursuing a higher price point ($7 - $10). They are also being successful in ranges over $10. On the whole, Spain has been a rather small player in the least expensive market since Spanish wines have a positive income elasticity. According to the authors, Spanish wine is seen as a complementary product to French, US, Italian and Australian wine. Incidentally, US consumers view Spanish white wine as inferior to other white wines as shown in the negative income elasticity (2007). The next few years should be interesting for Spain considering the amount of investment they have made in the wine industry. Their economy as a whole is in question so hopefully it will not negatively impact one of their brighter industries. The world of wine is intertwined. As the US imports more wine every year from different countries, US winemakers have to increase their export. This change brings about a development of wine appreciation in China and Japan of American wine. The Chinese wine market is improving as they see their consumers become savvier and have higher incomes. The spider‘s web that this creates continues into every continent. This paper is limited due to space and time. The wine regions in South America and South Africa were not included although they have a significant impact on the global wine industry. It should be mentioned that Portugal and Germany in particular are sizeable players and could have papers dedicated to each. The wine market has shown some consistency in pricing. The majority has positive income elasticities so as usual; it makes sense to follow the money. It will be interesting to see how the wine industry develops. If it stays on this trend the worldwide market will grow exponentially. There are so many markets left to penetrate. The US alone only has approximately 69 million wine drinkers out of a possible 212 million people of drinking age (Thach and Cuellar, 2007). Now that there has been a modernizing of wine manufacturing and a more scientific way of monitoring the weather wine should be taken to new heights in quality.

M. Kaufman IHART - Volume 16 (2011)
245
REFERENCES
Ashenfelter, Orley. (2008). Predicting the quality and prices of Bordeaux wine. The Economic Journal, 118 (June), F174–F184. Brentari, Eugenio and Levaggi, Rosella. Hedonic Price for the Italian Red Wine: A Panel Analysis (January 28, 2010). Available
at SSRN: http://ssrn.com/abstract=1440092 Buccola, S.T. and VanderZanden, L. (1997). Wine demand, price strategy and tax policy. Review of Agricultural Economics,
19(2), 428–440 Chiffoleau, Yuna and Laporte, Catherine. (2006). Price Formation: The Case of the Burgundy Wine Market. Revue française de
sociologie, Supplement: An Annual English Selection. Sociologie, 47,157-182. Cox, Juliet and Bridwell, Larry. (2007). Australian companies using globalization to disrupt the ancient wine industry.
Competitiveness Review: An International Business Journal, Vol. 17 No. 4, 209-221. Cuellar and Lucey. (2005). Forecasting California Wine Grape Supply Cycles. Wine Business Monthly, Dec. Dubois, Pierre and Nauges, Celine. (2010). Identifying the effect of unobserved quality and expert reviews in the pricing of
experience goods: Empirical application on Bordeaux wine. International Journal of Industrial Organization, 28, 205–212. Gallo, Ernest and Gallo, Julio. (1994). Ernest and Julio: Our Story. New York. Times Books. Hailman, John. (2006). Thomas Jefferson on wine. University Press of Mississippi; First Edition. Xiaoling Hu, Leeva Li, Charlene Xie, Jun Zhou. (2008). The effects of country-of-origin on Chinese consumers' wine purchasing
behaviour. Journal of Technology Management in China, Vol. 3 Iss: 3, 292 – 306. http://www.italymag.co.uk/italy/business/italian-wine-exports-see-record-year-2008 Oczkowski, Edward. (2010). Hedonic Wine Price Predictions and Nonnormal Errors. Agribusiness, Volume 26, Issue 4, 519–
535. Rosen, S. (1974). Hedonic prices and implicit markets: product differentiation in pure competition, Journal of Political Economy,
34 – 55. Sellers-Rubio, Ricardo. (2010). Evaluating the economic performance of Spanish wineries. International Journal of Wine
Business Research, Vol. 22 No. 1, 73-84. Thach, Elizabeth and Cuellar, Steven. (2007). Trends and implications for Spanish wine sales in the US market. International
Journal of Wine Business Research, Vol. 19 No. 1, 63-78. http://www.wineinstitute.org/resources/pressroom/03122010 http://www.winesfromspain.com/icex/cda/controller/pageGen/0,3346,1549487_6763451_6784365_4405158,00.html Zhao, Wei. (2008). Social categories, classification systems, and determinants of wine price in the California and French wine
industries. Sociological Perspectives, Vol. 51, Issue 1, 163–199.

W. C. Ingram IHART - Volume 16 (2011)
246
WHERE DO MILLENNIALS STAND ON THE MARKET SYSTEM?
William C. Ingram Lipscomb University, USA
ABSTRACT
One of the challenges of teaching is to be aware of the changing perspective of students over time. Much is made in popular media about the differences between the generally accepted categories of American generations. The formative experiences of the last three generations have been significantly different. The boomers were eye witnesses to the Cold War, Viet Nam, and the volatile 1970s. Generation X grew to maturity during the economic expansions of the 80s and 90s. Millennials have been shocked by the dramatic events of 9-11 and the financial crisis of 2008 with its consequent great recession. The focus of this investigation is the attitude of current students on the relevance and appropriateness of market forces with regard to major economic issues. Is there evidence of a shift in student opinion? Is there evidence that student attitudes are impacted by events during their formative years? To address these questions this study builds on previous studies to reveal how attitudes of the current generation of students (millennials) compare and contrast with the two previous generations (X and boomers). One of those studies (Jackstadt, Brennen, Thompson; Journal of Economic Education,17; 1985) incorporated thirty questions on free enterprise and public policy toward business. This study employs ten of those questions to survey a group of eighty students enrolled in two sections of principles of economics during the spring of 2011. Keywords: Student Attitudes, Millennials, Market System, Free Enterprise, Public Policy.

J. Abramson, A. Pierre and J. Stevens IHART - Volume 16 (2011)
247
LEADING BUSINESS INTELLIGENCE INITIATIVES
Jonathan Abramson1, Ashley Pierre1 and Jeffery Stevens1,2 1Colorado Technical University, USA and 2Workforce Solutions Company, USA
ABSTRACT
This article describes the need for business intelligence and requirements of successful business intelligence within the organization as a comprehensive and inclusive set of processes. The application of business intelligence as operational business intelligence is critical and integrated for day-to-day operations and project management, process improvement and streamlines processes through business intelligence, and enhances customer service. The article takes a view from above to outline the most important aspects of planning, designing, and implementing BI in the contemporary organization. The article seeks to clarify that business intelligence is not simply intelligence architecture, a data warehouse, a data mining operation, or any other architectural or infrastructural component. Business intelligence is a window into the organization‘s informational world. A composite set of subsystems that provide a virtual kiosk for employee access to informational flow. The informational flow provides users with business reporting functions and real-time business analytics which makes the system a highly capable decision support system. Leadership is critical to business intelligence success. The set of business systems and repository of vital business information represent how others will view the company. If business intelligence is not lead it may become another out of control IT failure. Leadership is key to the success of business intelligence projects as they have a high failure rate. Leaders aid the BI cause by providing a clear picture of BI benefits, value, and vision for the organization. Recognition of properly implemented BI characteristics of an agile, timely and flexible system that can consistently improve business performance, provide relevant revenue indicators, and help provide human capital and cash flow metrics. Conversely new leadership opportunities are afforded by successful BI implementation and maintenance. The leader and organization will be more capable to identify and explore business opportunities, experiment with newly discovered information assets and knowledge, and be able to take more informed risks, control the normal organizational chaos that is becoming mission critical in the contemporary business environment. All of these advantages create a compelling need for BI. Business intelligence planning, design, and implementation is a risk, but far less risky when… Keywords: Business Intelligence, Intelligence Architecture, Data Warehouse, Data Mining, Virtual Kiosk, Decision Support
System.
J. Plummer and H. Cochran IHART - Volume 16 (2011)
248
HOW ECONOMIC THEORY MAY EXPLAIN FREQUENCY COLLISION AVOIDANCE BEHAVIOUR AMONG HIGH FREQUENCY INTERNATIONAL BROADCASTERS
Jerry Plummer1 and Howard Cochran2
1Austin Peay State University, USA and 2Belmont University, USA
ABSTRACT
High frequency broadcasters have been operating internationally since the 1930‘s. An understanding of the logistics in which these broadcasters operate may contribute to an understanding of the problems encountered and overcome with selecting frequency allocation by broadcaster. High frequency transmissions are able to bridge long distances, so long that signals are inter-country in that the signal crosses many borders. Broadcasters use high frequencies to primarily inform and educate, but are also helpful in relief efforts in addition to providing some entertainment programming, and are sometimes used for propaganda or jamming purposes. High frequencies are especially invaluable within developing countries; where no other form of communication is readily available. The spectrum of available high frequencies tends to cluster within various ranges. Frequency collisions are the inevitable result of this clustering, that is, one broadcaster's signal interferes with a signal from a different broadcaster. Unlike the FCC model in the United States that allocates frequencies on a fixed range basis, high frequency international broadcasters voluntarily and informally coordinate their frequency spectrum through an international association. The logistics of frequency allocation and selection are executed using this model. The paper will discuss various logistics practices to avoid frequency collision that include technological solutions, self-policing, enforcement and negotiation. Economic theory and shades of behavioural economics will be utilized as well to address logistic market irregularities, including political considerations and other country risk factors that affect the distribution of high frequency programming across national borders, as well as introduce the logistics equilibrium cluster as a possible answer to frequency logistics management.

P. Kariuki IHART - Volume 16 (2011)
249
UTILIZING PROJECT MANAGEMENT TOOLS TO IMPROVE PROJECT PERFORMANCE IN AFRICA
Phyllis Kariuki
Morgan State University, USA
ABSTRACT
Africa is riddled with Non-Governmental Organizations (NGO), all claiming to help or solve problems facing the communities they live in. These NGOs are either funded by the United Nations, Charitable organizations like USAID and OXFAM, Religious organizations or private funds. Most local NGOs are formed by individuals or groups who have identified a problem that needs to be solved or a situation that need to be rectified. As such, they are usually temporally undertaking with a beginning and an end, or simply projects. The common thread to all these NGO is that the funding organization or individual expects the NGO to deliver what was sold to them. Unfortunately, this is not the case. Many of them have either nothing to show by the end, or the effort fails to demonstrate any noticeable progress or impact to the community. Keywords: NGO; United Nations; Project Management; Project Success Rate.
OVERVIEW
In 2009, United States contributed $5.6 billion to the United Nations budget which is 22% of $28 billion UN budget (USAID 2009 budget). Over 22% of United States Agency for International Development (USAID) 2010 $18 billion budget went to Africa and 9 out of 20 top funds recipients were African countries. 40% of Oxford Committee for Famine Relief International (OXFAM) 2009 budget, $.9 Billion budget too went to Africa (Program expenditure 2008-09, pg 20). All this funding is intended to go needy courses and most important, make a positive impact. Unfortunately this is not always the case. The reason being, the big funders fund home country NGOs, who then fund smaller NGOs. Sometimes this chain can be very long. At the end, the actual recipient is not accountable to the funding company and so not subjected to funding organization‘s performance requirements. And, even if the funding organization expects accountability, the performing NGO does not know how to. UN itself has been accused of mismanagement and incompetence in some of their projects. On April 1st, 2011 UN officials announced that the UN New York headquarters renovation project (projected to be completed by 2012) will finish $80 million over budget. The Same project was projected to be $280 over budget same time last year. The fact that the United Nations, with all its resources, funding and project management experience can have project problems demonstrates how important project management is for the success of any undertaking. Outside of these major funders, thousands of well-intentioned projects fail to deliver due to poor management or lack of efficient project management.
EXAMPLES OF FAILED PROJECTS
Electronic Voter registration in Uganda (Uganda)
During the 2002 elections, the Ugandan government decided to purchase cameras to take pictures of every Ugandan, load pictures into a database and use that database to verify and identify voters. The project had hardware and storage problems, tendering process was transparent and many cameras disappeared. The project failed to deliver. Problems: Lack of will from stake holders (citizens & government), change was too sudden, poor planning.
Lake Turkana Fish Processing Plant (Kenya)
To uplift the lives of the Turkana, a nomadic tribe (who do not eat fish) in Northern Kenya, the Norwegian government spent $22 million to set up a fish processing plant. The project failed because (1) Turkana distastes fish (2) they are nomads, (3) Semi-desert – high costs to operate freezers. Plant was shut down within months. Problem: The project failed because crucial stake holders were not included. Projects are undertaken to specific problems. With most projects, individual actually running them believe money alone can solve all the problems. They start out without clear objectives, no scope or schedule definition, and no quality assurance and control. And because they have no plan, they have no way of measuring success. They trudge on until they ran out of funds.

Utilizing Project Management Tools to Improve Project Performance in Africa
250
Some of the projects succeed in making short term impact on the community but is not long lived. Funding organizations stress sustainable development. Unfortunately short term success projects fail to achieve that.
UTILIZING PROJECT MANAGEMENT TO IMPROVE NGO FUNDED PROJECT SUCCESS RATE
Project Management can be utilized to give projects direction and increase chances of success. This can be done by applying proven project techniques and tools, and allowing definition of clear and achievable project scope, Schedule and budget. And, by sticking to a defined project baseline, utilizing tools like quality planning, quality assurance and control and both risk analysis and control. Successful projects could lead to increased funding for the NGO and value and more impact to the community. To achieve some level of project management, funding companies or individuals must at least demand and require the receiving company to specifically have some defined objectives, deliverables, required resources (labor, finance, time) and how project scope, time and cost would be tracked. This requirement would make the performing NGO more accountable and allow development of lessons learned for future reference.
REFERENCES
FY 2009 Foreign Operations Performance Report. http://www.usaid.gov/policy/budget/money/ Associated Press, (2007) Oil pipeline, fishing processing plant are few of the unsuccessful ones. http://www.msnbc.msn.com/
id/22380448/ns/world_news-africa/t/examples-failed-aid-funded-projects-africa/ USAID 2010 Budget. http://www.usaid.gov/policy/budget/cbj2010/2010_CBJ_Summary_Tables.pdf Schaefer, B. (2010) U.S. Funding of the United Nations Reaches All-Time High, WebMemo #2981 Oxfam Annual Report 2009-10 http://www.oxfam.org/sites/www.oxfam.org/files/oxfam-international-annual-report-2009-
2010.pdf Hughes, C. (2010) Headquarters Gets $1.8 Billion Facelift. http://newyork.construction.com/new_york_construction_news/201
0/0921_UNfacelift.asp
J. Wrieden IHART - Volume 16 (2011)
251
DISMANTLING BARRIERS TO THE FREE FLOW OF COMMERCE IN THE EUROPEAN UNION: A PRESCRIPTION FOR POLITICAL FAILURE
John Wrieden
Florida International University, USA
ABSTRACT
The European Union will propose measures to dismantle barriers to trade within the twenty-seven members of the EU. This paper will address the difficulties with regard to the integration of policy within the ―single market‖. This issue is particularly instructive given the political crisis affecting the Euro Zone. For example, Spain is dealing with an economic crisis which has resulted in an approximately 20 percent unemployment rate. Prime Minister Zapatero will almost certainly feel the effects of the economic crisis in the coming elections. Millions of jobs have been lost in the Euro Zone which forces political parties, organize labor and others to protest various initiatives of the EU. A basic ingredient to dismantling barriers will be the goodwill of many nations which are upwardly mobile and more transparency in nations with severe debt crisis. Attempts to enact the legal and regulatory goals of the European Central Bank (ECB), the Lisbon Treaty and the Schengen Agreement require a level of compromise which will become more difficult in the near future. This paper will discuss in detail how the economic crisis will impact the further reduction of barriers, particularly with regard to the movement of people, goods and financial services. It is self evident with regard to Greece, Ireland, Portugal and in my view Spain/Italy that there will be some retrenchment particularly by Germany and its commitment to increasing financial bailouts. The resulting fallout, I believe, will mark the most challenging era for the EU to date. The Lisbon Treaty which became law on December 1, 2009 took eight years after European leaders set out to make the EU ―more democratic, more transparent and more efficient‖. Under EU rules the treaty was ratified by all twenty-seven member states in order to have legal force. Any efforts in the near future to remove ―national vetoes‖ in areas such as climate change, emergency aid, agricultural subsidies, competition law as well as other issues such as taxation will be problematic with regard to the constitutional threshold of unanimity. Even with the redistribution of voting rights between the member states, the current fiscal and monetary emergency may trump the agreed upon process of reducing ―barriers‖ within the EU. Obviously, immigration in Southern Europe has become political dynamite. ―Fringe politicians‖ are receiving more support and credibility. The European Commission has recently referred numerous issues to the EU Court of Justice: to include; breaches of EU rules on the free movement of capital regarding investment restrictions imposed by certain nations. The free movement of capital is ―at the heart of the single market and allows for more open integrated, competitive and efficient markets and services in Europe‖. Unfortunately, the necessity to provide a financial underpinning for, now, numerous EU states has reduced the political mobility of other member states. Once again, the paper will discuss the dichotomy between politics/re-election and economics. Clear definition with regard to ECB regulations and European Commission rules will be more difficult in the near term. On issues as diverse as ensuring EU businesses can setup operations/supply services or even online gambling in Europe, the financial crisis will exact a toll on various countries. The difference between member states who believe in reducing government spending/raising interest rates in the midst of severe unemployment in other countries is extraordinary. The variation between the philosophy of the ECB and a more liberal mindset of the IMF is also an important element of the discussion. These issues along with promises of nations to impose severe austerity programs may become politically untenable. The issues discussed herein will be analyzed with regard to their impact on the success or failure of further integration and reduction of barriers within the EU. Finally, I am not sanguine about reaching the EU‘s stated goals in the near term.

SECTION 3
SCIENCE & TECHNOLOGY
Late Intake Valve Closing and Early Exhaust Valve Opening in a Four Stroke Spark Ignition Engine Stephen A. Idem and Karthik Silaipillayarputhur .......................................................................................................................... 253
A Case for Intelligent Mobile Agent Computer Network Defense Robert O. Seale and Kathleen M. Hargiss ................................................................................................................................... 264
Spark Advance Effects in Spark Ignition Engines Stephen A. Idem and Karthik Silaipillayarputhur .......................................................................................................................... 272
An Anthropomorphic Perspective in Homology Theory Brett A. Sims ................................................................................................................................................................................ 286
Motor-Control Center Design Joshua Lepselter, Lamar Jones, Nate Goodman, Marquael Green and Adnan Bahour ............................................................. 295
The Skinny on the Lap-Band: A Case Study Barbara K. Fralinger and Amy Dorsey ......................................................................................................................................... 298
ABSTRACTS
Factors Affecting Cloud Computing Acceptance in Organizations: From Management to the End-Users‘ Perspectives Festus Onyegbula, Maurice Eugene Dawson Jr. and Jeffery Stevens ........................................................................................ 312
Applying Object Orientated Analysis Design to the Greater Philadelphia Innovation Cluster (GPIC) for Energy Efficient Buildings William Emanuel, Corey Dickens and Maurice Eugene Dawson Jr. ............................................................................................ 313
Developing the Next Generation of Cyber Warriors and Intelligence Analysts Maurice Eugene Dawson Jr., Miguel Angel Crespo and Darrell Norman Burrell ......................................................................... 315
A Qualitative Study of Recurrent Themes from the Conduct of Disability Simulations by Doctor of Physical Therapy Students Ronald De Vera Barredo.............................................................................................................................................................. 316
Rich Eating with a Poor Income: Can the Poor Afford to Eat a Healthy Diet? Anita H. King ................................................................................................................................................................................ 318
Exploring Alzheimer‘s Disease from the Perspective of Patients and Caregivers Phyllis Skorga .............................................................................................................................................................................. 319
S. A. Idem and K. Silaipillayarputhur IHART - Volume 16 (2011)
253
LATE INTAKE VALVE CLOSING AND EARLY EXHAUST VALVE OPENING IN A FOUR STROKE SPARK IGNITION ENGINE
Stephen A. Idem1 and Karthik Silaipillayarputhur2
1Tennessee Technological University, USA and 2Kordsa Global, USA
ABSTRACT
This study investigates the effects of late intake valve closing and early exhaust valve opening on volumetric efficiency and lost work in a four-stroke spark ignition engine. The effects of pressure drop through intake and exhaust poppet valves were also studied. Two basic valve lift profiles - namely sinusoidal and instantaneous - were considered in this study. The effects of late intake valve closing and early exhaust valve opening were examined for various engine speeds, valve sizes, and valve discharge coefficients. Finally, an optimum intake valve closing angle to maximize the volumetric efficiency and an optimum exhaust valve opening angle to minimize lost work were established.
INTRODUCTION
The Otto cycle models the special case of a four-stroke internal combustion engine whose combustion is so rapid that the piston hardly moves during the event; refer to Figure 1. Relative to the ideal cycle an actual cycle produces less work. In part, this is due to the finite duration of combustion and heat transfer from the charge during the expansion stroke [1]. Moreover, valve opening/closing does not occur on dead center. In addition, constant pressure intake and exhaust processes occur only at low engine speeds. This paper investigates the effects of late Intake Valve Closing (IVC) and early Exhaust Valve Opening (EVO) on the performance of a typical four-stroke spark-ignition engine. The effects of pressure drop through intake and exhaust poppet valves are also studied. Initially, the piston is at the topmost position-Top Dead Center (TDC) and is ready to move down, and draw in a mixture of fuel and air. At this point, the inlet valve is open and exhaust valve is closed. A fresh charge of air-fuel mixture enters the cylinder through the inlet valve, due to the suction created during the induction stroke. The pressure losses that occur as the air-fuel mixture passes through the intake valve and port are considered in this study. This intake of fresh air-fuel mixture continues even after the piston has reached Bottom Dead Center (BDC). Typically, the intake valve remains open after BDC, and this is done to enhance the charging of the engine cylinder or cylinders [2]. During the compression stroke, the piston moves upward and compresses the charge enclosed in the cylinder. The pressure and temperature of the mixture increases continuously during this process. As the piston reaches TDC, an electric spark ignites the mixture. The burning of this mixture is almost instantaneous, and the pressure and temperature of the gases increase over a crank angle increment of approximately 30-90 degrees, depending on the engine speed. The increased pressure of the burned mixture exerts a large force, and pushes the piston down. The high pressure and high temperature gases push the piston downwards and the gas pressure gradually decreases. This stroke is known as power stroke, as work is done during this stroke. The exhaust valve opens during this stroke, even before the piston reaches BDC, as this improves the removal of burnt gases from the engine cylinder. Volumetric efficiency is a parameter used to measure the effectiveness of an engine‘s induction process. The term is only used with four-stroke engines, which have a distinct induction process. Volumetric efficiency is affected by various parameters such as engine speed, intake and exhaust valve geometry, valve size, valve lift, etc. This study deals with the effects of late intake valve closing for various engine speeds, valve discharge coefficients, valve diameters, and valve lift profiles. The goal is to determine an optimum intake valve closing angle, so as to maximize the volumetric efficiency. This study also examines early exhaust valve opening for various engine speeds, valve diameters, and valve lift profiles. The purpose is to determine an optimum exhaust valve opening angle, so as to minimize lost work.
NOMENCLATURE
AR Valve curtain area (m2) AF Air-fuel ratio B Bore (m)

Late Intake Valve Closing and Early Exhaust Valve Opening in a Four Stroke Spark Ignition Engine
254
CA Crank Angle (degrees) Cd Discharge coefficient cv Specific heat at constant Volume di Valve inner seat diameter (m) ds Valve stem diameter (m)
dv Valve head diameter (m) l Valve lift (m) LW Lost work (N-m) m Mass of charge (kg)
.
m Flow rate of charge mass (kg/s)
p Pressure of gases in the combustion chamber at any instance (kPa) po Upstream stagnation pressure (kPa) pT Downstream static pressure (kPa) QHV Heating value of the fuel (kJ/kg)
R Universal gas constant for air (KJ/kgK) r Compression ratio R1 Engine design parameter S Stroke T Temperature of the gases in the combustion chamber at any instance (K) To Upstream stagnation temperature (K) V Volume of the cylinder at any instance (m3)
Vd Displacement volume, SB4
2
(m3)
W Thermodynamic work done on or by the engine (kJ) xr Residual mass fraction
Valve seat angle (degrees)
Gas specific heat ratio (cp/cv)
Thermal efficiency
c Combustion efficiency
Crank angle (degrees)
o Crank angle at valve opening (degrees)
Crank angle interval (degrees)
Density of charge (kg/m3)
GOVERNING EQUATIONS
Consider Figure 2, which depicts the main geometric parameters of a poppet valve head and seat. The mass flow rate through a poppet valve is usually described by the equation for compressible flow through a restriction. It is derived from a one-dimensional isentropic flow analysis [3]. Real gas flow effects are included by means of an experimentally determined discharge coefficient Cd. In that case for a sub-critical flow
.
m = (CdARpo/(RTo)0.5)(pT/po)0.5 *A (1)
where: A = {2/(-1)(1-(pT/po)(-1) /)}0.5
The valve of the discharge coefficient CD and the choice of the reference area are linked together. The product CDAR is referred to as the effective flow area of the valve assembly AE, thus
CdAR = AE (2)
The most convenient reference area in practice is the valve curtain area
ldA vR (3)
Typical inlet valve discharge coefficients, adapted from [4], are plotted in Figure 3 as functions of Reynolds number and dimensionless valve lift l/dv. Likewise, typical exhaust valve data, adapted from [3], are plotted in Figure 4 as a function of

S. A. Idem and K. Silaipillayarputhur IHART - Volume 16 (2011)
255
dimensionless valve lift. For a wide range of exhaust valve and port designs, the discharge coefficient is a constant approximately equal to 0.7. Many of the considerations applied to intake valves likewise apply to exhaust valves. However, because exhaust gas density is much lower than for the intake mixture, pressure losses are also lower. Hence, exhaust valves are typically smaller in diameter than the inlet valves. Flow through an exhaust valve will at first be choked, and the velocity is sonic. This occurs when the ratio of pressure across a restriction is greater than or equal to
(po/pT)={(+1)/2}/(-1) (4)
If = 1.35 is assumed for air, this yields:
po/pT=1.86 (5)
In that case, for choked flow through the exhaust valve, the mass flow rate is given by
)1(2/)1(5.05.0
ooRd
.
)1/2())RT/(pAC(m (6)
Two valve lift profiles were considered in this study. If the valve lift is assumed instantaneous, the valve lift immediately assumes it maximum value. A rule of thumb for maximum valve lift is given by
l = (dv / 4) (7)
In that case, over the crank angle interval, for which the valve is open, the flow area is given by
AR=dv2/4 (8)
A sinusoidal profile was also considered, wherein
AR/Amax=[sin((-o)/)]1/4 (9)
where the maximum flow area Amax = dv2 / 4. The two assumed valve lift profiles are compared in Figures 5 and 6, for an
assumed crank angle interval of 180º. In practice, the instantaneous lift profile would entail an infinite acceleration, whereas the sinusoidal profile is more representative of actual lift profiles [3].
At any crank angle , the instantaneous cylinder volume is given by
V()={Vd/(r–1)}+(Vd/2)[R1+1-cos-(R12–sin2)1/2] (10)
Using the ideal gas law and rearranging Equation (1) yields:
dm/dt= (CdAR(RTo)0.5)(pT/po)0.5 *A‘ (11)
where: A‘ = {2/(-1)(1-(pT/po)(-1) /)}0.5 m/V The terms on the right hand side are either assumed to be constant, or are functions of the instantaneous charge mass m and
the crank angle . Hence, Equation (11) may be written as
dm/dt=f1(m,) (12)
or
dm/d=f1(m,)/(d/dt) (13)
This differential equation was integrated numerically by Euler‘s method [5]. In that case, for a crank angle interval of , the charge mass in the cylinder at each crank angle increment i is given by
mi+1=mi+f1(m,)/(d/dt) (14)
The integration starts at TDC (refer to Figure 1) and proceeds to IVC. It was necessary to specify the thermodynamic state prior to the induction stroke to initiate the calculations. At IVC, the calculated charge mass by ideal gas law is given by mIVC. In that case, the volumetric efficiency is given as

Late Intake Valve Closing and Early Exhaust Valve Opening in a Four Stroke Spark Ignition Engine
256
v=(mIVC–mTDC)/Vdmanifold (15)
Consider the case of flow through a single exhaust valve. Referring to Figure 1, the thermodynamic state at C is assumed known from an ideal Otto cycle analysis. The expansion process from C to EVO is isentropic. Likewise, the charge is assumed to expand isentropically into the exhaust manifold when the exhaust valve opens. Using the ideal gas law and isentropic relationship and rearranging Equation (6), it can readily be shown that
dm/dt= (CdAR(RTo)0.5)(VEVO)(-1) /2)}*K (16)
where: K = {2/(+1)}(+1) /2( -1) m/V
The right-hand side is a function of the instantaneous charge mass m and the crank angle , hence
dm/dt=f2(m,) (17)
or
dm/d = f2 (m,) / (d/dt) (18)
This differential equation was also integrated numerically by Euler‘s method [5]. For a prescribed crank angle increment , the instantaneous charge mass in the cylinder is given by
mi+1=mi-f2(m,)/(d/dt) (19)
where the subscript i denotes a discrete crank angle. It is possible that the pressure ratio across the exhaust valve will be less than that given Equation (5), late in the expansion stroke. That implies the flow is no longer choked, and the mass flow is instead described by Equation (1). In that case the
instantaneous charge mass was still calculated by Equation (16), although the function f2 (m,) was modified appropriately. For brevity, the details are not shown. Relative to the ideal Otto cycle, less work is produced when early EVO is employed. The cylinder pressure would attain atmospheric pressure, well before the piston reaches BDC, when the exhaust valve is opened early in the expansion stroke or at very low engine speeds. In such cases the lost work is given by
)VV(ppdv)1/()VpVp(LW BDCee
e
EVO
EVOEVOBDCBDC (20)
The subscript e denotes the point where the cylinder pressure reaches atmospheric pressure in the exhaust process and the
subscript BDC refers to point D in Figure (1). The term e
EVO
pdv was calculated using the trapezoidal rule [5]. At moderate
engine speeds, the cylinder pressure would attain atmospheric pressure after the piston reaches BDC. In such cases lost work is given by
S)1/()VpVp(LW EVOEVOBDCBDC (21)
where: S = )VV(ppdvpdv BDCee
e
BDC
BDC
EVO
The subscript e denotes the point where the cylinder pressure reaches atmospheric pressure in the exhaust process and the
subscript BDC refers to point D in Figure (1). The terms BDC
EVO
pdv and e
BDC
pdv were calculated using the trapezoidal rule [5]. The
lost work was calculated on a dimensionless basis by dividing through by the maximum energy applied to the engine, i.e., ((LW)/((ρVd / AF) QHV)))*100.
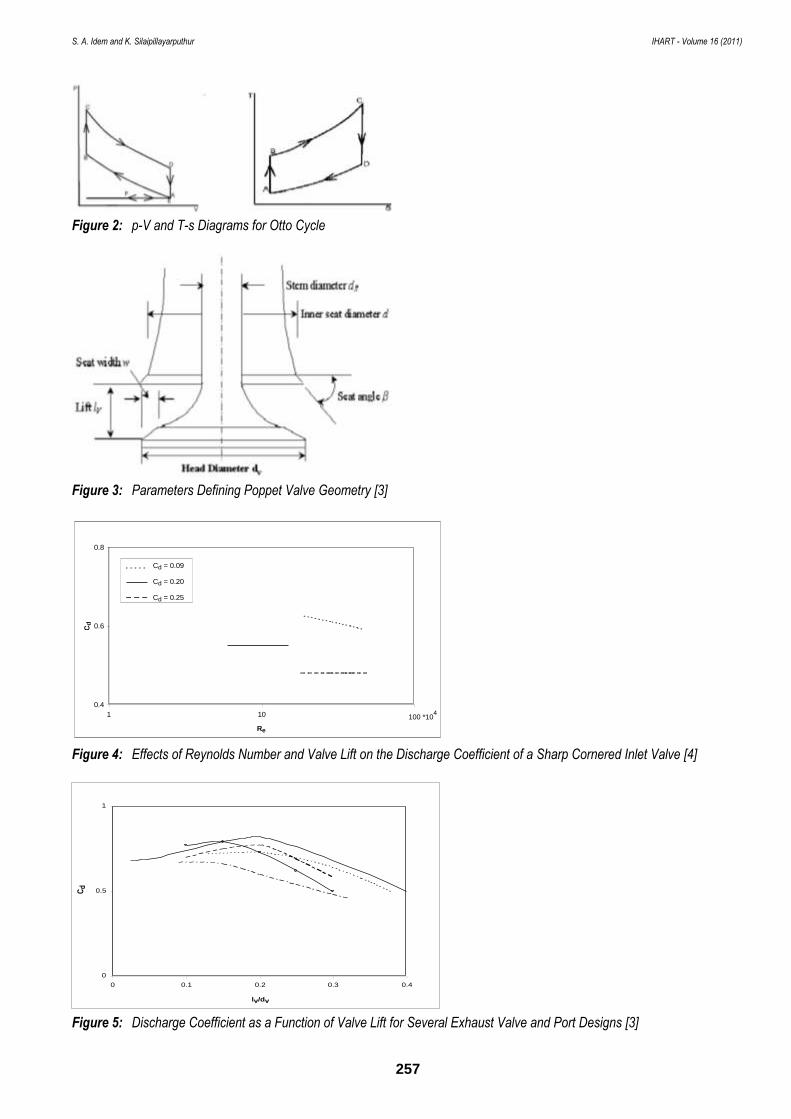
S. A. Idem and K. Silaipillayarputhur IHART - Volume 16 (2011)
257
Figure 2: p-V and T-s Diagrams for Otto Cycle
Figure 3: Parameters Defining Poppet Valve Geometry [3]
0.4
0.6
0.8
1 10 100 *104
Re
Cd
Cd = 0.09
Cd = 0.20
Cd = 0.25
Figure 4: Effects of Reynolds Number and Valve Lift on the Discharge Coefficient of a Sharp Cornered Inlet Valve [4]
0
0.5
1
0 0.1 0.2 0.3 0.4
lv/dv
Cd
Figure 5: Discharge Coefficient as a Function of Valve Lift for Several Exhaust Valve and Port Designs [3]

Late Intake Valve Closing and Early Exhaust Valve Opening in a Four Stroke Spark Ignition Engine
258
0.0
0.1
0.2
0.3
0.4
0.5
0.6
0.7
0.8
0.9
1.0
1.1
120 160 200 240 280 320 360
Crank Angle (Degrees)
AR
/Am
ax
Figure 6: Sinusoidal Valve Lift Profile–EVO 60 Before BDC
0.0
0.1
0.2
0.3
0.4
0.5
0.6
0.7
0.8
0.9
1.0
1.1
120 160 200 240 280 320 360
Crank Angle (Degrees)
AR/A
max
Figure 7: Instantaneous Valve Lift Profile - EVO 60 Before BDC
SPECIFICATIONS OF BASELINE ENGINE
In order to study the effects of early EVO and late IVC on energy loss and volumetric efficiency, it was necessary to define baseline engine geometry and operating conditions. The geometry, combustion parameters, and operating conditions chosen for this study are presented in Tables 1 through 4. As described earlier, the study on early EVO and late IVC were conducted on two different valve lift profiles, namely instantaneous and sinusoidal. The present study was performed at various engine speeds ranging from 500 rpm to 6000 rpm. Typical valve arrangements were considered in the present study. The number of valves (inlet and exhaust) considered in this study, and their geometry, are sketched in Figure 7. These configurations are identified in [2] as having the maximum possible valve diameter to bore ratio, without compromising the structural integrity of the cylinder head. For brevity, these geometries are herein referred to as case A, case B, and case C, respectively. In those instances where multiple intake/exhaust valves were present, the valve was modeled as a single valve having an equivalent diameter that would yield the same cross section as the combined multiple valves. The fraction of the cylinder cross section occupied by the intake/exhaust valve(s) are presented in Table 4. Relative to the other geometries, Case B has the highest percentage of cylinder cross section occupied by both the intake and exhaust valves. The effects of late IVC were examined for discharge coefficients of 0.5, 0.6, and 0.7 in this study. For the case of EVO, a typical discharge coefficient of 0.7 was assumed in the study.
Table 1: Geometry for Baseline Engine
B S r R
(m) (m)
0.092 0.089 9 3.5

S. A. Idem and K. Silaipillayarputhur IHART - Volume 16 (2011)
259
Table 2: Combustion Parameters for Baseline Engine
QHV AF Ratio c xr
(KJ/kg)
43,000 14.6 1.0 0.0
Table 3: Operating Conditions for Baseline Engine
P1 T1
(kPa) (K) (intake Stroke) (Compression/Power Stroke)
101 298 1.4 1.35
Table 4: Comparison of Valve Areas for Different Configurations Used in This Study
Intake Valve Exhaust Valve Intake Valve Exhaust Valve Intake Valve Exhaust Valve
(% area) (% area) (% area) (% area) (% area) (% area)
19.36 14.44 24.01 18 21.78 16.82
Case A Case B Case C
Case A Case B Case C
Figure 8: Valve Geometry
EFFECTS OF LATE IVC OR EARLY EVO
For intake valves, the governing equation, (14), was integrated numerically by the Euler method, using a crank angle interval of 0.1 degree. For exhaust valves, the governing equation, (19), was likewise integrated numerically by Euler‘s method, wherein a crank angle increment of 0.1 degree was also employed. Consider Figures 8 through 13. Results calculated by numerical modeling of the intake stroke using sinusoidal valve lift are summarized in these figures. For brevity, the results obtained by numerical modeling of the intake stroke using instantaneous valve lift are not plotted; refer to [7] for additional details. The crank angles at IVO for which the maximum volumetric efficiency was obtained are also depicted. It can be noticed that at low engine speeds, the maximum volumetric efficiency is approximately 98% for all discharge coefficients and lift profiles. For a typical engine speed of 3000 rpm, and a moderate discharge coefficient of 0.6, it was observed that an unrealistically high volumetric efficiency of 98% is obtained for all cases A, B, and C assuming an instantaneous valve lift. For the same conditions, maximum volumetric efficiencies of 0.6, 0.8, and 0.75 are obtained for cases A, B, and C assuming a sinusoidal valve lift. Likewise, considering an engine speed of 3000 rpm and an intake valve discharge
coefficient of 0.6, it can be observed that the optimum IVC angle for Case A was 255, for Case B it was 230, and for Case C
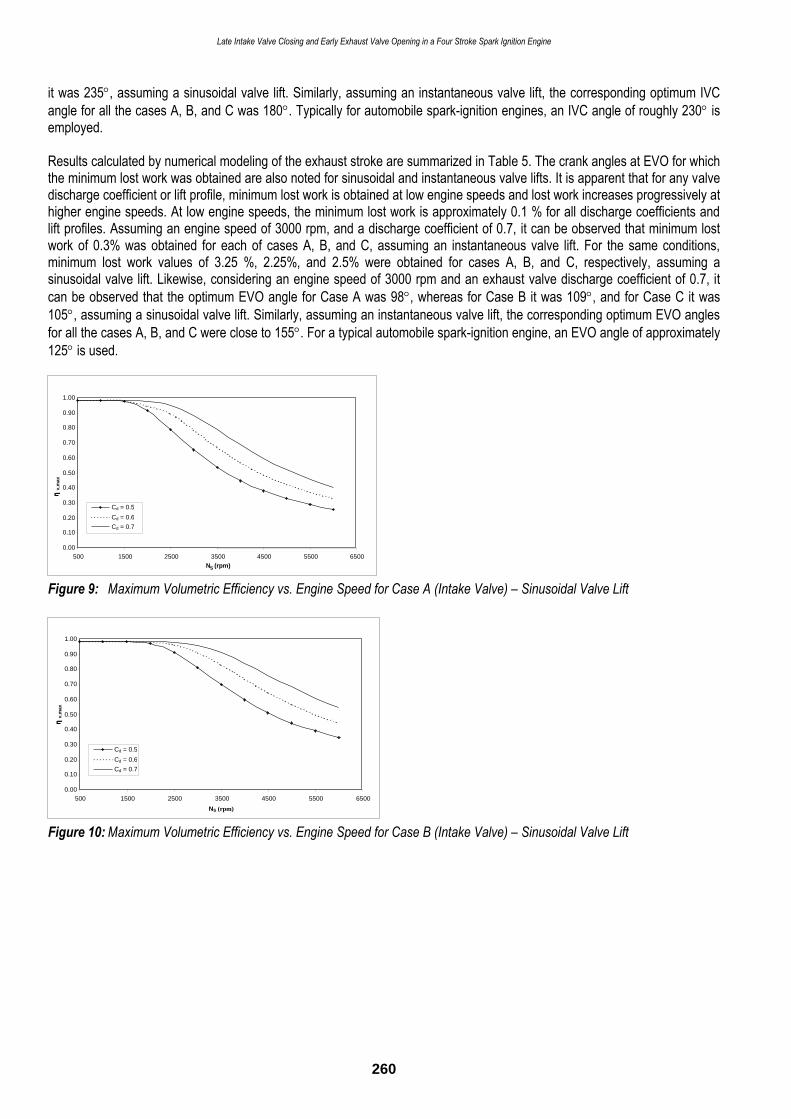
Late Intake Valve Closing and Early Exhaust Valve Opening in a Four Stroke Spark Ignition Engine
260
it was 235, assuming a sinusoidal valve lift. Similarly, assuming an instantaneous valve lift, the corresponding optimum IVC
angle for all the cases A, B, and C was 180. Typically for automobile spark-ignition engines, an IVC angle of roughly 230 is employed. Results calculated by numerical modeling of the exhaust stroke are summarized in Table 5. The crank angles at EVO for which the minimum lost work was obtained are also noted for sinusoidal and instantaneous valve lifts. It is apparent that for any valve discharge coefficient or lift profile, minimum lost work is obtained at low engine speeds and lost work increases progressively at higher engine speeds. At low engine speeds, the minimum lost work is approximately 0.1 % for all discharge coefficients and lift profiles. Assuming an engine speed of 3000 rpm, and a discharge coefficient of 0.7, it can be observed that minimum lost work of 0.3% was obtained for each of cases A, B, and C, assuming an instantaneous valve lift. For the same conditions, minimum lost work values of 3.25 %, 2.25%, and 2.5% were obtained for cases A, B, and C, respectively, assuming a sinusoidal valve lift. Likewise, considering an engine speed of 3000 rpm and an exhaust valve discharge coefficient of 0.7, it
can be observed that the optimum EVO angle for Case A was 98, whereas for Case B it was 109, and for Case C it was
105, assuming a sinusoidal valve lift. Similarly, assuming an instantaneous valve lift, the corresponding optimum EVO angles
for all the cases A, B, and C were close to 155. For a typical automobile spark-ignition engine, an EVO angle of approximately
125 is used.
0.00
0.10
0.20
0.30
0.40
0.50
0.60
0.70
0.80
0.90
1.00
500 1500 2500 3500 4500 5500 6500
N S (rpm)
v
,max
Cd = 0.5
Cd = 0.6
Cd = 0.7
Figure 9: Maximum Volumetric Efficiency vs. Engine Speed for Case A (Intake Valve) – Sinusoidal Valve Lift
0.00
0.10
0.20
0.30
0.40
0.50
0.60
0.70
0.80
0.90
1.00
500 1500 2500 3500 4500 5500 6500
NS (rpm)
v
,max
Cd = 0.5
Cd = 0.6
Cd = 0.7
Figure 10: Maximum Volumetric Efficiency vs. Engine Speed for Case B (Intake Valve) – Sinusoidal Valve Lift
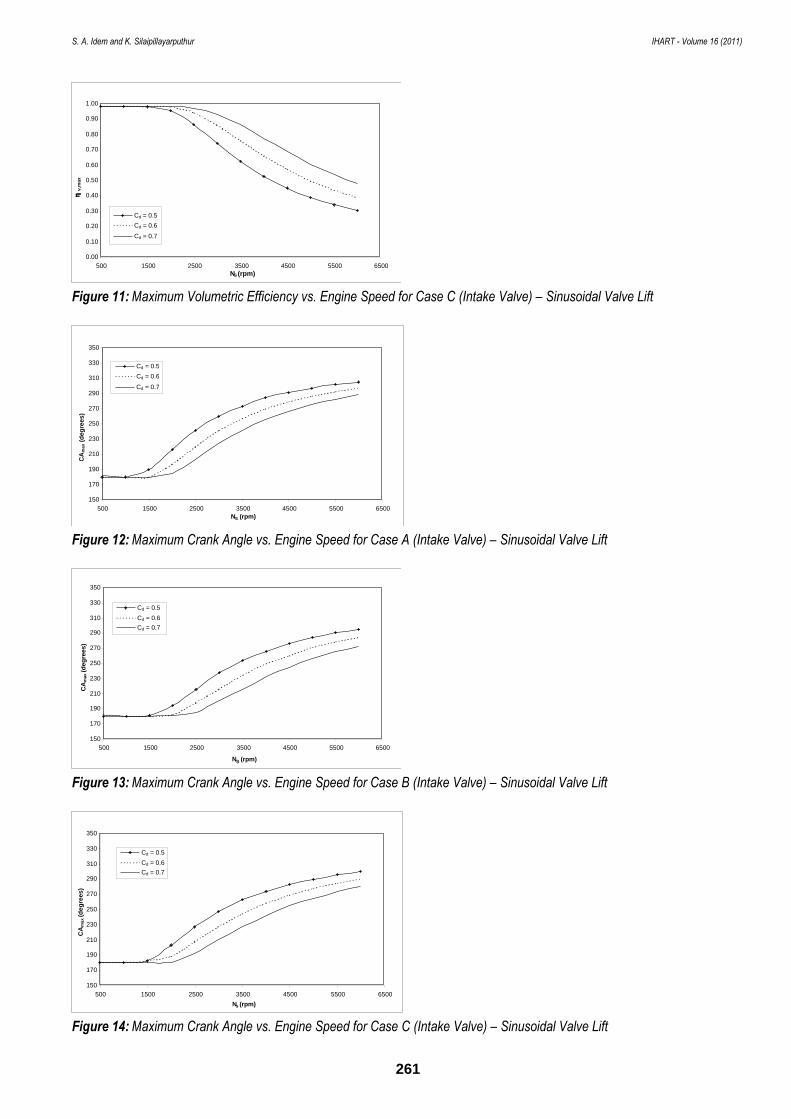
S. A. Idem and K. Silaipillayarputhur IHART - Volume 16 (2011)
261
0.00
0.10
0.20
0.30
0.40
0.50
0.60
0.70
0.80
0.90
1.00
500 1500 2500 3500 4500 5500 6500
N S (rpm)
v
,max
Cd = 0.5
Cd = 0.6
Cd = 0.7
Figure 11: Maximum Volumetric Efficiency vs. Engine Speed for Case C (Intake Valve) – Sinusoidal Valve Lift
150
170
190
210
230
250
270
290
310
330
350
500 1500 2500 3500 4500 5500 6500
N S (rpm)
CA
max (
de
gre
es
)
Cd = 0.5
Cd = 0.6
Cd = 0.7
Figure 12: Maximum Crank Angle vs. Engine Speed for Case A (Intake Valve) – Sinusoidal Valve Lift
150
170
190
210
230
250
270
290
310
330
350
500 1500 2500 3500 4500 5500 6500
N S (rpm)
CA
max (d
eg
rees
)
Cd = 0.5
Cd = 0.6
Cd = 0.7
Figure 13: Maximum Crank Angle vs. Engine Speed for Case B (Intake Valve) – Sinusoidal Valve Lift
150
170
190
210
230
250
270
290
310
330
350
500 1500 2500 3500 4500 5500 6500
N S (rpm)
CA
max (d
eg
rees
)
Cd = 0.5
Cd = 0.6
Cd = 0.7
Figure 14: Maximum Crank Angle vs. Engine Speed for Case C (Intake Valve) – Sinusoidal Valve Lift

Late Intake Valve Closing and Early Exhaust Valve Opening in a Four Stroke Spark Ignition Engine
262
Table 5: Results from Early EVO Sinusoidal Valve lift
Rpm Min % of Rpm Min % of Rpm Min % of
Energy Lost Energy Lost Energy Lost
500 0.13 500 0.09 500 0.10
1000 0.42 1000 0.29 1000 0.33
1500 0.87 1500 0.60 1500 0.68
2000 1.49 2000 1.02 2000 1.15
2500 2.30 2500 1.55 2500 1.77
3000 3.29 3000 2.21 3000 2.52
3500 4.34 3500 2.99 3500 3.41
4000 5.39 4000 3.86 4000 4.35
4500 6.42 4500 4.73 4500 5.27
5000 7.42 5000 5.59 5000 6.19
5500 8.28 5500 6.45 5500 7.09
6000 8.71 6000 7.29 6000 7.97
Rpm Optimum EVO Rpm Optimum EVO Rpm Optimum EVO
500 160.50 500 163.50 500 163.50
1000 145.60 1000 151.20 1000 151.20
1500 132.10 1500 139.60 1500 137.40
2000 119.10 2000 129.20 2000 126.40
2500 107.80 2500 118.80 2500 115.60
3000 98.40 3000 109.60 3000 105.80
3500 93.30 3500 101.50 3500 98.10
4000 88.00 4000 96.40 4000 93.90
4500 83.60 4500 91.80 4500 89.30
5000 79.80 5000 87.80 5000 85.20
5500 79.10 5500 84.20 5500 81.70
6000 80.10 6000 81.00 6000 78.60
Case A Case B Case C
0.38 B 0.424 B 0.410 B
Case C
0.410 B
Case A
0.38 B
Case B
0.424 B
Table 5 (Continued): Instantaneous Valve Lift
Rpm Min % of Rpm Min % of Rpm Min % of
Energy Lost Energy Lost Energy Lost
500 0.01 500 0.01 500 0.01
1000 0.04 1000 0.03 1000 0.03
1500 0.09 1500 0.06 1500 0.07
2000 0.16 2000 0.11 2000 0.12
2500 0.26 2500 0.17 2500 0.19
3000 0.38 3000 0.25 3000 0.28
3500 0.52 3500 0.34 3500 0.39
4000 0.70 4000 0.45 4000 0.52
4500 0.90 4500 0.58 4500 0.67
5000 1.14 5000 0.73 5000 0.84
5500 1.42 5500 0.90 5500 1.04
6000 1.72 6000 1.09 6000 1.26
Rpm Optimum EVO Rpm Optimum EVO Rpm Optimum EVO
500 175.50 500 176.40 500 176.10
1000 171.00 1000 172.30 1000 172.40
1500 166.20 1500 169.00 1500 168.10
2000 162.00 2000 165.20 2000 164.30
2500 157.10 2500 161.40 2500 160.40
3000 152.30 3000 158.10 3000 156.40
3500 147.50 3500 154.00 3500 152.30
4000 142.70 4000 150.30 4000 148.20
4500 137.80 4500 146.40 4500 143.90
5000 132.80 5000 142.20 5000 139.70
5500 128.00 5500 138.50 5500 135.50
6000 123.10 6000 134.60 6000 131.30
Case A Case B Case C
0.38 B 0.424 B 0.410 B
0.38 B 0.424 B 0.410 B
Case A Case B Case C
CONCLUSIONS
This study has presented a numerical analysis of the effects of early EVO and late IVC on the performance of a typical four-stroke spark-ignition engine. It was determined that at any engine speed, there exists an optimum intake valve closing angle for which the volumetric efficiency is maximized and an optimum exhaust valve opening angle for which the lost work is minimized. Opening the exhaust valve(s) before BDC allows completion of the blowdown process before the exhaust stroke has
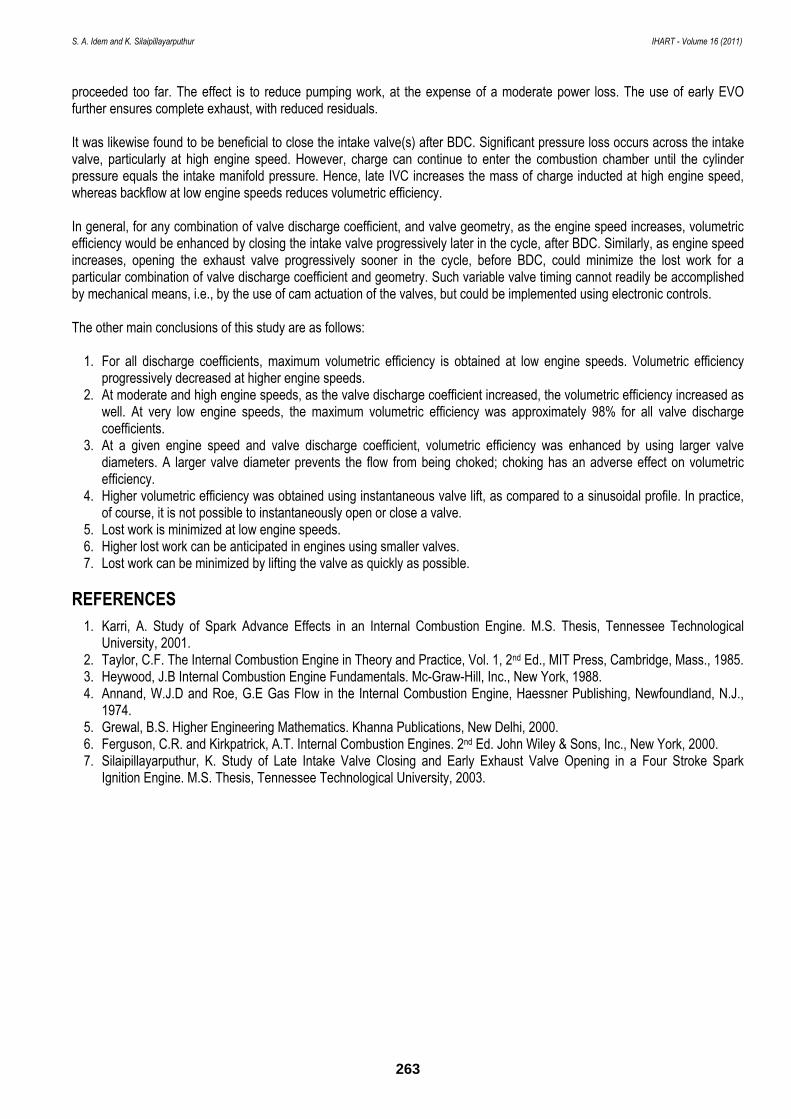
S. A. Idem and K. Silaipillayarputhur IHART - Volume 16 (2011)
263
proceeded too far. The effect is to reduce pumping work, at the expense of a moderate power loss. The use of early EVO further ensures complete exhaust, with reduced residuals. It was likewise found to be beneficial to close the intake valve(s) after BDC. Significant pressure loss occurs across the intake valve, particularly at high engine speed. However, charge can continue to enter the combustion chamber until the cylinder pressure equals the intake manifold pressure. Hence, late IVC increases the mass of charge inducted at high engine speed, whereas backflow at low engine speeds reduces volumetric efficiency. In general, for any combination of valve discharge coefficient, and valve geometry, as the engine speed increases, volumetric efficiency would be enhanced by closing the intake valve progressively later in the cycle, after BDC. Similarly, as engine speed increases, opening the exhaust valve progressively sooner in the cycle, before BDC, could minimize the lost work for a particular combination of valve discharge coefficient and geometry. Such variable valve timing cannot readily be accomplished by mechanical means, i.e., by the use of cam actuation of the valves, but could be implemented using electronic controls. The other main conclusions of this study are as follows:
1. For all discharge coefficients, maximum volumetric efficiency is obtained at low engine speeds. Volumetric efficiency progressively decreased at higher engine speeds.
2. At moderate and high engine speeds, as the valve discharge coefficient increased, the volumetric efficiency increased as well. At very low engine speeds, the maximum volumetric efficiency was approximately 98% for all valve discharge coefficients.
3. At a given engine speed and valve discharge coefficient, volumetric efficiency was enhanced by using larger valve diameters. A larger valve diameter prevents the flow from being choked; choking has an adverse effect on volumetric efficiency.
4. Higher volumetric efficiency was obtained using instantaneous valve lift, as compared to a sinusoidal profile. In practice, of course, it is not possible to instantaneously open or close a valve.
5. Lost work is minimized at low engine speeds. 6. Higher lost work can be anticipated in engines using smaller valves. 7. Lost work can be minimized by lifting the valve as quickly as possible.
REFERENCES
1. Karri, A. Study of Spark Advance Effects in an Internal Combustion Engine. M.S. Thesis, Tennessee Technological University, 2001.
2. Taylor, C.F. The Internal Combustion Engine in Theory and Practice, Vol. 1, 2nd Ed., MIT Press, Cambridge, Mass., 1985. 3. Heywood, J.B Internal Combustion Engine Fundamentals. Mc-Graw-Hill, Inc., New York, 1988. 4. Annand, W.J.D and Roe, G.E Gas Flow in the Internal Combustion Engine, Haessner Publishing, Newfoundland, N.J.,
1974. 5. Grewal, B.S. Higher Engineering Mathematics. Khanna Publications, New Delhi, 2000. 6. Ferguson, C.R. and Kirkpatrick, A.T. Internal Combustion Engines. 2nd Ed. John Wiley & Sons, Inc., New York, 2000. 7. Silaipillayarputhur, K. Study of Late Intake Valve Closing and Early Exhaust Valve Opening in a Four Stroke Spark
Ignition Engine. M.S. Thesis, Tennessee Technological University, 2003.

R. O. Seale and K. M. Hargiss IHART - Volume 16 (2011)
264
A CASE FOR INTELLIGENT MOBILE AGENT COMPUTER NETWORK DEFENSE
Robert O. Seale and Kathleen M. Hargiss Colorado Technical University, USA
ABSTRACT
Intrusion Prevention Systems based on signatures and behavior heuristic algorithms lack an ability to effectively learn and adapt to specific network environments and require extensive human intervention. Layering security from the network down to the operating system levels often means duplicating scans and inflicting significant performance hits to overall computing speeds. Autonomous agents with the ability to acquire and use knowledge and the ability to adapt to an ever-changing virtual environment combined with an ability to discern the difference between acceptable and unacceptable behaviors and processes can significantly reduce the workload of system administrators by reducing the need for human intervention. Distributing the malware protection over a network using multiple specialized autonomous mobile agents reduces the overall workload of all the systems on the network by eliminating duplication of effort and by offloading the bulk of the tasks to computers on the network that are least active. In a world where the shifting computer paradigm includes decentralized heterogeneous networks with no defined perimeter, the task of monitoring and enforcing security policies is ever more crucial to smooth and efficient operations. Self-adapting agents that learn enables administrators to deploy and configure once and allow agents to adjust their operating parameters to adapt to changing architectures. Keywords: Software Agents, Computer Network Security, Intelligent Agents, Network Protection, Intrusion Prevention.
A CASE FOR INTELLIGENT MOBILE AGENT COMPUTER NETWORK DEFENSE
―In a world in which the total of human knowledge is doubling about every ten years, our security can rest only on our ability to learn‖
~Nathaniel Branden
The problem with computer security as it exists today is that it is too complex, requires users to answer too many questions that cannot be answered, gets in the way of completing jobs, and requires too much interaction when the focus should be on the task. All these questions and interferences with productivity do not necessarily equate to a totally secure computing environment. New threats are appearing at an alarming rate. According to the latest Symantec threat report, a record 6.8 million new computer infections occurred by the end of 2009 which equates to a computer being infected with malware once every 4.6 seconds (Symantec, 2010). The total number of malware catalogued by the Aberdeen Group at the end of 2010 exceeded 10 million new pieces of malware, up 110% from 2009 (Aberdeen Group, 2010). Additionally, as the complexity of applications and network architectures increase, the number of reported vulnerabilities per year from 2005 to 2009 averaged 4,464 common vulnerabilities and exposures (CVEs), which is the ―industry standard to uniquely identify vulnerabilities‖ (Secunia, 2010). In addition to vulnerabilities that exist in software applications that can only be resolved by better coding techniques, a survey conducted of the attendees of 2010 DEFCON 18 hacking conference by Tufin Technologies indicated that 76% of all the respondents encountered misconfigured networks and security software and that those misconfigured IT resources were the easiest to exploit (Prince, 2010). For computer security to be effective, it needs to be proactive and interfere as little as possible with workflow processes. Computer security should solve problems by itself and operate in the background without impeding productivity. Effective security constructs should be intelligent, identify, solve, and fix problems, as well as learn about new threats without requiring manual updates or requiring a restart to apply changes during the workday. Security should keep computer systems and privacy information safe, secure, and protect data in a way that requires no thought and no intervention by human administrators. Current intrusion and malware prevention solutions available today have been unable to stay ahead of the malware and hacker threat. Most current solutions are far from automatic and have no ability to adapt to changing paradigms without human input and human intervention. There are potential improvements that can be achieved by applying artificial intelligence theory to current distributed mobile agent technology to form a proactive security network framework that will enforce network policies, prevent malware infections, and improve the overall security profile of a given system.

R. O. Seale and K. M. Hargiss IHART - Volume 16 (2011)
265
An issue that has plagued most studies in the application of artificial intelligence is the lack of a coherent definition as to what artificial intelligence is in order to determine the threshold to achieve an ―intelligent‖ system. This paper does not attempt to define an intelligence threshold; rather, concentrates on using some of the precepts of artificial intelligence. Some of these precepts include situational awareness, problem solving, and the ability to learn and apply new knowledge through analytical decision-making processes to improve computer security and reduce the requirement for human interaction. This paper will be used to examine two distinct fields of computer science, artificial intelligence and computer security, to improve existing computer technology. Malware and malicious hacking techniques have always remained a step ahead of malware and intrusion prevention technologies. This is due to a heavy on threat signatures to recognize and react to a malware threat. The disadvantage to this method of security is that there is always a delay between the time a threat is recognized and when the antivirus companies to create signatures apply the patch or signature is downloaded and applied to the system. Threat signatures can only be created after malware has been captured dissected, and reverse engineered to provide a solution. This process can take weeks or even months after the vulnerability is discovered before a solution is fielded. Polymorphic malware payloads that hide within an encrypted shell make it difficult to develop reliable detection signatures. Combine this with the ability of the morphing malware to change its signature by incorporating random bits of code into the body its body to change its size and content, and the malware can effectively evade detection. Employing multiple autonomous intelligent agents can streamline the process of identifying threats through the enforcement of process-based policies to isolate aberrant or unrecognized run-time processes. The problem with using either process or behavior based recognition is that damage can be done in the time that it takes the agent to recognize the process or behavior as a threat. The solution is to provide a safe environment using a virtual computing environment (sandboxing) technique to isolate the process from the operating system and hardware resources to prevent any potential damage that may be caused by allowing the process to continue. Malware that attempts to disguise itself using encryption or morphism would reveal itself in the virtual environment through its behavior and process threads. If behavior recognition agents determine the process to be benign, they can add a rule to allow future instances of that process to run in normal memory space unhindered. If behavior recognition agents determine that the process is suspicious, additional agents are summoned that are responsible for identification and possible eradication of the malware that started the process. If the source of the process cannot be determined, the process thread can be stopped entirely and a rule created to prevent the process from starting again if it is deemed hazardous to the system by the detection agents. The process is recorded and catalogued for further review by the agent system or human administrator.. Malware can effectively hide what it looks like, but in the end, cannot hide what it does. User behaviors and actions on computer assets and the network can be handled in similar fashion as malware threats. When user behavior or actions fall outside of the established policy and rules governing fair use of the system, the entire user session is moved into a virtualized environment. The user is allowed to continue their work as their behavior is analyzed within the sandbox. Users would not be allowed to save any data to an external device nor send email while in the virtualized session. If the user‘s actions taken in its entirety are deemed by user behavior recognition agents as consistent with the user‘s job requirements, the session is moved back into normal memory space and the user is allowed to continue unimpeded. If the user action is deemed suspicious, system administrators are alerted and the system remains in a virtualized session. Agents collaborate to determine a ―best case‖ resolution to a given problem would analyze the potential threat. This leaves users unaware that security measures are enforced as long as the user behavior falls within the acceptable use policies outlined by the organization aside from the system log that is created by agents working on the problem. Although user logs do not necessarily play a role in preventing an intrusion, logs would still be required as forensic evidence of a breach that was missed by the agents.
BACKGROUND
Most intrusion detection and protection methods are reactive in nature due to their reliance on constant threat signature updates. Although heuristic pattern recognition is more commonplace in malware protection software, their detection rates remain low for unknown threats while the false alarm and subsequent user lockout rate is unacceptably high (AV Comparative, 2010). The combination of growing rules and signature databases coupled with more robust heuristic scanning methods are using more and more system resources and reducing the processing potentials of the systems they are installed on to the point where productivity begins to be impacted as each byte of data is examined and compared to the signature database. The compromise is usually to reduce the scanning depth or frequency to improve speed; however, this also equates to a reduction in the level of security protection for the system.

A Case for Intelligent Mobile Agent Computer Network Defense
266
The solution to the problems stated above are directly related to intrusion prevention system‘s ability to incorporate unused network resources and autonomously detects and reacts to potential threats to the system without relying on human intervention. Many of the delays experienced by users are a result of the system awaiting a human decision to allow a process which does not fit neatly into an existing policy. The field of Artificial Intelligence (AI) is hindered by several factors; however, none more than an inability for AI experts to agree on an Artificial Intelligence standard definition (Legg & Hutter, 2007). Part of this problem is driven by reluctance to define intelligence in the field of Psychology and Neuroscience that are parallel fields of study. Linda S. Gottfredson, a renowned expert in the field of human intelligence, describes attempts of experts to define general intelligence in a public arena as falling ―down the rabbit hole into Alice‘s Wonderland‖ (Gottfredson, 1998). Past attempts to define intelligence that can be construed as being related to either race or genetics has resulted in ferocious public attacks by the media creating reluctance among researcher to define intelligence at all. Although defining general intelligence is not crucial to furthering the body of knowledge related to artificial intelligence, the lack of a single coherent definition prevents a researcher from establishing a true test of intelligence – artificial or otherwise – that would establish a threshold that would be universally accepted as an ―intelligent‖ system. For the purposes of this paper the threshold for intelligence is defined as specific attributes which must be attained. Those attributes include:
The ability to acquire and use knowledge.
The ability to reason and solve problems.
The ability to adapt the current knowledge base and adapt it to solve new problems.
The ability to recognize acceptable and unacceptable behaviors and processes and apply rules and policies to restrict malicious acts.
The ability to add knowledge to the existing knowledge base.
Future definitions of AI could very well find that the scope of the threshold for intelligence used in this paper less than adequate. For this reason, this paper will concentrate more upon the attributes selected rather than attempting to define a system that would meet any anticipated future requirements of an Artificially Intelligent system. The closest form of software-based problem solving methods that comes close to artificial intelligence in use today involves the use of heuristic predictive algorithms that work on cause and effect principles. Modern heuristic processes attempt to solve problems based upon available data to apply a ―best case‖ solution to a given problem. In heuristic thinking there is no absolute state of true or false; rather it looks at everything from the perspective of what is mostly true or mostly false. When applied to computer security and malware scanning, heuristically algorithms attempt to observe processes and/or behaviors and make decisions based on a predetermined set of rules which are determined by the software programmer rather than the organization using the technology protect their networks. The net result is that heuristic scanning is error prone and as a result, is often relegated to intrusion detection rather than intrusion prevention duties. In the intrusion detection role, heuristic scanning creates seemingly endless logs that must be reviewed by human system administrators to determine whether the suspect processes are in fact malicious processes. The normal evolution of any software solution has been to move from software developer hard coded requirements to allowing system administrators and users the ability to customize output results to their needs; computer security is no different. As a result, much work is being done to allow end users the ability to customize requirements to the needs of their organization using a variety of methods. Advances along traditional paths may, in fact, lead to an acceptable solution to many of the problems identified in this paper without actually employing artificial intelligence principles or theory.
WHY MOBILE AGENTS?
The concept of the Mobile Agent has been in existence since the 1960‘s where mobile code was used to execute remote job entry systems; however, the benefit potential of using mobile agents in many different applications opens the possibility of no longer being tied to a single platform, operating system, or location and remains vastly untapped. What makes a mobile agent unique is that it ―is not bound to the system on which it begins execution (Lange & Oshima, 1999)‖. Mobile agents are free to roam among all of the hosts connected to the network without regard to the operational state of any one host. Mobile agents can ―halt themselves, ship themselves to another agent-enabled host on the network, and continue execution, deciding where to go, and what to do along the way‖ (Jansen & Karygiannis, 1999). Some of the proven benefits of using mobile agents

R. O. Seale and K. M. Hargiss IHART - Volume 16 (2011)
267
include reducing network load, their ability to adapt to dynamically changing environments, they are naturally heterogeneous and, they are robust and fault tolerant (Jansen & Karygiannis, 1999),
WHAT IS AN INTELLIGENT AGENT?
Building on what is already known about mobile agents; an intelligent agent should have certain properties or characteristics such as autonomy, social ability, reactivity, pro-activeness, and rationality (Woolridge & Jennings, 1995). Autonomy does not refer to absolute freedom; rather, it refers to a state in which agents can make decisions within the parameters of the framework they were designed to work in without human intervention (Castelfranchi, 1990). In a multi-agent environment as is proposed by this paper, agents must exhibit an ability to interact with other agents and when necessary, human operators through the use of an ―agent-communication‖ (Genesereth & Ketchpel, 1994); thus, agents need to be social entities which communicate their intent, their findings, and their actions to coordinate solutions. For an agent to be reactive or pro-active in a given environment they must be able to perceive their environment in the context of what they were intended to do. Reactivity implies that the agent can perceive an event that requires some kind of action and pro-activeness infers that he agent is goal-oriented and can take initiative to act by recognizing that something is missing from the environment that should be there (Woolridge & Jennings, 1995). The foundation of this paper relies on the use of intelligent rational agents. Norvig and Russell (2010) define a rational agent as ―anything that can be viewed as perceiving its environment through sensors and acting upon that environment through actuators (pg. 34).‖ The agents themselves may be intelligent or the agent may be a component of a system of agents that communicate and coordinate their actions to form an intelligent system (Russell & Norvig, 2010). They further define what is rational in terms of the agent‘s perception of its present environment that depends on four things: ―the performance measure that defines the criterion of success, the agent‘s prior knowledge of the environment, the actions that the agent can perform,‖ and ―the agent‘s percept sequence to date‖ (Russell & Norvig, 2010, p. 37). An agent is rational when it selects an action that is expected to maximize its performance. The outcome is not as important to rational decision-making as the choices that were available at the time the decision was made. The rational choice may fall short of the overall objective; thus the outcome of the choice could be deemed as ―wrong‖ in spite of the fact that there was not an obvious ―right‖ answer at the time there was a need to make a choice. In a multi-agent environment, each agent specializes in a particular problem-solving function. In order for an agent to arrive at a best-case solution to a given problem, it must be able to accurately and completely evaluate the environment to determine what actions can be taken given a specific goal to accomplish. Additionally, ―an agent with several immediate options of unknown value can decide what to do by first examining future actions that eventually lead to states of known value. (Russell & Norvig, 2010, p. 65)‖ Once the agent arrives at a solution and begins executing, ―it ignores its percepts… because it knows in advance what the actions will be‖ (Russell & Norvig, 2010, p. 66). After the agent carries out its intended actions, it re-examines the environment to evaluate its effectiveness. To a certain degree, a multi-agent environment can be likened to an ant colony. ―Each ant chooses to perform a role according to the local conditions it observes. For example, foragers travel away from the nest, search for a seed, and when they find one, bring it back immediately. The rate at which foragers return to the nest is an approximation of the availability of food today‖ (Russell & Norvig, 2010, p. 429). While the subject of swarm intelligence touches on an entirely different field than what this paper examines, the individual roles of each agent (ant) in the colony (system) in an intelligent multi-agent environment has similar roots (Holloway, Lamont, & Peterson, 2009). Each agent works autonomously as opposed to cooperatively; however, assuming that each agent performs a function within the system which is both required and necessary, the combined efforts of each agent essentially creates a cooperative structure (Sulaiman, Sharma, Ma, & Tran, 2009).
BRIEF BACKGROUND ON COMPUTER SECURITY
While artificial intelligence theory can be traced back before the advent of the first computer, the idea that computer systems need protection from being attacked is a relatively recent development. The first internet worm attack occurred on 3 November of 1988 (Baskerville, 2006). Although malware had existed before that time, the impact was limited because the distribution system – primarily in the form of removable media such as floppy discs – was an inefficient way to spread an infection from computer to computer (Cohen, 1984). Once viruses gained widespread notoriety via mass media reports of computer attacks through the internet, commercial and non-commercial antivirus programs began to surface to combat the new threat (Miller, 2007). Simultaneous development of firewalls and the first Intrusion Detection Systems which monitored for unauthorized intrusions laid the foundation for future Intrusion Prevention Systems which would combine the capabilities of malicious software (malware) prevention and intrusion detection systems (Baskerville, 2006).

A Case for Intelligent Mobile Agent Computer Network Defense
268
Traditional intrusion detection and malware detection techniques rely heavily on signature-based detection where the software looks for specific bits of code to identify malware (Idika & Mathur, 2007). Heuristic-based detection that attempts to analyze behaviors and activities was added to enhance the detection capabilities and to detect the new generation of viruses that uses encryption shells and morphing capabilities to bypass detection of signature-based systems (Szor, 2005, pp. 252-288). The true effectiveness of these systems is not known since the only detection rates that can be measured is based primarily on the detection of known malware; the detection of zero-day threats – threats which have not been identified, cataloged, and countermeasures deployed – defies statistical gathering methods. A study to quantify the potential effectiveness of major commercial antivirus software conducted by Carnegie Mellon University in 2009 suggests that up to 62.15% of all new malware infections on average cannot be detected on the first day of the infection and up to 8.61% of malware after a month of being in the ―wild‖ (Sukwang, Kim, & Hoe, 2010). The measure of effectiveness of modern Intrusion Detection Systems (IDS) is not necessarily how effective it is at detecting an intrusion; rather, the measure of effectiveness is the percentage of false alarms within a given period. In a study conducted by the University of New Brunswick, Canada the false alarm rate for common heuristic-based IDS systems was as high as 89.89%. Additionally, the heuristics are based on known methods of intrusion that look for behavior based on a set of rules; thus heuristic-based IDS cannot detect intrusions which use previously unknown techniques (Guan, Ghorbani, & Belacel, 2003). Prior to the advent of the World Wide Web, the only real threats were from hackers who were more interested in breaking into systems and stealing some kind of proof that they were there as bragging rights within their own social circles (Clarke, Clawson, & Cordell, 2003). The evolution of computer security essentially began as policy measures in which authentication, authorization, and access control methods were standardized by the Department of Defense (DoD) with the publication of CSC-STD-00l-83, Department of Defense Trusted Computer System Evaluation Criteria – more commonly known as the ―Orange Book‖ – and the rest of the Rainbow series of computer security standards published in 1983. Since the time that the Orange Book was introduced, networks have evolved into far more complex constructs than what was available at the time the Orange Book was written; yet, the security paradigms specified in the Orange Book remain as the foundational basis for all new computer security applications and theory (Siponen, 2003). The evolution of information and computer security standards in ISO 2700 series, ISO 15408 (also known as the Common Criteria), various National Institute for Standards and Technology publications, and continuous improvement models such as the Systems Security Engineering – Capability Maturity Model (SSE-CMM) have not been able to address the security issues which are exposed by emergent technologies such as cloud computing networks and an increasing reliance on global network communication (Leavitt, 2009) . Additionally, even if these standards are implemented and fully supported, it is no guarantee a system is secure. In 2010 alone, there were 371 high profile data breaches in organizations like banking, finance and credit institutions (39 breaches), medical and healthcare facilities (108 breaches), government and military organizations (60 breaches), educational institutions (34 breaches), and commercial businesses (130 breaches) exposing the personal information of an estimated 14,560,354 customers and clients (Identity Theft Resource Center, 2010). According to a study conducted by the Ponemon Institute that was sponsored by the PGP Corporation that looked at 45 companies from 15 different industry sectors and found that the direct and indirect organizational costs associated with a data breach averaged $6.75 million (Ponemon Institute, 2010) per breach.
ARTIFICIAL INTELLIGENCE AND THE INFORMATION SECURITY PARADIGM
Often the problem with the current security paradigm has little to do with the available technology as much as it has to do with the amount of human interaction that is required to make it work properly or the restrictions security imposes on legitimate user actions. This is especially true as emergent technologies and architectures whittle away at the perimeter walls that current security paradigms rely on to keep systems secure (Leavitt, 2009). If the complications of emergent technologies are combined with the known issues and limitations of currently available malware and intrusion detection systems, the amount of human interaction that is required to efficiently monitor operations becomes untenable. The solution to the problem is to apply a technology which possesses a human-like ability to evaluate a potential problem, determine a best course of action, and apply the corrective measures at speeds that could only be attained by a machine while minimizing the false alarm rate for issues which must be passed on to the human administrator for action (Depren, Topallar, Anarim, & Ciliz, 2005). Machine intelligence is often compared to human intelligence. The capacity of the human brain to perceive its environment, reason, solve problems, evaluate outcomes, memorize inputs, and its capacity for creativity has long been the goal of most artificial intelligent systems (Hawkins & Blakeslee, 2004, pp. 9-18). Agents can be likened to neurons in the brain, each with a specific function and design. The neural network of axons and dendrites that create the synapse of the brain can be likened to the communication network between agents in a multi-agent system in which actions are indirectly coordinated through the

R. O. Seale and K. M. Hargiss IHART - Volume 16 (2011)
269
agent synapse (Hawkins & Blakeslee, 2004, pp. 23-32). A critical piece to problem solving is the ability of the brain to predict outcomes based on a logical sequence of events. Intelligent agents would need to be able to weigh a given problem based on the potential outcome of its actions. In some cases where the agent is not equipped to deal with the problem, the solution may be nothing more than to act as a sensor for the other agents in the system and communicate its observations so that another agent which is better equipped to handle the problem can be given the opportunity to act (Hawkins & Blakeslee, 2004, p. 106). The human brain contains approximately 100 billion neurons. Each neuron creates an estimated 1,000 connections per neuron. This means that the average human brain has an estimate 100 trillion connections. Each neuron is capable of performing an estimated 200 calculations per second which means that the human brain is capable of processing up to 20 billion million instructions per second (MIPS) (Kurzweil, 2001). If Moore‘s Law holds true, a single processor computer will not be able to perform at the same capacity of the average human brain until at least the year 2023 (Kurzweil, 2001). The workaround to the single intelligent processor is the distributed agent paradigm which takes advantage of numerous processors distributed over a network which, if taken in its entirety, can exceed the number of neurons, number of connections, and the number of instructions per second of the human brain given a large enough network of computers (Nils, 1998). Given the predicted abilities of an artificially intelligent system combined with the complications of accurately identifying malicious behavior or the presence of malicious software on a given network, the melding of AI and computer security seem to be a natural evolution of both fields of study (Weiss, 1999).
CONCLUSION
The globalization and virtualization of computer networks has complicated the task of securing networks. In the past where networks were isolated or contained a limited number of gateways to the internet, computer security often involved the task of securing a defined perimeter and ensuring that malware protection was installed on each computing device on the network. Although this paradigm provided an adequate level of security, in the modern distributed network model that is prevalent in today‘s open network environment simply securing the network perimeter and individual machines has proved less than adequate (Ponemon Institute, 2010). A complete intrusion prevention system must address two specific areas. First, the system must be able to detect anomalies in user behaviors that would indicate malicious intent (Pikoulas, Buchanan, Mannion, & Triantafyllopoulos, 2002). Second, it must be able to detect the malicious behavior of software code that violates the system policies (Esfandi, 2010). In order to be most effective, the IPS must be able to examine processes on the host using host-based intrusion detection (HID) as well as the ability to examine packets moving on the network using network-based intrusion detection (NID) (Inella, 2001). Traditional IDS/IPS technologies work well in the closed network with a few controlled gateways paradigm; however, is less than effective when combined with distributed computing architectures such as cloud computing that lacks a defined perimeter (Does IDS have a future in cloud security, 2010). Mobile agents work well within the emerging cloud computing paradigm due to their ability to efficiently move and communicate in a flexible computing environment consisting of different operating systems, platforms, virtualized computing architectures, and constantly changing network connections (Aversa, Martino, Rak, & Venticinque, 2010). Agents can work with both internal network processes and web services to provide a total solution to the intrusion prevention. Traditional IDS and IPS are scalable through the use of HID; however, there is considerable duplication of effort as each host on the network perform the same tasks that creates a performance penalty against performing operational tasks that the host is intended to run (Rajeswari & Nithya, 2009). A distributed IDS approach using multiple agents eliminates the duplication of effort of having all hosts on the network running the same application simultaneously; thus, freeing up processor cycles to perform operational tasks. The use of mobile agents also frees up the requirement to ensure that every host is updated with the latest rules and threat signatures in order to remain current. The mobile agent architecture allows for the specialization of agents; therefore, updating the agent population involves introducing the new and improved agents into the system rather than having to replace a reference file on a host or a server (Carver, Hill, Surdu, & Pooch, 2000). The complexity of emerging technologies requires that security intelligently adapt to the new paradigms. A fully scalable autonomous and intelligent mobile agent system that requires no server, no centralized database and that can operate on multiple platforms running different operating systems is self-adapting by its nature. Improving existing security frameworks and methods can provide limited effectiveness as a stopgap measure until a more effective approach can take its place.

A Case for Intelligent Mobile Agent Computer Network Defense
270
REFERENCES
Wilson, S., & Brenner, B. (Performers). (2010). Does IDS have a future in cloud security [Podcast]. Framingham, MA, Retrieved December 16, 2010 from http://a1448.g.akamai.net/7/1448/25138/v0001/compworld.download.akamai. com/25137/cso/podcasts/security_perspectives/CSO_PodcastIDScloud_07_08_10.mp3: CSO Online.
Aberdeen Group. (2010, December). Aberdeen Group Research Brief. Retrieved January 23, 2011, from Secunia Web Site: http://secunia.com/gfx/pdf/Aberdeen_Group_Research_Brief_december_2010.pdf
AV Comparative. (2010, December 6). Proactive/retrospective test (static detection of new/unknown malicious software). Retrieved January 10, 2011, from AV-Comparatives: http://www.av-comparatives.org/images/stories/test/ondret/avc_retr o_nov2010.pdf
Aversa, R., Martino, B. D., Rak, M., & Venticinque, S. (2010, February 18). Cloud agency: A mobile agent based cloud system. Retrieved December 4, 2010, from IEEE Xplore: http://ieeexplore.ieee.org/stamp/stamp.jsp?tp=&arnumber=5447417
Baskerville, P. (2006). Intrusion prevention systems: How do they prevent intrusion? University of Otago. Dunedin, NZ: University of Otago School of Business.
Carver, C. A., Hill, J. M., Surdu, J. R., & Pooch, U. W. (2000, June 29). A methodology for using intelligent agents to provide automated intrusion response. Retrieved September 3, 2010, from Citeseer: http://citeseerx.ist.psu.edu/viewdoc/dow nload;jsessionid=3868D958A0F2CF7A9D2FCC7CB1042CF2?doi=10.1.1.33.2700&rep=rep1&type=pdf
Castelfranchi, C. (1990). Social Power. (Y. Demazeau, & J.-P. Muller, Eds.) Proceedings of the First European Workshop on Modeling Autonomous Agents in Multi-Agent Worlds (MAAMAW-89), pp. 49-62.
Clarke, Z., Clawson, J., & Cordell, M. (2003, November). A brief history of hacking... Retrieved November 15, 2010, from Georga Technical University: http://steel.lcc.gatech.edu/~mcordell/lcc6316/Hacker%20Group%20Project%20FINAL.pdf
Cohen, F. (1984). Computer viruses - theory and experiments. Retrieved October 3, 2010, from University of Michigan: http://www.eecs.umich.edu/~aprakash/eecs588/handouts/cohen-viruses.html
Common Criteria. (2009, July). Common criteria for information technology security evaluation. Retrieved December 5, 2010, from Common Criteria: http://www.commoncriteriaportal.org/cc/
Department of Defense. (1985, December). Department of defense trusted computer system evaluation criteria. Retrieved November 24, 2010, from National Institute of Standards and Technology: http://csrc.nist.gov/publications/histor y/dod85.pdf
Depren, O., Topallar, M., Anarim, E., & Ciliz, M. K. (2005, November). An intelligent intrusion detection system for anomaly and misuse detection in computer networks. Expert Systems with Applications, 29(4), 714-722.
Esfandi, A. (2010, July 11). Efficient anomaly intrusion detection system in adhoc networks by mobile agents. Retrieved December 16, 2010, from IEEE Xplore: http://ieeexplore.ieee.org/stamp/stamp.jsp?tp=&arnumber=5563804
Genesereth, M. R., & Ketchpel, S. P. (1994). Software agents. Communications of the ACM, 37(7), pp. 48-53. Gottfredson, L. S. (1998, Winter). The general intelligence factor. Scientific American Presents, 9(4), 24-29. Guan, Y., Ghorbani, A. A., & Belacel, N. (2003, May). Y-Means: A clustering method for intrusion detection. Retrieved
November 23, 2010, from National Research Council Canada: http://nparc.cisti-icist.nrc-cnrc.gc.ca/npsi/ctrl?action=r tdoc&an=8913828&article=0&lang=en
Hawkins, J., & Blakeslee, S. (2004). On intelligence. New York: St. Martin‘s Griffin. Holloway, E. M., Lamont, G. B., & Peterson, G. L. (2009, May 15). Network security using self organized multi agent swarms.
Retrieved September 28, 2010, from IEEE Xplore Digital Library: http:/ieeexplore.ieee.org/iel5/4910763/4925076/04 925102.pdf
Identity Theft Resource Center. (2010, November 30). 2010 ITRC Breach Report. Retrieved December 4, 2010, from Identity Theft Resource Center: http://www.idtheftcenter.org/ITRC%20Breach%20Report%202010.pdf
Idika, N., & Mathur, A. P. (2007, February 2). A survey of malware detection techniques. Retrieved November 3, 2010, from Penn State University: http://www.google.com/url?sa=t&source=web&cd=1&sqi=2&ved=0CBwQFjAA&url=http%3A %2F%2Fciteseerx.ist.psu.edu%2Fviewdoc%2Fdownload%3Fdoi%3D10.1.1.75.4594%26rep%3Drep1%26type%3Dpdf&rct=j&q=A%20Survey%20of%20Malware%20Detection%20Techniques&ei=9Yj6TIa3KISglAe17
Inella, P. (2001, November 15). The evolution of intrusion detection systems. Retrieved December 5, 2010, from Symantec Connect: http://www.symantec.com/connect/articles/evolution-intrusion-detection-systems
Jansen, W., & Karygiannis, T. (1999). NIST Special Publication 800-19 - Mobile agent security. National Institute of Standards and Technology, Computer Security Division. Gaithersburg, MD: Information Technology Laboratory.
Kurzweil, R. (2001, March 7). The law of accelerating returns. Retrieved December 2, 2010, from Kurzweil Accelerating Intelligence: http://www.kurzweilai.net/the-law-of-accelerating-returns
Lange, D. B., & Oshima, M. (1999, March). Seven good reasons for mobile agents. Communications of the ACM, 42(3), pp. 88-89.
Leavitt, N. (2009, January). Is cloud computing really ready for prime time? Computing now, 42(1), 15-20.

R. O. Seale and K. M. Hargiss IHART - Volume 16 (2011)
271
Legg, S., & Hutter, M. (2007, December 15). Universal intelligence: A definition of machine intelligence. Retrieved November 25, 2010, from Vetta Project: http://www.vetta.org/documents/UniversalIntelligence.pdf
Miller, J. (2007, December 7). Antivirus history. Retrieved September 23, 2010, from Articlesbase.com: http://www.articlesbase.com/information-technology-articles/antivirus-history-277310.html
Nils, N. J. (1998). Artificial intelligence: A new synthesis. San Francisco: Morgan Kaufmann Publishers, Inc. Pikoulas, J., Buchanan, W., Mannion, M., & Triantafyllopoulos, K. (2002). An intelligent agent security intrusion system.
Retrieved September 2, 2010, from IEEEXplore Website: http://ieeexplore.ieee.org/stamp/stamp.jsp?tp=&arnumber =999827
Ponemon Institute. (2010, January). 2009 Annual study: Cost of a data breach. Retrieved October 15, 2010, from PGP: http://www.google.com/url?sa=t&source=web&cd=1&ved=0CBMQFjAA&url=http%3A%2F%2Fwww.encryptionreports.com%2Fdownload%2FPonemon_COB_2009_US.pdf&ei=Q6P6TLnhJYHGlQeU6r2dDA&usg=AFQjCNEy40dZgidKTe5nc0lnOfycKNzavQ
Prince, B. (2010, August 31). Hackers focus on misconfigured networks, survey finds. Retrieved January 22, 2011, from eWeek.com Web Site: http://www.eweek.com/c/a/Security/Hackers-Focus-on-Misconfigured-Networks-Survey-Finds-264850/
Rajeswari, G., & Nithya, B. (2009, October 28). Implementing intrusion detection system for multicore processor. Retrieved December 4, 2010, from IEEE Xplore: http://ieeexplore.ieee.org/stamp/stamp.jsp?tp=&arnumber=5329074
Russell, S., & Norvig, P. (2010). Artificial intelligence: A modern approach (3rd ed.). Upper Saddle River, NJ: Prentice Hall. Secunia. (2010). Secunia half year report 2010. Copenhagen, DK: Secunia. Siponen, M. T. (2003). Information security managment standards: Problems and solutions. 7th Pacific Asia Conference on
Information Systems (pp. 1550-1561). Adelaide, South Australia: Elsevier. Sukwang, O., Kim, H. S., & Hoe, J. C. (2010, July 8). An empirical study of commercial antivirus software effectiveness.
Retrieved November 3, 2010, from IEEE Xplore: http://ieeexplore.ieee.org/stamp/stamp.jsp?tp=&arnumber=5506074 Sulaiman, R., Sharma, D., Ma, W., & Tran, D. (2009, September 24). A multi-agent security structure. Retrieved September 26,
2010, from IEEE Xplore: http://ieeexplore.ieee.org/stamp/stamp.jsp?arnumber=05318910 Symantec. (2010, April). Symantec global internet threat report: Trends for 2009. Retrieved September 26, 2010, from
Symantec: http://eval.symantec.com/mktginfo/enterprise/white_papers/b-whitepaper_internet_security_threat_report_xv_0 4-2010.en-us.pdf
Szor, P. (2005). The art of computer virus research and defense. Upper Saddle Rivder, NJ: Addison-Wesley Professional. Weiss, G. (1999). Multiagent systems: a modern approach to distributed artificial intelligence. Boston: Massachusetts Institute
of Technology. Woolridge, M., & Jennings, N. R. (1995, January). Intelligent agents: Theory and practice. Knowledge Engineering Review(10),
pp. 115-152.

S. A. Idem and K. Silaipillayarputhur IHART - Volume 16 (2011)
272
SPARK ADVANCE EFFECTS IN SPARK IGNITION ENGINES
Stephen A. Idem1 and Karthik Silaipillayarputhur2 1Tennessee Technological University, USA and 2Kordsa Global, USA
ABSTRACT
The objective of this study was to determine optimum spark timing in spark ignition engines in order to maximize the power output. A finite heat release model was considered for comparison with the baseline case of an ideal Otto cycle. Losses occurring due to heat transfer were considered. A relation was established to determine an optimum spark advance as a function of engine speed.
INTRODUCTION
There are many types of internal combustion engines. Heywood [1] and Ferguson and Kirkpatrick [2] classified internal combustion engines by their design, application, working cycle, type of fuel used, method of ignition, method of cooling, etc. Depending on the method of ignition, IC engines are classified as spark ignition (SI) or compression ignition (CI) engines. The present study deals with a parametric study of the effects of spark advance and combustion duration during the combustion process of a SI engine. Spark advance can be defined as timing of the spark discharge before the piston reaches top dead center (TDC) during the compression stroke. One goal of this paper is to study spark timing for a particular engine at a given engine speed. In addition, a parametric study of the change in power at varying engine speeds is performed. The concept of finite heat release model is introduced and is applied to the combustion process in a SI, four-stroke, internal combustion engine. The analysis considers the losses due to heat transfer in the engine. For a given mass of fuel and air inside the combustion chamber, and at a given engine speed, an optimum spark timing is sought that produces maximum power. There are numerous references available in the literature pertaining to internal combustion engines. Rassweiler and Withrow [3] considered the mass fraction burned in various cycles. This fraction of mass burned is represented as a function of the crank angle by the Weibe function. Heywood et al. [4] discussed the determination of Weibe function, and this requires the knowledge of the spark advance and the combustion duration. Combustion duration is the change in crank angle from 1 to 90 percent burned fraction. The duration depends on engine speed, spark timing, equivalence ratio, heat transfer, and the residual mass fraction. It also depends on the combustion chamber geometry and the turbulence intensity of flow. Engine heat transfer is also affected by spark timing and combustion duration. Alkidas [5] studied the behavior of heat flux for different types of engines, with the main operational variable being the engine speed. Alkidas and Myers [6] observed that heat flux is a maximum for stoichiometric mixtures. For either leaner or richer mixture compositions, the heat flux decreases. Borman and Nishiwaki [7] observed that the variations of heat fluxes were considerably different from cycle-to-cycle. This is due to the combustion gases that move in a transient three-dimensional pattern undergoing rapid changes in temperature and pressure. A number of studies were performed for the improvement of calculations of the heat transfer coefficient. Annand and Oguri [8, 9] developed expressions for the determination of a suitable formula for the heat transfer coefficient during the compression stroke. Han et al. [10] discussed the variation in these calculations and developed a different formula for the heat transfer coefficient. Overbye et al. [11] performed a study describing the unsteady heat transfer in engines. Bohac [12] discussed the development of a global model for steady state and transient heat transfer studies in SI engines. In this study it was observed that a large amount of heat is transported through the engine oil.
NOMENCLATURE
a - Weibe efficiency factor Aw - Instantaneous exposed cylinder surface area (m2) AF - Air-feul ratio B - Bore (m) cv - Specific heat at constant volume (kcal/kg-K) FA - Fuel-air ratio hg - Heat transfer coefficient (W/m2-K) k - Thermal conductivity (W/m-K)

S. A. Idem and K. Silaipillayarputhur IHART - Volume 16 (2011)
273
l - Length of the connecting rod (m) M - Molecular weight of the gas (kg/kmol) ma - Mass of air (kg) mf - Mass of fuel (kg) mm - Mass of charge (kg) mr - Mass of residual gases (kg) n - Weibe form factor N - Engine speed (rpm) P - Pressure of the gases in combustion chamber at any instant (kPa) P1 - Initial gas pressure (kPa) Qin - Amount of heat input (kJ) Qout - Amount of heat rejected (kJ) QHV - Heating value of the fuel (kJ/kg-fuel) r - Compression ratio
R - Engine parameter, S
21R
Re - Reynolds number Ru - Universal gas constant for air (kJ/kmol-K) S - Stroke (m) T - Temperature of the gases in the combustion chamber at any instance (K) Tg - Gas temperature (K) Tw - Cylinder wall temperature (K) T1 - Initial gas temperature (K) U - Internal energy of the system (kJ)
pu - Mean engine speed (m/s), SN2u p
V - Volume of the cylinder at any instance (m3) V1 - Initial cylinder volume (m3)
Vd - Displacement volume, SB4
2 (m3)
Vf - Flame velocity (m/s) W - Thermodynamic work done on/ by the engine (kJ) Wnet - Net work produced (kJ) WOtto - Net work done by the ideal Otto cycle (kJ) xb - Fraction of mass burned xr - Residual mass fraction
- Gas specific heat ratio
v
p
c
c
- Crank angle (°)
d - Rapid burning angle (°)
s - Spark advance (°)
- Thermal efficiency
c - Combustion efficiency
- Dynamic viscosity (kg/m-s)
- Density of charge (kg/m3)
GOVERNING EQUATIONS
The Otto cycle models the special case of a SI internal combustion engine whose combustion is so rapid that the piston moves very little during the event. Hence, combustion occurs a constant volume. A four-stroke Otto cycle is composed of four reversible processes, plus an intake and an exhaust portion. Consider Figure 1 depicting the air standard PV and Ts diagrams for the Otto cycle. The four basic processes involved in the operation of the Otto cycle are isentropic compression (1 – 2), constant volume heat addition (2 – 3), isentropic expansion (3 – 4), and constant volume heat rejection (4 – 1). The thermal efficiency is given by

Spark Advance Effects in Spark Ignition Engines
274
in
net
Q
W (1)
where netW is the net work of the heat engine and is given by
outinnet QQW (2)
The quantities inQ and
outQ respectively correspond to the amount of heat input and the amount of heat rejected during the
constant volume processes in Figure 1. From basic thermodynamic relationships, Equation (1) can be readily simplified as
1
1
1
2
2
1 r1V
V1
T
T1 (3)
where ‗ ‘ corresponds to the specific heat ratio and ‗r‘ corresponds to the compression ratio. Therefore, the principal
parameters affecting thermal efficiency of an Otto cycle are compression ratio and specific heat ratio.
Figure 15: P-V and T-s Diagrams for Otto Cycle
Relative to the ideal cycle, an actual cycle produces less work primarily because of the work loss due to finite combustion duration, heat transfer, and valve timing. In addition, the thermodynamic state of the working fluid at the beginning of the compression stroke is a function of residual gas properties and intake conditions. Also, loss of mass occurs during the cycle because of crevice flow and blow by past piston rings. In practice, it is observed that valve closing and opening is not instantaneous and does not occur at the dead center. It is also noted that constant pressure intake and exhaust processes occur only at low engine speeds.
Finite Heat Release Model
In the ideal cycle, the fuel is assumed to burn at a rate that results in constant volume combustion. Actual engine data do not really match this simple model. The finite heat release model predicts the heat addition as a function of crank angle. This model is required in order to assess the effects of spark timing or heat transfer on the engine work and efficiency. The mass fraction burned is given by the Weibe function [2]
n
d
sb aexp1x (4)
This is a curve fit to experimental data where ‗a‘ and ‗n‘ are adjustable parameters. These parameters depend on the engine load and speed to a certain extent. The heat release starts at
s , i.e., 0x b . This curve approaches 1 asymptotically. The
end of combustion is typically defined at bx = 0.9 or 0.99 for SI engines. The quantity ‗
d ‘ refers to the duration of heat release
and is also termed as the rapid burning angle. Differentiation of Equation (4) results in the heat release rate, as a function of crank angle, i.e.,
1n
d
s
b
d
inb
in x1Q
nad
dxQ
d
dQ
(5)
The mass of charge is the sum of masses of air, fuel and the residual gases, i.e.,
rfam mmmm (6)

S. A. Idem and K. Silaipillayarputhur IHART - Volume 16 (2011)
275
Dividing throughout by mm yields
r
m
f
m
a
m
m xm
m
m
m
m
m (7)
where the mass of air is calculated using the conditions at the beginning of the compression stroke. The term rx corresponds
to residual mass fraction. Solving Equation (7) further yields
r
amx1
FA1mm
(8)
where FA corresponds to the fuel air ratio. The total cycle heat addition is given as
AF1
Qx1mQ cHVr
min
(9)
where HVQ is the heating value of the fuel,
c is the combustion efficiency, and AF is the air fuel ratio.
The finite heat release model assumes that the heat release occurs during the compression and the expansion strokes. The heat release equation is incorporated into the differential energy equation to obtain the model. The differential energy equation for a small crank angle change ‗ d ‘ is
dUWQ (10)
where:
PdVW (11)
and:
dTCmdU vm (12)
Solving for pressure P yields
d
dQ
V
1
d
dV
V
P
d
dP (13)
This first order differential equation can be numerically integrated to obtain pressure as a function of the crank angle. The cylinder volume is given as
2
122dd sinRcos1R
2
V
1r
VV (14)
where ‗R‘ is the engine design parameter and ‗dV ‘ is the displacement volume. Upon differentiation
2
122d sinRcos1sin
2
V
d
dV (15)
The differential energy equation, Equation (13), is numerically integrated, using the forth order Runge-Kutta integration presented by Jaluria [13], in order to obtain pressure. This integration starts at bottom dead center with initial conditions
1P , 1V ,
1T , and proceeds through the top dead center and back to the bottom dead center. After calculating pressure, total work is
obtained by integrating Equation (11) over the compression and expansion strokes, using the trapezoidal rule [13]. The charge temperature is calculated as a function of crank angle using the ideal gas law.
umRm
PVMT (16)
where the charge mass is calculated using specified conditions at the start of the compression stroke.

Spark Advance Effects in Spark Ignition Engines
276
Heat Transfer Modeling
The finite heat release model discussed in the previous section is modified in order to include the differential heat transfer to the cylinder walls. This requires knowledge of the instantaneous spatially averaged cylinder heat transfer coefficient and the engine speed. Using the cylinder head thermocouple measurements of instantaneous heat flux, the Annand correlation [8] was developed. It uses mean piston speed as a constant characteristic velocity, and the cylinder diameter as a constant characteristic length. Properties such as the thermal conductivity and viscosity that are used in the correlation are the zone averaged instantaneous values. Known constant charge mass and instantaneous cylinder volumes are used for determination of the instantaneous gas density. The Annand correlation is given as
7.0
1ReaNu (17)
where the constant a1 is 0.49 for a four stroke engine. The Reynolds number is given in terms of mean piston speed and cylinder bore and is expressed as
BuRe
p (18)
The density of the charge mass is a function of crank angle, such that
TR
MP
u
(19)
The heat transfer coefficient as a function of crank angle is given as
B
kRe49.0h
7.0
g
(20)
The addition of wall heat transfer modifies Equation (13) as follows
d
dV
V
P
d
dQ
d
dxQ
V
1
d
dp wb
in (21)
where d
dQw is the heat transfer rate at any crank angle ‗ ‘, and at an engine speed ‗N‘. Thus:
N
TTAh
d
dQ wgwgw
(22)
The instantaneous exposed cylinder surface area is given by
B
V4B
2A 2
w
(23)
These equations are used for the parametric study of the present model.
OTTO CYCLE ANALYSIS
In order to model the effects of spark timing, combustion duration, and engine speed on engine performance, it was first necessary to define baseline engine geometry and operating conditions. The baseline engine was subjected to an Otto cycle analysis. The geometry chosen for this study is presented in Table 1. The ratio of bore to stroke for the baseline engine was unity, hence this is termed a square engine. The ratio of connecting rod length to crank radius usually has values of 3 to 4 for small engines. The values of the compression ratio can be as high as 10 for the largest displacement engines. The compression ratio selected for the baseline case is typical of spark ignition engines.
Table 1: Baseline engine geometry
B S Vd r R
(m) (m) (m3)
0.1 0.1 7.85*10-3 9 3

S. A. Idem and K. Silaipillayarputhur IHART - Volume 16 (2011)
277
The combustion parameters assigned to the baseline engine are presented in Table 2. The fuel heating value is representative of isooctane. Because of the variability of the gasoline composition regionally and seasonally, isooctane is often used to model SI engine performance [2]. Typical engines can operate over a narrow range of air-fuel ratios. Generally, slightly rich combustion is employed at idle or wide-open throttle, and slightly lean combustion is used at highway cruising speeds. The baseline case assumed complete combustion, i.e., presumably no fuel chemical energy was expelled with the exhaust products. The baseline case further assumed that there was no mixing of exhaust residual gases with the fresh charge to begin the new cycle.
Table 2: Baseline engine combustion parameters
QHV Φ AF ratio ηc xr
(kJ/kg)
43,000 1 14.6 1 0
The operating conditions attributed to the baseline engine are presented in Table 3. Standard temperature and pressure is assumed at the start of the compression process. An implication is that the engine was operated at wide-open throttle, such that the pressure loss across the throttle was negligible. Intake manifold heating was taken into account only to the extent that
1T is a variable. Moreover, pressure losses across the intake and exhaust valves were neglected. Valve pressure loss has a
significant impact on the engine performance [1, 2]. These effects were not considered in this study. Engines are designed to operate over a wide range of engine speeds. Most SI engines idle at 700 to 1200 rpm. Typically, the engine speed is approximately 2000 rpm under highway cruising conditions. Hence, the engine speed selected for the baseline study would be that for a moderate load, i.e., climbing a hill or accelerating.
Table 3: Baseline engine operating conditions
P1 T1 Tw N
(kPa) (K) (K) (rpm)
101 298 14.6 2500
Table 4 gives a brief overview of temperatures and pressures calculated assuming an Otto cycle, and applied to the baseline case. A constant specific heat ratio 35.1 was assumed in the analysis. The Otto cycle performance for the baseline case
was analyzed, and is presented in Table 5. For the operating conditions specified for the baseline engine, the net work and the power are evaluated. For a typical SI engine, these values are higher than actual measured values. For example, the fuel conversion efficiency of a SI engine is generally in the range of 25 to 35 percent near cruising speeds.
Table 4: Otto cycle Temperatures and Pressures
P2 T2 P3 T3 P4 T4
(kPa) (K) (kPa) (K) (kPa) (K)
1961.3 642.9 13671.1 4481.5 704 2077
Table 5: Otto cycle performance
Wnet W η
(kJ) (kW)
1.65 34.38 0.537
EFFECTS OF SPARK ADVANCE
The effects of spark advance and combustion duration were evaluated for the baseline engine outlined in the previous section. Equation 21 was integrated numerically by the fourth-order Runge-Kutta method, using a crank angle interval of one degree.

Spark Advance Effects in Spark Ignition Engines
278
The thermal properties of the charge were evaluated using air data, at an average cycle temperature of 1400K. This temperature was chosen based on [2], wherein similar geometry engine was analyzed, at an equivalence ratio of unity. The property data presented in Table 6 were obtained from Incropera and Dewitt [14]. The charge density was calculated at each point in the cycle by the ideal gas law, i.e., Equation 19. The Weibe factor and Weibe efficiency factor for the baseline case (selected as 3 and 5, respectively) are typical of SI engines [2].
Table 6: Thermal properties
k µ cv γ
(W/m-K) (N-s/m2) (kJ/kg-K) (cp/cv)
0.091 0.000053 0.718 1.35
The following is a discussion of the various parametric studies performed in this study. Initially, the effect of spark advance on various parameters, at a constant engine speed of 2500 rpm, is presented. Then the effect of varying engine speeds is discussed. Finally, an empirical relation is established to approximate the duration of combustion as a function of engine speed. The power of the engine is estimated and analyzed for constant as well as varying spark timing.
Constant Engine Speed
Cylinder pressure behavior is discussed with respect to Figures 2 and 3. In every case, the instantaneous cylinder pressure is calculated by numerical integration. This pressure is nondimensionalized by the prescribed pressure at the beginning of the compression stroke. The engine speed is kept constant at 2500 rpm. Figures 2 and 3 represent the variations in the pressure of the cylinder as the spark advance is varied relative to top dead center. The duration of combustion is also varied. It is observed in these graphs that as the combustion duration is increased and spark timing is kept constant, the peak cylinder pressure occurs later in the expansion stroke. The magnitude of these pressures is also thereby reduced. For a given combustion duration, as spark timing is advanced, peak cylinder pressure increases. Moreover, progressively greater positive pressure is observed during the compression stroke, i.e., before top dead center. Positive pressure during the compression stroke implies that more work is required to compress the charge. This results in a decrease in the overall (net) work. Typically, in order to maximize work, the peak pressure needs to be centered at about 10 to 20 degrees after the top dead center. Corresponding temperature profiles are shown in Figures 4 and 5. In these graphs, it is observed that for fixed spark timing, as the duration of the combustion process increases, the peak temperatures are significantly reduced. In addition, the attainment of the peak is delayed. For a given combustion duration, as spark is advanced before top dead center, the magnitude of the peak temperature increases. This likewise has the effect of increasing temperature (and pressure) on compression stroke, thereby increasing the work required to compress the charge.
Figure 2: Pressure vs. crank angle for θs = 0°
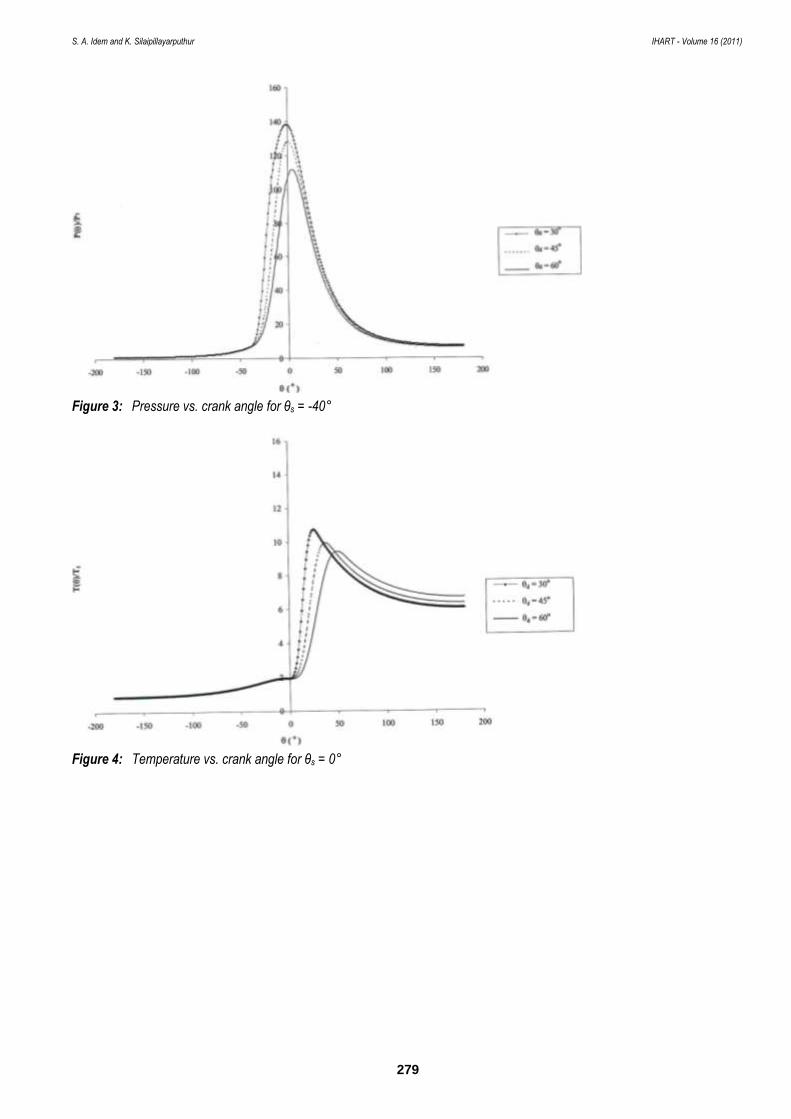
S. A. Idem and K. Silaipillayarputhur IHART - Volume 16 (2011)
279
Figure 3: Pressure vs. crank angle for θs = -40°
Figure 4: Temperature vs. crank angle for θs = 0°
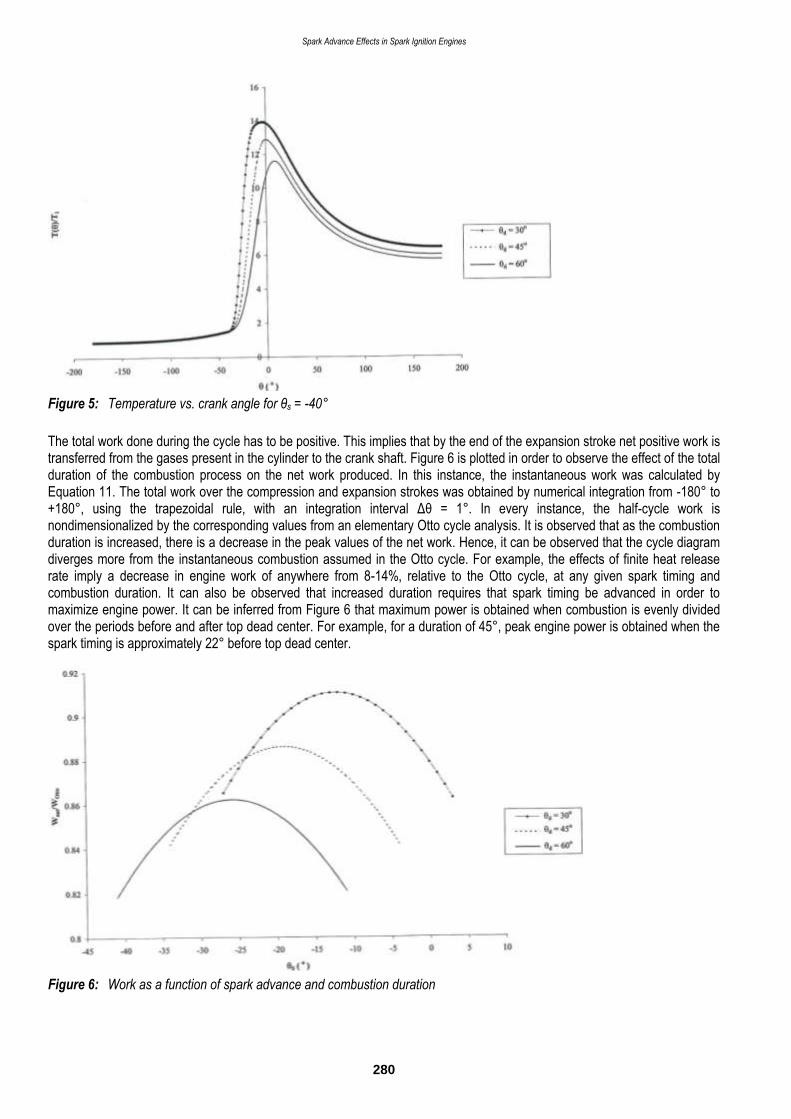
Spark Advance Effects in Spark Ignition Engines
280
Figure 5: Temperature vs. crank angle for θs = -40°
The total work done during the cycle has to be positive. This implies that by the end of the expansion stroke net positive work is transferred from the gases present in the cylinder to the crank shaft. Figure 6 is plotted in order to observe the effect of the total duration of the combustion process on the net work produced. In this instance, the instantaneous work was calculated by Equation 11. The total work over the compression and expansion strokes was obtained by numerical integration from -180° to +180°, using the trapezoidal rule, with an integration interval Δθ = 1°. In every instance, the half-cycle work is nondimensionalized by the corresponding values from an elementary Otto cycle analysis. It is observed that as the combustion duration is increased, there is a decrease in the peak values of the net work. Hence, it can be observed that the cycle diagram diverges more from the instantaneous combustion assumed in the Otto cycle. For example, the effects of finite heat release rate imply a decrease in engine work of anywhere from 8-14%, relative to the Otto cycle, at any given spark timing and combustion duration. It can also be observed that increased duration requires that spark timing be advanced in order to maximize engine power. It can be inferred from Figure 6 that maximum power is obtained when combustion is evenly divided over the periods before and after top dead center. For example, for a duration of 45°, peak engine power is obtained when the spark timing is approximately 22° before top dead center.
Figure 6: Work as a function of spark advance and combustion duration
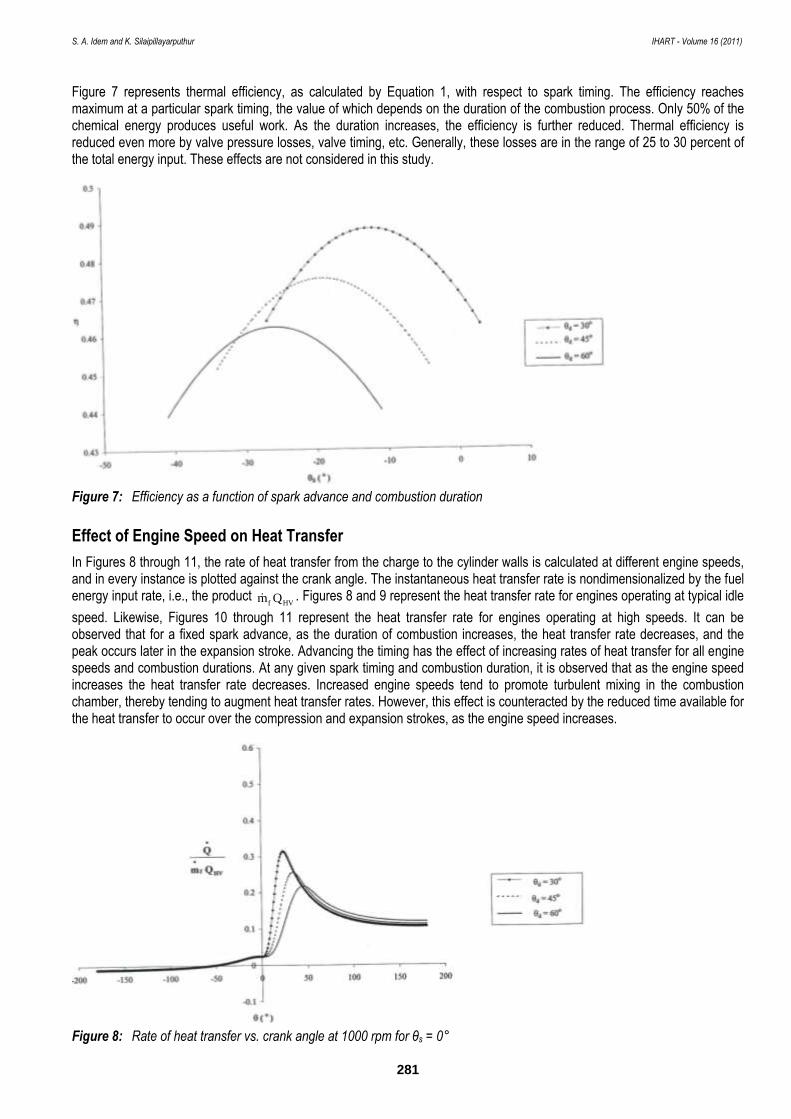
S. A. Idem and K. Silaipillayarputhur IHART - Volume 16 (2011)
281
Figure 7 represents thermal efficiency, as calculated by Equation 1, with respect to spark timing. The efficiency reaches maximum at a particular spark timing, the value of which depends on the duration of the combustion process. Only 50% of the chemical energy produces useful work. As the duration increases, the efficiency is further reduced. Thermal efficiency is reduced even more by valve pressure losses, valve timing, etc. Generally, these losses are in the range of 25 to 30 percent of the total energy input. These effects are not considered in this study.
Figure 7: Efficiency as a function of spark advance and combustion duration
Effect of Engine Speed on Heat Transfer
In Figures 8 through 11, the rate of heat transfer from the charge to the cylinder walls is calculated at different engine speeds, and in every instance is plotted against the crank angle. The instantaneous heat transfer rate is nondimensionalized by the fuel energy input rate, i.e., the product
HVf Qm . Figures 8 and 9 represent the heat transfer rate for engines operating at typical idle
speed. Likewise, Figures 10 through 11 represent the heat transfer rate for engines operating at high speeds. It can be observed that for a fixed spark advance, as the duration of combustion increases, the heat transfer rate decreases, and the peak occurs later in the expansion stroke. Advancing the timing has the effect of increasing rates of heat transfer for all engine speeds and combustion durations. At any given spark timing and combustion duration, it is observed that as the engine speed increases the heat transfer rate decreases. Increased engine speeds tend to promote turbulent mixing in the combustion chamber, thereby tending to augment heat transfer rates. However, this effect is counteracted by the reduced time available for the heat transfer to occur over the compression and expansion strokes, as the engine speed increases.
Figure 8: Rate of heat transfer vs. crank angle at 1000 rpm for θs = 0°

Spark Advance Effects in Spark Ignition Engines
282
Figure 9: Rate of heat transfer vs. crank angle at 1000 rpm for θs = -40°
Figure 10: Rate of heat transfer vs. crank angle at 3000 rpm for θs = 0°
Figure 11: Rate of heat transfer vs. crank angle at 3000 rpm for θs = -40°

S. A. Idem and K. Silaipillayarputhur IHART - Volume 16 (2011)
283
Effect on Engine Speed on Combustion Duration
The previous analyses have implicitly assumed that spark timing, engine speed, and combustion duration can be varied independently. Combustion duration is a function of many variables, such as port design, the method of fuel addition, the equivalence ratio, etc. However, the most important parameter that affects combustion duration in a particular engine is engine speed, since increased speed promotes turbulent mixing, thereby augmenting flame speed. In order to develop a relation between the spark timing, engine speed, and combustion duration, experimental data from Taylor [15] was used. In addition, a similar geometry engine was assumed, i.e., an engine with the same bore, a flat piston crown, and central location of the spark plug. Curve fitting these data gives a relationship between the flame velocity and the engine speed, i.e.,
27
f N10717.3N0071.0V (24)
The rapid burning angle (which is roughly equivalent to the combustion duration) is obtained from the flame velocity using the following relation
Nt360d (25)
where 't' is the time required for flame propagation, i.e.,
fV
2Bt (26)
The previous equation assumes the spark plug is situated at the centerline axis of the cylinder. Figure 12 is the graphical representation of Equation 25. It can be observed that the duration of the combustion process increases nonlinearly with speed. Starting at an idle speed of 1000 rpm, it can be observed that the combustion duration is approximately 30°. At 6000 rpm, the combustion duration increases to 48°.
Figure 12: Combustion duration vs. engine speed
The baseline engine outlined was analyzed by the finite heat release model. Heat transfer from the charge to the coolant was accounted for in the analysis. It was assumed that the flame speed variation with the engine speed was described by Equation 24. Two cases were considered. In one instance, a constant spark advance of 15° was assumed for all engine speeds. In the
other, spark timing was varied as a function of engine speed, wherein the spark advance was chosen such that ds
2
1 .
Each case was compared to the baseline engine performance predicted by an Otto cycle analysis. Figure 13 represents the effect of engine speed, spark timing, and combustion duration on the net power produced. The power produced by an ideal Otto cycle increases linearly with increasing engine speed. This is because the Otto cycle analysis does not consider losses of any nature, for example, those due to heat transfer or finite combustion rate. When finite combustion rates are considered, there is a reduction in the power produced, relative to the Otto cycle. When the spark advance is fixed at
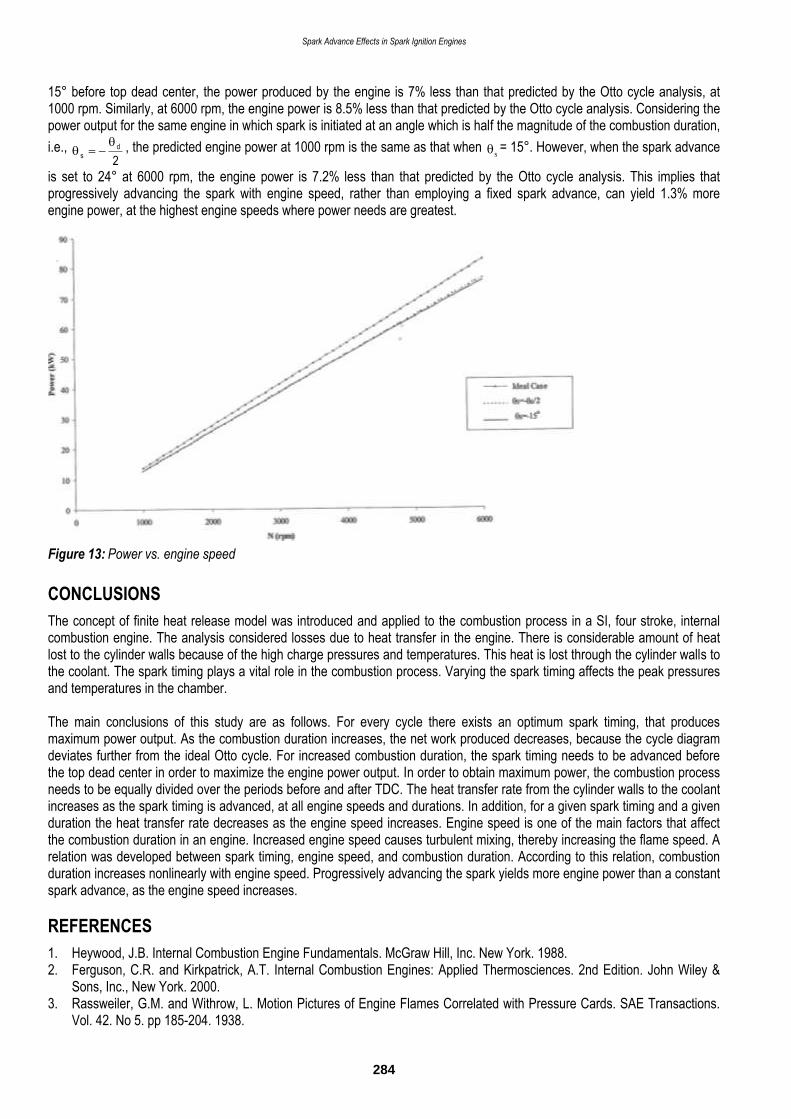
Spark Advance Effects in Spark Ignition Engines
284
15° before top dead center, the power produced by the engine is 7% less than that predicted by the Otto cycle analysis, at 1000 rpm. Similarly, at 6000 rpm, the engine power is 8.5% less than that predicted by the Otto cycle analysis. Considering the power output for the same engine in which spark is initiated at an angle which is half the magnitude of the combustion duration,
i.e., 2
d
s
, the predicted engine power at 1000 rpm is the same as that when
s = 15°. However, when the spark advance
is set to 24° at 6000 rpm, the engine power is 7.2% less than that predicted by the Otto cycle analysis. This implies that progressively advancing the spark with engine speed, rather than employing a fixed spark advance, can yield 1.3% more engine power, at the highest engine speeds where power needs are greatest.
Figure 13: Power vs. engine speed
CONCLUSIONS
The concept of finite heat release model was introduced and applied to the combustion process in a SI, four stroke, internal combustion engine. The analysis considered losses due to heat transfer in the engine. There is considerable amount of heat lost to the cylinder walls because of the high charge pressures and temperatures. This heat is lost through the cylinder walls to the coolant. The spark timing plays a vital role in the combustion process. Varying the spark timing affects the peak pressures and temperatures in the chamber. The main conclusions of this study are as follows. For every cycle there exists an optimum spark timing, that produces maximum power output. As the combustion duration increases, the net work produced decreases, because the cycle diagram deviates further from the ideal Otto cycle. For increased combustion duration, the spark timing needs to be advanced before the top dead center in order to maximize the engine power output. In order to obtain maximum power, the combustion process needs to be equally divided over the periods before and after TDC. The heat transfer rate from the cylinder walls to the coolant increases as the spark timing is advanced, at all engine speeds and durations. In addition, for a given spark timing and a given duration the heat transfer rate decreases as the engine speed increases. Engine speed is one of the main factors that affect the combustion duration in an engine. Increased engine speed causes turbulent mixing, thereby increasing the flame speed. A relation was developed between spark timing, engine speed, and combustion duration. According to this relation, combustion duration increases nonlinearly with engine speed. Progressively advancing the spark yields more engine power than a constant spark advance, as the engine speed increases.
REFERENCES
1. Heywood, J.B. Internal Combustion Engine Fundamentals. McGraw Hill, Inc. New York. 1988. 2. Ferguson, C.R. and Kirkpatrick, A.T. Internal Combustion Engines: Applied Thermosciences. 2nd Edition. John Wiley &
Sons, Inc., New York. 2000. 3. Rassweiler, G.M. and Withrow, L. Motion Pictures of Engine Flames Correlated with Pressure Cards. SAE Transactions.
Vol. 42. No 5. pp 185-204. 1938.

S. A. Idem and K. Silaipillayarputhur IHART - Volume 16 (2011)
285
4. Heywood, J. B., Higgins, J. M., Watts, P. A., and Tabaczynski, R. J. Development and Use of a Cycle Simulation to Predict SI Engine Efficiency and NOx Emissions. SAE Paper 790291. 1979.
5. Alkidas, A. C. Heat Transfer Characteristics of a Spark Ignition Engine. ASME Journal of Heat Transfer. Vol. 102. No 2. pp 189-193. 1979.
6. Alkidas, A. C., and Myers, J. P. Transient Heat-Flux Measurements in the Combustion Chamber of a Spark-Ignition Engine. Transactions of the ASME Journal of Heat Transfer. Vol. 104. pp. 62-67. 1982.
7. Borman, G., and Nishiwaki, K. A. Review of Internal Combustion Engine Heat Transfer. Progress in Energy and Combustion Science. Vol. 13. pp 1-46. 1983.
8. Annand, W. J. D. Heat Transfer In the Cylinders of Reciprocating Internal Combustion Engines. Proc. Inst. Mech. Engrs. Vol 177. No 36. pp 973-990. 1963.
9. Oguri, T. On the Coefficient of Heat Transfer Between Gases and Cylinder Walls of the Spark Ignition Engine. Bulletin of the JSME. Vol. 3. No 11. pp363-369. 1960.
10. Han, S., Chung, Y. K., and Lee, S. Emprical Formula for Instantaneous Heat Transfer Coefficient in Spark Ignition Engine. SAE paper 972995. 1997.
11. Overbye, V. D., Bennethum,J. E., Uyehara, O. A., and Myers, P. S. Unsteady Heat Transfer in Engines. SAE Transactions. Vol. 69. pp 461-494. 1961.
12. Bohac, S. V., Baker. D. M., and Assanis, D. N. A. Global Model for Steady State and Transient S. I. Engine Heat Transfer Studies. SAE paper 960073. 1996.
13. Jaluria, Y. Computer Methods for Engineering. Taylor & Francis Publishers, Washington, DC. 1996. 14. Incropera, F.P., Dewitt, D.P., Bergman, T.L., and Lavine, A.S. Fundamentals of Heat and Mass Transfer, 6th Edition, John
Wiley & Sons, Inc., New York. 2006. 15. Charles Fayette Taylor. The Internal Combustion Engine in Theory and Practice: Combustion, Fuels, Materials, Design. Vol. 2.
The MIT Press, Boston, MA. 1985.
B. A. Sims IHART - Volume 16 (2011)
286
AN ANTHROPOMORPHIC PERSPECTIVE IN HOMOLOGY THEORY
Brett A. Sims Borough of Manhattan Community College, USA
ABSTRACT
In this work we seek to mathematically describe philosophical kinship among people based on their use of a common set of principles with which to define ―concepts‖ that are perceived. We use definitions and theorems found in homology theory to develop the notion of ―sameness‖ among people. Definitions and propositions on the simplex, simplicial complex, map, and simplicial map are used to show that people that use the same set of ―principles‖ to formulate definitions or a ―way of understanding‖ are homotopic with one another, in the sense that any one person‘s ―way of understanding‖ can be ―cultivated‖ (continuously transformed) into any other person‘s ―way‖, along a given period of time. Further, we discuss the idea of a hierarchal system, for the class of ―homotopic‖ people, in terms of rank where a person‘s rank depends on the number of principles that they use to develop a ―definition‖ or ―understanding‖ of a thing. Also the notion of ―contiguity‖ among people is developed based on the way they ―manifest‖ philosophies. Keywords: Simplicial Complex, Simplicial Map, Homotopy, Philosophy.
INTRODUCTION
Homology theory suggests a theory of ―sameness‖ and can be used to study a level of sameness between objects. The objects can be physical, ideas, or viewpoints, etc. The study of humans, from any point of view presents very complicated problems, many of which begin with the problem of defining and measuring human qualities. There are structures and notions in homology theory that are explored in this paper for the purpose of developing a sense of ―sameness‖, approximation, or contiguity among humans. In the past decade, researchers have used group theory, simplicial theory, and graph theoretic applications to analyze and describe ideas of kinship among certain clans of people [1][2][3]. In Alain Gottcheiner‘s work, 2000, the partitioning of a clan into classes is replaced by a set of ―types‖ where group actions are on types [4]. Group affiliation is determined by one‘s gender and the ―type‖ of one‘s parent. The group elements are permutations mapping a person‘s type onto the type of some descendent of that person, male or female. For cyclic and non-cyclic groups Gottcheiner determined which marriages among clan members are permissible. In 2002, referencing the work of R. Atkins, Jacky Legrand employed Q-analysis to investigate q-connectedness among sets of simplexes, where simplexes can represent people, concepts, or concrete entities [5][6]. He also suggests that features of the simplexes can represent relationships among people and that q-connectivity can be computed by counting shared features. Legrand examined connectivity by means of q-nearness graphs, where a finite sequence of q-near simplexes defines a q-connectivity sequence that gives a sense of ―nearness‖ among simplexes (people). In this work we seek to mathematically describe a philosophical kinship among people based on their use of a common set of principles with which to define ―concepts‖ that are perceived. Definitions and propositions used in this work were found in [7]. The realistic representation of a set of ―concepts‖ could be difficult when defining continuity of functions on such spaces. Here, we confine our concept space
X to be a discrete topological space where the singleton sets, containing a concept, are the
open sets in
X . Further, we assume that a person, represented by a function
f i , must use some set of principles, complex
K , with which to define a concept
xX . Where
f i(x) is
f i 's definition of concept
x , we require that to each definition
that a person may have, there is a unique concept. Thus a person‘s concept-definition match, here, is limited to that of a one-to-one relation. In the real setting, a concept may be defined using a set of qualitative principles with or without regard to the significance of any one principle. Subjectivity can arise where a person may, for example, consider one principle to be more (less) significant than another principle with respect to the concept being defined. In this work we assume that ―significance‖ can be quantified as a proportion in the closed interval [0,1]. Further, while a definition is hardly ever described in context of linearity or non-
linearity with respect to its component principles, we model
f i 's definition of concept
x ,
f i(x) , to be a linear combination of
some set of principles. Now, the coefficient of each principle can be that principles‘ significance, assigned by the person
f i .
The set that
f i maps a concept into is a space or subspace of definitions, simplex
s, spanned by a set of principles. The
philosophical nearness or lack thereof of two or more individuals,
f1,
f2 , or
f3 , is here determined by whether or not their

B. A. Sims IHART - Volume 16 (2011)
287
image of a concept lies in a common closed or open simplex in the structure of a complex. By representing individuals as simplicial maps, nearness is also determined with respect to whether or not their image of a simplex is a face of some common simplex.
THE SET OF PRINCIPLES AND ITS SYSTEM
We can define a set of principles (pillars) of which a whole system of activity is based on:
P{a0,a1,a2,...,aN}, where
each
a j is a principle. A system that is ―based on‖ (spanned by) the set of principles P can be considered as a simplex.
Each point (idea) of the simplex is a linear combination of the set P of principles. That is, if
b is a point or element of the simplex then
NNaaaab 221100, (1)
or
b ja j
j0
N
.
In common language the sum, Equation (1), is a ―recipe‖ for the element b where the
a j 's are the ―ingredients‖ and the
j ' s give the amount of each ingredient, and
0 j N . Also, the operation, +, here means the “mixture” of principles or
ideas. More specifically,
j represents the amount of significance that a principle
a j is given in the recipe for the idea or
element b - assuming that a numerical measure can be given to the significance of a principle. Further, we can give the
significance in terms of a proportion between 0 and 1 so that 10 j , where 10
N
j
j . We call the set
{ j} j0
N , the
set of significances.
The simplex is a system that consists of points (elements) b spanned by the set P . In set notation we can write the simplex
(system) as
}1,10,|{0
jj
N
j
jjN abbs .
In a shorter form we prefer to represent the simplex by ),...,,,( 210 NN aaaas .
A REFINEMENT OF THE SET OF PRINCIPLES
If we dissect, ―break-down‖, the simplex into a more ―refined‖ set of principles, we can create a new set of principles,
P , with ―more‖ principles in it than set P. We call
P the derived set of P. Let us represent the derived set by
P {a j0,a j1,a j2,...,a j K}, where some or all of the
a jm 's ,
0mK, can be thought of as that derived from
considering new principles from among points spanned by principles
a j from the set P. Note that NK since P has
―more‖ principles in it than P .
We now write the simplex (system) based on the set P as ),...,,,( 210 jKjjjKN aaaass , called a ―dissection‖ of Ns .
Each point of Ns can be written as jKjKjjjjjj aaaab 221100 or
K
m
jmjmab0
. For the refinement
Ns we also require that the set of ―significances‖ have the property 10 jm , and 10
K
m
jm .
GEOMETRIC EXAMPLES OF A SIMPLEX
A geometric presentation of the simplex, here, is meant to strengthen our notion of the simplex.

An Anthropomorphic Perspective in Homology Theory
288
The 1-Simplex
Figure 1: A One-dimensional simplex (1-simplex): The interior of the line segment with end points )0,1(0 a and
)1,0(1 a .
The one-dimensional simplex or 1- simplex in Figure 1 is the interior of a line segment spanned by the set },{ 10 aa , where the
end points are )0,1(0 a and )1,0(1 a . Every point b on the line segment, except for the end points, can be written in
terms of a linear combination of the end points:
1100 aab , where 110 and 1,0 10 .
The set of all points on the line segment, except for the end points, is called the interior of the line segment. The 1-simplex is defined to be the interior of the line segment:
}1,1,0,|{ 101011001 andaabbs .
We call the set of end points of the line segment the boundary of the 1-simplex given by },{ 101 aas . In terms of the
constraints on the sj ' we can also represent the boundary by }|{ 11001 aabbs , where some of the sj ' are
zero.
The entire line segment- the closure of the 1-simplex, is written 1s . The closure is given by the union of the interior with the
boundary, 111 sss . We may represent the closure of in terms of the constraints on the sj ' :
s 1{b|b0a01a1,00,11,and011}.
The 2-Simplex
Figure 2: A Two-dimensional regular simplex (2-simplex): The interior of a triangle with vertices at
a0 (1,0,0),
a1(0,1,0) , and
a2 (0,0,1).

B. A. Sims IHART - Volume 16 (2011)
289
The two-dimensional regular simplex or 2- simplex in Figure 2 is the interior of an equilateral triangle spanned by the set
},,{ 210 aaa , where the vertices are
a0 (1,0,0), )0,1,0(1 a , and )1,0,0(2 a . Every point b in the 2- simplex,
except for the vertices and the edges E1, E2, and E3, can be written in terms of a linear combination of the vertices:
221100 aaab , where 1210 and 1,,0 210 .
Similar to the 1-simplex, the 2-simplex can be written as:
}1,10,|{ 2102211002 andaaabbs j .
Faces of The 2-Simplex
The boundary of the 2-simplex, the triangle edges and vertices, can be written as:
}1,0,|{ 2102211002 andsomeaaabbs j .
Observe that the dimension of any edge is one less than the dimension of the 2-simplex (triangle interior). The dimension of an edge is one. Further, the dimension of any vertex is one less than the edge (line segment). The dimension of a vertex (point) is zero.
We call any edge of the triangle the face of the 2-simplex. E1, E2, and E3 are faces of 2s and we write 21 sE , 22 sE ,
and 23 sE . Like wise, the vertices are faces of an edge, written, 11 Ea , 12 Ea , 22 Ea , 23 Ea , 33 Ea ,
31 Ea . The closure of 2s is the union of its boundary with its interior, written 222 sss .
THE SIMPLICIAL COMPLEX
We can define a set of simplexes B where the face of each simplex is also an element of B and, further, all simplexes in B are distinct from each other. Formally, B is a simplicial complex if
for every simplex Bsi
p , if i
pss then Bs and
m
p
i
p ss for mi ,
where the superscript i is the index and p is the dimension of the ith simplex. We define the polyhedron of the complex B to
be the union of the simplexes and their faces, written, B . We can write
B sp
i
i1
L
U , for all Bsi
p .
A SENSE OF “SAMENESS”
Definition 1. Let
f1, f2 :XK be mappings where X is a topological space and K is a complex. If for every point
Xx there exists a simplex Kxs )( such that )()(1 xsxf and )(2 xsf we define 1f and 2f to be K -
approximate.
Anthropomorphic view of Definition 1. Consider the topological space X to be a set of concepts (points) and let K be a
set of definitions for the concepts (a system of thought). Define 1f and 2f to be two people that give two different ―ways of
understanding‖ the concept Xx , written )(1 xf and )(2 xf . Let the simplex Kxs )( be the system spanned by the
set of principles },...,,,{ 210 NaaaaP .
Now 1f and 2f are K - approximate so that )()(1 xsxf and )(2 xsf . Thus, 1f ‘s and 2f ‘s ―way of understanding
or defining‖ the concept x is some ―mixture‖ (linear combination) of the principles in set P , written
N
j
jjaxf0
1 )( and

An Anthropomorphic Perspective in Homology Theory
290
f2(x) ja j
j0
N
, where the j ‘s and j ‘s is the ―significance‖ that the persons 1f and 2f , respectively, give to each
principle when giving their ―understanding‖ of the concept x . Also we require that
0 j , j 1 ,
j 1 , and
1 j so that the significance represents some proportion of a particular principle used in the person‘s formulation of
their ―understanding or definition‖ of x . For example, the person 1f may give a proportion 4 to the principle 4a according
to how significant 4a is determined to be, as an ―ingredient‖ in the formulation of the definition of the concept x , while the
person 2f may give a proportion 4 to the principle 4a , where
4 and 4 are not necessarily equal.
In summary, if two people use the same set of principles from which to establish a definition, an understanding, or point of view then the two people can be considered to be approximate to each other in the sense of understanding and point of view.
Definition 2. Let the sets X and Y be topological spaces and ]1,0[I be the closed unit interval. A Homotopy is a
continues deformation map YIXtxF :),( that continuously deforms a map YXf :1 into a map YXf :2
and is defined by
)()()1(),( 21 xtfxfttxF where )()0,( 1 xfxF and )()1,( 2 xfxF .
Definition 3. Two mappings YXff :, 21 are said to be homotopic if there exists a homotopy YIXtxF :),(
such that )()0,( 1 xfxF and )()1,( 2 xfxF . If 1f is homotopic to 2f we write
f1 f2.
Proposition 1. If 1f and 2f , are K - approximate then 1f and 2f are homotopic.
Proof: (i) Let the maps KXff :, 21 be K - approximate and define KIXtxF :),( such that
)()()1(),( 21 xtfxfttxF where )()0,( 1 xfxF and )()1,( 2 xfxF . Now 1f and 2f are both continuous
functions on X and t1 and t are continuous on the interval I . Now ),( txF is the sum of the products of continuous
functions and is therefore continuous.
(ii) Next, for every point IXtx ),( and recall that there exists a simplex Ks dependent on x such that
f1(x) and
f2(x) are each unique linear combinations of the vertices }{ ja of s , let
N
j
jjaxf0
1 )( and
N
j
jjaxf0
2 )(
where 1,0 jj , 10
N
j
j , and 10
N
j
j .
Now observe that
)()()1(),( 21 xtfxfttxF
N
j
j
N
j
j tt00
)1(
j
N
j
jj att ))1((0
.
Since 1,0 jj , 10 t , 10
N
j
j , and 10
N
j
j , then

B. A. Sims IHART - Volume 16 (2011)
291
1)1(0 jj tt and
1 ((1 t) j t j
j0
N
) ,
The coefficients of the vertices are between 0 and 1 and the sum of the coefficients is 1. Thus for all IXtx ),( we have
that ),( txF is a linear combination of the vertices of s , i.e., stxF ),( .
By (i) and (ii) ),( txF is a suitable homotopy so that 1f and 2f are homotopic and we write 21 ff .
Anthropomorphic View of Proposition 1. Again we define 1f and 2f to be two people where the values )(1 xf and
f2(x) are defined to be their definitions of the concept x . If each of the two people establish their own definition of the same
concept based on the same set of principles (K- approximate) then Proposition 1 concludes that the two people are homotopic.
We can define a homotopy, along some period of time 10 t , as the continuous transformation (learning or training) of
the person 1f ‗s ―view‖ or ―understanding‖ into the ―view‖ or ―understanding‖ of the person 2f . In short, we may say that 1f
can be brought to the same level of understanding or perspective as the person 2f .
Also, during the philosophical transformation of 1f into 2f , 1f ‘s ―way of understanding‖ is still based on some ―mixture‖ of
the same set of principles as the person
f2 , since for all
(x,t)X I ,
F(x,t)s . Thus 1f does not deviate from the
set of principles, }{ ja , during the time period of transformation (training). However, the set of proportions }{ j , defined as
―significances‖ that 1f gives to corresponding principles, may change with respect to time.
The Homotopy relation
is an equivalence relation on the space of mappings where the set of functions, }{ if , that are
homotoptic to each other establishes an equivalence class. The equivalence class can be defined as a ―social equality‖ or
social order where every person if in the social order defines ideas or ―sees things‖ according to some combination of the
same set of principles as the next person kf in that same social order.
A HIERARCHY FOR THE EQUIVALENCE CLASS?
We may define a hierarchy for the social order (equivalence class) }{ if . Recall that dissections of the spanning set of a
simplex produce ―new vertices‖. Geometrically, the dissections can be computed so that the ―new vertices‖ are midpoints of the edges of the simplex, centers of the simplex faces, and a center of the solid. For example consider the dissected 3-simplex in Figure 3. We can compute the center for edge E1 to be the average of its vertices,
)(2
11001 aab ,
where the subscripts denote the two vertices that were averaged.
Figure 3. 3-simplex showing points b01, b012, and b0123 resulting from the dissections of edge E1, the geometric face with
vertices 210 ,, aaa , and the simplex itself
s3 .

An Anthropomorphic Perspective in Homology Theory
292
Similarly, the dissection of the geometric face, in Figure 3, whose vertices are
{a0,a1,a2} yields the center of the face and is
computed by )(3
12100 1 2 aaab .
Noting that any dissection of a geometric face yields a three-subscripted vertex. Finally, the dissection of the solid yields the center of the solid computed by
b0 1 2 31
4(a0 a1 a2 a3) ,
where we have a four-subscripted vertex.
In general, each vertex resulting from a dissection is computed:
b0...n 1
n 1ai
i0
n
. Also we may define the vertex with the
most subscripts as the leading vertex [7], then all other vertices of a lesser number of subscripts will follow. Thus we can establish a vertex ordering.
The Hierarchy. Recall that each person KXfi : yields a definition of a concept that is some combination of the
spanning principles },...,,,{ 210 NaaaaP , of a simplex (system) Kt , i.e., txfi )( so that )(xf i can be in a face
(boundary) or the interior of t . If there is a person KXf :* who gives equal significance,
1
1
N , to each
principle in the set },...,,,{ 210 NaaaaP in their ―definition‖ of the concept x , then that ―definition‖ will have the form
N
i
iN aN
b0
...01
1,
which has the most subscripts; so we may define *f to be the “lead” person among all people in the class }{ if , with
respect to defining x , written iff * . In other words,
*f ‘s definition of x is at the ―center‖ of the system spanned by P .
Similarly if a person *
kf gives equal significance to principles in a proper subset of P , say
P {ak}, in their definition of
x , their definition will have the form
1
0
1...0
1 N
i
iN aN
b ,
so that *
kf ‘s definition of x is at the ―center‖ of the system spanned by }{ kaP and *
kf will be defined as the lead person
among all people that define x based on a combination of principles in }{ kaP . However, the person*
kf uses a set of
fewer principles than *f to ―define‖ concept x and is therefore lesser in rank than
*f , written, **
kff . Observe that
there are N+1 such subsets }{ kaP , for Nk ,...2,1,0 , so that there can be N+1 people, *
kf where Nk ,...2,1,0 ,
whose definition of x is at the ―center‖ of the system spanned by }{ kaP . Thus there is a set of N+1 people , }{ *
kf ,
whose rank is immediately below*f .
Again, determining the rank of persons whose ―definition‖ of the concept x lies at the ―center‖ of systems spanned by the
subsets constructed by deleting pairs of vertices from P , },{ kj aaP for }...2,1,0{, Nkj and kj , we get a set of
leaders }{ *
jkf that are subordinate to leaders in }{ *
kf and to the leader *f , written,
***
jkk fff . Also note that the
number of subscripts that a leader has indicates the amount of principles that they do not use in formulating their definition of x . The number of subscripts of leaders in a set of leaders can serve as a label for that set.

B. A. Sims IHART - Volume 16 (2011)
293
In general, if we continue with the process of determining the rank of persons whose ―definition‖ of the concept x lies at the
―center‖ of systems spanned by the non-singleton subsets of P by deleting r-tuplets-
P {aik}k0
r for 1Nr , we get
a number of sets of leaders of the type }{ *
,...2,1,0 rf , where leaders with fewer subscripts are higher in rank than leaders with a
higher number of subscripts. Thus we have a hierarchy among ranks of leadership, written *
,. . . ,2,1,0
*
1,0
*
0
*
rffff
for 1Nr . Note that the leader with no subscript uses all of the principles in P when defining.
For leaders of the same rank we write *
,...2,1,0
*
,...2,1,0 mr ff , for rm , where
is defined in the sense that the two
leaders define concept x with subsets of P that have the same cardinality.
Let us also consider the people that are not ―leaders‖ whose ―definition‖ of the concept x lies in the span of subsets
r
kikaP 0}{ for Nr . We can rank-order people according to the number of principles that they use to define concept x ,
in the same way that we rank-ordered the leaders, rffff , . . . ,2,1,01,00 , where the person with no subscript
indicates that they define using all of the principles in P . Persons that define with subsets of P that have the same cardinality
are said to be of equal rank, written mr ff ,...2,1,0,...2,1,0 , for rm .
For a more concrete idea of a rank hierarchy in the class of ―homotopic‖ people, an example follows: Let the following people
define the same concept using subsets of P as indicated;
f * and
f define using the set P . *
012f ,
f012 , and
g012 define
using the subset 2
0}{ kikaP .
f 01 23*
and
f0 1 23 define using the subset 3
0}{ kikaP . We rank order the people as
follows,
f * f f0,1,2* f0,1,2 g0,1,2 f0,1,2,3
* f0,1,2,3 .
Contiguity
Definition 4. Let
K and
L be complexes. A simplicial map
w:KL is a function that maps simplexes to simplexes
defined on the vertices
ai of a simplex
sK to vertices, say, )( ii awc of another simplex
qL . For every point
bs, it is some linear combination of the vertices of
s,
b iai , so that
w(b) iw(ai) is some linear
combination of vertices of
qL.
Definition 5. Two simplicial maps
w1 :KL and
w2 : K L are said to be contiguous if for all simplexes
sK and
s K , there exists a simplex
qL such that qsw )(1 and qsw )(2
.
Anthropomorphic view of Definition 5. Define the simplex
s to be some philosophical system and
s to be the philosophical system derived (spanned) by the dissection of
s - ―refinement‖ of principles that undergird system
s. Let the two simplicial
maps
w1 and
w2 be two people that each ―manifest‖, in some way, a philosophy. Thus the two people would produce two
simplexes
z w1(s) and
hw2( s ) , each being some ―manifestation‖ of the philosophies
s and
s . Now if we define the
simplex
qL to be a ―larger‖ ―manifestation‖ of some philosophy from the system of thought,
K , then consider the faces
given by qsw )(1 and qsw )(2
to be ―manifestations‖ of philosophies
s and
s , respectively, that are a part of and
contribute to the development and structure of the larger ―manifestation‖
q. Let the set of principles that span the larger
manifestation be given by },...,,,{ 210 mrrrrG , so that the faces qsw )(1 and qsw )(2
are each spanned by a
subset of
G . Here, Definition 5 suggests that If two people
w1 and
w2 ―manifest‖ philosophies where one philosophy
s is a ―refinement‖ of
another philosophy
s, and
w1‘s and
w2 ‗s ―manifestations‖ are both spanned by a subset of the spanning set of principles of
some ―larger‖ manifestation
q then we can now consider the two people
w1 and
w2 to be contiguous (―near‖ or ―touching‖) in
the sense of the way they ―manifest‖ philosophies or ideas.

An Anthropomorphic Perspective in Homology Theory
294
CONCLUSION
In this paper we considered theorems on the simplicial complex to suggest a measure of ―nearness‖ (approximation) among people, based on the principles that they use to develop their view or understanding of ideas or concepts. We have also considered a means by which to measure ―nearness‖ (contiguity) among people based on the way that they manifest a philosophy or how they ―realize‖ a philosophy. An interesting observation found is that structures and theorems on map homotopy can be used to model social orders (equivalence classes) among people and suggests that people that are approximate in terms of constructing their view based on the same set of principles can be considered to be homotopic. That is, one person may be trained to ―view‖ or ―understand‖ just like another person of the same social order, by some form of learning (homotopy). In the human setting a difficulty arises when attempting to give a measure, using number, to how much significance (as a proportion) that a person gives to a particular principle in their use of that principle when formulating a definition or view. We can; however, determine a set of principles that the person uses in a definition of a thing. With respect to the human manifestation of ideas or philosophies, we can determine what we want to consider as a ―manifestation‖ or ―realization‖ of a philosophy. Then, the problem is how to determine whether that manifestation is a ―point‖ or ―face‖ of a larger manifestation. Finally, it has been demonstrated that mathematical structures can be applied to the study of anthropological/philosophical systems. A point of view can also be taken that anthropological structures can be used to, make more concrete, some abstract ideas in the study of homology theory.
REFERENCES
[1] D. Jenkins, Anthropology, Mathematics, Kinship: A Tribute to Anthropologist Per Hage and His Work with the Mathematician Frank Harary. Mathematical and Cultural Theory: An International Journal,Vol. 2 no. 3, 2008.
[2] Mirco A. Mannucci, Lisa Sparks, Daniele C. Struppa, Simplicial models of social aggregation I. http://arxiv.org/pdf/cs/0604090v1, pdf, Apr, 2006.
[3] G. De Meur and A. Gottcheiner, Prescriptive Kinship Systems, Permutations Groups and Graphs. Mathematical and Cultural Theory: An International Journal,Vol. 1 no. 1, 2000.
[4] A. Gottcheiner, On Some Classes of Kinship Systems I: Abelian Systems. Mathematical and Cultural Theory: An International Journal, vol. 2 no. 4, 2000.
[5] J. Legrand, How far can Q-analysis go into social systems understanding? Fifth European Systems Science Congress, 2002.
[6] Atkin, R. (1972). From cohomology in physics to q-connectivity in social science. International Journal of Man-Machines Studies vol. 4, 341-362.
[7] P.J. Hilton and S. Wylie, Homology Theory, An Introduction to Algebraic Topology. Cambridge University Press, 1967.

J. Lepselter, L. Jones, N. Goodman, M. Green and A. Bahour IHART - Volume 16 (2011)
295
MOTOR-CONTROL CENTER DESIGN
Joshua Lepselter, Lamar Jones, Nate Goodman, Marquael Green and Adnan Bahour Tennessee State University, USA
MOTIVATION
This lighting design project will be presented in a step by step method on how to determine our overall size, draw layout of motor-control center, and determine the ampacity rating for the main bus. Sufficient clear working space must be provided in front of the enclosure to permit ready and safe operation and maintenance of all devices. Section 110-16 of the National Electrical Code governs the working space about electrical equipment operating at 600 volts nominal or less.
PROBLEM STATEMENT
The motor-control design must be accomplished as follows: Five 10 hp, FVNR Three 25 hp, FVNR One 25 hp, FVR One 30 hp, FVNR One 40 hp, FVNR One 75 hp, FVR The source of electrical supply is 230 V, three-phase, and the motor are related at 200 V, three-phase. The control units are the circuit breaker type..
A - Determine the overall size and draw layout of motor-control center. B - Determine the ampacity rating for the main bus.
BASIS FOR DESIGN
The basis for design of the motor-control center should consider that the source of electrical supply is 230 V, three-phase, and the motor are related at 200 V, three-phase, and the control units are the circuit breaker type with the following motors and type of starters: Five 10 hp, FVNR Three 25 hp, FVNR One 25 hp, FVR One 30 hp, FVNR One 40 hp, FVNR One 75 hp, FVR
CALCULATIONS DATA AND EVALUATION
The space requirements for motor starters are given in Table -1

Motor-Control Center Design
296
Table 1
Number Motor HP Type of Starting Starter Size Each Unit Total
5 10 FVNR 2 2 2 x 5 = 10
3 25 FVNR 3 4 4 x 3 = 12
1 25 FVR 3 4 4 x 1 = 4
1 30 FVNR 4 4 4 x 1 = 4
1 40 FVNR 4 4 4 x 1 = 4
1 75 FVR 5 10 10 x 1 = 10
Total for Starters = 44
No additional space factors Allowance for main incoming feeder cables: 1 space factor Total required space factors is found: 44 + 1 = 45 -Maximum possible space factors per vertical section = 12 -Minimum number of vertical sections = 45/12 ≈ 4 -Total number of space factors = 4 x 12 = 48 Number used = 45 Number of spare space factors = 3
Table 2
Motor HP FLMA (A)
Total
75 192 125% 125% of largest = 1.25 x 192 = 240
10 28
5 x 28 = 104
25 68
3 x 68 = 204
25 68 Plus 100% of 1 x 68 = 68
30 80 remaining 1 x 80 = 80
40 104
1 x 104 = 104
Minimum Ampacity = 800 A
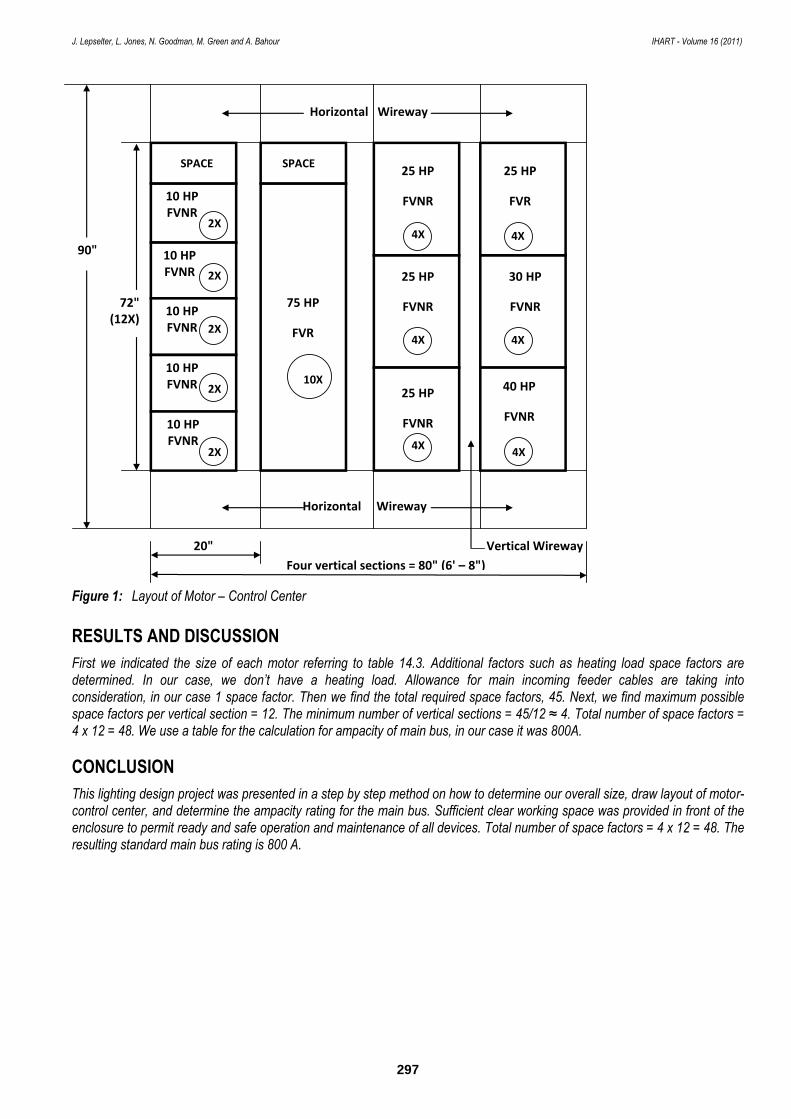
J. Lepselter, L. Jones, N. Goodman, M. Green and A. Bahour IHART - Volume 16 (2011)
297
40 HP
FVNR
30 HP
FVNR
25 HP
FVR
25 HP
FVNR
25 HP
FVNR
25 HP
FVNR
75 HP
FVR
SPACE
10 HP FVNR
SPACE
10 HP FVNR
10 HP FVNR
10 HP FVNR
10 HP FVNR
4X
4X
4X 4X
4X
4X
10X
2X
2X
2X
2X
2X
Horizontal Wireway
Horizontal Wireway
Vertical Wireway 20"
Four vertical sections = 80" (6' – 8")
72" (12X)
90"
Figure 1: Layout of Motor – Control Center
RESULTS AND DISCUSSION
First we indicated the size of each motor referring to table 14.3. Additional factors such as heating load space factors are determined. In our case, we don‘t have a heating load. Allowance for main incoming feeder cables are taking into consideration, in our case 1 space factor. Then we find the total required space factors, 45. Next, we find maximum possible space factors per vertical section = 12. The minimum number of vertical sections = 45/12 ≈ 4. Total number of space factors = 4 x 12 = 48. We use a table for the calculation for ampacity of main bus, in our case it was 800A.
CONCLUSION
This lighting design project was presented in a step by step method on how to determine our overall size, draw layout of motor-control center, and determine the ampacity rating for the main bus. Sufficient clear working space was provided in front of the enclosure to permit ready and safe operation and maintenance of all devices. Total number of space factors = 4 x 12 = 48. The resulting standard main bus rating is 800 A.
B. K. Fralinger and A. Dorsey IHART - Volume 16 (2011)
298
THE SKINNY ON THE LAP-BAND: A CASE STUDY
Barbara K. Fralinger and Amy Dorsey Delaware State University, USA
ABSTRACT
This article reports on the effectiveness of the Lap-Band procedure in an individual case study. In-depth interviews were performed with a 33 year-old obese woman prior to and after surgery over the course of one year. The purpose of the study was to gather information on the physical, mental, and emotional factors surrounding this bariatric surgery option and to determine its impact on weight loss, self-efficacy, and overall quality of life. The Weight Efficacy Life-Style Questionnaire (WEL) was used to measure patient self-efficacy before and after surgery while qualitative survey methodologies were used to gain detailed knowledge of all preparatory procedures, the surgery itself, and the specific lifestyle modifications necessary for successful weight loss after Lap-Band implantation. The findings of the study indicated that with adherence to the recommended nutritional guidelines presented in pre-surgery counseling sessions, the Lap-Band procedure can be a highly effective weight loss option for obese individuals. Further, results of this case study showed an increase in patient self-efficacy and perceived behavioral control with regard to food consumption. Since beginning the surgery process in January 2010, the patient lost 106 pounds in 13 months and reported increased energy, reduced joint pain, decreased fatigue, and improved outlook on life.
INTRODUCTION
Being overweight or obese is a significant risk factor for the development of hypertension and coronary heart disease. Obesity is defined as excess body fat determined by measurement of Body Mass Index (BMI) of 30 kg/m2 or more, usually due to an imbalance between caloric intake and expenditure (Pettit, 2009). According to the Centers for Disease Control (2010), during the past 20 years there has been a dramatic increase in obesity in the United States. In 2009, only Colorado and the District of Columbia had a prevalence of obesity less than 20% (CDC, 2010). Research has shown considerable evidence that traditional nonsurgical obesity treatments such as diet, exercise, and pharmacotherapy, have been ineffective for achieving long term, significant weight loss in the morbidly obese. Buchwald et al. (2004) concluded that because of the failure of traditional treatments and excessive costs related to treatment of obesity-related medical conditions/disease, increasing numbers of obese individuals started pursuing weight loss surgery (―bariatric‖ surgery) which modifies the stomach and/or intestines to reduce the amount of food that can be eaten and absorbed. Popular surgical options include gastric bypass, gastroplasty, and gastric banding. In the present study, the surgical method depicted is gastric banding, where a constricting ring is placed completely around the fundus of the stomach, below the junction of the stomach and esophagus. Specifically, ―Lap-Band‖ is the trademark term for the adjustable gastric banding device produced and sold by Allergan, Inc. Recommended for individuals who are at least 30 pounds overweight with a BMI of 30 kg/m2 or higher, the Lap-Band surgery is an approved FDA procedure that is considered to be ―restrictive.‖ Restrictive operations serve only to restrict food intake and do not interfere with the normal digestive process. To perform the surgery, doctors make a set of laparoscopic incisions in the abdomen. The gastric band is sewed around the perimeter of the stomach and inflated with saline solution. This creates a small pouch at the top of the stomach where food enters from the esophagus. Initially, the pouch holds about one ounce of food and later expands to two to three ounces. The lower outlet of the pouch usually has a diameter of only about ¾ inch and delays the emptying of food, causing a feeling of satiety. This process promotes gradual weight loss as it forces consumption of smaller portions that allow the individual to feel full more quickly and for a longer period of time. Over time, the band can be tightened or loosened to change the size of the passage by increasing or decreasing the amount of saline (SOCH, 2010).
PURPOSE OF THE STUDY
The purpose of this study was to gather information on the physical, mental, and emotional factors surrounding the Lap-Band surgery and to determine its impact on weight loss, self-efficacy, and overall quality of life. The objective of this study was to gain a detailed description of the processes and corresponding health outcomes of this procedure by way of an in-depth case study in order to evaluate its effectiveness in achieving patient-desired weight loss goals.
B. K. Fralinger and A. Dorsey IHART - Volume 16 (2011)
299
SIGNIFICANCE OF THE STUDY
Limited research exists on how individual physical, mental, and emotional factors play a role in the effectiveness of the Lap-Band procedure. Specifically, although there has been more emerging research on the relationship between self-efficacy and weight loss, virtually no studies have examined this with regard to the Lap-Band procedure. By using both quantitative and qualitative methods, the current study evaluated one patient‘s perceptions of the effectiveness of the Lap-Band process in achieving desired weight loss outcomes. This research adds to the knowledge base of the existing literature on bariatric surgery options.
THE SUBJECT
The subject of this case study was Ms. Amy Dorsey, a 33 year old woman who was obese for a period of 10 years prior to having Lap-Band surgery in July of 2010 at Southern Ocean County Hospital (SOCH) in Manahawkin, NJ. At the start of pre-operative procedures in January 2010, Ms. Dorsey weighed 271 pounds with a BMI of 44.8. Before the Lap-Band process, the subject had engaged in several traditional weight loss techniques (e.g., the Atkins diet, Weight Watchers, Slim-Fast, Phentermine, calorie counting, etc.) with little or no success.
THE LAP-BAND PROCEDURE: STEP-BY-STEP
Pre-Operative Evaluation Procedures
In order to qualify for the Lap-Band surgery, the patient had to first go through a series of evaluations by a team of medical professionals to determine if she met the requirements for the procedure (e.g., must be at least 30 pounds overweight, have a BMI of 30 kg/m2 , etc.). Once approved for surgery, pre-operative consultations with a nutritionist, psychologist, gastroenterologist, pulmonologist, and cardiologist were required and performed during January 2010. Once all consulting physicians examined the patient, ordered the appropriate tests, and sent a clearance letter to the primary care physician, final plans were made for the surgery, including pre-operative testing and an office visit with the surgeon. During this time, the patient was encouraged to meet and ask questions of all members of the medical team who would take part in her care (the surgeon, physician assistant, anesthesiologist, nurses, physical therapists, respiratory therapists, lab technicians, social workers, pharmacists and nutritionists).
Nutrition Counseling Sessions
For six months prior to surgery, the patient participated in the Comprehensive Weight Loss Program, which involved nutritional counseling sessions with a Registered Dietitian (RD) each month to learn about the mental, physical, and emotional factors surrounding food consumption. The RD reviewed the patient‘s previous weight loss attempts and current eating behaviors and provided education on the guidelines required for post-operative success. Nutrition, behavior, and exercise goals were established during the initial visit followed by additional educational sessions covering the following basic nutrition topics (SOCH, 2010):
Setting realistic goals
Reading food labels
Portion control
Protein and vitamin/mineral intake
Mechanics of the pouch
Prevention of complications
Importance of exercise for weight loss and maintenance
Maintaining a healthy weight for life During these sessions, the RD emphasized that the band creates a ―tool‖ to help one lose weight by aiding in portion control and caloric reduction; success is primarily on the part of the individual as it is up to the patient to adhere to the recommended guidelines in order to lose weight.
Bariatric Exercise Program
The patient also had the option to engage in a six week exercise program consisting of group sessions two days per week prior to surgery. Activities in this program consisted of aerobics, exercise bands, isotonic exercises using muscle tension, and

The Skinny on the Lap-Band: A Case Study
300
stretching. Although this is recommended for all Lap-Band candidates, it is not mandatory. Ms. Dorsey opted not to participate in the program and instead incorporated more walking into her daily routine.
Bariatric Weight Loss Goals
The Lap-Band pre- and post-operative process sets the following goals for patient success (SOCH, 2010):
Nutrition
Take multivitamin each day
Eliminate carbonated beverages
Decrease then eliminate caffeine and alcohol intake
Drink 64 oz. of non-carbonated, non-caffeinated beverages each day
Eat protein at each meal
Eat more fruits and vegetables; 2 choices of each every day
Dilute or eliminate fruit juice
Limit high fat, high sugar foods (cakes, candy, cookies, donuts, chips, etc.)
Change breads, pasta, cereal and crackers to 100% whole grains/whole wheat
Exercise
Walk 30 minutes 3-5 times per week
Swim/water aerobics for 30 minutes 3-5 times per week
Ride a bike for 30 minutes 3-5 times per week
Exercise at the gym for 30 minutes 3-5 times per week
Behavior
Eat three meals per day (do not skip meals)
Take 30 minutes to finish each meal
Practice taking small bites and small sips
Chew foods 25 times before swallowing
Put fork down between each bite
Avoid eating and drinking at the same time
Eat consciously – not while driving, cooking, watching TV, reading, etc.
Become aware of stress eating triggers and change your reactions
Practice mindful eating habits
Pre-Surgical Diet
For seven days prior to Lap-Band surgery, the patient was instructed to follow the daily diet below (SOCH, 2010):
Drink 4 servings of protein supplement (UNJURY) each day. Mix at least two servings with skim/skim plus milk (for lactose intolerance, soy or lactose free milk may be substituted).
Include at least 6-8 servings each day from this food list: o 1 cup tomato or V-8 juice o ½ cup cream of wheat or oatmeal o 6 ounces of sugar-free, fat-free/low-fat yogurt o ½ cup unsweetened applesauce o 1 cup fat-free raw vegetables (lettuce, cucumbers, carrots, tomato, green peppers) o ½ cup sugar-free pudding or UNJURY Hi-Protein pudding o Sugar-free Jell-O or UNJURY Hi-Protein Jell-O
Drink at least 64 oz. of water or sugar-free, caffeine free beverages each day.
Take a multivitamin and calcium supplement (1500mg) daily.
If drinking milk causes digestive problems, then include an additional (5th) serving of protein supplement (UNJURY).

B. K. Fralinger and A. Dorsey IHART - Volume 16 (2011)
301
Lap-Band Surgical Procedure
On July 1, 2010 the patient entered the Bariatric Hospital at Southern Ocean County Hospital in Manahawkin, NJ. During a one-hour laparoscopic procedure using general anesthesia, the Lap-Band device was inserted through tiny (1cm) incisions in the abdomen and placed around the upper part of the stomach. The resulting 15cc pouch (or the "new stomach") dramatically reduced the functional capacity of the stomach. A tube was then connected from the Lap-Band system to a small access port, fixed beneath the skin of the abdomen. After the first four weeks, an adjustment to tighten the Lap-Band system was made by adding saline solution through the access port. The patient has currently had four total adjustments since surgery. The following photos are video stills of an actual Lap-Band surgery retrieved from the Bariatric Care Center at the Palms of Pasadena Hospital in Florida website (2010):
Step 1. Incisions Step 2. Clearing through muscle and fat to get to the abdomen
Step 3. Placement of the Lap-Band system Step 4. Sewing the Lap-Band system to the stomach
Step 5. Attaching the access port
Post-Operative Diet
Post-operative dietary guidelines consisted of the following four stages (SOCH, 2010):

The Skinny on the Lap-Band: A Case Study
302
Stage I: Bariatric Clear Liquids with Protein Supplement (Week 1)
Progress from clear liquids to full liquids that are sugar-free, non-carbonated, and decaffeinated.
Consume one ounce of water every hour while awake; gradually increase to a goal rate of 4 oz. per hour.
Liquids should be sipped slowly, without a straw, to avoid stretching the pouch and feelings of nausea, vomiting and pain.
A minimum of 64 oz. of liquids should be consumed daily over a period of 16 hours to replace fluid losses and prevent dehydration.
Stage II: Low-fat, no concentrated sweets pureed diet (Weeks 2-4)
Consumption of 2-3 oz. portions of oatmeal consistency (pureed) foods to avoid blockages of the opening leaving the stomach.
Eat protein-rich foods such as cottage cheese, yogurt, eggs, soups, poultry, fish, pureed meat, beans, and tofu.
Do not drink any liquid with meals; have nothing to drink for 15 minutes before meals and do not resume drinking until 45 minutes after meals.
Continue with supplements from Stage I.
Eat slowly; 2 oz. of food should take about 30-45 minutes to consume.
Stage III: Soft Food Diet (Weeks 5-6)
Increase meal size to 3-4 oz.
Foods should be chopped, ground, and tender; food should be easily chewed
Food choices may include soups, moist ground lean meat, cooked or dry cereal, soft cooked vegetables, cooked or canned fruit, sugar free pudding or gelatin.
Eat three small meals each day and 2 protein supplements between meals.
Stage IV: Modified Weight Reduction Diet (Weeks 7 and Beyond)
Following the first band adjustment, consume clear liquids and protein shakes for 1 day; progress to regular foods the following day, introducing one new food at a time.
Chew food slowly and thoroughly; dice meats to the size of a pencil top eraser.
Gradually increase meal size to 4-5 oz. three times a day.
Drink at least 8 cups of low calorie fluids between meals
Continue to take vitamin and mineral supplements as prescribed by physician
Goal is to achieve at least 60-80g of protein per day.
Safety of the Procedure
Research concerning the safety of the Lap-Band has been primarily positive as implantation requires no cutting or stapling of the stomach. According to researchers at Allergan, Inc., the Lap-Band system is up to ten times safer than more extensive weight loss surgeries, such as gastric bypass or gastric sleeve (O‘Brien, 2003). Possible complications that can occur include accidental injury to the spleen, esophageal injury, slipping of the band, infection, leaking of the inflation system, vomiting, acid reflux, and failure to lose weight (Pettit, 2009). Overall, however, there is less risk associated with both the initial surgical implantation and post-surgical presence of the device in the body than with other gastric procedures. Further, there is generally a quick recovery time, as most individuals resume normal activity in approximately one week (Parikh, 2006).
METHODS
Quantitative Measures
From 1992 to 2005, the number of bariatric surgeries performed in the United States increased by over 10-fold, with the Roux-en-Y gastric bypass (RYGBP) surgery being the most widely performed procedure (Colwell, 2005). Mun, Blackburn, & Matthews (2001) surmised that although 90% of patients who undergo bariatric surgery can expect to lose 30–50% of their body weight after surgery, sustained weight loss requires adherence to strict post-surgical eating behavior guidelines. Some patients often revert back to pre-surgical eating habits because they find it too difficult to modify their behaviors with regard to portion control (Anderson & Larsen, 1989; MacLean, Rhode, & Shizgal, 1983; Sarwer et al., 2008). In fact, overeating and weight gain after surgery may occur because patients learn how to ―cheat‖ the surgical and dietary restrictions by either consuming large amounts of soft foods or calorie-dense liquids, or by continually grazing on small amounts of high caloric foods (Hsu, Bentancourt, & Sullivan, 1996; Hsu et al., 1998; Boeka et al., 2010).
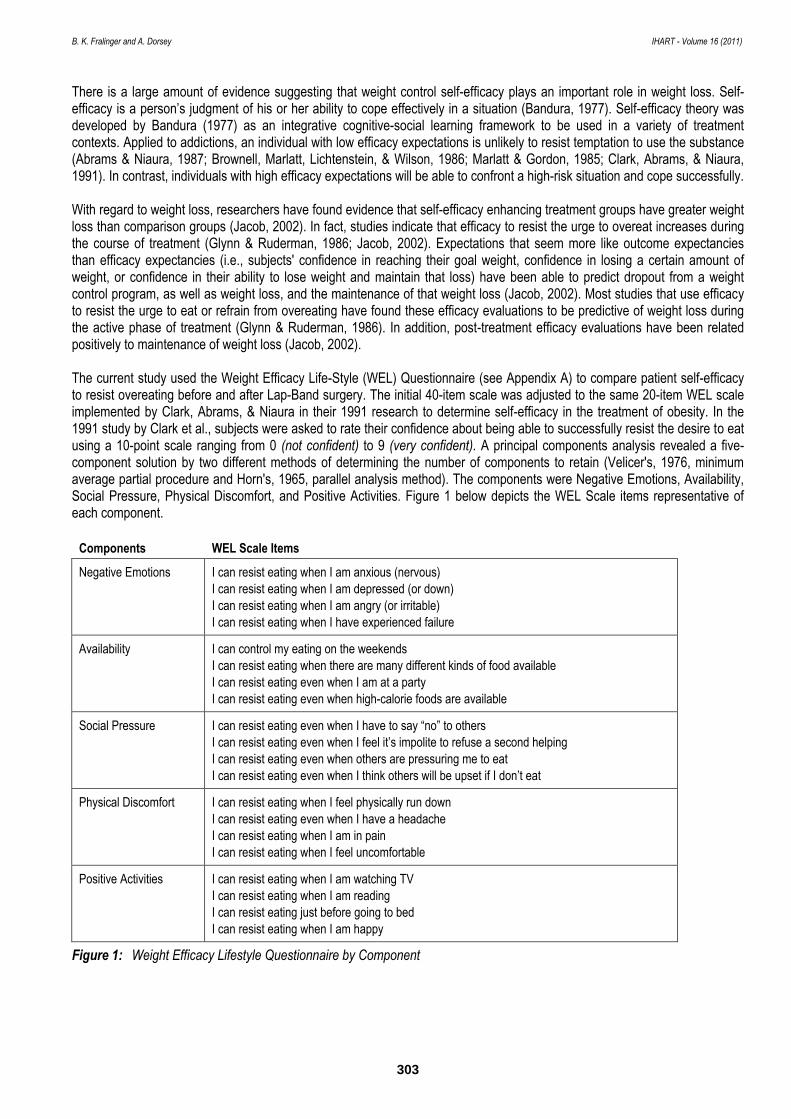
B. K. Fralinger and A. Dorsey IHART - Volume 16 (2011)
303
There is a large amount of evidence suggesting that weight control self-efficacy plays an important role in weight loss. Self-efficacy is a person‘s judgment of his or her ability to cope effectively in a situation (Bandura, 1977). Self-efficacy theory was developed by Bandura (1977) as an integrative cognitive-social learning framework to be used in a variety of treatment contexts. Applied to addictions, an individual with low efficacy expectations is unlikely to resist temptation to use the substance (Abrams & Niaura, 1987; Brownell, Marlatt, Lichtenstein, & Wilson, 1986; Marlatt & Gordon, 1985; Clark, Abrams, & Niaura, 1991). In contrast, individuals with high efficacy expectations will be able to confront a high-risk situation and cope successfully. With regard to weight loss, researchers have found evidence that self-efficacy enhancing treatment groups have greater weight loss than comparison groups (Jacob, 2002). In fact, studies indicate that efficacy to resist the urge to overeat increases during the course of treatment (Glynn & Ruderman, 1986; Jacob, 2002). Expectations that seem more like outcome expectancies than efficacy expectancies (i.e., subjects' confidence in reaching their goal weight, confidence in losing a certain amount of weight, or confidence in their ability to lose weight and maintain that loss) have been able to predict dropout from a weight control program, as well as weight loss, and the maintenance of that weight loss (Jacob, 2002). Most studies that use efficacy to resist the urge to eat or refrain from overeating have found these efficacy evaluations to be predictive of weight loss during the active phase of treatment (Glynn & Ruderman, 1986). In addition, post-treatment efficacy evaluations have been related positively to maintenance of weight loss (Jacob, 2002). The current study used the Weight Efficacy Life-Style (WEL) Questionnaire (see Appendix A) to compare patient self-efficacy to resist overeating before and after Lap-Band surgery. The initial 40-item scale was adjusted to the same 20-item WEL scale implemented by Clark, Abrams, & Niaura in their 1991 research to determine self-efficacy in the treatment of obesity. In the 1991 study by Clark et al., subjects were asked to rate their confidence about being able to successfully resist the desire to eat using a 10-point scale ranging from 0 (not confident) to 9 (very confident). A principal components analysis revealed a five-component solution by two different methods of determining the number of components to retain (Velicer's, 1976, minimum average partial procedure and Horn's, 1965, parallel analysis method). The components were Negative Emotions, Availability, Social Pressure, Physical Discomfort, and Positive Activities. Figure 1 below depicts the WEL Scale items representative of each component.
Components WEL Scale Items
Negative Emotions I can resist eating when I am anxious (nervous)
I can resist eating when I am depressed (or down)
I can resist eating when I am angry (or irritable)
I can resist eating when I have experienced failure
Availability I can control my eating on the weekends
I can resist eating when there are many different kinds of food available
I can resist eating even when I am at a party
I can resist eating even when high-calorie foods are available
Social Pressure I can resist eating even when I have to say ―no‖ to others
I can resist eating even when I feel it‘s impolite to refuse a second helping
I can resist eating even when others are pressuring me to eat
I can resist eating even when I think others will be upset if I don‘t eat
Physical Discomfort I can resist eating when I feel physically run down
I can resist eating even when I have a headache
I can resist eating when I am in pain
I can resist eating when I feel uncomfortable
Positive Activities I can resist eating when I am watching TV
I can resist eating when I am reading
I can resist eating just before going to bed
I can resist eating when I am happy
Figure 1: Weight Efficacy Lifestyle Questionnaire by Component
The Skinny on the Lap-Band: A Case Study
304
Qualitative Measures
Qualitative research has been defined in a variety of ways. In one definition, Strauss and Corbin (1998) identified qualitative research as: Any type of research that produces findings not arrived at by statistical procedures or other means of quantification. It [qualitative research] can refer to research about persons‘ lives, lived experiences, behaviors, emotions, and feelings as well as about organizational functioning, social movements, and cultural phenomena (p.10-11). Further the authors state that qualitative research is best used when the methods are: (a) complementary to the preferences and personal experiences of the researcher; (b) congruent with the nature of the research problem; and (c) employed to explore areas about which little is known. Miles and Huberman (1994) expressed an expanded position and indicated that qualitative research is conducted to: (a) confirm previous research on a topic; (b) provide more in-depth detail about something that is already known; (c) gain a new perspective or a new way of viewing something; and (d) expand the scope of an existing study. Based on this collection of reasons, qualitative methods were appropriate for this study. Limited research exists on the effectiveness of the Lap-Band procedure and influence of self-efficacy on weight loss. The current study adds to the knowledge base of bariatric surgery options and promotes the need for further exploration of the mental, physical, and emotional factors affecting adherence to post-surgical weight loss guidelines.
DATA COLLECTION
In order to gain quantitative data regarding weight loss and self-efficacy, the Weight Efficacy Life-Style (WEL) Questionnaire (see Appendix A) was administered to the patient to compare her confidence in successfully resisting the desire to overeat prior to and after Lap-Band surgery. In order to gain a more in-depth understanding of the results obtained from this 20-item survey, qualitative data collection procedures were performed over the last 13 months.
Marshall and Rossman (1999) suggested that data collection methods in qualitative research could be categorized into four types: (a) participation in the setting, (b) direct observation, (c) in-depth interviews, and (d) document analysis. For the purpose of this research, in-depth individual interviews were used as the primary method of qualitative data collection. Coffey and Atkinson (1996) suggested that data collection and analysis are best conducted simultaneously in qualitative research to allow for necessary flexibility. Data collection and analysis occurred throughout the Lap-Band pre and post surgery process for a total period of 13 months. The logic behind this decision was to gain an in-depth understanding of the surgical procedure and the patient‘s perceptions of her experiences. To gain a detailed depiction of perspectives related to her experiences, an open-ended questionnaire was administered at various intervals both before and after surgery. The majority of the responses were in the form of statements. The specific items explored are summarized in Appendix B.
The truth-value, or credibility, of conclusions in a qualitative study is comparable to the concept of internal validity in quantitative research. Lincoln and Guba (1985) and Miles and Huberman (1994) suggested that research results be scrutinized according to three basic questions: (a) Do the conclusions make sense? (b) Do the conclusions adequately describe research participants‘ perspectives? and (c) Do conclusions authentically represent the phenomena under study? The researcher relied on triangulation and member checks to enhance credibility. According to Lincoln and Guba (1985), triangulation is the corroboration of results with alternative sources of data. Consultation with an expert in the field was utilized as an alternate data source. Additionally, presenting results to the participant during a concluding interview was to serve as a method to enhance the credibility of this study‘s results.
RESULTS
Study Sample
The sample consisted of one subject treated as a case study. Administration of surveys was done via email over 13 months.
Analysis of the Data
The data obtained in this study were analyzed using both quantitative measures (descriptive statistics and paired samples t-test) and qualitative methodologies. Specifically, patient self- efficacy and personal perceptions of the effectiveness of the Lap-Band procedure in achieving her desired weight loss outcomes were studied.
Quantitative Analysis
Coding System
The WEL Scale contained 20 items that were rated on a 10-point Likert scale ranging from 0 (not confident) to 9 (very confident). Items were grouped into five components: Negative Emotions, Availability, Social Pressure, Physical Discomfort,
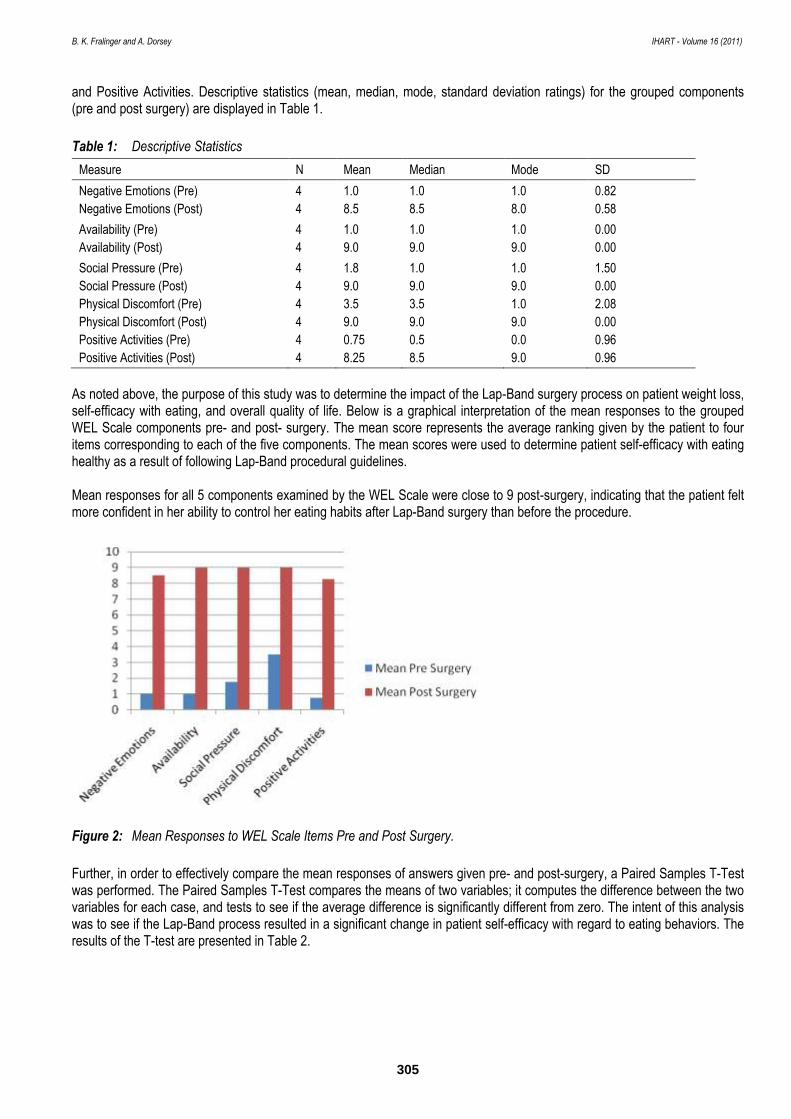
B. K. Fralinger and A. Dorsey IHART - Volume 16 (2011)
305
and Positive Activities. Descriptive statistics (mean, median, mode, standard deviation ratings) for the grouped components (pre and post surgery) are displayed in Table 1.
Table 1: Descriptive Statistics
Measure N Mean Median Mode SD
Negative Emotions (Pre)
Negative Emotions (Post)
4
4
1.0
8.5
1.0
8.5
1.0
8.0
0.82
0.58
Availability (Pre)
Availability (Post)
4
4
1.0
9.0
1.0
9.0
1.0
9.0
0.00
0.00
Social Pressure (Pre)
Social Pressure (Post)
Physical Discomfort (Pre)
Physical Discomfort (Post)
Positive Activities (Pre)
Positive Activities (Post)
4
4
4
4
4
4
1.8
9.0
3.5
9.0
0.75
8.25
1.0
9.0
3.5
9.0
0.5
8.5
1.0
9.0
1.0
9.0
0.0
9.0
1.50
0.00
2.08
0.00
0.96
0.96
As noted above, the purpose of this study was to determine the impact of the Lap-Band surgery process on patient weight loss, self-efficacy with eating, and overall quality of life. Below is a graphical interpretation of the mean responses to the grouped WEL Scale components pre- and post- surgery. The mean score represents the average ranking given by the patient to four items corresponding to each of the five components. The mean scores were used to determine patient self-efficacy with eating healthy as a result of following Lap-Band procedural guidelines. Mean responses for all 5 components examined by the WEL Scale were close to 9 post-surgery, indicating that the patient felt more confident in her ability to control her eating habits after Lap-Band surgery than before the procedure.
Figure 2: Mean Responses to WEL Scale Items Pre and Post Surgery.
Further, in order to effectively compare the mean responses of answers given pre- and post-surgery, a Paired Samples T-Test was performed. The Paired Samples T-Test compares the means of two variables; it computes the difference between the two variables for each case, and tests to see if the average difference is significantly different from zero. The intent of this analysis was to see if the Lap-Band process resulted in a significant change in patient self-efficacy with regard to eating behaviors. The results of the T-test are presented in Table 2.

The Skinny on the Lap-Band: A Case Study
306
Table 2: Paired Samples T-Test
Pair
Paired Differences
t df
Sig.
(2-tailed) Mean Std.
Deviation
Std. Error Mean
95% Confidence Interval of the
Difference
Lower Upper
Pair 1: Pre –Negative Emotions
Post–Negative Emotions
-7.50 1.29 0.65 -9.55 -5.45 -11.62 3 .001
Pair 3: Pre–Social Pressure
Post–Social Pressure
-7.25 1.50 0.75 -9.63 -4.86 -9.67 3 .002
Pair 4: Pre–Physical Discomfort
Post–Physical Discomfort
-5.50 2.08 1.04 -8.81 -2.19 -5.28 3 .013
Pair 5: Pre–Positive Activities
Post–Positive Activities
-7.50 0.58 0.29 -8.42 -6.58 -25.98 3 .000
The correlation and t for Pair 2 (Pre- and Post-Availability) could not be computed because the standard error of the difference is 0.
Results of the Paired Samples T-test yielded a significant difference in the pre- and post-surgery responses to items presented in the WEL Scale. Specifically, these results indicate that the patient felt significantly more confident post-surgery to control her eating when faced with negative emotions, social pressures, and physical discomforts and while engaging in positive activities such as reading, watching TV, etc.
Qualitative Analysis
Physical Factors
The subject of this case study, Ms. Dorsey, is 5‘5‖ and began the Lap-Band process at 271 lbs with a BMI of 44.8. Due to her obesity, she experienced chronic joint pain, fatigue, and high cholesterol. As Ms. Dorsey wrote: ―I would fall asleep while driving, felt sluggish the majority of the time, and experienced pain when I walked.‖ During the six months prior to surgery, Ms. Dorsey began implementing the nutritional guidelines learned in the monthly counseling sessions and lost 22 pounds; she weighed 249 pounds on her date of surgery. Over the 11 months following the Lap-Band procedure, Ms. Dorsey had four adjustments and lost an additional 84 pounds, for a total weight loss of 106 pounds. Currently, she is 165 pounds, has a BMI of 26, and reports increased energy and vitality. As Ms. Dorsey states, ―I love walking around now because there is no pain.‖ Within one week of the surgery, Ms. Dorsey was able to return to work. The only negative side effect she experienced was heartburn, as her ―new stomach‖ was trying to adjust to the Lap-Band. She increased her physical activity gradually after the first week following surgery. By week three, she reported ease of moving around/walking. Her daily physical activity consisted of simple lifestyle changes such as taking the stairs instead of the elevator, parking her car far away from a building entrance so she would have to walk a good distance, and getting up and moving around at work every chance she got. Further, Ms. Dorsey followed the post-operative diet completely and currently continues to implement the Stage IV guidelines. As she wrote: ―Sometimes I forget that I need to consciously chew my food and savor each SMALL bite; and by the time I realize that I forgot, it‘s too late. My chest tightens and I know at that point I need to get rid of what I just ate and start over (yes, I have to vomit). Once I vomit I can continue consciously eating without gorging. My typical daily diet includes eggs or a bowl of Cream of Wheat for breakfast; chicken salad, egg salad, or soup for lunch; scrambled eggs or some other soy food for dinner; and unsalted peanuts, wasabi almonds, etc. for snacks.‖

B. K. Fralinger and A. Dorsey IHART - Volume 16 (2011)
307
Mental Factors
Prior to the Lap-Band process, Ms. Dorsey had attempted a variety of traditional weight loss strategies with little or no success. In her opinion, these strategies did not work because she was not cognitively prepared enough for them. With the Lap-Band procedure, Ms. Dorsey states, ―The six months of nutritional counseling was a blessing! I learned how to eat properly, how my body works with food and that everyone is different. I learned how to get in touch with myself and my eating. With previous diets, I had a tendency after losing weight to ‗fall off the wagon‘ and trick myself into thinking that if I ate a huge bowl of macaroni and cheese that I would work it off the next day; and I never did. I would mentally keep repeating that trickery every day until eventually the weight would come back tenfold.‖ By implementing the concepts taught in the pre-surgery counseling sessions before the procedure, Ms. Dorsey lost 22 pounds, which boosted her mental confidence to adhere to the guidelines post-surgery. At this point, she decided that once the Lap-Band was inserted, she would focus on losing 2 pounds a week from the start, as a smaller goal was more achievable in her mind than a larger one (e.g., 30 pounds per month). By cognitively focusing on 2 pounds per week, she felt mentally stronger each time she surpassed her goal, which occurred quite frequently in the first two months after surgery (she averaged about 5-6 pounds a week).
Emotional Factors
Throughout her childhood and teenage years, Ms. Dorsey was always at a healthy weight, but had a negative body image. Although she had an athletic build and participated in sports, she never accepted her body. She explains that a number of factors contributed to her negative perception of herself: ―My family would make constant remarks about my weight and body; I was always told that I needed to watch what I was eating and to hold my stomach in. At the same time, I was never exposed to healthy eating behaviors, as my family had the ‗buffet-style‘ mentality that it was bad not to eat all food put in front of you. It actually got to a point where I would feel guilty if we went out and I didn‘t finish a meal. Even if I felt full, I would wait a little while and force myself to eat everything so I wouldn‘t have the feelings of guilt.‖ Because Ms. Dorsey was involved in athletics and was physically active, she did not experience the negative effects of these eating patterns until she stopped playing sports after college and no longer was as active as she had previously been. When reflecting on this now, she states that because she did not have the foundation of a healthy relationship with food throughout her youth, once she became less active and her metabolism slowed, she gained weight. As a result, she had an even lower perception of her body and used food as a coping mechanism to comfort herself. She states that it was ―a vicious cycle of eating to cope with stressors and negative feelings about myself, feeling guilt after I would overeat, and then eating again to cope with those feelings of guilt.‖ Once she became obese and failed at multiple attempts at weight loss, Ms. Dorsey ―gave up‖ on herself and feared that no diet or weight loss regimen would work for her. When she decided to do the Lap-Band procedure, Ms. Dorsey wrote the following: ―I was excited and terrified; I was excited at the thought of losing weight and terrified that I might fail. Everyone I spoke to about the Lap-Band either knew someone who had the procedure or had heard a story about someone who did. There were stories of success and failure. However, the individuals who failed all had one thing in common - they did not follow the recommended diet and exercise guidelines and were expecting the band to do all of the work.‖ To keep motivated post-surgery, Ms. Dorsey surrounded herself with old pictures of when she was at a healthy weight. She stated that constantly seeing images of herself at a healthy weight kept her from getting discouraged. Also, she decided that she was not going to keep the fact that she had surgery a secret. As she wrote: ―I decided to tell my family and friends that I had the surgery because it gave me support. I posted progress pictures on Facebook and the comments from my friends kept me excited to stick with my diet. I feel like a lot of people fail at the Lap-Band process because they try to keep it a secret and have no one to ‗answer‘ to. I put it out there because I wanted to be an example and make myself accountable; when you're accountable to someone, you always end up succeeding.‖ Ms. Dorsey also said that her personal desire of becoming a spokesperson for the Lap-Band procedure to help other people who may choose this path was a motivational factor as well. Therefore, the support, encouragement, and accountability from friends along with her individual focus on a higher intention involving others aided Ms. Dorsey in the emotional coping process and increased her self-efficacy with regard to weight loss.
CONCLUSIONS
From this case study, we found that patient self-efficacy to control eating was significantly increased as a result of the Lap-Band surgery process. Overall, the patient reported greater physical, mental, and emotional well-being after the procedure. Our results indicate that if individuals undergoing the Lap-Band surgery follow all of the recommended guidelines provided by the

The Skinny on the Lap-Band: A Case Study
308
medical care team in pre- and post-operative counseling sessions, they have a great chance of success with this bariatric weight loss option.
LIMITATIONS
There are limitations to the present study which should be taken into account when interpreting these findings. First, this was a case study of one individual who had the Lap-Band surgery, so results may not be generalized to the public. Second, this exploratory study used a primarily qualitative design with limited quantitative components; therefore, measures of the physical, mental, and emotional factors surrounding the effectiveness of the Lap-Band procedure were based mostly on participant perceptions rather than through use of a variety of quantitative measures.
RECOMMENDATIONS
The purposes of the study were achieved in varying degrees. Of course, evaluation of one patient is insufficient to determine the usefulness of the Lap-Band process in achieving desired weight loss goals. More ‗experimentation‘ over a period of time and a broader base of subjects will be required. Further, use of more valid and reliable quantitative scales to measure the physical, mental, and emotional factors surrounding this bariatric option would add greater support to its effectiveness with weight loss and help determine whether this procedure increases self-efficacy to control eating habits.
REFERENCES
Abrams, D. B., & Niaura, R. S. (1987). Social learning theory. In H. T. Blane & K. E. Leonard (Eds.), Psychological theories of drinking and alcoholism (pp. 131-178). New York: Guilford Press.
Anderson, T., & Larsen, U. (1989). Dietary outcome in obese patients treated with a gastroplasty program. American Journal of Clinical Nutrition, 50, 1328–1340.
Bandura, A. (1977). Self-efficacy: Toward a unifying theory of behavior change. Psychological Review, 84, 191-215. Bariatric Center at the Palms of Pasadena Hospital, FL. (2010). Retrieved from
http://www.youtube.com/user/BariatricCareCenter Boeka, A.G., Prentice-Dunn, S., & Lokken, K. (2010). Psychosocial predictors of intentions to comply with bariatric surgery
guidelines. Psychology, 15(2), 188-197. Brownell, K. D, Marlatt, G. A., Lichtenstein, E., & Wilson, G. T. (1986). Understanding and preventing relapse. American
Psychologist, 41, 765-782. Buchwald, H., Avidor, Y., Braunwald, E., Jensen, M., Pories, W., Fahrbach, K., et al. (2004). Bariatric surgery: A systematic
review and meta-analysis. Journal of the American Medical Association, 292, 1724–1737. Centers for Disease Control. (2010). National Center for Health Statistics. Retrieved April 5, 2011 from
http://www.cdc.gov/nchs/hus.htm Clark, M., Abrams, D.B., & Niaura, R.S. (1991). Self-Efficacy in Weight Management. Journal of Consulting and Clinical
Psychology, 59(5), 739-744. Colwell, J. (2005). New ACP guidelines target obesity management. American College of Physicians, ACP Observer, April
edition. Coffey, A., & Atkinson, P. (1996). Making sense of qualitative data: Complementary research strategies. Thousand Oaks, CA:
Sage. Glynn, S. M., & Ruderman, A. J. (1986). The development and validation of an Eating Self-Efficacy Scale. Cognitive Therapy
and Research, 10, 403-420. Horn, J. L. (1965). A rationale and test for the number of factors in factor analysis. Psychametrika, 30, 179-185. Hsu, L., Bentancourt, S., & Sullivan, S. (1996). Eating disturbances before and after vertical banded gastroplasty: A pilot study.
International Journal of Eating Disorders, 19(1), 23–34. Jacob, A.V. (2002). Translating theory into practice: Self-efficacy and weight management. Healthy Weight Journal, Nov/Dec
Issue, 86-88. Lincoln, Y. S. & Guba, E. G. (1985). Naturalistic Inquiry. Beverly Hills, CA: Sage. MacLean, L.D., Rhode, B.M., & Shizgal, H.M. (1983). Nutrition following gastric operations for morbid obesity. Annals of
Surgery, 198, 347–355. Marlatt, G. A., & Gordon, J. R. (1985). Relapse prevention: Maintenance strategies in the treatment of addictive behaviors.
(Eds.). New York: Guilford Press. Marshall, C., & Rossman, G. B. (1999). Designing qualitative research (3rd ed.). Thousand Oaks, CA: Sage. Miles, M. B., & Huberman, A. M. (1994). Qualitative data analysis: An expanded sourcebook (2nd ed.). Thousand Oaks, CA:
Sage.

B. K. Fralinger and A. Dorsey IHART - Volume 16 (2011)
309
Mun, E., Blackburn, G., & Matthews, J. (2001). Current status of medical and surgical therapy for obesity. Gastroenterology, 120, 669–681.
O‘Brien, P.E., et al. (2003) LAP-BAND®: Outcomes and Results. J Laparoendosc Adv Surg Tech A., 13(4): 265-270. Parikh, M.S., Laker, S., Weiner, M., Hajiseyedjavadi, O., & Ren, C.J. (2006) Objective Comparison of Complications Resulting
from Laparoscopic Bariatric Procedures. J Am Coll Surg., 202(2): 252-261. Pettit, E. (2009). Treating Morbid Obesity. RN. Retrieved from http://www.modernmedicine.com/modernmedicine/
Modern+Medicine+Now/CE-Treating-morbid-obesity/ArticleStandard/Article/detail/581609 Sarwer, D.B., Wadden, T.A., Moore, R.H., Baker, A.W., Gibbons, L.M., Raper, S.E., et al. (2008). Preoperative eating
behavior, postoperative dietary adherence, and weight loss after gastric bypass surgery. Surgery for Obesity and Related Diseases, 4, 640–646.
SOCH. (2010). Patient Handbook. The Center for Bariatrics at Southern Ocean County Hospital. Strauss, A., & Corbin, J. (1988). The basics of qualitative research: Techniques and procedures for developing grounded
theory (2nd ed.). Thousand Oaks, CA: Sage. Velicer, W F (1976). Determining the number of components from the matrix of partial correlations. Psvchometrika, 11, 321-
327.

The Skinny on the Lap-Band: A Case Study
310
APPENDIX A
Weight Efficacy Lifestyle Questionnaire
Rate each of the items below on the following scale of 0 (not confident) to 9 (very confident).
1. I can resist eating when I am anxious (nervous) 0 1 2 3 4 5 6 7 8 9
2. I can control my eating on the weekends 0 1 2 3 4 5 6 7 8 9
3. I can resist eating even when I have to say ―no‖ to others 0 1 2 3 4 5 6 7 8 9
4. I can resist eating when I feel physically run down 0 1 2 3 4 5 6 7 8 9
5. I can resist eating when I am watching TV 0 1 2 3 4 5 6 7 8 9
6. I can resist eating when I am depressed (or down) 0 1 2 3 4 5 6 7 8 9
7. I can resist eating when there are many different kinds of food available 0 1 2 3 4 5 6 7 8 9
8. I can resist eating even when I feel it‘s impolite to refuel a second helping 0 1 2 3 4 5 6 7 8 9
9. I can resist eating even when I have a headache 0 1 2 3 4 5 6 7 8 9
10. I can resist eating when I am reading 0 1 2 3 4 5 6 7 8 9
11. I can resist eating when I am angry (or irritable) 0 1 2 3 4 5 6 7 8 9
12. I can resist eating even when I am at a party 0 1 2 3 4 5 6 7 8 9
13. I can resist eating even when others are pressuring me to eat 0 1 2 3 4 5 6 7 8 9
14. I can resist eating when I am in pain 0 1 2 3 4 5 6 7 8 9
15. I can resist eating just before going to bed 0 1 2 3 4 5 6 7 8 9
16. I can resist eating when I have experienced failure 0 1 2 3 4 5 6 7 8 9
17. I can resist eating even when high-calorie foods are available 0 1 2 3 4 5 6 7 8 9
18. I can resist eating even when I think others will be upset if I don‘t eat 0 1 2 3 4 5 6 7 8 9
19. I can resist eating when I feel uncomfortable 0 1 2 3 4 5 6 7 8 9
20. I can resist eating when I am happy 0 1 2 3 4 5 6 7 8 9

B. K. Fralinger and A. Dorsey IHART - Volume 16 (2011)
311
APPENDIX B
Qualitative Questionnaire
Directions: For each of the following questions, please provide as much feedback as possible on your overall thoughts, opinions, and experiences regarding the Lap-Band process and weight loss journey.
1. Height: 2. Starting weight: 3. Current weight: 4. Goal weight: 5. Starting BMI: 6. Starting blood pressure, cholesterol levels, health conditions: 7. Current blood pressure, cholesterol levels, health conditions: 8. Energy and vitality prior to surgery: 9. Energy and vitality now: 10. Amount of time you were overweight: 11. Previous diet methods prior to surgery: 12. Reason for choosing the lap band procedure: 13. Lap Band surgery date: 14. Preparation for surgery 15. Thoughts, feelings, and emotions in the weeks prior to surgery: 16. Day of surgery – procedures, length of time, etc.: 17. Recovery period – length of time, side effects (if any): 18. Thoughts, feelings, and emotions after surgery: 19. Lifestyle changes (diet, exercise, habits, etc.): 20. How the lap band affects your eating habits physically 21. Foods and amounts consumed during a typical day: 22. Progression of weight loss since the surgery (approximately how much weight lost in the beginning weeks, middle
weeks, and now): 23. Have you had the band tightened? If not, will you do so and when? 24. What has been the hardest part of the whole process? 25. What has been the best part of the whole process? 26. Do you feel confident that you will achieve your weight loss goals? Why or why not? 27. What keeps you motivated to stay on track with your lifestyle change? 28. Have you had any setbacks since the surgery? If so, explain what those were and how you got back on track.
Additional Comments:

F. Onyegbula, M. E. Dawson Jr. and J. Stevens IHART - Volume 16 (2011)
312
FACTORS AFFECTING CLOUD COMPUTING ACCEPTANCE IN ORGANIZATIONS: FROM MANAGEMENT TO THE END-USERS‟ PERSPECTIVES
Festus Onyegbula1, Maurice Eugene Dawson Jr.2 and Jeffery Stevens1
1Colorado Technical University, USA and 2Alabama A&M University, USA
ABSTRACT
Cloud computing as a new disruptive technology allows commercial, non-commercial, and governmental organizations to access resources and services outside the boundaries of their internal intranets. The fundamental goal of cloud computing is for organizations to be able to share resources, leveraging its capabilities, such as elasticity, on-demand, flexibility, and above all savings in Information Technology (IT). While cloud computing is still in its infancy stage, the need to understand its offering and acceptance has become a concern for end-users and IT management alike. The acceptance of cloud computing within the IT management communities tend to suggest that not all IT managers are embracing cloud computing as a result of apprehension found in other new technologies in the past. The goal of this research is therefore meant to look at some of the forces and variables that are hindering the acceptability of cloud computing within the IT manager‘s perspective as well as those of the end-users. The result of this research shall allow for further barriers to be broken down within the view of cloud computing and propose an architecture that allows for successful deployment within organizations. Keywords: Cloud Computing, Management Acceptance, End-User‘s Perspectives, Change Management.

W. Emanuel, C. Dickens and M. E. Dawson Jr. IHART - Volume 16 (2011)
313
APPLYING OBJECT ORIENTATED ANALYSIS DESIGN TO THE GREATER PHILADELPHIA INNOVATION CLUSTER (GPIC) FOR
ENERGY EFFICIENT BUILDINGS
William Emanuel1, Corey Dickens1 and Maurice Eugene Dawson Jr.2 1Morgan State University, USA and 2Alabama A&M University, USA
ABSTRACT
Over the last few decades scientists have been trying to develop ways in decreasing human‘s carbon foot print on the planet. This is simply because of the Greenhouse Effect, air pollution, water pollution, acid rain, and the growing ozone hole over the Antarctic, to name a few issues. These issues come from the built environment which is everything engineers and scientists develop to make humans comfortable. Advance technology is directly connected to the increase amounts of carbon found in the atmosphere. Scientists noticed that transportation and power generating stations were the major polluters on the planet. The main solution is to develop green technology which includes bio-fuels and renewable energy sources. For transportation we develop bio-fuel, car fuel efficiency and electric cars. For power generating stations renewable energy sources are used like solar, wind, bio-fuel, geo-thermal, hydro and fuel cells. As the population of the earth increases from 6.5 billion to 10 billion by 2050 the increase use of cars and energy consumption will increase proportionately. This paper will take a concentrate on the area of energy consumption. One of the largest consumption of energy is found in buildings. Engineers and scientists are addressing the issue of energy efficient buildings to reduce the amount of energy consumption.
One of the first ways in developing energy efficient buildings was by developing a solar neighborhood in Gardner MA back in the early 1980‘s. This demonstrated the possibility for large scale deployment of renewable energy systems outside the utility companies. This was the first energy independent community. The solar electric system used was a photovoltaic (PV) system. The world‘s first solar powered neighborhood retrofitted buildings in a residential subdivision with businesses, like Burger King, furniture retailer, Town Hall and Town Library. This model is now over 25 years old and is proof that the concept of harvesting clean energy from the sun without disrupting the local utility‘s distribution network works. This proved to be a guide and training for PV installers and electricians in the future. This $1.25 million dollars project has given us a glimpse of what the future could hold for sustainable energy systems.

Applying Object Orientated Analysis Design to the Greater Philadelphia Innovation Cluster (GPIC) for Energy Efficient Buildings
314
Over the years it has been recognized that building energy efficiency should be coupled with renewable energy systems to get optimize our results. This would take into effect the whole building design. The orientation of the build in relationship with the sun, green roof for insulation, passive solar for hot water heating system, energy efficient lighting system, high efficiency insulation, also ventilation and air conditioning (HVAC) system. NASA has a sustainable program for building energy efficiency called green space. DOE has now joined the group by adding GPIC project. A cornerstone of the Navy Yard redevelopment effort is to develop a Clean Energy Campus, where GPIC would like to develop a critical part. Its aim is to make the Philadelphia Navy Yard a national center of excellence for energy research, education, and commercialization. DOE would like to have a Clean Energy Campus which will one day house:
The DOE Mid Atlantic Clean Energy Applications Center
The DOE Northern Mid Atlantic Solar Training Center
The DOE Grid Smart Training Applications Resource (GridSTAR) Center Morgan is part of this project and we will be using Object Orientated Analysis Design to model GPIC project at Morgan State University. Keywords: Built Environment, Energy Efficiency, System Development Life Cycle, Textual Analysis, Sequence Diagram.

M. E. Dawson Jr., M. A. Crespo and D. N. Burrell IHART - Volume 16 (2011)
315
DEVELOPING THE NEXT GENERATION OF CYBER WARRIORS AND INTELLIGENCE ANALYSTS
Maurice Eugene Dawson Jr.1, Miguel Angel Crespo2 and Darrell Norman Burrell3
1Alabama A & M University, USA, 2Norwich University, USA and 3A.T. Still University, USA
ABSTRACT
As the United States of America (USA) is continually creating more major government commands for cyber security without the appropriate personnel to fill slots we can prepare a generation that has been under represented with the appropriate skillets to meet an ever growing demand. With technology costs also continuously rising Open Source Software (OSS) is a solution that allows these students to maximize their technology learning experience. This software can be used to create a rigorous curriculum that aids in the development cyber warriors and intelligence analysts for the future. Through OSS fundamentals of intelligence analysis, dissemination, gathering, system penetration testing, and defense in depth can be taught. Curriculum in the primary and secondary schools can be accommodated to add in small portions of items taught in the Intelligence Community (IC) to gear students in a direction that will lead in a career in the IC. These types of career direction will result in the engineering or sciences which the USA currently lacks overall. This will allow the science and engineering ranks of the government to remain strong and competitive on a global scale. Keywords: Intelligence Analysis, Cyber Security, Information Assurance, Talent Management.
R. D. V. Barredo IHART - Volume 16 (2011)
316
A QUALITATIVE STUDY OF RECURRENT THEMES FROM THE CONDUCT OF DISABILITY SIMULATIONS BY DOCTOR OF PHYSICAL THERAPY STUDENTS
Ronald De Vera Barredo
Tennessee State University, USA
PURPOSE
The purposes of the study were threefold: first, to extract recurrent themes from reflection papers written by students in the Doctor of Physical Therapy (DPT) program who have undergone disability simulations; second, to ascribe through the inductive process prospective meanings attached with these recurrent themes; and third, to ascertain whether or not these recurrent themes occur randomly or follow a pattern as described by the students.
SUBJECTS
Reflection papers of seventy students from the graduating classes of 2009, 2010, and 2011 were used in the study. The reflection papers were written after DPT students in the second year of the program underwent disability simulations as a course requirement.
METHODS
The study was conducted using the grounded theory approach, where a theory is inductively built from a corpus of textual data. Students in their second year of the DPT program were required to assume the role of someone with a disability in the community. With faculty guidelines on the type and extent of disability, the students were instructed that the simulation should last for at least two hours. After the exercise, students wrote open papers about the experience; no other directives were given with the writing activity, except for the students to write openly and frankly about the experience. For this study, the reflection papers of students in the DPT program who have undergone disability simulations served as the textual database.
ANALYSIS
Consistent with the grounded theory approach, thematic analysis was used to uncover recurrent patterns of thought or action. These patterns were then open coded to identify emergent themes or meanings. Finally, the emergent themes were reviewed to ascertain sequential patterns, if any existed.
RESULTS
Data analysis yielded four emergent themes. These include: (1) conflict in student expectations prior to and during the simulation, (2) opposition and ridicule from friends and family regarding the exercise, (3) student recognition of the impact of disability and its consequent strain on their personal lives and support systems, and (4) acknowledgment not only of the complexity and but also of the challenges that individuals with disabilities face.
Conflict in Student Expectations
The first theme revolved around the conflict in student expectations prior to and during the simulation. This theme highlighted the diametric opposition between the students‘ preconceived notions and the reality of what they have experienced. The pattern of thought could be illustrated as follows: ―I originally thought…, however, during the exercise, I realized…‖
Opposition and Ridicule from Friends and Family
The second theme revolved around reactions of family and friends regarding the exercise. This theme highlighted the mindset of others not involved with the disability simulation, and how this type of mindset may be contributory to the development of preconceived notions about disability. Statements such as ―You won‘t really know how it feels unless you have it‖ or ―My family does not see the value in this‖ were typical of this theme.
A Qualitative Study of Recurrent Themes from the Conduct of Disability Simulations by Doctor of Physical Therapy Students
317
Student Recognition of the Impact of Disability
The third theme revolved around students recognizing the impact of disability in their daily living. This theme became the ―light-bulb‖ moment in the students‘ thinking when experiential learning took place. More specifically, this theme bridged the gap between two different constructs in the disablement framework—how impairments lead to or result in functional limitations.
Acknowledgement of the Complexity and the Challenges
The fourth theme revolved around students acknowledging the complexity and the challenges that individuals with disabilities face both at home and in the community. This theme provided the students the impetus needed not only to provide appropriate care, but also to advocate for the needs or concerns of individuals with disabilities. The pattern of thought could be illustrated as follows: ―Now that I know…, I will…‖
CONCLUSIONS
A thematic analysis of the reflection papers by doctor of physical therapy students who have undergone disability simulations yielded the following four themes: (1) conflict in student expectations prior to and during the simulation, (2) opposition and ridicule from friends and family regarding the exercise, (3) student recognition of the impact of disability and its consequent strain on their personal lives and support systems, and (4) acknowledgment not only of the complexity and but also of the challenges that individuals with disabilities face. Of these four themes, frequency counts revealed that themes 1, 3, and 4 were the most recurrent. Moreover, when viewed structurally in the text these themes appear in the same sequential order: conflict, followed by recognition, followed by acknowledgement.
CLINICAL RELEVANCE
As prospective clinicians, physical therapy students need to develop a basic understanding of the disablement process beyond the letters in a textbook or the lectures in class. In order to empathize better with the patients with whom they will interact, students have to experience disabilities firsthand. Disability simulations appear to provide the mechanism needed to achieve this end. Keywords: Disability Simulation, Grounded Theory, Thematic Analysis.

A. H. King IHART - Volume 16 (2011)
318
RICH EATING WITH A POOR INCOME: CAN THE POOR AFFORD TO EAT A HEALTHY DIET?
Anita H. King
University of South Alabama, USA
ABSTRACT
The historical downturn of the United States economy has presented serious concerns to many of those with diabetes. Diabetes expenses for medication and supplies can average $6000 annually. A healthy diet and exercise are cornerstone treatments for diabetes. Unfortunately many with diabetes have the misperception that healthy foods are not affordable. They often have a lack of knowledge of what foods to eat for diabetes control. This presentation is based on the Health Promotion Model by Nola Pender with a focus on increasing the client's level of well-being. The Health Promotion Model addresses situational influences that can assist with the client regulating their own behavior. The speaker has an extensive background with as a certified diabetes educator and nurse practitioner and is committed to positive behavioral outcomes that result from fundamental knowledge of diabetes care. The speaker currently volunteers at a local clinic for the indigent population where she manages diabetes care for the poor and the "new poor". The speaker will discuss who the low income are and who are the "new poor", community resources, criteria and drawbacks of food stamps, and survival tactics for healthy eating while on a "shoestring budget". The one hour presentation will also discuss the "train the trainer" concept of providing nutritional education and meal planning for the low income population. Nurses play a pivotal role in providing care and education to the individual with diabetes. The presentation will provide practical information that is appropriate for the nurse at all levels of care. The speaker will conclude with actual case scenarios and interactive audience participation. Learning objectives are: I. Compare and contrast community programs that can assist the low-income with healthy food choices.
II. List at least 6 survival tactics for the low-income population to maintain a healthy diabetes diet. III. Outline a teaching plan to "train the trainer" in budget friendly meal planning.

P. Skorga IHART - Volume 16 (2011)
319
EXPLORING ALZHEIMER‟S DISEASE FROM THE PERSPECTIVE OF PATIENTS AND CAREGIVERS
Phyllis Skorga
Arkansas State University- Jonesboro, USA
ABSTRACT
Dementia has been broadly defined by many as the gradual and progressive decline of cognitive function, and may be caused by numerous diseases and conditions. Of the various forms of dementia, the most prevalent is Alzheimer‘s Dementia (AD), which affects more than 5.3 million and is the 7th leading cause of death in America. AD is characterized by difficulty remembering names and recent events, apathy and depression, impaired judgment, disorientation, confusion, behavior changes, and difficulty speaking, swallowing and walking. In Arkansas, there has been a 7% increase in rate of Alzheimer‘s disease since 2000 with a 36% projected increase by 2025. This health problem is overwhelming in scope and is growing for patients, families and caregivers. The purpose of this qualitative study is to understand better the phenomena of Alzheimer‘s disease from the perspective of patient and caregiver. Using phenomenology the collective voices of patients and caregivers attending an Alzheimer‘s program in rural Arkansas are analyzed using content analysis techniques. Investigators will objectively and systematically identify and present specific characteristics of the messages. Keywords: Alzheimer‘s Disease, Dementia, Lived Experience of Alzheimer‘s.

CALL FOR ACADEMIC PAPERS AND PARTICIPATION Intellectbase International Consortium Academic Conferences
TEXAS – USA March
Nashville, TN – USA May
Puerto Rico – USA July
Atlanta, GA – USA October
Las Vegas, NV – USA December
International Locations Summer
Abstracts, Research-in-Progress, Full Papers, Workshops, Case Studies and Posters are invited!!
All Conceptual and Empirical Papers are very welcome.
Email all papers to: [email protected]
All submitted papers must include a cover page stating the following: location of the conference, date, each author(s) name, phone, e-mail, full affiliation, a 200 - 500 word Abstract and Keywords. Please send your submission in Microsoft Word format. Intellectbase International Consortium provides an open discussion forum for Academics, Researchers, Engineers and Practitioners from a wide range of disciplines including, but not limited to the following: Business, Education, Science, Technology, Multimedia, Arts, Political, Social - BESTMAPS.
Categories Page Limit Single Spaced
Word Count Approximate
Fonts & Size Document Format
FULL PAPERS 7 – 15 5000 - 7000 Arial Narrow
Title - Bold, Centered, 16, All Capital Letters
Heading 1 – Left, 14, All Capital Letters
Heading 2 – Left, 13, Capitalize each word
Body – Left Aligned, 11
All Margins 3/4 inches Or 1.9 cm
Reference - Normal 11
MS Word / Rich Text
Harvard Style Or APA Referencing
RESEARCH-IN-PROGRESS 5 - 12 2500 - 5000
EXTENDED ABSTRACTS 1 - 4 500 - 1500
WORKSHOPS 2 - 5 1000 - 3000
CASE STUDIES 3 - 10 1500 - 5000
POSTERS A3 Paper Size Research Title, Research Model or Framework N/A
By submitting a paper, authors implicitly assign Intellectbase the copyright license to publish and agree that at least one (if more authors) will register, attend and participate at the conference to present the paper. All submitted papers are peer reviewed by the Reviewers Task Panel (RTP) and accepted papers are published in a refereed conference proceeding. Articles that are recommended to the Executive Editorial Board (EEB) have a high chance of being published in one of the Intellectbase double-blind reviewed Journals. For Intellectbase Journals and publications, please visit: www.intellectbase.org/Journals.php
Intellectbase Journals are listed in major publication directories: e.g. Cabell's, ProQuest, ABDC, Ulrich's Directory and JournalSeek and available through EBSCO Library Services. In addition, Intellectbase Journals are in the process to be listed in the following databases: EBSCO Discovery Service, ABI Inform, CINAHL, ACADEMIC JOURNALS DATABASE, Thomson SCI, Thomson SSCI and ERIC. For more information concerning conferences and Journal publications, please visit the Intellectbase website at www.intellectbase.org. For any questions, please do not hesitate to contact the Conference Chair at [email protected] Note: Intellectbase International Consortium prioritizes papers that are selected from Intellectbase conference proceedings for Journal publication. Papers that have been
published in the conference proceedings, do not incur a fee for Journal publication. However, papers that are submitted directly to be considered for Journal publication will incur a US$195 fee to cover the cost of processing, formatting, compiling, printing, postage and handling if accepted. Papers submitted direct to a
Journal may be emailed to [email protected] or e.g. [email protected], [email protected], etc.
INTELLECTBASE DOUBLE-BLIND REVIEWED JOURNALS
Intellectbase International Consortium promotes broader intellectual resources and publishes reviewed papers from
all disciplines. To achieve this, Intellectbase hosts approximately 4-6 academic conferences per year and publishes
the following Double-Blind Reviewed Journals and more (http://www.intellectbase.org/journals.php).
JAGR, Journal of Applied Global Research - ISSN: 1940-1833 (Print)
- ISSN: 1940-1833 (CD-ROM)
- ISSN: 1940-1833 (Online)
IJAISL, International Journal of Accounting Information Science and Leadership - ISSN: 1940-9524 (Print)
- ISSN: 1940-1833 (CD-ROM)
- ISSN: 1940-1833 (Online)
RHESL, Review of Higher Education and Self-Learning - ISSN: 1940-9494 (Print)
- ISSN: 1940-1833 (CD-ROM)
- ISSN: 1940-1833 (Online)
IJSHIM, International Journal of Social Health Information Management - ISSN: 1942-9664 (Print)
- ISSN: 1940-1833 (CD-ROM)
- ISSN: 1940-1833 (Online)
RMIC, Review of Management Innovation and Creativity - ISSN: 1934-6727 (Print)
- ISSN: 1940-1833 (CD-ROM)
- ISSN: 1940-1833 (Online)
JGIP, Journal of Global Intelligence and Policy - ISSN: 1942-8189 (Print)
- ISSN: 1940-1833 (CD-ROM)
- ISSN: 1940-1833 (Online)
JISTP, Journal of Information Systems Technology and Planning - ISSN: 1945-5240 (Print)
- ISSN: 1940-1833 (CD-ROM)
- ISSN: 1940-1833 (Online)
JKHRM, Journal of Knowledge and Human Resource Management - ISSN: 1945-5275 (Print)
- ISSN: 1940-1833 (CD-ROM)
- ISSN: 1940-1833 (Online)
Please visit Intellectbase International Consortium website (www.intellectbase.org) for more information and
details.Journal images are available on the back cover of the conference proceedings.

IJEDAS-International Journal
of Electronic Data
Administration and Security
JIBMR-Journal of International
Business Management &
Research
JOIM-Journal of Organizational
Information Management
JISTP-Journal of Information
Systems Technology and
Planning
RMIC-Review of Management
Innovation and Creativity
JGIP-Journal of Global
Intelligence and Policy
IJAISL-International Journal of
Accounting Information
Science and Leadership
JAGR-Journal of Applied Global
Research
IJSHIM-International Journal
of Social Health Information
Systems Management
RHESL-Review of Higher
Education and Self-Learning
For information about Intellectbase International Consortium and associated journals of the conference, please visit www.intellectbase.org
B E S T M A P S
MULTI-DISCIPLINARY
FOUNDATIONS & INTELLECTUAL
PERSPECTIVES
EDUCATION
BUSINESS
SOCIAL
POLITICAL
ADMINISTRATION
MANAGEMENT
TECHNOLOGY
SCIENCE
JWBSTE-Journal of Web-Based
Socio-Technical Engineering
JKHRM-Journal of Knowledge
and Human Resource
Management
IHPPL-Intellectbase Handbook
of Professional Practice and
Learning
JGISM-Journal of Global Health
Information Systems in
Medicine


