Embed Size (px)
Citation preview
AANN
CentMi
NU2
tral Pinistry
W
UAL201
Pollutiof Env
Website
L R10-
ion Cvironmee: cpcb.
REP-11
ontroent & Fnic.in
PO
ol BoaForests
ORT
ard
s
T
CPCB (English), 300 copies
Published by : PR Division on behalf of Shri J.S. Kamyotra, Member Secretary,
CPCB Delhi-32
Text Compilation & Editing : Dr. C.S. Sharma, Shri S. Suresh, Shri V.P. Yadav
Shri Nazimuddin & Ms. Anamika Sagar
Printing Supervision & Layout: Shri S. Suresh, Ms. Anamika Sagar & Satish Kumar
Printed at : Chandu Press, 63, Patparganj Industrial Area, Delhi-92
Chapter Title Page No.
I Introduction 1
II Constitution of the Central Board 4
III Meetings of the Central Board 5
IV Committees constituted by the Board and their activities 7
V Air and water quality monitoring network 10
VI Present state of environment, environmental problems and
counter measures 55
VII Environmental research 82
VIII Environmental training 88
IX Environmental awareness and public participation 92
X Environmental standards including schedule for their
enforcement 100
XI Prosecutions launched, convictions secured and directions
given for closure of polluting industries 129
XII Finance and accounts 145
XIII Annual action plan for the year 2011 – 2012 146
XIV Other important activities dealt by CPCB 153
APPENDICES
CONTENTS

Page | 1
CHAPTER I
INTRODUCTION
Under the provisions of The Water (Prevention & Control of Pollution) Act, 1974, the Central Government constituted the ‘Central Board for the Prevention and Control of Water Pollution’ on September 23, 1974. The name of the Central Board was amended to Central Pollution Control Board (CPCB) under the Water (Prevention & Control of Pollution) Amendment Act, 1988 (No. 53 of 1988). The Central Pollution Control Board has been entrusted with the added responsibilities of Air Pollution Control since May, 1981 under the provisions of the Air (Prevention and Control of Pollution) Act, 1981. The enactment of the Environment (Protection) Act, 1986, which is umbrella legislation for enforcement of measures for protection of environment and several notifications of Rules under the Act, widened the scope of activities of the Central Board. The CPCB has been continuously playing a key role in abatement and control of pollution in the country by generating, compiling and collating data, providing scientific information, rendering technical inputs for formation of national policies and programmes, training and development of manpower and through activities for promoting awareness at different levels of the Government and Public at large. 1.1 FUNCTIONS OF THE CENTRAL BOARD The main functions of CPCB, as spelt out in The Water (Prevention and Control of Pollution) Act, 1974, and The Air (Prevention and Control of Pollution) Act, 1981, are: (i) To promote cleanliness of streams and wells in different areas of the States
through prevention, control and abatement of water pollution; and,
(ii) To improve the quality of air and to prevent, control or abate air pollution in
the country.
In addition to the main functions of promoting cleanliness of streams and wells, improving the quality of air and to prevent, control or abate air pollution, CPCB has been assigned following National Level functions: Advise the Central Government on any matter concerning prevention and
control of water and air pollution and improvement of the quality of air;
Page | 2
Plan and cause to be executed a nation-wide programme for the prevention, control or abatement of water and air pollution;
Co-ordinate the activities of the State Boards and resolve disputes among them;
Provide technical assistance and guidance to the State Boards, carry out and sponsor investigations and research relating to problems of water and air pollution, and for their prevention, control or abatement;
Plan and organise training of persons engaged in programmes for prevention, control or abatement of water and air pollution;
Organise through mass media, a comprehensive mass awareness programme on prevention, control or abatement of water and air pollution;
Collect, compile and publish technical and statistical data relating to water and air pollution and the measures devised for their effective prevention, control or abatement;
Prepare manuals, codes and guidelines relating to treatment and disposal of sewage and trade effluents as well as for stack gas cleaning devices, stacks and ducts;
Disseminate information in respect of matters relating to water and air pollution and their prevention and control;
Lay down, modify or annul, in consultation with the State Governments concerned, the standards for stream or well, and lay down standards for the quality of air;
Establish or recognize laboratories to enable the Board to perform, and; Perform such other functions as and when prescribed by the Government of
India. 1.2 FUNCTIONS OF THE CENTRAL BOARD AS STATE BOARD FOR THE
UNION TERRITORIES Advise the Governments of Union Territories with respect to the suitability of
any premises or location for carrying on any industry which is likely to pollute a stream or well or cause air pollution;
Lay down standards for treatment of sewage and trade effluents and for emissions from automobiles, industrial plants, and any other polluting source;
Evolve efficient methods for disposal of sewage and trade effluents on land; Develop reliable and economically viable methods for treatment of sewage,
trade effluents and air pollution control equipment; Identify any area or areas within Union Territories as air pollution control area
or areas to be notified under The Air (Prevention and Control of Pollution) Act, 1981; and
Assess the quality of ambient air and water, and inspect wastewater treatment
Page | 3
installations, air pollution control equipment, industrial plants or manufacturing processes to evaluate their performance and to take steps for the prevention, control and abatement of air and water pollution.
1.3 DELEGATION OF POWERS BY CENTRAL POLLUTION CONTROL BOARD As per the policy decision of the Government of India, the Central Pollution Control Board, delegated its powers and functions from time to time under Section 4, Sub Section 4 of The Water (Prevention and Control of Pollution) Act, 1974 and Section 6 of The Air (Prevention and Control of Pollution) Act, 1981 with respect to various Union Territories to respective Pollution Control Committees under the administrative control of local Administration (Annexure-I).
* * *
Page | 4
CHAPTER II
CONSTITUTION OF THE CENTRAL BOARD
2.1 According to the provisions of The Water (Prevention & Control of Pollution) Act, 1974, the Central Board consists of the following members:
a full-time Chairman, being a person having special knowledge or practical experience in respect of matters relating to environmental protection or a person having knowledge and experience in administering institutions dealing with the matters aforesaid, to be nominated by the Central Government;
such number of officials, not exceeding five, to be nominated by the Central Government to represent Government;
such number of persons, not exceeding five, to be nominated by the Central Government, from amongst the members of the State Boards, of whom not exceeding two shall be from amongst the members of the local authorities;
such number of non-officials, not exceeding three to be nominated by the Central Government, to represent the interest of agriculture, fishery or industry or trade or any other interest which, in the opinion of the Central Government, ought to be represented;
two persons to represent the companies or corporations owned, controlled or managed by the Central Government, to be nominated by the Government; and
a full-time Member Secretary, possessing qualifications, knowledge and experience of scientific, engineering or management aspects of pollution control, to be appointed by the Central Government.
2.2 List of Board Members during year 2010 -2011 is provided at Annexure-II.
The organisation structure of the Central Pollution Control Board is provided at Annexure-III. Staff strength as on March 31, 2011 is furnished in Annexure-IV & V.
* * *
Page | 5
CHAPTER III
MEETINGS OF CENTRAL POLLUTION CONTROL BOARD
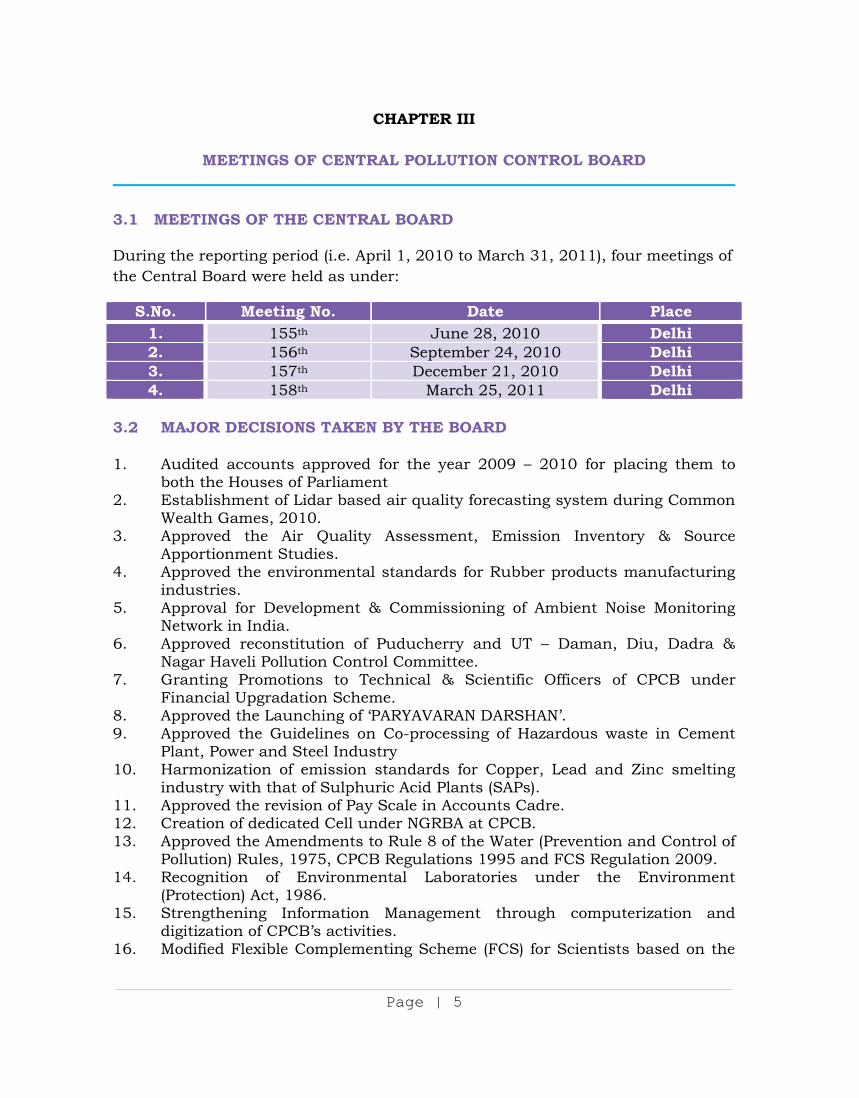
3.1 MEETINGS OF THE CENTRAL BOARD During the reporting period (i.e. April 1, 2010 to March 31, 2011), four meetings of the Central Board were held as under:
S.No. Meeting No. Date Place1. 155th June 28, 2010 Delhi2. 156th September 24, 2010 Delhi3. 157th December 21, 2010 Delhi4. 158th March 25, 2011 Delhi
3.2 MAJOR DECISIONS TAKEN BY THE BOARD 1. Audited accounts approved for the year 2009 – 2010 for placing them to
both the Houses of Parliament 2. Establishment of Lidar based air quality forecasting system during Common
Wealth Games, 2010. 3. Approved the Air Quality Assessment, Emission Inventory & Source
Apportionment Studies. 4. Approved the environmental standards for Rubber products manufacturing
industries. 5. Approval for Development & Commissioning of Ambient Noise Monitoring
Network in India. 6. Approved reconstitution of Puducherry and UT – Daman, Diu, Dadra &
Nagar Haveli Pollution Control Committee. 7. Granting Promotions to Technical & Scientific Officers of CPCB under
Financial Upgradation Scheme. 8. Approved the Launching of ‘PARYAVARAN DARSHAN’. 9. Approved the Guidelines on Co-processing of Hazardous waste in Cement
Plant, Power and Steel Industry 10. Harmonization of emission standards for Copper, Lead and Zinc smelting
industry with that of Sulphuric Acid Plants (SAPs). 11. Approved the revision of Pay Scale in Accounts Cadre. 12. Creation of dedicated Cell under NGRBA at CPCB. 13. Approved the Amendments to Rule 8 of the Water (Prevention and Control of
Pollution) Rules, 1975, CPCB Regulations 1995 and FCS Regulation 2009. 14. Recognition of Environmental Laboratories under the Environment
(Protection) Act, 1986. 15. Strengthening Information Management through computerization and
digitization of CPCB’s activities. 16. Modified Flexible Complementing Scheme (FCS) for Scientists based on the
Page | 6
recommendations of the 6th Central Pay Commission. 17. Approved Action Plan along with the Budget Estimate (BE) for the year
2011– 2012. 18. Approved the Recruitment Rules for the Post of Chairman, Central Pollution
Control Board. 3.3 CONFERENCES 3.3.1 NATIONAL CONFERENCE OF CHAIRMEN & MEMBER SECRETARIES The 56th Conference of Chairmen & Member Secretaries of CPCB/SPCBs/PCCs was organized during August 31, 2010 at “Ashoka Hotel”, New Delhi. Over 150 participants from 32 State/UTs, MoEF and CPCB attended the Conference. The major issues discussed during the conference are as follows:
Updated Inventorisation of (a) 17 categories of highly polluting industries, (b) grossly water polluting industries and (c) red categories of industries.
Waste Management. Implementation of Ambient Air Quality Standards and increase of
Ambient Air Quality Monitoring Network and Technological redressal. Implementation of Noise Rules – discussion on Zoning Classification and
establishment of Noise Monitoring Network. Status of Action Plans for Critically Polluted Industrial Clusters. Online Emission Monitoring of 17 categories of industries. Environmental audit of industries and involvement of third party in
environmental performance monitoring. Online consent mechanism and computerization of SPCBs and PCCs. Strengthening of Pollution Control Board / Committees. Environmental Performance Index and Ranking of States. As a follow-up
- Working groups have been constituted.
3.4 VISITS OF DIGNITARIES TO CPCB
Visit of Shri R.H. Khwaja, Special Secretary, Ministry of Environment & Forests, Govt. of India, to Central Pollution Control Board on June 14, 2010
Visit of Secretary (Environment and Forest) of Ministry of Environment & Forests, Govt. of India, to CPCB on August 27, 2010.
Visit of Shri T. Chatterjee, OSD, Ministry of Environment & Forests, Govt. of India, to CPCB on November 24, 2010.
* * *
Page | 7
CHAPTER IV
COMMITTEES CONSTITUTED BY THE BOARD & THEIR ACTIVITIES
4.1 EXPERT COMMITTEE ON NOISE POLLUTION CONTROL IN IGI AIRPORT, DELHI An expert committee has been constituted by Central Pollution Control Board on Noise Pollution Control in and around Indira Gandhi International (IGI) Airport, Delhi. The expert committee advised Central Pollution Control Board on the following issues related to noise pollution caused due to movement of aircraft in and around IGI airport.
a) To guide the working group on technical aspects for assessment of noise
problem in the vicinity of Indira Gandhi International (IGI) Airport. b) To develop the methodology including identification of noise monitoring
equipments, monitoring location and number of monitoring stations required for the study
c) To propose the noise monitoring network at the IGI airport. d) To evaluate and interpret the data generated from noise monitoring. e) To examine the noise impact due to activities other than the aircraft noise. f) To advise in preparation of noise contour / noise mapping of area and
assess the correctness. g) To finalize the short term and long term measures required for the
abatement of noise at IGI Airport. h) To prepare an action plan for abatement of noise from sources other than
aircraft. i) To assist in finalization of the comprehensive report of the study.
It was decided by the expert committee to engage an expert agency for conducting noise monitoring and noise contour mapping in and around IGI airport. The study proposal including tender document has been prepared accordingly. 4.2 COMMITTEE ON NATIONAL AMBIENT NOISE MONITORING PROGRAMME (NANMP) Consequent upon the announcement by Hon’ble Minister for Environment & Forests, Government of India in January, 2010 in New Delhi for setting up of a National Ambient Noise Monitoring Network.
Page | 8
CPCB is in the process of developing Noise Monitoring Network in India and has planned for installation of Real Time Ambient Noise Monitoring Network in seven cities Delhi, Kolkata, Mumbai, Chennai, Bangalore, Hyderabad and Lucknow by 2010. A Committee comprising of the following members to supervise the procurement and installation of the noise monitoring systems has been constituted: 1. Sh. R.S. Kori, Additional Director - Chairman 2. Dr. D.D. Basu, SS - Member 3. Sh. A.K. Sinha, Scientist 'C' - Member 4. Sh. G. K. Mendiratta, Technical Expert- Member 5. Sh. Virendra Bansal, AAO - Member 6. Sh. M. Verghese AO (M) - Member Convener Terms of Reference of the Committee are as follows:
• Opening & Evaluation of the Bid for NANMP as per Tender Document;
• Preparation of the Comparative statement;
• Identifying the party/organisation for placement of order;
• Supervising the installation & performance of the system;
• Tenure of the Committee six months and
• Sitting Allowance of Rs. 1000/- per meeting alongwith local conveyance as
per actual for non-official member.
4.3 CONSTITUTION OF A TEAM OF EXPERTS IN COMPLIANCE WITH THE
ORDER OF HON’BLE HIGH COURT OF ALLAHABAD DATED 08.12.2010 IN THE MATTER OF PIL NO. 4003 OF 2006
The tanneries because of their pollution potential in Kanpur located on the bank of river Ganga impact the water quality of river. The Hon’ble High Court of Allahabad in its Order passed on 08.12.2010 in the matter of PIL No. 4003 of 2006 directed CPCB constitute a team of Expert and get an spot inspection done at Kanpur for ascertaining the reasons for discharge of Chromium, functioning of CETP and STP at Kanpur and for suggesting concrete solutions to ensure that waste/dirty water does not enter in river Ganges at Kanpur. Consequent upon the above directions of the Hon’ble High Court of Allahabad dated 08.12.2010, Central Pollution Control Board (CPCB) constituted a team of following officers to investigate the matter by Office Order dated December 30, 2010.
Page | 9
Mr. U. N. Singh, Scientist ‘E’ & In-charge PCI (SSI) Division, CPCB Dr. M. Q. Ansari, Scientist ‘E’ & In-charge Zonal Office (North), CPCB Mr. Gurnam Singh, Scientist ‘D’, Zonal Office (North), CPCB Mr. V. P. Yadav, Scientist ‘D’, Coordination Cell, CPCB Mr. Nazim uddin, Scientist ‘D’, PCI (SSI) Division, CPCB Mr. R. K. Singh, Scientist ‘C’, Zonal Office (North), CPCB
The Team members visited the site at Kanpur on 23.12.2010, 28.12.2010, 07.01.2011 and 08.01.2011, conducted investigations, collected samples and held discussion with officers of the concerned local authorities. Based on the observations/findings of the Team, a report was submitted before the Hon’ble High Court of Allahabad.
* * *
Page | 10
CHAPTER V
AIR AND WATER QUALITY MONITORING NETWORK
5.1 WATER QUALITY MANAGEMENT IN INDIA 5.1.1 National Water Quality Monitoring Programme In order to assess the nature and extent of pollution control needed in different water bodies or their part, water quality monitoring is an imperative prerequisite. Central Pollution Control Board in collaboration with State Pollution Control Boards has established a Water Quality Monitoring Network with following objectives:
• For rational planning of pollution control strategies and their prioritisation • To evaluate effectiveness of pollution control measures already in existence • To evaluate water quality trend over a period of time • To assess assimilative capacity of a water body thereby reducing cost on
pollution control • To understand the environmental fate of different pollutants • To assess the fitness of water for different uses
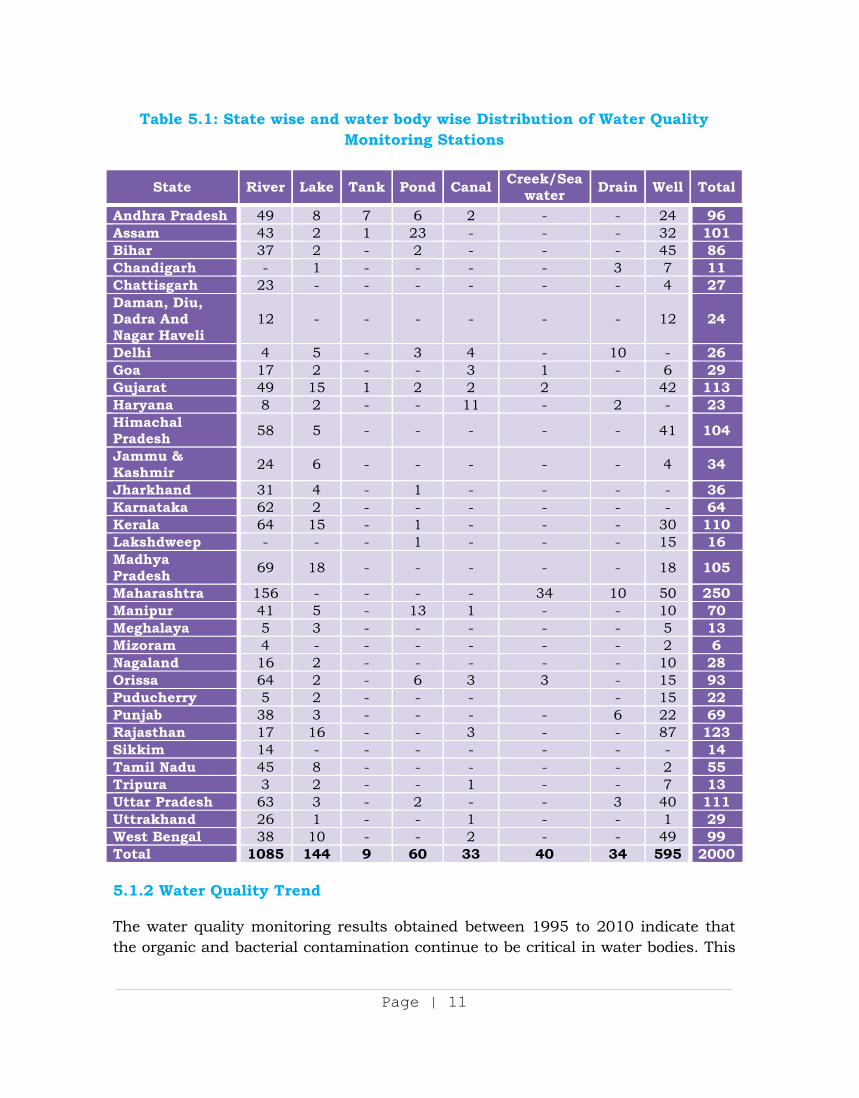
The present water quality network comprises of 2000 stations in 27 States and 6 Union Territories spread over the country. The monitoring network covers 383 Rivers, 127 Lakes, 9 Tanks, 59 Ponds, 40 Creeks/Seawater, 17 Canals, 34 Drains and 595 Wells. Among the 2000 stations, 1085 are on rivers, 144 on lakes, 34 on drains, 33 on canals, 9 on tank, 40 on creeks/seawater, 60 on pond and 595 are groundwater stations. During 2010-11 monitoring network expanded from 1700 to 2000 stations by addition of 300 new locations. The network expansion during the year covered 116 new water bodies. Presently the inland water quality-monitoring network is operated under a three-tier programme i.e. Global Environmental Monitoring System (GEMS), Monitoring of Indian National Aquatic Resources System (MINARS). The monitoring is done on monthly basis in surface waters and on half-yearly basis in case of ground water. Water samples are analyzed for 28 parameters consisting of physico-chemical and bacteriological parameters for ambient water samples apart from the field observations. Besides this, 9 trace metals and 28 pesticides are analyzed in selected samples. In view of resource, constraints limited numbers of organic pollution related parameters are chosen for frequent monitoring i.e. monthly or quarterly and major cations, anions, other inorganic ions and micro pollutants (Toxic Metals & POP’s) are analyzed once in a year to keep track of water quality over large period of time. The water quality data are reported in Water Quality Status Year Book.
Page | 11
Table 5.1: State wise and water body wise Distribution of Water Quality Monitoring Stations
State River Lake Tank Pond Canal Creek/Sea
water Drain Well Total
Andhra Pradesh 49 8 7 6 2 - - 24 96Assam 43 2 1 23 - - - 32 101Bihar 37 2 - 2 - - - 45 86Chandigarh - 1 - - - - 3 7 11Chattisgarh 23 - - - - - - 4 27Daman, Diu, Dadra And Nagar Haveli
12 - - - - - - 12 24
Delhi 4 5 - 3 4 - 10 - 26Goa 17 2 - - 3 1 - 6 29Gujarat 49 15 1 2 2 2 42 113Haryana 8 2 - - 11 - 2 - 23Himachal Pradesh 58 5 - - - - - 41 104
Jammu & Kashmir 24 6 - - - - - 4 34
Jharkhand 31 4 - 1 - - - - 36Karnataka 62 2 - - - - - - 64Kerala 64 15 - 1 - - - 30 110Lakshdweep - - - 1 - - - 15 16Madhya Pradesh 69 18 - - - - - 18 105
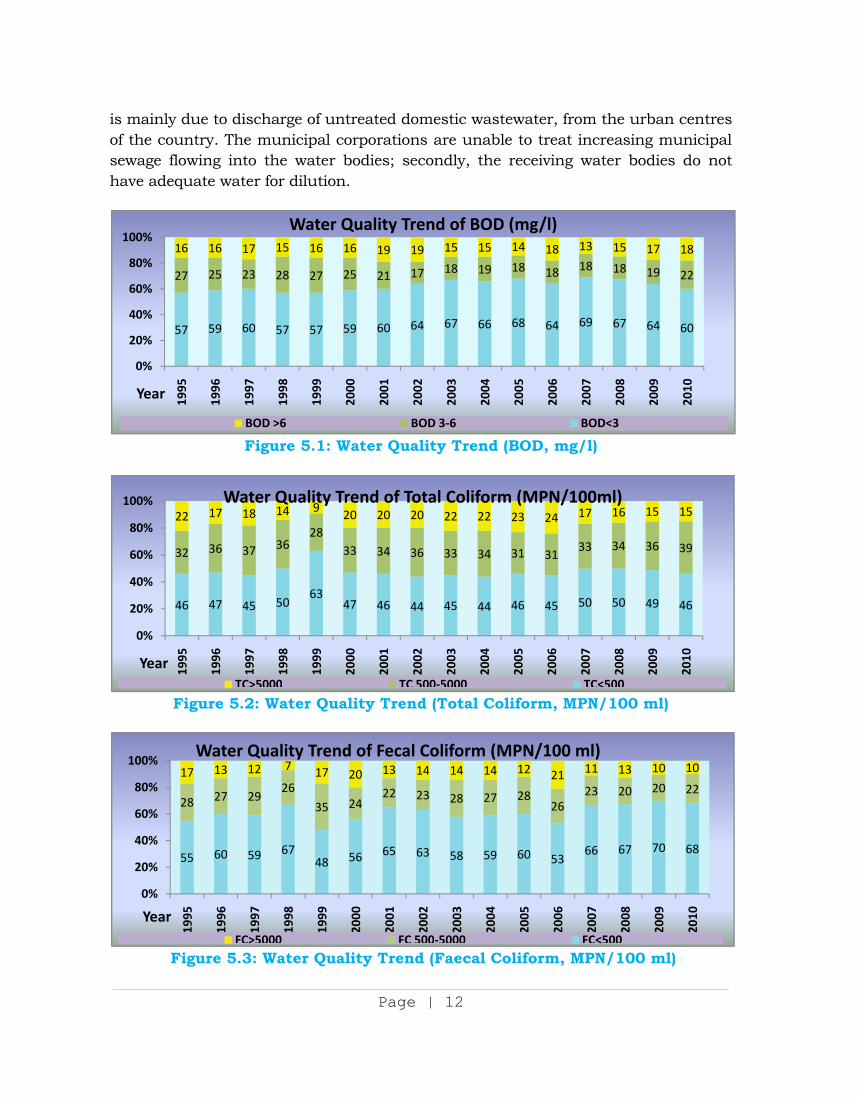
Maharashtra 156 - - - - 34 10 50 250Manipur 41 5 - 13 1 - - 10 70Meghalaya 5 3 - - - - - 5 13Mizoram 4 - - - - - - 2 6Nagaland 16 2 - - - - - 10 28Orissa 64 2 - 6 3 3 - 15 93Puducherry 5 2 - - - - 15 22Punjab 38 3 - - - - 6 22 69Rajasthan 17 16 - - 3 - - 87 123Sikkim 14 - - - - - - - 14Tamil Nadu 45 8 - - - - - 2 55Tripura 3 2 - - 1 - - 7 13Uttar Pradesh 63 3 - 2 - - 3 40 111Uttrakhand 26 1 - - 1 - - 1 29West Bengal 38 10 - - 2 - - 49 99Total 1085 144 9 60 33 40 34 595 2000 5.1.2 Water Quality Trend The water quality monitoring results obtained between 1995 to 2010 indicate that the organic and bacterial contamination continue to be critical in water bodies. This
Page | 12
is mainly due to discharge of untreated domestic wastewater, from the urban centres of the country. The municipal corporations are unable to treat increasing municipal sewage flowing into the water bodies; secondly, the receiving water bodies do not have adequate water for dilution.
Figure 5.1: Water Quality Trend (BOD, mg/l)
Figure 5.2: Water Quality Trend (Total Coliform, MPN/100 ml)
Figure 5.3: Water Quality Trend (Faecal Coliform, MPN/100 ml)
57 59 60 57 57 59 60 64 67 66 68 64 69 67 64 60
27 25 23 28 27 25 21 17 18 19 18 18 18 18 19 22
16 16 17 15 16 16 19 19 15 15 14 18 13 15 17 18
0%
20%
40%
60%
80%
100%
1995
1996
1997
1998
1999
2000
2001
2002
2003
2004
2005
2006
2007
2008
2009
2010Year
Water Quality Trend of BOD (mg/l)
BOD >6 BOD 3-6 BOD<3
46 47 45 5063
47 46 44 45 44 46 45 50 50 49 46
32 36 37 3628
33 34 36 33 34 31 3133 34 36 39
22 17 18 14 9 20 20 20 22 22 23 24 17 16 15 15
0%
20%
40%
60%
80%
100%
1995
1996
1997
1998
1999
2000
2001
2002
2003
2004
2005
2006
2007
2008
2009
2010Year
Water Quality Trend of Total Coliform (MPN/100ml)
TC>5000 TC 500-5000 TC<500
55 60 59 6748 56 65 63 58 59 60 53
66 67 70 68
28 27 2926
35 2422 23 28 27 28
2623 20 20 22
17 13 12 7 17 20 13 14 14 14 12 21 11 13 10 10
0%
20%
40%
60%
80%
100%
1995
1996
1997
1998
1999
2000
2001
2002
2003
2004
2005
2006
2007
2008
2009
2010Year
Water Quality Trend of Fecal Coliform (MPN/100 ml)
FC>5000 FC 500-5000 FC<500
Page | 13
5.2 DEVELOPMENT OF DECISION SUPPORT SYSTEM (DSS) FOR INTEGRATED WATER RESOURCES PLANNING AND MANAGEMENT
The National Hydrology Project-II that includes development of a Decision Support System (DSS) to be applied by Indian States and Central agencies for improved planning and management of water for domestic, industrial, and agricultural uses. The aim of development of DSS is to address the issues of intra-sectoral demands and overall resource planning and management through the establishment of core hydrological organizations serving all specialized water agencies to improve overall integrated water resource management in India. The main objective of the activity is to strengthen the knowledge of the modeling tools, which are incorporated in the DSS, particularly the MIKE BASIN water allocation model and the NAM rainfall-runoff model. These are applied for improved assessment of water resources availability and to help planning efficient use of surface and ground water in both normal and drought situations. The time series data on water quality is applied to these models for pilot study for scenario generation. Overall, project interventions and outcomes will contribute to better overall sustainable environmental management through generating
(i) a reliable and accessible hydrological knowledge base of meteorology, surface and ground water resources and water quality;
(ii) promotion of use of hydrological models and analytical tools such as decision support systems to mainstream environmental issues in water resources planning and management; and
(iii) promotion of special-purpose studies on critical issues on environmental issues in the water sector such as pollution of SW and GW and resource conservation.
The databases and analytical tools developed under DSS would help in the work of various agencies (e.g. water agencies, environmental agencies) on WQ data generation, management and use. Planning DSS would be related to SW and GW planning, reservoir operation, irrigation management, drought management, conjunctive use of SW and GW, and water quality. The above water quality modeling exercise was applied to Integration of water quality to the pilot basin-Upper Bhima, Maharashtra covering point & non point sources by over laying information from agencies. The Decision Support System for Integrated Water resources Management is expected to provide tools for interaction options for priority action to be taken up for improvement of water quality. The requirement of water quality for DSS Planning are but not limited to, the following aspects.
Page | 14
Nature & magnitude of pollution control needed – stretch wise Prioritization of areas for pollution control Assimilation capacity Water Quality trend Compliance with Designated Use Fate of various pollutants in aquatic environment Design of Water Quality Monitoring Network Rationalisation and optimisation of water quality monitoring programme Perspective plan for Water Quality management Evaluation of possible drinking water options including storages Evaluation of Economic Impact of pollution control efforts Evaluation of pollution control options Augment the capacity of sewage treatment plants in case gap is observed for
water quality degradation Cost-benefit analysis of wastewater treatment and options of
minimum/environmental flows Assessment and evaluation of ecological impact Hot spots identification Prioritisation of activities for improvement of water quality through
regulation and tightening of norms/standards for control of pollution in the event of non availability of minimum/environmental flows and to decide on the Intervention required
5.2.1 Water quality-monitoring program at the river stretch of Interstate
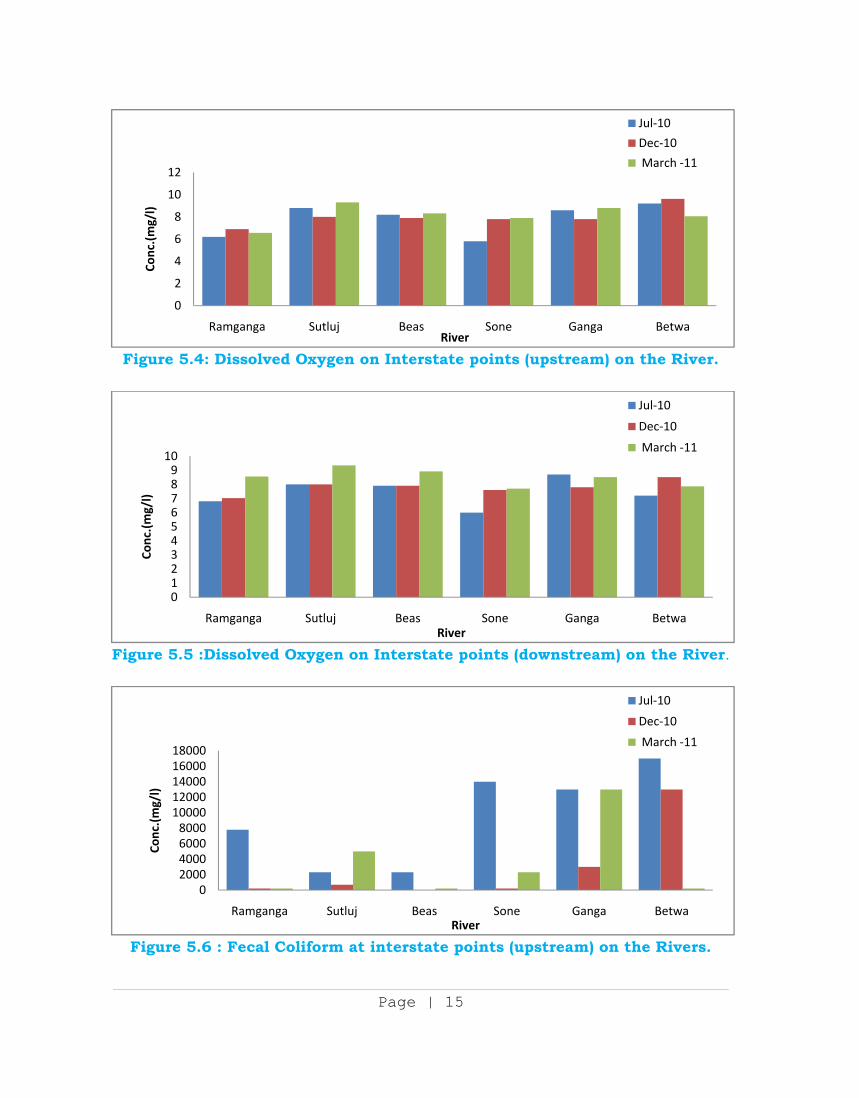
Boundaries One of the function of the Central Pollution Control Board, under Section 16 2(b) of the Water (Prevention and Control of Pollution) Act, 1974 is to “coordinate the activities of the State Boards and resolve disputes among them”. In the light of above, CPCB is monitoring the water quality of rivers at the interstate boundaries since 2005. At present, monitoring is carried out four times a year at 82 locations spread over 40 rivers. It was observed that 26 rivers at 40 locations are polluted due to high Bio-Chemical Oxygen Demand (BOD), one of the most important indicator of water quality. The water quality of interstate river bounderies covering Betwa in M.P and U.P, Sone and Ganga in U.P and Bihar, Satluj and Beas in H.P and Punjab and Ramganga in Uttrakhand and U.P. is presented in Figures 5.4 to 5.7.
Page | 15
Figure 5.4: Dissolved Oxygen on Interstate points (upstream) on the River.
Figure 5.5 :Dissolved Oxygen on Interstate points (downstream) on the River.
Figure 5.6 : Fecal Coliform at interstate points (upstream) on the Rivers.
0
2
4
6
8
10
12
Ramganga Sutluj Beas Sone Ganga Betwa
Conc
.(m
g/l)
River
Jul-10
Dec-10
March -11
0123456789
10
Ramganga Sutluj Beas Sone Ganga Betwa
Conc
.(m
g/l)
River
Jul-10
Dec-10
March -11
02000400060008000
1000012000140001600018000
Ramganga Sutluj Beas Sone Ganga Betwa
Conc
.(m
g/l)
River
Jul-10
Dec-10
March -11
Page | 16
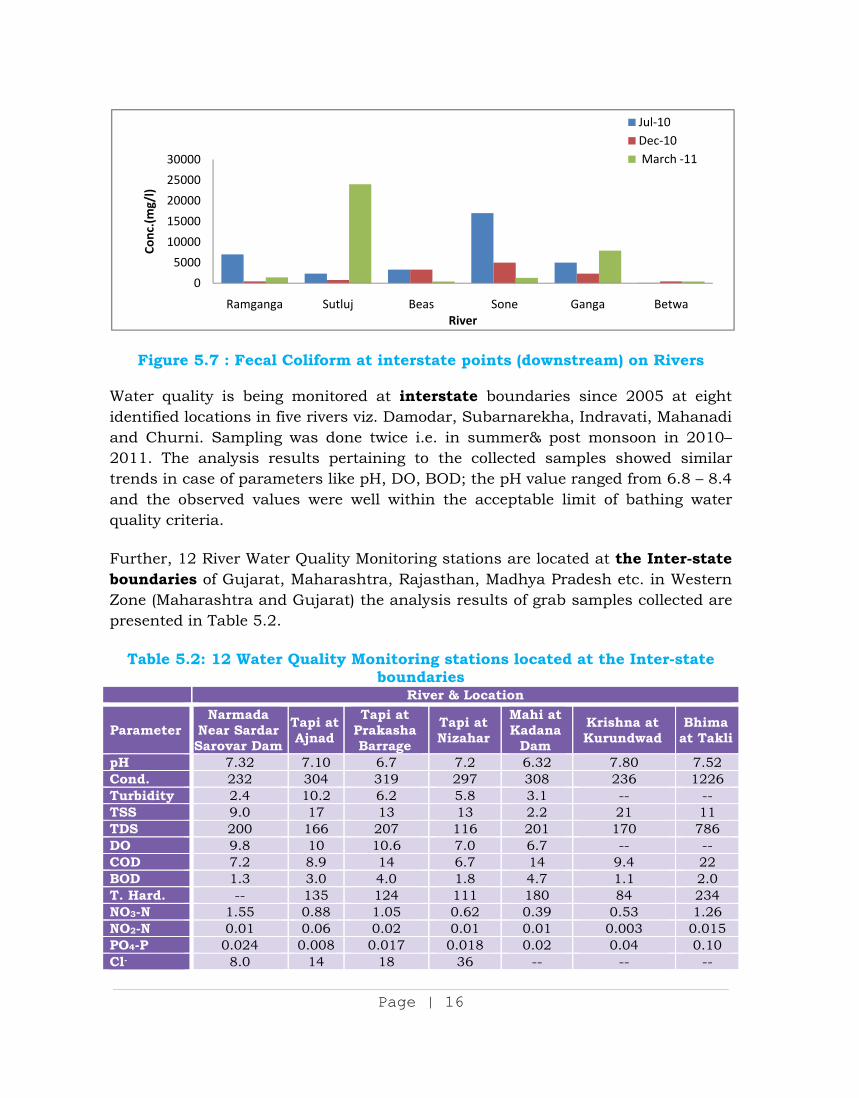
Figure 5.7 : Fecal Coliform at interstate points (downstream) on Rivers Water quality is being monitored at interstate boundaries since 2005 at eight identified locations in five rivers viz. Damodar, Subarnarekha, Indravati, Mahanadi and Churni. Sampling was done twice i.e. in summer& post monsoon in 2010–2011. The analysis results pertaining to the collected samples showed similar trends in case of parameters like pH, DO, BOD; the pH value ranged from 6.8 – 8.4 and the observed values were well within the acceptable limit of bathing water quality criteria. Further, 12 River Water Quality Monitoring stations are located at the Inter-state boundaries of Gujarat, Maharashtra, Rajasthan, Madhya Pradesh etc. in Western Zone (Maharashtra and Gujarat) the analysis results of grab samples collected are presented in Table 5.2.
Table 5.2: 12 Water Quality Monitoring stations located at the Inter-state boundaries
River & Location
Parameter Narmada
Near Sardar Sarovar Dam
Tapi at Ajnad
Tapi at Prakasha Barrage
Tapi at Nizahar
Mahi at Kadana
Dam
Krishna at Kurundwad
Bhima at Takli
pH 7.32 7.10 6.7 7.2 6.32 7.80 7.52 Cond. 232 304 319 297 308 236 1226 Turbidity 2.4 10.2 6.2 5.8 3.1 -- -- TSS 9.0 17 13 13 2.2 21 11 TDS 200 166 207 116 201 170 786 DO 9.8 10 10.6 7.0 6.7 -- -- COD 7.2 8.9 14 6.7 14 9.4 22 BOD 1.3 3.0 4.0 1.8 4.7 1.1 2.0 T. Hard. -- 135 124 111 180 84 234 NO3-N 1.55 0.88 1.05 0.62 0.39 0.53 1.26 NO2-N 0.01 0.06 0.02 0.01 0.01 0.003 0.015 PO4-P 0.024 0.008 0.017 0.018 0.02 0.04 0.10 Cl- 8.0 14 18 36 -- -- --
0
5000
10000
15000
20000
25000
30000
Ramganga Sutluj Beas Sone Ganga Betwa
Conc
.(m
g/l)
River
Jul-10Dec-10March -11
Page | 17
Alk 117 149 133 141 147 66 222 Na+ 6.0 13 22 18 27 14.4 96.8 K+ 1.9 4.1 5.0 4.0 4.9 6.7 5.5 NH3-N 0.04 0.10 0.28 0.12 0.81 1.27 0.91 TKN 0.25 -- -- -- 1.4 -- -- Note: Except pH, Conductivity & Turbidity, all other results are expressed in mg/l. Conductivity is expressed in µmhos/cm & Turbidity in NTU. Apart from the above locations monitoring the river Damanganga at Gujarat and Daman boarder on quarterly basis is also done. During 2010-11, the water quality of five rivers flowing from Bhutan to India were assessed under interstate / international boundary river – the rivers were from Bhutan (Pagladiya, Manas, Saralbhanga, Champaman Rivers), one river from Sikkim to West Bengal (Teesta River), one river from Nagaland to Assam (Dhansiri River), two rivers from Meghalaya to Bangladesh (Lukha River and Kmai Um River) one river from Meghalaya to Assam (Umtrew River) and Barak River starting from Manipur then flows between Manipur and Mizoram, Manipur and Assam then flowing through Assam lastly enters to Bangladesh. The water qualities in Bharalu river of Guwahati and Deepor Beel, near Guwahati Airport, Assam were assessed for polluted river stretches and polluted lake. The water quality of the five rivers from Bhutan entering India, Umtrew from Meghalaya entering Assam, Teesta river from Sikkim entering West Bengal and Barak river from Manipur lastly entering to Bangladesh were found complying with the permissible limits. The pH values of Kmai Um and Lukha rivers from the coal mining areas of Jaintia Hills entering to Bangladesh observed in acidic range. 5.3 WATER QUALITY OF RIVER GANGA In the state of Uttar Pradesh CPCB is regularly conducting performance evaluation of STPs (GAP-1) and monitoring the impact on river water quality in the designated stretches between Allahabad to Tarighat district Ghazipur. Water quality is monitored at river Ganga and its tributeries at thirteen locations. The status of water quality observed between April 2010 to March 2011 is as follows: • The observed D.O. in the complete stretch of river Ganga was more than 4 mg/l
(avg.). • For BOD , the complete stretch of river Ganga monitored does not conform to
the water quality i.e. < 3.0 mg/l • All monitoring locations on river Ganga showed high concentration of coliform. • DO in River Varuna was found below 5 mg/l. The river works as a drain
carrying excess effluent of Dinapur STP and few minor drains of Varanasi. Water quality of River Varuna was deteriorating due to uncontrolled discharge
Page | 18
of Varanasi city sewage and bypass of Konia pumping station feeder to Dinapur STP.
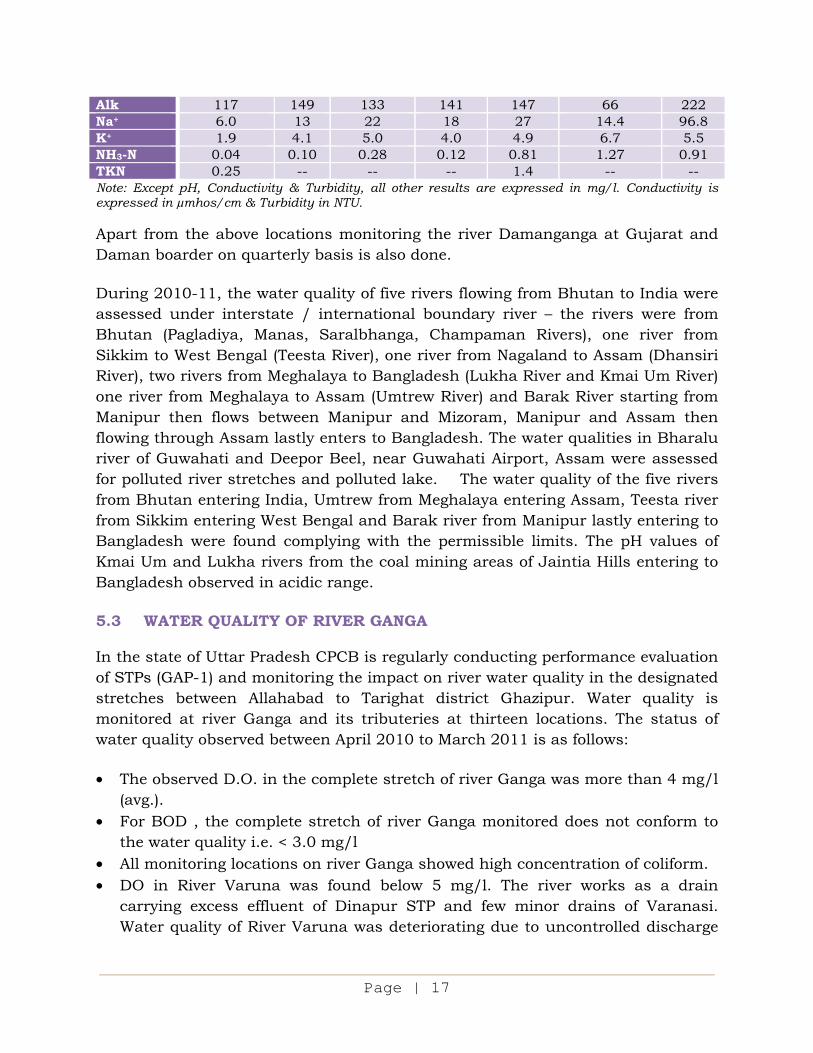
Graphical presentation of river water quality for Dissolved Oxygen (DO), Biochemical Oxygen Demand (BOD), Chemical Oxygen Demand (COD) and chloride from April 2010 to March 2011 is as under.
Figure 5.8 : Water Quality of River Ganga in Up stram at Ujjaini ( Fatehpur)
Figure 5.9 : Water Quality of River Yamuna beforer confluence with River
Ganga at Allahabad
Figure 5.10 : Water Quality of River Ganga at Sangam in Allahabad
0
10
20
30
40
50
April May June July Aug. Sept. Oct. Nov. Dec. Jan. Feb. Mar.
Conc
.(m
g/l)
MONTHS
DO (mg/L)
BOD (mg/L)
COD (mg/L)
Cl- (mg/L)
0
20
40
60
80
100
April May June July Aug. Sept. Oct. Nov. Dec. Jan. Feb. Mar.
Conc
.(m
g/l)
MONTHS
DO (mg/L)
BOD (mg/L)
COD (mg/L)
Cl- (mg/L)
010203040506070
April May June July Aug. Sept. Oct. Nov. Dec. Jan. Feb. Mar.
Conc
.(m
g/l)
MONTHS
DO (mg/L)
BOD (mg/L)
COD (mg/L)
Cl- (mg/L)
Page | 19
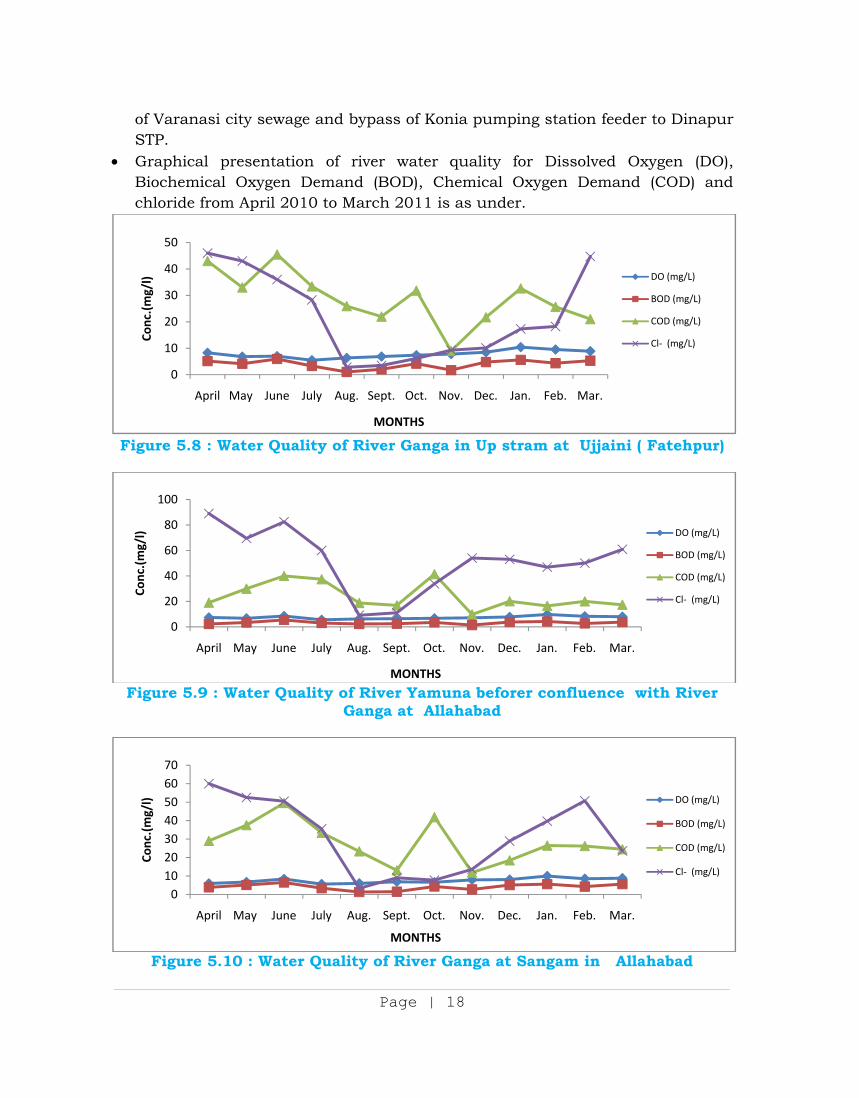
Figure 5.11 : Water Quality of River Ganga at Deehaghat (¼ width), Allahabad
Figure 5.12 : Water Quality of River Ganga at Deehaghat (1/2 width ),
Allahabad
Figure 5.13 : Water Quality of River Ganga at Deehaghat (1/2 width ),
Allahabad
01020304050607080
April May June July Aug. Sept. Oct. Nov. Dec. Jan. Feb. Mar.
Conc
.(m
g/l)
MONTHS
DO (mg/L)
BOD (mg/L)
COD (mg/L)
Cl- (mg/L)
01020304050607080
April May June July Aug. Sept. Oct. Nov. Dec. Jan. Feb. Mar.
Conc
.(m
g/l)
MONTHS
DO (mg/L)
BOD (mg/L)
COD (mg/L)
Cl- (mg/L)
0
5
10
15
20
25
April May June July Aug. Sept. Oct. Nov. Dec. Jan. Feb. Mar.
Conc
.(m
g/l)
MONTHS
DO (mg/L)
BOD (mg/L)
COD (mg/L)
Cl- (mg/L)
Page | 20
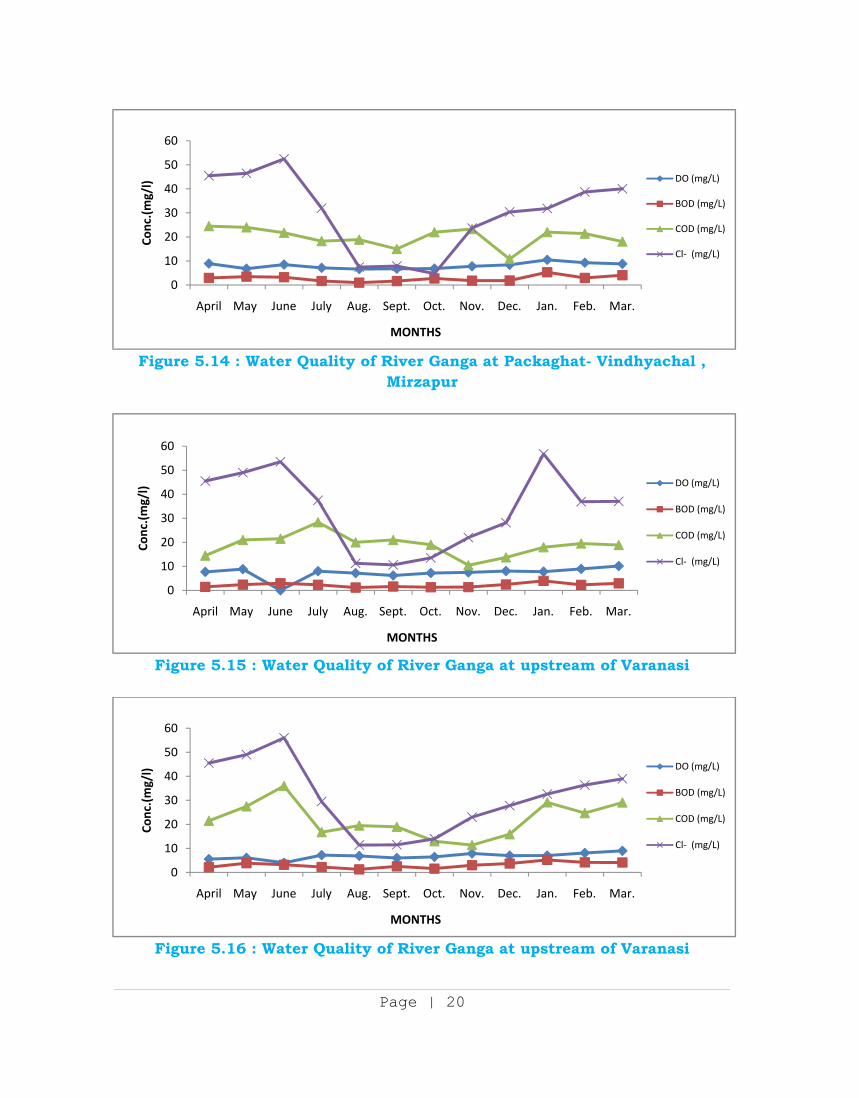
Figure 5.14 : Water Quality of River Ganga at Packaghat- Vindhyachal ,
Mirzapur
Figure 5.15 : Water Quality of River Ganga at upstream of Varanasi
Figure 5.16 : Water Quality of River Ganga at upstream of Varanasi
0
10
20
30
40
50
60
April May June July Aug. Sept. Oct. Nov. Dec. Jan. Feb. Mar.
Conc
.(m
g/l)
MONTHS
DO (mg/L)
BOD (mg/L)
COD (mg/L)
Cl- (mg/L)
0
10
20
30
40
50
60
April May June July Aug. Sept. Oct. Nov. Dec. Jan. Feb. Mar.
Conc
.(m
g/l)
MONTHS
DO (mg/L)
BOD (mg/L)
COD (mg/L)
Cl- (mg/L)
0
10
20
30
40
50
60
April May June July Aug. Sept. Oct. Nov. Dec. Jan. Feb. Mar.
Conc
.(m
g/l)
MONTHS
DO (mg/L)
BOD (mg/L)
COD (mg/L)
Cl- (mg/L)
Page | 21
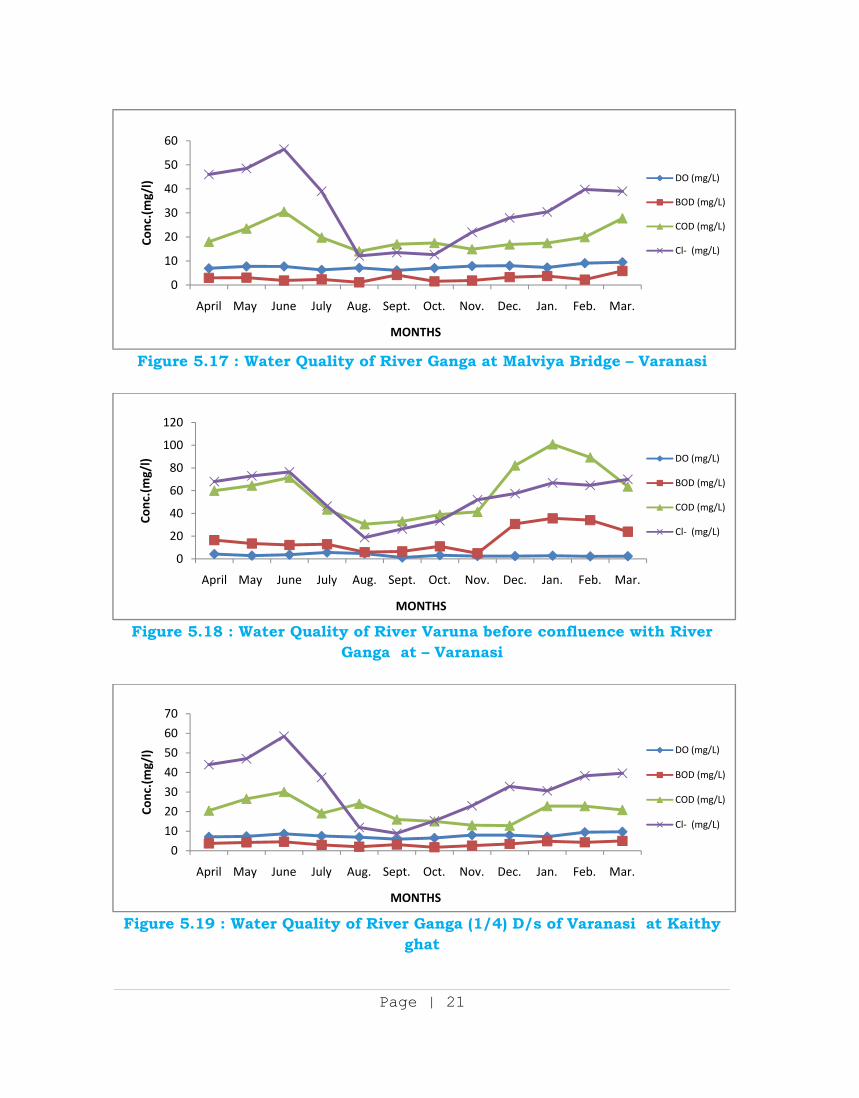
Figure 5.17 : Water Quality of River Ganga at Malviya Bridge – Varanasi
Figure 5.18 : Water Quality of River Varuna before confluence with River
Ganga at – Varanasi
Figure 5.19 : Water Quality of River Ganga (1/4) D/s of Varanasi at Kaithy
ghat
0
10
20
30
40
50
60
April May June July Aug. Sept. Oct. Nov. Dec. Jan. Feb. Mar.
Conc
.(m
g/l)
MONTHS
DO (mg/L)
BOD (mg/L)
COD (mg/L)
Cl- (mg/L)
0
20
40
60
80
100
120
April May June July Aug. Sept. Oct. Nov. Dec. Jan. Feb. Mar.
Conc
.(m
g/l)
MONTHS
DO (mg/L)
BOD (mg/L)
COD (mg/L)
Cl- (mg/L)
0
10
20
30
40
50
60
70
April May June July Aug. Sept. Oct. Nov. Dec. Jan. Feb. Mar.
Conc
.(m
g/l)
MONTHS
DO (mg/L)
BOD (mg/L)
COD (mg/L)
Cl- (mg/L)
Page | 22
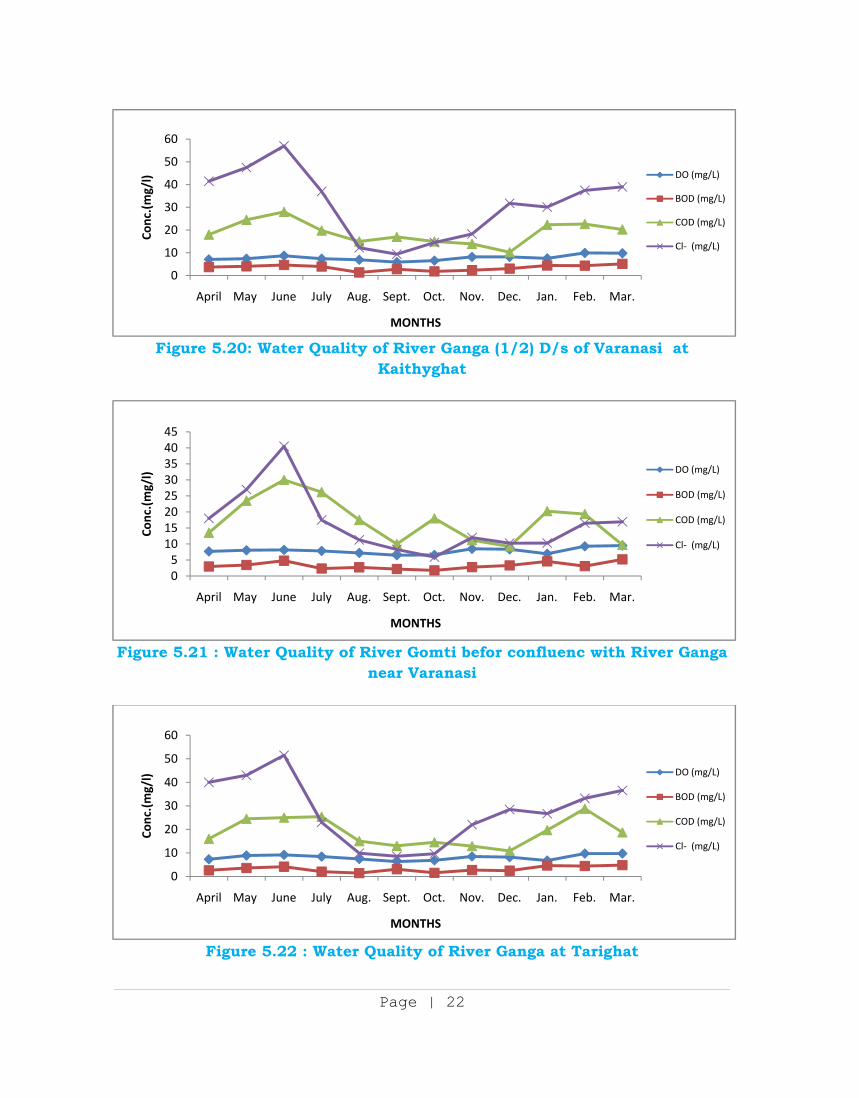
Figure 5.20: Water Quality of River Ganga (1/2) D/s of Varanasi at
Kaithyghat
Figure 5.21 : Water Quality of River Gomti befor confluenc with River Ganga
near Varanasi
Figure 5.22 : Water Quality of River Ganga at Tarighat
0
10
20
30
40
50
60
April May June July Aug. Sept. Oct. Nov. Dec. Jan. Feb. Mar.
Conc
.(m
g/l)
MONTHS
DO (mg/L)
BOD (mg/L)
COD (mg/L)
Cl- (mg/L)
05
1015202530354045
April May June July Aug. Sept. Oct. Nov. Dec. Jan. Feb. Mar.
Conc
.(m
g/l)
MONTHS
DO (mg/L)
BOD (mg/L)
COD (mg/L)
Cl- (mg/L)
0
10
20
30
40
50
60
April May June July Aug. Sept. Oct. Nov. Dec. Jan. Feb. Mar.
Conc
.(m
g/l)
MONTHS
DO (mg/L)
BOD (mg/L)
COD (mg/L)
Cl- (mg/L)
Page | 23
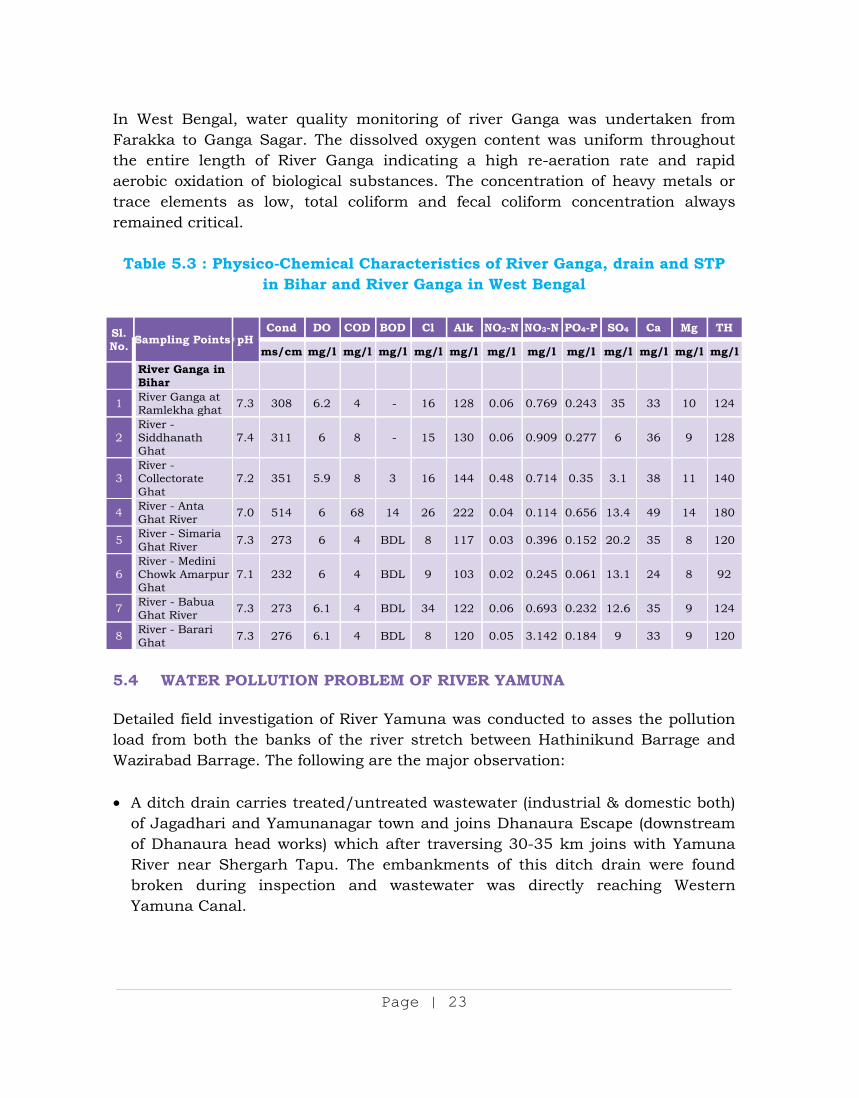
In West Bengal, water quality monitoring of river Ganga was undertaken from Farakka to Ganga Sagar. The dissolved oxygen content was uniform throughout the entire length of River Ganga indicating a high re-aeration rate and rapid aerobic oxidation of biological substances. The concentration of heavy metals or trace elements as low, total coliform and fecal coliform concentration always remained critical. Table 5.3 : Physico-Chemical Characteristics of River Ganga, drain and STP
in Bihar and River Ganga in West Bengal
Sl. No. Sampling Points pH
Cond DO COD BOD Cl Alk NO2-N NO3-N PO4-P SO4 Ca Mg TH
ms/cm mg/l mg/l mg/l mg/l mg/l mg/l mg/l mg/l mg/l mg/l mg/l mg/l
River Ganga in Bihar
1 River Ganga at Ramlekha ghat 7.3 308 6.2 4 - 16 128 0.06 0.769 0.243 35 33 10 124
2 River - Siddhanath Ghat
7.4 311 6 8 - 15 130 0.06 0.909 0.277 6 36 9 128
3 River - Collectorate Ghat
7.2 351 5.9 8 3 16 144 0.48 0.714 0.35 3.1 38 11 140
4 River - Anta Ghat River 7.0 514 6 68 14 26 222 0.04 0.114 0.656 13.4 49 14 180
5 River - Simaria Ghat River 7.3 273 6 4 BDL 8 117 0.03 0.396 0.152 20.2 35 8 120
6 River - Medini Chowk Amarpur Ghat
7.1 232 6 4 BDL 9 103 0.02 0.245 0.061 13.1 24 8 92
7 River - Babua Ghat River 7.3 273 6.1 4 BDL 34 122 0.06 0.693 0.232 12.6 35 9 124
8 River - Barari Ghat 7.3 276 6.1 4 BDL 8 120 0.05 3.142 0.184 9 33 9 120
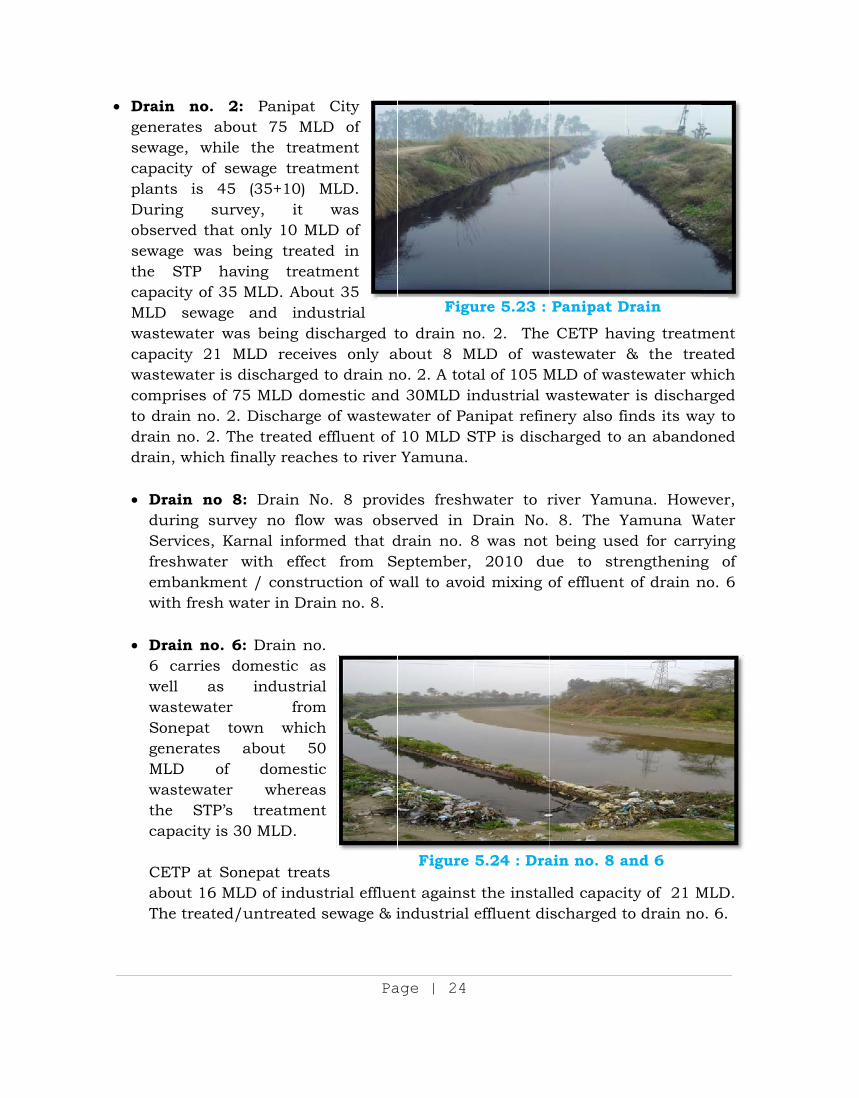
5.4 WATER POLLUTION PROBLEM OF RIVER YAMUNA Detailed field investigation of River Yamuna was conducted to asses the pollution load from both the banks of the river stretch between Hathinikund Barrage and Wazirabad Barrage. The following are the major observation:
A ditch drain carries treated/untreated wastewater (industrial & domestic both) of Jagadhari and Yamunanagar town and joins Dhanaura Escape (downstream of Dhanaura head works) which after traversing 30-35 km joins with Yamuna River near Shergarh Tapu. The embankments of this ditch drain were found broken during inspection and wastewater was directly reaching Western Yamuna Canal.
DraingenersewagcapacplantDurinobsersewagthe capacMLD wastecapacwastecompto dradraindrain
DraduSerfresemwit
Dra6 wewaSongenMLwathecap
CEaboThe
n no. 2: rates abouge, while city of sewts is 45 ng surverved that oge was beSTP hav
city of 35 Msewage
ewater wascity 21 Mewater is dprises of 75ain no. 2.
n no. 2. Thn, which fin
ain no 8:ring survervices, Karshwater w
mbankmentth fresh wa
ain no. 6:carries doll as
astewater nepat townerates aLD of astewater e STP’s pacity is 30
ETP at Sonout 16 MLe treated/u
Panipat ut 75 ML
the treatwage treat(35+10) M
ey, it only 10 MLeing treateving treatMLD. Abouand indu
s being disMLD receivdischarged 5 MLD domDischarge
he treated enally reach
: Drain Noey no flowrnal informwith effectt / construater in Dra
: Drain noomestic as
industriafrom
wn whichabout 50
domesticwhereas
treatment0 MLD.
nepat treatD of indusuntreated
Pa
City LD of ment ment MLD.
was LD of ed in ment ut 35 ustrial scharged tes only ato drain n
mestic and of wasteweffluent of
hes to river
o. 8 proviw was obsmed that dt from Suction of wain no. 8.
. s
al m h 0 c s t
ts strial effluesewage & i
age | 24
to drain noabout 8 Mno. 2. A totad 30MLD inwater of Pa
10 MLD SYamuna.
ides freshwserved in Ddrain no. 8eptember,
wall to avoi
ent againstindustrial
Figure
Figuo. 2. The
MLD of waal of 105 Mndustrial w
anipat refinSTP is disc
water to rDrain No. 8 was not
2010 duid mixing o
t the instaleffluent di
5.24 : Dra
ure 5.23 : CETP hav
astewater MLD of waswastewaternery also ficharged to
river Yamu8. The Ybeing use
ue to strof effluent
lled capacischarged t
ain no. 8 a
Panipat Dving treatm& the trestewater wr is dischainds its waan abando
una. HoweYamuna Wed for carrengtheningof drain n
ity of 21 Mto drain no
and 6
Drain
ment eated which arged ay to oned
ever, Water rying g of no. 6
MLD. o. 6.
YamDisRivwa
SchemaBarrage
Figure
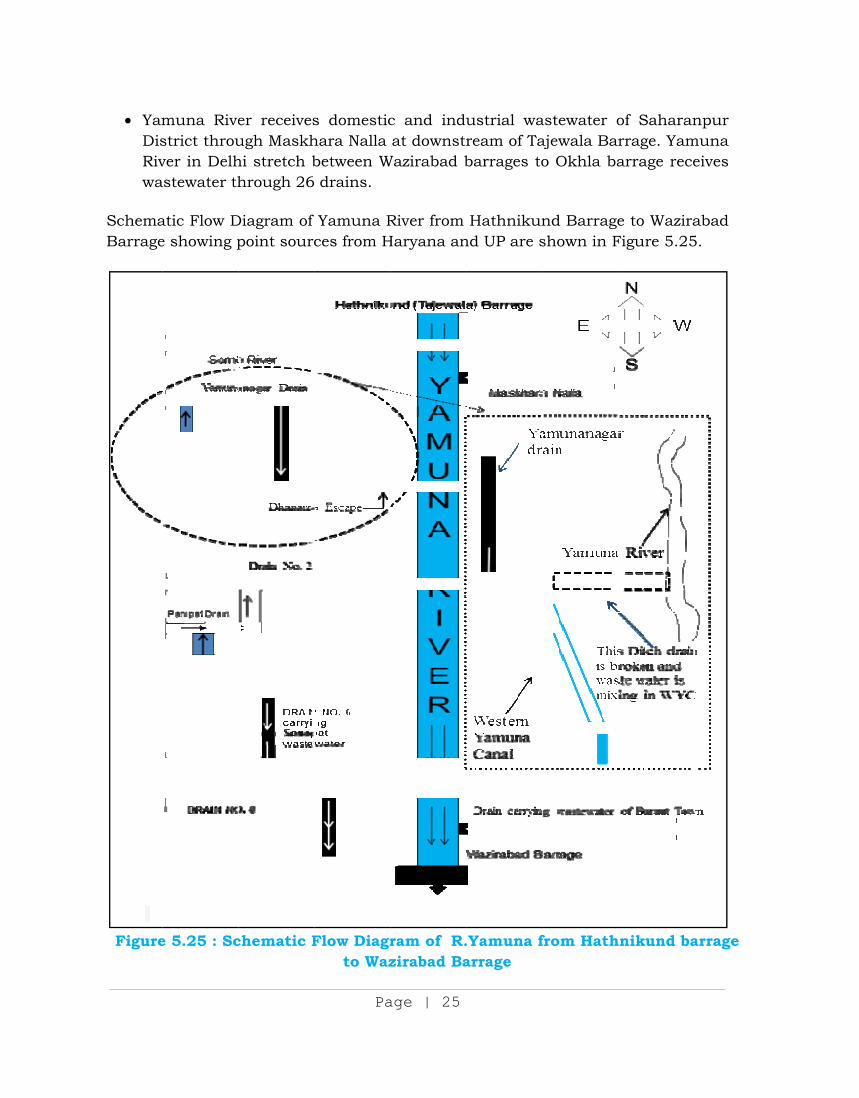
muna Rivestrict throuver in Delhastewater th
atic Flow De showing p
e 5.25 : Sc
er receivesugh Maskhhi stretch bhrough 26
Diagram of point sourc
chematic F
Pa
s domestichara Nalla between W drains.
Yamuna Rces from H
Flow Diagrto Waz
age | 25
c and induat downstr
Wazirabad b
River from Haryana an
ram of R.zirabad Ba
ustrial waream of Tabarrages to
Hathnikunnd UP are s
.Yamuna farrage
astewater oajewala Baro Okhla ba
nd Barrageshown in F
from Hath
of Saharanrrage. Yamarrage rece
e to WaziraFigure 5.25
nikund ba
npur muna eives
abad 5.
arrage
Page | 26
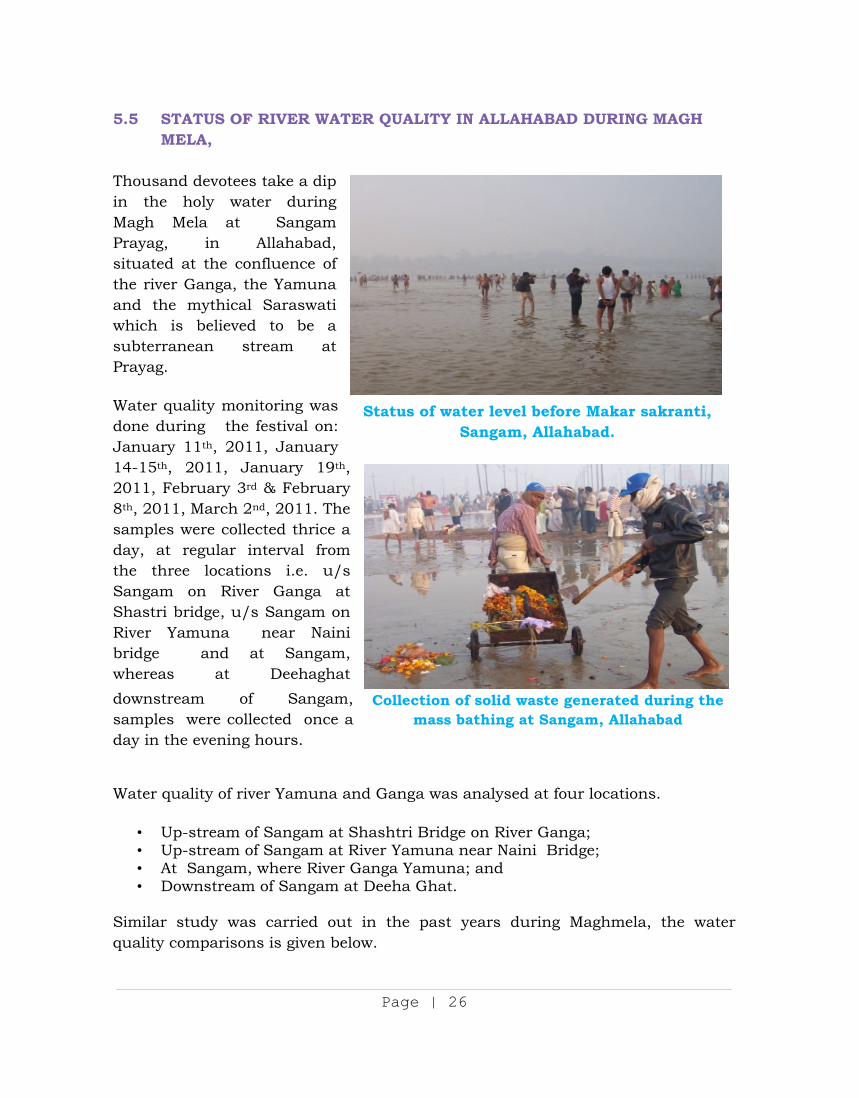
5.5 STATUS OF RIVER WATER QUALITY IN ALLAHABAD DURING MAGH MELA,
Thousand devotees take a dip in the holy water during Magh Mela at Sangam Prayag, in Allahabad, situated at the confluence of the river Ganga, the Yamuna and the mythical Saraswati which is believed to be a subterranean stream at Prayag.
Water quality monitoring was done during the festival on: January 11th, 2011, January 14-15th, 2011, January 19th, 2011, February 3rd & February 8th, 2011, March 2nd, 2011. The samples were collected thrice a day, at regular interval from the three locations i.e. u/s Sangam on River Ganga at Shastri bridge, u/s Sangam on River Yamuna near Naini bridge and at Sangam, whereas at Deehaghat downstream of Sangam, samples were collected once a day in the evening hours.
Water quality of river Yamuna and Ganga was analysed at four locations.
• Up-stream of Sangam at Shashtri Bridge on River Ganga; • Up-stream of Sangam at River Yamuna near Naini Bridge; • At Sangam, where River Ganga Yamuna; and • Downstream of Sangam at Deeha Ghat.
Similar study was carried out in the past years during Maghmela, the water quality comparisons is given below.
Status of water level before Makar sakranti, Sangam, Allahabad.
Collection of solid waste generated during the mass bathing at Sangam, Allahabad
Page | 27
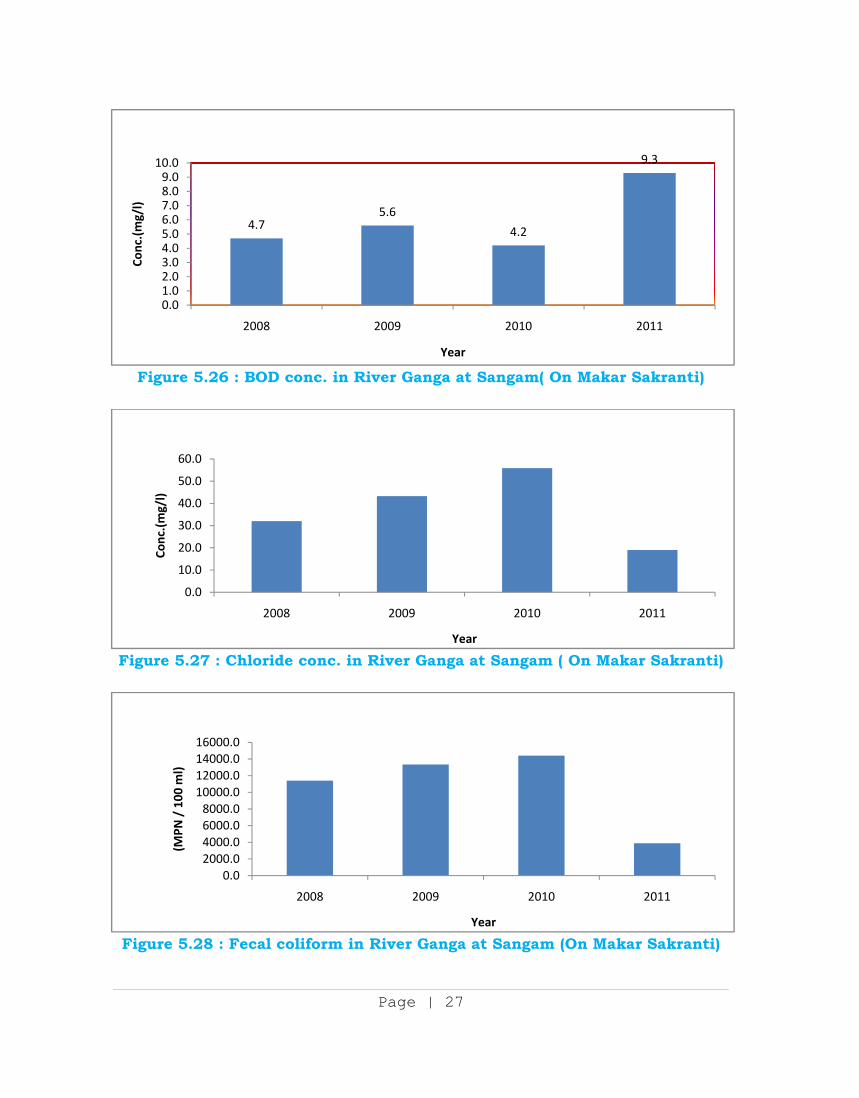
Figure 5.26 : BOD conc. in River Ganga at Sangam( On Makar Sakranti)
Figure 5.27 : Chloride conc. in River Ganga at Sangam ( On Makar Sakranti)
Figure 5.28 : Fecal coliform in River Ganga at Sangam (On Makar Sakranti)
4.75.6
4.2
9.3
0.01.02.03.04.05.06.07.08.09.0
10.0
2008 2009 2010 2011
Conc
.(m
g/l)
Year
0.0
10.0
20.0
30.0
40.0
50.0
60.0
2008 2009 2010 2011
Conc
.(m
g/l)
Year
0.02000.04000.06000.08000.0
10000.012000.014000.016000.0
2008 2009 2010 2011
(MPN
/ 1
00 m
l)
Year
Page | 28
5.6 BIO MAPPING OF BARAK RIVER AND ITS TRIBUTARIES The Barak River and its tributaries flow through the states of Manipur, Mizoram and Assam. The River is also a trans-boundary river, flowing into Bangladesh. The water quality of the River is, therefore, of importance both at a National as well as at an International level. The aim of the project was to assess the quality of the river and its tributaries through bio monitoring. The key findings of the project are given below:
Barak River gets moderately polluted as it flows through Silchar;
Barak River and its tributaries are generally clean upstream of Slichar; and
The main causes for this pollution, as identified by assessing the landuse
pattern around the sampling area, are open defecation, washing of clothes
and utensils, bathing and dumping of municipal solid wastes
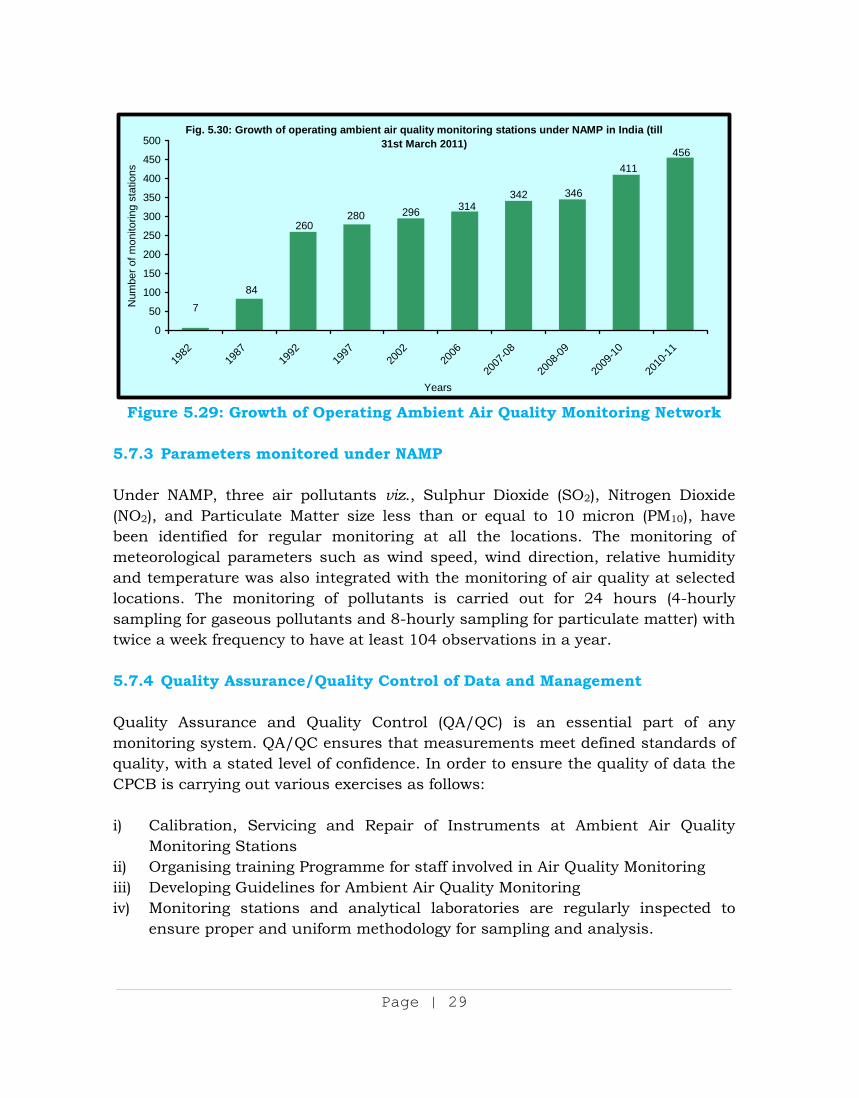
5.7 AIR QUALITY NETWORK 5.7.1 National Ambient Air quality Standards The National Ambient Air Quality Standards (NAAQS) were notified in the year 1982, duly revised in 1994 based on health criteria and land use based approach. The NAAQS have been revisited and revised in November 2009 in consultation with civil society and experts for 12 pollutants which include SO2, NO2, PM10, PM2.5, Ozone, Lead, Arsenic, Nickel, CO, NH3, Benzene, and B(a)P (particulate phase). 5.7.2 National Ambient Air Quality Monitoring Programme The Central Board is executing a nation-wide National Air Quality Monitoring Programme (NAMP) covering 456 operating stations (Fig. 5.30) spread over covering 190 cities/towns and industrial areas in 26 States and 5 Union Territories. The Table below shows the number of sanctioned and operating air quality monitoring stations till March 31st, 2011.
Page | 29
Fig. 5.30: Growth of operating ambient air quality monitoring stations under NAMP in India (till 31st March 2011)
296 314342 346
456411
7
84
260280
0
50
100
150
200
250
300
350
400
450
500
1982
1987
1992
1997
2002
2006
2007
-08
2008
-09
2009
-10
2010
-11
Years
Num
ber o
f mon
itorin
g st
atio
ns
Figure 5.29: Growth of Operating Ambient Air Quality Monitoring Network
5.7.3 Parameters monitored under NAMP Under NAMP, three air pollutants viz., Sulphur Dioxide (SO2), Nitrogen Dioxide (NO2), and Particulate Matter size less than or equal to 10 micron (PM10), have been identified for regular monitoring at all the locations. The monitoring of meteorological parameters such as wind speed, wind direction, relative humidity and temperature was also integrated with the monitoring of air quality at selected locations. The monitoring of pollutants is carried out for 24 hours (4-hourly sampling for gaseous pollutants and 8-hourly sampling for particulate matter) with twice a week frequency to have at least 104 observations in a year. 5.7.4 Quality Assurance/Quality Control of Data and Management Quality Assurance and Quality Control (QA/QC) is an essential part of any monitoring system. QA/QC ensures that measurements meet defined standards of quality, with a stated level of confidence. In order to ensure the quality of data the CPCB is carrying out various exercises as follows: i) Calibration, Servicing and Repair of Instruments at Ambient Air Quality
Monitoring Stations ii) Organising training Programme for staff involved in Air Quality Monitoring iii) Developing Guidelines for Ambient Air Quality Monitoring iv) Monitoring stations and analytical laboratories are regularly inspected to
ensure proper and uniform methodology for sampling and analysis.
v) Coissme
vi) Ancon
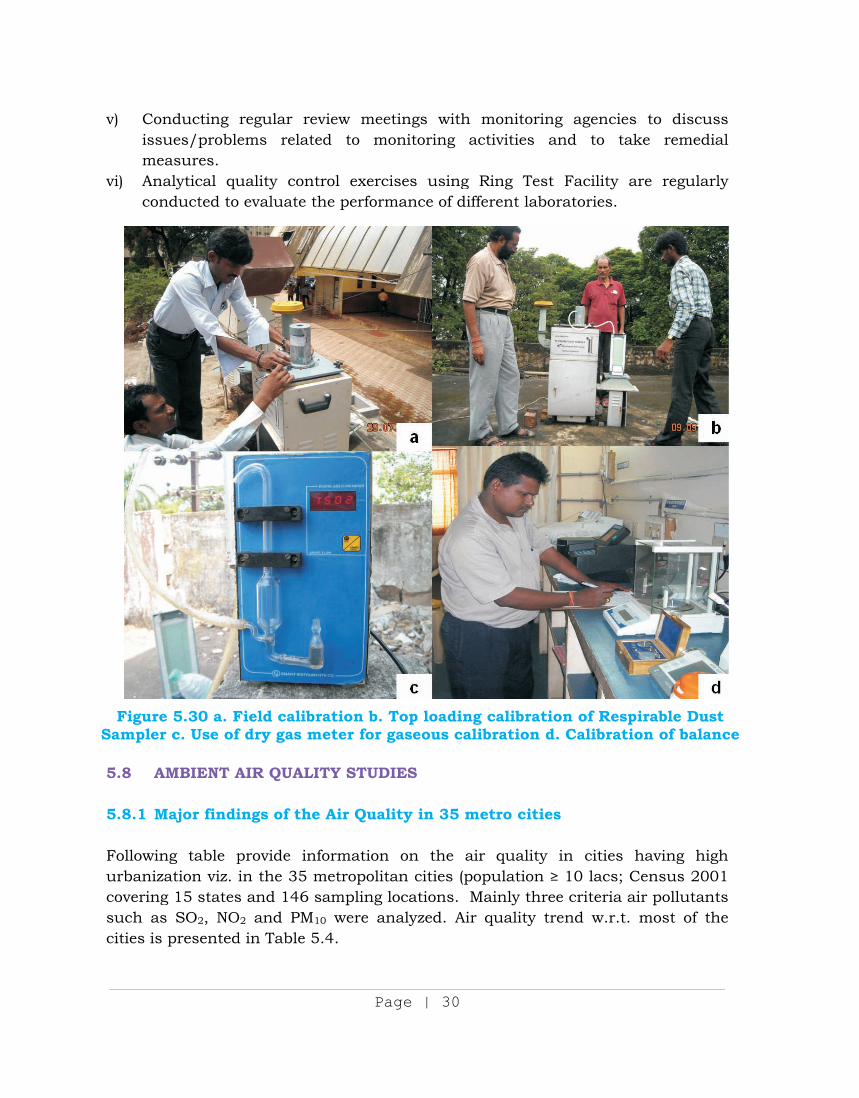
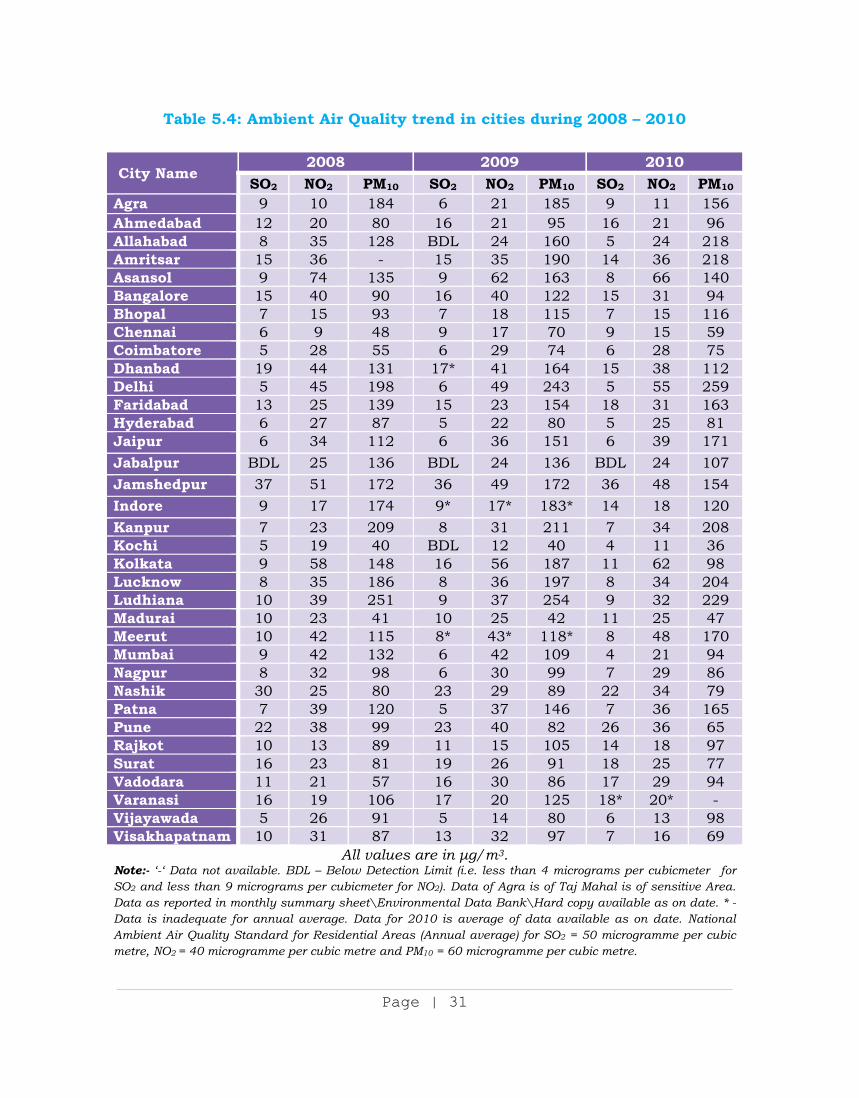
FigureSampler 5.8 A 5.8.1 M Followinurbanizcoveringsuch ascities is
nducting ues/proble
easures. alytical qunducted to
e 5.30 a. Fr c. Use of
AMBIENT A
Major findi
ng table pzation viz. g 15 statess SO2, NO presented
regular reems relat
uality con evaluate t
Field calibf dry gas m
AIR QUALI
ings of the
provide inin the 35 ms and 146
O2 and PMd in Table 5
Pa
eview meeed to mo
trol exercithe perform
bration b. Tmeter for g
ITY STUD
e Air Qual
nformation metropolitasampling l10 were an5.4.
age | 30
tings withonitoring
ises usingmance of d
Top loadingaseous ca
IES
lity in 35 m
on the aan cities (plocations. nalyzed. Ai
h monitoriactivities
g Ring Tesifferent lab
ng calibratalibration
metro citi
air qualitypopulationMainly thrir quality
ing agenciand to
st Facility boratories.
tion of Red. Calibra
ies
y in citiesn 10 lacsree criteriatrend w.r.
ies to distake reme
are regu
espirable Dation of ba
s having ; Census 2
a air pollutt. most of
cuss edial
ularly
Dust alance
high 2001 tants f the
Page | 31
Table 5.4: Ambient Air Quality trend in cities during 2008 – 2010
City Name 2008 2009 2010
SO2 NO2 PM10 SO2 NO2 PM10 SO2 NO2 PM10 Agra 9 10 184 6 21 185 9 11 156 Ahmedabad 12 20 80 16 21 95 16 21 96 Allahabad 8 35 128 BDL 24 160 5 24 218 Amritsar 15 36 - 15 35 190 14 36 218 Asansol 9 74 135 9 62 163 8 66 140 Bangalore 15 40 90 16 40 122 15 31 94 Bhopal 7 15 93 7 18 115 7 15 116 Chennai 6 9 48 9 17 70 9 15 59 Coimbatore 5 28 55 6 29 74 6 28 75 Dhanbad 19 44 131 17* 41 164 15 38 112 Delhi 5 45 198 6 49 243 5 55 259 Faridabad 13 25 139 15 23 154 18 31 163 Hyderabad 6 27 87 5 22 80 5 25 81 Jaipur 6 34 112 6 36 151 6 39 171 Jabalpur BDL 25 136 BDL 24 136 BDL 24 107 Jamshedpur 37 51 172 36 49 172 36 48 154 Indore 9 17 174 9* 17* 183* 14 18 120 Kanpur 7 23 209 8 31 211 7 34 208 Kochi 5 19 40 BDL 12 40 4 11 36 Kolkata 9 58 148 16 56 187 11 62 98 Lucknow 8 35 186 8 36 197 8 34 204 Ludhiana 10 39 251 9 37 254 9 32 229 Madurai 10 23 41 10 25 42 11 25 47 Meerut 10 42 115 8* 43* 118* 8 48 170 Mumbai 9 42 132 6 42 109 4 21 94 Nagpur 8 32 98 6 30 99 7 29 86 Nashik 30 25 80 23 29 89 22 34 79 Patna 7 39 120 5 37 146 7 36 165 Pune 22 38 99 23 40 82 26 36 65 Rajkot 10 13 89 11 15 105 14 18 97 Surat 16 23 81 19 26 91 18 25 77 Vadodara 11 21 57 16 30 86 17 29 94 Varanasi 16 19 106 17 20 125 18* 20* - Vijayawada 5 26 91 5 14 80 6 13 98 Visakhapatnam 10 31 87 13 32 97 7 16 69
All values are in g/m3. Note:- ‘-‘ Data not available. BDL – Below Detection Limit (i.e. less than 4 micrograms per cubicmeter for SO2 and less than 9 micrograms per cubicmeter for NO2). Data of Agra is of Taj Mahal is of sensitive Area. Data as reported in monthly summary sheet\Environmental Data Bank\Hard copy available as on date. * - Data is inadequate for annual average. Data for 2010 is average of data available as on date. National Ambient Air Quality Standard for Residential Areas (Annual average) for SO2 = 50 microgramme per cubic metre, NO2 = 40 microgramme per cubic metre and PM10 = 60 microgramme per cubic metre.
Page | 32
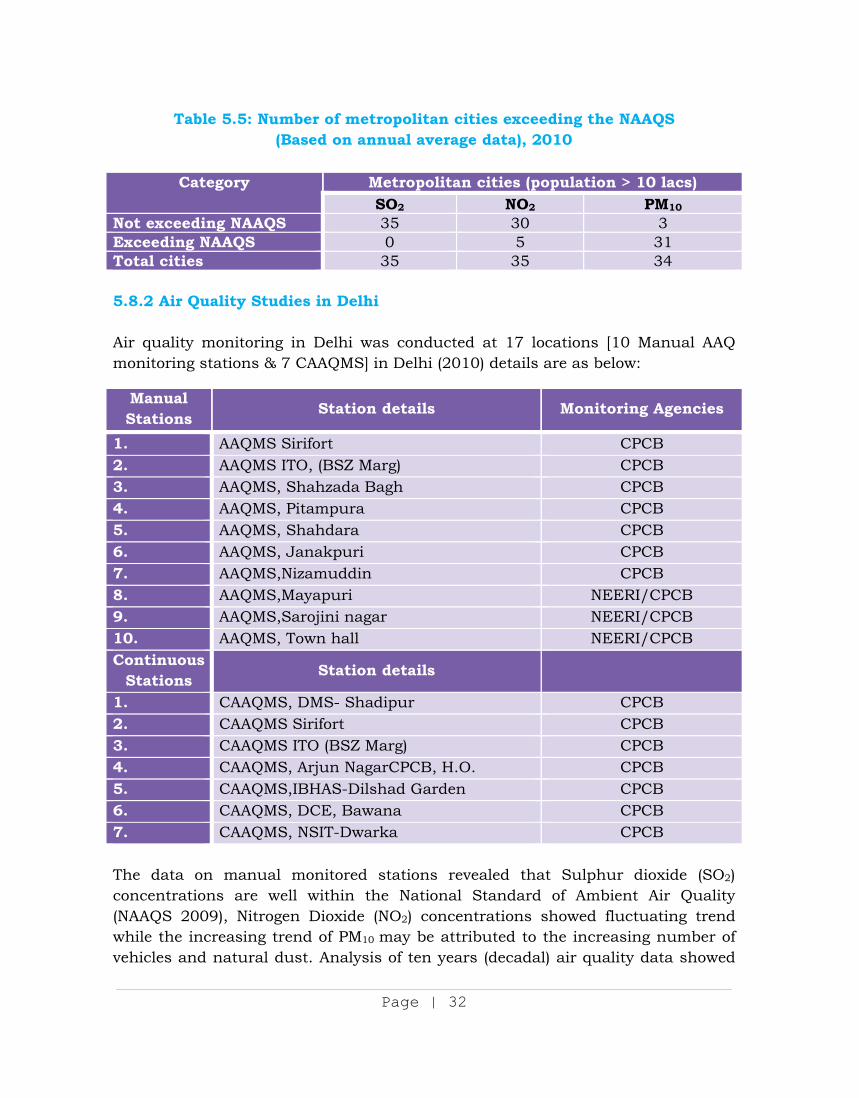
Table 5.5: Number of metropolitan cities exceeding the NAAQS (Based on annual average data), 2010
Category
Metropolitan cities (population > 10 lacs)SO2 NO2 PM10
Not exceeding NAAQS 35 30 3 Exceeding NAAQS 0 5 31 Total cities 35 35 34 5.8.2 Air Quality Studies in Delhi Air quality monitoring in Delhi was conducted at 17 locations [10 Manual AAQ monitoring stations & 7 CAAQMS] in Delhi (2010) details are as below:
Manual Stations Station details Monitoring Agencies
1. AAQMS Sirifort CPCB 2. AAQMS ITO, (BSZ Marg) CPCB 3. AAQMS, Shahzada Bagh CPCB 4. AAQMS, Pitampura CPCB 5. AAQMS, Shahdara CPCB 6. AAQMS, Janakpuri CPCB 7. AAQMS,Nizamuddin CPCB 8. AAQMS,Mayapuri NEERI/CPCB 9. AAQMS,Sarojini nagar NEERI/CPCB 10. AAQMS, Town hall NEERI/CPCB Continuous
Stations Station details
1. CAAQMS, DMS- Shadipur CPCB 2. CAAQMS Sirifort CPCB 3. CAAQMS ITO (BSZ Marg) CPCB 4. CAAQMS, Arjun NagarCPCB, H.O. CPCB 5. CAAQMS,IBHAS-Dilshad Garden CPCB 6. CAAQMS, DCE, Bawana CPCB 7. CAAQMS, NSIT-Dwarka CPCB The data on manual monitored stations revealed that Sulphur dioxide (SO2) concentrations are well within the National Standard of Ambient Air Quality (NAAQS 2009), Nitrogen Dioxide (NO2) concentrations showed fluctuating trend while the increasing trend of PM10 may be attributed to the increasing number of vehicles and natural dust. Analysis of ten years (decadal) air quality data showed
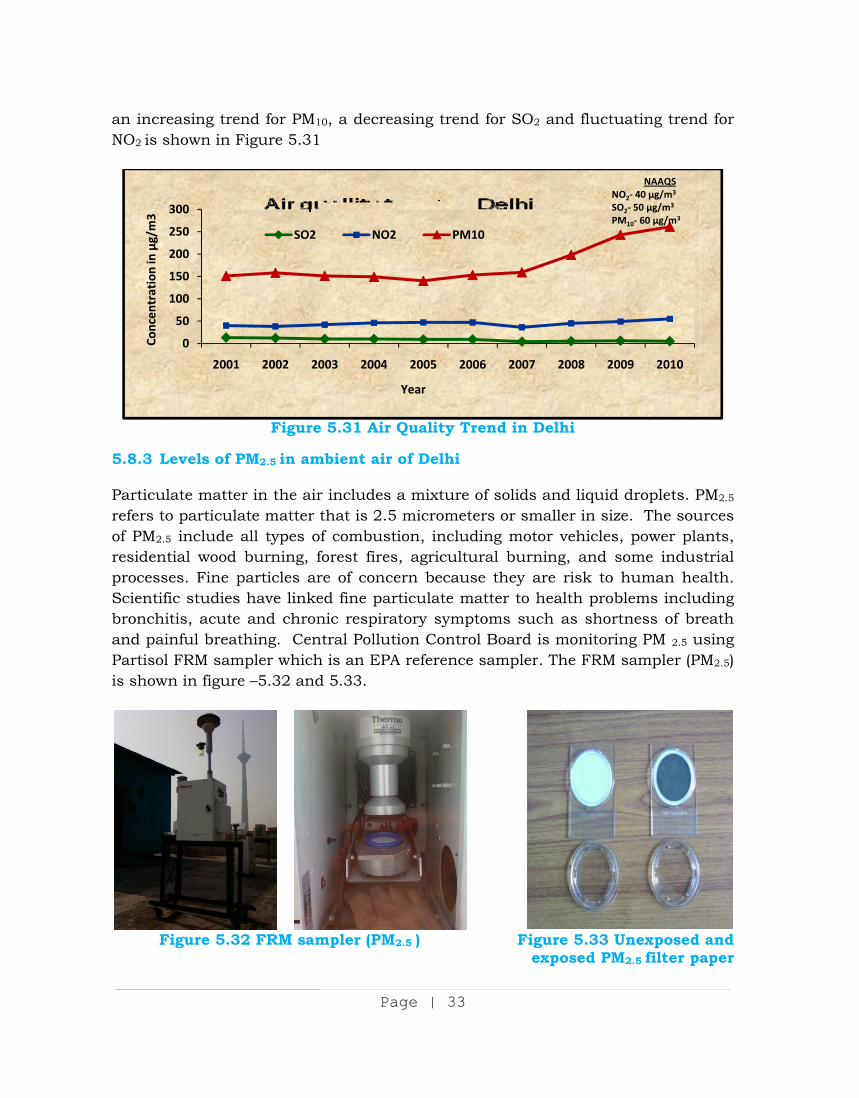
an increNO2 is s
5.8.3 L Particulrefers toof PM2.5
residentprocessScientifbronchiand paiPartisolis show
F
Conc
entr
atio
n in
µg/
m3
easing trenshown in F
Levels of P
late mattero particula5 include atial wood es. Fine p
fic studies itis, acute inful breathl FRM samn in figure
Figure 5.32
0
50
100
150
200
250
300
2001
nd for PM1
Figure 5.31
Figure
PM2.5 in am
r in the airate matter all types oburning, f
particles arhave linkeand chronhing. Cen
mpler whiche –5.32 and
2 FRM sam
2002 20
SO2
Pa
10, a decrea
e 5.31 Air
mbient air
r includes that is 2.5f combustforest firesre of conceed fine parnic respirantral Polluth is an EPAd 5.33.
mpler (PM2
003 2004
NO2
age | 33
asing trend
Quality Tr
of Delhi
a mixture micromet
tion, includs, agricultuern becausrticulate matory symption ControA reference
2.5 )
2005 20
Year
PM1
d for SO2 a
rend in De
of solids aters or smading motorural burninse they ar
matter to heptoms suchol Board ise sampler.
Figuex
006 2007
10
and fluctu
elhi
and liquid aller in sizer vehicles, ng, and soe risk to health problh as shorts monitorinThe FRM s
ure 5.33 Uxposed PM
2008 200
NOSO2
PM
ating trend
droplets. Pe. The sou
power plaome indushuman helems incluness of br
ng PM 2.5 usampler (P
Unexposed M2.5 filter pa
09 2010
NAAQSO2- 40 µg/m3
2- 50 µg/m3
M10- 60 µg/m3
d for
PM2.5
urces ants, strial alth.
uding reath using M2.5)
and aper
Page | 34
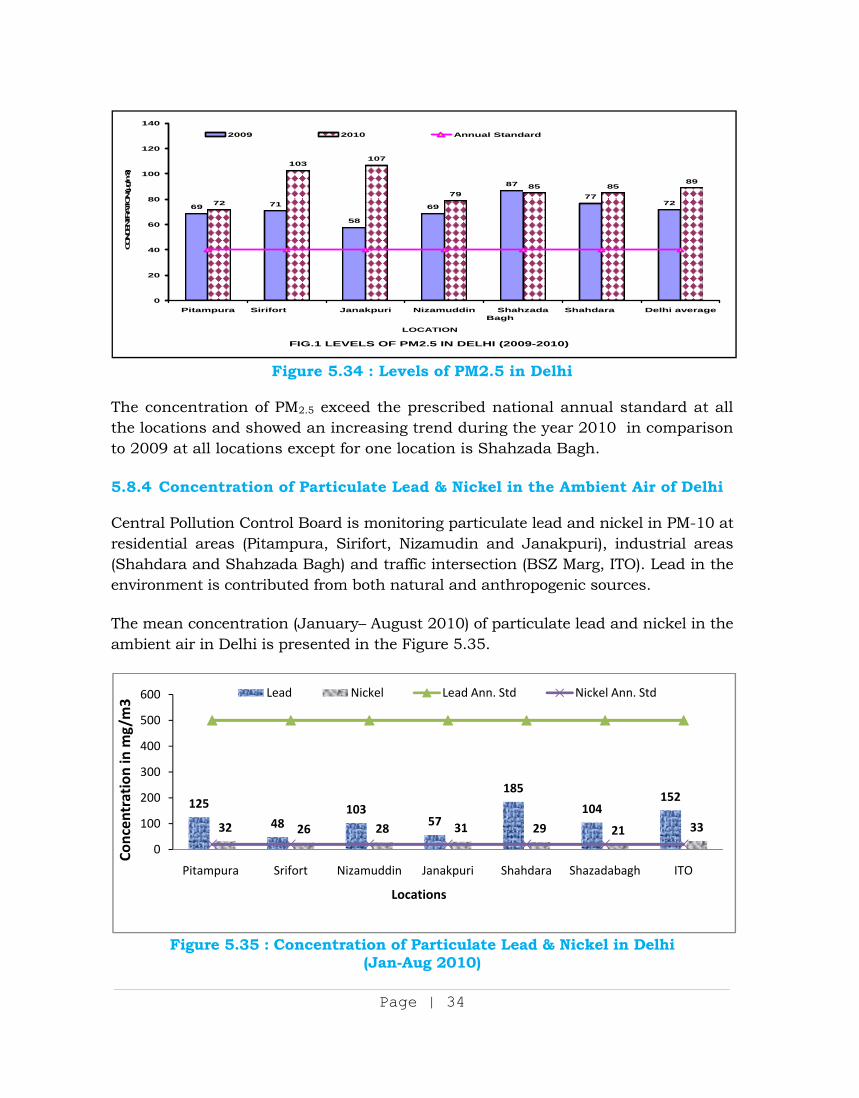
Figure 5.34 : Levels of PM2.5 in Delhi
The concentration of PM2.5 exceed the prescribed national annual standard at all the locations and showed an increasing trend during the year 2010 in comparison to 2009 at all locations except for one location is Shahzada Bagh. 5.8.4 Concentration of Particulate Lead & Nickel in the Ambient Air of Delhi Central Pollution Control Board is monitoring particulate lead and nickel in PM-10 at residential areas (Pitampura, Sirifort, Nizamudin and Janakpuri), industrial areas (Shahdara and Shahzada Bagh) and traffic intersection (BSZ Marg, ITO). Lead in the environment is contributed from both natural and anthropogenic sources. The mean concentration (January– August 2010) of particulate lead and nickel in the ambient air in Delhi is presented in the Figure 5.35.
Figure 5.35 : Concentration of Particulate Lead & Nickel in Delhi
(Jan-Aug 2010)
FIG.1 LEVELS OF PM2.5 IN DELHI (2009-2010)
69 71
58
69
87
777272
103107
7985 85
89
0
20
40
60
80
100
120
140
Pitampura Sirifort Janakpuri Nizamuddin ShahzadaBagh
Shahdara Delhi average
LOCATION
CONCEN
TRATION (µ
g/m3)
2009 2010 Annual Standard
125
48103
57
185
104152
32 26 28 31 29 21 33
0
100
200
300
400
500
600
Pitampura Srifort Nizamuddin Janakpuri Shahdara Shazadabagh ITO
Conc
entr
atio
n in
mg/
m3
Locations
Lead Nickel Lead Ann. Std Nickel Ann. Std
The meawere ob(Shahzaof lead wof nickeconcentto 185 n 5.8.5 B BenzeneJanakpuArjun NPassive 2010) of
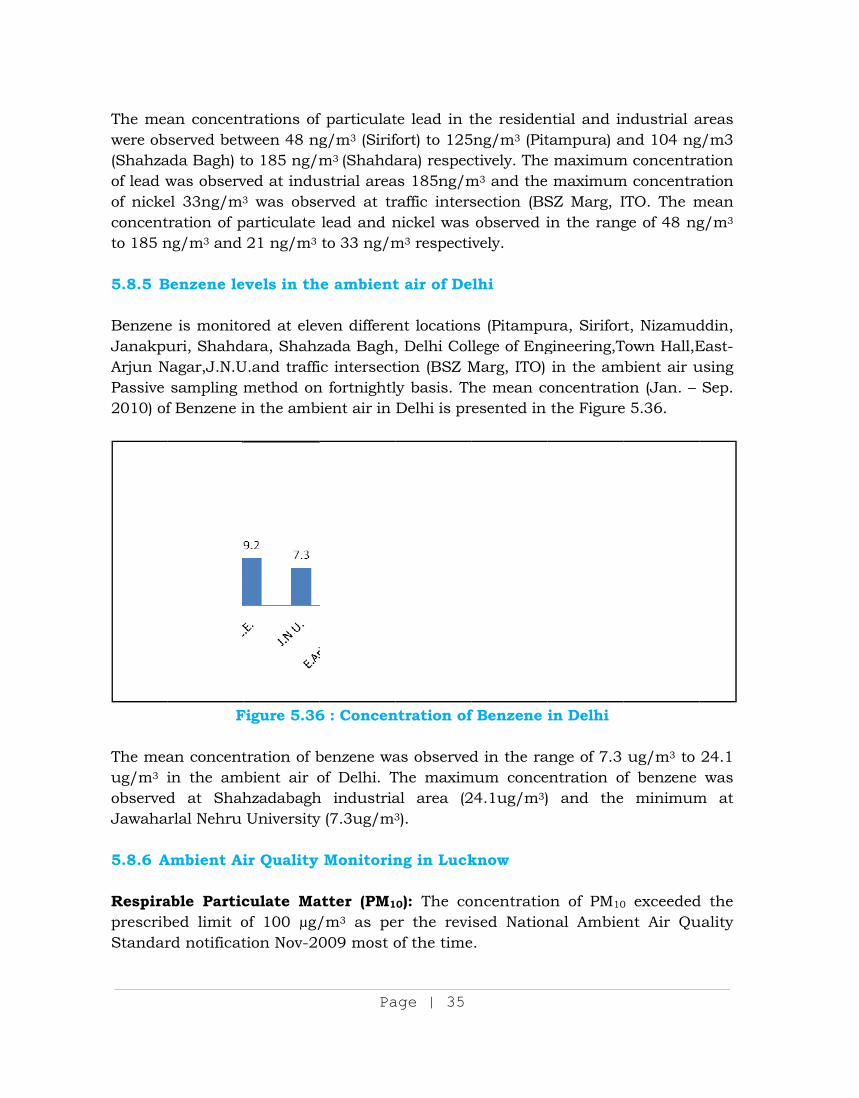
The meaug/m3 iobservedJawaha 5.8.6 A RespiraprescribStandar
an concenserved betw
ada Bagh) twas observel 33ng/m3
tration of png/m3 and
Benzene le
e is monitouri, Shahd
Nagar,J.N.Usampling f Benzene i
F
an concentin the amd at Shah
arlal Nehru
Ambient Ai
able Particbed limit ord notificat
trations ofween 48 ngto 185 ng/mved at indu3 was obse
particulate 21 ng/m3
evels in th
ored at elevdara, ShahzU.and traffimethod onin the amb
Figure 5.36
tration of bmbient air o
hzadabaghUniversity
ir Quality
culate Maof 100 µg/tion Nov-20
Pa
f particulatg/m3 (Sirifm3 (Shahda
ustrial areaerved at trlead and nto 33 ng/m
he ambient
ven differenzada Bagh,ic intersectn fortnightlbient air in
6 : Concen
benzene waof Delhi. T
h industriay (7.3ug/m3
Monitorin
atter (PM1
/m3 as pe009 most o
age | 35
te lead in tfort) to 125ara) respec
as 185ng/mraffic intersnickel was m3 respecti
t air of De
nt location, Delhi Coltion (BSZ Mly basis. ThDelhi is pr
ntration of
as observedThe maximal area (23).
ng in Luck
0): The coer the reviof the time
the residen5ng/m3 (Pitctively. Them3 and thesection (BSobserved i
ively.
elhi
ns (Pitampullege of EngMarg, ITO) he mean coresented in
f Benzene
d in the ramum conce24.1ug/m3)
know
oncentratioised Natione.
ntial and intampura) ae maximum maximumSZ Marg, Iin the rang
ura, Siriforgineering,Tin the am
oncentratiothe Figure
in Delhi
ange of 7.3 entration o) and the
on of PM10
nal Ambie
ndustrial aand 104 ngm concentram concentraITO. The mge of 48 ng
rt, NizamudTown Hall,E
mbient air uon (Jan. –e 5.36.
ug/m3 to of benzene minimum
0 exceedednt Air Qu
areas g/m3 ation ation mean g/m3
ddin, East-using Sep.
24.1 was
m at
d the uality
Page | 36
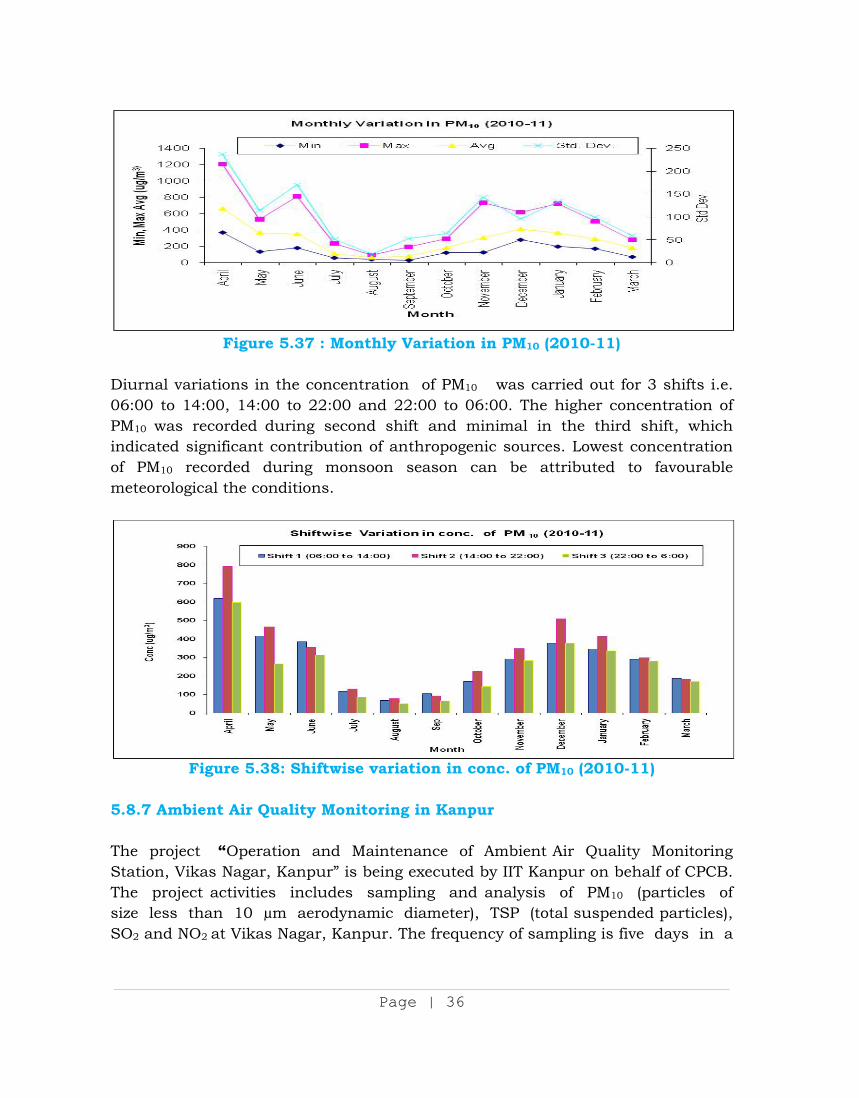
Figure 5.37 : Monthly Variation in PM10 (2010-11)
Diurnal variations in the concentration of PM10 was carried out for 3 shifts i.e. 06:00 to 14:00, 14:00 to 22:00 and 22:00 to 06:00. The higher concentration of PM10 was recorded during second shift and minimal in the third shift, which indicated significant contribution of anthropogenic sources. Lowest concentration of PM10 recorded during monsoon season can be attributed to favourable meteorological the conditions.
Figure 5.38: Shiftwise variation in conc. of PM10 (2010-11)
5.8.7 Ambient Air Quality Monitoring in Kanpur The project “Operation and Maintenance of Ambient Air Quality Monitoring Station, Vikas Nagar, Kanpur” is being executed by IIT Kanpur on behalf of CPCB. The project activities includes sampling and analysis of PM10 (particles of size less than 10 µm aerodynamic diameter), TSP (total suspended particles), SO2 and NO2 at Vikas Nagar, Kanpur. The frequency of sampling is five days in a
Page | 37
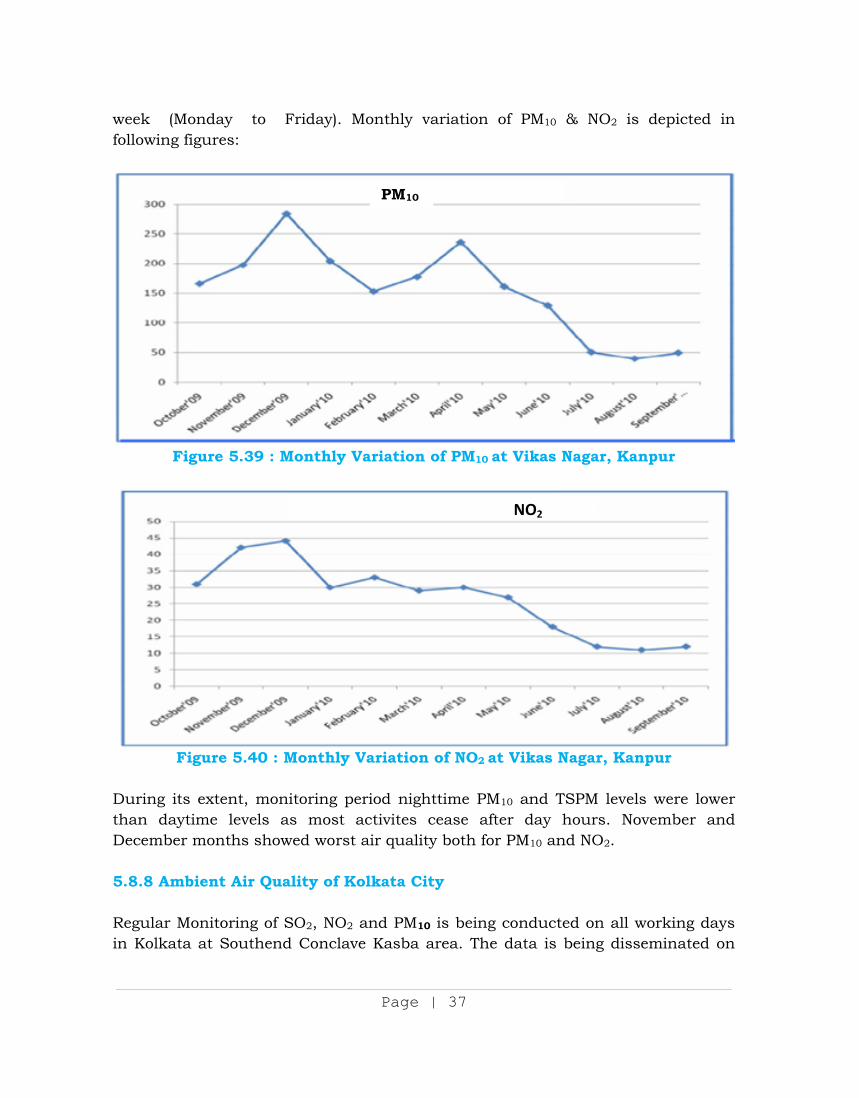
week (Monday to Friday). Monthly variation of PM10 & NO2 is depicted in following figures:
Figure 5.39 : Monthly Variation of PM10 at Vikas Nagar, Kanpur
Figure 5.40 : Monthly Variation of NO2 at Vikas Nagar, Kanpur During its extent, monitoring period nighttime PM10 and TSPM levels were lower than daytime levels as most activites cease after day hours. November and December months showed worst air quality both for PM10 and NO2. 5.8.8 Ambient Air Quality of Kolkata City Regular Monitoring of SO2, NO2 and PM10 is being conducted on all working days in Kolkata at Southend Conclave Kasba area. The data is being disseminated on
NO2
PM10
Page | 38
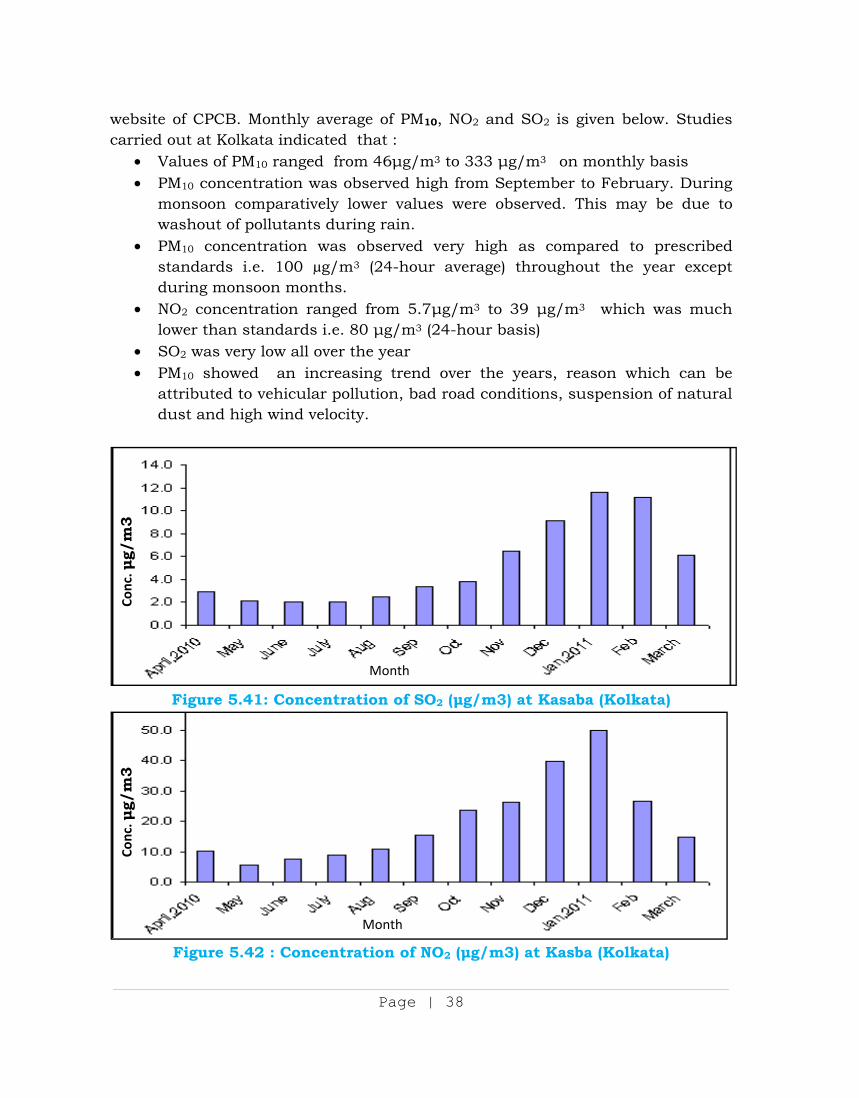
website of CPCB. Monthly average of PM10, NO2 and SO2 is given below. Studies carried out at Kolkata indicated that :
Values of PM10 ranged from 46 g/m3 to 333 g/m3 on monthly basis PM10 concentration was observed high from September to February. During
monsoon comparatively lower values were observed. This may be due to washout of pollutants during rain.
PM10 concentration was observed very high as compared to prescribed standards i.e. 100 µg/m3 (24-hour average) throughout the year except during monsoon months.
NO2 concentration ranged from 5.7 g/m3 to 39 g/m3 which was much lower than standards i.e. 80 g/m3 (24-hour basis)
SO2 was very low all over the year PM10 showed an increasing trend over the years, reason which can be
attributed to vehicular pollution, bad road conditions, suspension of natural dust and high wind velocity.
Figure 5.41: Concentration of SO2 ( g/m3) at Kasaba (Kolkata)
Figure 5.42 : Concentration of NO2 ( g/m3) at Kasba (Kolkata)
Conc
. g/
m3
Conc
. g/
m3
Month
Month
Page | 39
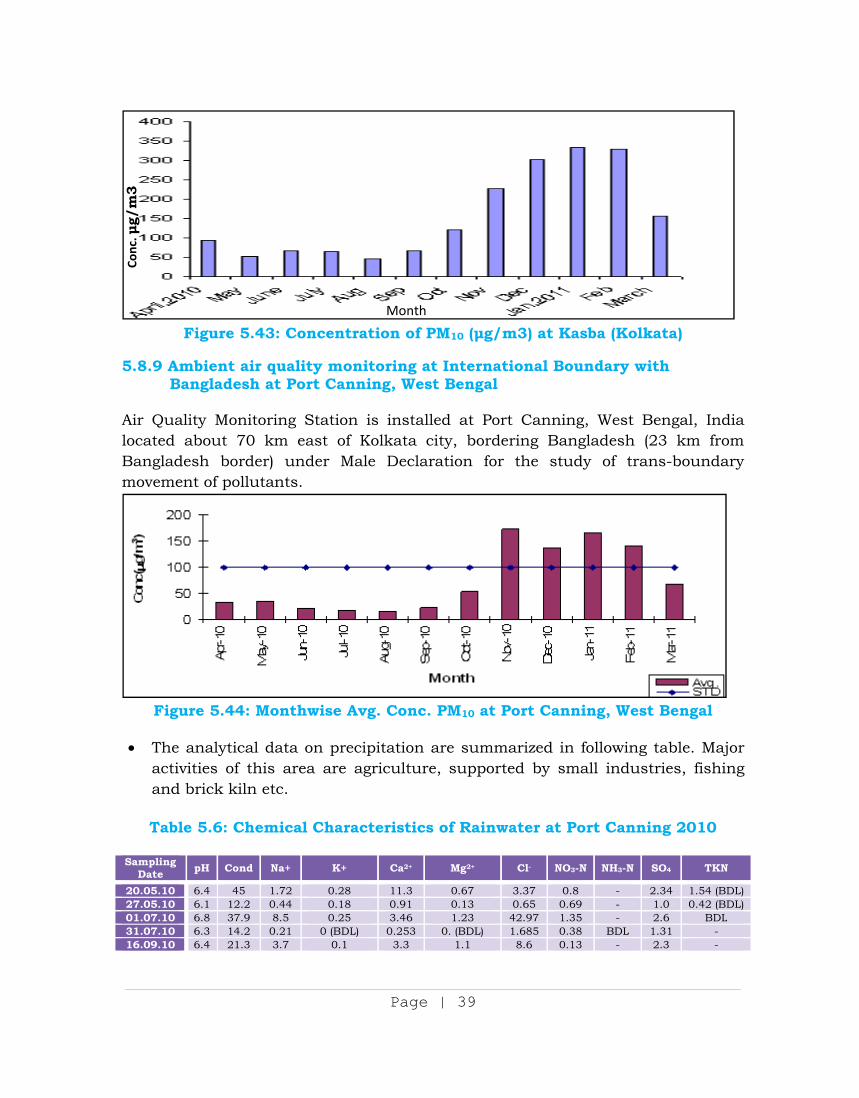
Figure 5.43: Concentration of PM10 ( g/m3) at Kasba (Kolkata)
5.8.9 Ambient air quality monitoring at International Boundary with Bangladesh at Port Canning, West Bengal Air Quality Monitoring Station is installed at Port Canning, West Bengal, India located about 70 km east of Kolkata city, bordering Bangladesh (23 km from Bangladesh border) under Male Declaration for the study of trans-boundary movement of pollutants.
Figure 5.44: Monthwise Avg. Conc. PM10 at Port Canning, West Bengal
The analytical data on precipitation are summarized in following table. Major
activities of this area are agriculture, supported by small industries, fishing and brick kiln etc. Table 5.6: Chemical Characteristics of Rainwater at Port Canning 2010
Sampling
Date pH Cond Na+ K+ Ca2+ Mg2+ Cl- NO3-N NH3-N SO4 TKN
20.05.10 6.4 45 1.72 0.28 11.3 0.67 3.37 0.8 - 2.34 1.54 (BDL)27.05.10 6.1 12.2 0.44 0.18 0.91 0.13 0.65 0.69 - 1.0 0.42 (BDL)01.07.10 6.8 37.9 8.5 0.25 3.46 1.23 42.97 1.35 - 2.6 BDL31.07.10 6.3 14.2 0.21 0 (BDL) 0.253 0. (BDL) 1.685 0.38 BDL 1.31 -16.09.10 6.4 21.3 3.7 0.1 3.3 1.1 8.6 0.13 - 2.3 -
Conc
. g/
m3
Month
Page | 40
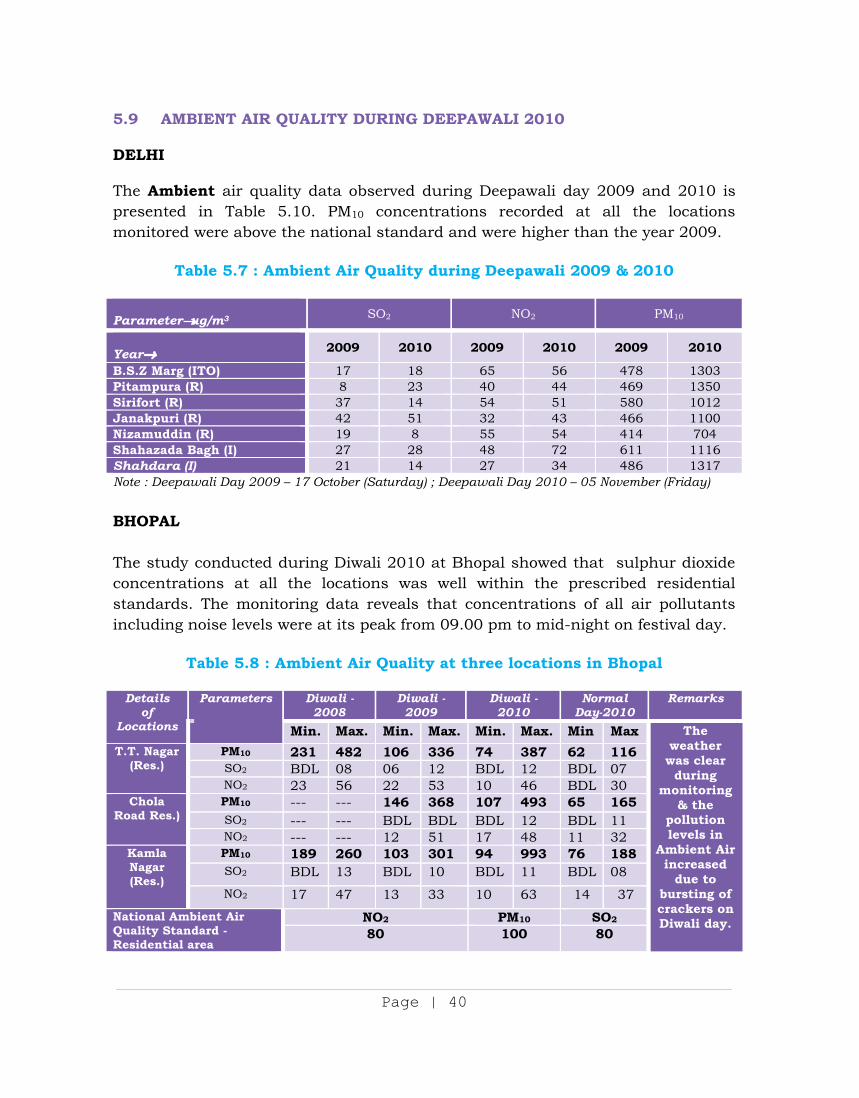
5.9 AMBIENT AIR QUALITY DURING DEEPAWALI 2010 DELHI The Ambient air quality data observed during Deepawali day 2009 and 2010 is presented in Table 5.10. PM10 concentrations recorded at all the locations monitored were above the national standard and were higher than the year 2009.
Table 5.7 : Ambient Air Quality during Deepawali 2009 & 2010
Parameter ug/m3 SO2 NO2 PM10
Year 2009 2010 2009 2010 2009 2010
B.S.Z Marg (ITO) 17 18 65 56 478 1303 Pitampura (R) 8 23 40 44 469 1350 Sirifort (R) 37 14 54 51 580 1012 Janakpuri (R) 42 51 32 43 466 1100 Nizamuddin (R) 19 8 55 54 414 704 Shahazada Bagh (I) 27 28 48 72 611 1116 Shahdara (I) 21 14 27 34 486 1317 Note : Deepawali Day 2009 – 17 October (Saturday) ; Deepawali Day 2010 – 05 November (Friday) BHOPAL The study conducted during Diwali 2010 at Bhopal showed that sulphur dioxide concentrations at all the locations was well within the prescribed residential standards. The monitoring data reveals that concentrations of all air pollutants including noise levels were at its peak from 09.00 pm to mid-night on festival day.
Table 5.8 : Ambient Air Quality at three locations in Bhopal
Details of
Locations
Parameters Diwali - 2008
Diwali - 2009
Diwali - 2010
Normal Day-2010
Remarks
Min. Max. Min. Max. Min. Max. Min Max The weather was clear
during monitoring
& the pollution levels in
Ambient Air increased
due to bursting of crackers on Diwali day.
T.T. Nagar (Res.)
PM10 231 482 106 336 74 387 62 116 SO2 BDL 08 06 12 BDL 12 BDL 07 NO2 23 56 22 53 10 46 BDL 30
Chola Road Res.)
PM10 --- --- 146 368 107 493 65 165 SO2 --- --- BDL BDL BDL 12 BDL 11 NO2 --- --- 12 51 17 48 11 32
Kamla Nagar (Res.)
PM10 189 260 103 301 94 993 76 188 SO2 BDL 13 BDL 10 BDL 11 BDL 08 NO2 17 47 13 33 10 63 14 37
National Ambient Air Quality Standard -Residential area
NO2 PM10 SO2
80 100 80
Page | 41
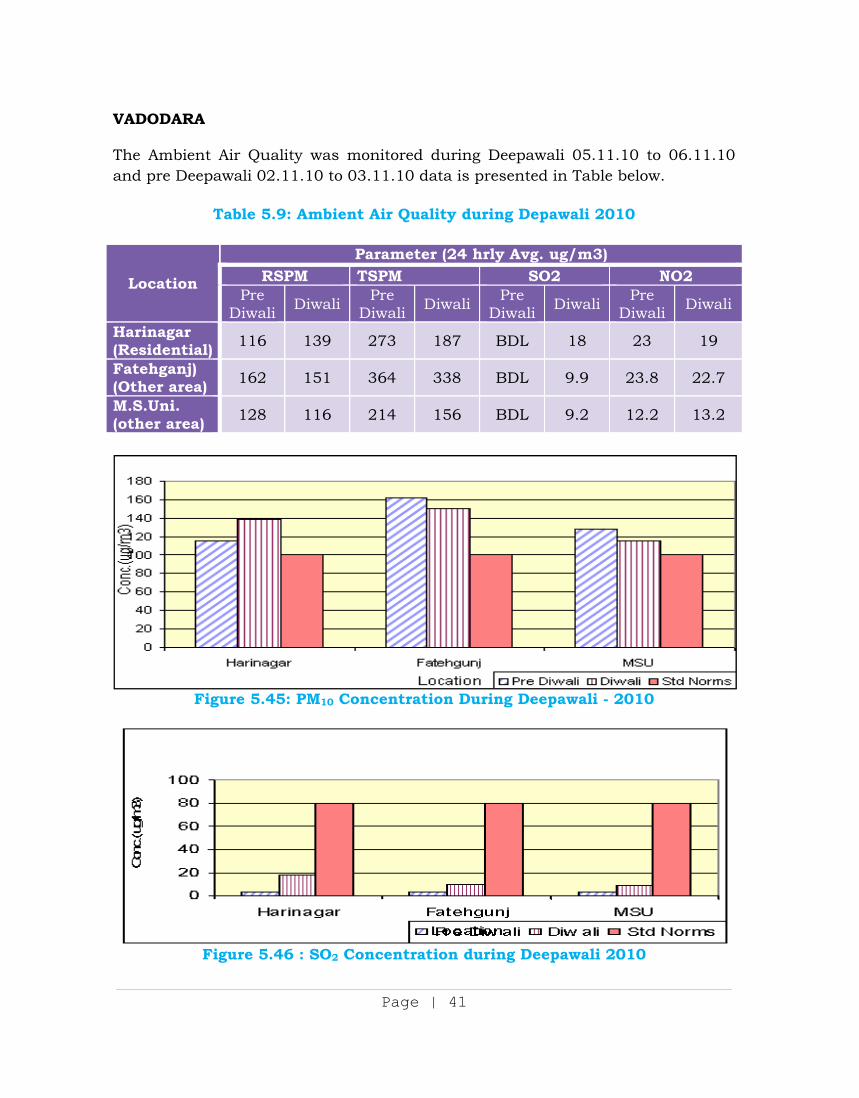
VADODARA The Ambient Air Quality was monitored during Deepawali 05.11.10 to 06.11.10 and pre Deepawali 02.11.10 to 03.11.10 data is presented in Table below.
Table 5.9: Ambient Air Quality during Depawali 2010
Location
Parameter (24 hrly Avg. ug/m3) RSPM TSPM SO2 NO2
Pre Diwali Diwali Pre
Diwali Diwali Pre Diwali Diwali Pre
Diwali Diwali
Harinagar (Residential) 116 139 273 187 BDL 18 23 19
Fatehganj) (Other area) 162 151 364 338 BDL 9.9 23.8 22.7
M.S.Uni. (other area) 128 116 214 156 BDL 9.2 12.2 13.2
Figure 5.45: PM10 Concentration During Deepawali - 2010
Figure 5.46 : SO2 Concentration during Deepawali 2010
Page | 42
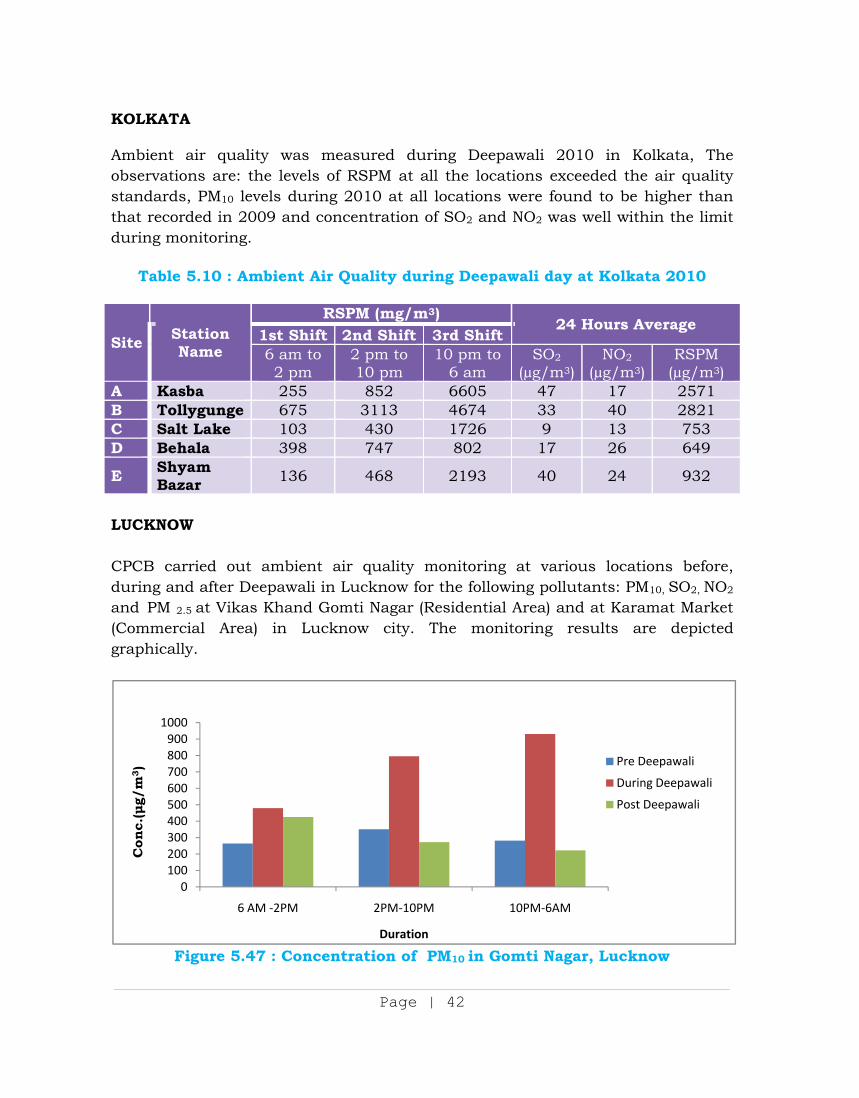
KOLKATA Ambient air quality was measured during Deepawali 2010 in Kolkata, The observations are: the levels of RSPM at all the locations exceeded the air quality standards, PM10 levels during 2010 at all locations were found to be higher than that recorded in 2009 and concentration of SO2 and NO2 was well within the limit during monitoring.
Table 5.10 : Ambient Air Quality during Deepawali day at Kolkata 2010
Site Station Name
RSPM (mg/m3) 24 Hours Average
1st Shift 2nd Shift 3rd Shift6 am to 2 pm
2 pm to 10 pm
10 pm to 6 am
SO2
(µg/m3)NO2
(µg/m3) RSPM
(µg/m3) A Kasba 255 852 6605 47 17 2571 B Tollygunge 675 3113 4674 33 40 2821 C Salt Lake 103 430 1726 9 13 753 D Behala 398 747 802 17 26 649
E Shyam Bazar 136 468 2193 40 24 932
LUCKNOW CPCB carried out ambient air quality monitoring at various locations before, during and after Deepawali in Lucknow for the following pollutants: PM10, SO2, NO2
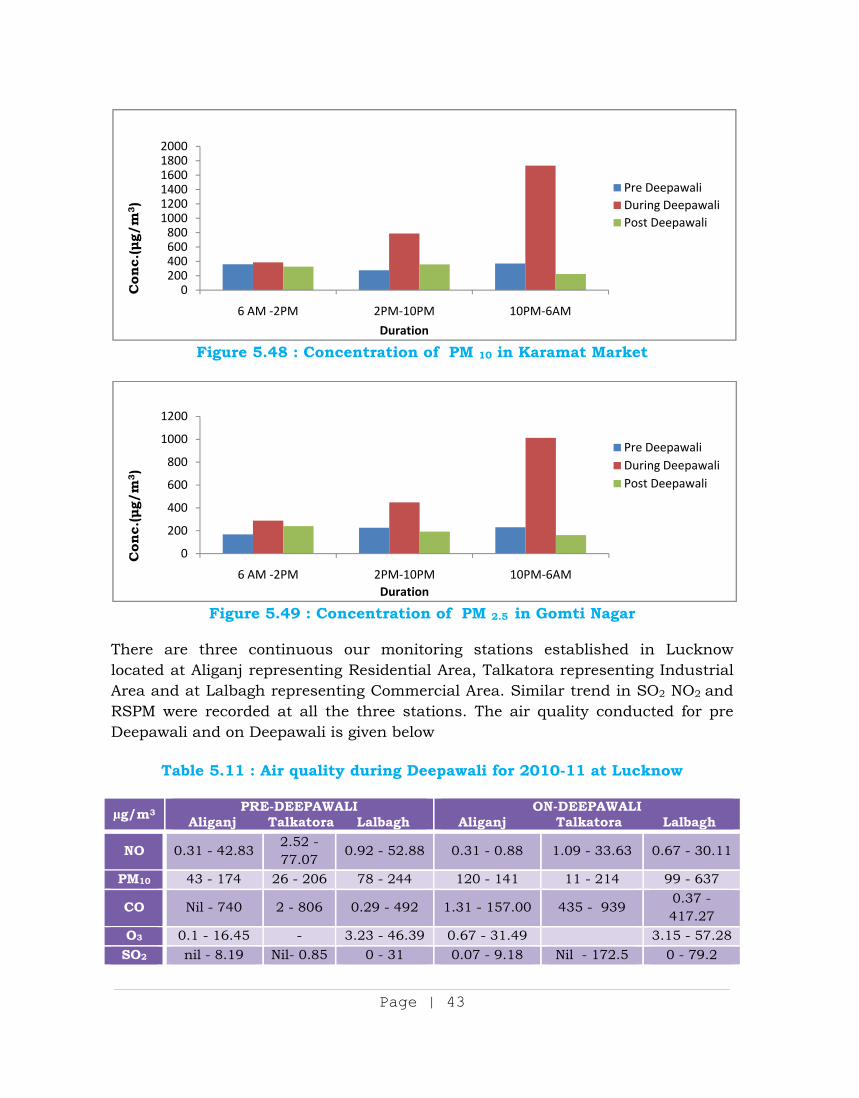
and PM 2.5 at Vikas Khand Gomti Nagar (Residential Area) and at Karamat Market (Commercial Area) in Lucknow city. The monitoring results are depicted graphically.
Figure 5.47 : Concentration of PM10 in Gomti Nagar, Lucknow
0100200300400500600700800900
1000
6 AM -2PM 2PM-10PM 10PM-6AM
Con
c.(
g/m
3 )
Duration
Pre Deepawali
During Deepawali
Post Deepawali
Page | 43
Figure 5.48 : Concentration of PM 10 in Karamat Market
Figure 5.49 : Concentration of PM 2.5 in Gomti Nagar
There are three continuous our monitoring stations established in Lucknow located at Aliganj representing Residential Area, Talkatora representing Industrial Area and at Lalbagh representing Commercial Area. Similar trend in SO2 NO2 and RSPM were recorded at all the three stations. The air quality conducted for pre Deepawali and on Deepawali is given below
Table 5.11 : Air quality during Deepawali for 2010-11 at Lucknow
µg/m3 PRE-DEEPAWALI Aliganj Talkatora Lalbagh
ON-DEEPAWALI Aliganj Talkatora Lalbagh
NO 0.31 - 42.83 2.52 - 77.07
0.92 - 52.88 0.31 - 0.88 1.09 - 33.63 0.67 - 30.11
PM10 43 - 174 26 - 206 78 - 244 120 - 141 11 - 214 99 - 637
CO Nil - 740 2 - 806 0.29 - 492 1.31 - 157.00 435 - 939 0.37 - 417.27
O3 0.1 - 16.45 - 3.23 - 46.39 0.67 - 31.49 3.15 - 57.28 SO2 nil - 8.19 Nil- 0.85 0 - 31 0.07 - 9.18 Nil - 172.5 0 - 79.2
0200400600800
100012001400160018002000
6 AM -2PM 2PM-10PM 10PM-6AM
Con
c.(
g/m
3 )
Duration
Pre DeepawaliDuring DeepawaliPost Deepawali
0
200
400
600
800
1000
1200
6 AM -2PM 2PM-10PM 10PM-6AM
Con
c.(
g/m
3 )
Duration
Pre DeepawaliDuring DeepawaliPost Deepawali
Page | 44
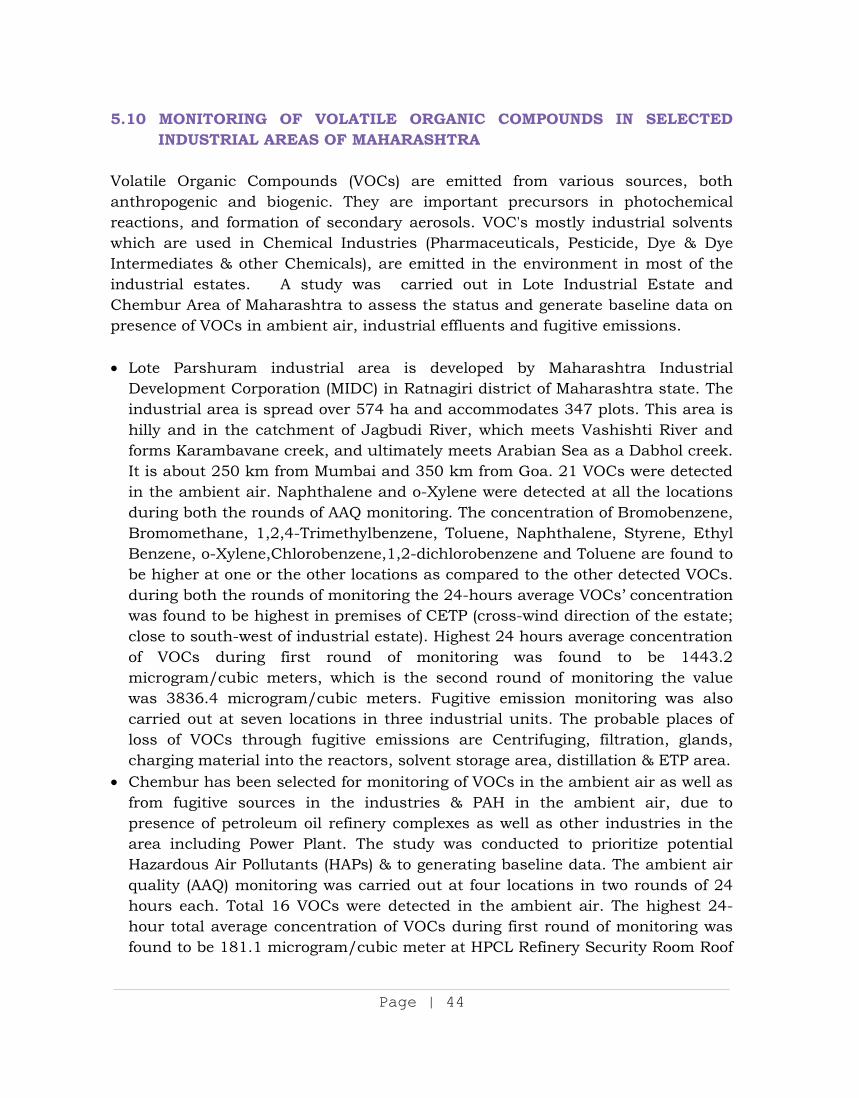
5.10 MONITORING OF VOLATILE ORGANIC COMPOUNDS IN SELECTED INDUSTRIAL AREAS OF MAHARASHTRA
Volatile Organic Compounds (VOCs) are emitted from various sources, both anthropogenic and biogenic. They are important precursors in photochemical reactions, and formation of secondary aerosols. VOC's mostly industrial solvents which are used in Chemical Industries (Pharmaceuticals, Pesticide, Dye & Dye Intermediates & other Chemicals), are emitted in the environment in most of the industrial estates. A study was carried out in Lote Industrial Estate and Chembur Area of Maharashtra to assess the status and generate baseline data on presence of VOCs in ambient air, industrial effluents and fugitive emissions. Lote Parshuram industrial area is developed by Maharashtra Industrial Development Corporation (MIDC) in Ratnagiri district of Maharashtra state. The industrial area is spread over 574 ha and accommodates 347 plots. This area is hilly and in the catchment of Jagbudi River, which meets Vashishti River and forms Karambavane creek, and ultimately meets Arabian Sea as a Dabhol creek. It is about 250 km from Mumbai and 350 km from Goa. 21 VOCs were detected in the ambient air. Naphthalene and o-Xylene were detected at all the locations during both the rounds of AAQ monitoring. The concentration of Bromobenzene, Bromomethane, 1,2,4-Trimethylbenzene, Toluene, Naphthalene, Styrene, Ethyl Benzene, o-Xylene,Chlorobenzene,1,2-dichlorobenzene and Toluene are found to be higher at one or the other locations as compared to the other detected VOCs. during both the rounds of monitoring the 24-hours average VOCs’ concentration was found to be highest in premises of CETP (cross-wind direction of the estate; close to south-west of industrial estate). Highest 24 hours average concentration of VOCs during first round of monitoring was found to be 1443.2 microgram/cubic meters, which is the second round of monitoring the value was 3836.4 microgram/cubic meters. Fugitive emission monitoring was also carried out at seven locations in three industrial units. The probable places of loss of VOCs through fugitive emissions are Centrifuging, filtration, glands, charging material into the reactors, solvent storage area, distillation & ETP area.
Chembur has been selected for monitoring of VOCs in the ambient air as well as from fugitive sources in the industries & PAH in the ambient air, due to presence of petroleum oil refinery complexes as well as other industries in the area including Power Plant. The study was conducted to prioritize potential Hazardous Air Pollutants (HAPs) & to generating baseline data. The ambient air quality (AAQ) monitoring was carried out at four locations in two rounds of 24 hours each. Total 16 VOCs were detected in the ambient air. The highest 24-hour total average concentration of VOCs during first round of monitoring was found to be 181.1 microgram/cubic meter at HPCL Refinery Security Room Roof
Page | 45
Top. The highest average concentration during second round of monitoring was found to be 504.9 microgram/cubic meter at Tata Power Guest House. The concentration of PAH's in the ambient air was also monitored at all four locations. The 24-hourly average concentration of PAM's at the four locations varied in a very wide range of 28.4 ng/m3 to 12416.78 ng/m3. The number of PAHs compounds in particulate phase were more at 3 locations than there is gaseous phase but however the gaseous phase concentration PAMS was higher at 03 locations whereas particulate phase Concentration of PAH was higher than the gaseous phase at Tata Power Guest House. Naphthalene in gaseous phase found to be present at all locations. The highest concentration of Naphthalene in gaseous phase was found to be 12342 ng/m3 at BPCL sports club.
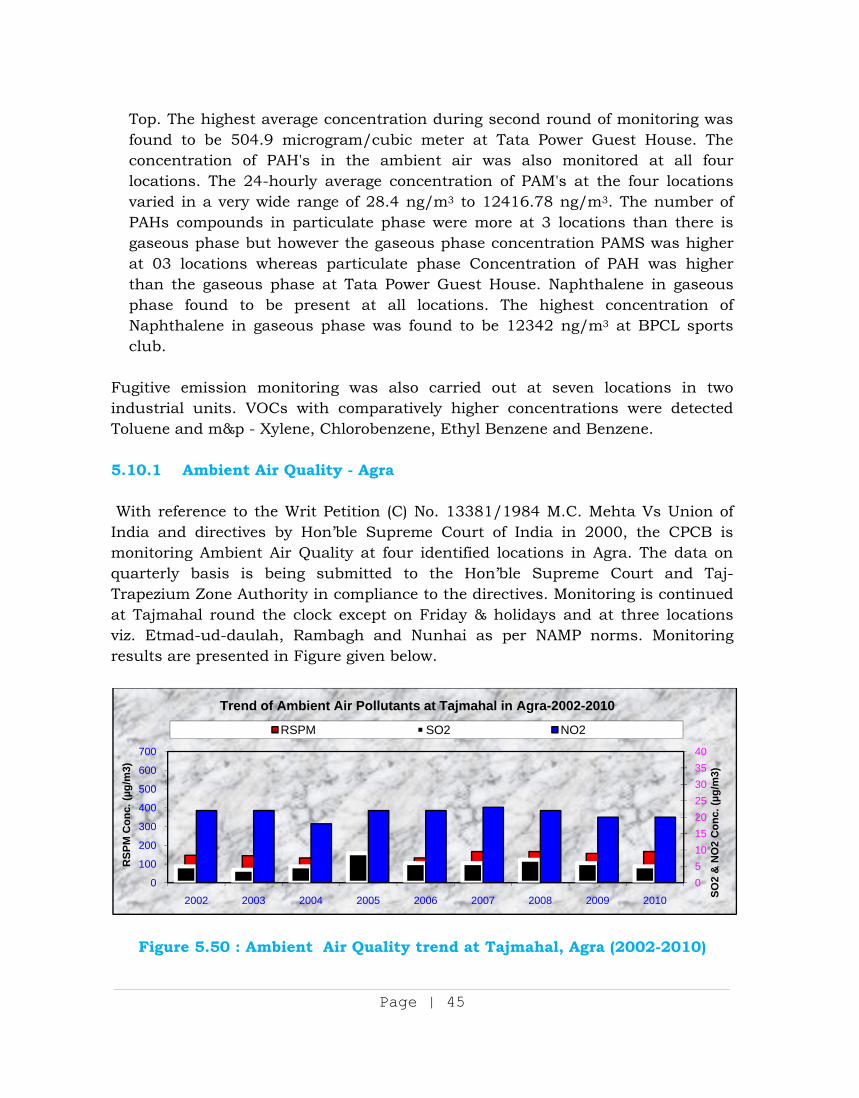
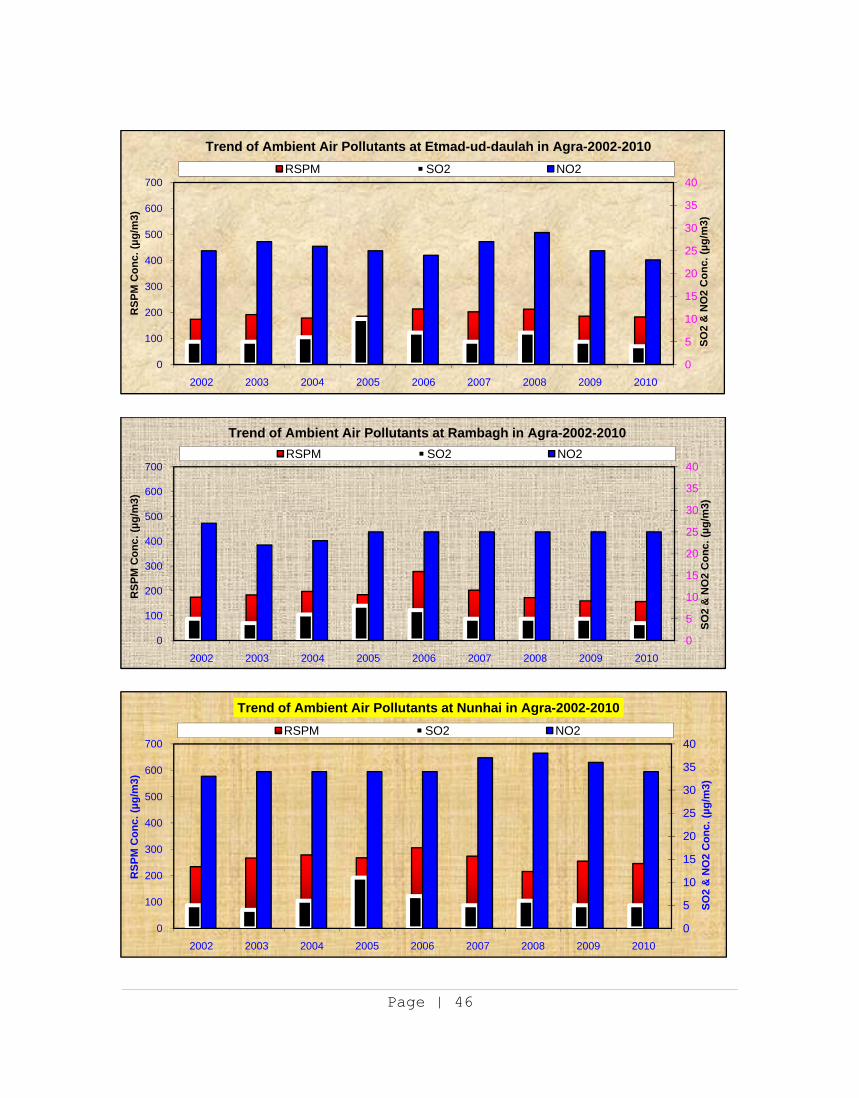
Fugitive emission monitoring was also carried out at seven locations in two industrial units. VOCs with comparatively higher concentrations were detected Toluene and m&p - Xylene, Chlorobenzene, Ethyl Benzene and Benzene. 5.10.1 Ambient Air Quality - Agra With reference to the Writ Petition (C) No. 13381/1984 M.C. Mehta Vs Union of India and directives by Hon’ble Supreme Court of India in 2000, the CPCB is monitoring Ambient Air Quality at four identified locations in Agra. The data on quarterly basis is being submitted to the Hon’ble Supreme Court and Taj-Trapezium Zone Authority in compliance to the directives. Monitoring is continued at Tajmahal round the clock except on Friday & holidays and at three locations viz. Etmad-ud-daulah, Rambagh and Nunhai as per NAMP norms. Monitoring results are presented in Figure given below.
Figure 5.50 : Ambient Air Quality trend at Tajmahal, Agra (2002-2010)
0510152025303540
0
100
200
300
400
500
600
700
2002 2003 2004 2005 2006 2007 2008 2009 2010 SO2
& N
O2
Con
c. (µ
g/m
3)
RSP
M C
onc.
(µg/
m3)
Trend of Ambient Air Pollutants at Tajmahal in Agra-2002-2010
RSPM SO2 NO2
Page | 46
0
5
10
15
20
25
30
35
40
0
100
200
300
400
500
600
700
2002 2003 2004 2005 2006 2007 2008 2009 2010
SO2
& N
O2
Con
c. (µ
g/m
3)
RSP
M C
onc.
(µg/
m3)
Trend of Ambient Air Pollutants at Etmad-ud-daulah in Agra-2002-2010RSPM SO2 NO2
0
5
10
15
20
25
30
35
40
0
100
200
300
400
500
600
700
2002 2003 2004 2005 2006 2007 2008 2009 2010
SO2
& N
O2
Con
c. (µ
g/m
3)
RSP
M C
onc.
(µg/
m3)
Trend of Ambient Air Pollutants at Rambagh in Agra-2002-2010RSPM SO2 NO2
0
5
10
15
20
25
30
35
40
0
100
200
300
400
500
600
700
2002 2003 2004 2005 2006 2007 2008 2009 2010
SO2
& N
O2
Con
c. (µ
g/m
3)
RSP
M C
onc.
(µg/
m3)
Trend of Ambient Air Pollutants at Nunhai in Agra-2002-2010RSPM SO2 NO2
Page | 47
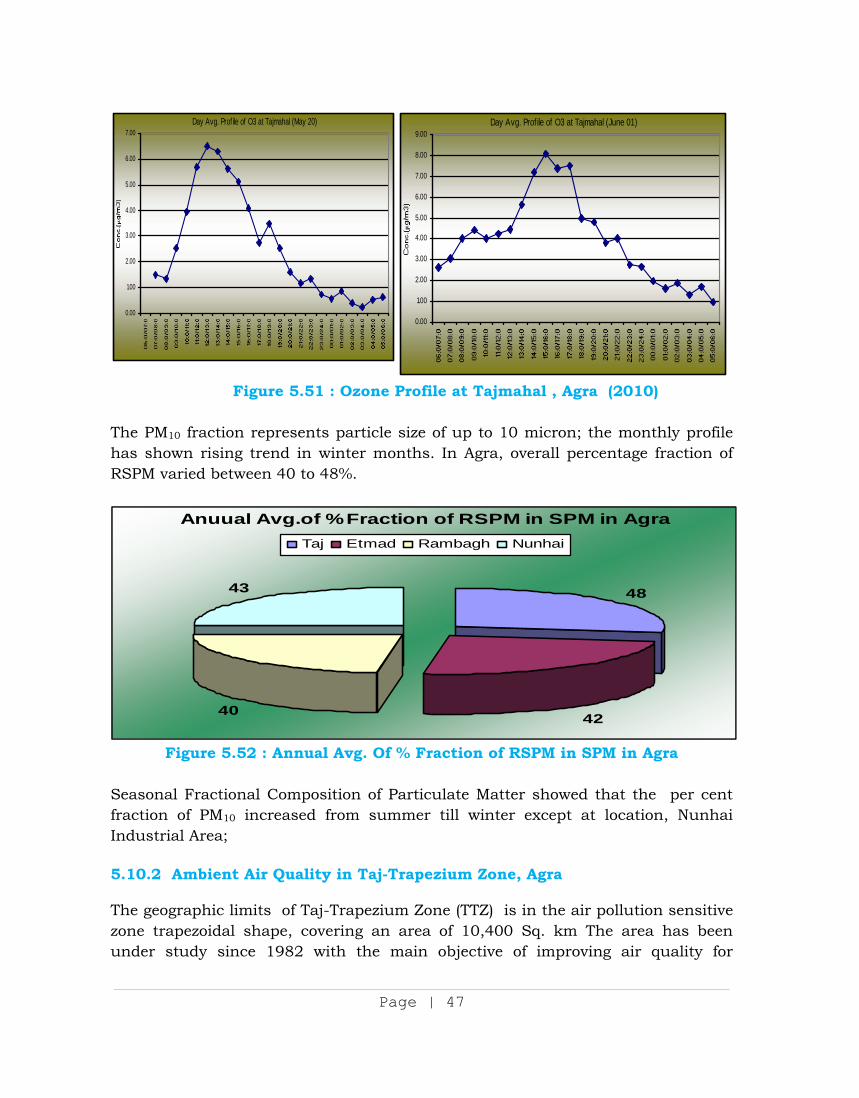
Figure 5.51 : Ozone Profile at Tajmahal , Agra (2010)
The PM10 fraction represents particle size of up to 10 micron; the monthly profile has shown rising trend in winter months. In Agra, overall percentage fraction of RSPM varied between 40 to 48%.
Figure 5.52 : Annual Avg. Of % Fraction of RSPM in SPM in Agra
Seasonal Fractional Composition of Particulate Matter showed that the per cent fraction of PM10 increased from summer till winter except at location, Nunhai Industrial Area;
5.10.2 Ambient Air Quality in Taj-Trapezium Zone, Agra The geographic limits of Taj-Trapezium Zone (TTZ) is in the air pollution sensitive zone trapezoidal shape, covering an area of 10,400 Sq. km The area has been under study since 1982 with the main objective of improving air quality for
Anuual Avg.of %Fraction of RSPM in SPM in Agra
48
4240
43
Taj Etmad Rambagh Nunhai
Day Avg. Prof ile of O3 at Tajmahal (June 01)
0.00
1.00
2.00
3.00
4.00
5.00
6.00
7.00
8.00
9.00Day Avg. Profile of O3 at Tajmahal (May 20)
0.00
1.00
2.00
3.00
4.00
5.00
6.00
7.00
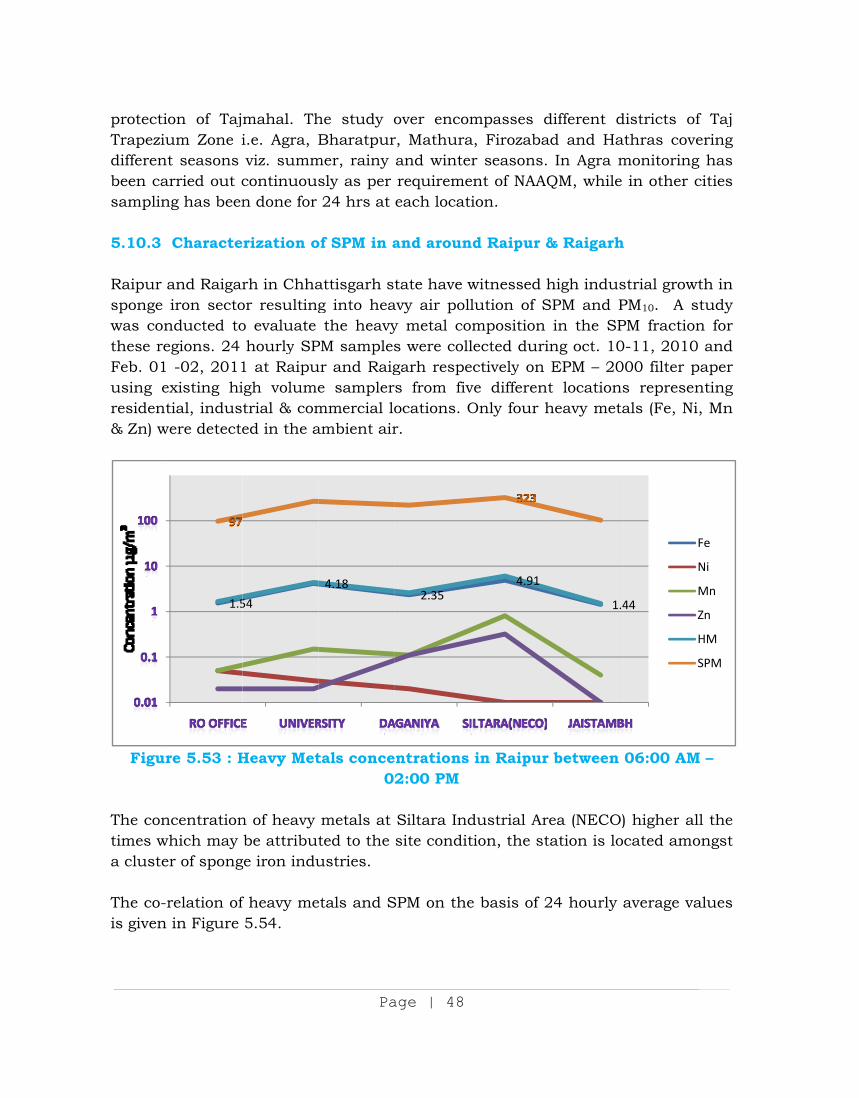
protectiTrapeziudifferenbeen casamplin 5.10.3 Raipur sponge was conthese reFeb. 01using eresident& Zn) w
Figur
The contimes wa cluste The co-is given
ion of Tajum Zone it seasons
arried out cng has been
Characte
and Raigariron secto
nducted toegions. 24 -02, 2011
existing hitial, indus
were detecte
re 5.53 : H
ncentrationwhich may er of spong
relation of in Figure
1.5
mahal. Thi.e. Agra, Bviz. summcontinuousn done for
rization o
rh in Chhaor resultingo evaluate hourly SP
1 at Raipuigh volumetrial & comed in the a
Heavy Met
n of heavy be attribut
ge iron indu
f heavy me5.54.
54
Pa
he study oBharatpur
mer, rainy sly as per 24 hrs at
of SPM in a
attisgarh stg into heathe heavy
PM samplesur and Raige samplermmercial loambient air
tals conce02
metals at ted to the ustries.
etals and S
4.18
age | 48
over encomr, Mathuraand winterequiremeeach locat
and aroun
tate have wavy air polly metal cos were collgarh respes from fivocations. Or.
ntrations 2:00 PM
Siltara Indsite condit
SPM on the
2.35
mpasses da, Firozabar seasons.
ent of NAAQion.
nd Raipur &
witnessed hlution of Smposition lected duriectively onve differenOnly four h
in Raipur
dustrial Artion, the st
e basis of 2
4.91
different dad and Ha In Agra mQM, while
& Raigarh
high indusSPM and P
in the SPing oct. 10EPM – 20
nt locationsheavy meta
r between
rea (NECO)tation is lo
24 hourly
1.4
districts ofathras covemonitoring
in other c
h
strial growtPM10. A sPM fraction0-11, 2010 000 filter ps represenals (Fe, Ni
06:00 AM
) higher alcated amo
average va
44
F
N
M
Z
H
S
f Taj ering g has cities
th in tudy n for and
paper nting , Mn
M –
l the ongst
alues
Fe
Ni
Mn
Zn
HM
SPM
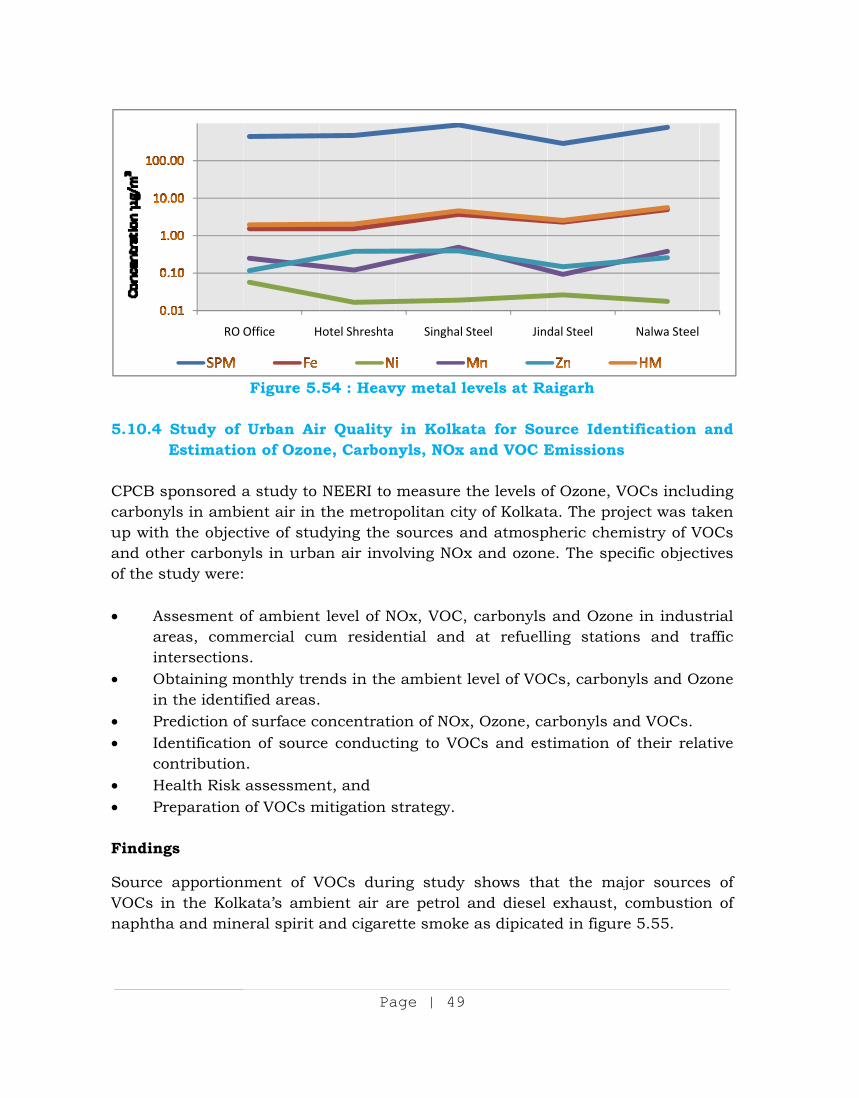
5.10.4
CPCB scarbonyup withand othof the st As
arin
Obin
Pr Id
co He Pr
Finding
Source VOCs innaphtha
Study of Estimatio
ponsored ayls in ambih the objecher carbonytudy were:
ssesment oreas, commtersectionsbtaining m the identi
rediction ofentification
ontributionealth Risk reparation
gs
apportionn the Kolka and mine
RO
Figure 5.
Urban Aion of Ozon
a study to ient air in tive of stuyls in urba
of ambientmercial cus.
monthly treified areas.f surface cn of sourc
n. assessmenof VOCs m
nment of Vkata’s amberal spirit a
Office H
Pa
.54 : Heav
r Quality ne, Carbon
NEERI to the metropdying the an air invo
t level of Num residen
nds in the oncentrati
ce conduct
nt, and mitigation s
VOCs duribient air arand cigare
Hotel Shreshta
age | 49
vy metal le
in Kolkatnyls, NOx a
measure tpolitan citysources an
olving NOx
NOx, VOC, ntial and
ambient l
on of NOx,ing to VOC
strategy.
ng study re petrol a
ette smoke
Singhal S
evels at Ra
ta for Souand VOC E
the levels oy of Kolkatnd atmospx and ozon
carbonyls at refuell
evel of VO
, Ozone, caCs and est
shows thaand diesel as dipicate
Steel Jin
aigarh
urce IdentEmissions
of Ozone, Vta. The propheric cheme. The spe
and Ozoning station
Cs, carbon
arbonyls antimation o
at the majexhaust,
ed in figur
dal Steel
tification s
VOCs incluoject was tamistry of Vecific objec
ne in indusns and tr
nyls and O
nd VOCs.of their rela
ajor sourcecombustioe 5.55.
Nalwa Steel
and
uding aken
VOCs tives
strial raffic
zone
ative
es of on of
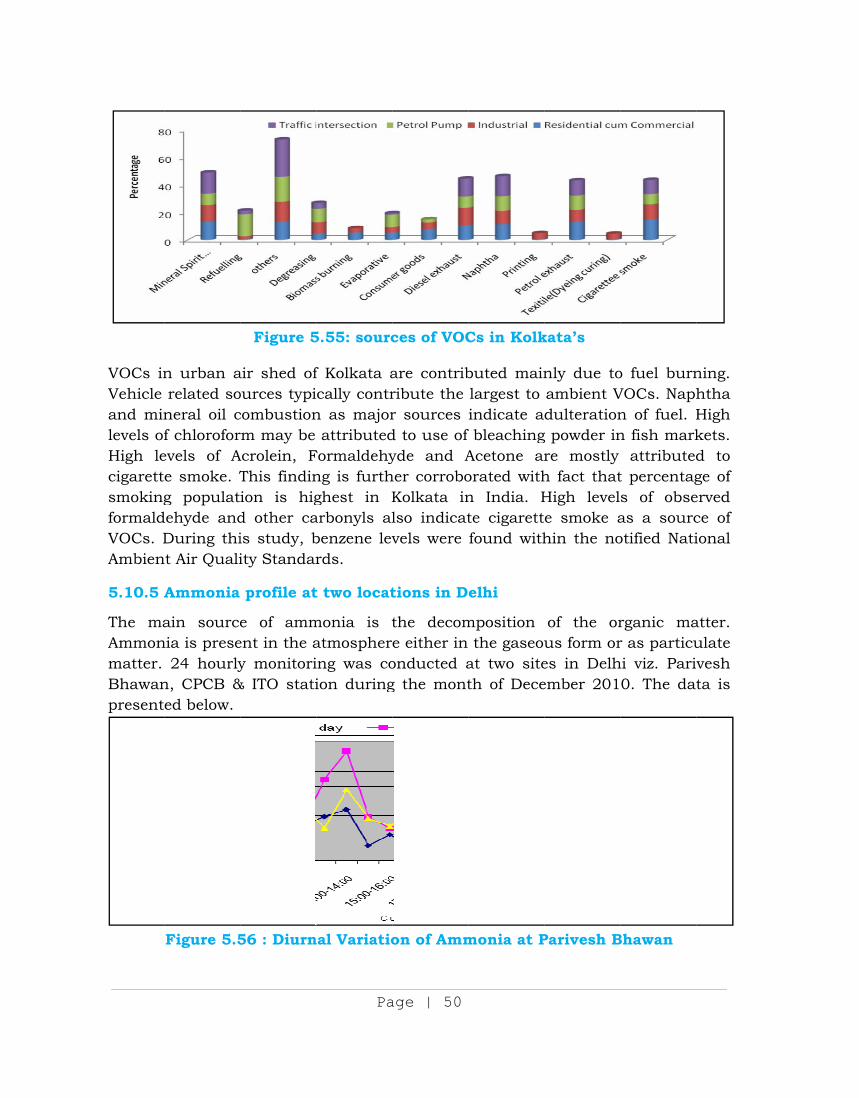
VOCs inVehicle and minlevels ofHigh lecigarettsmokingformaldVOCs. DAmbien
5.10.5 A The maAmmonmatter. Bhawanpresent
n urban arelated so
neral oil cf chloroforevels of Ae smoke. Tg populat
dehyde andDuring thi
nt Air Quali
Ammonia
ain sourcenia is prese
24 hourlyn, CPCB &ed below.
Figure 5.5
Figure 5
air shed ofources typicombustionrm may be Acrolein, FThis findinion is higd other cais study, bity Standar
profile at
e of amment in the ay monitori
& ITO stati
56 : Diurn
Pa
5.55: sourc
f Kolkata acally contr
n as majorattributed
Formaldehyng is furthghest in Karbonyls albenzene levrds.
t two locat
monia is tatmosphering was coion during
nal Variatio
age | 50
ces of VOC
are contribribute the r sources d to use of yde and Aher corroboKolkata inlso indicatvels were
tions in D
the decome either in onducted ag the mont
on of Amm
Cs in Kolk
buted mainlargest to indicate a
f bleachingAcetone arorated withn India. Hte cigarettfound with
elhi
mposition the gaseou
at two siteth of Dece
monia at P
kata’s
nly due toambient Vdulteration
g powder inre mostly h fact thatHigh levele smoke ahin the no
of the orus form ores in Delhember 201
Parivesh B
o fuel burnVOCs. Naphn of fuel. Hn fish mark
attributedt percentags of obseas a sourcotified Nati
rganic mar as particuhi viz. Pariv0. The dat
Bhawan
ning. htha High kets. d to ge of erved ce of ional
atter. ulate vesh ta is
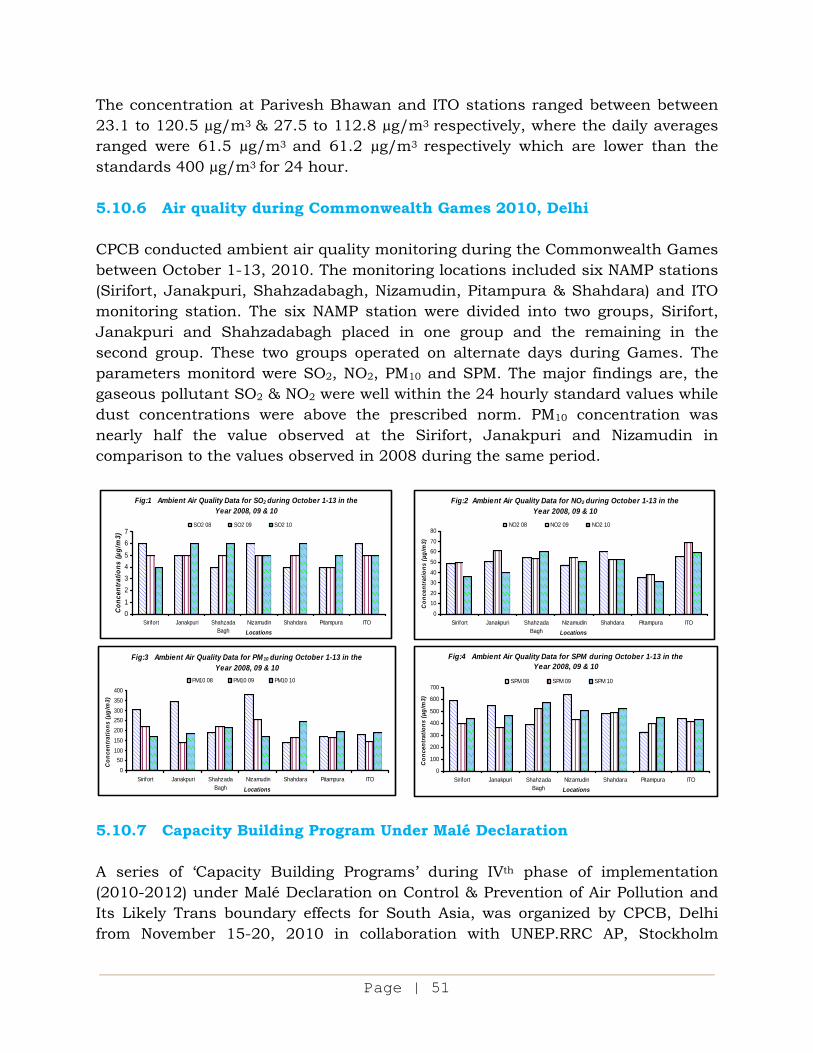
Page | 51
The concentration at Parivesh Bhawan and ITO stations ranged between between 23.1 to 120.5 µg/m3 & 27.5 to 112.8 µg/m3 respectively, where the daily averages ranged were 61.5 µg/m3 and 61.2 µg/m3 respectively which are lower than the standards 400 µg/m3 for 24 hour. 5.10.6 Air quality during Commonwealth Games 2010, Delhi CPCB conducted ambient air quality monitoring during the Commonwealth Games between October 1-13, 2010. The monitoring locations included six NAMP stations (Sirifort, Janakpuri, Shahzadabagh, Nizamudin, Pitampura & Shahdara) and ITO monitoring station. The six NAMP station were divided into two groups, Sirifort, Janakpuri and Shahzadabagh placed in one group and the remaining in the second group. These two groups operated on alternate days during Games. The parameters monitord were SO2, NO2, PM10 and SPM. The major findings are, the gaseous pollutant SO2 & NO2 were well within the 24 hourly standard values while dust concentrations were above the prescribed norm. PM10 concentration was nearly half the value observed at the Sirifort, Janakpuri and Nizamudin in comparison to the values observed in 2008 during the same period.
5.10.7 Capacity Building Program Under Malé Declaration A series of ‘Capacity Building Programs’ during IVth phase of implementation (2010-2012) under Malé Declaration on Control & Prevention of Air Pollution and Its Likely Trans boundary effects for South Asia, was organized by CPCB, Delhi from November 15-20, 2010 in collaboration with UNEP.RRC AP, Stockholm
Fig:1 Ambient Air Quality Data for SO2 during October 1-13 in the Year 2008, 09 & 10
01
2345
67
Sirifort Janakpuri ShahzadaBagh
Nizamudin Shahdara Pitampura ITOLocations
Con
cent
ratio
ns (µ
g/m
3)
SO2 08 SO2 09 SO2 10
Fig:2 Ambient Air Quality Data for NO2 during October 1-13 in the Year 2008, 09 & 10
0
1020
3040
50
6070
80
Sirifort Janakpuri ShahzadaBagh
Nizamudin Shahdara Pitampura ITOLocations
Con
cent
ratio
ns (µ
g/m
3)
NO2 08 NO2 09 NO2 10
Fig:3 Ambient Air Quality Data for PM10 during October 1-13 in the Year 2008, 09 & 10
050
100150200250300350400
Sirifort Janakpuri ShahzadaBagh
Nizamudin Shahdara Pitampura ITO
Locations
Con
cent
ratio
ns (µ
g/m
3)
PM10 08 PM10 09 PM10 10
Fig:4 Ambient Air Quality Data for SPM during October 1-13 in the Year 2008, 09 & 10
0
100
200
300
400
500
600
700
Sirifort Janakpuri ShahzadaBagh
Nizamudin Shahdara Pitampura ITOLocations
Con
cent
ratio
ns (µ
g/m
3)
SPM 08 SPM 09 SPM 10
EnvironGlobal Forum EnvironParticipSouth BangladMaldiveSrilankaHands-owith a vat all trlocationwas con
5.11 C 5.11.1
Central Monitorpollutio NAMP Stationsstationsvarious UniversRSPM, S The preof applInternatQuality requiremmanual The Indreplacinsector in
nment InAtmosph( GAP)
nment & Fpants fro
Asian desh, Bhutes, Nepal, a attendedon-trainingview to achransbound
ns. Additionnducted be
CONTINUO
Pilot Projthe manaStation /
Pollutionring Progran control p
presently s (NAMP) s are man
State Posity etc. ThSO2 and N
esent Indiaication antional stan
Monitorinment to dl monitorin
dian air qng the man the devel
nstitute heric Poll& Ministr
Forests (Mm the countries tan, India,
Pakistan d the progg was imphieve unifodary monitnal trainin
etween Nov
OUS AMBIE
ject in ideagement Network
n Control amme (NAMprogramme
includes covering 1
nually opeollution Che air qualox.
an (Nationand hence, ndard. Inteng is widdo air quang is done a
quality moanual statilopment an
Pa
(SEI), lution ry of
MoEF). eight
viz. Iran, and
gram. parted ormity toring ng was convember 22-
ENT AIR Q
entified ciof Conti
Board (MP) in 198es and air
a network190 cities rated twic
Control Bolity param
al) Air qualthere is
ernationalldely accepality monias a compl
nitoring syions with nd the ope
age | 52
nducted for-24, 2010.
QUALITY M
ities for ininuous Am
CPCB) ha84 to assesquality tre
k of 456 in 26 Stat
ce a weekoards (SPC
meters that
lity Monitoneed to mly use of cpted. In mitoring usilement to o
ystem reqCAAQMS
eration of th
r delegates
MONITORI
nvolving pmbient A
as startedss air qualends.
National tes and 5
k (24 hourCBs) & lo
are regula
ring Netwomodernize continuousmost of ting automonline mea
quires modand also
he system.
s from Bhu
ING (CAAQ
private paAir Quality
d Nationaity & the e
Air Qualiunion ter
rly) with iocal or Sarly monit
ork is limitthe exist
s Automatithe countr
matic analyasurements
dernization integratin.
utan, Mald
QM)
articipatioy Monito
al Air Queffectivenes
ity Monitorritories. Tinvolvementate agen
tored are S
ted in its sing systemic Ambientries it is yzers and s.
n by gradung the pri
dives
n in oring
uality ss of
oring hese
nt of ncies, SPM,
cope m to t Air
the the
ually ivate
Page | 53
After evaluating the merits & demerits of possible models including private participation in the management of Continuous Ambient Air Quality Monitoring Station (CAAQMS), CPCB decided that the following two new models may be adopted in the identified cities as pilot project: • Model- I : Operation contract • Model-II : Build Own & Operate (BOO) contract (investigation and operate) To begin with CPCB has taken up the project under the proposed option of “Operation Contract”. The project is being executed as Pilot Project in four cities namely Delhi, Lucknow, Bangalore and Chennai under Operational Contract. The project on proposal Model II is made to execute in another two cities namely Ahmedabad & Mumbai. Each identified city will be having a Pilot Network of three CAAQM Stations (1 in residential area, one in industrial area and one in traffic hotspot area). Activities performed during 2010-11
M/s ESA France, opened its subsidiary M/s Environnement S.A., India Pvt. Ltd and proposed M/s Environnement S.A., India Pvt. Ltd as their O&M partner in place of CTPL. After obtaining required clarifications the Committee of CPCB recommended for consideration of ESA India Pvt. Ltd as O&M operator and the amendment III to NOA in this regard was issued on 05/05/2010.
Connectivity between Regional station & Local station and Installation of Data Acquisition System at Regional & Central station is completed.
Requited inspection/ visit of the Technical Working Group (TWG) regarding endorsement / supervision related to successful installation & commissioning of Continuous Ambient Air Quality Monitoring Station (CAAQMS) and regional station in all the four cities were performed.
The Acceptance Certificate towards successful commissioning was issued by the ultimate consignee/ representative of CPCB and the Acceptance Certificate issued by the ultimate consignees were sent to NTPC for processing of balance twenty (20) percent of contract price of the equipment etc. to the contractor.
Air quality & meteorological data from all the 12 CAAQMS are being received online at the Central Management Unit, CPCB-Delhi. Online data transmission from 12 CAAQMS, was also demonstrated during the Chairmen’s / Member Secretaries conference.
All 12 data display system covered under this project for public awareness are installed & operational
Page | 54
Two weeks training programme on “Operation, Maintenance & Data Management of Continuous Ambient Air Quality Monitoring Station/Network Organized successfully during September 6th to 17th 2010,
O&M contract is now commenced w.e.f. December 31, 2010. The O&M operator is reporting data pertaining to CAAQMS to all concerned offices of CPCB for scrutiny etc.
Qualification requirement for BOO contract was reviewed for better response from the prospective bidders & finalized revised Request For Qualification (RFQ) Documents . .
Expert Evaluation Committee (EEC) comprising outside experts was constituted towards execution of Build, Own & Operate (BOO) Contract and a meeting of Expert Evaluation Committee (EEC) was held for evaluating and processing RFQ applications and bids received from NTPC for the selection of developers for setting up of Continuous Ambient Air Quality Monitoring Stations (CAAQMS) under Build Own & Operate (BOO) basis at Mumbai & Ahmedabad.
Preparation of financial analysis cost of data and others financial criteria’s for BOO mode detailed RFP document and OMDA document are under progress.
* * *
Page | 55
CHAPTER VI
PRESENT STATE OF ENVIRONMENT, ENVIRONMENTAL PROBLEMS AND COUNTER MEASURES
6.1 INVENTORISATION OF INDUSTRIAL CLUSTERS IN THE COUNTRY AND
ASSESSMENT OF THE UNMET NEED FOR COMMON EFFLUENT TREATMENT PLANTS
Largely due to the financial support provided by the Central Government, 149 CETPs having combined capacity of about 1174 MLD covering about 15000 polluting industries have been established in the country and 27 CETPs are under-construction or proposed. CETPs may not be required and feasible in all cases because many clusters might comprise of mostly non polluting industries or might have very little combined flow with the contributing industries having individual ETPs. However, there could be some cases where even though the combined flow is substantial, still the industries in the clusters are reluctant to propose any CETPs because of all effluent generating industries have installed individual ETPs and in such cases the SPCBs are the best judge to decide about necessity of CETP based on overall compliance status. In a meeting regarding CETPs held on 18.11.2010, Member, Planning Commission has desired that a study be carried out quickly for assessment of actual unmet need for common effluent treatment plants in the country and for assessment of industrial clusters to be serviced by these CETPs. MoEF requested CPCB to coordinate with SPCBs and get this assessment done within three months. In order to assess the actual unmet need for common effluent treatment plants in the country it was felt necessary that an inventorisation of all industrial clusters is also done and explicit views of SPCBs/PCCs about requirement and feasibility of CETP are obtained for each clusters so that a clear picture may emerge. In view of the short time available for the inventorisation of industrial clusters and assessment of the unmet need for CETPs, the study needs to be carried out simultaneously in States and UTs in six Zones. Accordingly, a study has been proposed to be undertaken with the following objectives:
1) State wise documentation of general information on all industrial clusters in the country. (Developed either by Government agencies or traditionally/privately)
2) Collecting basic information about effluent generation, treatment and disposal and requirement/feasibility for CETP in respect of all clusters.
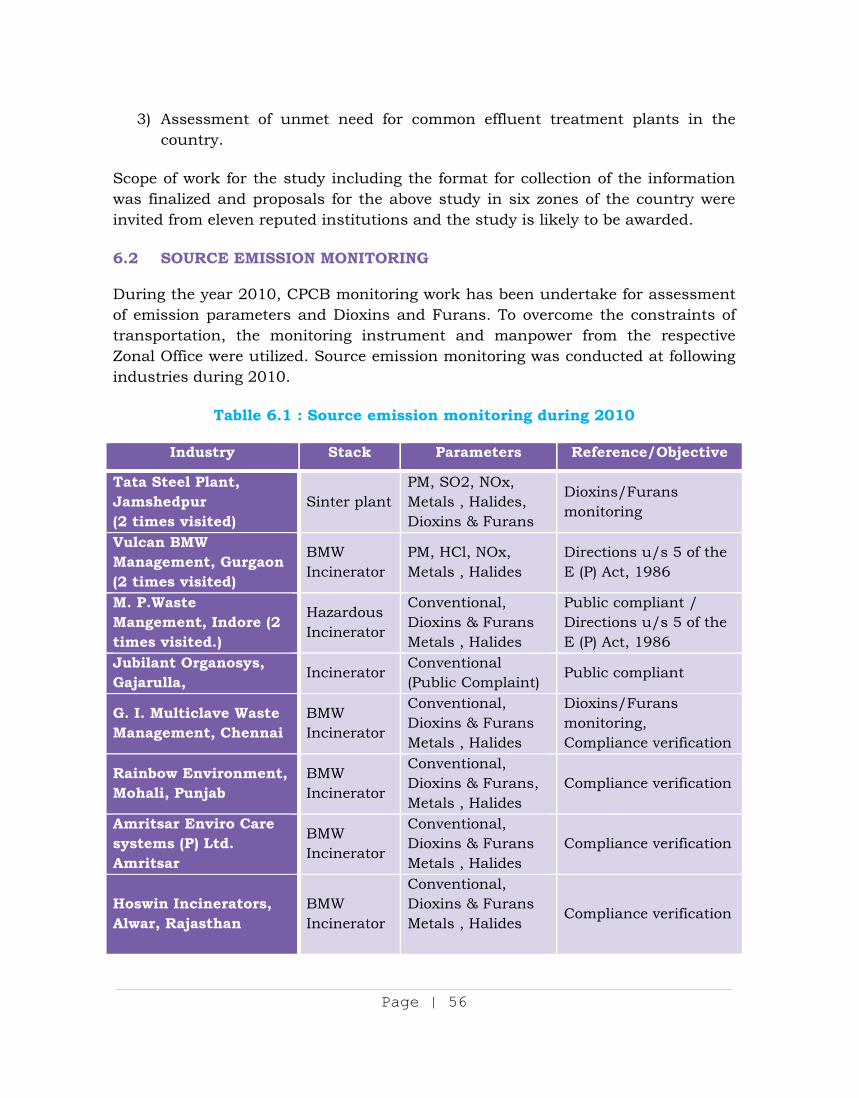
Page | 56
3) Assessment of unmet need for common effluent treatment plants in the country.
Scope of work for the study including the format for collection of the information was finalized and proposals for the above study in six zones of the country were invited from eleven reputed institutions and the study is likely to be awarded. 6.2 SOURCE EMISSION MONITORING During the year 2010, CPCB monitoring work has been undertake for assessment of emission parameters and Dioxins and Furans. To overcome the constraints of transportation, the monitoring instrument and manpower from the respective Zonal Office were utilized. Source emission monitoring was conducted at following industries during 2010.
Tablle 6.1 : Source emission monitoring during 2010
Industry Stack Parameters Reference/Objective
Tata Steel Plant, Jamshedpur (2 times visited)
Sinter plantPM, SO2, NOx, Metals , Halides, Dioxins & Furans
Dioxins/Furans monitoring
Vulcan BMW Management, Gurgaon (2 times visited)
BMW Incinerator
PM, HCl, NOx, Metals , Halides
Directions u/s 5 of the E (P) Act, 1986
M. P.Waste Mangement, Indore (2 times visited.)
Hazardous Incinerator
Conventional, Dioxins & Furans Metals , Halides
Public compliant / Directions u/s 5 of the E (P) Act, 1986
Jubilant Organosys, Gajarulla, Incinerator
Conventional (Public Complaint)
Public compliant
G. I. Multiclave Waste Management, Chennai
BMW Incinerator
Conventional, Dioxins & Furans Metals , Halides
Dioxins/Furans monitoring, Compliance verification
Rainbow Environment, Mohali, Punjab
BMW Incinerator
Conventional, Dioxins & Furans, Metals , Halides
Compliance verification
Amritsar Enviro Care systems (P) Ltd. Amritsar
BMW Incinerator
Conventional, Dioxins & Furans Metals , Halides
Compliance verification
Hoswin Incinerators, Alwar, Rajasthan
BMW Incinerator
Conventional, Dioxins & Furans Metals , Halides
Compliance verification
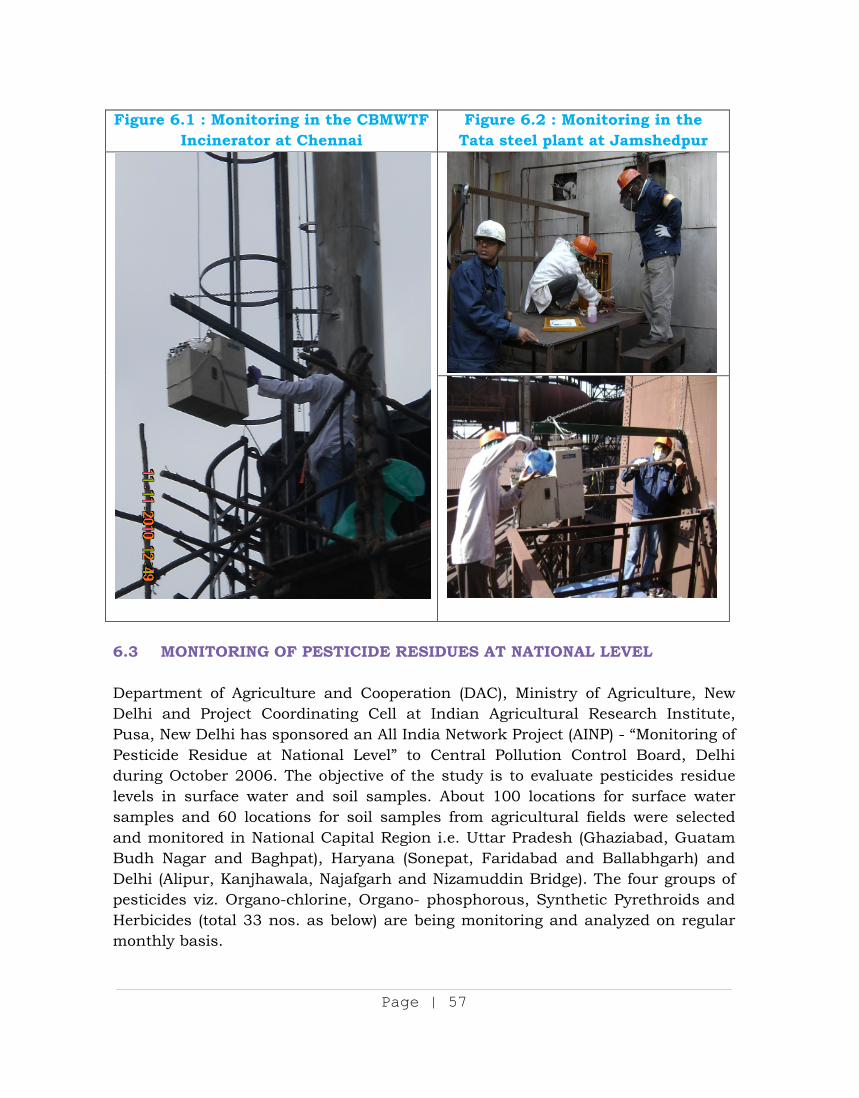
Page | 57
Figure 6.1 : Monitoring in the CBMWTF Incinerator at Chennai
Figure 6.2 : Monitoring in the Tata steel plant at Jamshedpur
6.3 MONITORING OF PESTICIDE RESIDUES AT NATIONAL LEVEL Department of Agriculture and Cooperation (DAC), Ministry of Agriculture, New Delhi and Project Coordinating Cell at Indian Agricultural Research Institute, Pusa, New Delhi has sponsored an All India Network Project (AINP) - “Monitoring of Pesticide Residue at National Level” to Central Pollution Control Board, Delhi during October 2006. The objective of the study is to evaluate pesticides residue levels in surface water and soil samples. About 100 locations for surface water samples and 60 locations for soil samples from agricultural fields were selected and monitored in National Capital Region i.e. Uttar Pradesh (Ghaziabad, Guatam Budh Nagar and Baghpat), Haryana (Sonepat, Faridabad and Ballabhgarh) and Delhi (Alipur, Kanjhawala, Najafgarh and Nizamuddin Bridge). The four groups of pesticides viz. Organo-chlorine, Organo- phosphorous, Synthetic Pyrethroids and Herbicides (total 33 nos. as below) are being monitoring and analyzed on regular monthly basis.
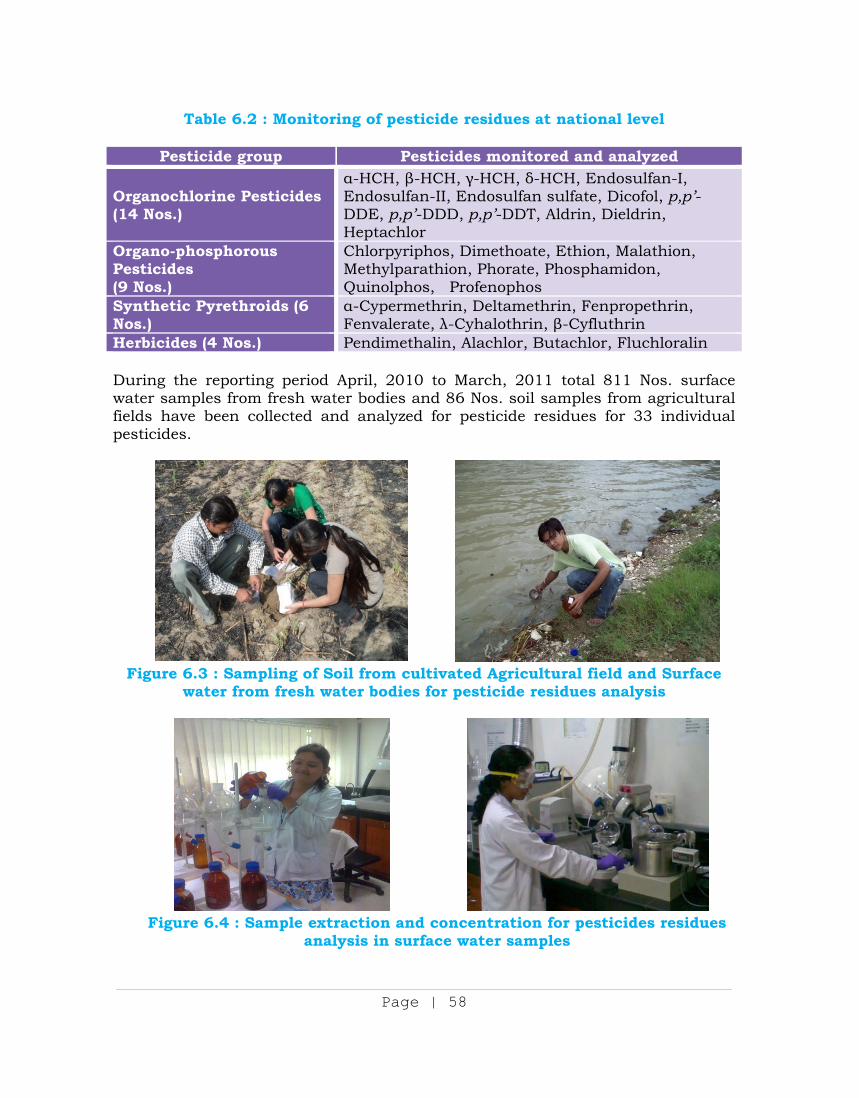
Page | 58
Table 6.2 : Monitoring of pesticide residues at national level
Pesticide group Pesticides monitored and analyzed
Organochlorine Pesticides (14 Nos.)
-HCH, -HCH, -HCH, -HCH, Endosulfan-I, Endosulfan-II, Endosulfan sulfate, Dicofol, p,p’-DDE, p,p’-DDD, p,p’-DDT, Aldrin, Dieldrin, Heptachlor
Organo-phosphorous Pesticides (9 Nos.)
Chlorpyriphos, Dimethoate, Ethion, Malathion, Methylparathion, Phorate, Phosphamidon, Quinolphos, Profenophos
Synthetic Pyrethroids (6 Nos.)
-Cypermethrin, Deltamethrin, Fenpropethrin, Fenvalerate, -Cyhalothrin, -Cyfluthrin
Herbicides (4 Nos.) Pendimethalin, Alachlor, Butachlor, Fluchloralin During the reporting period April, 2010 to March, 2011 total 811 Nos. surface water samples from fresh water bodies and 86 Nos. soil samples from agricultural fields have been collected and analyzed for pesticide residues for 33 individual pesticides.
Figure 6.3 : Sampling of Soil from cultivated Agricultural field and Surface water from fresh water bodies for pesticide residues analysis
Figure 6.4 : Sample extraction and concentration for pesticides residues analysis in surface water samples
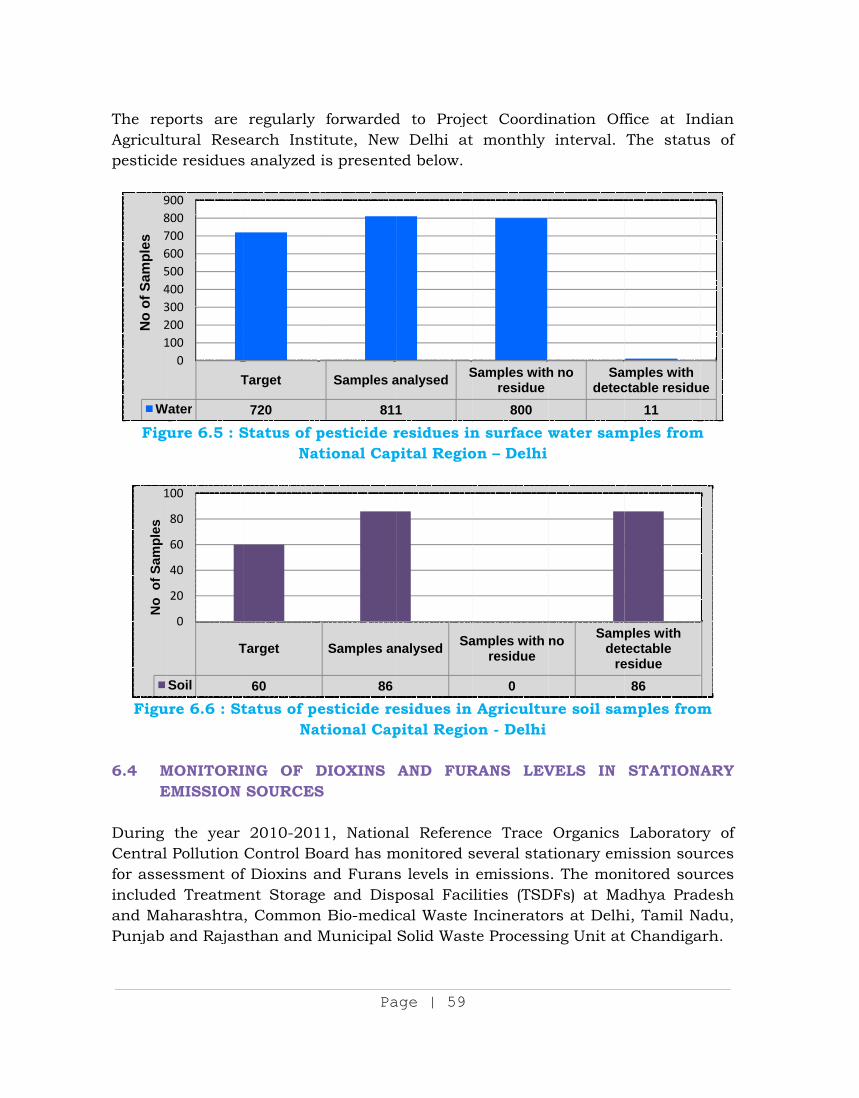
The repAgricultpesticid
Figu
Figu
6.4 M E During Central for asseincludedand MaPunjab
W
123456789
No
of S
ampl
es
1
No
of S
ampl
es
ports are tural Resede residues
ure 6.5 : S
ure 6.6 : St
MONITORIEMISSION
the year Pollution
essment ofd Treatme
aharashtraand Rajas
T
Water
0100200300400500600700800900
T
Soil
0
20
40
60
80
100
regularly earch Instis analyzed
Status of pNat
tatus of peNa
ING OF DSOURCES
2010-201Control Bof Dioxins aent Storage, Commonthan and M
Target
720
Target
60
Pa
forwardeditute, Newis presente
pesticide rtional Cap
esticide retional Cap
DIOXINSS
11, Nationoard has mand Furanse and Disp
n Bio-medicMunicipal
Samples a
811
Samples an
86
age | 59
d to Projew Delhi ated below.
residues inpital Regio
esidues in pital Regio
AND FUR
al Referenmonitored ss levels in posal Facical Waste Solid Wast
analysed S
1
nalysed Sa
ect Coordit monthly
n surface won – Delhi
Agricultuon - Delhi
RANS LEV
nce Trace several statemissions
ilities (TSDIncineratote Processi
Samples withresidue
800
amples with residue
0
nation Ofinterval.
water sam
ure soil sam
VELS IN
Organics tionary em
s. The monDFs) at Maors at Delhing Unit at
h no Sadetec
no Samdet
re
ffice at InThe statu
mples from
mples from
STATION
Laboratormission sounitored souadhya Pradhi, Tamil Nt Chandiga
amples with ctable residu
11
ples with tectable esidue
86
ndian us of
m
m
ARY
ry of urces urces desh adu,
arh.
ue
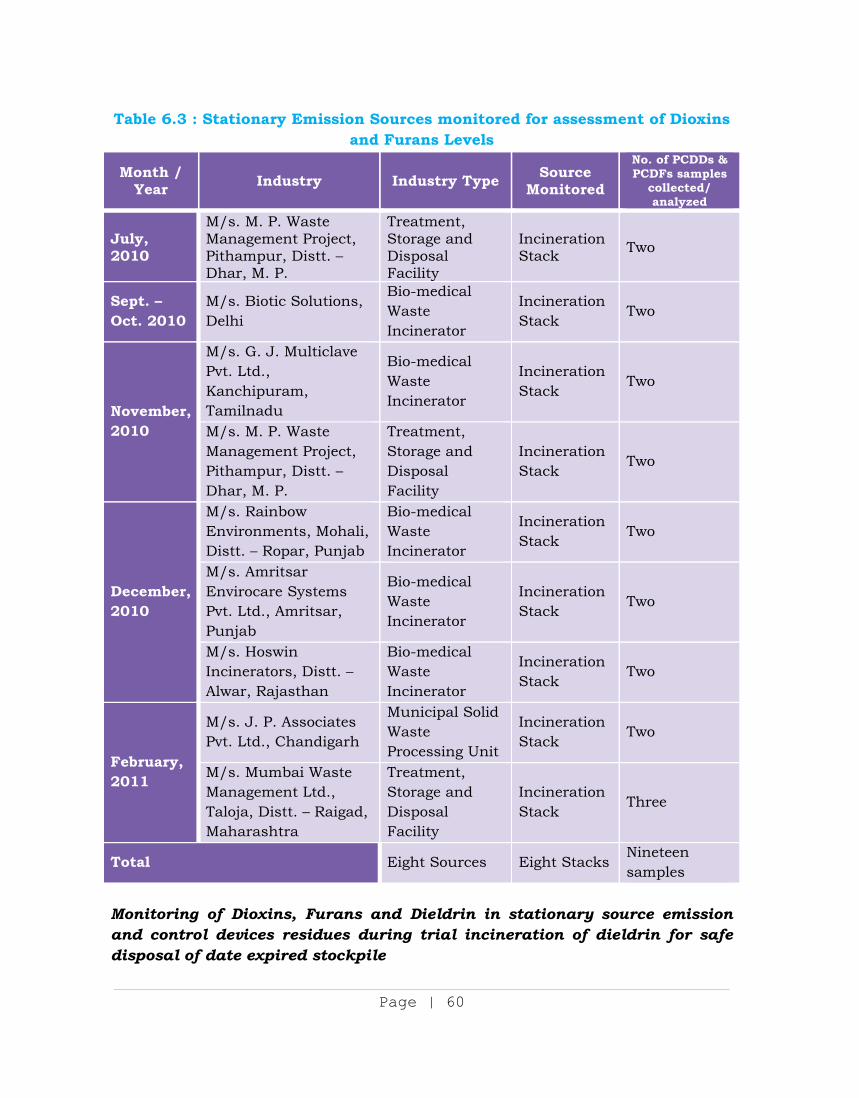
Page | 60
Table 6.3 : Stationary Emission Sources monitored for assessment of Dioxins and Furans Levels
Month / Year Industry Industry Type Source
Monitored
No. of PCDDs & PCDFs samples
collected/ analyzed
July, 2010
M/s. M. P. Waste Management Project, Pithampur, Distt. – Dhar, M. P.
Treatment, Storage and Disposal Facility
Incineration Stack Two
Sept. – Oct. 2010
M/s. Biotic Solutions, Delhi
Bio-medical Waste Incinerator
Incineration Stack
Two
November, 2010
M/s. G. J. Multiclave Pvt. Ltd., Kanchipuram, Tamilnadu
Bio-medical Waste Incinerator
Incineration Stack
Two
M/s. M. P. Waste Management Project, Pithampur, Distt. – Dhar, M. P.
Treatment, Storage and Disposal Facility
Incineration Stack
Two
December, 2010
M/s. Rainbow Environments, Mohali, Distt. – Ropar, Punjab
Bio-medical Waste Incinerator
Incineration Stack
Two
M/s. Amritsar Envirocare Systems Pvt. Ltd., Amritsar, Punjab
Bio-medical Waste Incinerator
Incineration Stack
Two
M/s. Hoswin Incinerators, Distt. – Alwar, Rajasthan
Bio-medical Waste Incinerator
Incineration Stack
Two
February, 2011
M/s. J. P. Associates Pvt. Ltd., Chandigarh
Municipal Solid Waste Processing Unit
Incineration Stack
Two
M/s. Mumbai Waste Management Ltd., Taloja, Distt. – Raigad, Maharashtra
Treatment, Storage and Disposal Facility
Incineration Stack
Three
Total Eight Sources Eight Stacks Nineteen samples
Monitoring of Dioxins, Furans and Dieldrin in stationary source emission and control devices residues during trial incineration of dieldrin for safe disposal of date expired stockpile
Page | 61
Directorate of Plant Protection, Quarantine, Storage (PPQ&S), Ministry of Agriculture requested Central Pollution Control Board for safe disposal of date expired stockpile of Dieldrin as about 33 tonnes of Dieldrin (technical grade) and 16 tonnes formulations were stored since 1978. Ministry of Agricultures alongwith MoEF, CPCB and GTZ had been examining the possibility of safe destruction of the POPs chemical in the incinerator within the country ensuring the condition that the prescribed standards should not be violated during such safe disposal. In the Technical Committee meeting to review the present status of facilities of incinerator, it was decided that following trial runs for incineration of date expired Dieldrin should be undertaken at TSDF incinerator at Taloja (Maharashtra):
A Blank run (with only HD Diesel)
Two test run of diesel diluted Dieldrin with 2% chlorine
Sampling of solids from Emission Treatment unit (Bag filters, cyclone
sprayer and spray drier) for Dieldrin Residues.
(During the blank run and test run the monitoring of Dioxins & Furans and Dieldrin have to be undertaken by National Reference Trace Organics Laboratory of Central Pollution Control Board) Accordingly, during trial incineration of date expired stockpile of Dieldrin, Organo-chlorine pesticides, Dioxins-Furans and Dieldrin levels were monitored from stack emission and Air Pollution Control Devices (APCD) residues at Treatment Storage and Disposal Facility (TSDF) of M/s Mumbai Waste Management Ltd., Taloja, Distt. Raigad, Maharashtra during the period 25-27 February, 2011. In order to assess the emissions due to incineration of diesel, which is used as dilution solvent of Dieldrin for liquid injection, first a blank run was monitored and thereafter source emission monitoring was undertaken after liquid injection of Dieldrin diluted with diesel was incinerated. Two samples each were taken for Dioxins, Furans and Dieldrin during Dieldrin incineration diluted with diesel at 2% chlorine. APCD residues were also collected for analysis of Dioxins, Furans and Dieldrin from Spray drier, Multiclone and Bag Filter House during blank diesel incineration as well as dieldrin incineration. The Dioxins, Furans and Dieldrin samples were analyzed at National Reference Trace Organics Laboratory and the analytical results put up before Expert Committee for consideration and further decision.
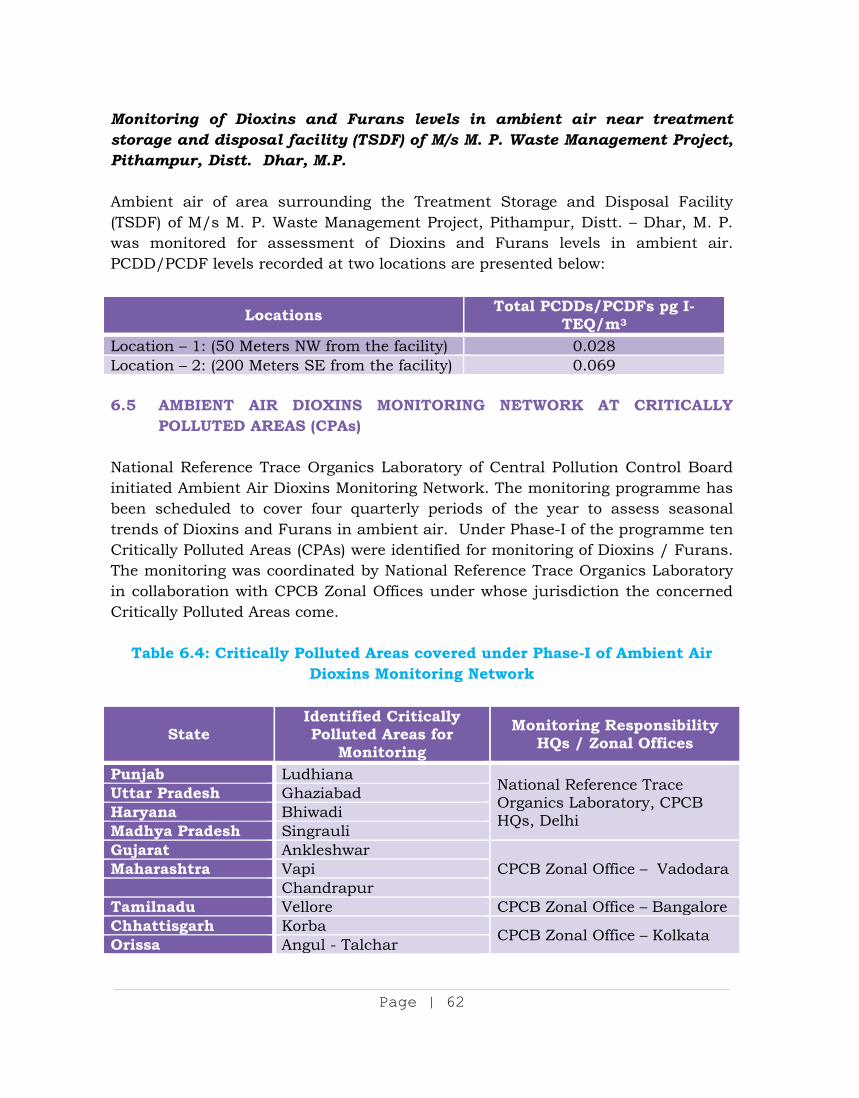
Page | 62
Monitoring of Dioxins and Furans levels in ambient air near treatment storage and disposal facility (TSDF) of M/s M. P. Waste Management Project, Pithampur, Distt. Dhar, M.P. Ambient air of area surrounding the Treatment Storage and Disposal Facility (TSDF) of M/s M. P. Waste Management Project, Pithampur, Distt. – Dhar, M. P. was monitored for assessment of Dioxins and Furans levels in ambient air. PCDD/PCDF levels recorded at two locations are presented below:
Locations Total PCDDs/PCDFs pg I-TEQ/m3
Location – 1: (50 Meters NW from the facility) 0.028 Location – 2: (200 Meters SE from the facility) 0.069 6.5 AMBIENT AIR DIOXINS MONITORING NETWORK AT CRITICALLY
POLLUTED AREAS (CPAs) National Reference Trace Organics Laboratory of Central Pollution Control Board initiated Ambient Air Dioxins Monitoring Network. The monitoring programme has been scheduled to cover four quarterly periods of the year to assess seasonal trends of Dioxins and Furans in ambient air. Under Phase-I of the programme ten Critically Polluted Areas (CPAs) were identified for monitoring of Dioxins / Furans. The monitoring was coordinated by National Reference Trace Organics Laboratory in collaboration with CPCB Zonal Offices under whose jurisdiction the concerned Critically Polluted Areas come.
Table 6.4: Critically Polluted Areas covered under Phase-I of Ambient Air
Dioxins Monitoring Network
State Identified Critically Polluted Areas for
Monitoring
Monitoring Responsibility HQs / Zonal Offices
Punjab Ludhiana National Reference Trace Organics Laboratory, CPCB HQs, Delhi
Uttar Pradesh Ghaziabad Haryana Bhiwadi Madhya Pradesh Singrauli Gujarat Ankleshwar
CPCB Zonal Office – Vadodara Maharashtra Vapi Chandrapur Tamilnadu Vellore CPCB Zonal Office – Bangalore Chhattisgarh Korba CPCB Zonal Office – Kolkata Orissa Angul - Talchar
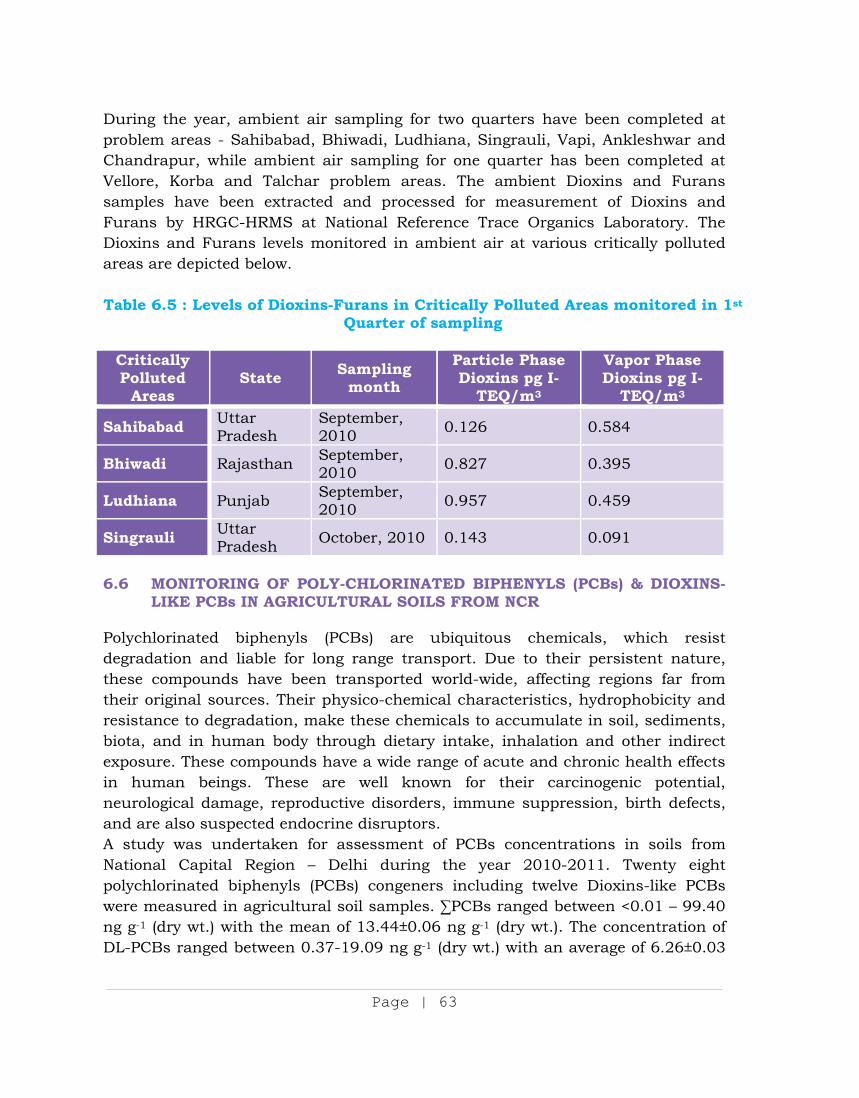
Page | 63
During the year, ambient air sampling for two quarters have been completed at problem areas - Sahibabad, Bhiwadi, Ludhiana, Singrauli, Vapi, Ankleshwar and Chandrapur, while ambient air sampling for one quarter has been completed at Vellore, Korba and Talchar problem areas. The ambient Dioxins and Furans samples have been extracted and processed for measurement of Dioxins and Furans by HRGC-HRMS at National Reference Trace Organics Laboratory. The Dioxins and Furans levels monitored in ambient air at various critically polluted areas are depicted below. Table 6.5 : Levels of Dioxins-Furans in Critically Polluted Areas monitored in 1st
Quarter of sampling
Critically Polluted
Areas State Sampling
month
Particle Phase Dioxins pg I-
TEQ/m3
Vapor Phase Dioxins pg I-
TEQ/m3
Sahibabad Uttar Pradesh
September, 2010 0.126 0.584
Bhiwadi Rajasthan September, 2010 0.827 0.395
Ludhiana Punjab September, 2010 0.957 0.459
Singrauli Uttar Pradesh October, 2010 0.143 0.091
6.6 MONITORING OF POLY-CHLORINATED BIPHENYLS (PCBs) & DIOXINS-
LIKE PCBs IN AGRICULTURAL SOILS FROM NCR Polychlorinated biphenyls (PCBs) are ubiquitous chemicals, which resist degradation and liable for long range transport. Due to their persistent nature, these compounds have been transported world-wide, affecting regions far from their original sources. Their physico-chemical characteristics, hydrophobicity and resistance to degradation, make these chemicals to accumulate in soil, sediments, biota, and in human body through dietary intake, inhalation and other indirect exposure. These compounds have a wide range of acute and chronic health effects in human beings. These are well known for their carcinogenic potential, neurological damage, reproductive disorders, immune suppression, birth defects, and are also suspected endocrine disruptors. A study was undertaken for assessment of PCBs concentrations in soils from National Capital Region – Delhi during the year 2010-2011. Twenty eight polychlorinated biphenyls (PCBs) congeners including twelve Dioxins-like PCBs were measured in agricultural soil samples. PCBs ranged between <0.01 – 99.40 ng g-1 (dry wt.) with the mean of 13.44±0.06 ng g-1 (dry wt.). The concentration of DL-PCBs ranged between 0.37-19.09 ng g-1 (dry wt.) with an average of 6.26±0.03
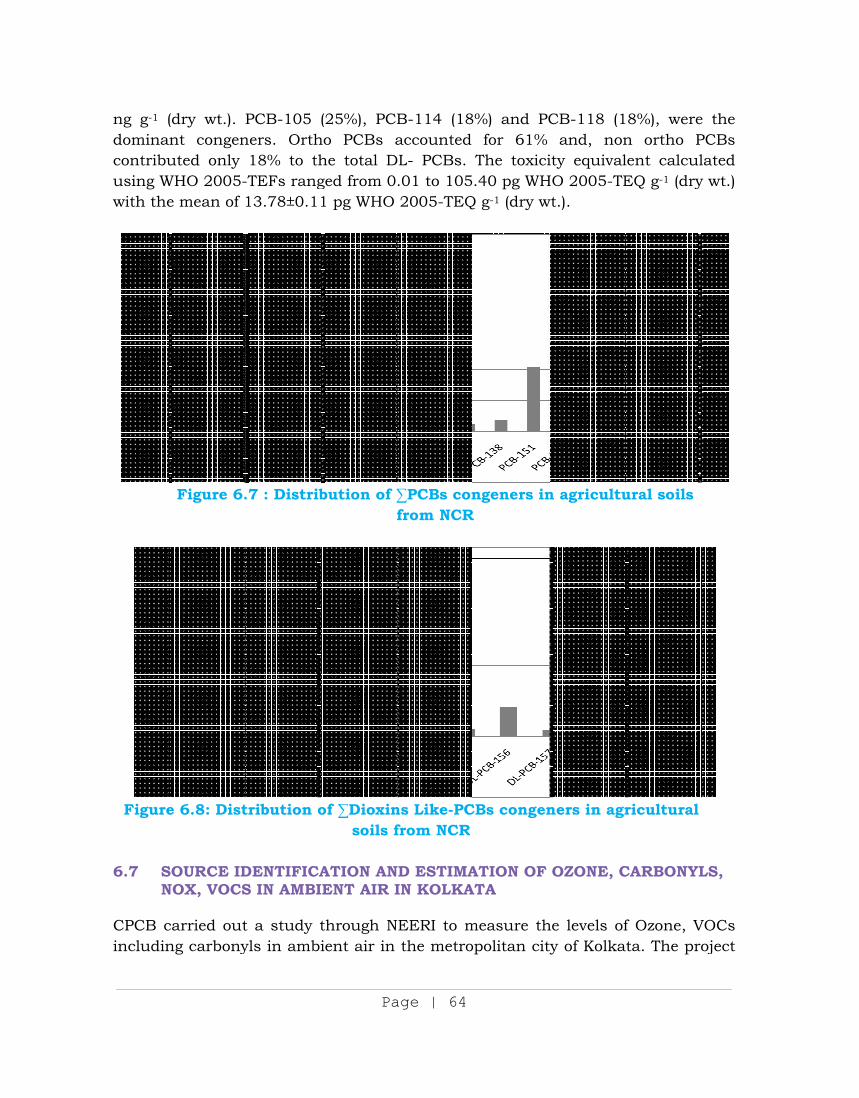
ng g-1 (dominacontribuusing Wwith the
Figure
6.7 SN
CPCB cincludin
(dry wt.). nt congenuted only
WHO 2005-e mean of
Figure 6.
e 6.8: Dist
SOURCE IDNOX, VOCS
carried outng carbony
PCB-105 ners. Orth18% to th
-TEFs rang13.78±0.11
.7 : Distrib
tribution o
DENTIFICAS IN AMBI
t a study tyls in ambi
Pa
(25%), PCBho PCBs ahe total Dged from 01 pg WHO
bution of f
of Dioxinsoils f
ATION ANENT AIR I
through Nient air in
age | 64
B-114 (18accounted L- PCBs. .01 to 1052005-TEQ
PCBs confrom NCR
ns Like-PCfrom NCR
ND ESTIMAIN KOLKA
EERI to mthe metro
%) and PCfor 61%
The toxici.40 pg WH
Q g-1 (dry w
ngeners inR
CBs congen
ATION OF ATA
measure thpolitan cit
CB-118 (1and, non
ity equivalHO 2005-TEwt.).
n agricultu
ners in agr
OZONE, C
he levels ofty of Kolka
8%), weren ortho Plent calculEQ g-1 (dry
ural soils
ricultural
CARBONYL
f Ozone, Vata. The pro
e the PCBs lated y wt.)
LS,
VOCs oject
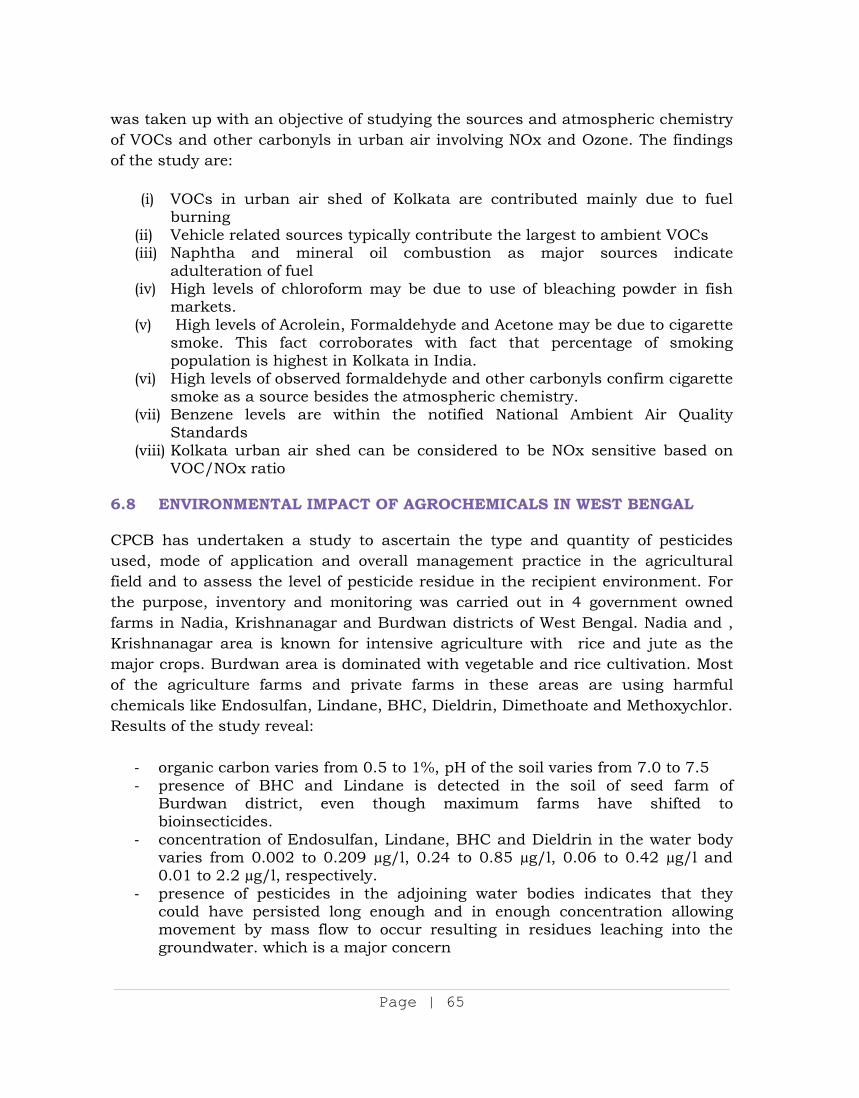
Page | 65
was taken up with an objective of studying the sources and atmospheric chemistry of VOCs and other carbonyls in urban air involving NOx and Ozone. The findings of the study are:
(i) VOCs in urban air shed of Kolkata are contributed mainly due to fuel burning
(ii) Vehicle related sources typically contribute the largest to ambient VOCs (iii) Naphtha and mineral oil combustion as major sources indicate
adulteration of fuel (iv) High levels of chloroform may be due to use of bleaching powder in fish
markets. (v) High levels of Acrolein, Formaldehyde and Acetone may be due to cigarette
smoke. This fact corroborates with fact that percentage of smoking population is highest in Kolkata in India.
(vi) High levels of observed formaldehyde and other carbonyls confirm cigarette smoke as a source besides the atmospheric chemistry.
(vii) Benzene levels are within the notified National Ambient Air Quality Standards
(viii) Kolkata urban air shed can be considered to be NOx sensitive based on VOC/NOx ratio
6.8 ENVIRONMENTAL IMPACT OF AGROCHEMICALS IN WEST BENGAL CPCB has undertaken a study to ascertain the type and quantity of pesticides used, mode of application and overall management practice in the agricultural field and to assess the level of pesticide residue in the recipient environment. For the purpose, inventory and monitoring was carried out in 4 government owned farms in Nadia, Krishnanagar and Burdwan districts of West Bengal. Nadia and , Krishnanagar area is known for intensive agriculture with rice and jute as the major crops. Burdwan area is dominated with vegetable and rice cultivation. Most of the agriculture farms and private farms in these areas are using harmful chemicals like Endosulfan, Lindane, BHC, Dieldrin, Dimethoate and Methoxychlor. Results of the study reveal:
- organic carbon varies from 0.5 to 1%, pH of the soil varies from 7.0 to 7.5 - presence of BHC and Lindane is detected in the soil of seed farm of
Burdwan district, even though maximum farms have shifted to bioinsecticides.
- concentration of Endosulfan, Lindane, BHC and Dieldrin in the water body varies from 0.002 to 0.209 µg/l, 0.24 to 0.85 µg/l, 0.06 to 0.42 µg/l and 0.01 to 2.2 µg/l, respectively.
- presence of pesticides in the adjoining water bodies indicates that they could have persisted long enough and in enough concentration allowing movement by mass flow to occur resulting in residues leaching into the groundwater. which is a major concern
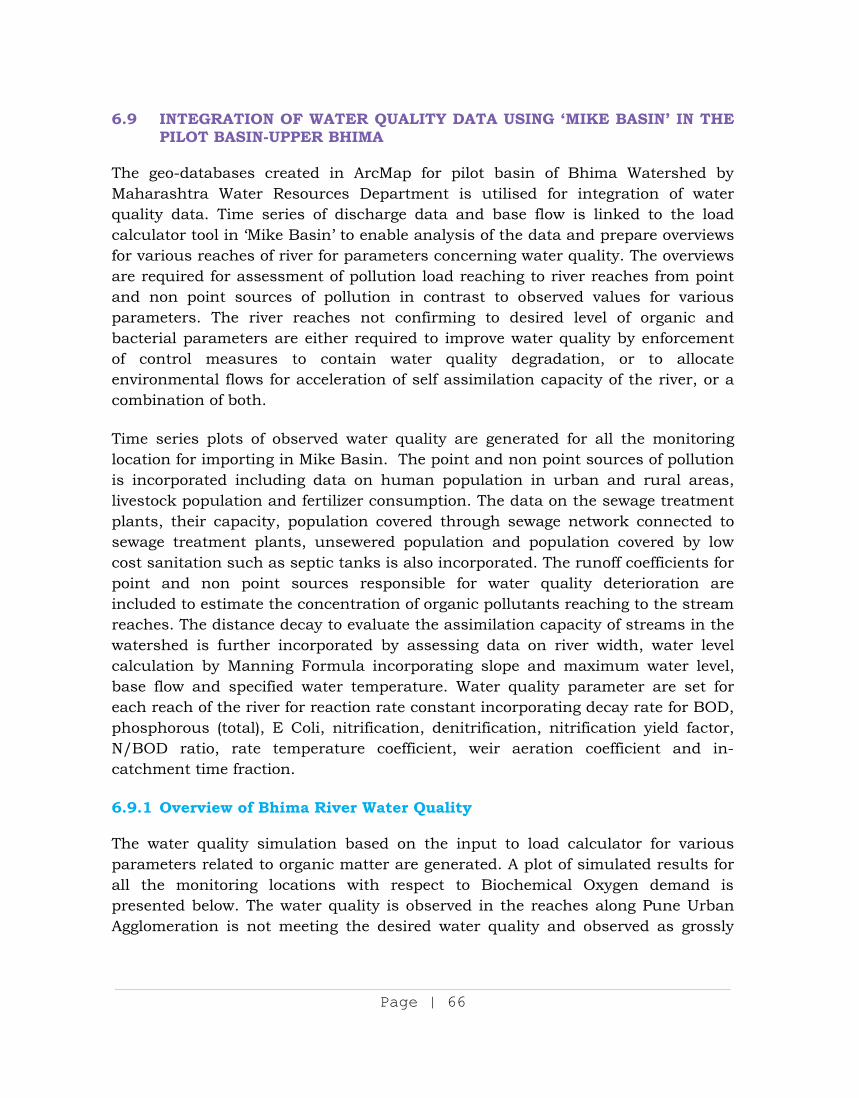
Page | 66
6.9 INTEGRATION OF WATER QUALITY DATA USING ‘MIKE BASIN’ IN THE PILOT BASIN-UPPER BHIMA
The geo-databases created in ArcMap for pilot basin of Bhima Watershed by Maharashtra Water Resources Department is utilised for integration of water quality data. Time series of discharge data and base flow is linked to the load calculator tool in ‘Mike Basin’ to enable analysis of the data and prepare overviews for various reaches of river for parameters concerning water quality. The overviews are required for assessment of pollution load reaching to river reaches from point and non point sources of pollution in contrast to observed values for various parameters. The river reaches not confirming to desired level of organic and bacterial parameters are either required to improve water quality by enforcement of control measures to contain water quality degradation, or to allocate environmental flows for acceleration of self assimilation capacity of the river, or a combination of both. Time series plots of observed water quality are generated for all the monitoring location for importing in Mike Basin. The point and non point sources of pollution is incorporated including data on human population in urban and rural areas, livestock population and fertilizer consumption. The data on the sewage treatment plants, their capacity, population covered through sewage network connected to sewage treatment plants, unsewered population and population covered by low cost sanitation such as septic tanks is also incorporated. The runoff coefficients for point and non point sources responsible for water quality deterioration are included to estimate the concentration of organic pollutants reaching to the stream reaches. The distance decay to evaluate the assimilation capacity of streams in the watershed is further incorporated by assessing data on river width, water level calculation by Manning Formula incorporating slope and maximum water level, base flow and specified water temperature. Water quality parameter are set for each reach of the river for reaction rate constant incorporating decay rate for BOD, phosphorous (total), E Coli, nitrification, denitrification, nitrification yield factor, N/BOD ratio, rate temperature coefficient, weir aeration coefficient and in-catchment time fraction. 6.9.1 Overview of Bhima River Water Quality The water quality simulation based on the input to load calculator for various parameters related to organic matter are generated. A plot of simulated results for all the monitoring locations with respect to Biochemical Oxygen demand is presented below. The water quality is observed in the reaches along Pune Urban Agglomeration is not meeting the desired water quality and observed as grossly
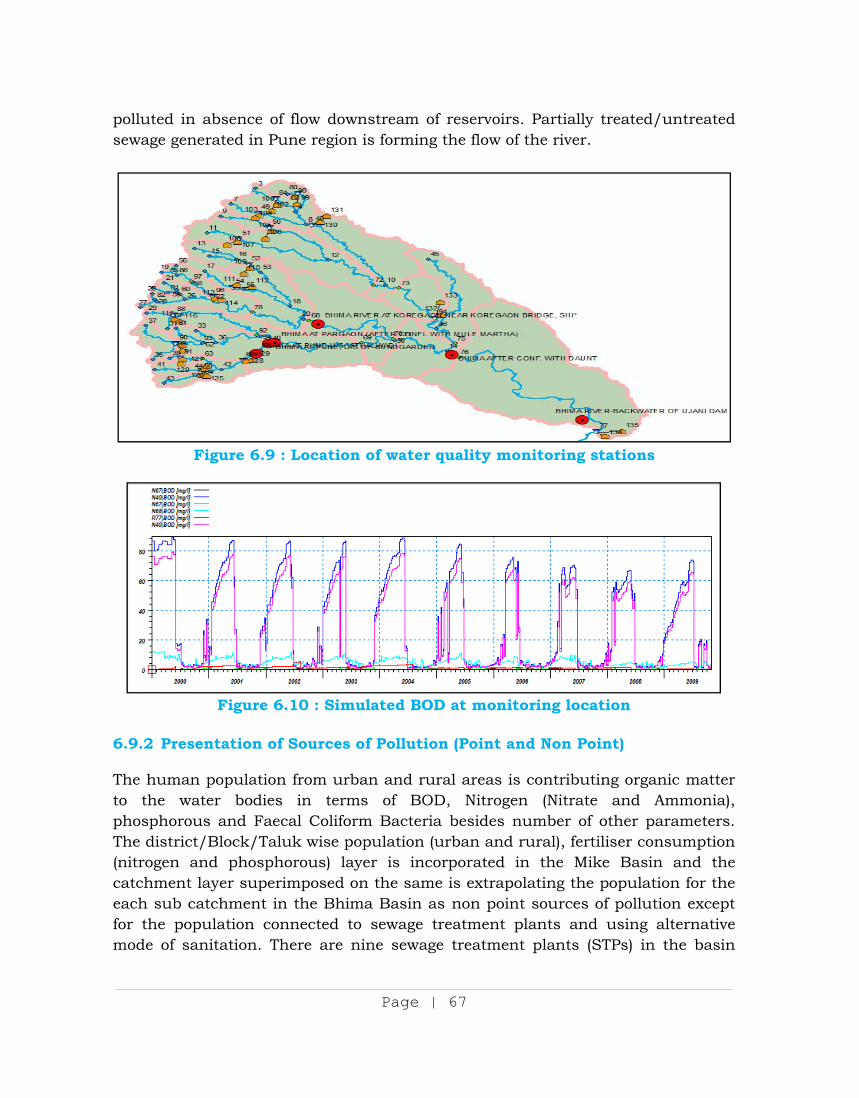
Page | 67
polluted in absence of flow downstream of reservoirs. Partially treated/untreated sewage generated in Pune region is forming the flow of the river.
Figure 6.9 : Location of water quality monitoring stations
Figure 6.10 : Simulated BOD at monitoring location
6.9.2 Presentation of Sources of Pollution (Point and Non Point) The human population from urban and rural areas is contributing organic matter to the water bodies in terms of BOD, Nitrogen (Nitrate and Ammonia), phosphorous and Faecal Coliform Bacteria besides number of other parameters. The district/Block/Taluk wise population (urban and rural), fertiliser consumption (nitrogen and phosphorous) layer is incorporated in the Mike Basin and the catchment layer superimposed on the same is extrapolating the population for the each sub catchment in the Bhima Basin as non point sources of pollution except for the population connected to sewage treatment plants and using alternative mode of sanitation. There are nine sewage treatment plants (STPs) in the basin
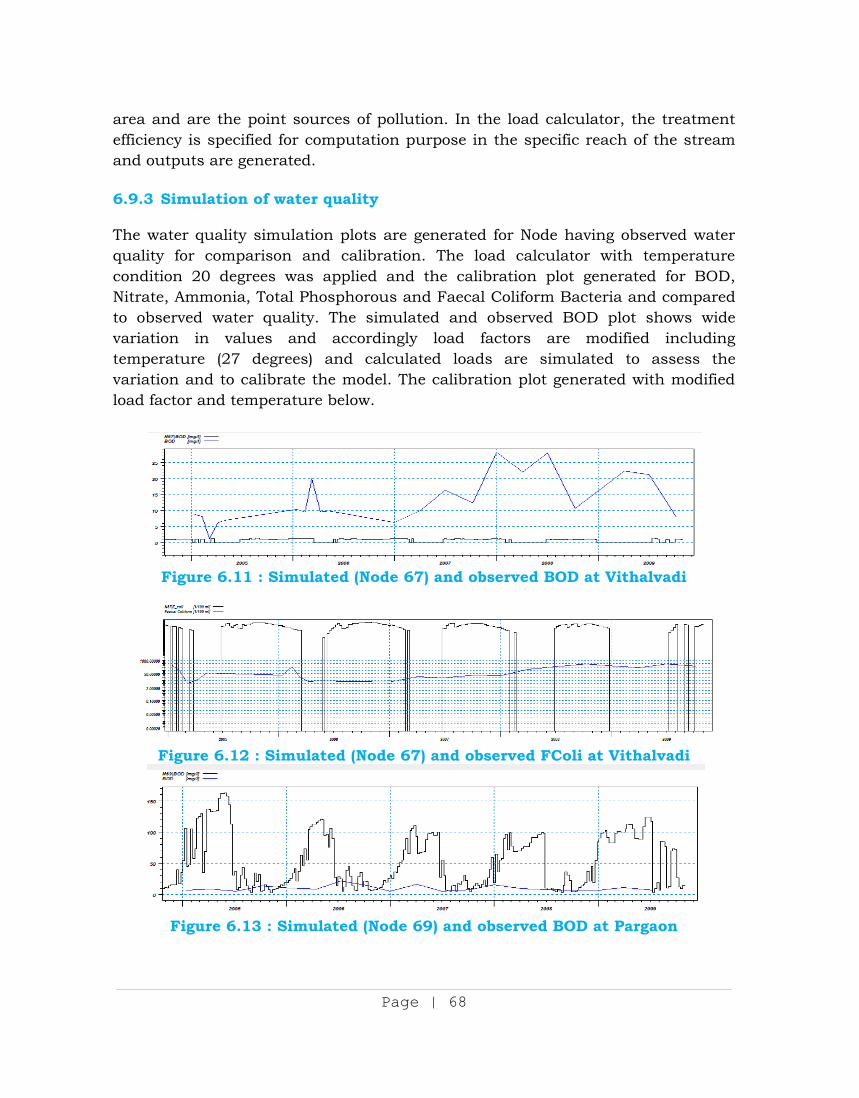
Page | 68
area and are the point sources of pollution. In the load calculator, the treatment efficiency is specified for computation purpose in the specific reach of the stream and outputs are generated. 6.9.3 Simulation of water quality The water quality simulation plots are generated for Node having observed water quality for comparison and calibration. The load calculator with temperature condition 20 degrees was applied and the calibration plot generated for BOD, Nitrate, Ammonia, Total Phosphorous and Faecal Coliform Bacteria and compared to observed water quality. The simulated and observed BOD plot shows wide variation in values and accordingly load factors are modified including temperature (27 degrees) and calculated loads are simulated to assess the variation and to calibrate the model. The calibration plot generated with modified load factor and temperature below.
Figure 6.11 : Simulated (Node 67) and observed BOD at Vithalvadi
Figure 6.12 : Simulated (Node 67) and observed FColi at Vithalvadi
Figure 6.13 : Simulated (Node 69) and observed BOD at Pargaon
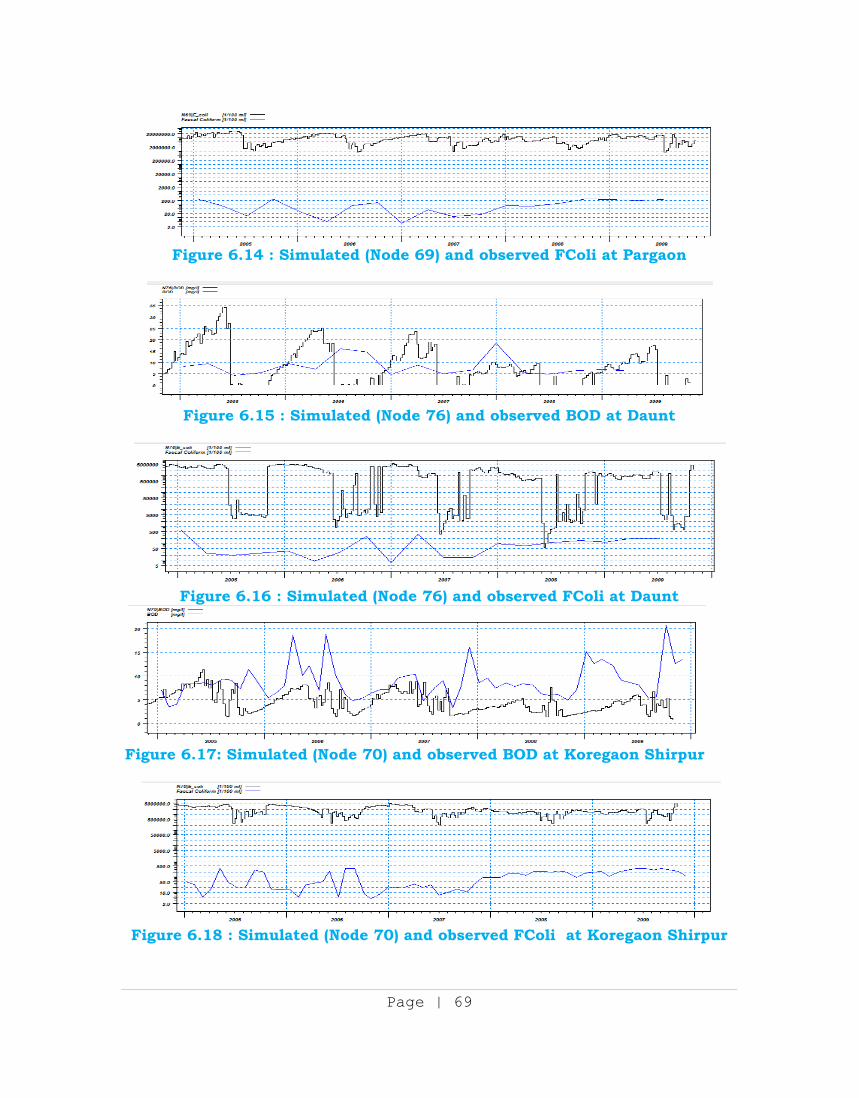
Page | 69
Figure 6.14 : Simulated (Node 69) and observed FColi at Pargaon
Figure 6.15 : Simulated (Node 76) and observed BOD at Daunt
Figure 6.16 : Simulated (Node 76) and observed FColi at Daunt
Figure 6.17: Simulated (Node 70) and observed BOD at Koregaon Shirpur
Figure 6.18 : Simulated (Node 70) and observed FColi at Koregaon Shirpur
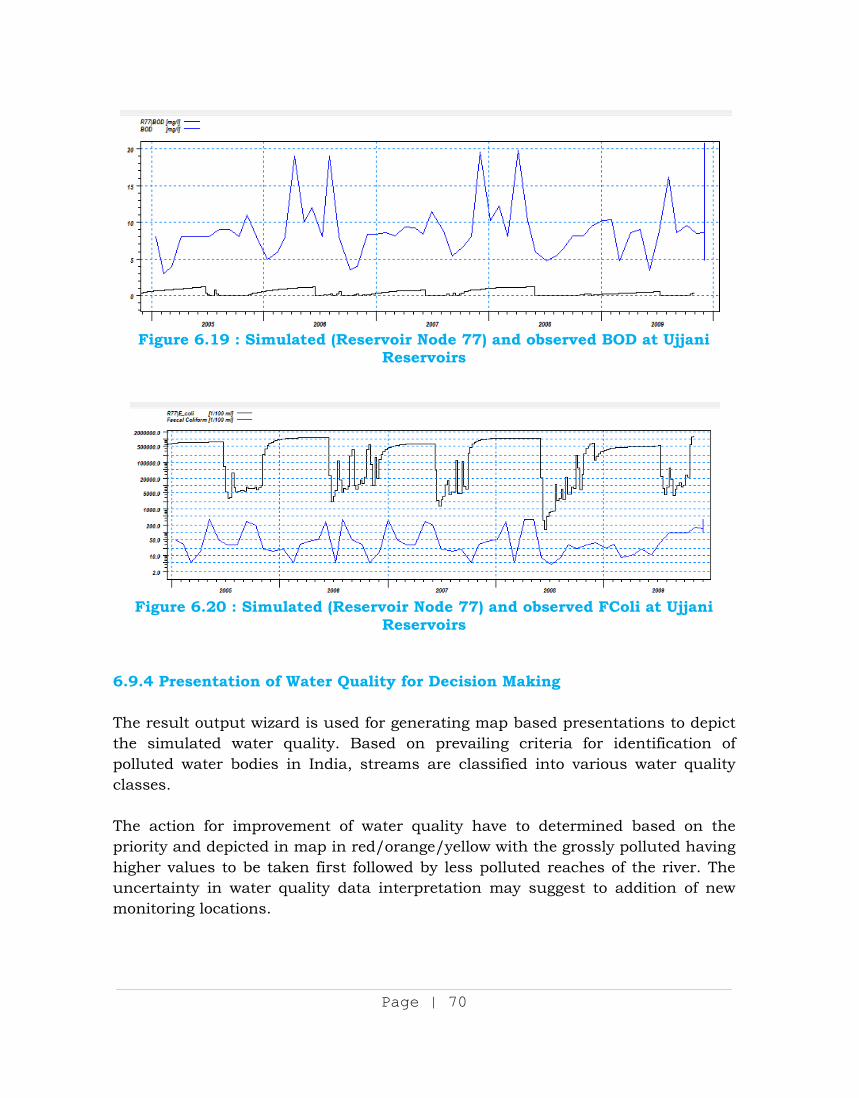
Page | 70
Figure 6.19 : Simulated (Reservoir Node 77) and observed BOD at Ujjani
Reservoirs
Figure 6.20 : Simulated (Reservoir Node 77) and observed FColi at Ujjani
Reservoirs
6.9.4 Presentation of Water Quality for Decision Making The result output wizard is used for generating map based presentations to depict the simulated water quality. Based on prevailing criteria for identification of polluted water bodies in India, streams are classified into various water quality classes. The action for improvement of water quality have to determined based on the priority and depicted in map in red/orange/yellow with the grossly polluted having higher values to be taken first followed by less polluted reaches of the river. The uncertainty in water quality data interpretation may suggest to addition of new monitoring locations.
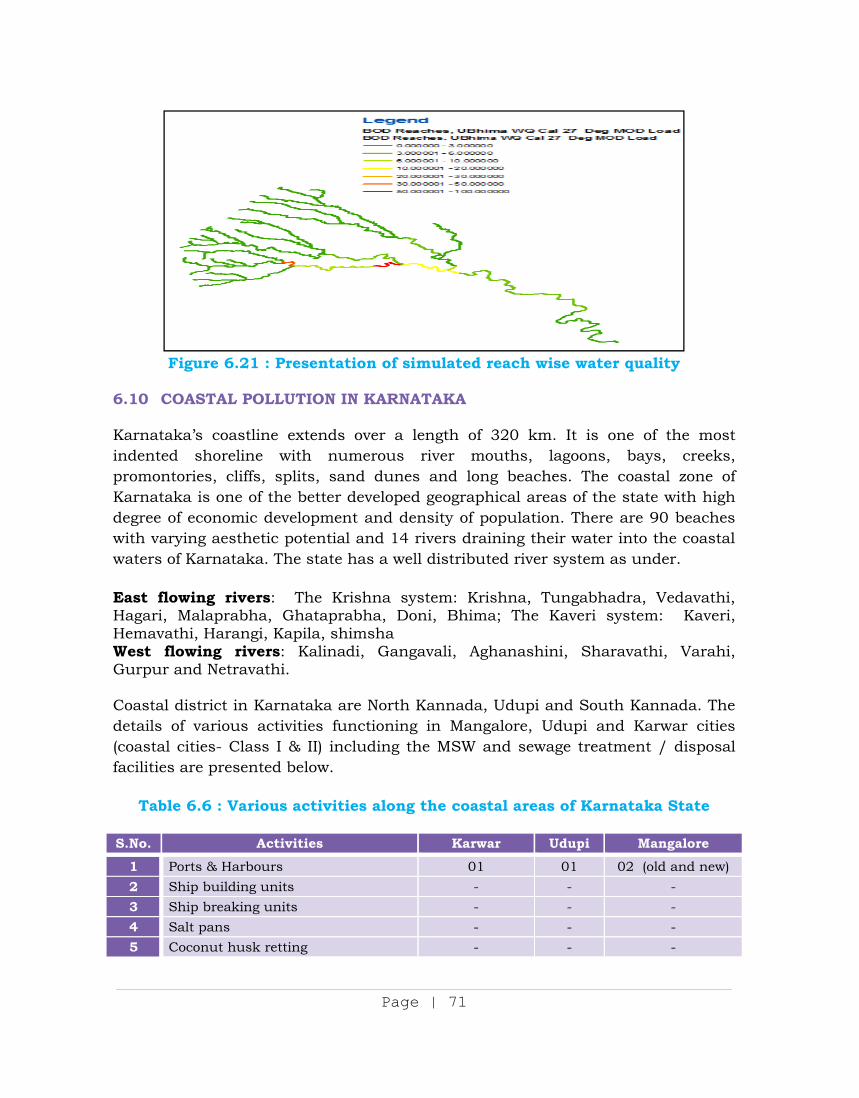
Page | 71
Figure 6.21 : Presentation of simulated reach wise water quality
6.10 COASTAL POLLUTION IN KARNATAKA Karnataka’s coastline extends over a length of 320 km. It is one of the most indented shoreline with numerous river mouths, lagoons, bays, creeks, promontories, cliffs, splits, sand dunes and long beaches. The coastal zone of Karnataka is one of the better developed geographical areas of the state with high degree of economic development and density of population. There are 90 beaches with varying aesthetic potential and 14 rivers draining their water into the coastal waters of Karnataka. The state has a well distributed river system as under. East flowing rivers: The Krishna system: Krishna, Tungabhadra, Vedavathi, Hagari, Malaprabha, Ghataprabha, Doni, Bhima; The Kaveri system: Kaveri, Hemavathi, Harangi, Kapila, shimsha West flowing rivers: Kalinadi, Gangavali, Aghanashini, Sharavathi, Varahi, Gurpur and Netravathi. Coastal district in Karnataka are North Kannada, Udupi and South Kannada. The details of various activities functioning in Mangalore, Udupi and Karwar cities (coastal cities- Class I & II) including the MSW and sewage treatment / disposal facilities are presented below.
Table 6.6 : Various activities along the coastal areas of Karnataka State
S.No. Activities Karwar Udupi Mangalore 1 Ports & Harbours 01 01 02 (old and new) 2 Ship building units - - - 3 Ship breaking units - - - 4 Salt pans - - - 5 Coconut husk retting - - -
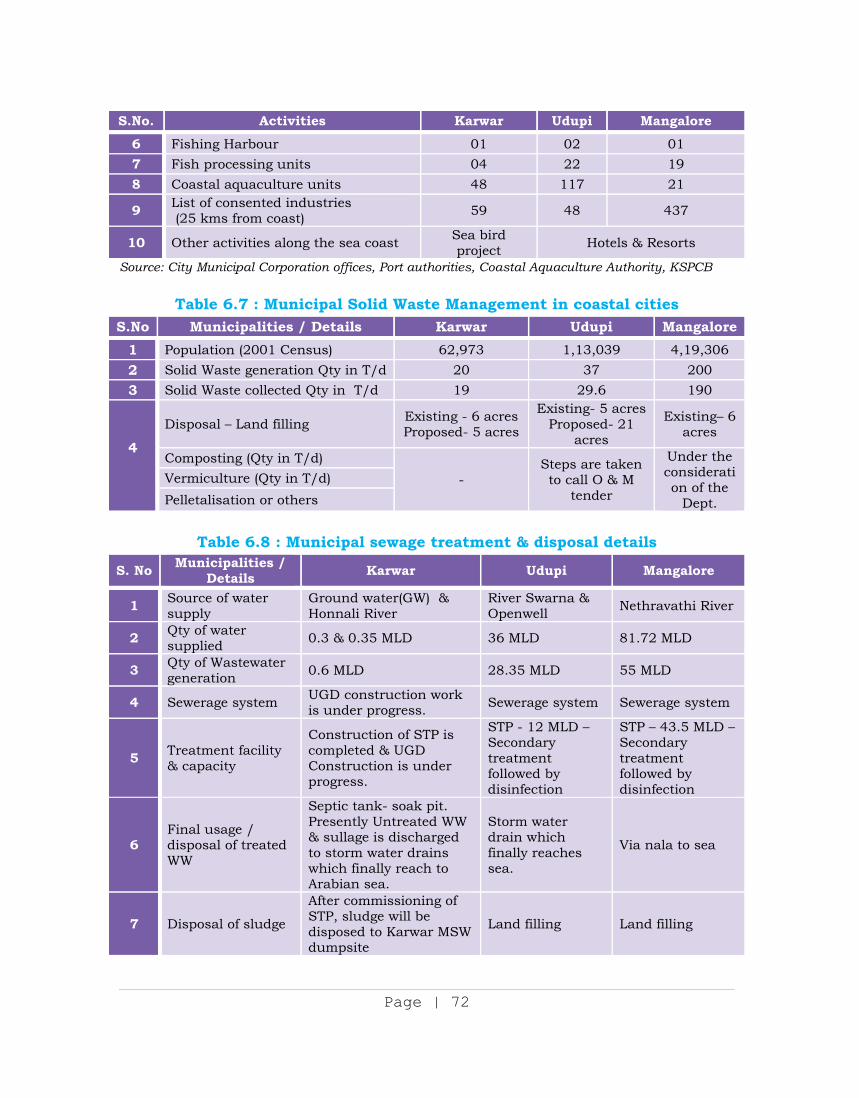
Page | 72
S.No. Activities Karwar Udupi Mangalore 6 Fishing Harbour 01 02 01 7 Fish processing units 04 22 19 8 Coastal aquaculture units 48 117 21
9 List of consented industries (25 kms from coast) 59 48 437
10 Other activities along the sea coast Sea bird project Hotels & Resorts
Source: City Municipal Corporation offices, Port authorities, Coastal Aquaculture Authority, KSPCB
Table 6.7 : Municipal Solid Waste Management in coastal cities S.No Municipalities / Details Karwar Udupi Mangalore
1 Population (2001 Census) 62,973 1,13,039 4,19,306 2 Solid Waste generation Qty in T/d 20 37 200 3 Solid Waste collected Qty in T/d 19 29.6 190
4
Disposal – Land filling Existing - 6 acres Proposed- 5 acres
Existing- 5 acres Proposed- 21
acres
Existing– 6 acres
Composting (Qty in T/d) -
Steps are taken to call O & M
tender
Under the consideration of the
Dept.
Vermiculture (Qty in T/d) Pelletalisation or others
Table 6.8 : Municipal sewage treatment & disposal details
S. No Municipalities / Details Karwar Udupi Mangalore
1 Source of water supply
Ground water(GW) & Honnali River
River Swarna & Openwell Nethravathi River
2 Qty of water supplied 0.3 & 0.35 MLD 36 MLD 81.72 MLD
3 Qty of Wastewater generation 0.6 MLD 28.35 MLD 55 MLD
4 Sewerage system UGD construction work is under progress. Sewerage system Sewerage system
5 Treatment facility & capacity
Construction of STP is completed & UGD Construction is under progress.
STP - 12 MLD – Secondary treatment followed by disinfection
STP – 43.5 MLD – Secondary treatment followed by disinfection
6 Final usage / disposal of treated WW
Septic tank- soak pit. Presently Untreated WW & sullage is discharged to storm water drains which finally reach to Arabian sea.
Storm water drain which finally reaches sea.
Via nala to sea
7 Disposal of sludge
After commissioning of STP, sludge will be disposed to Karwar MSW dumpsite
Land filling Land filling
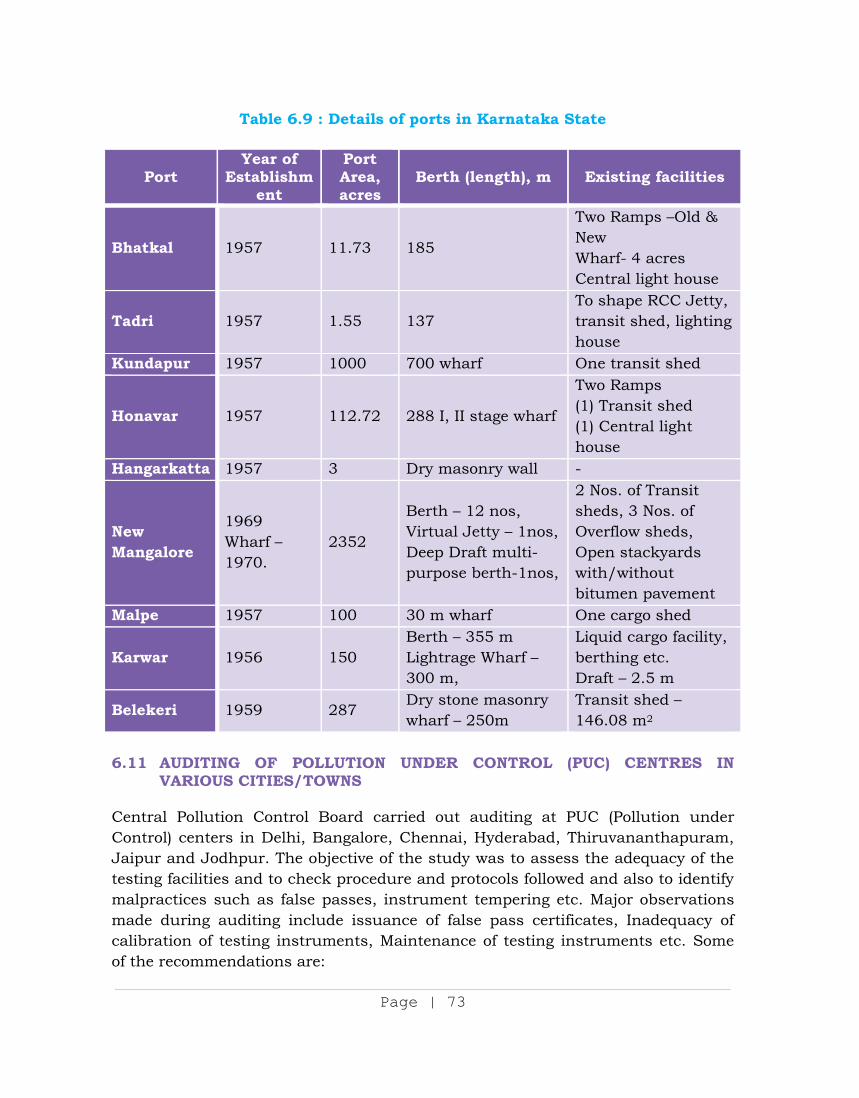
Page | 73
Table 6.9 : Details of ports in Karnataka State
Port Year of
Establishment
Port Area, acres
Berth (length), m Existing facilities
Bhatkal 1957 11.73 185
Two Ramps –Old & New Wharf- 4 acres Central light house
Tadri 1957 1.55 137 To shape RCC Jetty, transit shed, lighting house
Kundapur 1957 1000 700 wharf One transit shed
Honavar 1957 112.72 288 I, II stage wharf
Two Ramps (1) Transit shed (1) Central light house
Hangarkatta 1957 3 Dry masonry wall -
New Mangalore
1969 Wharf – 1970.
2352
Berth – 12 nos, Virtual Jetty – 1nos, Deep Draft multi-purpose berth-1nos,
2 Nos. of Transit sheds, 3 Nos. of Overflow sheds, Open stackyards with/without bitumen pavement
Malpe 1957 100 30 m wharf One cargo shed
Karwar 1956 150 Berth – 355 m Lightrage Wharf – 300 m,
Liquid cargo facility, berthing etc. Draft – 2.5 m
Belekeri 1959 287 Dry stone masonry wharf – 250m
Transit shed – 146.08 m2
6.11 AUDITING OF POLLUTION UNDER CONTROL (PUC) CENTRES IN
VARIOUS CITIES/TOWNS Central Pollution Control Board carried out auditing at PUC (Pollution under Control) centers in Delhi, Bangalore, Chennai, Hyderabad, Thiruvananthapuram, Jaipur and Jodhpur. The objective of the study was to assess the adequacy of the testing facilities and to check procedure and protocols followed and also to identify malpractices such as false passes, instrument tempering etc. Major observations made during auditing include issuance of false pass certificates, Inadequacy of calibration of testing instruments, Maintenance of testing instruments etc. Some of the recommendations are:
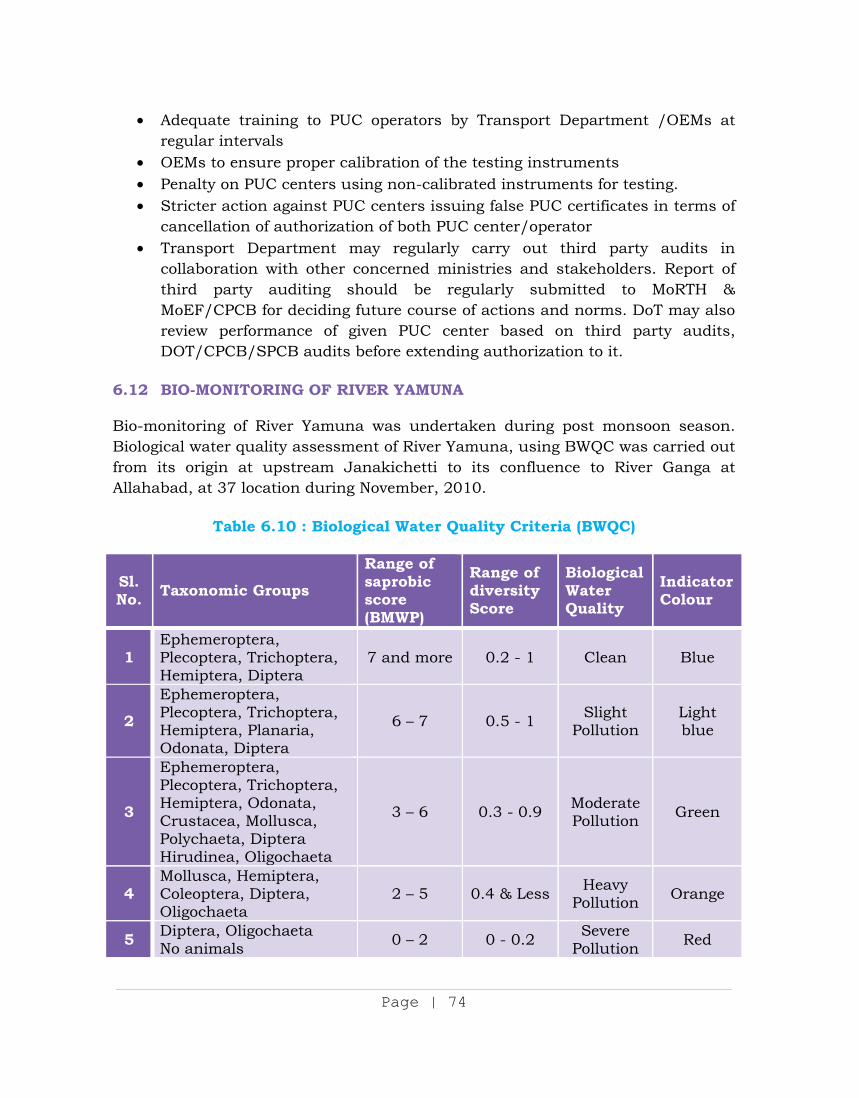
Page | 74
Adequate training to PUC operators by Transport Department /OEMs at regular intervals
OEMs to ensure proper calibration of the testing instruments Penalty on PUC centers using non-calibrated instruments for testing. Stricter action against PUC centers issuing false PUC certificates in terms of
cancellation of authorization of both PUC center/operator Transport Department may regularly carry out third party audits in
collaboration with other concerned ministries and stakeholders. Report of third party auditing should be regularly submitted to MoRTH & MoEF/CPCB for deciding future course of actions and norms. DoT may also review performance of given PUC center based on third party audits, DOT/CPCB/SPCB audits before extending authorization to it.
6.12 BIO-MONITORING OF RIVER YAMUNA Bio-monitoring of River Yamuna was undertaken during post monsoon season. Biological water quality assessment of River Yamuna, using BWQC was carried out from its origin at upstream Janakichetti to its confluence to River Ganga at Allahabad, at 37 location during November, 2010.
Table 6.10 : Biological Water Quality Criteria (BWQC)
Sl. No. Taxonomic Groups
Range of saprobic score (BMWP)
Range of diversity Score
Biological Water Quality
Indicator Colour
1 Ephemeroptera, Plecoptera, Trichoptera, Hemiptera, Diptera
7 and more 0.2 - 1 Clean Blue
2 Ephemeroptera, Plecoptera, Trichoptera, Hemiptera, Planaria, Odonata, Diptera
6 – 7 0.5 - 1 Slight Pollution
Light blue
3
Ephemeroptera, Plecoptera, Trichoptera, Hemiptera, Odonata, Crustacea, Mollusca, Polychaeta, Diptera Hirudinea, Oligochaeta
3 – 6 0.3 - 0.9 Moderate Pollution Green
4 Mollusca, Hemiptera, Coleoptera, Diptera, Oligochaeta
2 – 5 0.4 & Less Heavy Pollution Orange
5 Diptera, Oligochaeta No animals 0 – 2 0 - 0.2 Severe
Pollution Red
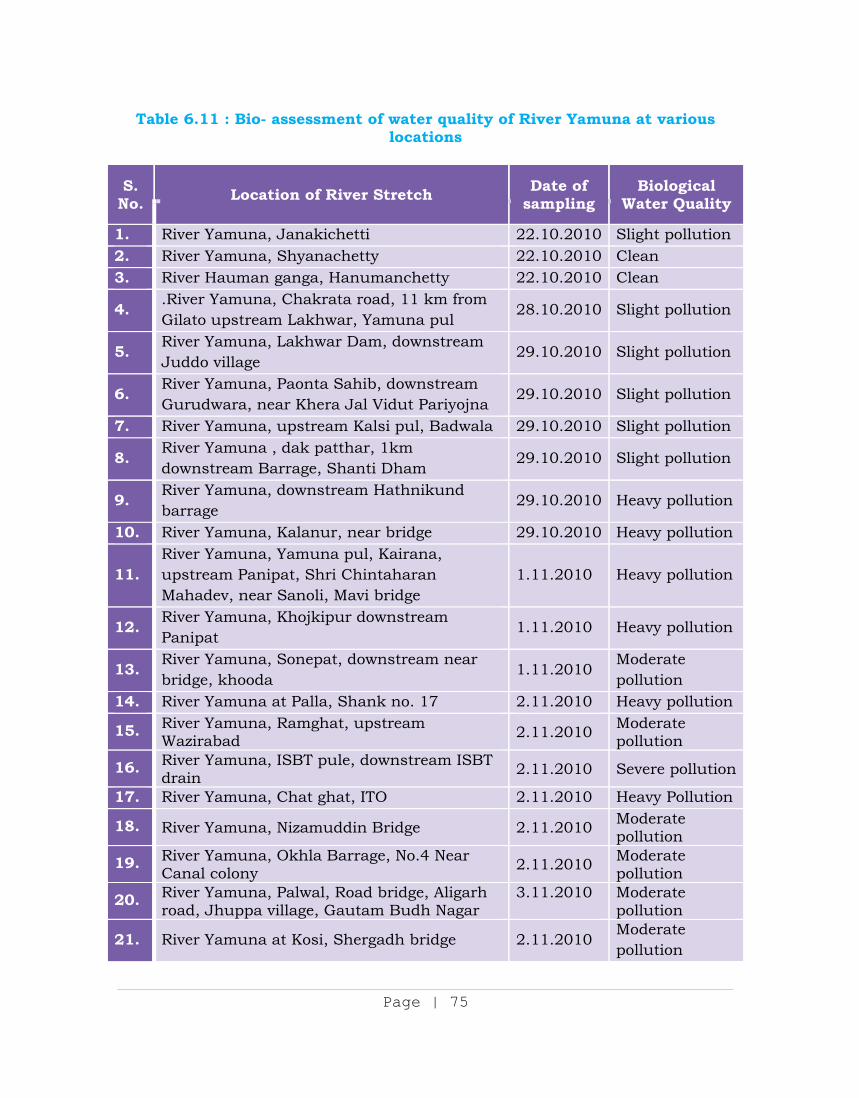
Page | 75
Table 6.11 : Bio- assessment of water quality of River Yamuna at various locations
S. No. Location of River Stretch Date of
sampling Biological
Water Quality
1. River Yamuna, Janakichetti 22.10.2010 Slight pollution 2. River Yamuna, Shyanachetty 22.10.2010 Clean 3. River Hauman ganga, Hanumanchetty 22.10.2010 Clean
4. .River Yamuna, Chakrata road, 11 km from Gilato upstream Lakhwar, Yamuna pul
28.10.2010 Slight pollution
5. River Yamuna, Lakhwar Dam, downstream Juddo village
29.10.2010 Slight pollution
6. River Yamuna, Paonta Sahib, downstream Gurudwara, near Khera Jal Vidut Pariyojna
29.10.2010 Slight pollution
7. River Yamuna, upstream Kalsi pul, Badwala 29.10.2010 Slight pollution
8. River Yamuna , dak patthar, 1km downstream Barrage, Shanti Dham
29.10.2010 Slight pollution
9. River Yamuna, downstream Hathnikund barrage
29.10.2010 Heavy pollution
10. River Yamuna, Kalanur, near bridge 29.10.2010 Heavy pollution
11. River Yamuna, Yamuna pul, Kairana, upstream Panipat, Shri Chintaharan Mahadev, near Sanoli, Mavi bridge
1.11.2010 Heavy pollution
12. River Yamuna, Khojkipur downstream Panipat
1.11.2010 Heavy pollution
13. River Yamuna, Sonepat, downstream near bridge, khooda
1.11.2010 Moderate pollution
14. River Yamuna at Palla, Shank no. 17 2.11.2010 Heavy pollution
15. River Yamuna, Ramghat, upstream Wazirabad 2.11.2010 Moderate
pollution
16. River Yamuna, ISBT pule, downstream ISBT drain 2.11.2010 Severe pollution
17. River Yamuna, Chat ghat, ITO 2.11.2010 Heavy Pollution
18. River Yamuna, Nizamuddin Bridge 2.11.2010 Moderate pollution
19. River Yamuna, Okhla Barrage, No.4 Near Canal colony 2.11.2010 Moderate
pollution
20. River Yamuna, Palwal, Road bridge, Aligarh road, Jhuppa village, Gautam Budh Nagar
3.11.2010
Moderate pollution
21. River Yamuna at Kosi, Shergadh bridge 2.11.2010 Moderate pollution
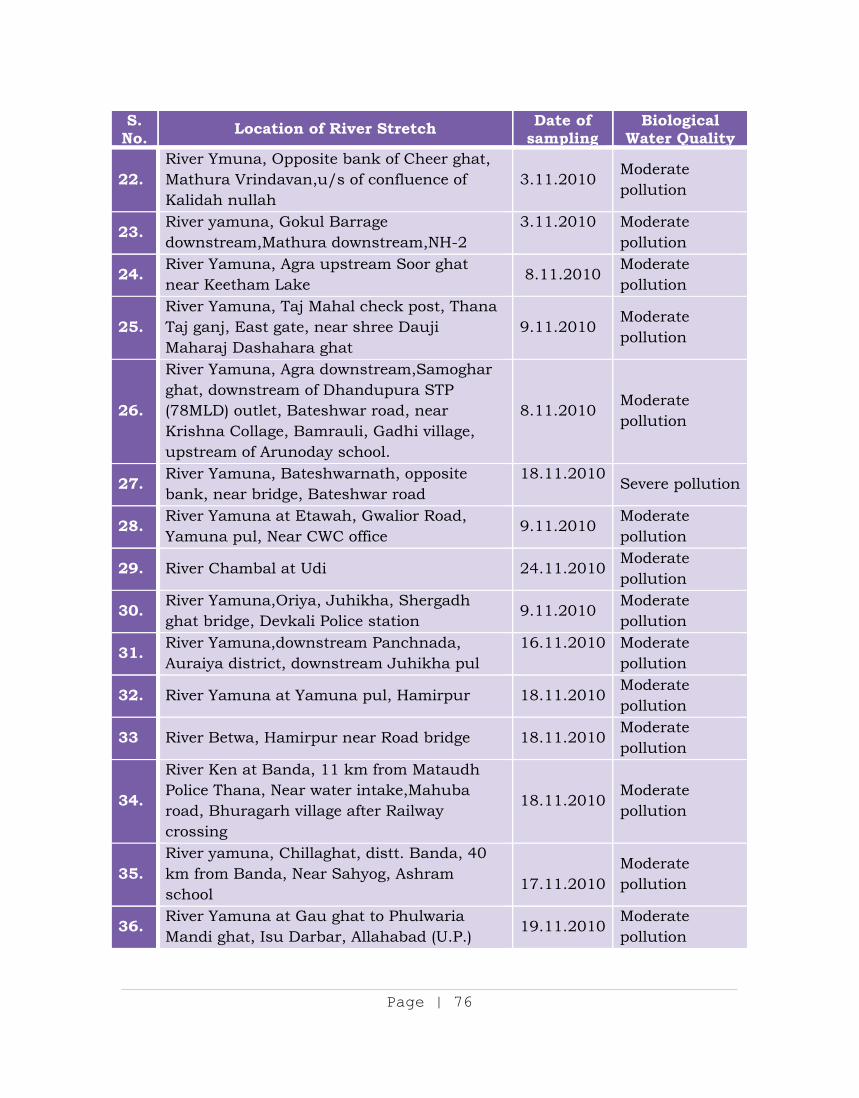
Page | 76
S. No. Location of River Stretch Date of
sampling Biological
Water Quality
22. River Ymuna, Opposite bank of Cheer ghat, Mathura Vrindavan,u/s of confluence of Kalidah nullah
3.11.2010 Moderate pollution
23. River yamuna, Gokul Barrage downstream,Mathura downstream,NH-2
3.11.2010
Moderate pollution
24. River Yamuna, Agra upstream Soor ghat near Keetham Lake
8.11.2010 Moderate pollution
25. River Yamuna, Taj Mahal check post, Thana Taj ganj, East gate, near shree Dauji Maharaj Dashahara ghat
9.11.2010 Moderate pollution
26.
River Yamuna, Agra downstream,Samoghar ghat, downstream of Dhandupura STP (78MLD) outlet, Bateshwar road, near Krishna Collage, Bamrauli, Gadhi village, upstream of Arunoday school.
8.11.2010 Moderate pollution
27. River Yamuna, Bateshwarnath, opposite bank, near bridge, Bateshwar road
18.11.2010
Severe pollution
28. River Yamuna at Etawah, Gwalior Road, Yamuna pul, Near CWC office
9.11.2010 Moderate pollution
29. River Chambal at Udi 24.11.2010 Moderate pollution
30. River Yamuna,Oriya, Juhikha, Shergadh ghat bridge, Devkali Police station
9.11.2010 Moderate pollution
31. River Yamuna,downstream Panchnada, Auraiya district, downstream Juhikha pul
16.11.2010
Moderate pollution
32. River Yamuna at Yamuna pul, Hamirpur 18.11.2010 Moderate pollution
33 River Betwa, Hamirpur near Road bridge 18.11.2010 Moderate pollution
34.
River Ken at Banda, 11 km from Mataudh Police Thana, Near water intake,Mahuba road, Bhuragarh village after Railway crossing
18.11.2010 Moderate pollution
35. River yamuna, Chillaghat, distt. Banda, 40 km from Banda, Near Sahyog, Ashram school
17.11.2010
Moderate pollution
36. River Yamuna at Gau ghat to Phulwaria Mandi ghat, Isu Darbar, Allahabad (U.P.)
19.11.2010 Moderate pollution
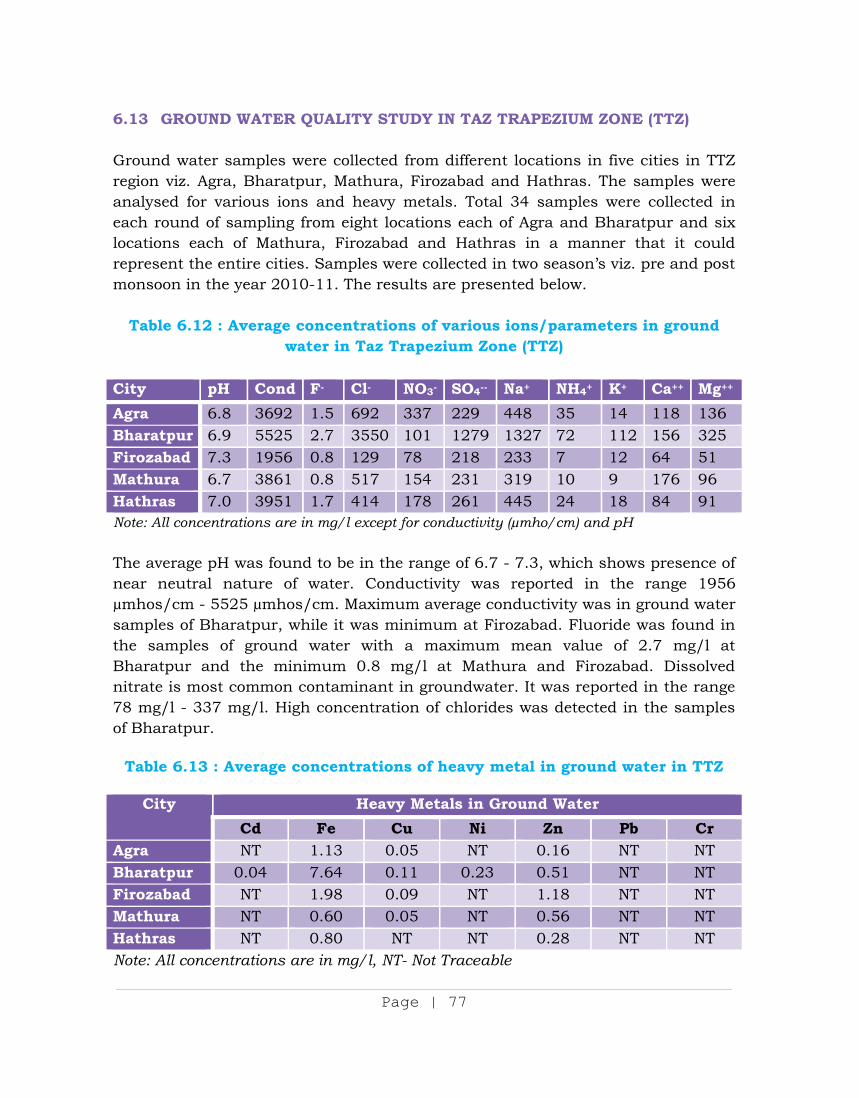
Page | 77
6.13 GROUND WATER QUALITY STUDY IN TAZ TRAPEZIUM ZONE (TTZ) Ground water samples were collected from different locations in five cities in TTZ region viz. Agra, Bharatpur, Mathura, Firozabad and Hathras. The samples were analysed for various ions and heavy metals. Total 34 samples were collected in each round of sampling from eight locations each of Agra and Bharatpur and six locations each of Mathura, Firozabad and Hathras in a manner that it could represent the entire cities. Samples were collected in two season’s viz. pre and post monsoon in the year 2010-11. The results are presented below.
Table 6.12 : Average concentrations of various ions/parameters in ground water in Taz Trapezium Zone (TTZ)
City pH Cond F- Cl- NO3- SO4-- Na+ NH4+ K+ Ca++ Mg++
Agra 6.8 3692 1.5 692 337 229 448 35 14 118 136 Bharatpur 6.9 5525 2.7 3550 101 1279 1327 72 112 156 325 Firozabad 7.3 1956 0.8 129 78 218 233 7 12 64 51 Mathura 6.7 3861 0.8 517 154 231 319 10 9 176 96 Hathras 7.0 3951 1.7 414 178 261 445 24 18 84 91 Note: All concentrations are in mg/l except for conductivity (µmho/cm) and pH The average pH was found to be in the range of 6.7 - 7.3, which shows presence of near neutral nature of water. Conductivity was reported in the range 1956 µmhos/cm - 5525 µmhos/cm. Maximum average conductivity was in ground water samples of Bharatpur, while it was minimum at Firozabad. Fluoride was found in the samples of ground water with a maximum mean value of 2.7 mg/l at Bharatpur and the minimum 0.8 mg/l at Mathura and Firozabad. Dissolved nitrate is most common contaminant in groundwater. It was reported in the range 78 mg/l - 337 mg/l. High concentration of chlorides was detected in the samples of Bharatpur.
Table 6.13 : Average concentrations of heavy metal in ground water in TTZ
City Heavy Metals in Ground Water Cd Fe Cu Ni Zn Pb Cr
Agra NT 1.13 0.05 NT 0.16 NT NT Bharatpur 0.04 7.64 0.11 0.23 0.51 NT NT Firozabad NT 1.98 0.09 NT 1.18 NT NT Mathura NT 0.60 0.05 NT 0.56 NT NT Hathras NT 0.80 NT NT 0.28 NT NT Note: All concentrations are in mg/l, NT- Not Traceable
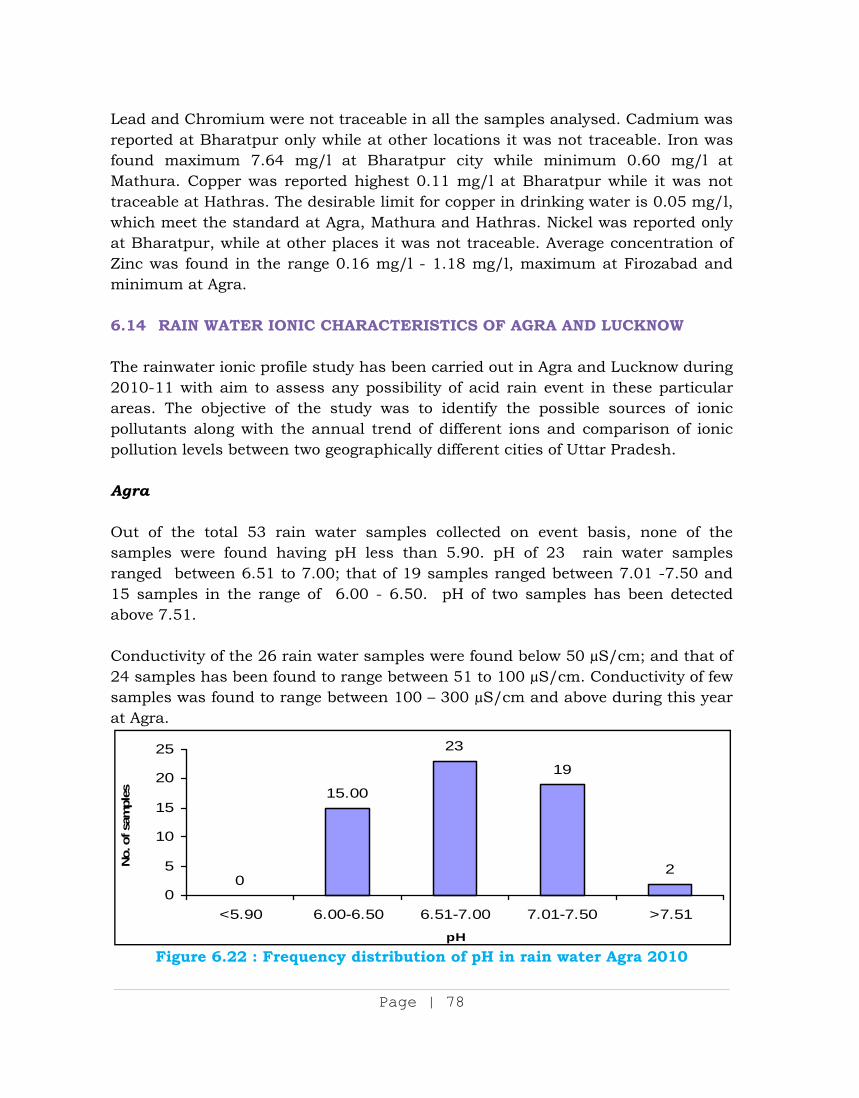
Page | 78
Lead and Chromium were not traceable in all the samples analysed. Cadmium was reported at Bharatpur only while at other locations it was not traceable. Iron was found maximum 7.64 mg/l at Bharatpur city while minimum 0.60 mg/l at Mathura. Copper was reported highest 0.11 mg/l at Bharatpur while it was not traceable at Hathras. The desirable limit for copper in drinking water is 0.05 mg/l, which meet the standard at Agra, Mathura and Hathras. Nickel was reported only at Bharatpur, while at other places it was not traceable. Average concentration of Zinc was found in the range 0.16 mg/l - 1.18 mg/l, maximum at Firozabad and minimum at Agra. 6.14 RAIN WATER IONIC CHARACTERISTICS OF AGRA AND LUCKNOW The rainwater ionic profile study has been carried out in Agra and Lucknow during 2010-11 with aim to assess any possibility of acid rain event in these particular areas. The objective of the study was to identify the possible sources of ionic pollutants along with the annual trend of different ions and comparison of ionic pollution levels between two geographically different cities of Uttar Pradesh. Agra Out of the total 53 rain water samples collected on event basis, none of the samples were found having pH less than 5.90. pH of 23 rain water samples ranged between 6.51 to 7.00; that of 19 samples ranged between 7.01 -7.50 and 15 samples in the range of 6.00 - 6.50. pH of two samples has been detected above 7.51. Conductivity of the 26 rain water samples were found below 50 µS/cm; and that of 24 samples has been found to range between 51 to 100 µS/cm. Conductivity of few samples was found to range between 100 – 300 µS/cm and above during this year at Agra.
Figure 6.22 : Frequency distribution of pH in rain water Agra 2010
0
15.00
23
19
2
0
5
10
15
20
25
<5.90 6.00-6.50 6.51-7.00 7.01-7.50 >7.51pH
No.
of s
ampl
es
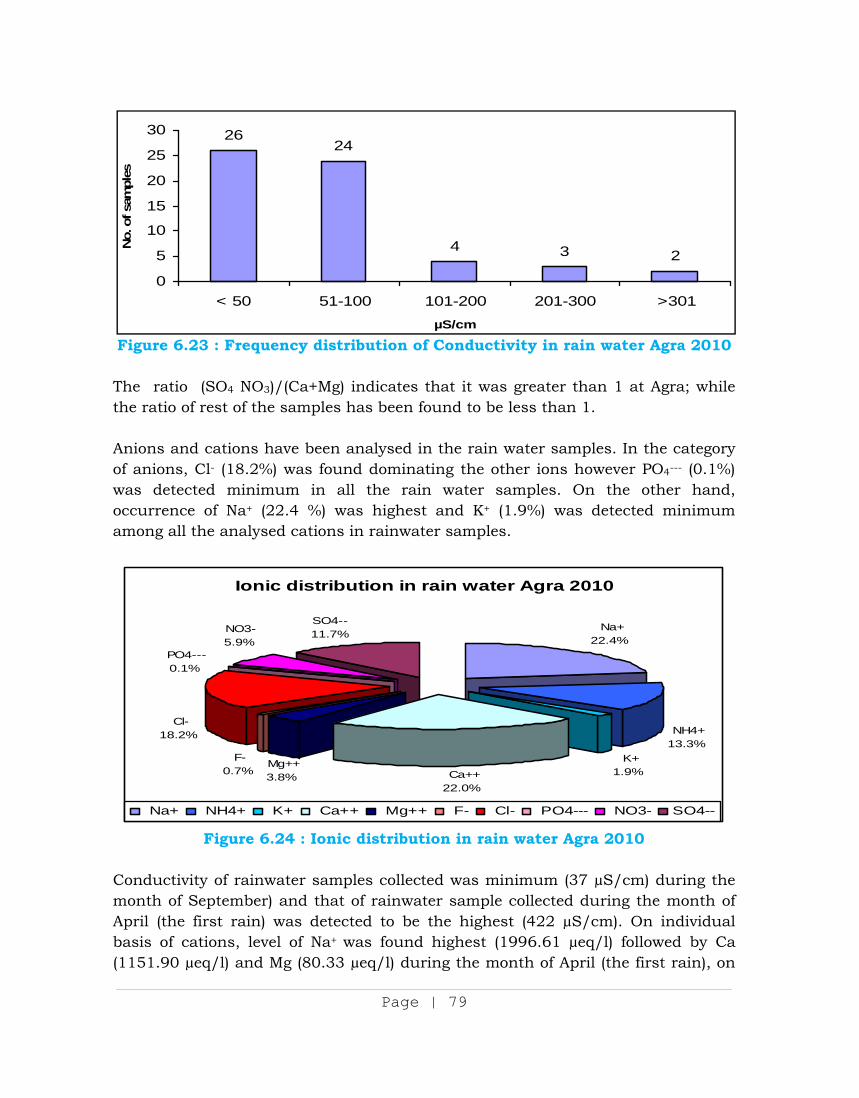
Page | 79
Figure 6.23 : Frequency distribution of Conductivity in rain water Agra 2010
The ratio (SO4 NO3)/(Ca+Mg) indicates that it was greater than 1 at Agra; while the ratio of rest of the samples has been found to be less than 1. Anions and cations have been analysed in the rain water samples. In the category of anions, Cl- (18.2%) was found dominating the other ions however PO4--- (0.1%) was detected minimum in all the rain water samples. On the other hand, occurrence of Na+ (22.4 %) was highest and K+ (1.9%) was detected minimum among all the analysed cations in rainwater samples.
Figure 6.24 : Ionic distribution in rain water Agra 2010
Conductivity of rainwater samples collected was minimum (37 µS/cm) during the month of September) and that of rainwater sample collected during the month of April (the first rain) was detected to be the highest (422 µS/cm). On individual basis of cations, level of Na+ was found highest (1996.61 µeq/l) followed by Ca (1151.90 µeq/l) and Mg (80.33 µeq/l) during the month of April (the first rain), on
2624
4 3 2
0
5
10
15
20
25
30
< 50 51-100 101-200 201-300 >301 µS/cm
No.
of s
ampl
es
Ionic distribution in rain water Agra 2010
Na+22.4%
NH4+13.3%
K+1.9% Ca++
22.0%
F-0.7%
Cl-18.2%
SO4--11.7%
Mg++3.8%
PO4---0.1%
NO3-5.9%
Na+ NH4+ K+ Ca++ Mg++ F- Cl- PO4--- NO3- SO4--
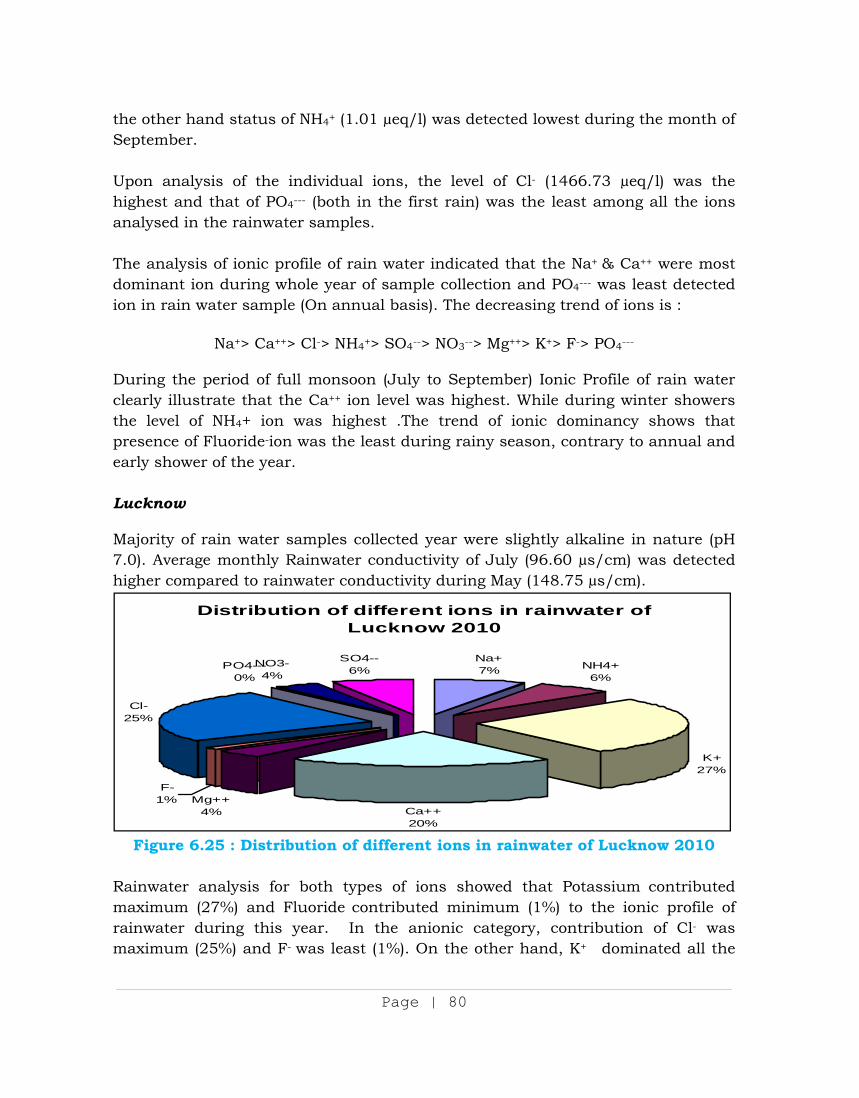
Page | 80
the other hand status of NH4+ (1.01 µeq/l) was detected lowest during the month of September. Upon analysis of the individual ions, the level of Cl- (1466.73 µeq/l) was the highest and that of PO4--- (both in the first rain) was the least among all the ions analysed in the rainwater samples. The analysis of ionic profile of rain water indicated that the Na+ & Ca++ were most dominant ion during whole year of sample collection and PO4--- was least detected ion in rain water sample (On annual basis). The decreasing trend of ions is :
Na+> Ca++> Cl-> NH4+> SO4--> NO3--> Mg++> K+> F-> PO4---
During the period of full monsoon (July to September) Ionic Profile of rain water clearly illustrate that the Ca++ ion level was highest. While during winter showers the level of NH4+ ion was highest .The trend of ionic dominancy shows that presence of Fluoride-ion was the least during rainy season, contrary to annual and early shower of the year. Lucknow Majority of rain water samples collected year were slightly alkaline in nature (pH 7.0). Average monthly Rainwater conductivity of July (96.60 µs/cm) was detected higher compared to rainwater conductivity during May (148.75 µs/cm).
Figure 6.25 : Distribution of different ions in rainwater of Lucknow 2010
Rainwater analysis for both types of ions showed that Potassium contributed maximum (27%) and Fluoride contributed minimum (1%) to the ionic profile of rainwater during this year. In the anionic category, contribution of Cl- was maximum (25%) and F- was least (1%). On the other hand, K+ dominated all the
Distribution of different ions in rainwater of Lucknow 2010
Na+7% NH4+
6%
K+27%
Ca++20%
Mg++4%
Cl-25%
PO4---0%
NO3-4%
SO4--6%
F-1%
Page | 81
cations (27%) in rainwater samples and Mg++ contributed only 4%. Majority of rainwater samples collected during this year in Lucknow has been found slightly alkaline in nature. 6.15 CHARACTERIZATION OF SUSPENDED PARTICULATE MATTER IN AND
AROUND RAIPUR & RAIGARH Raipur and Raigarh in Chhattisgarh state have witnessed high industrial growth in sponge iron sector resulting into heavy air pollution in these cities. The study was targeted to evaluate heavy metal composition present in the SPM fractions. The SPM samples were collected from five different locations representing residential, industrial and commercial locations. SPM containing filter paper was digested in concentrated nitric acid. And analyzed for Fe, Zn, Cu, Pb, Mn, Ni, Cd and Cr as per APHA manual. Only four heavy metals (Fe, Ni, Mn & Zn) have been detected in ambient air samples.
In Raipur city, the heavy metals were found in the range of 0.90-6.52% of SPM, on eight hourly basis and 1.17-2.32 % of SPM on 24 hourly average basis.
In Raigarh city, the heavy metals are found in the range of 0.32-1.85 % of SPM, on eight hourly basis and 0.43-0.89 % of SPM on 24 hourly average basis.
The higher values of iron are confirming that sponge iron industries are the main contributor of heavy metals in ambient air pollution.
In Raipur City, the trend shows that the pollution is generated from industries in Siltara industrial area and getting dispersed.
In Raigarh City, due to hill topography in nearby area the heavy metals getting trapped and brought back towards the city.
* * *
Page | 82
CHAPTER VII
ENVIRONMENTAL RESEARCH
7.1 SALT-LESS PRESERVATION OF HIDES AND SKINS BY LYOPHILISATION TECHNIQUE CPCB undertook an R&D intervention initiative to minimize use of salt in hide preservation thereby eliminate the key factor responsible for high dissolved solids in effluent from leather processing industries and developed a process of salt-less preservation of hides/skins which focused on freeze drying of hides by lyophilization. Lyophilization process is an advanced technique employed for preservation of easily biodegradable material. It is based on the principle of sublimation, whereby, water content in the materials to be preserved is first converted into ice and is sublimated to water vapor under vacuum condition, thus extracting the water content and make the lyophilized item freeze dried, stable and easier to store at ambient temperature. When opted for hide / skin preservation, lyophilisation has several merits compared to other hide drying and preserving techniques. 7.2 UTILIZATION OF DISTILLERY EFFLUENT AS A SOURCE OF NUTRIENTS
FOR CROP PRODUCTION IN DIFFERENT AGRO-CLIMATIC REGIONS OF INDIA
CPCB initiated a three year duration network study - “Utilization of Distillery Effluent as a Source of Nutrients for Crop production in Different Agro-climatic Regions of India” - in the year 2007-08 in association with four agricultural institutes/centres - Indian Agricultural Research Institute (IARI) New Delhi (coordinating agency), Tamil Nadu Agricultural University (TNAU) Coimbatore, Mahatma Phule Krishi Vidyapeeth (MPKV) Rahuri and College of Agriculture Indore. At each center field, experiments were carried out in one or two agro-climatic zones to quantify threshold doses of distillery effluent wash under different agro-climatic conditions. Movement of salts in soil layers and leaching requirements of salt load were studied in the experimental fields as well as under laboratory conditions. The study has been completed at all centers and the combined report is under preparation. 7.3 CORROSION IMPACT ASSESSMENT STUDIES- A REPORT To study the ‘Impact of Air Pollution on Corrosion of Metallic and Non-metallic materials’ a project has been initiated in association with National Metallurgical Laboratory, Jamshedpur. The major focus of this study is assessment of corrosion
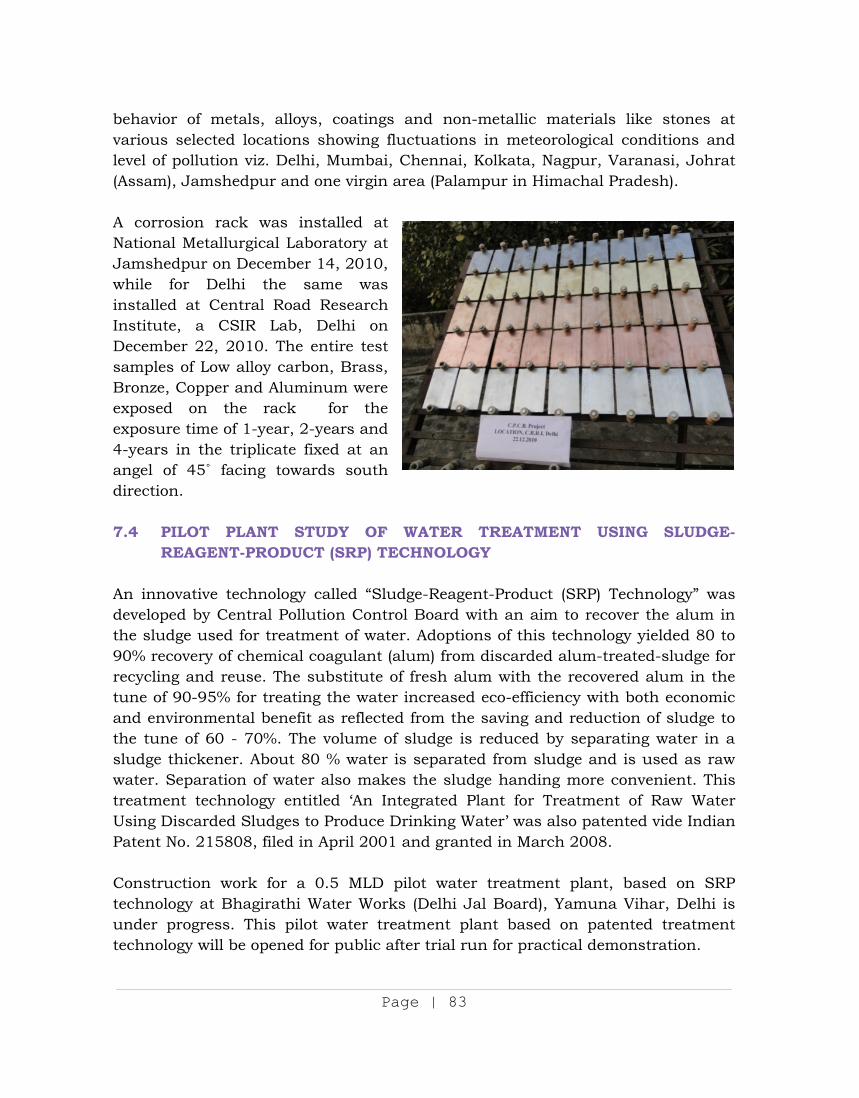
Page | 83
behavior of metals, alloys, coatings and non-metallic materials like stones at various selected locations showing fluctuations in meteorological conditions and level of pollution viz. Delhi, Mumbai, Chennai, Kolkata, Nagpur, Varanasi, Johrat (Assam), Jamshedpur and one virgin area (Palampur in Himachal Pradesh). A corrosion rack was installed at National Metallurgical Laboratory at Jamshedpur on December 14, 2010, while for Delhi the same was installed at Central Road Research Institute, a CSIR Lab, Delhi on December 22, 2010. The entire test samples of Low alloy carbon, Brass, Bronze, Copper and Aluminum were exposed on the rack for the exposure time of 1-year, 2-years and 4-years in the triplicate fixed at an angel of 45 facing towards south direction. 7.4 PILOT PLANT STUDY OF WATER TREATMENT USING SLUDGE-
REAGENT-PRODUCT (SRP) TECHNOLOGY An innovative technology called “Sludge-Reagent-Product (SRP) Technology” was developed by Central Pollution Control Board with an aim to recover the alum in the sludge used for treatment of water. Adoptions of this technology yielded 80 to 90% recovery of chemical coagulant (alum) from discarded alum-treated-sludge for recycling and reuse. The substitute of fresh alum with the recovered alum in the tune of 90-95% for treating the water increased eco-efficiency with both economic and environmental benefit as reflected from the saving and reduction of sludge to the tune of 60 - 70%. The volume of sludge is reduced by separating water in a sludge thickener. About 80 % water is separated from sludge and is used as raw water. Separation of water also makes the sludge handing more convenient. This treatment technology entitled ‘An Integrated Plant for Treatment of Raw Water Using Discarded Sludges to Produce Drinking Water’ was also patented vide Indian Patent No. 215808, filed in April 2001 and granted in March 2008. Construction work for a 0.5 MLD pilot water treatment plant, based on SRP technology at Bhagirathi Water Works (Delhi Jal Board), Yamuna Vihar, Delhi is under progress. This pilot water treatment plant based on patented treatment technology will be opened for public after trial run for practical demonstration.
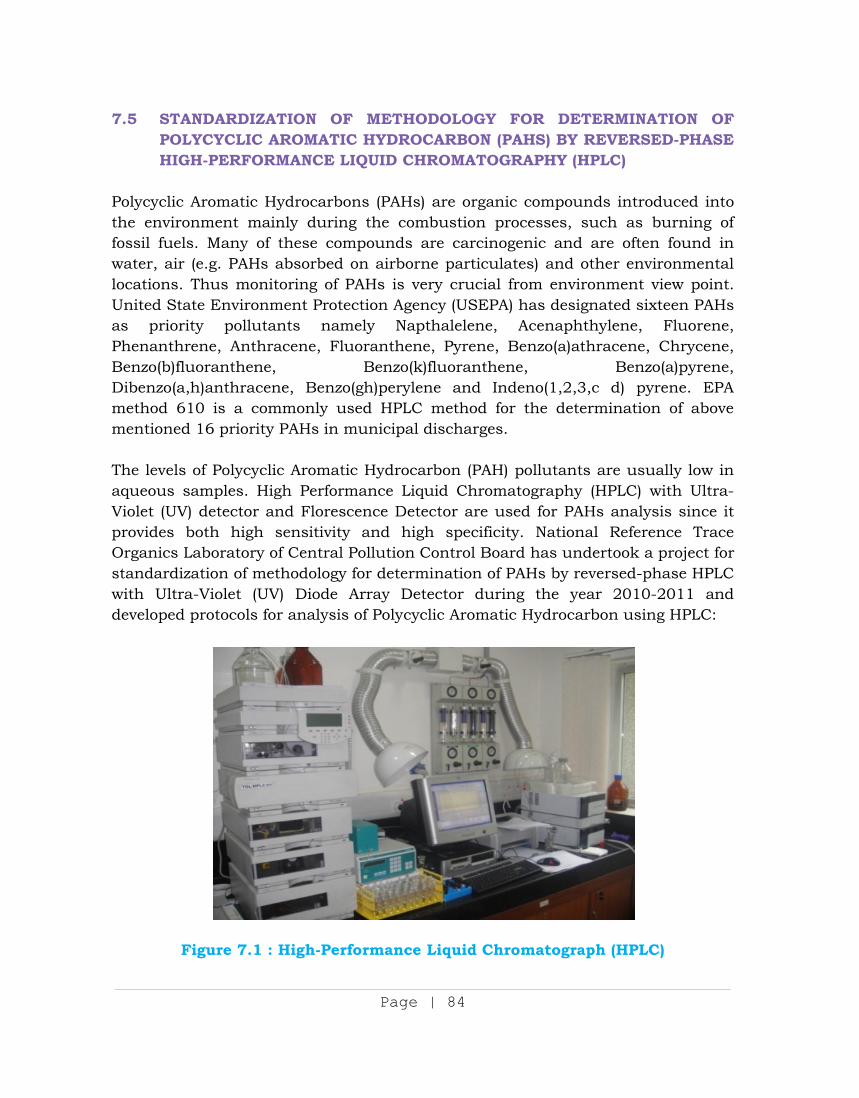
Page | 84
7.5 STANDARDIZATION OF METHODOLOGY FOR DETERMINATION OF POLYCYCLIC AROMATIC HYDROCARBON (PAHS) BY REVERSED-PHASE HIGH-PERFORMANCE LIQUID CHROMATOGRAPHY (HPLC)
Polycyclic Aromatic Hydrocarbons (PAHs) are organic compounds introduced into the environment mainly during the combustion processes, such as burning of fossil fuels. Many of these compounds are carcinogenic and are often found in water, air (e.g. PAHs absorbed on airborne particulates) and other environmental locations. Thus monitoring of PAHs is very crucial from environment view point. United State Environment Protection Agency (USEPA) has designated sixteen PAHs as priority pollutants namely Napthalelene, Acenaphthylene, Fluorene, Phenanthrene, Anthracene, Fluoranthene, Pyrene, Benzo(a)athracene, Chrycene, Benzo(b)fluoranthene, Benzo(k)fluoranthene, Benzo(a)pyrene, Dibenzo(a,h)anthracene, Benzo(gh)perylene and Indeno(1,2,3,c d) pyrene. EPA method 610 is a commonly used HPLC method for the determination of above mentioned 16 priority PAHs in municipal discharges. The levels of Polycyclic Aromatic Hydrocarbon (PAH) pollutants are usually low in aqueous samples. High Performance Liquid Chromatography (HPLC) with Ultra-Violet (UV) detector and Florescence Detector are used for PAHs analysis since it provides both high sensitivity and high specificity. National Reference Trace Organics Laboratory of Central Pollution Control Board has undertook a project for standardization of methodology for determination of PAHs by reversed-phase HPLC with Ultra-Violet (UV) Diode Array Detector during the year 2010-2011 and developed protocols for analysis of Polycyclic Aromatic Hydrocarbon using HPLC:
Figure 7.1 : High-Performance Liquid Chromatograph (HPLC)
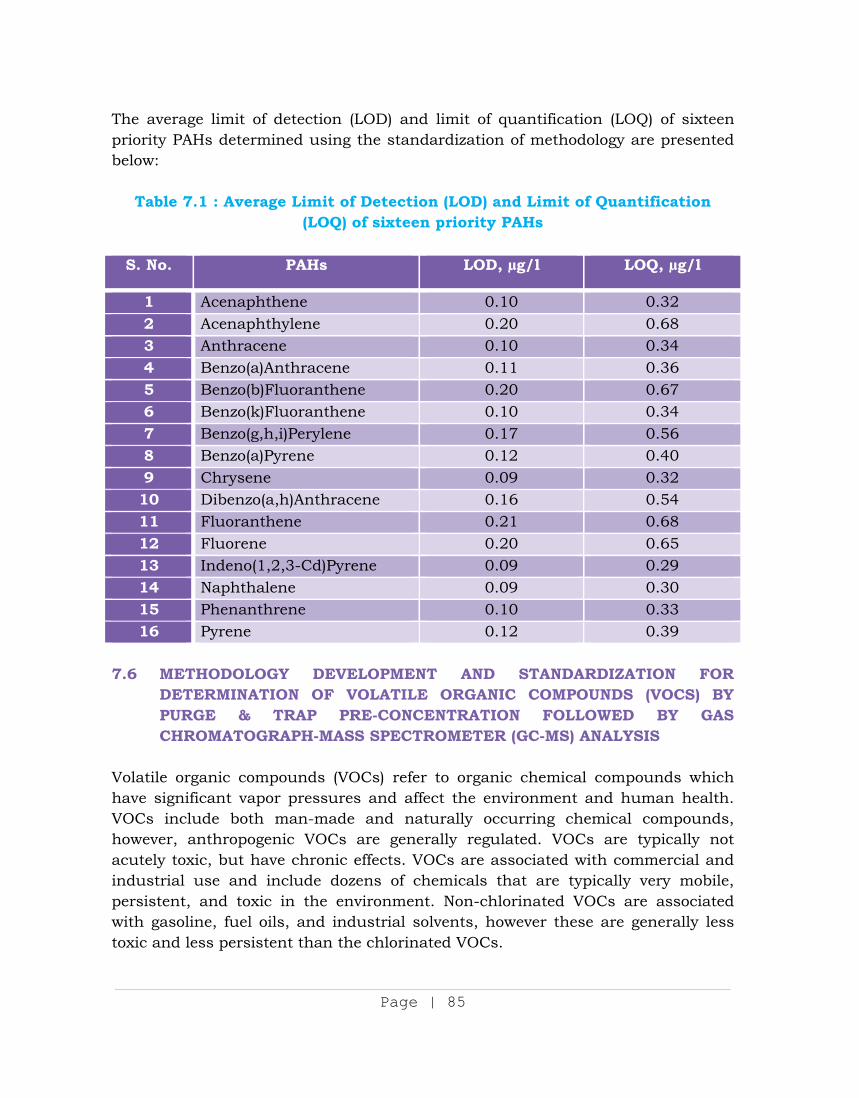
Page | 85
The average limit of detection (LOD) and limit of quantification (LOQ) of sixteen priority PAHs determined using the standardization of methodology are presented below:
Table 7.1 : Average Limit of Detection (LOD) and Limit of Quantification (LOQ) of sixteen priority PAHs
S. No. PAHs LOD, µg/l LOQ, µg/l
1 Acenaphthene 0.10 0.32 2 Acenaphthylene 0.20 0.68 3 Anthracene 0.10 0.34 4 Benzo(a)Anthracene 0.11 0.36 5 Benzo(b)Fluoranthene 0.20 0.67 6 Benzo(k)Fluoranthene 0.10 0.34 7 Benzo(g,h,i)Perylene 0.17 0.56 8 Benzo(a)Pyrene 0.12 0.40 9 Chrysene 0.09 0.32 10 Dibenzo(a,h)Anthracene 0.16 0.54 11 Fluoranthene 0.21 0.68 12 Fluorene 0.20 0.65 13 Indeno(1,2,3-Cd)Pyrene 0.09 0.29 14 Naphthalene 0.09 0.30 15 Phenanthrene 0.10 0.33 16 Pyrene 0.12 0.39
7.6 METHODOLOGY DEVELOPMENT AND STANDARDIZATION FOR
DETERMINATION OF VOLATILE ORGANIC COMPOUNDS (VOCS) BY PURGE & TRAP PRE-CONCENTRATION FOLLOWED BY GAS CHROMATOGRAPH-MASS SPECTROMETER (GC-MS) ANALYSIS
Volatile organic compounds (VOCs) refer to organic chemical compounds which have significant vapor pressures and affect the environment and human health. VOCs include both man-made and naturally occurring chemical compounds, however, anthropogenic VOCs are generally regulated. VOCs are typically not acutely toxic, but have chronic effects. VOCs are associated with commercial and industrial use and include dozens of chemicals that are typically very mobile, persistent, and toxic in the environment. Non-chlorinated VOCs are associated with gasoline, fuel oils, and industrial solvents, however these are generally less toxic and less persistent than the chlorinated VOCs.
Page | 86
Drinking water contaminants such as VOCs compromise the quality of water supply, which may cause short and long-term health effects in the consumer public. Central Board undertook a project during 2010-11for methodology development and standardization for determination of Volatile Organic Carbons adopting USEPA method 524.2 using Purge and Trap GC-MS. The results of analysis were compared with the WHO Guideline Value for Drinking Water Quality for the VOCs which were detected in the water sample and maximum contaminant level (MCL) set by USEPA for Drinking Water. All the results have been found well below the prescribed Guideline limits. 7.7 PROJECT “ASSESSMENT OF PERSISTENT ORGANIC POLLUTANTS
(POPSs) RESIDUES IN HUMAN POPULATION OF DELHI WITH SPECIAL REFERENCE TO ADVERSE HEALTH EFFECTS AND MORBIDITY” (COLLABORATIVE PROJECT WITH UCMS AND GTB HOSPITAL)
A study has been undertaken by Central Board in collaboration with University College of Medical Sciences (UCMS) as collaborative project during year 2008-09; 2009-2010; 2010-11 to generate epidemiological data and establishment of relative risk relationship between the incidence of adverse health outcomes including cancer due to exposure to pesticides with special reference to organo-chlorine Persistent Organic Pollutants residues and Poly-chlorinated Biphenyls. The following are the salient objectives of the project:
Determination of blood POPs levels such as organo-chlorine pesticides in
infants with special reference to pre-term and IUGR infants.
Determination of blood POPs levels such as organo-chlorine pesticides,
organochlorine residue levels in children and teenagers of various age
groups.
Determination of blood and tissue organo chlorine and Polychlorinated
biphenyls (PCBs) residue levels in adult and senior citizen populations with
special reference to breast cancer tissue and prostate cancer patients.
During the reporting year 2010-11, about 229 blood samples from different age group such as infants children, teenagers, adult, and senior citizens were collected, processed extracted and cleaned up at University College of Medical Sciences & GTB Hospital laboratories and the concentrated samples were analyzed. The analysis results indicate presence of Organo-chlorine pesticides,
Page | 87
Total BHC, Endosulfan and Total DDT in the adults of age group 40-60 years and senior citizens of age more than 60 years. There has been increasing pattern in pesticide levels in various age groups from infants to senior citizens. The pesticide Heptachlor was recorded in only one blood sample of adult in the 20-40 age group. The blood samples drawn from infants, children and teenagers were comparatively free from pesticides residue. Further studies with more number of blood samples from respective population groups are being continued. 7.8 MERCURY RECOVERY FROM SPENT MEDIA OF SO2
To minimize the impact of disposal of Mercury containing laboratory waste, the CPCB Project Office Agra is adhering to an environmental friendly exercise which involves recovery of Mercury from SO2 spent media and analysis waste. The prerequisite for ambient SO2 monitoring is the 30 ml absorbing media for each sample. 24 hour monitoring comprises of six samples monitored for 4 hour each beside a blank that is use of 210 ml of SO2 absorbing media per day. Subsequent to the monitoring, 10 ml of the sample is required for analysis. The left over SO2
absorbing media (after repeat analysis, if required) is used to recover Mercury. In this process, the unused SO2 absorbing media and analytical waste are collected in closed container. For the recovery of mercury, approximately 4 g of Aluminium foil pieces were added per liter of unused SO2 absorbing media (exposed potassium tetrachloromercurate solution) and left overnight for the displacement reaction to occur. The Mercury separates out at the bottom of the glass vessel which after decantation is collected in separate closed mouth bottle. Since June 2010 about 300 gm Mercury has been recovered from spent media/analysis waste.
* * *
Page | 88
CHAPTER VIII
ENVIRONMENTAL TRAINING
8.1 ENVIRONMENTAL TRAINING UNIT (ETU)
Environmental Training Unit (ETU) of CPCB organized 19 planned training
programmes during 2010-11 in various priority areas related to environment using the expertise available in various training/R&D institutes. Main target groups for CPCB sponsored training programmes were officials of CPCB, SPCBs/PCCs, Laboratories recognized under EPA, Industries, Hospitals, Universities, NGO’s, etc. (Annexure-VI-A).
CPCB officials were also nominated for various miscellaneous training programmes organized by other organizations (Annexure-VI-B).
ETU also facilitated participation of officials in various international training programmes/workshop/ seminars etc. during 2010-11 sponsored by other organizations (Annexure-VI-C).
Eight training programmes (1 & 2 days) on interpersonal skills and
administrative & financial aspects were also organized during the year 2010-11 exclusively for CPCB officials (Annexure-VI-D).
8.2 TRAINING-CUM-WORKSHOP ON “RIVER ACTION PLAN & STATISTICAL INTERPRETATION”
A three-day training programme-cum-workshop on “River Action Plan & Statistical Interpretation” was organized at Vadodara during 23rd–25th February 2011, The target group of the training comprised officials of hydrology, irrigation, groundwater, pollution control boards and other concerned agencies/departments of various state agencies. The programme was part of activities taken-up by Central Board under World Bank funded Hydrology Project – II. The programme was designed to cover the technical presentation on relevant topics with case studies. Field visit with discussions on subject were also part of the three-days programme to make it interesting and practical oriented. The programme was inaugurated by Prof. Nikhil Desai, Dean Faculty of Science of Maharaja Sayajirao University of Baroda.
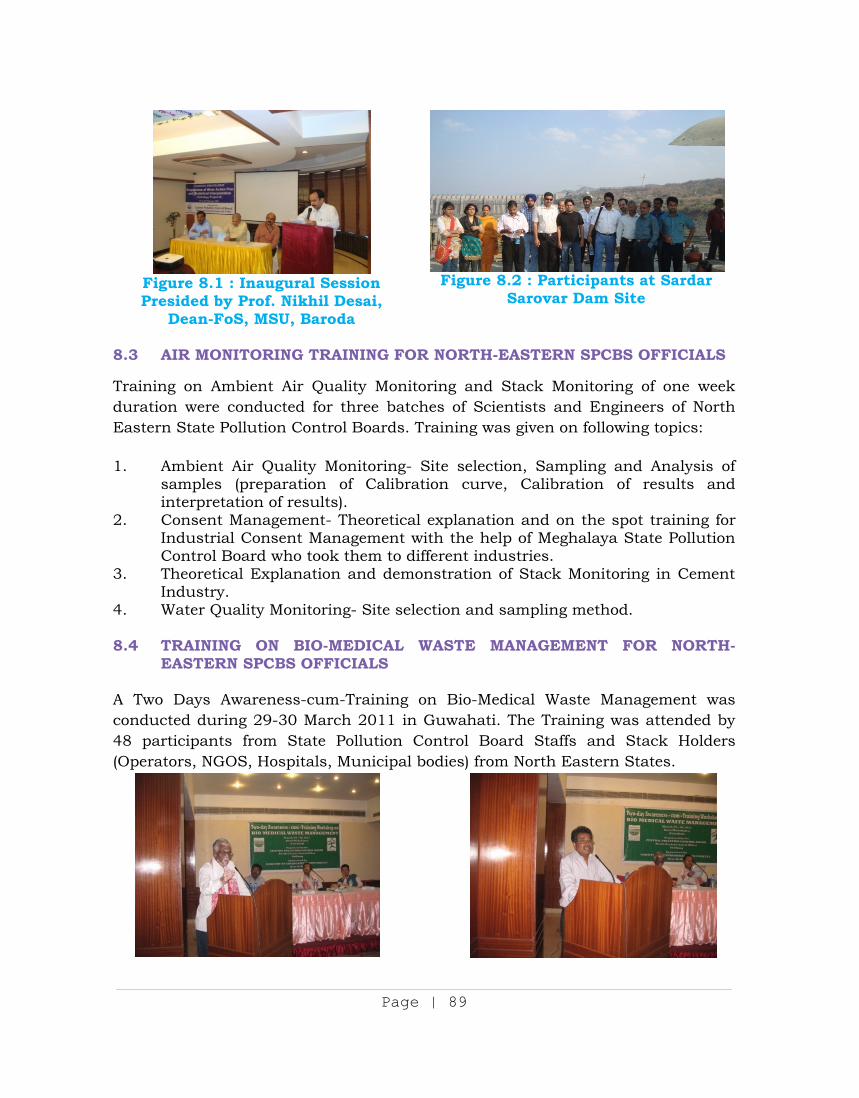
Page | 89
Figure 8.1 : Inaugural Session Presided by Prof. Nikhil Desai,
Dean-FoS, MSU, Baroda
Figure 8.2 : Participants at Sardar Sarovar Dam Site
8.3 AIR MONITORING TRAINING FOR NORTH-EASTERN SPCBS OFFICIALS
Training on Ambient Air Quality Monitoring and Stack Monitoring of one week duration were conducted for three batches of Scientists and Engineers of North Eastern State Pollution Control Boards. Training was given on following topics: 1. Ambient Air Quality Monitoring- Site selection, Sampling and Analysis of
samples (preparation of Calibration curve, Calibration of results and interpretation of results).
2. Consent Management- Theoretical explanation and on the spot training for Industrial Consent Management with the help of Meghalaya State Pollution Control Board who took them to different industries.
3. Theoretical Explanation and demonstration of Stack Monitoring in Cement Industry.
4. Water Quality Monitoring- Site selection and sampling method. 8.4 TRAINING ON BIO-MEDICAL WASTE MANAGEMENT FOR NORTH-
EASTERN SPCBS OFFICIALS A Two Days Awareness-cum-Training on Bio-Medical Waste Management was conducted during 29-30 March 2011 in Guwahati. The Training was attended by 48 participants from State Pollution Control Board Staffs and Stack Holders (Operators, NGOS, Hospitals, Municipal bodies) from North Eastern States.
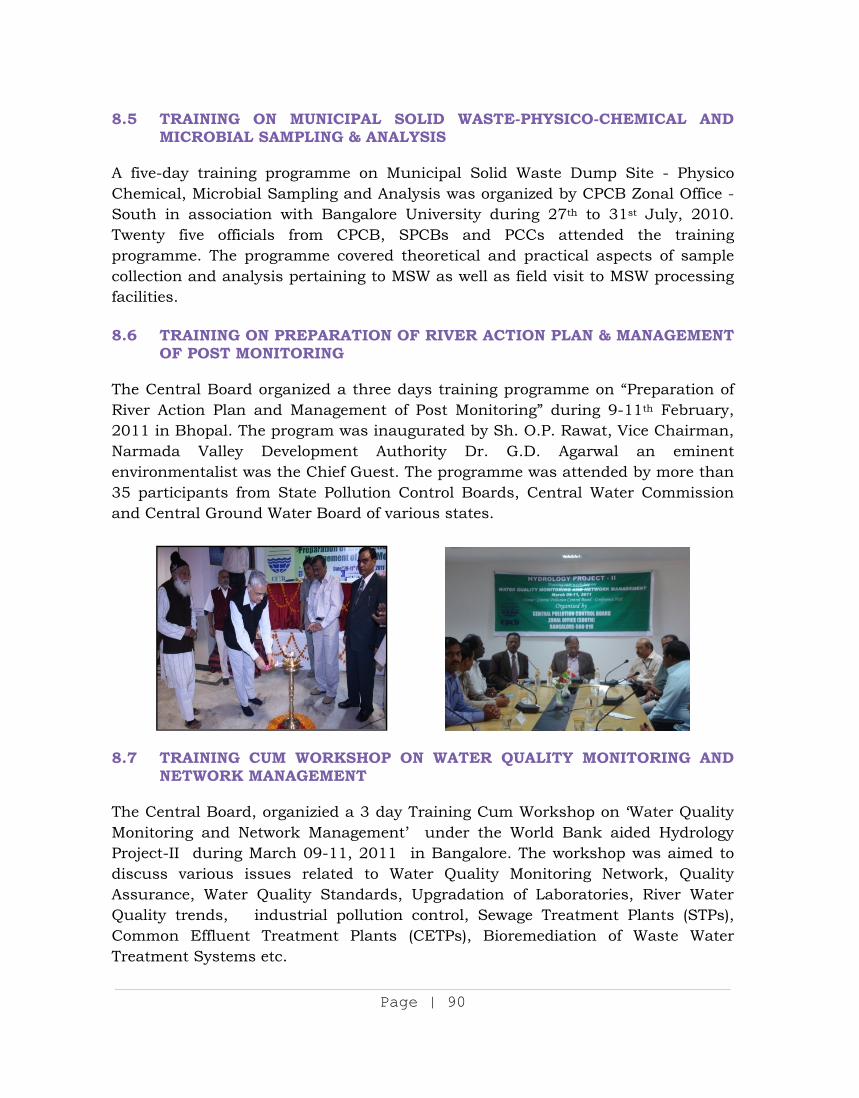
Page | 90
8.5 TRAINING ON MUNICIPAL SOLID WASTE-PHYSICO-CHEMICAL AND MICROBIAL SAMPLING & ANALYSIS
A five-day training programme on Municipal Solid Waste Dump Site - Physico Chemical, Microbial Sampling and Analysis was organized by CPCB Zonal Office -South in association with Bangalore University during 27th to 31st July, 2010. Twenty five officials from CPCB, SPCBs and PCCs attended the training programme. The programme covered theoretical and practical aspects of sample collection and analysis pertaining to MSW as well as field visit to MSW processing facilities. 8.6 TRAINING ON PREPARATION OF RIVER ACTION PLAN & MANAGEMENT
OF POST MONITORING The Central Board organized a three days training programme on “Preparation of River Action Plan and Management of Post Monitoring” during 9-11th February, 2011 in Bhopal. The program was inaugurated by Sh. O.P. Rawat, Vice Chairman, Narmada Valley Development Authority Dr. G.D. Agarwal an eminent environmentalist was the Chief Guest. The programme was attended by more than 35 participants from State Pollution Control Boards, Central Water Commission and Central Ground Water Board of various states.
8.7 TRAINING CUM WORKSHOP ON WATER QUALITY MONITORING AND
NETWORK MANAGEMENT The Central Board, organizied a 3 day Training Cum Workshop on ‘Water Quality Monitoring and Network Management’ under the World Bank aided Hydrology Project-II during March 09-11, 2011 in Bangalore. The workshop was aimed to discuss various issues related to Water Quality Monitoring Network, Quality Assurance, Water Quality Standards, Upgradation of Laboratories, River Water Quality trends, industrial pollution control, Sewage Treatment Plants (STPs), Common Effluent Treatment Plants (CETPs), Bioremediation of Waste Water Treatment Systems etc.
Page | 91
The workshop was attended by experts from Government organizations and Pollution Control Boards. Shri A.S. Sadashivaiah, Chairman, Karnataka State Pollution Control Board inaugurated the workshop. In his inaugural address Shri Sadashivaiah stressed the importance of proper water conservation management in view of increasing urbanization, industrialization & population and also stressed the need for rationalization of water quality monitoring networks and establishing good data base and Hydrological Information System. 8.8 TRAINING PROGRAMME ON MUNICIPAL SOLID WASTE DUMP SITE A five day training programme on Municipal Solid Waste Dump Site: Physico- Chemical, Microbial Sampling and Analysis, was sponsored by Central Pollution Control Board to Bangalore University, Bangalore. The training programme was conducted from 27th July to 31st July, 2010. The twenty five participant officials from Central Pollution Control Board, State Pollution Control Boards and Pollution Control Committees attended the training programme. The programme covered theoretical and practical aspects of Municipal Solid Waste Sample collection and analysis as well as field visit to Municipal Solid Waste processing facilities.
* * *
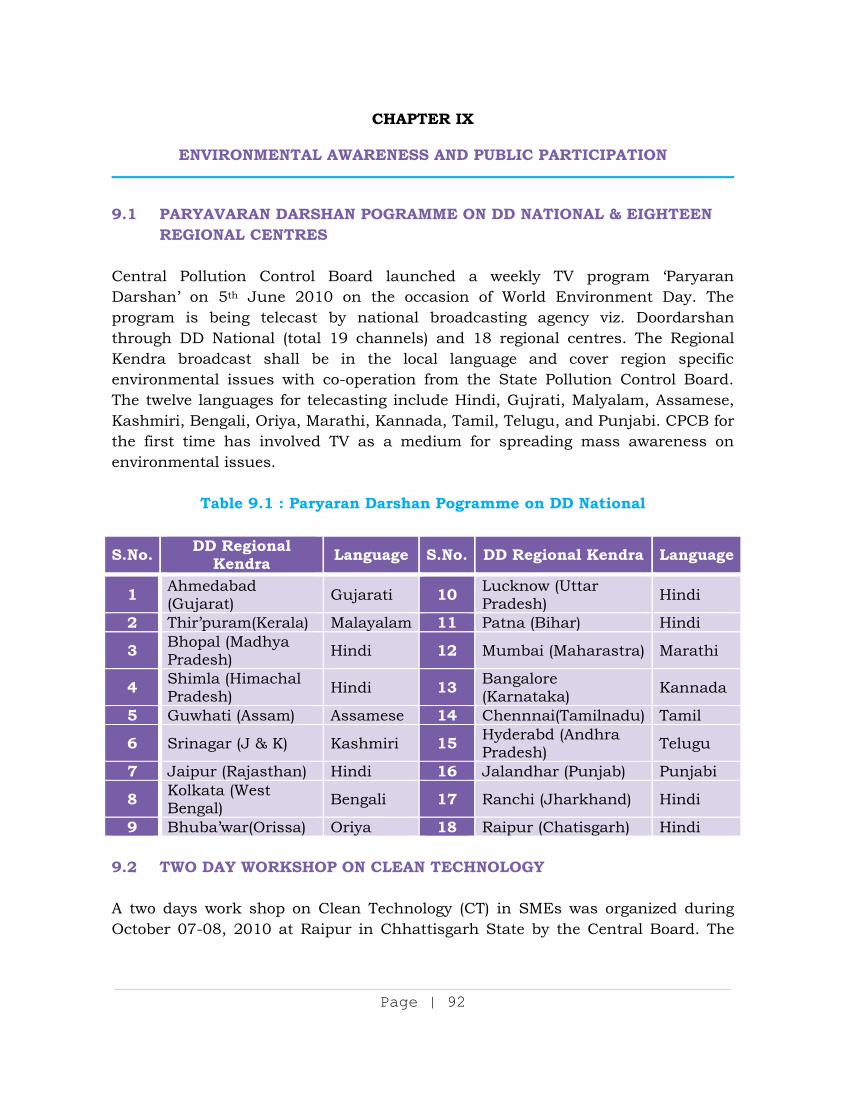
Page | 92
CHAPTER IX
ENVIRONMENTAL AWARENESS AND PUBLIC PARTICIPATION
9.1 PARYAVARAN DARSHAN POGRAMME ON DD NATIONAL & EIGHTEEN REGIONAL CENTRES Central Pollution Control Board launched a weekly TV program ‘Paryaran Darshan’ on 5th June 2010 on the occasion of World Environment Day. The program is being telecast by national broadcasting agency viz. Doordarshan through DD National (total 19 channels) and 18 regional centres. The Regional Kendra broadcast shall be in the local language and cover region specific environmental issues with co-operation from the State Pollution Control Board. The twelve languages for telecasting include Hindi, Gujrati, Malyalam, Assamese, Kashmiri, Bengali, Oriya, Marathi, Kannada, Tamil, Telugu, and Punjabi. CPCB for the first time has involved TV as a medium for spreading mass awareness on environmental issues.
Table 9.1 : Paryaran Darshan Pogramme on DD National
S.No. DD Regional Kendra Language S.No. DD Regional Kendra Language
1 Ahmedabad (Gujarat) Gujarati 10 Lucknow (Uttar
Pradesh) Hindi
2 Thir’puram(Kerala) Malayalam 11 Patna (Bihar) Hindi
3 Bhopal (Madhya Pradesh) Hindi 12 Mumbai (Maharastra) Marathi
4 Shimla (Himachal Pradesh) Hindi 13 Bangalore
(Karnataka) Kannada
5 Guwhati (Assam) Assamese 14 Chennnai(Tamilnadu) Tamil
6 Srinagar (J & K) Kashmiri 15 Hyderabd (Andhra Pradesh) Telugu
7 Jaipur (Rajasthan) Hindi 16 Jalandhar (Punjab) Punjabi
8 Kolkata (West Bengal) Bengali 17 Ranchi (Jharkhand) Hindi
9 Bhuba’war(Orissa) Oriya 18 Raipur (Chatisgarh) Hindi 9.2 TWO DAY WORKSHOP ON CLEAN TECHNOLOGY A two days work shop on Clean Technology (CT) in SMEs was organized during October 07-08, 2010 at Raipur in Chhattisgarh State by the Central Board. The
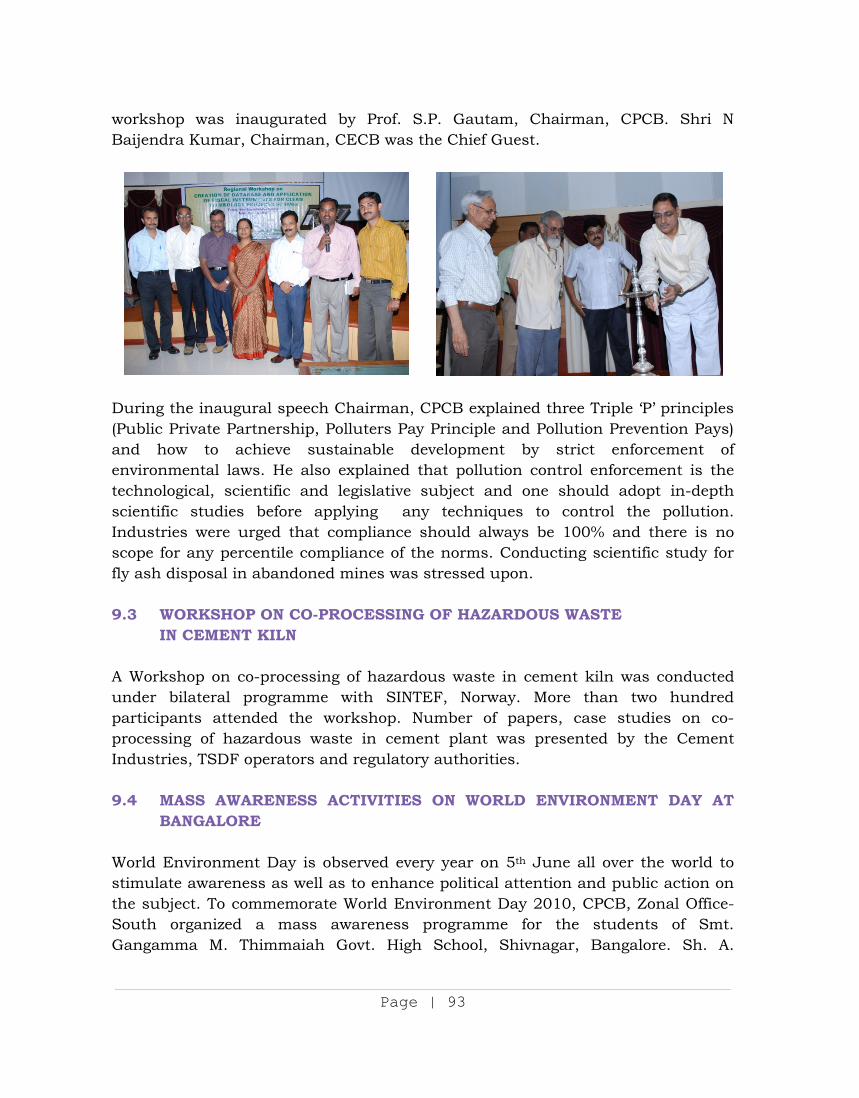
Page | 93
workshop was inaugurated by Prof. S.P. Gautam, Chairman, CPCB. Shri N Baijendra Kumar, Chairman, CECB was the Chief Guest.
During the inaugural speech Chairman, CPCB explained three Triple ‘P’ principles (Public Private Partnership, Polluters Pay Principle and Pollution Prevention Pays) and how to achieve sustainable development by strict enforcement of environmental laws. He also explained that pollution control enforcement is the technological, scientific and legislative subject and one should adopt in-depth scientific studies before applying any techniques to control the pollution. Industries were urged that compliance should always be 100% and there is no scope for any percentile compliance of the norms. Conducting scientific study for fly ash disposal in abandoned mines was stressed upon. 9.3 WORKSHOP ON CO-PROCESSING OF HAZARDOUS WASTE IN CEMENT KILN A Workshop on co-processing of hazardous waste in cement kiln was conducted under bilateral programme with SINTEF, Norway. More than two hundred participants attended the workshop. Number of papers, case studies on co-processing of hazardous waste in cement plant was presented by the Cement Industries, TSDF operators and regulatory authorities. 9.4 MASS AWARENESS ACTIVITIES ON WORLD ENVIRONMENT DAY AT BANGALORE World Environment Day is observed every year on 5th June all over the world to stimulate awareness as well as to enhance political attention and public action on the subject. To commemorate World Environment Day 2010, CPCB, Zonal Office-South organized a mass awareness programme for the students of Smt. Gangamma M. Thimmaiah Govt. High School, Shivnagar, Bangalore. Sh. A.
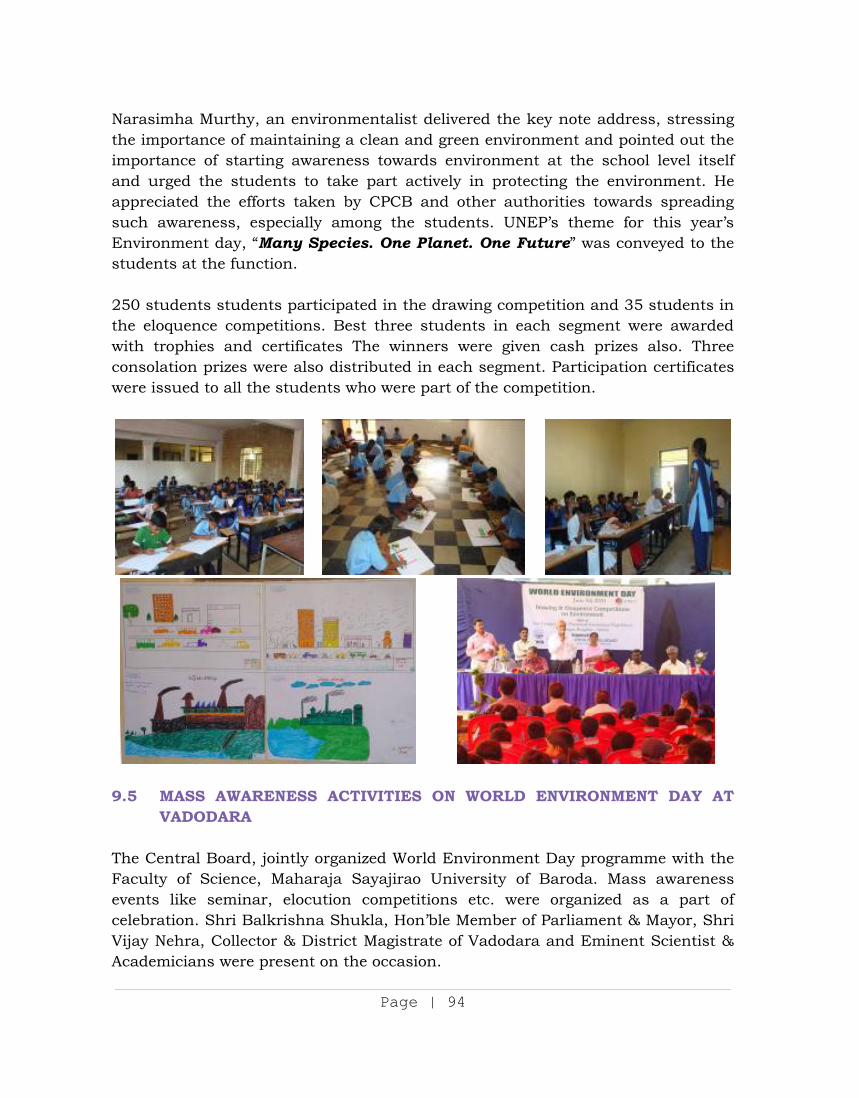
Page | 94
Narasimha Murthy, an environmentalist delivered the key note address, stressing the importance of maintaining a clean and green environment and pointed out the importance of starting awareness towards environment at the school level itself and urged the students to take part actively in protecting the environment. He appreciated the efforts taken by CPCB and other authorities towards spreading such awareness, especially among the students. UNEP’s theme for this year’s Environment day, “Many Species. One Planet. One Future” was conveyed to the students at the function. 250 students students participated in the drawing competition and 35 students in the eloquence competitions. Best three students in each segment were awarded with trophies and certificates The winners were given cash prizes also. Three consolation prizes were also distributed in each segment. Participation certificates were issued to all the students who were part of the competition.
9.5 MASS AWARENESS ACTIVITIES ON WORLD ENVIRONMENT DAY AT VADODARA The Central Board, jointly organized World Environment Day programme with the Faculty of Science, Maharaja Sayajirao University of Baroda. Mass awareness events like seminar, elocution competitions etc. were organized as a part of celebration. Shri Balkrishna Shukla, Hon’ble Member of Parliament & Mayor, Shri Vijay Nehra, Collector & District Magistrate of Vadodara and Eminent Scientist & Academicians were present on the occasion.
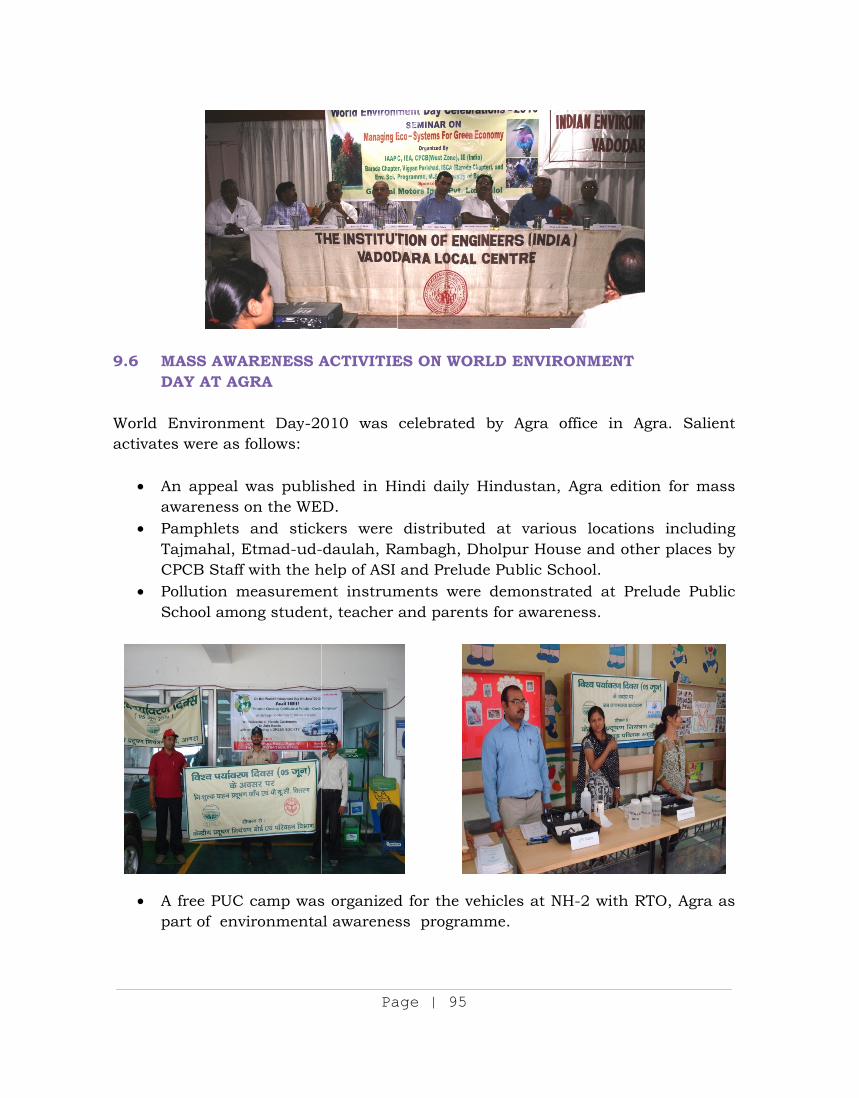
9.6 M D World Eactivate
Aa
PTC
PS
Ap
MASS AWADAY AT AG
Environmees were as
An appeal awareness oPamphlets Tajmahal, ECPCB Staff Pollution mSchool amo
A free PUC part of env
ARENESS AGRA
ent Day-20follows:
was publison the WEand stick
Etmad-ud-with the h
measuremeong studen
camp wasvironmenta
Pa
ACTIVITIE
010 was
shed in HED. kers were -daulah, Rahelp of ASI ent instrumnt, teacher
s organizedal awarenes
age | 95
ES ON WO
celebrated
indi daily
distributeambagh, Dand Prelu
ments werand paren
d for the vss program
RLD ENVI
d by Agra
Hindustan
ed at variDholpur Hode Public Se demonst
nts for awar
ehicles at mme.
IRONMENT
office in
n, Agra ed
ious locatiouse and oSchool. trated at Preness.
NH-2 with
T
Agra. Sa
dition for m
ions incluother place
Prelude Pu
h RTO, Agr
alient
mass
uding es by
ublic
ra as
9.7 M During festival,out by Office Band Pubpollutioschools MessageOfficer. lamp inBhopal 9.8 A An NGOenlistingwith CPBoards/facilitiesorder tomass aDuring concurrduring t A rebatenlistedFinanci
MASS AWA
14th to 22, mass aw
Central PBhopal in blic schooln monito.
e on ‘SafA oath wa
nstead of fand broad
ACTIVITIE
O Cell wasg environm
PCB, establ/Zonal Offs like wateo enhance awareness
2010-11,rence of cothe previou
e @ 50% id with CPCal Assistan
ARENESS O
2nd Octoberwareness cPollution Governm
ls. The demoring were
fe Diwali’ as also mafire crackerdcasted on
S OF NGO
s set up imental NGlishing NGfices, prover testing their capaprogramm
32 NGOncerned Cus years.
is extendedCB and snce of Rs.
Pa
ON DIWAL
r, 2010 prcampaign Control B
ment, Semimonstratioe conduc
was giveade by Zonrs. The whthe eve of
O CELL
in CPCB inGOs involvGO networkvide traininkits, anal
abilities in mes and pOs additioPCB Zonal
d for the pseveral NG
5000/- ea
age | 96
LI AT BHO
rior to Diwwas carri
Board, Zoni-governmeons on diwted in fi
en by Zonal Officer thole awareDiwali.
n the yearved in actik in consulng to the lytical instthe field opollution
onal were l Offices in
purchase oGOs availedach was pr
OPAL
wali ied nal ent
wali ive
nal to avoid noeness activ
r 1992 to ivities relaltation withNGOs an
truments, of pollutioncontrol acenlisted
n addition t
of CPCB pd this facrovided to
oisy crackevity was co
coordinatated to poh State Po
nd equippibooks, lite
n control, activities thwith CPC
to the 707
publicationcility durin11 NGO’s
ers and to overed by
e the taskllution conllution Coning them erature etcand organihrough NGCB subjecNGOs enli
s to the Nng 2010-2
for organi
lit a DD-
ks of ntrol ntrol with c. in izing GOs. ct to isted
NGOs 011. izing
Page | 97
Mass Awareness Programme on abatement of pollution during the year 2010 - 2011. Regional NGO Meet was organised at CPCB ZO–Kolkakta on 04.03.2011 with NGOs located in different States to coordinate their activities and promote their public participation/awareness in the pollution control programmes in the country. Interaction was made with NGOs of West Bengal, Bihar, Jharkhand and Orissa through coordination meetings with the following objectives:
To take a uniform and concerted approach towards pollution control; To have public participation for abatement of pollution through community
action; To identify the major localised environmental problems; and To identify the areas of mutual co-operation among NGOs themselves as well
between NGOs and Pollution Control Boards.
The response of the NGOs was overwhelming and over 50 participants attended the above programmes. 9.9 IMPLEMENTATION OF OFFICIAL LANGUAGE POLICY IN CPCB CPCB is implementing Official Language Policy of Govt. of India in its Head Office and Zonal Offices. Hindi Section is setup in the Head Office to assist the Chairman and Member Secretary in ensuring proper compliance of Official Language Policy of the Union as enshrined in the Constitution of India, envisaged in the Official Languages Act, Official Languages (Use for Official Purposes of the Union) Rules, and orders of the Govt. of India issued from time to time in this regard.
During the year 2010-2011 Hindi Division organized three Hindi workshops. These workshops proved to be very effective for sensitizing the officials of CPCB with regard to the Official Language Policy. Hindi Diwas was celebrated on 14th September, 2010 in CPCB Headquarter. The employees of CPCB actively participated in the competitions organized and made it a success. Cash prizes
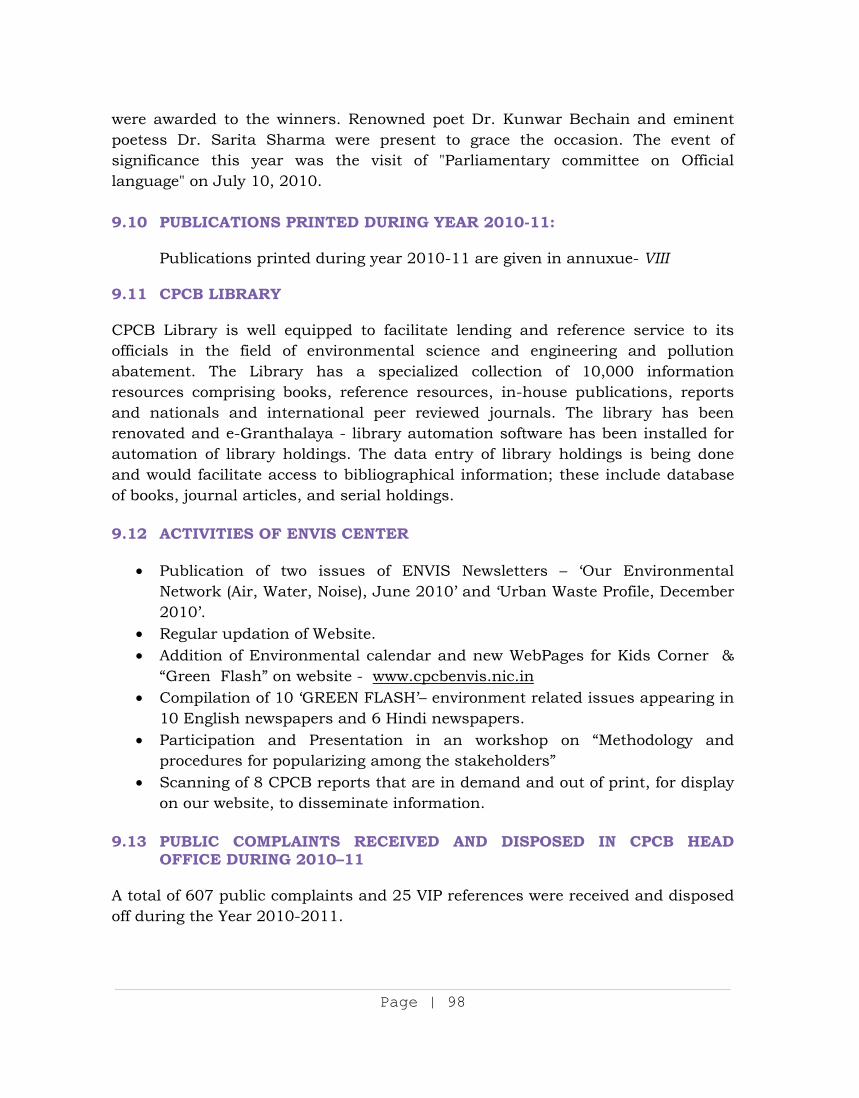
Page | 98
were awarded to the winners. Renowned poet Dr. Kunwar Bechain and eminent poetess Dr. Sarita Sharma were present to grace the occasion. The event of significance this year was the visit of "Parliamentary committee on Official language" on July 10, 2010. 9.10 PUBLICATIONS PRINTED DURING YEAR 2010-11:
Publications printed during year 2010-11 are given in annuxue- VIII
9.11 CPCB LIBRARY CPCB Library is well equipped to facilitate lending and reference service to its officials in the field of environmental science and engineering and pollution abatement. The Library has a specialized collection of 10,000 information resources comprising books, reference resources, in-house publications, reports and nationals and international peer reviewed journals. The library has been renovated and e-Granthalaya - library automation software has been installed for automation of library holdings. The data entry of library holdings is being done and would facilitate access to bibliographical information; these include database of books, journal articles, and serial holdings. 9.12 ACTIVITIES OF ENVIS CENTER
Publication of two issues of ENVIS Newsletters – ‘Our Environmental
Network (Air, Water, Noise), June 2010’ and ‘Urban Waste Profile, December 2010’.
Regular updation of Website. Addition of Environmental calendar and new WebPages for Kids Corner &
“Green Flash” on website - www.cpcbenvis.nic.in Compilation of 10 ‘GREEN FLASH’– environment related issues appearing in
10 English newspapers and 6 Hindi newspapers. Participation and Presentation in an workshop on “Methodology and
procedures for popularizing among the stakeholders” Scanning of 8 CPCB reports that are in demand and out of print, for display
on our website, to disseminate information.
9.13 PUBLIC COMPLAINTS RECEIVED AND DISPOSED IN CPCB HEAD OFFICE DURING 2010–11
A total of 607 public complaints and 25 VIP references were received and disposed off during the Year 2010-2011.
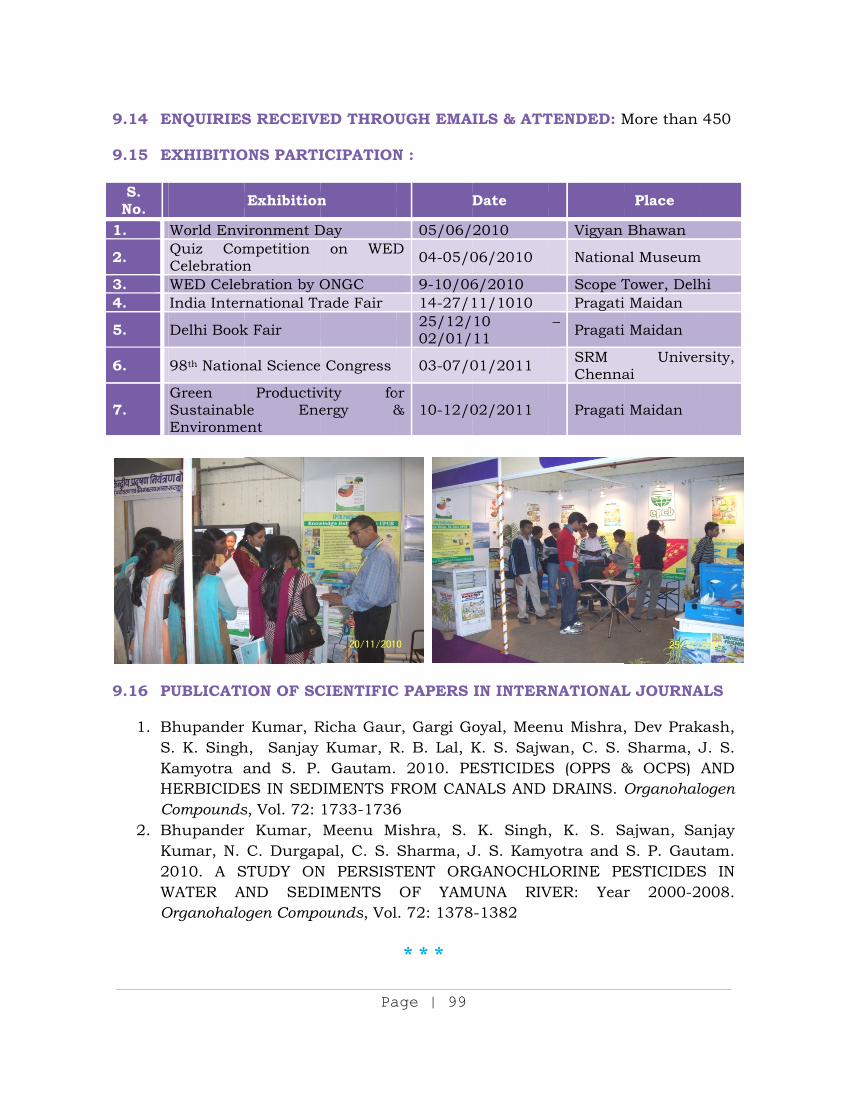
9.14 E 9.15 E
S. No.
1.
2.
3. 4.
5.
6.
7.
9.16 P
1. BSKHC
2. BK2WO
ENQUIRIES
EXHIBITIO
World EnviQuiz ComCelebrationWED CelebIndia Inter
Delhi Book
98th Nation
Green SustainablEnvironme
PUBLICATI
Bhupander S. K. SinghKamyotra aHERBICIDECompoundsBhupander Kumar, N. 010. A S
WATER AOrganohalo
S RECEIVE
ONS PARTI
Exhibition
ironment Dmpetition n bration by Ornational Tr
k Fair
nal Science
Productivle Eneent
ION OF SC
Kumar, Rh, Sanjay and S. P.ES IN SEDs, Vol. 72:
Kumar, C. Durgap
STUDY ONAND SEDIogen Compo
Pa
ED THROU
ICIPATION
n
Day on WED
ONGC rade Fair
Congress
vity foergy &
CIENTIFIC
Richa GaurKumar, R
Gautam. DIMENTS F1733-1736Meenu M
pal, C. S. N PERSISTIMENTS ounds, Vol
age | 99
UGH EMAI
N :
D
05/06/D 04-05/0
9-10/0614-27/125/12/02/01/
03-07/0
or & 10-12/0
C PAPERS
r, Gargi GoR. B. Lal, K
2010. PEFROM CAN6
Mishra, S. Sharma, JTENT ORGOF YAM. 72: 1378
* * *
ILS & ATT
Date
2010
06/2010
6/2010 11/1010 10 11
01/2011
02/2011
IN INTERN
oyal, MeenK. S. SajwESTICIDESNALS AND
K. Singh,J. S. KamyGANOCHLUNA RIV-1382
TENDED: M
Vigyan
Nationa
Scope TPragati
– Pragati
SRM Chenna
Pragati
NATIONAL
nu Mishra,wan, C. S. S (OPPS &DRAINS.
, K. S. Syotra and LORINE PEVER: Year
More than
Place
Bhawan
al Museum
Tower, DelhMaidan
Maidan
Univerai
Maidan
L JOURNA
, Dev PrakSharma, J
& OCPS) AOrganohal
Sajwan, SaS. P. GauESTICIDESr 2000-2
450
hi
rsity,
ALS
kash, J. S. AND ogen
anjay tam. S IN 008.
Page | 100
CHAPTER X
ENVIRONMENTAL STANDARDS INCLUDING SCHEDULE FOR THEIR ENFORCEMENT
10.1 DEVELOPMENT OF ENVIRONMENTAL STANDARDS
10.1.1 Effluent Standards for Soda Ash Industry
Soda Ash, an important part of Indian inorganic chemical industry is a high volume, low value product and finds application in the production of detergents, glass, chemicals, sodium silicate, pulp & paper and water treatment. The process of brine purification produces effluent as spent brine solution containing clay, silt, sand, calcium and magnesium carbonate, magnesium sulfate and high contents of sodium & calcium chloride. The effluent is generally diluted with seawater to reduce suspended solids (SS) concentration and discharged to sea. The effluent from soda ash industry being heavier than seawater, the best option is to release it through surface outfall at a location where sufficient dilution is expected .The final effluent may have adverse effects on flora and fauna particularly around the disposal site. The studies were conducted at four locations viz. Mithapur, Porbandar, Sutrapada and Bhavnagar where various soda ash manufacturing units viz. Tata Chemicals Ltd, Saurashtra Chemicals Ltd, Gujarat Heavy Chemical Ltd and Nirma Ltd, respectively release their effluents. The study was undertaken in association with National Institute of Oceanography (NIO), Goa .The revised effluent standard was finalized and approved by Peer and Core Expert committee and in the Board meeting. It was presented in sixth meeting of Reconstituted Expert committee of MoEF on January 13, 2011 and under notification.
10.1.2 Review of Emission Standards and Preparation of Comprehensive
Industry Document (COINDS) on Manmade Fibre Industry
Revision of emission standards for carbon disulphide (CS2) and hydrogen sulphide (H2S) is requested by Association of Manmade Fibre Industry for new and expansion projects due to non-availability of cost effective technologies to meet the existing emission norms for CS2 and H2S. The proposal addresses the revision and up-gradation of existing Comprehensive Industry Document (COINDS), prepared during year 1979-80 for liquid effluents generated from Manmade Fibre Industry. The objectives of study include review of existing effluent standards for Rayon and Nylon Industry. The study was initiated in association with NEERI Nagpur. The dry study has been completed, while in-depth study is in progress.
Page | 101
10.1.3 HARMONIZATION OF ENVIRONMENTAL STANDARDS FOR PESTICIDE INDUSTRY
Effluent and Emission standards for pesticide industry were notified at S. No. 40 and effluent standards alone at Sl. No. 71 respectively under Schedule I of the Environment (Protection) Rules, 1986. The Emission and Effluent standards for incinerator for pesticide industry were notified at S. No. 101.
In order to avoid this confusion regarding application of standards, it was proposed to harmonize the standards and to bring all norms under a single serial number. Accordingly, the standards notified at Sl. No 40, 71 & 101 were reviewed during sixth meeting held on 13th January 2011 of Reconstituted Expert Committee. The Environmental Standards and their notifications at three serial numbers (40, 71 & 101) of The Environment (protection) Rules 1986 have been harmonized and recommended to bring under Sl. No. 40. 10.1.4 Environmental Standards for Iron Ore Mining & Ore Processing The most prominent iron ores found in India include Haematite and Magnetite ore. India possesses Haematite iron ore resources of 14,630 million tonnes and magnetite ore of 10,619 million tones. The major ore deposits are located in the States of Jharkhand, Orissa, Chattisgarh, Karnataka and Goa. The significant environmental concerns due to iron ore mining and processing include particulate matter emissions during blasting, mining, excavation operations, and overburden dumps. In addition wastewater is generated from run-off and crushing activities. In order to regulate the pollution due to iron ore mining and processing, MoEF notified emission and effluent standards for the sector, vide G.S.R. 809 (E), dated 04.10.10. 10.1.5 Harmonization of Emission Standards for Copper, Lead and Zinc
Smelterts at par with Sulfuric Acid Plant The emission standards in Sulphuric Acid plant have been revisited and revised standards have been notified in May, 2008. Accordingly, the emission standards for copper, lead and Zinc Smelters have been harmonised with the emission standards for Sulphanic Acid Plant and recomended for notification. 10.1.6 Environmental Standards for Rubber Processing and Rubber Products
Industry
The studies for development of Environmental Standards for Rubber Industry have been undertaken by Central Pollution Control Board. Based on the study the environmental standards for Rubber Products Industry were finalized and notified
Page | 102
under the Environment (Protection) Rules, 1986 along with harmonised standards for remaining processes of rubber Sector in March, 2011. 10.1.7 Development of Environmental Standards and Guidelines for Glue &
Gelatin Industry
The study for Development of Environmental Standards and Guidelines for Glue & Gelatin Industries has been completed and final report submitted. Based on the findings in the report, the finalization of environmental standards for Glue & Gelatin Industry is being undertaken.
10.1.8 Environmental Standards and Good Practice for Automobile Service
Stations, Bus Depots and Workshops
The study for Development of Environmental Standards and Good Practice for Automobile Service Stations, Bus Depots and Workshops has been completed and final report submitted Based on the report the environmental standards are under finalization
10.1.9 Development of Environmental Standards & guidelines for Plywood
Industries
CPCB has undertaken the study for Development of Environmental Standards & guidelines for Plywood Industries. Monitoring in all Zones of the country has been completed and interim report prepared
10.1.10 Revision of Emission norms for Diesel Engine Genset and Genset
driven by Petrol and Kerosene
The 12th meeting of the “Standing Committee on Emission from RIC engine for off-road applications” has been held on September 06, 2010 for revision of emission norms for diesel kerosene & Petrol operated gensets. The various stakeholders and representative of Petrol and kerosene driven genset manufacturing industries have also attended the meeting.
On acceptance of the proposal, the committee finalized the issue of revision of emission norms for Diesel genset engines and genset driven by Petrol and kerosene. Draft notification to be uploaded on CPCB website, inviting further comments/suggestion.
Page | 103
10.1.11 Environmental Standards and Cleaner Technology for Sintering Plant of Steel Industry
The project has been initiated with objective to assess cleaner technologies for sintering plant of Steel Plants for better environment management improving production and energy efficiency. The project also aims at developing of new PM emissions standards for sintering plants to replace old standards of 150 mg/Nm3. The study will help in revision of standards and formulating guidelines for pollution prevention & control from sintering plants. 10.1.12 Preparation of Comprehensive Industry Document and the Status of
Paint Industry (Review of Effluent Standards and Development of Emission Standards)
Central Pollution Control Board awarded the study to National Productivity Council, New Delhi to revise the comprehensive document on paint industry including air pollution control technologies, to review effluent standards, to develop techno-economically achievable emission standards and to prepare status of paint industry
11 paint industries have been visited to collect primary information. Based on the preliminary data six paint industries were finalized to carry out in-depth studies, covering all type of paints manufactured in India and of different size and location. During the detailed study effluent, emission and solid waste samples were collected analyzed by M/s Vimta Labs and M/s SGS India for three units each. Interim Report has been submitted by National Productivity Council. The study is expected to complete by April, 2012. 10.1.13 Revision of Comprehensive Industry Document on Tanneries
CPCB has undertaken the study for Revision of Comprehensive Industry Document on Tanneries in association with Central Leather Research Institute (CLRI), Chennai. The study has been completed and final report submitted during 2010-11 and based on the report the revision of environmental standards for tanneries is being undertaken. 10.1.14 Comprehensive Industry Document (COINDS) for Aluminium, Copper,
Zinc (Non Ferrous Sector) Industries
I) Revision of COINDS for Aluminium Industry – Collection of dry data and partial monitoring
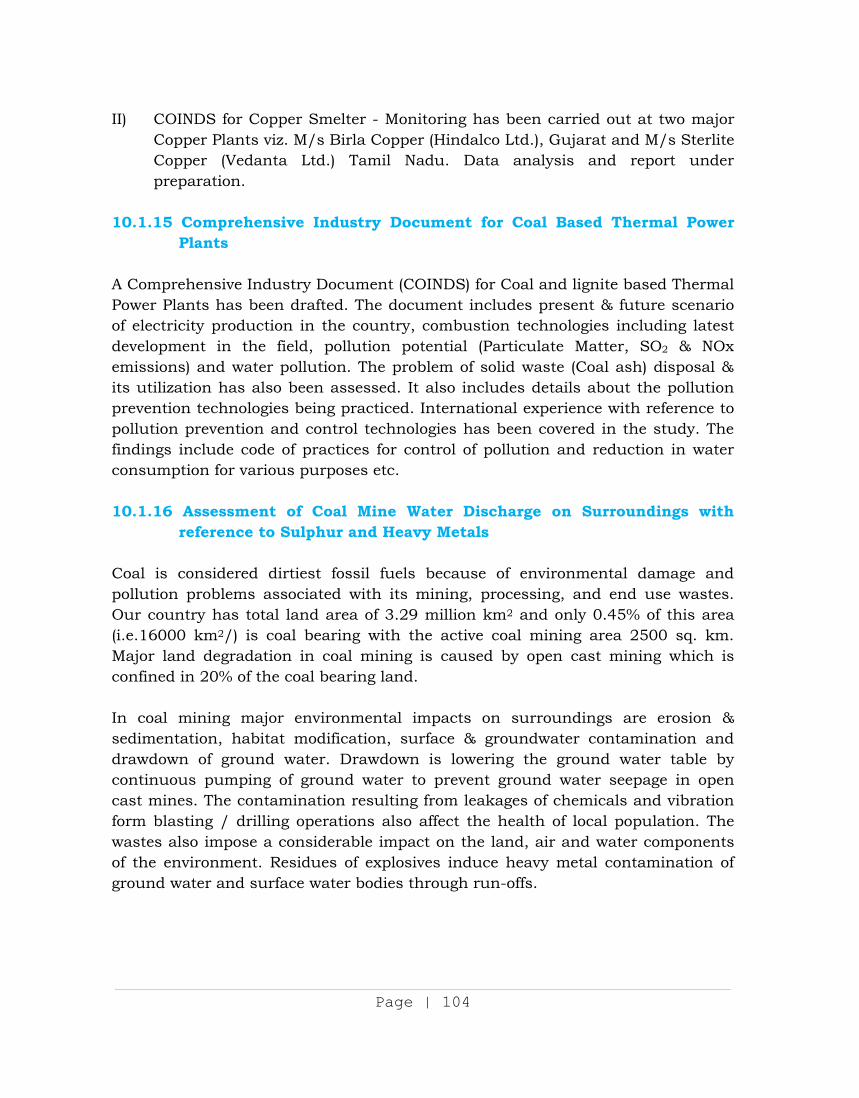
Page | 104
II) COINDS for Copper Smelter - Monitoring has been carried out at two major Copper Plants viz. M/s Birla Copper (Hindalco Ltd.), Gujarat and M/s Sterlite Copper (Vedanta Ltd.) Tamil Nadu. Data analysis and report under preparation.
10.1.15 Comprehensive Industry Document for Coal Based Thermal Power Plants
A Comprehensive Industry Document (COINDS) for Coal and lignite based Thermal Power Plants has been drafted. The document includes present & future scenario of electricity production in the country, combustion technologies including latest development in the field, pollution potential (Particulate Matter, SO2 & NOx emissions) and water pollution. The problem of solid waste (Coal ash) disposal & its utilization has also been assessed. It also includes details about the pollution prevention technologies being practiced. International experience with reference to pollution prevention and control technologies has been covered in the study. The findings include code of practices for control of pollution and reduction in water consumption for various purposes etc.
10.1.16 Assessment of Coal Mine Water Discharge on Surroundings with
reference to Sulphur and Heavy Metals
Coal is considered dirtiest fossil fuels because of environmental damage and pollution problems associated with its mining, processing, and end use wastes. Our country has total land area of 3.29 million km2 and only 0.45% of this area (i.e.16000 km2/) is coal bearing with the active coal mining area 2500 sq. km. Major land degradation in coal mining is caused by open cast mining which is confined in 20% of the coal bearing land.
In coal mining major environmental impacts on surroundings are erosion & sedimentation, habitat modification, surface & groundwater contamination and drawdown of ground water. Drawdown is lowering the ground water table by continuous pumping of ground water to prevent ground water seepage in open cast mines. The contamination resulting from leakages of chemicals and vibration form blasting / drilling operations also affect the health of local population. The wastes also impose a considerable impact on the land, air and water components of the environment. Residues of explosives induce heavy metal contamination of ground water and surface water bodies through run-offs.
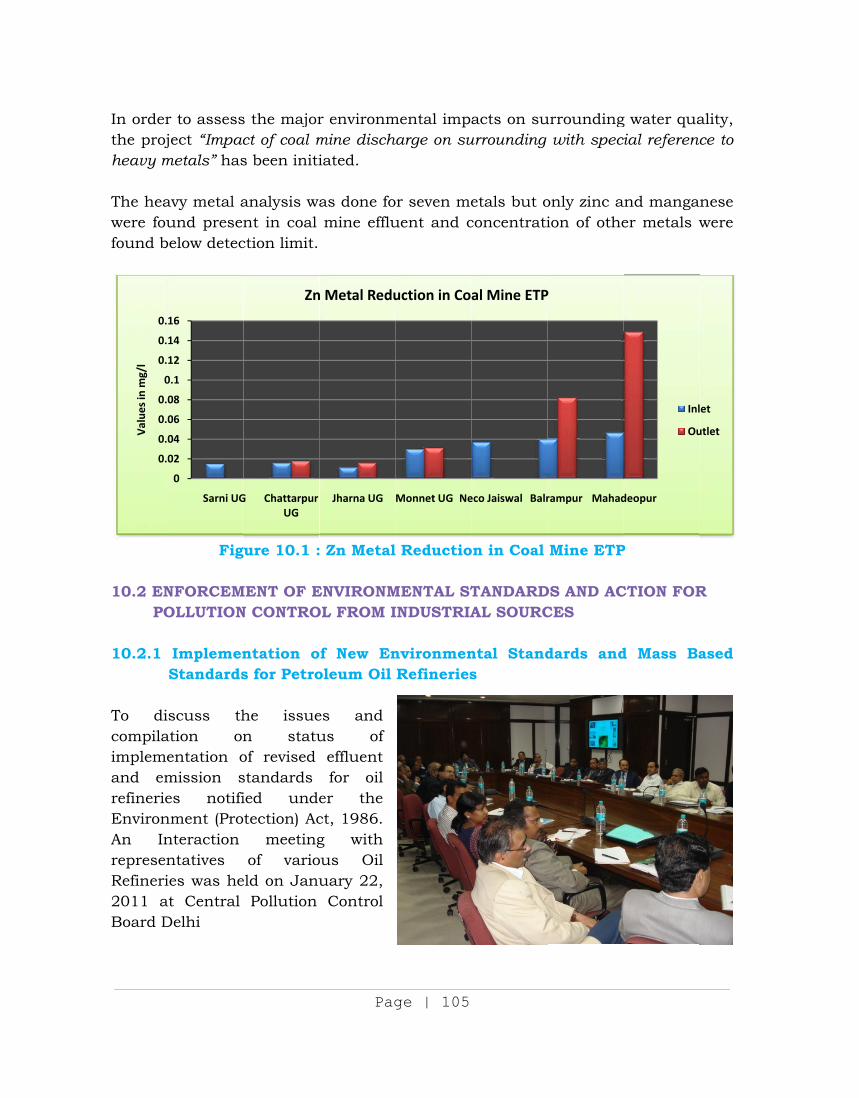
In orderthe projheavy m
The heawere foufound b
10.2 EN
PO 10.2.1
To dicompilaimplemeand emrefinerieEnvironAn InrepresenRefineri2011 aBoard D
0.
0.
0.
0.
0
0.
0.
0.
Val
ues
in m
g/l
r to assessject “Impac
metals” has
avy metal aund prese
below detec
Fig
NFORCEMOLLUTION
ImplemenStandards
iscuss thation onentation omission ses notifinment (Pronteraction ntatives ies was heat Central Delhi
0
02
04
06
08
0.1
12
14
16
Sarni UG
s the majorct of coal ms been initi
analysis want in coal ction limit.
gure 10.1 :
MENT OF EN CONTRO
ntation os for Petro
he issuen statuof revised standards ied undetection) Ac
meetingof vario
eld on JanuPollution
G Chattarpur UG
Zn
Pag
r environmmine dischiated.
as done fomine efflu
: Zn Metal
ENVIRONMOL FROM I
of New Enoleum Oil
es and us of
effluent for oil
er the ct, 1986. g with ous Oil uary 22, Control
Jharna UG
n Metal Redu
ge | 105
mental impharge on su
or seven meuent and c
l Reductio
MENTAL STINDUSTRIA
nvironmenRefineries
Monnet UG Ne
uction in Co
acts on suurrounding
etals but oconcentrati
on in Coal
TANDARDAL SOURC
ntal Stands
eco Jaiswal Balr
al Mine ETP
urroundingwith spec
only zinc aion of othe
Mine ETP
DS AND ACCES
dards and
rampur Mahad
P
g water quacial referen
and mangaer metals w
P
CTION FOR
d Mass Ba
deopur
Inl
Ou
ality, ce to
nese were
R
ased
let
utlet
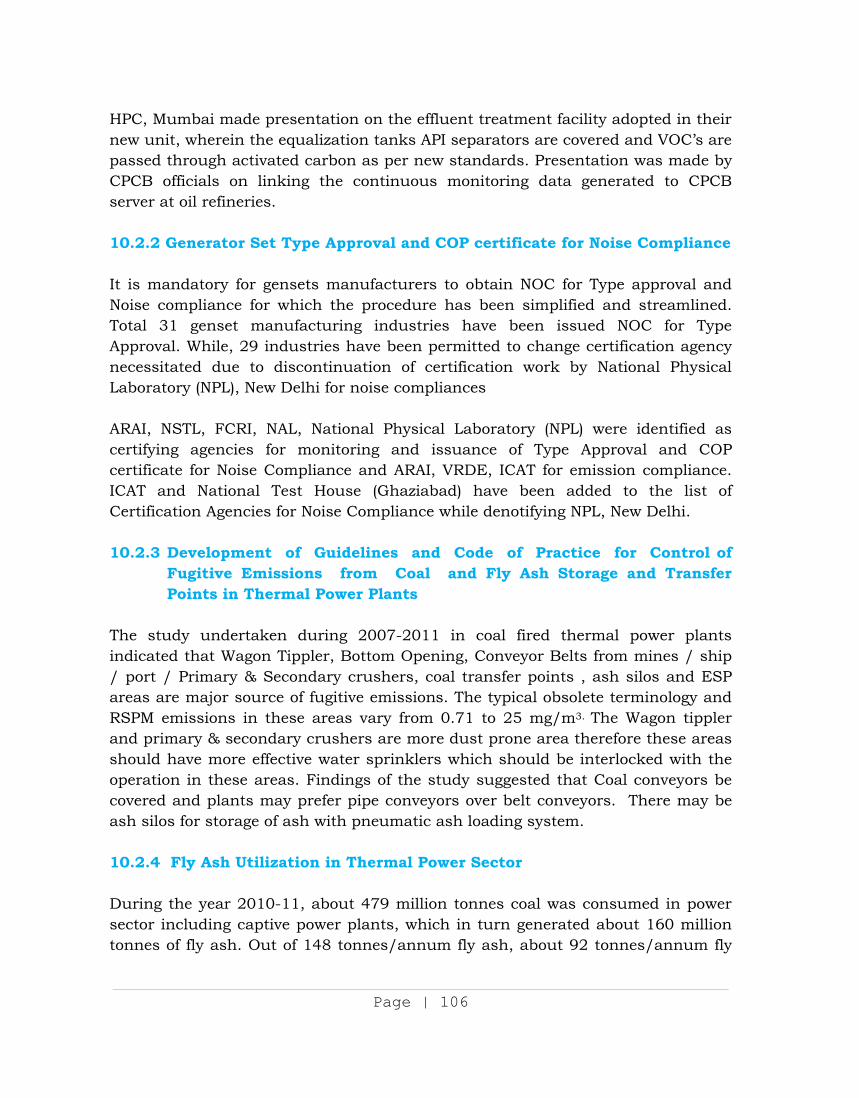
Page | 106
HPC, Mumbai made presentation on the effluent treatment facility adopted in their new unit, wherein the equalization tanks API separators are covered and VOC’s are passed through activated carbon as per new standards. Presentation was made by CPCB officials on linking the continuous monitoring data generated to CPCB server at oil refineries. 10.2.2 Generator Set Type Approval and COP certificate for Noise Compliance It is mandatory for gensets manufacturers to obtain NOC for Type approval and Noise compliance for which the procedure has been simplified and streamlined. Total 31 genset manufacturing industries have been issued NOC for Type Approval. While, 29 industries have been permitted to change certification agency necessitated due to discontinuation of certification work by National Physical Laboratory (NPL), New Delhi for noise compliances
ARAI, NSTL, FCRI, NAL, National Physical Laboratory (NPL) were identified as certifying agencies for monitoring and issuance of Type Approval and COP certificate for Noise Compliance and ARAI, VRDE, ICAT for emission compliance. ICAT and National Test House (Ghaziabad) have been added to the list of Certification Agencies for Noise Compliance while denotifying NPL, New Delhi. 10.2.3 Development of Guidelines and Code of Practice for Control of
Fugitive Emissions from Coal and Fly Ash Storage and Transfer Points in Thermal Power Plants
The study undertaken during 2007-2011 in coal fired thermal power plants indicated that Wagon Tippler, Bottom Opening, Conveyor Belts from mines / ship / port / Primary & Secondary crushers, coal transfer points , ash silos and ESP areas are major source of fugitive emissions. The typical obsolete terminology and RSPM emissions in these areas vary from 0.71 to 25 mg/m3. The Wagon tippler and primary & secondary crushers are more dust prone area therefore these areas should have more effective water sprinklers which should be interlocked with the operation in these areas. Findings of the study suggested that Coal conveyors be covered and plants may prefer pipe conveyors over belt conveyors. There may be ash silos for storage of ash with pneumatic ash loading system. 10.2.4 Fly Ash Utilization in Thermal Power Sector During the year 2010-11, about 479 million tonnes coal was consumed in power sector including captive power plants, which in turn generated about 160 million tonnes of fly ash. Out of 148 tonnes/annum fly ash, about 92 tonnes/annum fly
Page | 107
ash was utilized for various purposes. However, the overall ash utilization has increased from 2.3% (1992-93) to 55.7% (2010-11). Though, power plants have submitted time bound action programme to achieve 100 percent fly ash utilization, only 19 Thermal Power Plants (out of 100 plants) achieved 100% fly ash utilization while 27 Thermal Power Plants could achieve more than 50% of the targeted utilization. The percentage of fly ash utilization in various areas during the year 2010-11 is detailed in Table 10.1. Table 10.1: Percentage of fly ash utilization in various areas during the year
2010-11 Area of utilization Percentage of utilization
Ash dyke raising 8 Cement manufacturing 38 Land Filling 20 Brick manufacturing 9 Road & Flyover embankments 6 Mine back Filling 6 Ready Mix Concrete 3 Agriculture 0 Export 2 Others include (Cenosphere, Value added products etc.) 8
10.2.5 Assessment of Grain Based Fermentation Technology, Waste
Treatment Options, Disposal of Treated Effluents for Distilleries
Molassas based distilleries poses critical environmental problems’ due to very high Biological Oxygen Demand (BOD 40,000 - 65,000mg/l), Chemical Oxygen Demand (COD 80,000 -1,40,000 mg/l), inorganic impurities & dark brown color of their spent wash. Several conventional effluent treatment technologies recommended by Central Board includes Anaerobic treatment of spent wash to generate biogas, aerobic surface composting to manufacture bio-compost, reverse osmosis and multiple effect evaporation systems for concentration of spent wash but the treatment performance remains very poor. It has become very tough to achieve prescribed Effluent standards and to follow the Corporate Responsibility for Environmental Protection (CREP).
Many molassas based distillery units are switching to grain based distillery process, because of low COD 40,000-50,000 mg/l load of Raw Spent Wash. The Central Board has undertaken the performance study at two grain based distillery
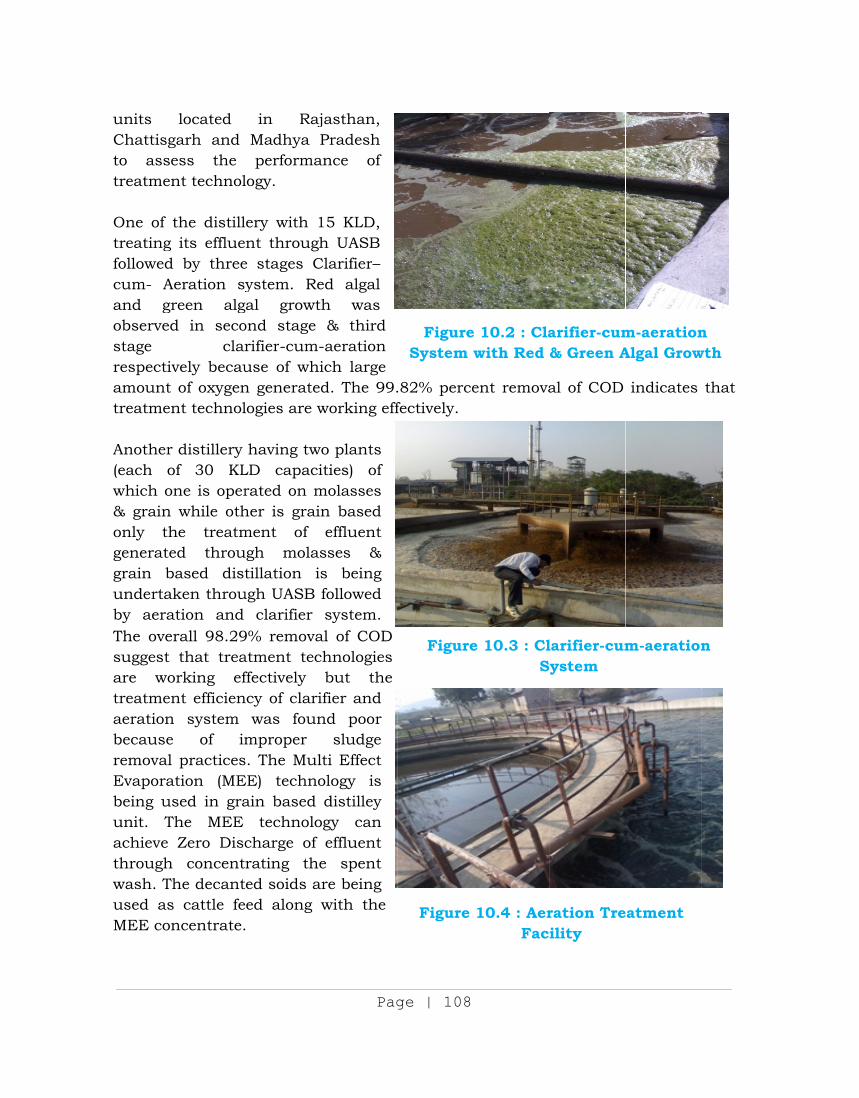
units Chattisgto asstreatme
One of treatingfollowedcum- Aand gobservestage respectiamounttreatme
Another(each owhich o& grainonly thgeneratgrain bundertaby aeraThe ovesuggestare wotreatmeaerationbecauseremovalEvaporabeing uunit. Tachieve throughwash. Tused asMEE co
located garh and sess the ent technol
the distillg its efflued by threeAeration sygreen algd in seco
clarively becaut of oxygenent technol
r distillery of 30 KLone is opern while othhe treatmed throubased distaken throuation and erall 98.29t that treaorking efent efficienn system e of iml practicesation (MEused in graThe MEE
Zero Disch concentThe decants cattle feoncentrate.
in RajMadhya Pperforma
logy.
ery with 1nt through
e stages Cystem. Re
gal growthond stage rifier-cum-use of whin generatedlogies are w
having twLD capacirated on mher is grainment of ugh molastillation is
ugh UASB clarifier
9% removaatment tecffectively
ncy of clariwas foun
mproper s. The MulEE) technoain based
technolocharge of rating theed soids aed along w
Pag
jasthan, Pradesh
ance of
15 KLD, h UASB
Clarifier–ed algal h was & third
-aeration ich large d. The 99.working eff
o plants ities) of molasses n based effluent
sses & s being followed system.
al of COD chnologies
but the ifier and nd poor
sludge lti Effect ology is distilley
ogy can effluent
e spent re being with the
ge | 108
.82% percefectively.
FigureSystem w
Figure
Figure
ent remova
e 10.2 : Clawith Red
e 10.3 : ClS
10.4 : AerFac
al of COD
arifier-cum& Green A
larifier-cumystem
ration Treility
indicates
m-aerationAlgal Grow
m-aeration
eatment
that
n wth
n
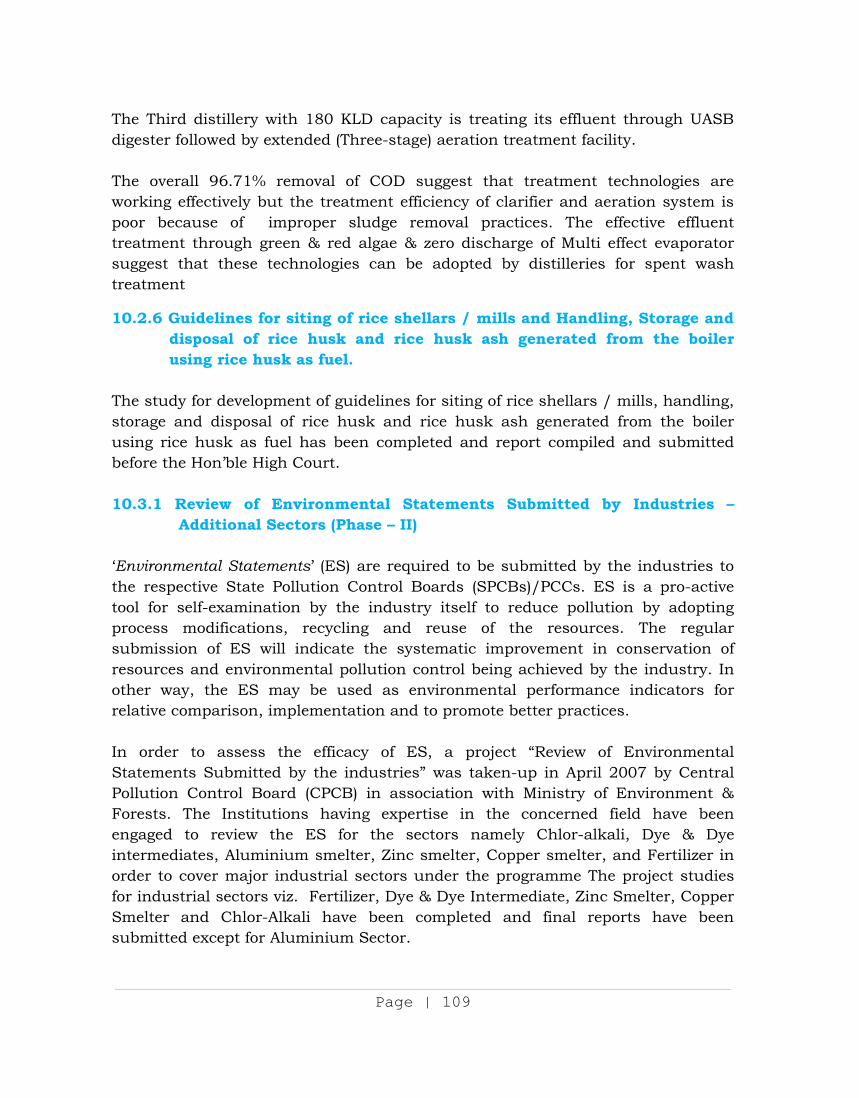
Page | 109
The Third distillery with 180 KLD capacity is treating its effluent through UASB digester followed by extended (Three-stage) aeration treatment facility.
The overall 96.71% removal of COD suggest that treatment technologies are working effectively but the treatment efficiency of clarifier and aeration system is poor because of improper sludge removal practices. The effective effluent treatment through green & red algae & zero discharge of Multi effect evaporator suggest that these technologies can be adopted by distilleries for spent wash treatment
10.2.6 Guidelines for siting of rice shellars / mills and Handling, Storage and disposal of rice husk and rice husk ash generated from the boiler using rice husk as fuel.
The study for development of guidelines for siting of rice shellars / mills, handling, storage and disposal of rice husk and rice husk ash generated from the boiler using rice husk as fuel has been completed and report compiled and submitted before the Hon’ble High Court. 10.3.1 Review of Environmental Statements Submitted by Industries –
Additional Sectors (Phase – II) ‘Environmental Statements’ (ES) are required to be submitted by the industries to the respective State Pollution Control Boards (SPCBs)/PCCs. ES is a pro-active tool for self-examination by the industry itself to reduce pollution by adopting process modifications, recycling and reuse of the resources. The regular submission of ES will indicate the systematic improvement in conservation of resources and environmental pollution control being achieved by the industry. In other way, the ES may be used as environmental performance indicators for relative comparison, implementation and to promote better practices.
In order to assess the efficacy of ES, a project “Review of Environmental Statements Submitted by the industries” was taken-up in April 2007 by Central Pollution Control Board (CPCB) in association with Ministry of Environment & Forests. The Institutions having expertise in the concerned field have been engaged to review the ES for the sectors namely Chlor-alkali, Dye & Dye intermediates, Aluminium smelter, Zinc smelter, Copper smelter, and Fertilizer in order to cover major industrial sectors under the programme The project studies for industrial sectors viz. Fertilizer, Dye & Dye Intermediate, Zinc Smelter, Copper Smelter and Chlor-Alkali have been completed and final reports have been submitted except for Aluminium Sector.
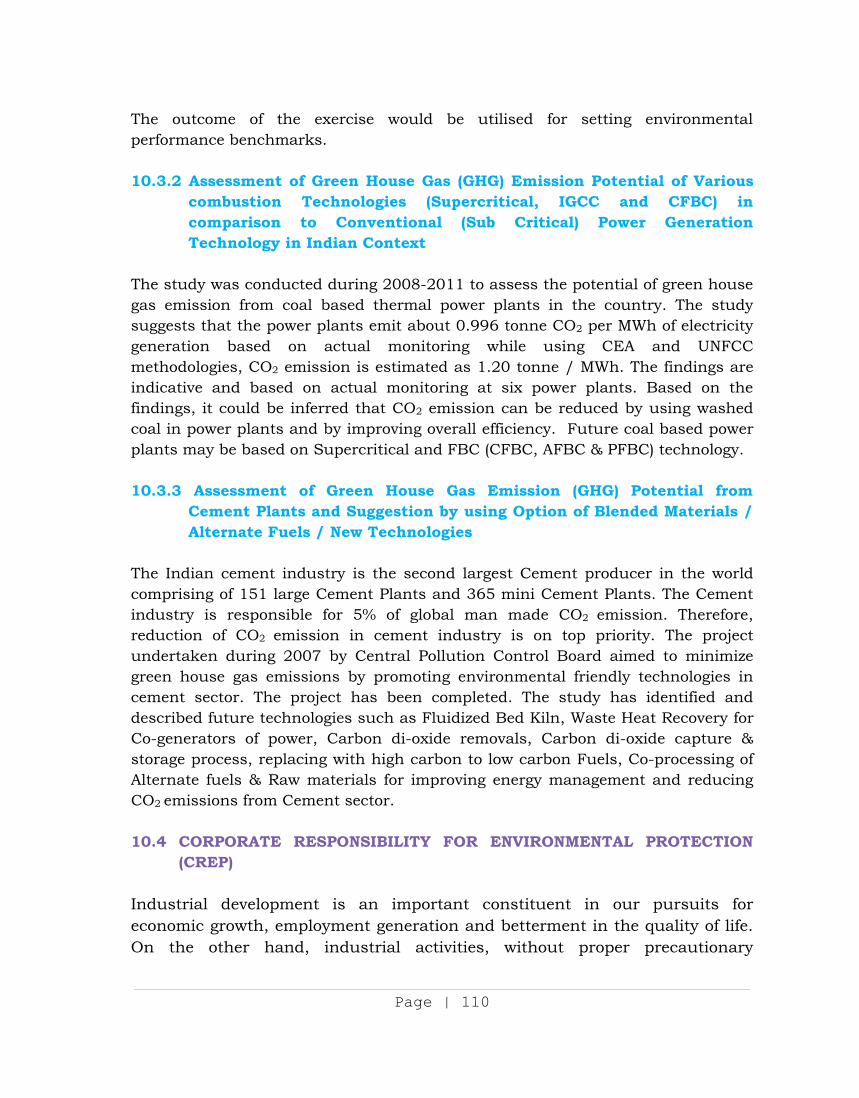
Page | 110
The outcome of the exercise would be utilised for setting environmental performance benchmarks.
10.3.2 Assessment of Green House Gas (GHG) Emission Potential of Various
combustion Technologies (Supercritical, IGCC and CFBC) in comparison to Conventional (Sub Critical) Power Generation Technology in Indian Context
The study was conducted during 2008-2011 to assess the potential of green house gas emission from coal based thermal power plants in the country. The study suggests that the power plants emit about 0.996 tonne CO2 per MWh of electricity generation based on actual monitoring while using CEA and UNFCC methodologies, CO2 emission is estimated as 1.20 tonne / MWh. The findings are indicative and based on actual monitoring at six power plants. Based on the findings, it could be inferred that CO2 emission can be reduced by using washed coal in power plants and by improving overall efficiency. Future coal based power plants may be based on Supercritical and FBC (CFBC, AFBC & PFBC) technology.
10.3.3 Assessment of Green House Gas Emission (GHG) Potential from
Cement Plants and Suggestion by using Option of Blended Materials / Alternate Fuels / New Technologies
The Indian cement industry is the second largest Cement producer in the world comprising of 151 large Cement Plants and 365 mini Cement Plants. The Cement industry is responsible for 5% of global man made CO2 emission. Therefore, reduction of CO2 emission in cement industry is on top priority. The project undertaken during 2007 by Central Pollution Control Board aimed to minimize green house gas emissions by promoting environmental friendly technologies in cement sector. The project has been completed. The study has identified and described future technologies such as Fluidized Bed Kiln, Waste Heat Recovery for Co-generators of power, Carbon di-oxide removals, Carbon di-oxide capture & storage process, replacing with high carbon to low carbon Fuels, Co-processing of Alternate fuels & Raw materials for improving energy management and reducing CO2 emissions from Cement sector.
10.4 CORPORATE RESPONSIBILITY FOR ENVIRONMENTAL PROTECTION
(CREP)
Industrial development is an important constituent in our pursuits for economic growth, employment generation and betterment in the quality of life. On the other hand, industrial activities, without proper precautionary
Page | 111
measures for environmental protection are known to cause pollution and associated problems. Hence, it is necessary to comply with the regulatory norms for prevention and control of pollution. Alongside, it is also imperative to go beyond compliance through adoption of clean technologies and improvement in management practices. Commitment and voluntary initiatives of industry for responsible care of the environment helps in building a partnership for pollution control and in view of this the Charter on Corporate Responsibility for Environmental Protection (CREP) fornulated. The action points enlisted in the Charter are addressed to corporate bodies as well as regulatory agencies. Thus, the Charter is a commitment for partnership and participatory action of concerned stakeholders. The Charter is also road map for progressive improvement in environmental management systems. In order to ensure the implementation of CREP recommendations, the National Task Forces for different sectors were constituted and the progress periodically reviewed. The progress of implementation of CREP in various sectors are as follows: 10.4.1 CREP in Oil Refineries and Petrochemical Sectors
Second National Task Force Meeting for CREP for Oil Refineries and Petrochemical Sectors was held on December 03, 2010. During the review, it is observed that refineries are complying with most of the action points of CREP except initiation of linking of data from continuous ambient air quality monitoring stations to CPCB server, monitoring and control system of VOC and hydrocarbon concentrations and installation of Low NOx burners in existing plants. Also flare loss recovery is not satisfactory and response of refineries towards compliance and reporting of revised environmental standards is inadequate. Industry agreed to incorporate new action points to prepare the Emission Inventory for all sources in refineries and to explore the possibilities of co-processing of oily sludge in cement kilns & power plants. 10.4.2 Implementation of CREP Recommendation in Thermal Power Plants The second meeting of the Task Force on Thermal Power plants for implementation of CREP recommendations was held on September 21, 2010 at DTPS, Dahanu, Dist Thane, Maharashtra. The Task Force recommended that non compliant power plants shall submit Action Plans for achieving the environmental norms and CREP recommendations in a time bound manner. Water consumption in power plants should be optimised for per unit of power generation. A feasibility study for phasing out the units having capacities less than 50 MW should be taken up in association with CEA. Considering the growth in power generation standards
Page | 112
should be developed for the parameter SO2 & NOX especially for the plants using imported coal/ pet coke. In order to meet the requirement of beneficiated coal, more coal washeries are required to be installed so as to provide uniform quality of coal to all power plants. In order to assess the impact on AAQ based on new NAAQS, a study will be conducted to assess the contribution of PM10 / PM2.5 fraction from power plants. Backfilling of mines with ash may be given priority. Integrated/ joint studies for Environmental Quality Assessment may be taken up for Singrauli, Korba, Talcher, Ratnagiri areas.
10.4.3 Implementation of CREP in Iron & Steel Industry The National Task Force meeting for implementation of CREP recommendations and to discuss best environmental management Practices in Steel Industry was held in Durgapur Steel Plant (DSP), Durgapur, West Bengal on May, 10th 2010. Time Targeted Action Points as below were discussed for implementation by the Steel Industries,
i) Reduction of specific water consumption levels to 3 m3 / t for long products and 4.8 m3 / t for flat products;
ii) Preparing road map for implementation of coal dust injection and coal tar injection in Blast Furnaces;
iii) Up linking data from all continous Ambient Air Quality Stations by steel plants with CPCB website for on-line display;
iv) Document preparation based on best available clean technologies for steel industries; and
v) Preparing a time bound commitment for utilization of LD slag and BF slag.
10.5 ACTION FOR CONTROL OF POLLUTION – CO-PROCESSING OF WASTES
10.5.1 Co-Processing of Wastes in Cement Plant, Thermal Power Plant and
Steel Plant - Project Funded by MoEF
A MoEF funded two years project during October 2010 on “Co-processing of hazardous and other wastes in cement plants, iron & steel plants and thermal power plants’ is being undertaken by the Central Board inOctober 2010. The main objective of the project is to explore the possibility of co-processing hazardous waste in environmentally friendly manner as well as to save coal which eventually reduces the carbon emission. Twenty five cement plants, six thermal power plants and eight steel plants have been identified for co-processing of thirty different types of wastes.
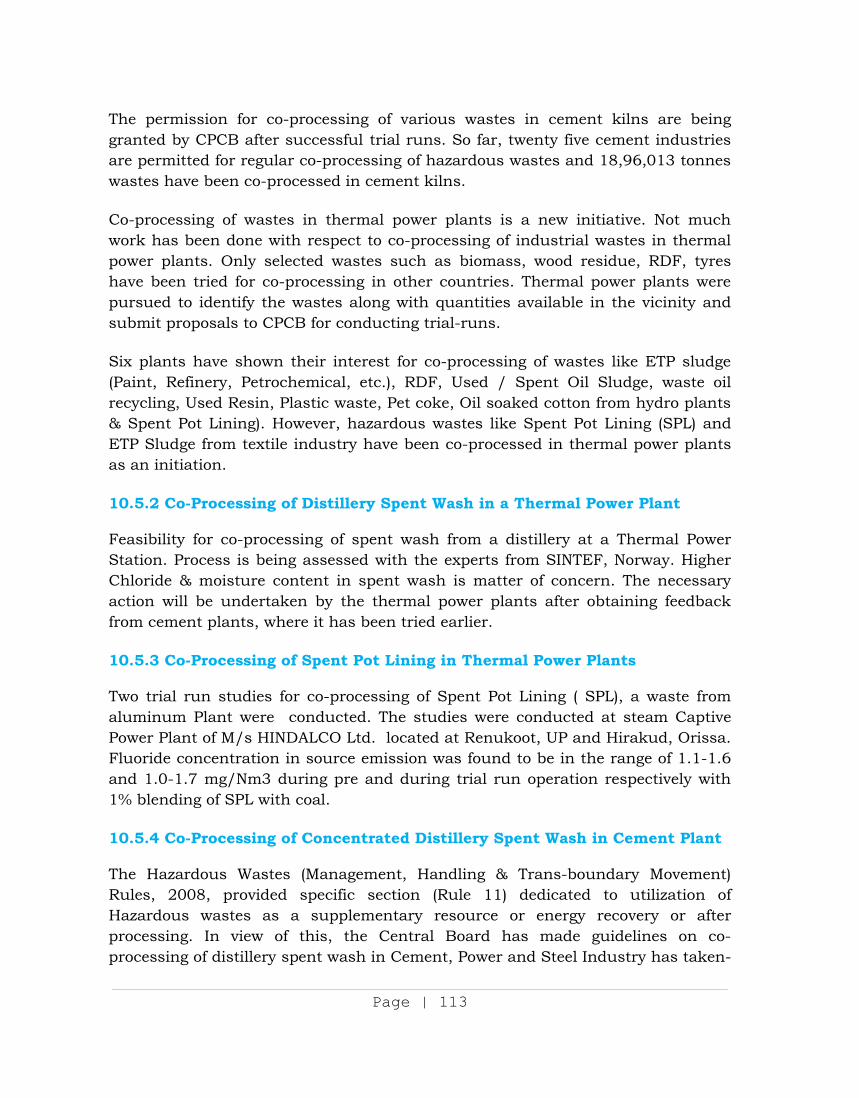
Page | 113
The permission for co-processing of various wastes in cement kilns are being granted by CPCB after successful trial runs. So far, twenty five cement industries are permitted for regular co-processing of hazardous wastes and 18,96,013 tonnes wastes have been co-processed in cement kilns.
Co-processing of wastes in thermal power plants is a new initiative. Not much work has been done with respect to co-processing of industrial wastes in thermal power plants. Only selected wastes such as biomass, wood residue, RDF, tyres have been tried for co-processing in other countries. Thermal power plants were pursued to identify the wastes along with quantities available in the vicinity and submit proposals to CPCB for conducting trial-runs.
Six plants have shown their interest for co-processing of wastes like ETP sludge (Paint, Refinery, Petrochemical, etc.), RDF, Used / Spent Oil Sludge, waste oil recycling, Used Resin, Plastic waste, Pet coke, Oil soaked cotton from hydro plants & Spent Pot Lining). However, hazardous wastes like Spent Pot Lining (SPL) and ETP Sludge from textile industry have been co-processed in thermal power plants as an initiation. 10.5.2 Co-Processing of Distillery Spent Wash in a Thermal Power Plant Feasibility for co-processing of spent wash from a distillery at a Thermal Power Station. Process is being assessed with the experts from SINTEF, Norway. Higher Chloride & moisture content in spent wash is matter of concern. The necessary action will be undertaken by the thermal power plants after obtaining feedback from cement plants, where it has been tried earlier.
10.5.3 Co-Processing of Spent Pot Lining in Thermal Power Plants Two trial run studies for co-processing of Spent Pot Lining ( SPL), a waste from aluminum Plant were conducted. The studies were conducted at steam Captive Power Plant of M/s HINDALCO Ltd. located at Renukoot, UP and Hirakud, Orissa. Fluoride concentration in source emission was found to be in the range of 1.1-1.6 and 1.0-1.7 mg/Nm3 during pre and during trial run operation respectively with 1% blending of SPL with coal. 10.5.4 Co-Processing of Concentrated Distillery Spent Wash in Cement Plant
The Hazardous Wastes (Management, Handling & Trans-boundary Movement) Rules, 2008, provided specific section (Rule 11) dedicated to utilization of Hazardous wastes as a supplementary resource or energy recovery or after processing. In view of this, the Central Board has made guidelines on co-processing of distillery spent wash in Cement, Power and Steel Industry has taken-
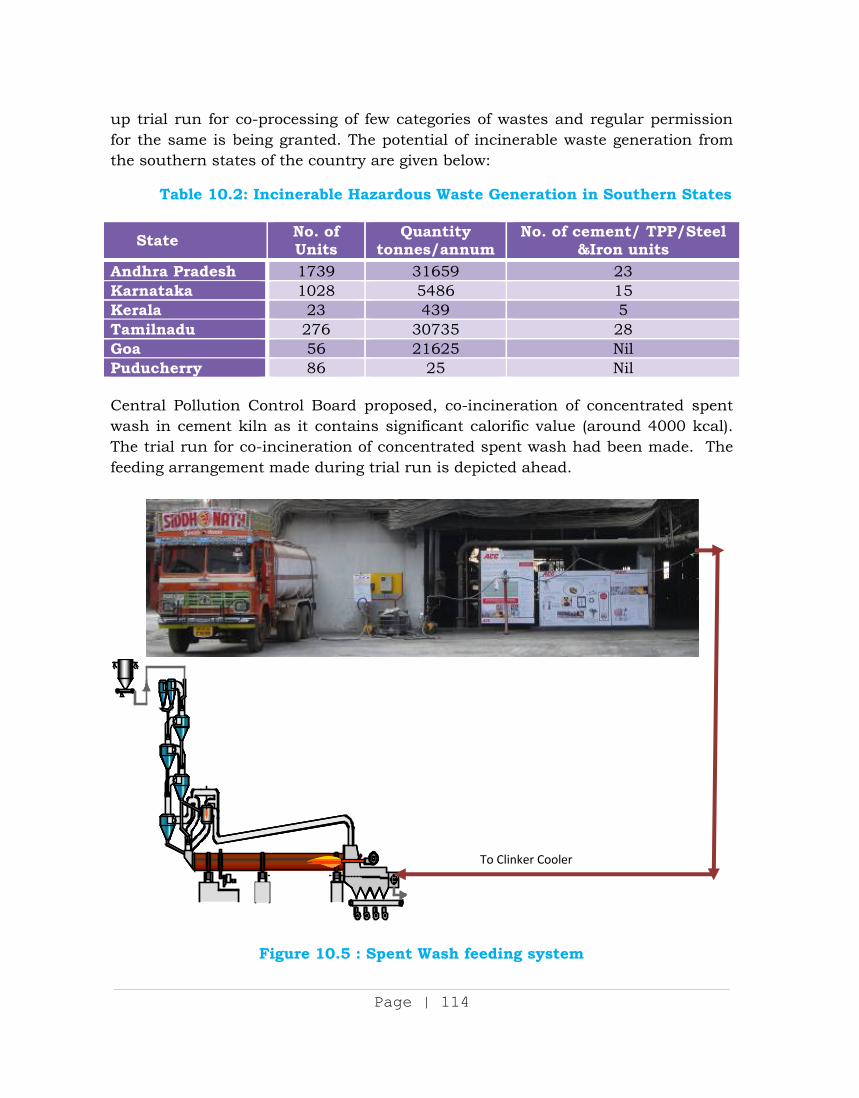
Page | 114
up trial run for co-processing of few categories of wastes and regular permission for the same is being granted. The potential of incinerable waste generation from the southern states of the country are given below:
Table 10.2: Incinerable Hazardous Waste Generation in Southern States
State No. of Units
Quantitytonnes/annum
No. of cement/ TPP/Steel &Iron units
Andhra Pradesh 1739 31659 23 Karnataka 1028 5486 15 Kerala 23 439 5 Tamilnadu 276 30735 28 Goa 56 21625 Nil Puducherry 86 25 Nil Central Pollution Control Board proposed, co-incineration of concentrated spent wash in cement kiln as it contains significant calorific value (around 4000 kcal). The trial run for co-incineration of concentrated spent wash had been made. The feeding arrangement made during trial run is depicted ahead.
Figure 10.5 : Spent Wash feeding system
To Clinker Cooler
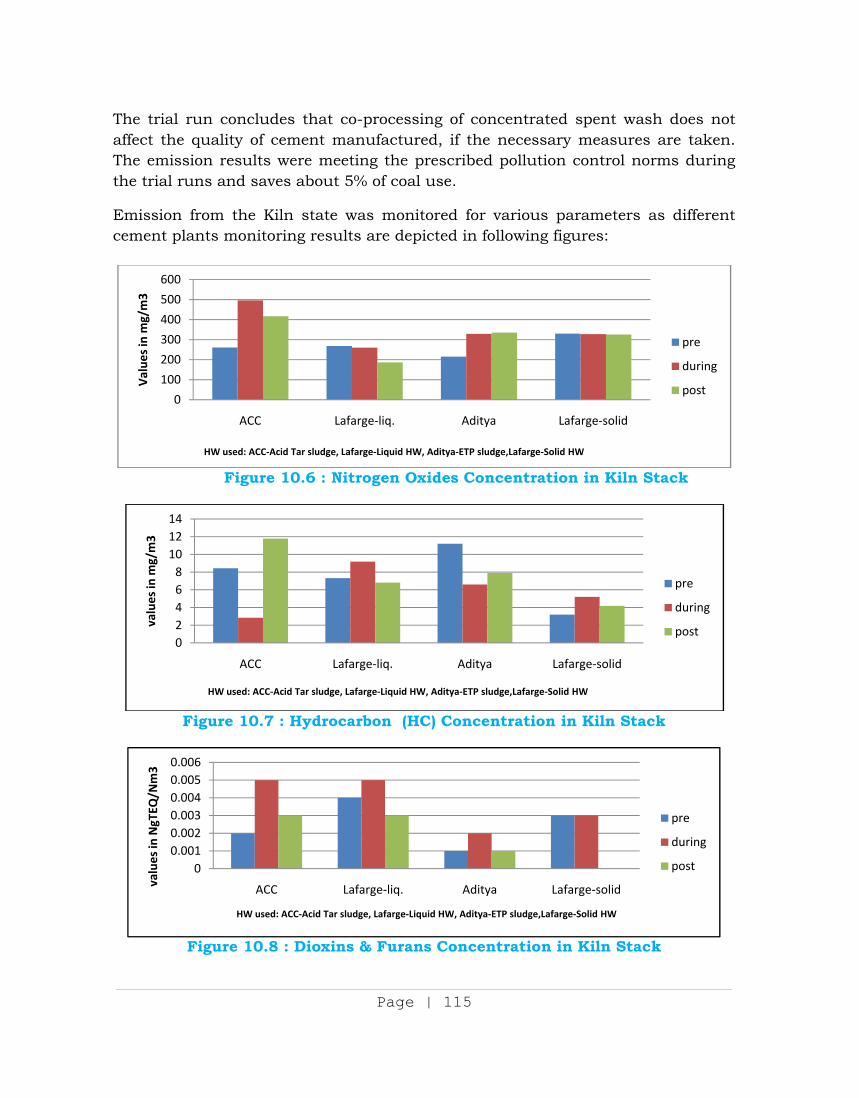
Page | 115
The trial run concludes that co-processing of concentrated spent wash does not affect the quality of cement manufactured, if the necessary measures are taken. The emission results were meeting the prescribed pollution control norms during the trial runs and saves about 5% of coal use.
Emission from the Kiln state was monitored for various parameters as different cement plants monitoring results are depicted in following figures:
Figure 10.6 : Nitrogen Oxides Concentration in Kiln Stack
Figure 10.7 : Hydrocarbon (HC) Concentration in Kiln Stack
Figure 10.8 : Dioxins & Furans Concentration in Kiln Stack
0
100
200
300
400
500
600
ACC Lafarge-liq. Aditya Lafarge-solid
Val
ues
in m
g/m
3
HW used: ACC-Acid Tar sludge, Lafarge-Liquid HW, Aditya-ETP sludge,Lafarge-Solid HW
pre
during
post
02468
101214
ACC Lafarge-liq. Aditya Lafarge-solid
valu
es in
mg/
m3
HW used: ACC-Acid Tar sludge, Lafarge-Liquid HW, Aditya-ETP sludge,Lafarge-Solid HW
pre
during
post
00.0010.0020.0030.0040.0050.006
ACC Lafarge-liq. Aditya Lafarge-solidvalu
es in
NgT
EQ/N
m3
HW used: ACC-Acid Tar sludge, Lafarge-Liquid HW, Aditya-ETP sludge,Lafarge-Solid HW
pre
during
post
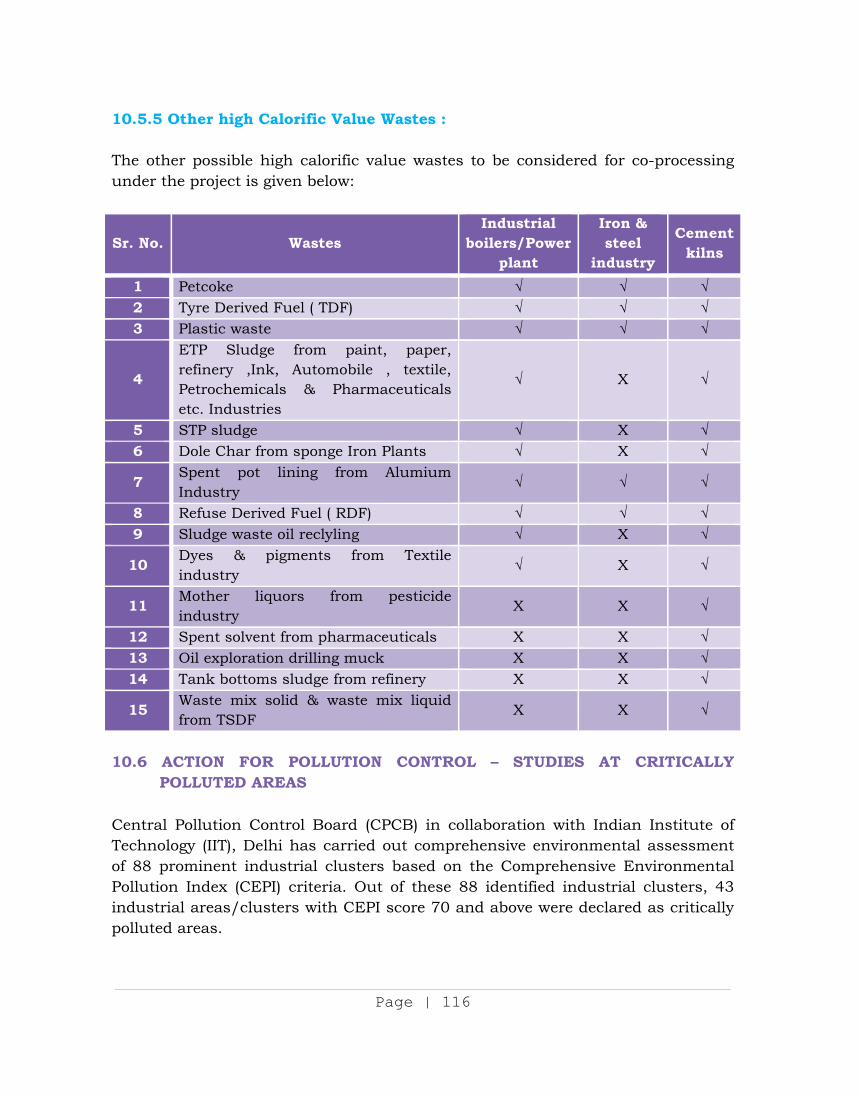
Page | 116
10.5.5 Other high Calorific Value Wastes : The other possible high calorific value wastes to be considered for co-processing under the project is given below:
Sr. No. Wastes Industrial
boilers/Power plant
Iron & steel
industry
Cement kilns
1 Petcoke 2 Tyre Derived Fuel ( TDF) 3 Plastic waste
4
ETP Sludge from paint, paper, refinery ,Ink, Automobile , textile, Petrochemicals & Pharmaceuticals etc. Industries
X
5 STP sludge X 6 Dole Char from sponge Iron Plants X
7 Spent pot lining from Alumium Industry
8 Refuse Derived Fuel ( RDF) 9 Sludge waste oil reclyling X
10 Dyes & pigments from Textile industry
X
11 Mother liquors from pesticide industry
X X
12 Spent solvent from pharmaceuticals X X 13 Oil exploration drilling muck X X 14 Tank bottoms sludge from refinery X X
15 Waste mix solid & waste mix liquid from TSDF
X X
10.6 ACTION FOR POLLUTION CONTROL – STUDIES AT CRITICALLY
POLLUTED AREAS Central Pollution Control Board (CPCB) in collaboration with Indian Institute of Technology (IIT), Delhi has carried out comprehensive environmental assessment of 88 prominent industrial clusters based on the Comprehensive Environmental Pollution Index (CEPI) criteria. Out of these 88 identified industrial clusters, 43 industrial areas/clusters with CEPI score 70 and above were declared as critically polluted areas.
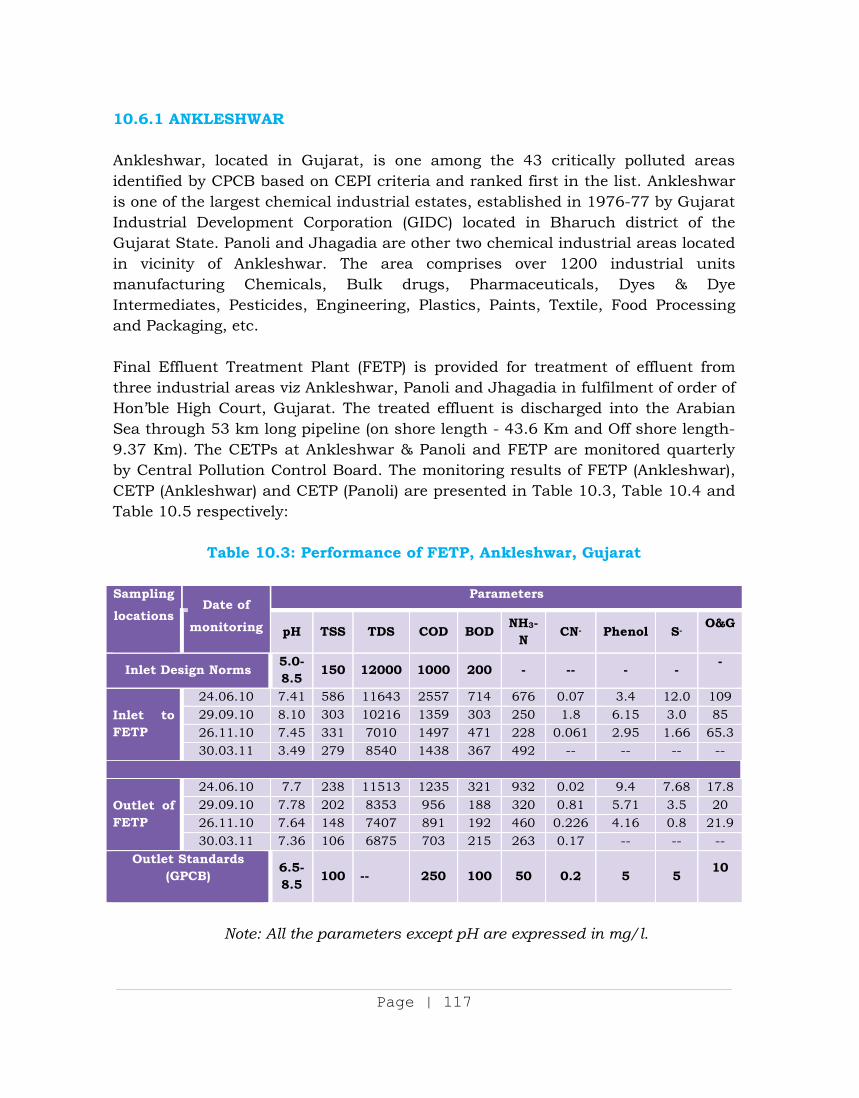
Page | 117
10.6.1 ANKLESHWAR Ankleshwar, located in Gujarat, is one among the 43 critically polluted areas identified by CPCB based on CEPI criteria and ranked first in the list. Ankleshwar is one of the largest chemical industrial estates, established in 1976-77 by Gujarat Industrial Development Corporation (GIDC) located in Bharuch district of the Gujarat State. Panoli and Jhagadia are other two chemical industrial areas located in vicinity of Ankleshwar. The area comprises over 1200 industrial units manufacturing Chemicals, Bulk drugs, Pharmaceuticals, Dyes & Dye Intermediates, Pesticides, Engineering, Plastics, Paints, Textile, Food Processing and Packaging, etc.
Final Effluent Treatment Plant (FETP) is provided for treatment of effluent from three industrial areas viz Ankleshwar, Panoli and Jhagadia in fulfilment of order of Hon’ble High Court, Gujarat. The treated effluent is discharged into the Arabian Sea through 53 km long pipeline (on shore length - 43.6 Km and Off shore length-9.37 Km). The CETPs at Ankleshwar & Panoli and FETP are monitored quarterly by Central Pollution Control Board. The monitoring results of FETP (Ankleshwar), CETP (Ankleshwar) and CETP (Panoli) are presented in Table 10.3, Table 10.4 and Table 10.5 respectively:
Table 10.3: Performance of FETP, Ankleshwar, Gujarat
Sampling
locations
Date of
monitoring
Parameters
pH TSS TDS COD BOD NH3-N CN- Phenol S- O&G
Inlet Design Norms 5.0-8.5 150 12000 1000 200 - -- - - -
Inlet to FETP
24.06.10 7.41 586 11643 2557 714 676 0.07 3.4 12.0 109 29.09.10 8.10 303 10216 1359 303 250 1.8 6.15 3.0 85 26.11.10 7.45 331 7010 1497 471 228 0.061 2.95 1.66 65.3 30.03.11 3.49 279 8540 1438 367 492 -- -- -- --
Outlet of FETP
24.06.10 7.7 238 11513 1235 321 932 0.02 9.4 7.68 17.8 29.09.10 7.78 202 8353 956 188 320 0.81 5.71 3.5 20 26.11.10 7.64 148 7407 891 192 460 0.226 4.16 0.8 21.9 30.03.11 7.36 106 6875 703 215 263 0.17 -- -- --
Outlet Standards (GPCB)
6.5-8.5 100 -- 250 100 50 0.2 5 5 10
Note: All the parameters except pH are expressed in mg/l.
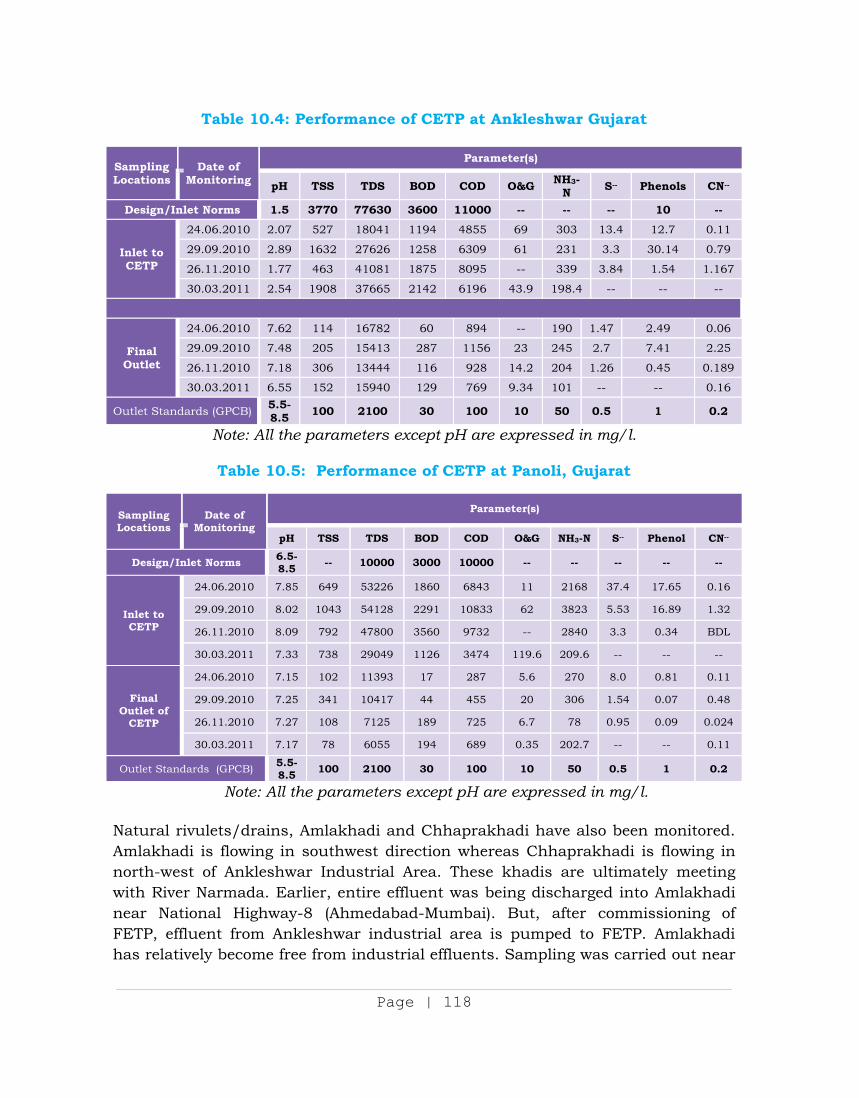
Page | 118
Table 10.4: Performance of CETP at Ankleshwar Gujarat
Sampling Locations
Date of Monitoring
Parameter(s)
pH TSS TDS BOD COD O&G NH3-N S-- Phenols CN--
Design/Inlet Norms 1.5 3770 77630 3600 11000 -- -- -- 10 --
Inlet to CETP
24.06.2010 2.07 527 18041 1194 4855 69 303 13.4 12.7 0.11
29.09.2010 2.89 1632 27626 1258 6309 61 231 3.3 30.14 0.79
26.11.2010 1.77 463 41081 1875 8095 -- 339 3.84 1.54 1.167
30.03.2011 2.54 1908 37665 2142 6196 43.9 198.4 -- -- --
Final Outlet
24.06.2010 7.62 114 16782 60 894 -- 190 1.47 2.49 0.06
29.09.2010 7.48 205 15413 287 1156 23 245 2.7 7.41 2.25
26.11.2010 7.18 306 13444 116 928 14.2 204 1.26 0.45 0.189
30.03.2011 6.55 152 15940 129 769 9.34 101 -- -- 0.16
Outlet Standards (GPCB) 5.5-8.5 100 2100 30 100 10 50 0.5 1 0.2
Note: All the parameters except pH are expressed in mg/l.
Table 10.5: Performance of CETP at Panoli, Gujarat
Note: All the parameters except pH are expressed in mg/l.
Natural rivulets/drains, Amlakhadi and Chhaprakhadi have also been monitored. Amlakhadi is flowing in southwest direction whereas Chhaprakhadi is flowing in north-west of Ankleshwar Industrial Area. These khadis are ultimately meeting with River Narmada. Earlier, entire effluent was being discharged into Amlakhadi near National Highway-8 (Ahmedabad-Mumbai). But, after commissioning of FETP, effluent from Ankleshwar industrial area is pumped to FETP. Amlakhadi has relatively become free from industrial effluents. Sampling was carried out near
Sampling Locations
Date of Monitoring
Parameter(s)
pH TSS TDS BOD COD O&G NH3-N S-- Phenol CN--
Design/Inlet Norms 6.5-8.5 -- 10000 3000 10000 -- -- -- -- --
Inlet to CETP
24.06.2010 7.85 649 53226 1860 6843 11 2168 37.4 17.65 0.16
29.09.2010 8.02 1043 54128 2291 10833 62 3823 5.53 16.89 1.32
26.11.2010 8.09 792 47800 3560 9732 -- 2840 3.3 0.34 BDL
30.03.2011 7.33 738 29049 1126 3474 119.6 209.6 -- -- --
Final Outlet of
CETP
24.06.2010 7.15 102 11393 17 287 5.6 270 8.0 0.81 0.11
29.09.2010 7.25 341 10417 44 455 20 306 1.54 0.07 0.48
26.11.2010 7.27 108 7125 189 725 6.7 78 0.95 0.09 0.024
30.03.2011 7.17 78 6055 194 689 0.35 202.7 -- -- 0.11
Outlet Standards (GPCB) 5.5-8.5 100 2100 30 100 10 50 0.5 1 0.2
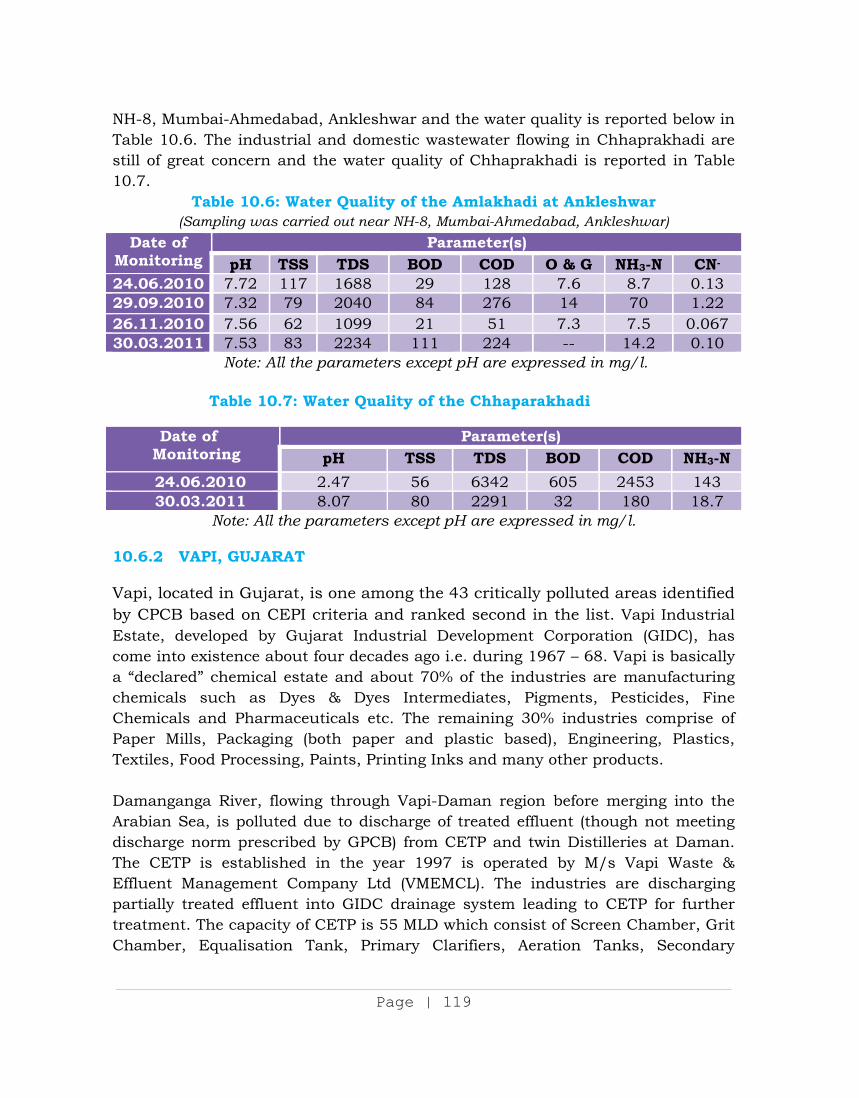
Page | 119
NH-8, Mumbai-Ahmedabad, Ankleshwar and the water quality is reported below in Table 10.6. The industrial and domestic wastewater flowing in Chhaprakhadi are still of great concern and the water quality of Chhaprakhadi is reported in Table 10.7.
Table 10.6: Water Quality of the Amlakhadi at Ankleshwar (Sampling was carried out near NH-8, Mumbai-Ahmedabad, Ankleshwar)
Date of Monitoring
Parameter(s)pH TSS TDS BOD COD O & G NH3-N CN-
24.06.2010 7.72 117 1688 29 128 7.6 8.7 0.13 29.09.2010 7.32 79 2040 84 276 14 70 1.22 26.11.2010 7.56 62 1099 21 51 7.3 7.5 0.067 30.03.2011 7.53 83 2234 111 224 -- 14.2 0.10
Note: All the parameters except pH are expressed in mg/l.
Table 10.7: Water Quality of the Chhaparakhadi
Note: All the parameters except pH are expressed in mg/l. 10.6.2 VAPI, GUJARAT
Vapi, located in Gujarat, is one among the 43 critically polluted areas identified by CPCB based on CEPI criteria and ranked second in the list. Vapi Industrial Estate, developed by Gujarat Industrial Development Corporation (GIDC), has come into existence about four decades ago i.e. during 1967 – 68. Vapi is basically a “declared” chemical estate and about 70% of the industries are manufacturing chemicals such as Dyes & Dyes Intermediates, Pigments, Pesticides, Fine Chemicals and Pharmaceuticals etc. The remaining 30% industries comprise of Paper Mills, Packaging (both paper and plastic based), Engineering, Plastics, Textiles, Food Processing, Paints, Printing Inks and many other products.
Damanganga River, flowing through Vapi-Daman region before merging into the Arabian Sea, is polluted due to discharge of treated effluent (though not meeting discharge norm prescribed by GPCB) from CETP and twin Distilleries at Daman. The CETP is established in the year 1997 is operated by M/s Vapi Waste & Effluent Management Company Ltd (VMEMCL). The industries are discharging partially treated effluent into GIDC drainage system leading to CETP for further treatment. The capacity of CETP is 55 MLD which consist of Screen Chamber, Grit Chamber, Equalisation Tank, Primary Clarifiers, Aeration Tanks, Secondary
Date of Monitoring
Parameter(s)pH TSS TDS BOD COD NH3-N
24.06.2010 2.47 56 6342 605 2453 143 30.03.2011 8.07 80 2291 32 180 18.7
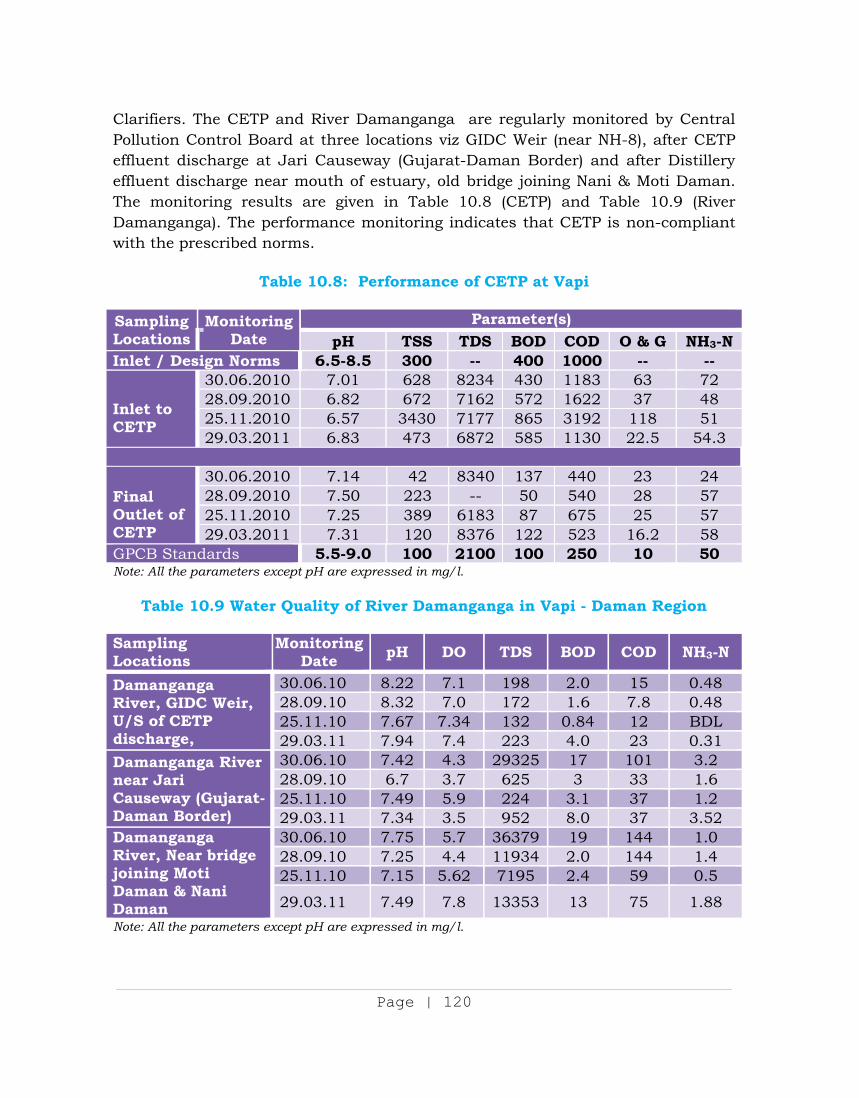
Page | 120
Clarifiers. The CETP and River Damanganga are regularly monitored by Central Pollution Control Board at three locations viz GIDC Weir (near NH-8), after CETP effluent discharge at Jari Causeway (Gujarat-Daman Border) and after Distillery effluent discharge near mouth of estuary, old bridge joining Nani & Moti Daman. The monitoring results are given in Table 10.8 (CETP) and Table 10.9 (River Damanganga). The performance monitoring indicates that CETP is non-compliant with the prescribed norms.
Table 10.8: Performance of CETP at Vapi
Sampling Locations
Monitoring Date
Parameter(s) pH TSS TDS BOD COD O & G NH3-N
Inlet / Design Norms 6.5-8.5 300 -- 400 1000 -- --
Inlet to CETP
30.06.2010 7.01 628 8234 430 1183 63 72 28.09.2010 6.82 672 7162 572 1622 37 48 25.11.2010 6.57 3430 7177 865 3192 118 51 29.03.2011 6.83 473 6872 585 1130 22.5 54.3
Final Outlet of CETP
30.06.2010 7.14 42 8340 137 440 23 24 28.09.2010 7.50 223 -- 50 540 28 57 25.11.2010 7.25 389 6183 87 675 25 57 29.03.2011 7.31 120 8376 122 523 16.2 58
GPCB Standards 5.5-9.0 100 2100 100 250 10 50Note: All the parameters except pH are expressed in mg/l.
Table 10.9 Water Quality of River Damanganga in Vapi - Daman Region
Sampling Locations
Monitoring Date pH DO TDS BOD COD NH3-N
Damanganga River, GIDC Weir, U/S of CETP discharge,
30.06.10 8.22 7.1 198 2.0 15 0.48 28.09.10 8.32 7.0 172 1.6 7.8 0.48 25.11.10 7.67 7.34 132 0.84 12 BDL 29.03.11 7.94 7.4 223 4.0 23 0.31
Damanganga River near Jari Causeway (Gujarat-Daman Border)
30.06.10 7.42 4.3 29325 17 101 3.2 28.09.10 6.7 3.7 625 3 33 1.6 25.11.10 7.49 5.9 224 3.1 37 1.2 29.03.11 7.34 3.5 952 8.0 37 3.52
Damanganga River, Near bridge joining Moti Daman & Nani Daman
30.06.10 7.75 5.7 36379 19 144 1.0 28.09.10 7.25 4.4 11934 2.0 144 1.4 25.11.10 7.15 5.62 7195 2.4 59 0.5
29.03.11 7.49 7.8 13353 13 75 1.88 Note: All the parameters except pH are expressed in mg/l.
Page | 121
As a follow up of inter-state dispute on Damanganga River among Gujarat State & Daman Union Territory, the meeting was held at CPCB, Delhi on 20th April, 2010, with concerned officials of Gujarat Pollution Control Board, Daman Pollution Control Committee and Central Pollution Control Board Zonal Office, Vadodara, in which various issues have been discussed in detail.
10.6.3 MANDI GOBINDGARH, PUNJAB
Mandi Gobindgarh (30.41°N 76.18°E) is a municipal council in Fatehgarh Sahib District in the Indian state of Punjab. District Fatehgarh Sahib. The city is located at a distance of 45 km from Ludhiana on National Highway 1.
Mandi Gobindgarh is known as "Steel City (Loha Mandi)" because of large number of steel mills, factories, and various categories of steel manufacturing industrial units operating in an area of 16,406 acres under the present non-statutory draft Master Plan of Mandi Gobindgarh. Nearly 95% industrial units operating in the city are air polluting in nature. Industrial development in non conforming area alongwith poor infrastructure development have propagated other pollution problems such as municipal solid waste, poor sewerage system, groundwater / surface water pollution, noise pollution etc. The study undertaken at Mandi Gobindgarh highlighted the environmental status of the area based on which the remedial measures have been suggested. Sources of Environmental Pollution:
The deterioration of ambient air quality at Mandi Gobindgarh takes place due to industrial pollution, other polluting sources and several other factors, some of these are as below:
i) Rapid increase in the vehicular density due to industrialization and
commercialization. ii) Haphazard growth of industries in and around Mandi Gobindgarh along
the link roads & katcha narrow roads in agricultural land. iii) Lack of proper infrastructure such as roads, green belts, buffer zones
etc. iv) National highway sub devide the Mandi Gobindgarh.
The total number of industrial units identified by the Punjab Pollution Control Board in and around Mandi Gobindgarh is 395 and their category-wise details presented at Table 10.10 Out of total 395 polluting industries, only 30 units are situated at Focal Point while remaining units are situated in un-defined and unplanned areas having poor infrastructure i.e. roads, sewer / drain etc.
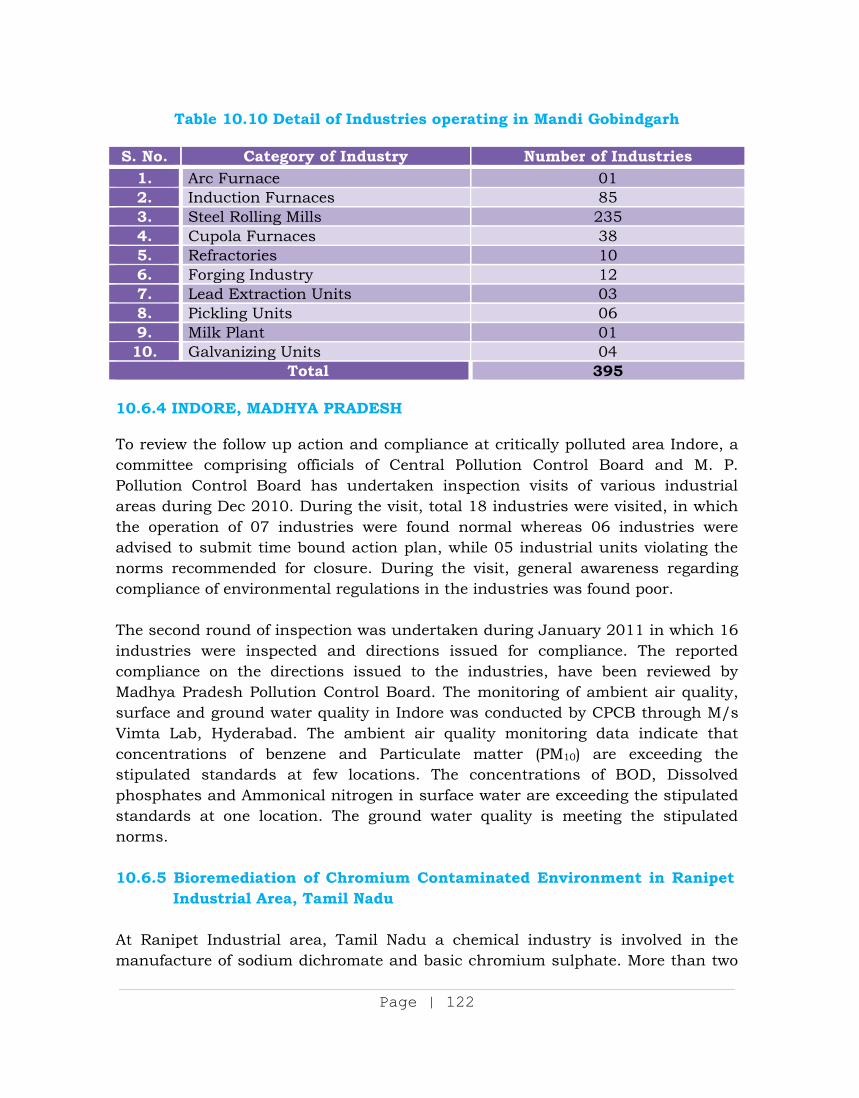
Page | 122
Table 10.10 Detail of Industries operating in Mandi Gobindgarh S. No. Category of Industry Number of Industries
1. Arc Furnace 01 2. Induction Furnaces 85 3. Steel Rolling Mills 235 4. Cupola Furnaces 38 5. Refractories 10 6. Forging Industry 12 7. Lead Extraction Units 03 8. Pickling Units 06 9. Milk Plant 01 10. Galvanizing Units 04
Total 395 10.6.4 INDORE, MADHYA PRADESH
To review the follow up action and compliance at critically polluted area Indore, a committee comprising officials of Central Pollution Control Board and M. P. Pollution Control Board has undertaken inspection visits of various industrial areas during Dec 2010. During the visit, total 18 industries were visited, in which the operation of 07 industries were found normal whereas 06 industries were advised to submit time bound action plan, while 05 industrial units violating the norms recommended for closure. During the visit, general awareness regarding compliance of environmental regulations in the industries was found poor.
The second round of inspection was undertaken during January 2011 in which 16 industries were inspected and directions issued for compliance. The reported compliance on the directions issued to the industries, have been reviewed by Madhya Pradesh Pollution Control Board. The monitoring of ambient air quality, surface and ground water quality in Indore was conducted by CPCB through M/s Vimta Lab, Hyderabad. The ambient air quality monitoring data indicate that concentrations of benzene and Particulate matter (PM10) are exceeding the stipulated standards at few locations. The concentrations of BOD, Dissolved phosphates and Ammonical nitrogen in surface water are exceeding the stipulated standards at one location. The ground water quality is meeting the stipulated norms.
10.6.5 Bioremediation of Chromium Contaminated Environment in Ranipet
Industrial Area, Tamil Nadu
At Ranipet Industrial area, Tamil Nadu a chemical industry is involved in the manufacture of sodium dichromate and basic chromium sulphate. More than two
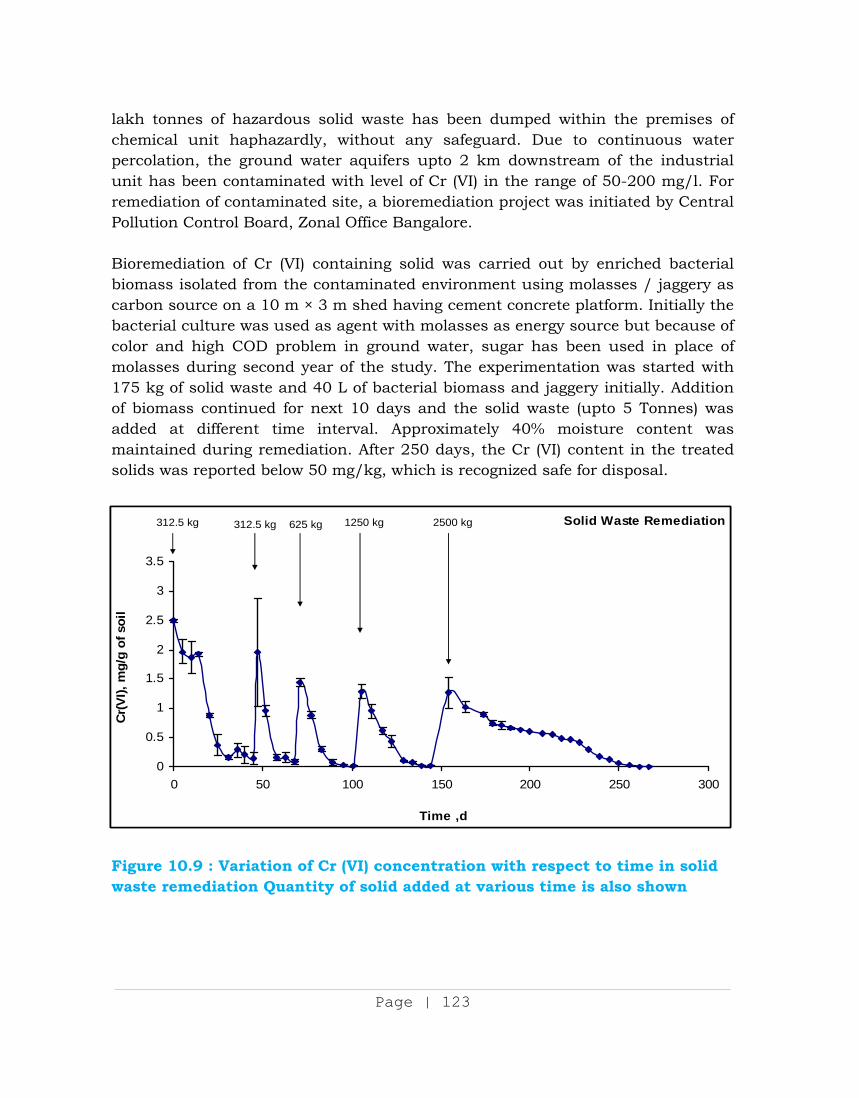
Page | 123
lakh tonnes of hazardous solid waste has been dumped within the premises of chemical unit haphazardly, without any safeguard. Due to continuous water percolation, the ground water aquifers upto 2 km downstream of the industrial unit has been contaminated with level of Cr (VI) in the range of 50-200 mg/l. For remediation of contaminated site, a bioremediation project was initiated by Central Pollution Control Board, Zonal Office Bangalore.
Bioremediation of Cr (VI) containing solid was carried out by enriched bacterial biomass isolated from the contaminated environment using molasses / jaggery as carbon source on a 10 m × 3 m shed having cement concrete platform. Initially the bacterial culture was used as agent with molasses as energy source but because of color and high COD problem in ground water, sugar has been used in place of molasses during second year of the study. The experimentation was started with 175 kg of solid waste and 40 L of bacterial biomass and jaggery initially. Addition of biomass continued for next 10 days and the solid waste (upto 5 Tonnes) was added at different time interval. Approximately 40% moisture content was maintained during remediation. After 250 days, the Cr (VI) content in the treated solids was reported below 50 mg/kg, which is recognized safe for disposal.
Figure 10.9 : Variation of Cr (VI) concentration with respect to time in solid waste remediation Quantity of solid added at various time is also shown
Solid Waste Remediation
0
0.5
1
1.5
2
2.5
3
3.5
0 50 100 150 200 250 300
Time ,d
Cr(V
I), m
g/g
of s
oil
312.5 kg 312.5 kg 625 kg 1250 kg 2500 kg Solid Waste Remediation
0
0.5
1
1.5
2
2.5
3
3.5
0 50 100 150 200 250 300
Time ,d
Cr(V
I), m
g/g
of s
oil
312.5 kg 312.5 kg 625 kg 1250 kg 2500 kg
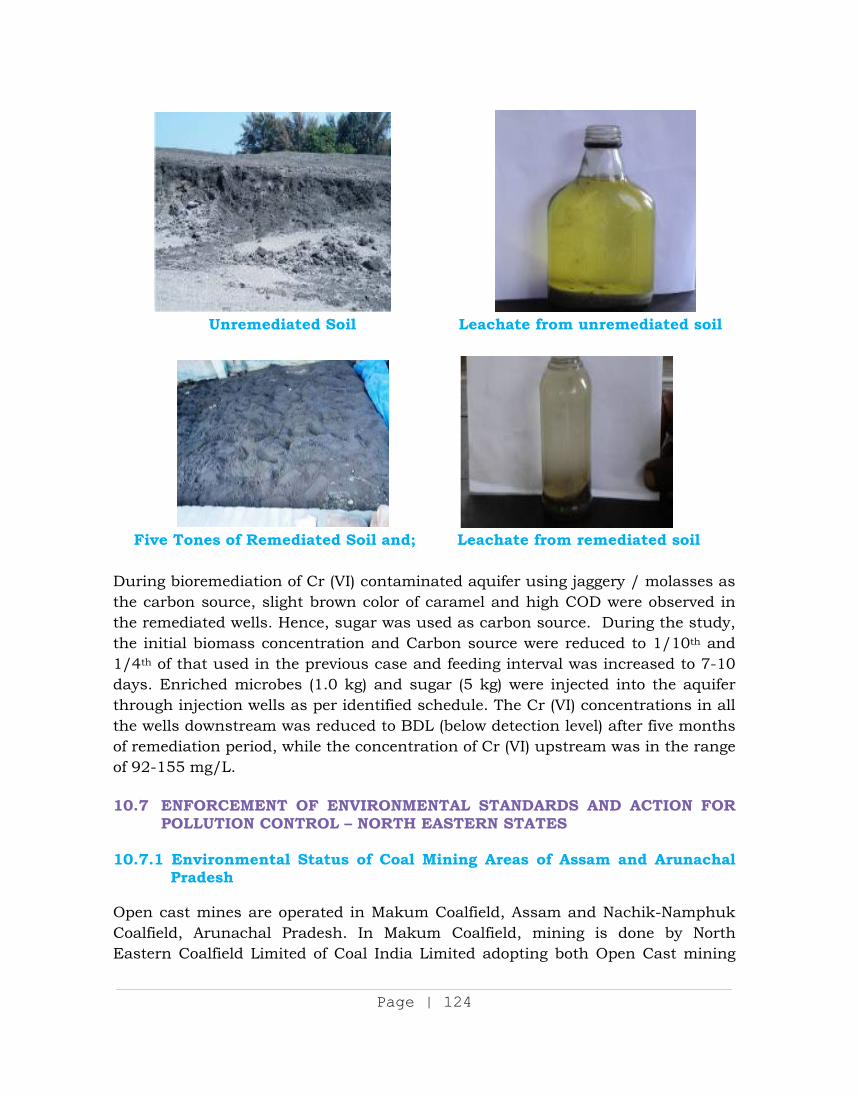
Page | 124
Unremediated Soil Leachate from unremediated soil
Five Tones of Remediated Soil and; Leachate from remediated soil During bioremediation of Cr (VI) contaminated aquifer using jaggery / molasses as the carbon source, slight brown color of caramel and high COD were observed in the remediated wells. Hence, sugar was used as carbon source. During the study, the initial biomass concentration and Carbon source were reduced to 1/10th and 1/4th of that used in the previous case and feeding interval was increased to 7-10 days. Enriched microbes (1.0 kg) and sugar (5 kg) were injected into the aquifer through injection wells as per identified schedule. The Cr (VI) concentrations in all the wells downstream was reduced to BDL (below detection level) after five months of remediation period, while the concentration of Cr (VI) upstream was in the range of 92-155 mg/L. 10.7 ENFORCEMENT OF ENVIRONMENTAL STANDARDS AND ACTION FOR
POLLUTION CONTROL – NORTH EASTERN STATES 10.7.1 Environmental Status of Coal Mining Areas of Assam and Arunachal
Pradesh Open cast mines are operated in Makum Coalfield, Assam and Nachik-Namphuk Coalfield, Arunachal Pradesh. In Makum Coalfield, mining is done by North Eastern Coalfield Limited of Coal India Limited adopting both Open Cast mining
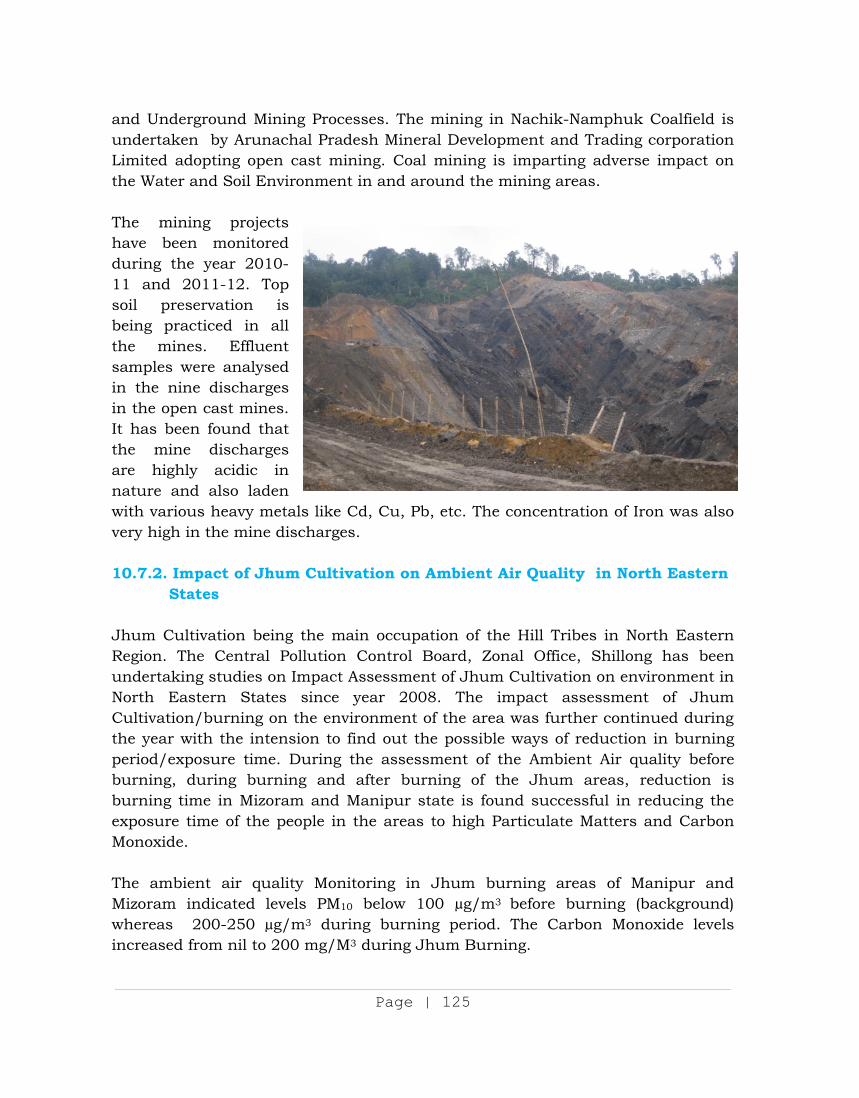
Page | 125
and Underground Mining Processes. The mining in Nachik-Namphuk Coalfield is undertaken by Arunachal Pradesh Mineral Development and Trading corporation Limited adopting open cast mining. Coal mining is imparting adverse impact on the Water and Soil Environment in and around the mining areas. The mining projects have been monitored during the year 2010-11 and 2011-12. Top soil preservation is being practiced in all the mines. Effluent samples were analysed in the nine discharges in the open cast mines. It has been found that the mine discharges are highly acidic in nature and also laden with various heavy metals like Cd, Cu, Pb, etc. The concentration of Iron was also very high in the mine discharges.
10.7.2. Impact of Jhum Cultivation on Ambient Air Quality in North Eastern
States Jhum Cultivation being the main occupation of the Hill Tribes in North Eastern Region. The Central Pollution Control Board, Zonal Office, Shillong has been undertaking studies on Impact Assessment of Jhum Cultivation on environment in North Eastern States since year 2008. The impact assessment of Jhum Cultivation/burning on the environment of the area was further continued during the year with the intension to find out the possible ways of reduction in burning period/exposure time. During the assessment of the Ambient Air quality before burning, during burning and after burning of the Jhum areas, reduction is burning time in Mizoram and Manipur state is found successful in reducing the exposure time of the people in the areas to high Particulate Matters and Carbon Monoxide. The ambient air quality Monitoring in Jhum burning areas of Manipur and Mizoram indicated levels PM10 below 100 µg/m3 before burning (background) whereas 200-250 µg/m3 during burning period. The Carbon Monoxide levels increased from nil to 200 mg/M3 during Jhum Burning.
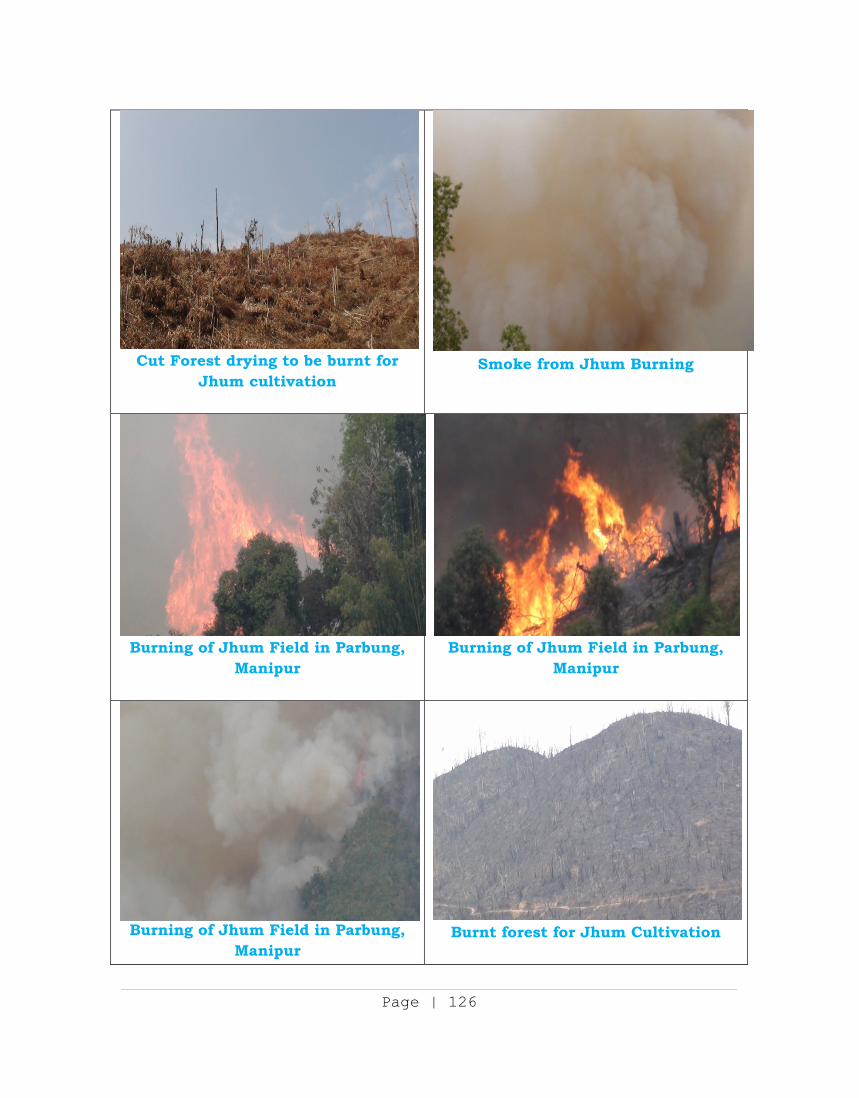
Page | 126
Cut Forest drying to be burnt for Jhum cultivation
Smoke from Jhum Burning
Burning of Jhum Field in Parbung, Manipur
Burning of Jhum Field in Parbung, Manipur
Burning of Jhum Field in Parbung, Manipur
Burnt forest for Jhum Cultivation
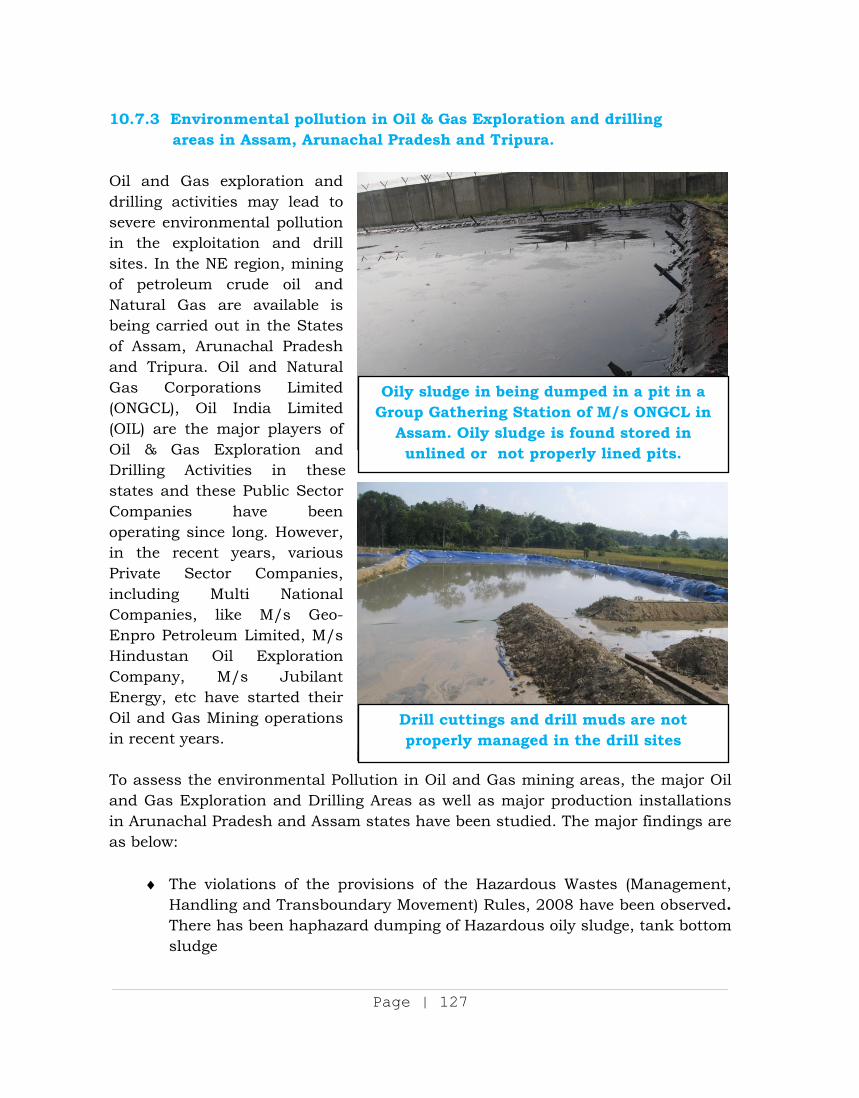
Page | 127
10.7.3 Environmental pollution in Oil & Gas Exploration and drilling areas in Assam, Arunachal Pradesh and Tripura.
Oil and Gas exploration and drilling activities may lead to severe environmental pollution in the exploitation and drill sites. In the NE region, mining of petroleum crude oil and Natural Gas are available is being carried out in the States of Assam, Arunachal Pradesh and Tripura. Oil and Natural Gas Corporations Limited (ONGCL), Oil India Limited (OIL) are the major players of Oil & Gas Exploration and Drilling Activities in these states and these Public Sector Companies have been operating since long. However, in the recent years, various Private Sector Companies, including Multi National Companies, like M/s Geo-Enpro Petroleum Limited, M/s Hindustan Oil Exploration Company, M/s Jubilant Energy, etc have started their Oil and Gas Mining operations in recent years. To assess the environmental Pollution in Oil and Gas mining areas, the major Oil and Gas Exploration and Drilling Areas as well as major production installations in Arunachal Pradesh and Assam states have been studied. The major findings are as below:
The violations of the provisions of the Hazardous Wastes (Management, Handling and Transboundary Movement) Rules, 2008 have been observed. There has been haphazard dumping of Hazardous oily sludge, tank bottom sludge
Oily sludge in being dumped in a pit in a Group Gathering Station of M/s ONGCL in
Assam. Oily sludge is found stored in unlined or not properly lined pits.
Drill cuttings and drill muds are not properly managed in the drill sites
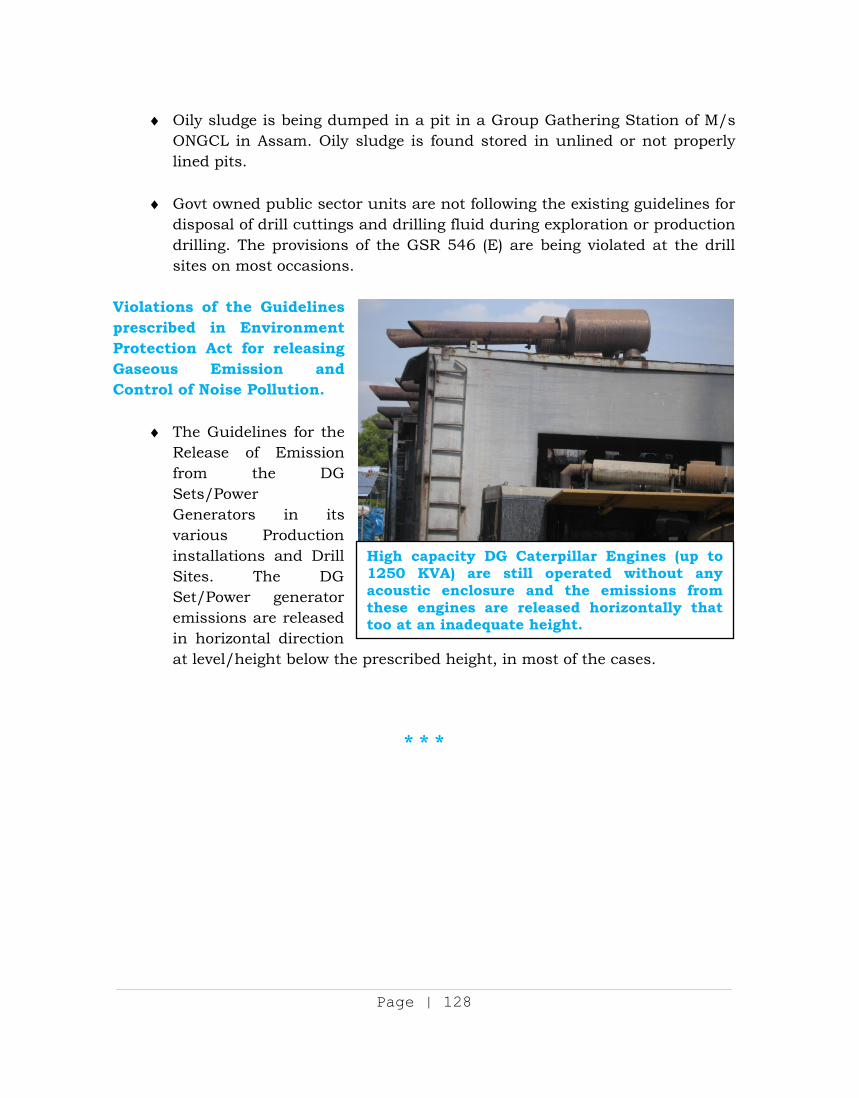
Page | 128
Oily sludge is being dumped in a pit in a Group Gathering Station of M/s ONGCL in Assam. Oily sludge is found stored in unlined or not properly lined pits.
Govt owned public sector units are not following the existing guidelines for
disposal of drill cuttings and drilling fluid during exploration or production drilling. The provisions of the GSR 546 (E) are being violated at the drill sites on most occasions.
Violations of the Guidelines prescribed in Environment Protection Act for releasing Gaseous Emission and Control of Noise Pollution.
The Guidelines for the Release of Emission from the DG Sets/Power Generators in its various Production installations and Drill Sites. The DG Set/Power generator emissions are released in horizontal direction at level/height below the prescribed height, in most of the cases.
* * *
High capacity DG Caterpillar Engines (up to 1250 KVA) are still operated without any acoustic enclosure and the emissions from these engines are released horizontally that too at an inadequate height.
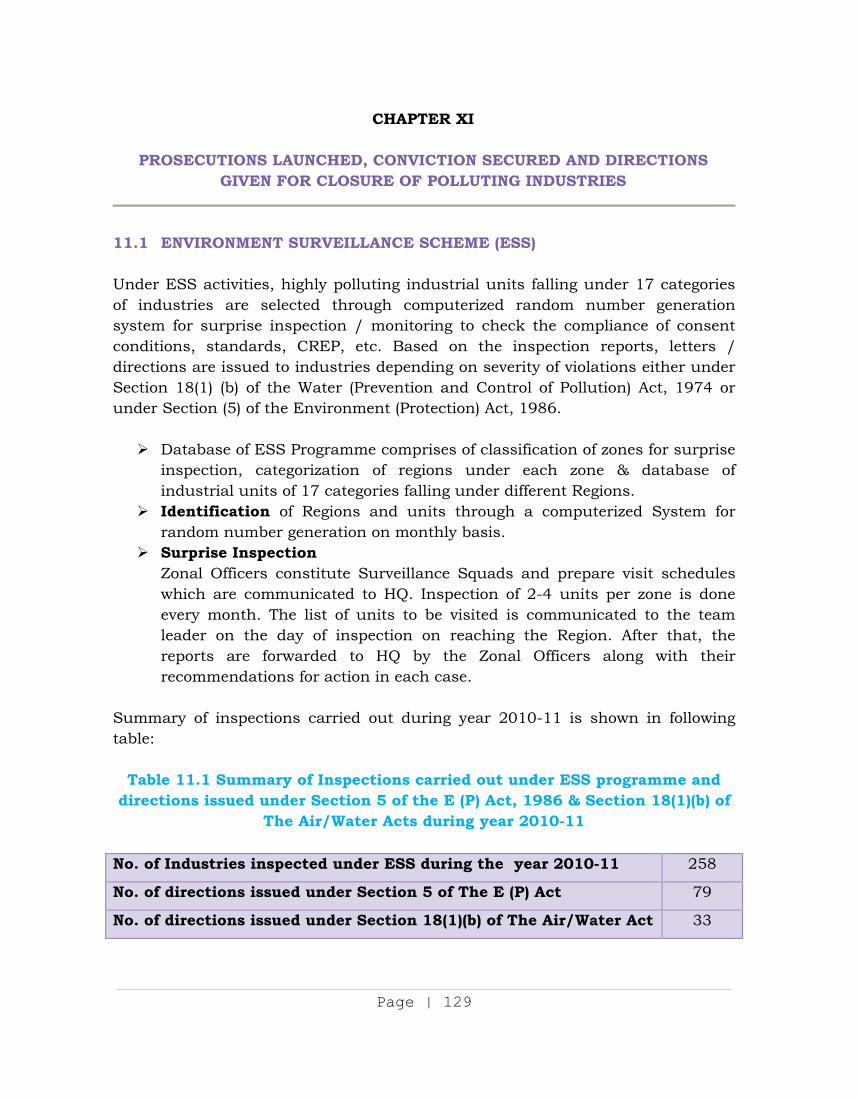
Page | 129
CHAPTER XI
PROSECUTIONS LAUNCHED, CONVICTION SECURED AND DIRECTIONS GIVEN FOR CLOSURE OF POLLUTING INDUSTRIES
11.1 ENVIRONMENT SURVEILLANCE SCHEME (ESS)
Under ESS activities, highly polluting industrial units falling under 17 categories of industries are selected through computerized random number generation system for surprise inspection / monitoring to check the compliance of consent conditions, standards, CREP, etc. Based on the inspection reports, letters / directions are issued to industries depending on severity of violations either under Section 18(1) (b) of the Water (Prevention and Control of Pollution) Act, 1974 or under Section (5) of the Environment (Protection) Act, 1986.
Database of ESS Programme comprises of classification of zones for surprise inspection, categorization of regions under each zone & database of industrial units of 17 categories falling under different Regions.
Identification of Regions and units through a computerized System for random number generation on monthly basis.
Surprise Inspection Zonal Officers constitute Surveillance Squads and prepare visit schedules which are communicated to HQ. Inspection of 2-4 units per zone is done every month. The list of units to be visited is communicated to the team leader on the day of inspection on reaching the Region. After that, the reports are forwarded to HQ by the Zonal Officers along with their recommendations for action in each case.
Summary of inspections carried out during year 2010-11 is shown in following table:
Table 11.1 Summary of Inspections carried out under ESS programme and directions issued under Section 5 of the E (P) Act, 1986 & Section 18(1)(b) of
The Air/Water Acts during year 2010-11
No. of Industries inspected under ESS during the year 2010-11 258
No. of directions issued under Section 5 of The E (P) Act 79
No. of directions issued under Section 18(1)(b) of The Air/Water Act 33
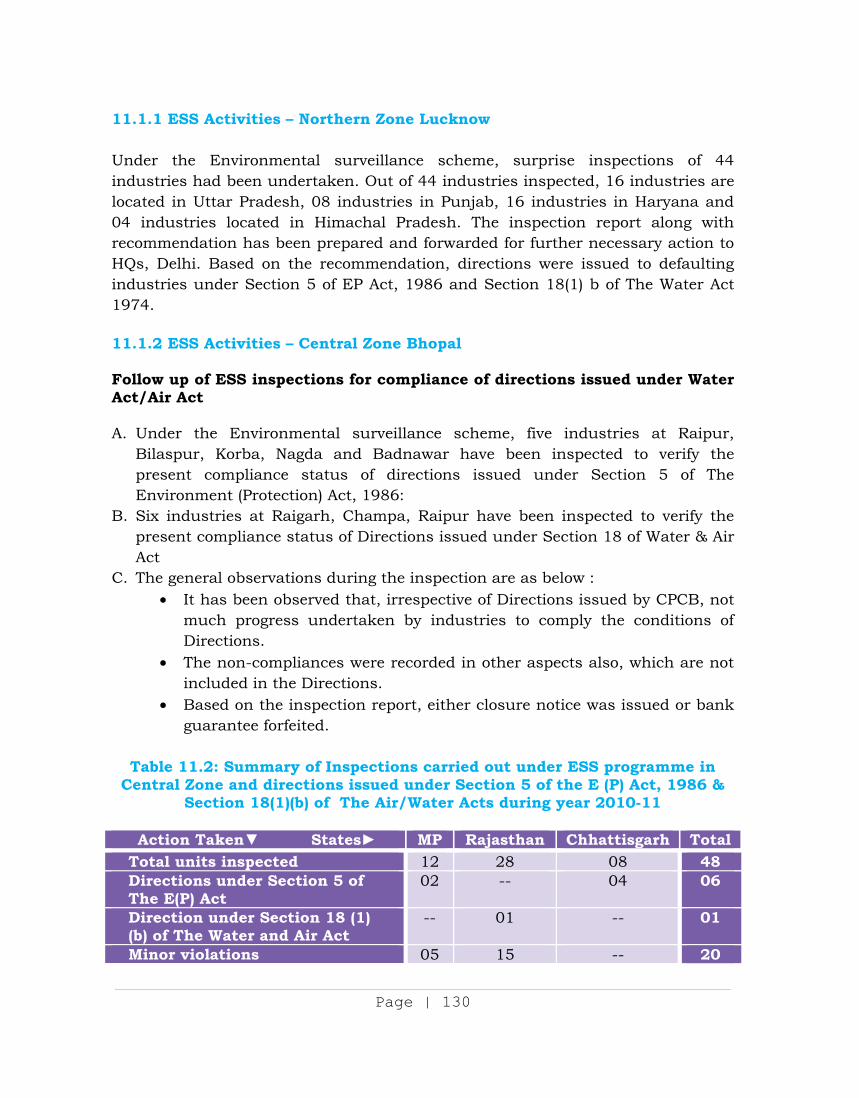
Page | 130
11.1.1 ESS Activities – Northern Zone Lucknow
Under the Environmental surveillance scheme, surprise inspections of 44 industries had been undertaken. Out of 44 industries inspected, 16 industries are located in Uttar Pradesh, 08 industries in Punjab, 16 industries in Haryana and 04 industries located in Himachal Pradesh. The inspection report along with recommendation has been prepared and forwarded for further necessary action to HQs, Delhi. Based on the recommendation, directions were issued to defaulting industries under Section 5 of EP Act, 1986 and Section 18(1) b of The Water Act 1974.
11.1.2 ESS Activities – Central Zone Bhopal
Follow up of ESS inspections for compliance of directions issued under Water Act/Air Act
A. Under the Environmental surveillance scheme, five industries at Raipur,
Bilaspur, Korba, Nagda and Badnawar have been inspected to verify the present compliance status of directions issued under Section 5 of The Environment (Protection) Act, 1986:
B. Six industries at Raigarh, Champa, Raipur have been inspected to verify the present compliance status of Directions issued under Section 18 of Water & Air Act
C. The general observations during the inspection are as below : It has been observed that, irrespective of Directions issued by CPCB, not
much progress undertaken by industries to comply the conditions of Directions.
The non-compliances were recorded in other aspects also, which are not included in the Directions.
Based on the inspection report, either closure notice was issued or bank guarantee forfeited.
Table 11.2: Summary of Inspections carried out under ESS programme in
Central Zone and directions issued under Section 5 of the E (P) Act, 1986 & Section 18(1)(b) of The Air/Water Acts during year 2010-11
Action Taken States MP Rajasthan Chhattisgarh Total
Total units inspected 12 28 08 48Directions under Section 5 of The E(P) Act
02 -- 04 06
Direction under Section 18 (1) (b) of The Water and Air Act
-- 01 -- 01
Minor violations 05 15 -- 20
Page | 131
11.1.3 ESS Activities - Western Zone Vadodara
Under the environmental surveillance scheme, the surprise inspection of randomly selected 55 industries has been carried out in western zone. During the year Out of 55 industrial units, the Inspection has been carried out in 40 industrial units of Maharashtra and 15 units of Gujarat. Suitable actions including directions to the concerned industries / SPCBs, have been taken based on findings of inspections.
11.1.4 ESS Activities - South Zone Bangalore Under the environmental surveillance scheme, the Central Pollution Control Board South Zonal office-Bangalore had inspected 48 industrial units. Out of 48 units, 12 industrial units inspected from Andhra Pradesh, 8 industrial units from Karnataka and 28 industrial units from Tamil Nadu. The industrial units inspected include Bulk Drugs & Pharmaceuticals units (13), Cement units (7), Distillery units (5), Dye & Dye intermediate units (1), Fertilizer Plant (1), Petrochemicals unit (3), Pulp & Paper industries (1), Sugar industries (3), and Tannery units (14). 11.2 COMPREHENSIVE ENVIRONMENTAL ASSESSMENT OF INDUSTRIAL
CLUSTERS
Central Pollution Control Board (CPCB) in collaboration with Indian Institute of Technology (IIT), Delhi has carried out comprehensive environmental assessment of 88 prominent industrial clusters based on Comprehensive Environmental Pollution Index (CEPI) criteria. Out of identified 88 prominent industrial clusters, 43 industrial clusters in 16 States having CEPI score of 70 or above are identified as Critically Polluted Industrial Clusters.
11.2.1 Preparation of Remedial Action Plans
Remedial Action Plans for identified 43 critically polluted areas are prepared by concerned SPCBs/PCCs based on the Terms of Reference (ToR) and Model frame of Action Plan prepared by the Central Pollution Control Board These draft Action Plans were initially reviewed by Steering Committee comprising national level experts and subsequently by an In-house committee of Central Pollution Control Board. Action Plans of 39 industrial clusters have already been finalized in light of suggestions of national-level Steering Committee.
Page | 132
11.2.2 Monitoring of Implementation of Action Plans
For the strict implementation of Action Plans prepared by respective State Pollution Control Boards, the Central Pollution Control Board requested SPCBs to constitute local committees for field visit / review and verification of implementation of Action Plans and to submit progress on bi-monthly basis to Central Pollution Control Board. Accordingly the State Pollution Control Boards have constituted local committees for implementation of Action Plans in 17 industrial clusters viz. Jharkhand, Ludhiana, Mandi-Govindgarh, IbValley-Jharsugda, Angul-Talcher, Bhadravati, Vapi, Ankleshwar, Ahmedabad, Vatva, Bhavnagar, Junagarh, NOIDA, Korba, Kanpur, Agra and Singrauli comprising various stakeholders, local representatives & government departments. The industrial clusters where local committees are not constituted, the SPCBs are self monitoring the progress of implementation of action plans. 11.2.3 Moratorium in Critically Polluted Areas The moratorium in 43 critically polluted areas was imposed by Ministry of Environment & Forests (MoEF) vide Office .Memorandum dated 13.01.2010. Subsequently, MoEF decided to lift the moratorium on the basis of statements furnished by concerned State Pollution Control Boards, that some work has been initiated in the line of submitted action plans. Therefore, the SPCBs were directed to submit the progress reports on the initiation of implementation of Action Plans. MoEF has lifted moratorium (till March 2011) in respect of below mentioned 20 Critically Polluted Areas based on the progress reports submitted by concerned SPCBs:, Clusters from where Moratorium lifted in October 2010: 05 Critically Polluted Areas
Pattancheru-Bollaram (Andhra Pradesh) Mandi Govindgarh (Punjab) Vapi (Gujarat) Tarapur (Maharashtra), Coimbatore (Tamilnadu)
Clusters from where Moratorium lifted in February 2011: 08 Critically Polluted Areas
Navi Mumbai (Maharashtra) Dombivali (Maharashtra) Aurangabad (Maharashtra) Ludhiana (Punjab) Agra (Uttar Pradesh) Varanasi-Mirzapur (Uttar Pradesh) Cuddalore (Tamilnadu) Bhavnagar (Gujarat)
Page | 133
Clusters from where Moratorium lifted in March 2011: 07 critically Polluted Areas
Indore (Madhya Pradesh) Angul-Talcher (Orissa) Faridabad (Haryana) Panipat (Haryana) Ghaziabad (Uttar Pradesh) Noida (Uttar Pradesh) Junagadh (Gujarat)
11.2.4 Environmental Quality Monitoring in Critically Polluted Areas
Central Pollution Control Board has engaged Third Party agencies, i.e. M/s SGS India Pvt. Ltd. and M/s Vimta Labs for monitoring of Air, Water and Ground water quality of all the 43 Critically Polluted Areas. The monitoring has been conducted between February–March, 2011 in presence of SPCB Scientists and representatives of local stakeholders. Regarding the effectiveness in improving the environmental quality in critically polluted areas from where the moratorium has been lifted, it is pertinent to mention that some short-term action plans have been implemented / initiated. State Pollution Control Board Boards are also keeping constant vigil over polluting industries and Common facilities / CETPs for their effective operation and maintenance. The long-term action plans are still to be implemented. The activities pertaining to technological intervention (adoption of cleaner technology / fuel), sewage treatment, municipal solid waste management, vehicular pollution control / traffic diversion, infrastructural development / renewal, hazardous waste management, up-gradation of existing environmental infrastructures etc. are still to be implemented, which play a vital role in improvement of environmental quality and reduction of CEPI scores. Therefore, improvement in total environmental status of the critically polluted areas would be reflected after implementation of long-term action plans. 11.2.5 Assessment of CEPI in new Industrial Clusters The assessment of CEPI is a dynamic process and based on the annual average data bank CEPI may be calculated regularly so that the impact and effect of enforcement could be evaluated in terms of improvement in environmental quality of selected industrial clusters. Therefore, software is being developed by Central Pollution Control Board through M/s DOEACC Society, Chandigarh for web-based online calculation of CEPI, which would be shared with SPCBs. The software would enable the concerned SPCBs / PCCs to recalculate the CEPI for their area on regular basis to ensure better enforcement and compliance. The SPCBs / PCC would be capable in regular evaluation of CEPI for the major industrial clusters
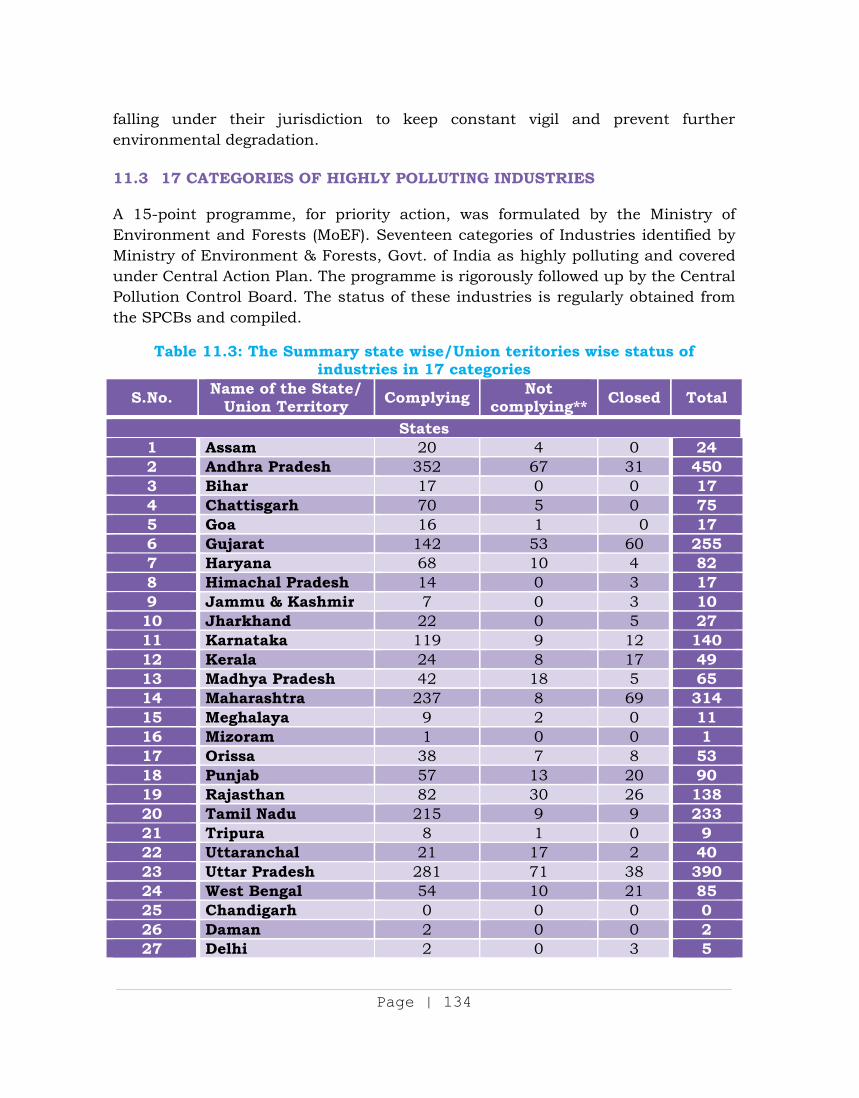
Page | 134
falling under their jurisdiction to keep constant vigil and prevent further environmental degradation. 11.3 17 CATEGORIES OF HIGHLY POLLUTING INDUSTRIES
A 15-point programme, for priority action, was formulated by the Ministry of Environment and Forests (MoEF). Seventeen categories of Industries identified by Ministry of Environment & Forests, Govt. of India as highly polluting and covered under Central Action Plan. The programme is rigorously followed up by the Central Pollution Control Board. The status of these industries is regularly obtained from the SPCBs and compiled.
Table 11.3: The Summary state wise/Union teritories wise status of industries in 17 categories
S.No. Name of the State/ Union Territory Complying Not
complying** Closed Total
States1 Assam 20 4 0 242 Andhra Pradesh 352 67 31 4503 Bihar 17 0 0 174 Chattisgarh 70 5 0 755 Goa 16 1 0 176 Gujarat 142 53 60 2557 Haryana 68 10 4 828 Himachal Pradesh 14 0 3 179 Jammu & Kashmir 7 0 3 1010 Jharkhand 22 0 5 2711 Karnataka 119 9 12 14012 Kerala 24 8 17 4913 Madhya Pradesh 42 18 5 6514 Maharashtra 237 8 69 31415 Meghalaya 9 2 0 1116 Mizoram 1 0 0 117 Orissa 38 7 8 5318 Punjab 57 13 20 9019 Rajasthan 82 30 26 13820 Tamil Nadu 215 9 9 23321 Tripura 8 1 0 922 Uttaranchal 21 17 2 4023 Uttar Pradesh 281 71 38 39024 West Bengal 54 10 21 8525 Chandigarh 0 0 0 026 Daman 2 0 0 227 Delhi 2 0 3 5
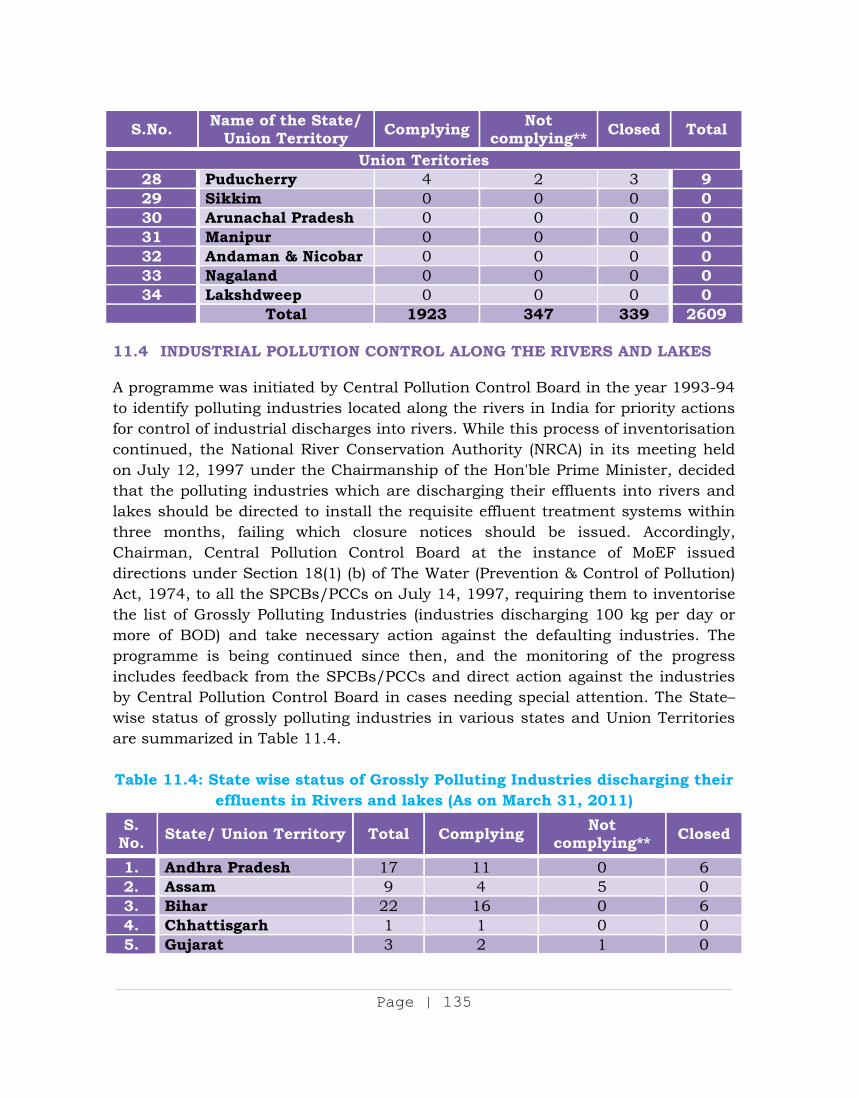
Page | 135
S.No. Name of the State/ Union Territory Complying Not
complying** Closed Total
Union Teritories28 Puducherry 4 2 3 929 Sikkim 0 0 0 030 Arunachal Pradesh 0 0 0 031 Manipur 0 0 0 032 Andaman & Nicobar 0 0 0 033 Nagaland 0 0 0 034 Lakshdweep 0 0 0 0 Total 1923 347 339 2609
11.4 INDUSTRIAL POLLUTION CONTROL ALONG THE RIVERS AND LAKES A programme was initiated by Central Pollution Control Board in the year 1993-94 to identify polluting industries located along the rivers in India for priority actions for control of industrial discharges into rivers. While this process of inventorisation continued, the National River Conservation Authority (NRCA) in its meeting held on July 12, 1997 under the Chairmanship of the Hon'ble Prime Minister, decided that the polluting industries which are discharging their effluents into rivers and lakes should be directed to install the requisite effluent treatment systems within three months, failing which closure notices should be issued. Accordingly, Chairman, Central Pollution Control Board at the instance of MoEF issued directions under Section 18(1) (b) of The Water (Prevention & Control of Pollution) Act, 1974, to all the SPCBs/PCCs on July 14, 1997, requiring them to inventorise the list of Grossly Polluting Industries (industries discharging 100 kg per day or more of BOD) and take necessary action against the defaulting industries. The programme is being continued since then, and the monitoring of the progress includes feedback from the SPCBs/PCCs and direct action against the industries by Central Pollution Control Board in cases needing special attention. The State–wise status of grossly polluting industries in various states and Union Territories are summarized in Table 11.4.
Table 11.4: State wise status of Grossly Polluting Industries discharging their
effluents in Rivers and lakes (As on March 31, 2011) S.
No. State/ Union Territory Total Complying Not complying** Closed
1. Andhra Pradesh 17 11 0 6 2. Assam 9 4 5 0 3. Bihar 22 16 0 6 4. Chhattisgarh 1 1 0 0 5. Gujarat 3 2 1 0
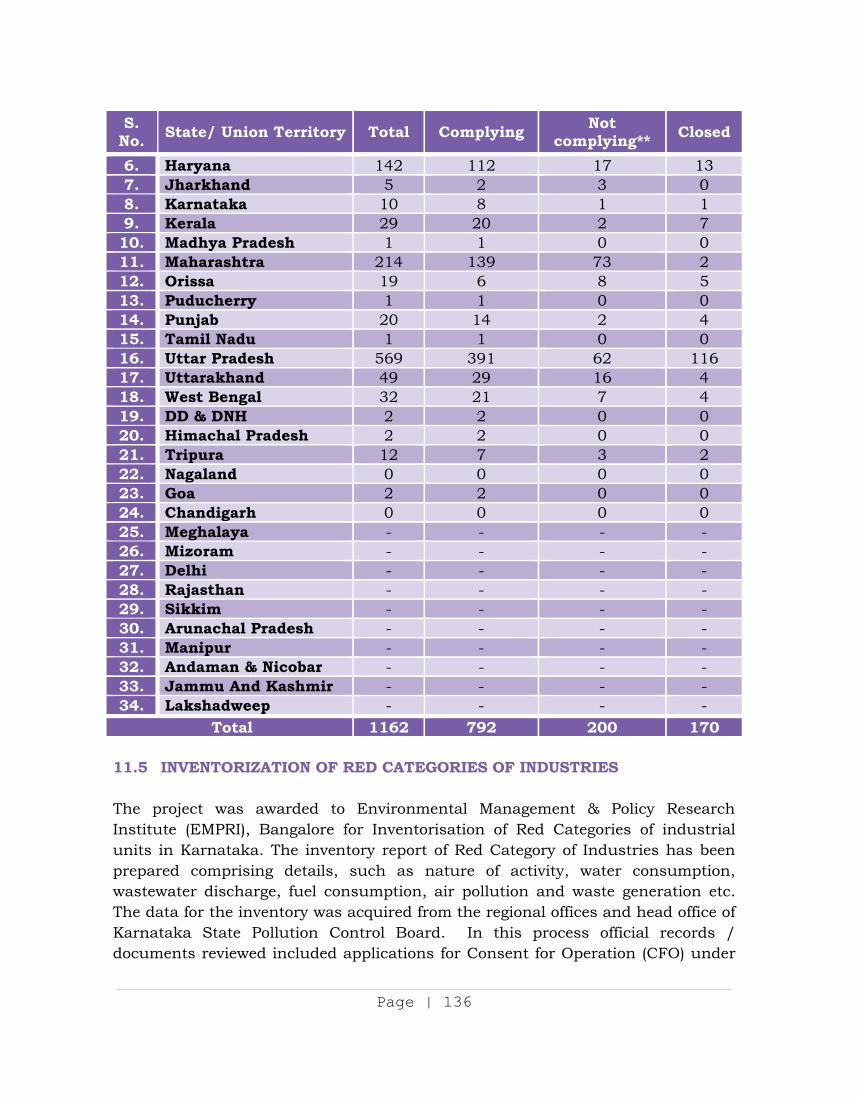
Page | 136
S. No. State/ Union Territory Total Complying Not
complying** Closed
6. Haryana 142 112 17 13 7. Jharkhand 5 2 3 0 8. Karnataka 10 8 1 1 9. Kerala 29 20 2 7 10. Madhya Pradesh 1 1 0 0 11. Maharashtra 214 139 73 2 12. Orissa 19 6 8 5 13. Puducherry 1 1 0 0 14. Punjab 20 14 2 4 15. Tamil Nadu 1 1 0 0 16. Uttar Pradesh 569 391 62 116 17. Uttarakhand 49 29 16 4 18. West Bengal 32 21 7 4 19. DD & DNH 2 2 0 0 20. Himachal Pradesh 2 2 0 0 21. Tripura 12 7 3 2 22. Nagaland 0 0 0 0 23. Goa 2 2 0 0 24. Chandigarh 0 0 0 0 25. Meghalaya - - - - 26. Mizoram - - - - 27. Delhi - - - - 28. Rajasthan - - - - 29. Sikkim - - - - 30. Arunachal Pradesh - - - - 31. Manipur - - - - 32. Andaman & Nicobar - - - - 33. Jammu And Kashmir - - - - 34. Lakshadweep - - - -
Total 1162 792 200 170 11.5 INVENTORIZATION OF RED CATEGORIES OF INDUSTRIES
The project was awarded to Environmental Management & Policy Research Institute (EMPRI), Bangalore for Inventorisation of Red Categories of industrial units in Karnataka. The inventory report of Red Category of Industries has been prepared comprising details, such as nature of activity, water consumption, wastewater discharge, fuel consumption, air pollution and waste generation etc. The data for the inventory was acquired from the regional offices and head office of Karnataka State Pollution Control Board. In this process official records / documents reviewed included applications for Consent for Operation (CFO) under
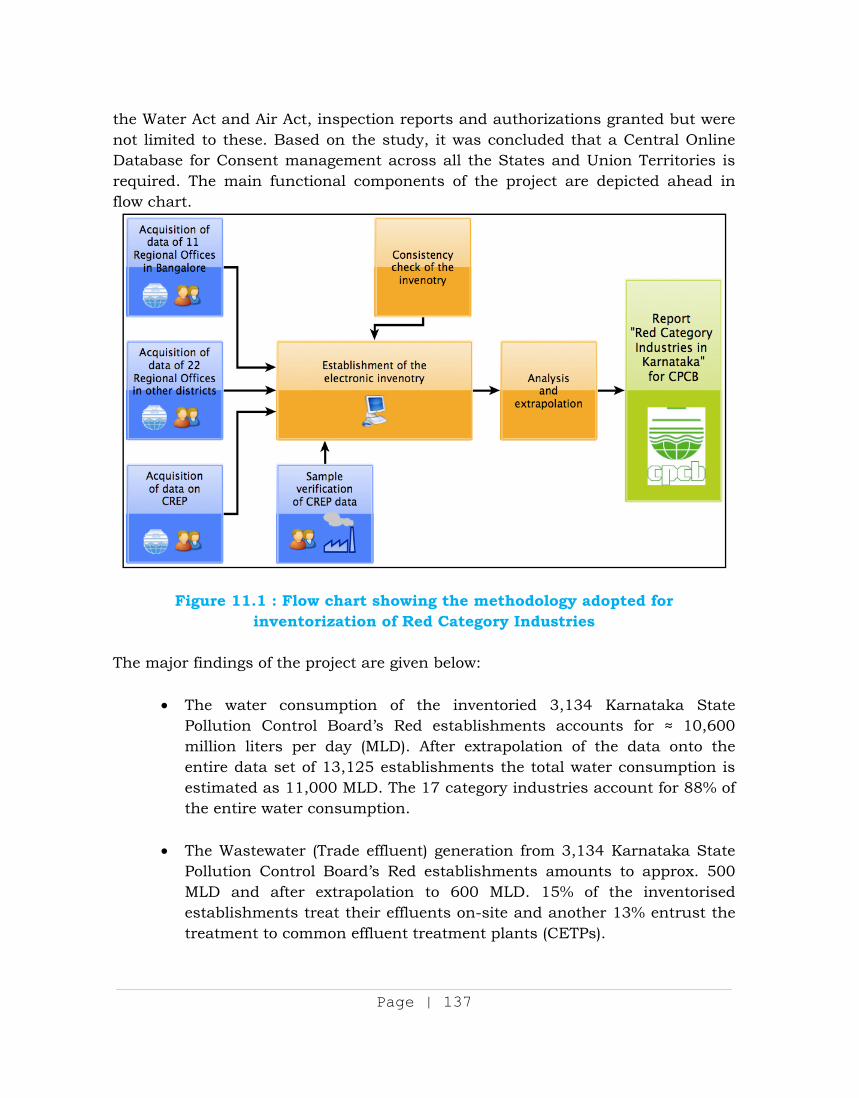
Page | 137
the Water Act and Air Act, inspection reports and authorizations granted but were not limited to these. Based on the study, it was concluded that a Central Online Database for Consent management across all the States and Union Territories is required. The main functional components of the project are depicted ahead in flow chart.
Figure 11.1 : Flow chart showing the methodology adopted for inventorization of Red Category Industries
The major findings of the project are given below:
The water consumption of the inventoried 3,134 Karnataka State
Pollution Control Board’s Red establishments accounts for 10,600 million liters per day (MLD). After extrapolation of the data onto the entire data set of 13,125 establishments the total water consumption is estimated as 11,000 MLD. The 17 category industries account for 88% of the entire water consumption.
The Wastewater (Trade effluent) generation from 3,134 Karnataka State
Pollution Control Board’s Red establishments amounts to approx. 500 MLD and after extrapolation to 600 MLD. 15% of the inventorised establishments treat their effluents on-site and another 13% entrust the treatment to common effluent treatment plants (CETPs).
Page | 138
The estimated total BOD discharge from treated effluents amount to approx. 64,000 kg per day and 190,000 kg per day of COD. Out of 33 grossly polluting establishments identified based on BOD, 28 are falling under 17 category industries.
The total estimated SO2 emissions from operating Karnataka State
Pollution Control Board’s Red establishments in Karnataka are approx. 50,000 to 75,000 MTA. NOX accounts for an estimated 81 MTA and SPM for 439 MTA.
The total waste generation for all 13,125 Karnataka State Pollution
Control Board’s Red establishments in Karnataka has been estimated to be 66,407,063 MTA. In that hazardous waste (HW) accounts for 106,561 MTA; e-waste for 88 MTA; non-hazardous industrial waste for 2,391,272 MTA, solid waste for 59,536,774 MTA; biomedical waste for 76,964 MTA; fly ash for 3,112,980 MTA; non-hazardous sludge for 1,169,574 MTA and other non-hazardous waste for 12,849 MTA.
11.6 DIRECTIONS/VERIFICATION OF COMPLIANCE OF DIRECTIONS ISSUED
UNDER SECTION 5 OF THE ENVIRONMENT (PROTECTION) ACT, 1986
11.6.1 Directions/verification of compliance of directions issued under section 5 of The Environment (Protection) Act, 1986.
Central Pollution Control Board is pursuing continuously with the State Pollution Control Boards (SPCBs)/Pollution Control Committeee (PCCs), for ensuring effective implementation and compliance to the provisions of the Bio-medical Waste (Management & Handling) Rules, 1998 and amendments made thereof. Apart from the above, CPCB in association with the respective State Pollution Control Boards carried out random inspections and monitoring the HCFs as well as CBWTFs to assess the status of compliance. Based on such inspections and monitoring five (5) show Cause Directions, twelve (12) confirmed directions & two (2) closure directions under Section 5 of E(P) Act, 1986 were issued to CBWTFs / HCFs, located in the States of Andhra Pradesh, Bihar, Gujarat, Karnataka, Madhya Pradesh, Orissa, Rajashthan, Tamilnadu & Uttar Pradesh for violations of the provisions of BMW Rules and CPCB Guidelines. Bank guarantees of Five (05) Lakhs in case of HCFs and Ten (10) Lakhs in case of CBWTFs, were sought for compliance to CPCB Directions. Upon receipt of the confirmation with regard to the compliance to the directions issued under Section 5 of the E (P) Act, 1986 from the respective HCF/CBWTF,
Page | 139
verification of compliance to the directions is carriedout either by CPCB (HQ) or through its Zonal Offices. During the financial year 2010-2011, inspections for verification of compliance were carried out in nine (9) nos of HCFs/CBWTFs. 11.6.2 Direction issued under Section 5 of the Environment (Protection) Act,
1986 and section 18(1) (b) of The Water (Preventation and Control of Pollution) Act, 1974 to Small Scale Industries (SSI) and Common Effluent Treatment Plants (CETPs)
Central Pollution Control Board issued directions for closure to four small scale industries under Section 5 of The Environment (Protection) Act, 1986 during the year. Directions were also issued to two Common Effluent Treatment Plants (CETPs) and six small scale industries under Section 5 of The Environment (Protection) Act 1986. The directions were also issued under Section 18 (1) (b) of the Water (Prevention and Control of Pollution) Act, 1974 to concerned SPCBs with reference to seven Common Effluent Treatment Plants and five small scale industries.
11.7 HON’BLE COURT CASES FOLLOW UP & INVESTIGATIONS AS PER
COURTS DIRECTIVES
11.7.1 Court Cases Follow up
Following Court cases are filed at various courts, wherein the Central Pollution Control Board is one of the respondents. The counter affidavits have been filled before the Hon’ble courts.
o Delhi High Court:
i. PIL No. 9337 of 2009: CHETNA Vs Union of India & Ors.; ii. Writ Petition (C) no. 12719 of 2009: Indian Spinal Injury hospital Vs
Union of India & Ors.; iii. Writ Petition (C) no. 13675/2009: Bijvasan Gram Vikas Samiti & Ors.
Vs Union of India & Ors.;
o Allahabad High Court:
W.P No. 801(M/B) of 2010 (Ranveer Singh Vs State of UP and Others), CMWP No.25835/10 (Govind Giri Vs State of UP and Others), CMWP No. 70485 of 2010 (People’s Resources and Women Advocacy
Society, ”Prawas” Vs State of UP and others), CMWP No.26025 of 2006 (Rania Industrial Associations Vs
Chairman,National Highway Authority of India and Others), PIL No.4003 of 2006 (Re: Ganga Pollution),

Page | 140
CMWP No.5526 of 2010(M/B) (Ranjeet Kumar and Others Vs State of UP and Others),
WP No. 9310 (M/B) of 2010 (Ravindra Bahadur Singh Vs UP Pollution Control Board and Others),
11.7.2 Investigations as per Hon’ble Courts Directives Consequent upon direction of Hon’ble High court in Public Interest Litigation No. 4003 of 2006, in the case Ganga Pollution v/s State of U.P. and others, dated 08.12.2010, the series of investigations have been carried out by Central Pollution Control Board, Zonal Office- Lucknow. The investigations were focused on following issues:
1. Ascertaining reason for discharge of chromium 2. Functioning of CETP and STPs at Kanpur 3. Concrete solution to ensure that waste/dirty water does not enter in river Ganga at Kanpur 4. Fixing responsibilities for the situation noticed
In order to execute the above court directives, monitoring was undertaken for the following:
• Performance evaluation of 5 Million Liter Per Day (MLD) Sewage
Treatment Plant (STP) at Jajmau, Kanpur
• Performance evaluation of 36 MLD Common Effluent Treatment Plant
(CETP) at Jajmau, Kanpur
• Performance evaluation of 130 MLD STP at Jajmau, Kanpur
• Status of operation in Conveyance Network for Tannery wastewater
• Performance of different plants is summarized as per below:
The Affidavit based on the comprehensive investigations, observations and facts ascertained had been filed in the Hon’ble Court. 11.8 PUBLIC COMPLAINTS/VIP COMPLAINTS INVESTIGATIONS/FOLLOW UP
Large numbers of complaints on various subjects have been received by Central Pollution Control Board, most of them complaints were forwarded to concern State Pollution Control Board for investigations. The six complaint cases in Uttar Pradesh have been investigated during the year & suitable action has been taken.
Page | 141
With respect to issues raised by Hon’ble MP, Mrs. Annu Tandon in her letter addressed to Hon’ble Minister of Environment & Forests, Govt. of India. The Central Board has undertaken investigations at Unnao city to verify the facts and report has been submitted to the Government.
11.8.1 Pollution Caused By M/S Chunar Cement Factory, Chunar (U. P.)
Ministry of Environment & Forests, Govt. of India forwarded the complaint and matter raised during zero hour in Lok Sabha by Sh. Bal Kumar Patel, Hon'ble Member of Parliament regarding pollution caused by M/s Chunar Cement Factory, Chunar, Uttar Pradesh (A Division of J.P. Associates Ltd.). The inspection of the unit and monitoring was undertaken by Central Pollution Control Board, Zonal Office - Lucknow. The following are the recommendations based on the investigations:
• Unit should store all clinker and gypsum in the stockpiles and silo, which was found stored in open area.
• Properly covered shed should be made for Gypsum storage to avoid leaching during rainy season and to reduce fugitive emission.
• Suitable measures should be taken for control of fugitive emission in the unloading and storage area. Housekeeping should be improved by the unit
• All the leakage of the joints should be checked periodically, so that dust emissions are reduced. It will also restrict loss of final product.
• Effort should be made by the unit for rain water harvesting in order to conserve water.
11.8.2 Investigations on Fish Mortality at Shukratal. Muzaffarnagar, Uttar
Pradesh
Central Pollution Control Board, Delhi received public complaint on fish mortality incidence occurred in River Ganga at Shukratal, Muzaffarnagar, Uttar Pradesh. The area was inspected by Central Pollution Control Board, Zonal Office - ,Lucknow along with Uttarakhand EPPCB, Haridwar to check the pollution control measures adopted by the units/industries in the vicinity which may be discharging their effluent into River Ganga or tributaries of River Ganga and likely to be causing factor for such incidents. The incident of fish mortality on 11th July 2010 at Shukratal, Muzaffarnagar might have occured either due to agriculture field’s rain water run-off finding its way to Shukratal. The presence of pesticides / fertilizers can not be ruled out in first rain water run-off or may be due to personal interest of anti social elements.
Page | 142
11.8.3 Pollution Caused By M/S S. S. Medical Pvt. Ltd. Faizabad (UP) Ministry of Environment and Forests forwarded complaint received from Sh. Rohit Sabharwal, President, Anti Corruption & Crime Investigation Cell (Regd.), Kundan Bhawan, Ludhiana, Punjab regarding violation of Bio-Medical Waste (Management & Handling) Rules, 1998 by M/s S. S. Medical Pvt.Ltd. Faizabad (Uttar Pradesh). The said facility / unit was inspected by Central Pollution Control Board, Zonal Office-Lucknow along with officials of Uttar Pradesh Pollution Control Board to check the pollution control measures adopted by the unit. During the inspection, the unit was not in operation. The following are the recommendations based on investigations:
• The waste water generated by the unit should be treated properly in
Effluent Treatment Plant.
• The unit should ensure compliance of Bio-Medical Waste (Management &
Handling) Rules, 1998.
• The unit should collect, handle and dispose Sharp Waste properly. No
Sharp Waste should be placed / spread in open place.
• The unit should make proper record of Bio-Medical Waste collection,
Handling, Transportation and Treatment.
11.8.4 Inspection of M/S Sandeep Paper Mills (P) Ltd., Noida, UP
The complaint has been received at Central Pollution Control Board from Sh. Surender Bhatti, Sector 34, Noida against M/s Sandeep Paper Mills (P) Ltd., A-20, Sector – VI, Noida, Uttar Pradesh causing pollution problem. The surprise inspection of the industry was undertaken and following was recommended
• Primary and Secondary Clarifiers should be repaired.
• Sludge from the aeration tank should be removed.
• Scraps from the sludge drying beds should be removed and proper beds
(layers) should be made.
• The industry should install pulp recovery system for better results.
• The shed covered around the stack should be removed to have a proper
working area for stack monitoring.
• The industry should upgrade / modify its ETP and ensure that the
treated effluent meets the stipulated standards.
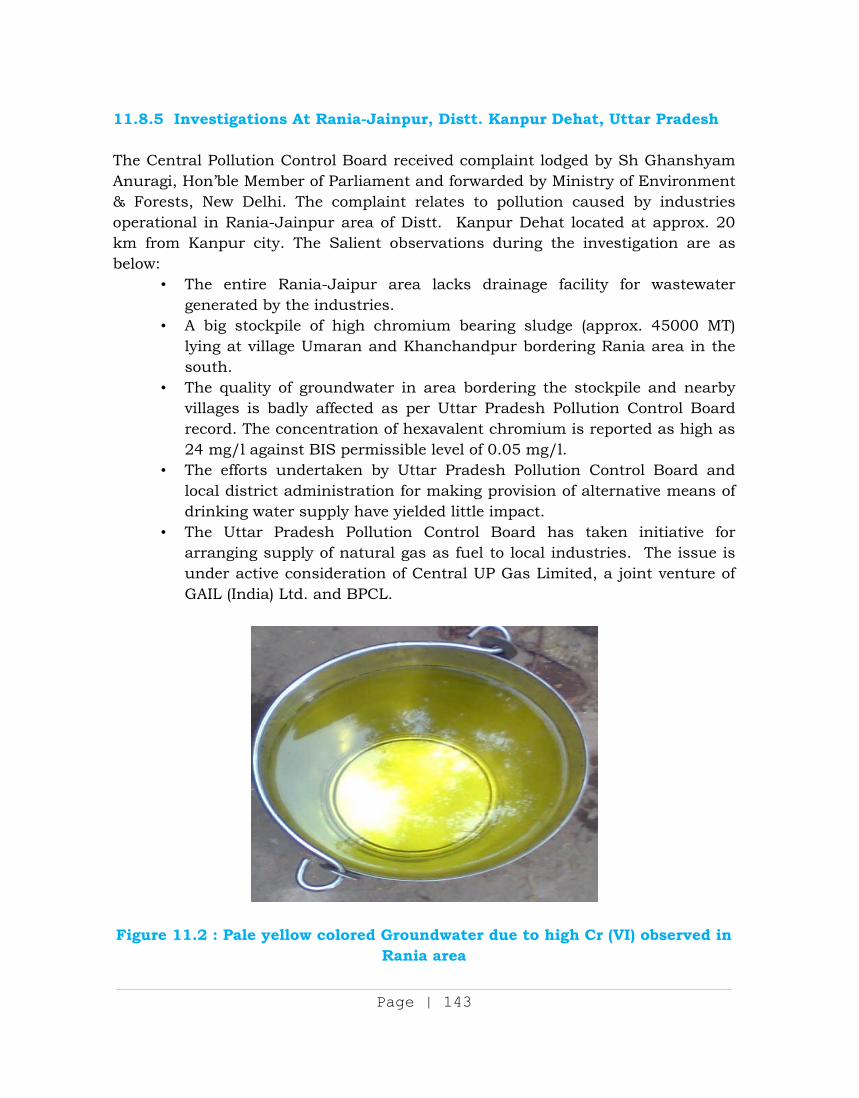
Page | 143
11.8.5 Investigations At Rania-Jainpur, Distt. Kanpur Dehat, Uttar Pradesh
The Central Pollution Control Board received complaint lodged by Sh Ghanshyam Anuragi, Hon’ble Member of Parliament and forwarded by Ministry of Environment & Forests, New Delhi. The complaint relates to pollution caused by industries operational in Rania-Jainpur area of Distt. Kanpur Dehat located at approx. 20 km from Kanpur city. The Salient observations during the investigation are as below:
• The entire Rania-Jaipur area lacks drainage facility for wastewater generated by the industries.
• A big stockpile of high chromium bearing sludge (approx. 45000 MT) lying at village Umaran and Khanchandpur bordering Rania area in the south.
• The quality of groundwater in area bordering the stockpile and nearby villages is badly affected as per Uttar Pradesh Pollution Control Board record. The concentration of hexavalent chromium is reported as high as 24 mg/l against BIS permissible level of 0.05 mg/l.
• The efforts undertaken by Uttar Pradesh Pollution Control Board and local district administration for making provision of alternative means of drinking water supply have yielded little impact.
• The Uttar Pradesh Pollution Control Board has taken initiative for arranging supply of natural gas as fuel to local industries. The issue is under active consideration of Central UP Gas Limited, a joint venture of GAIL (India) Ltd. and BPCL.
Figure 11.2 : Pale yellow colored Groundwater due to high Cr (VI) observed in Rania area
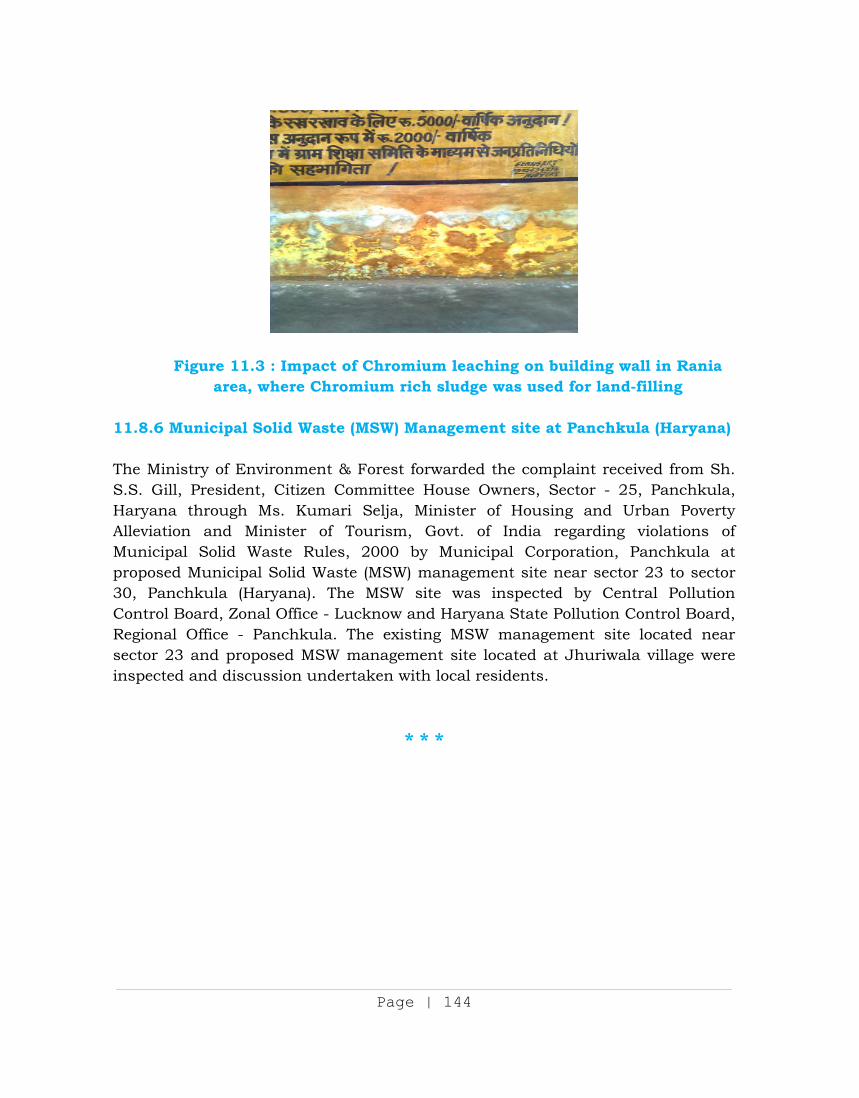
Page | 144
Figure 11.3 : Impact of Chromium leaching on building wall in Rania area, where Chromium rich sludge was used for land-filling
11.8.6 Municipal Solid Waste (MSW) Management site at Panchkula (Haryana)
The Ministry of Environment & Forest forwarded the complaint received from Sh. S.S. Gill, President, Citizen Committee House Owners, Sector - 25, Panchkula, Haryana through Ms. Kumari Selja, Minister of Housing and Urban Poverty Alleviation and Minister of Tourism, Govt. of India regarding violations of Municipal Solid Waste Rules, 2000 by Municipal Corporation, Panchkula at proposed Municipal Solid Waste (MSW) management site near sector 23 to sector 30, Panchkula (Haryana). The MSW site was inspected by Central Pollution Control Board, Zonal Office - Lucknow and Haryana State Pollution Control Board, Regional Office - Panchkula. The existing MSW management site located near sector 23 and proposed MSW management site located at Jhuriwala village were inspected and discussion undertaken with local residents.
* * *
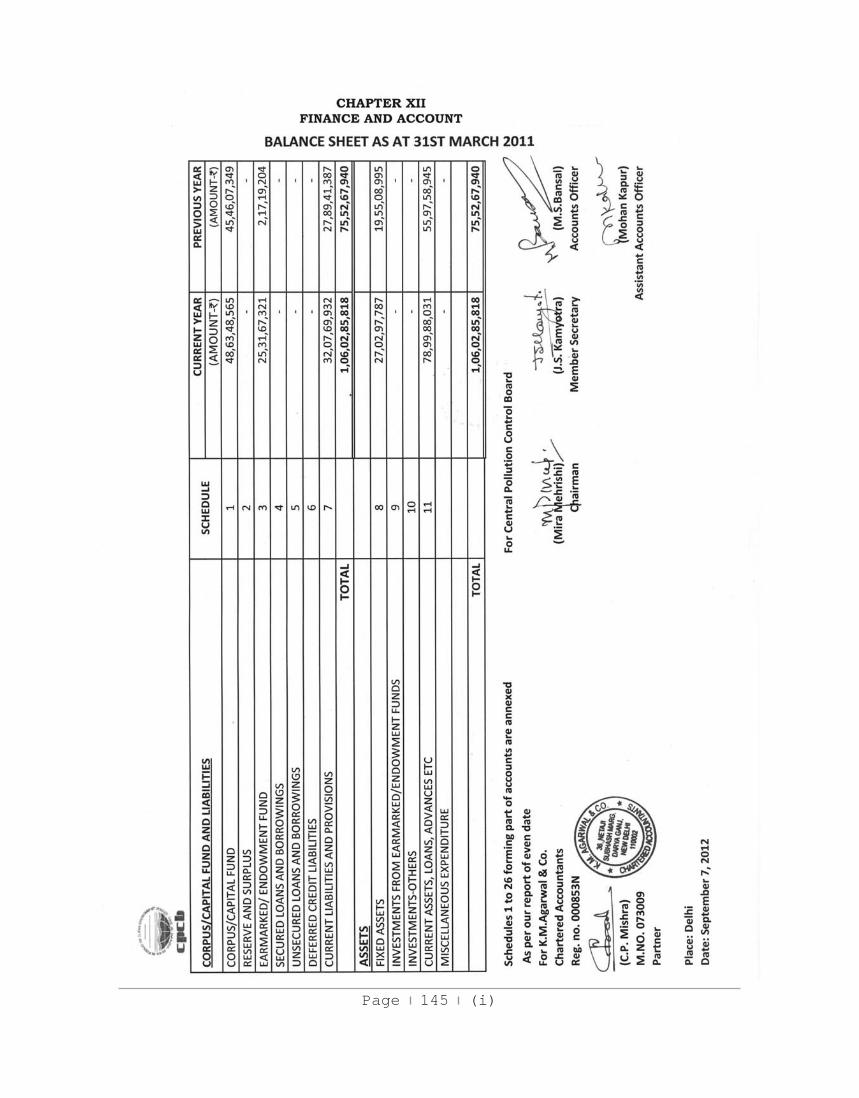
Page 145 (i)
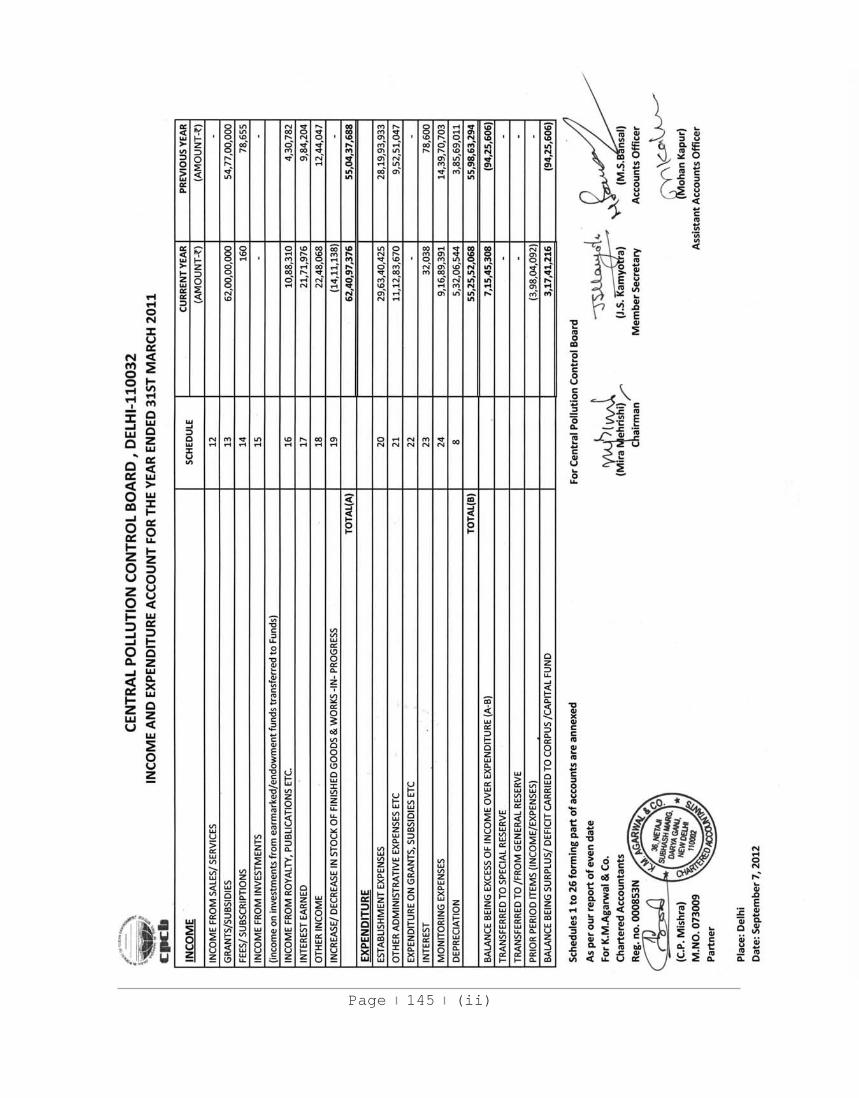
Page 145 (ii)
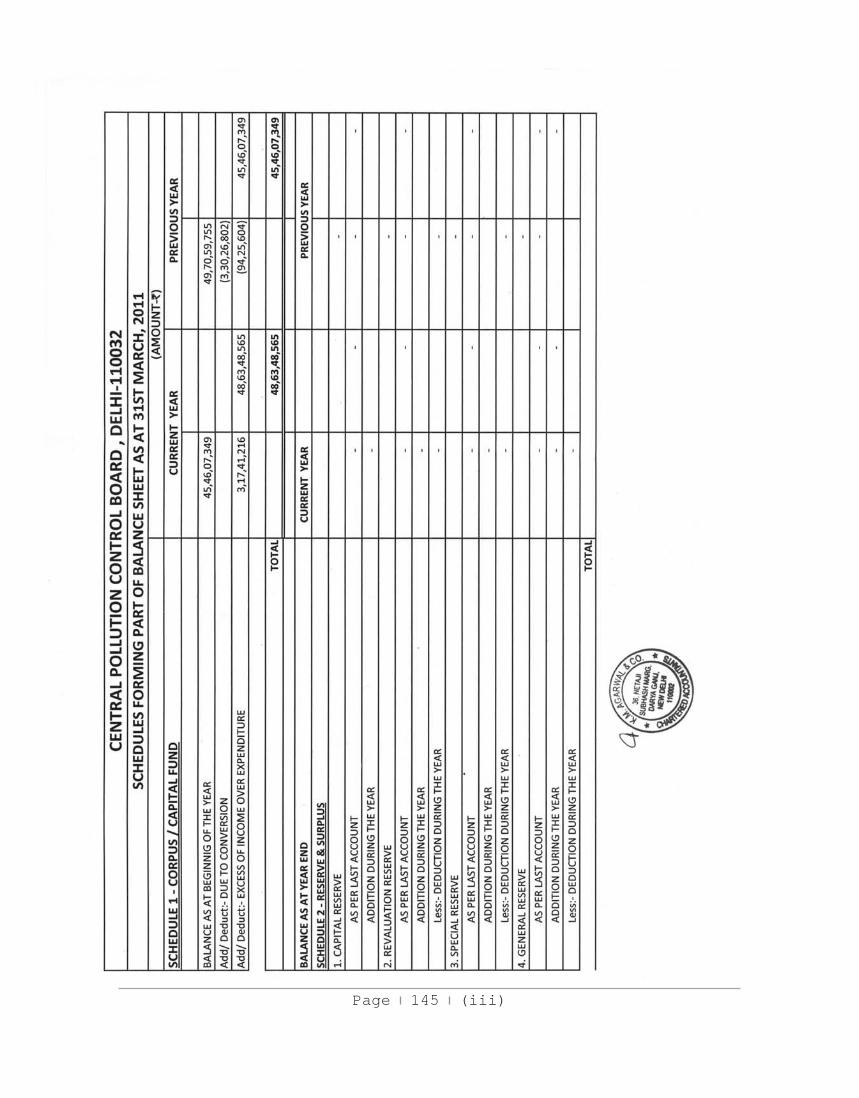
Page 145 (iii)
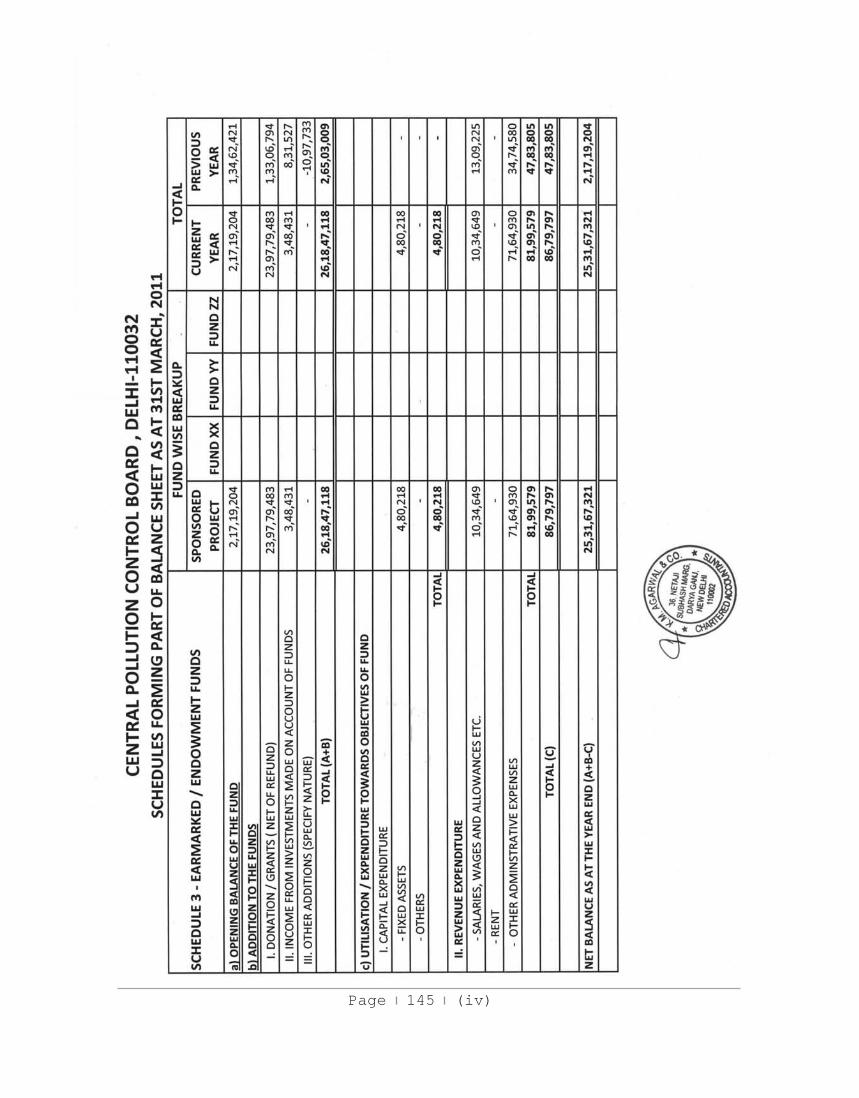
Page 145 (iv)
Page 145 (v)
Page 145 (vi)
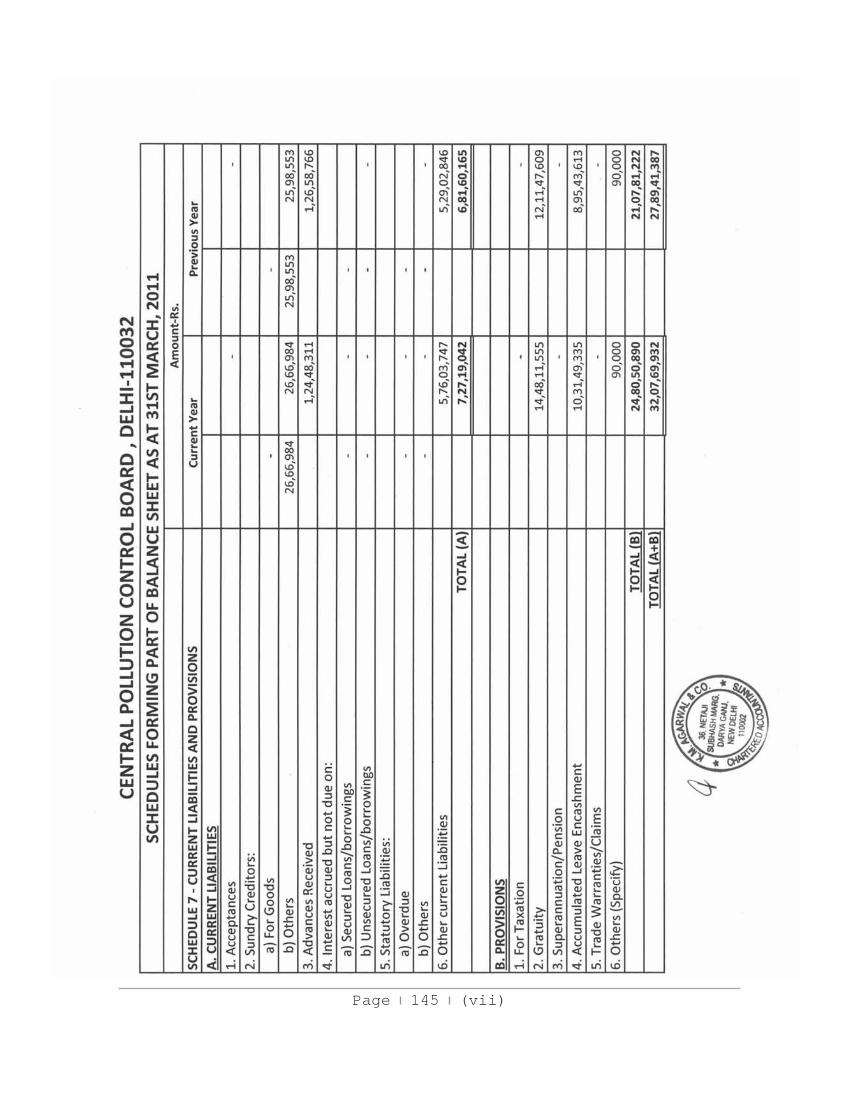
Page 145 (vii)
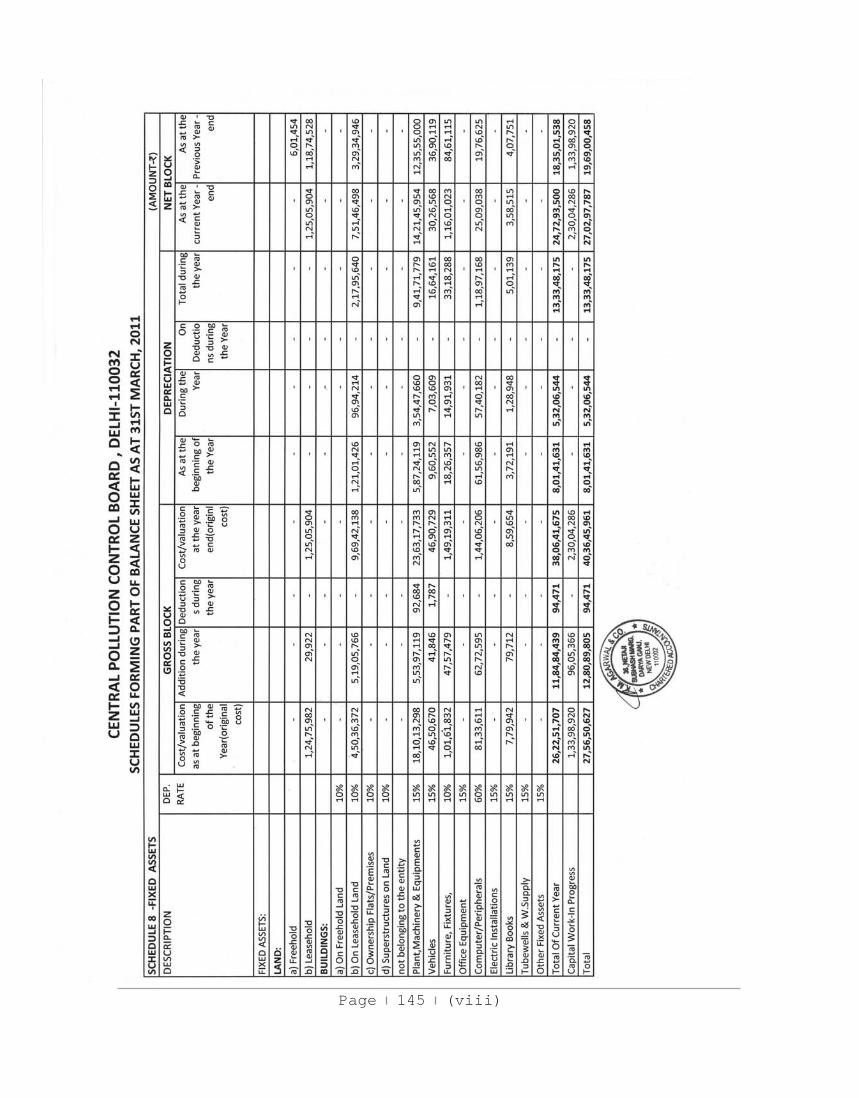
Page 145 (viii)
Page 145 (ix)
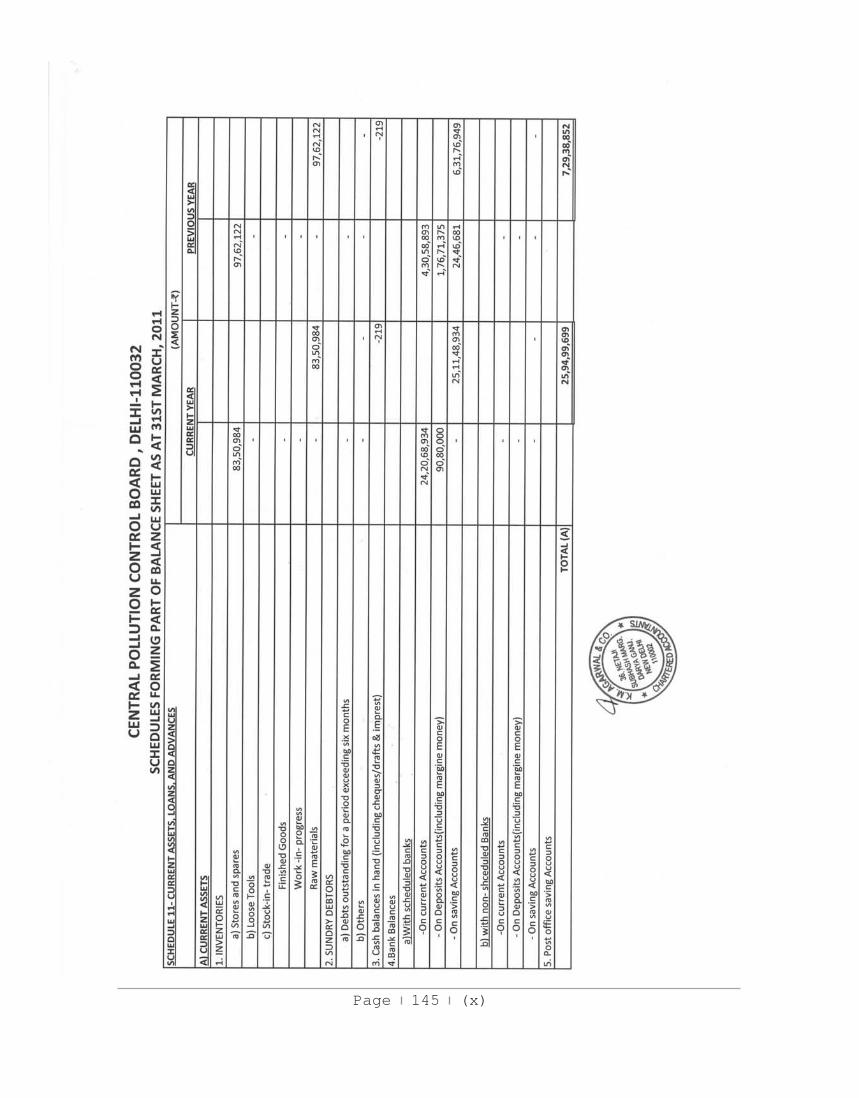
Page 145 (x)
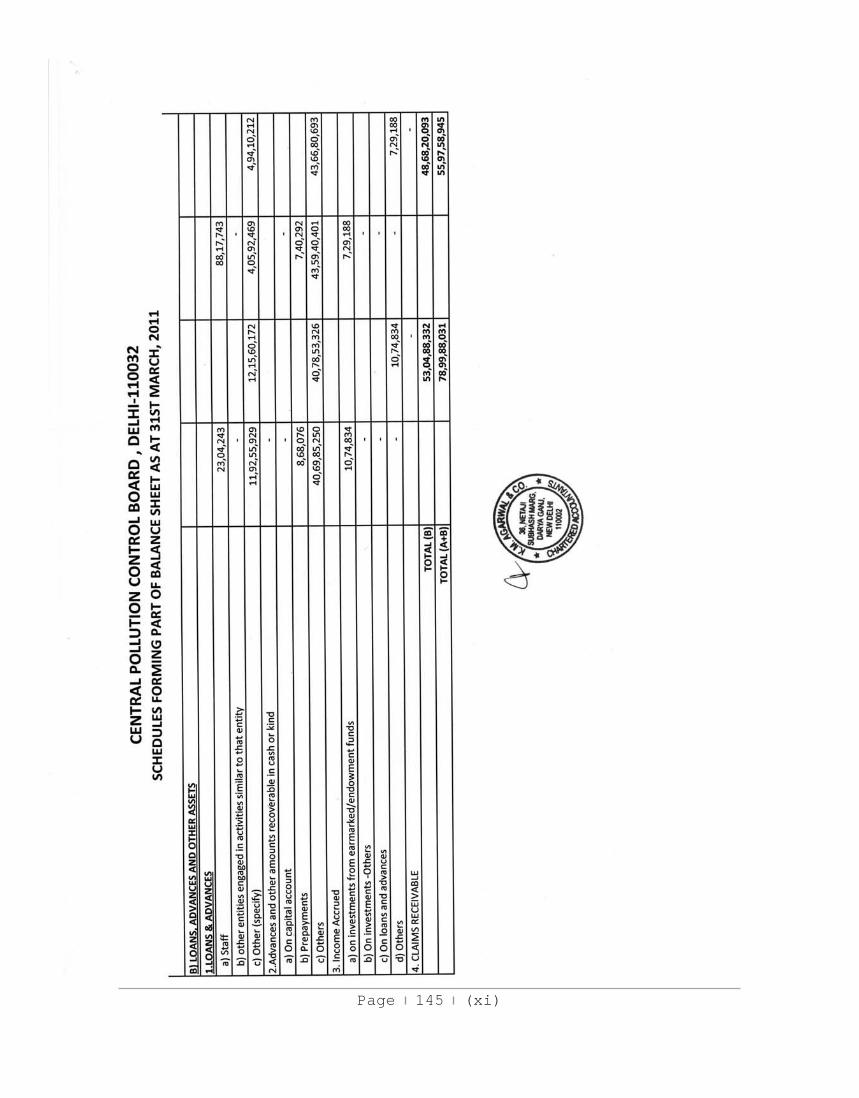
Page 145 (xi)
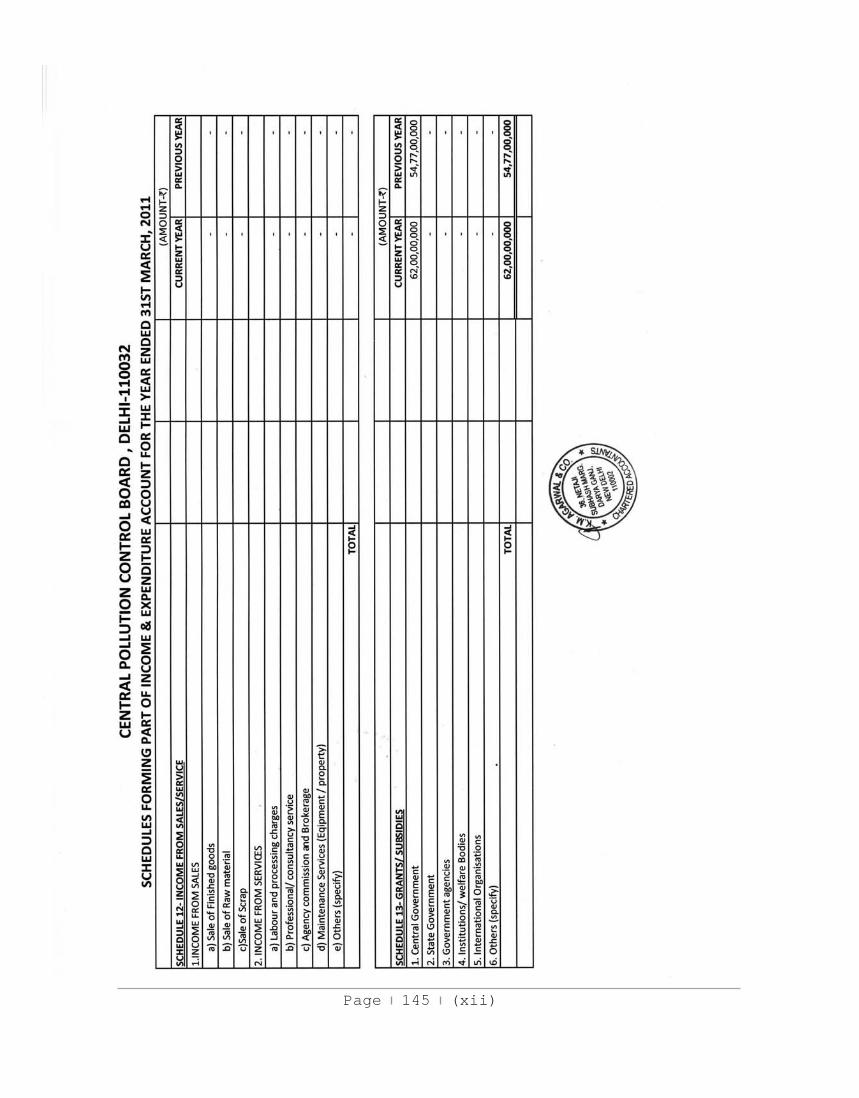
Page 145 (xii)
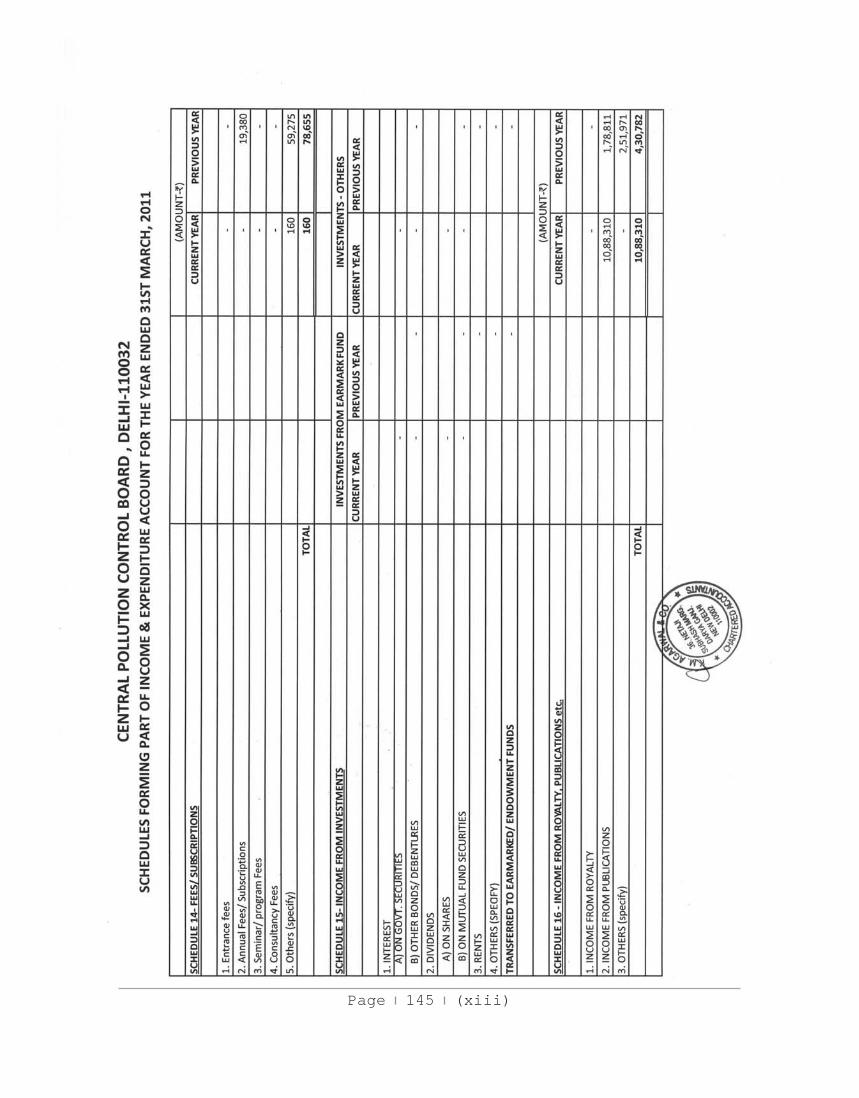
Page 145 (xiii)
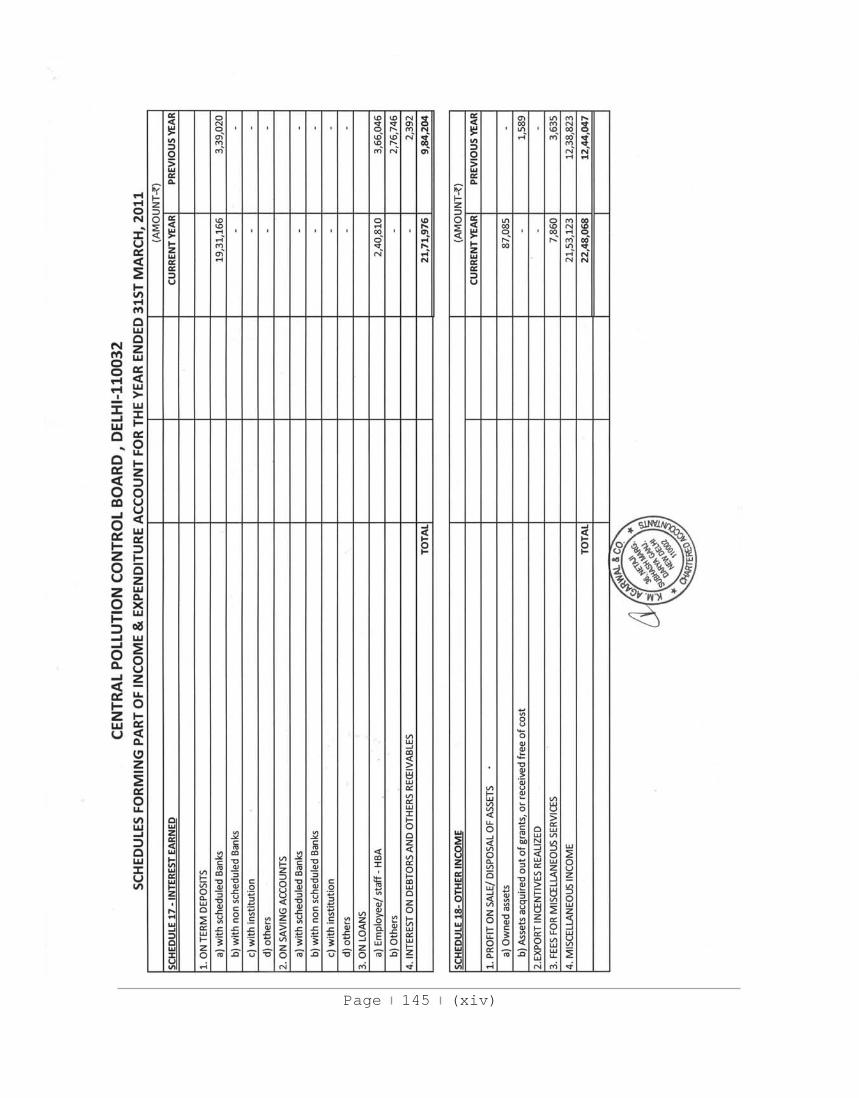
Page 145 (xiv)
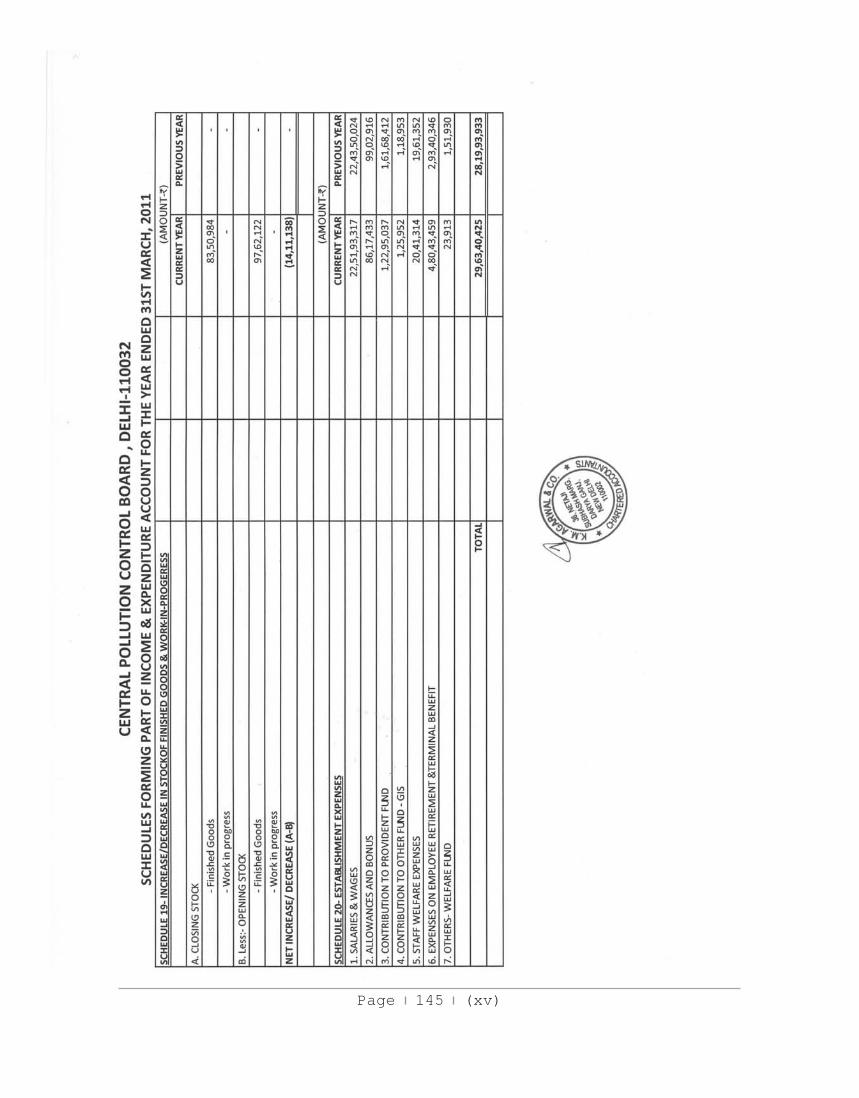
Page 145 (xv)
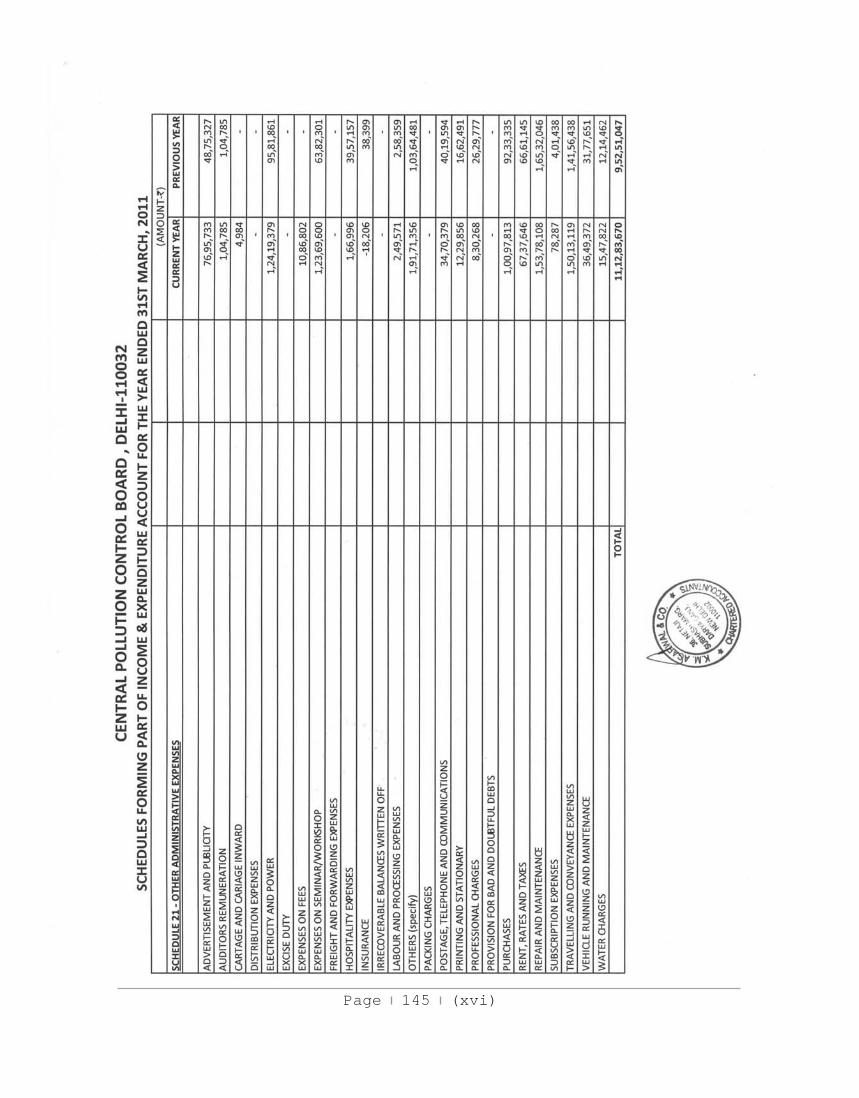
Page 145 (xvi)
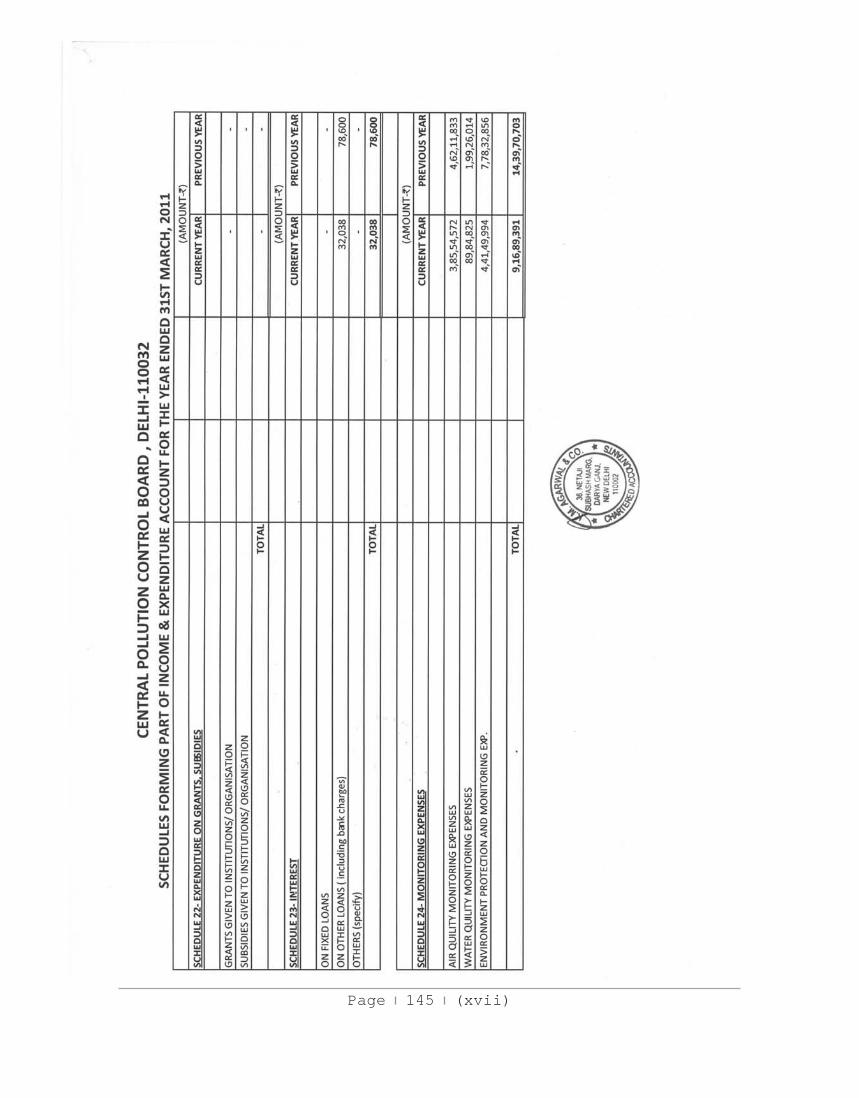
Page 145 (xvii)
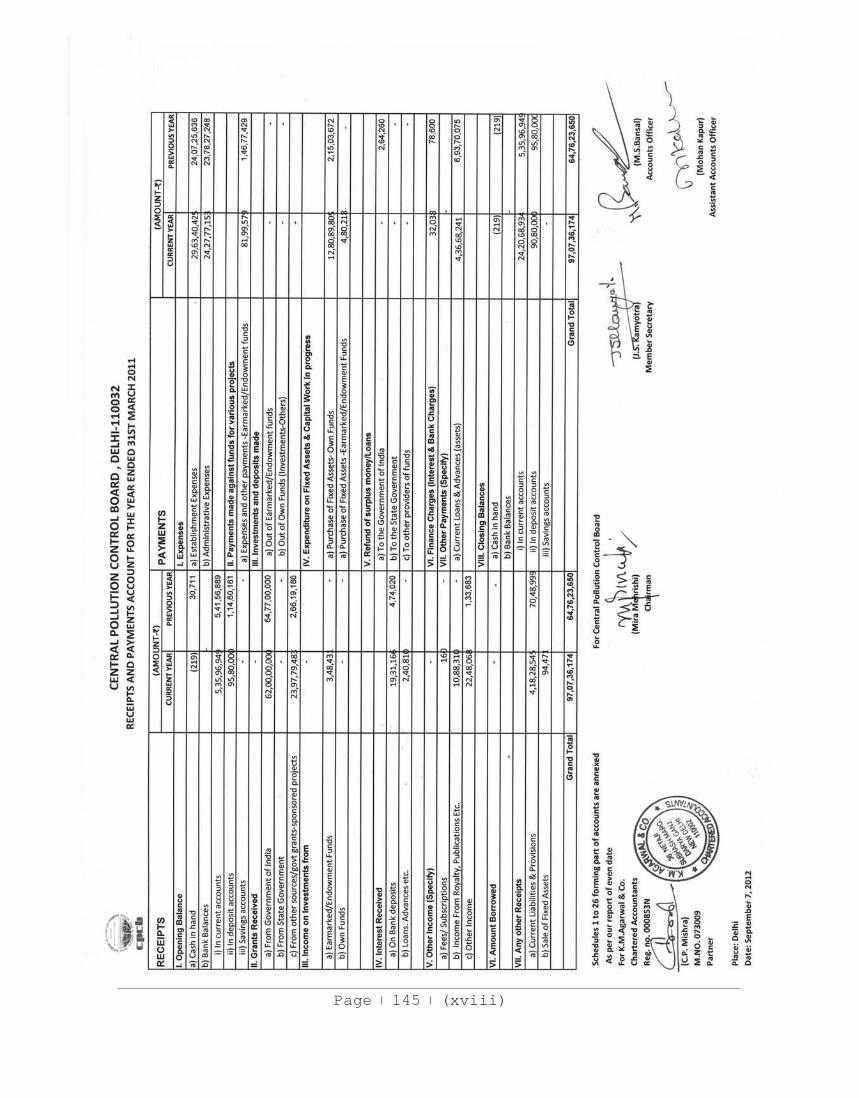
Page 145 (xviii)
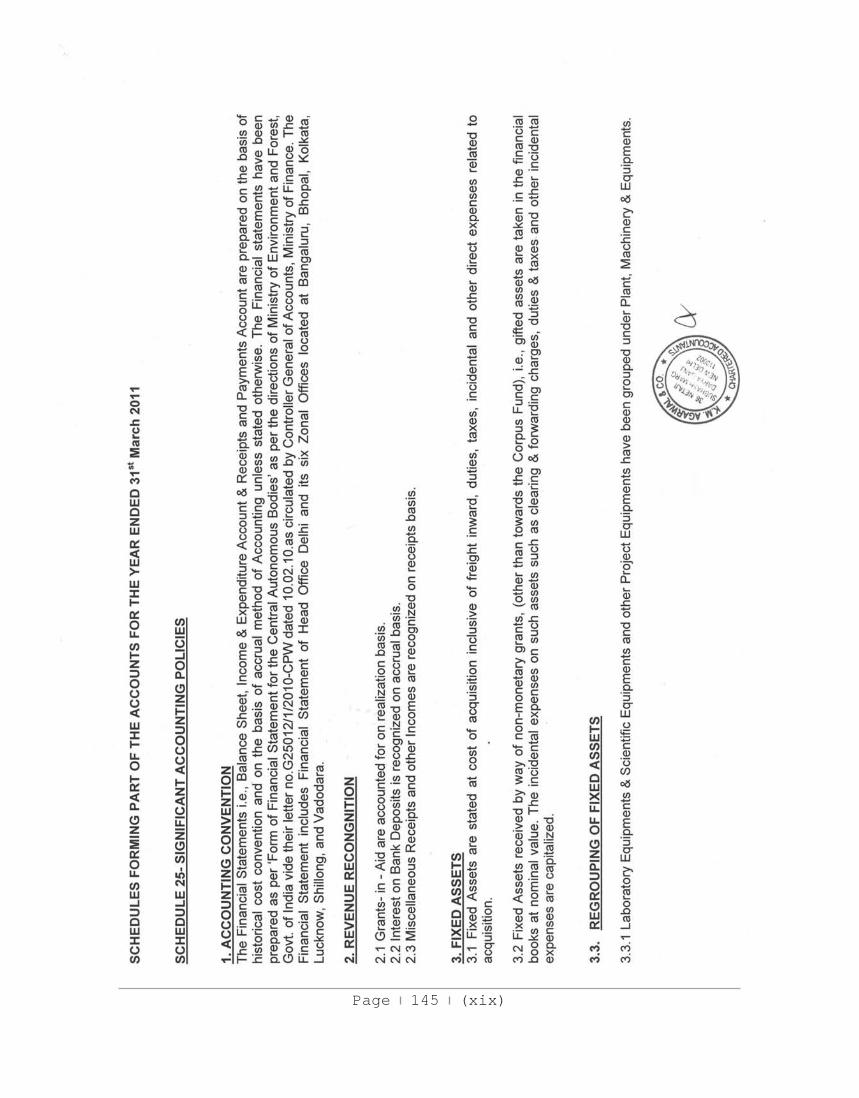
Page 145 (xix)
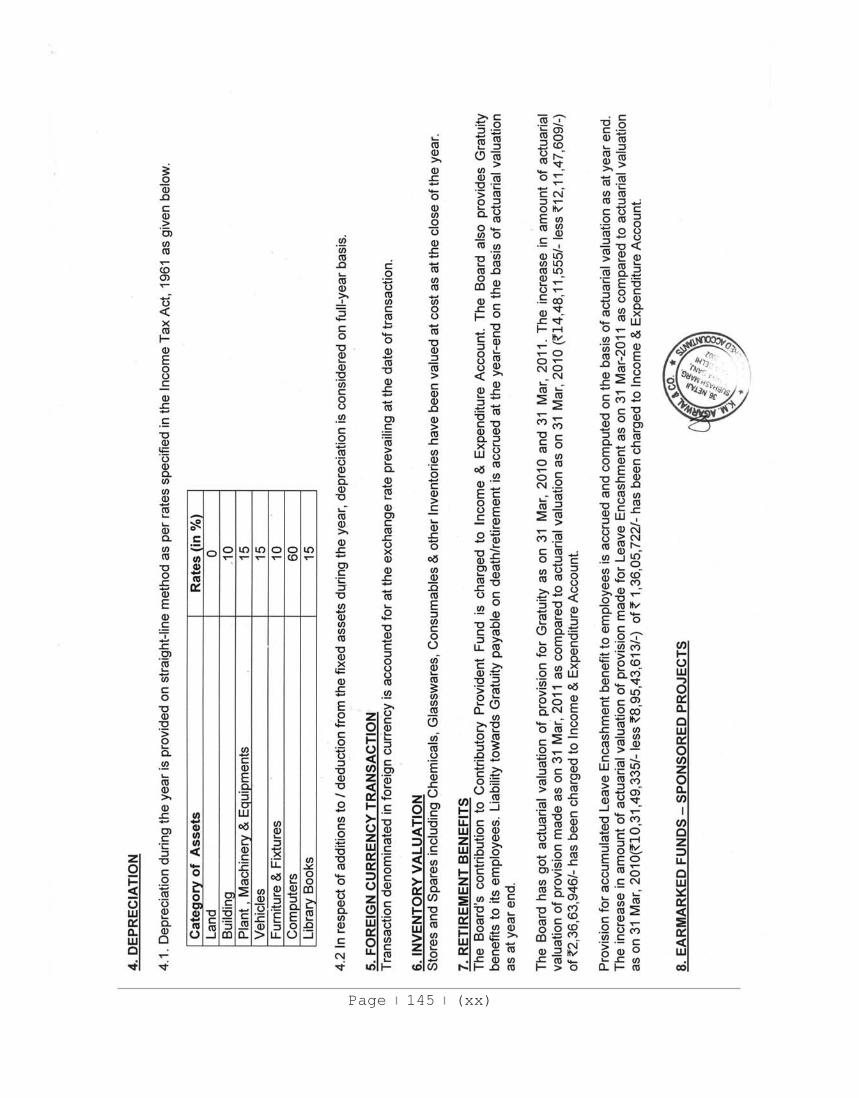
Page 145 (xx)
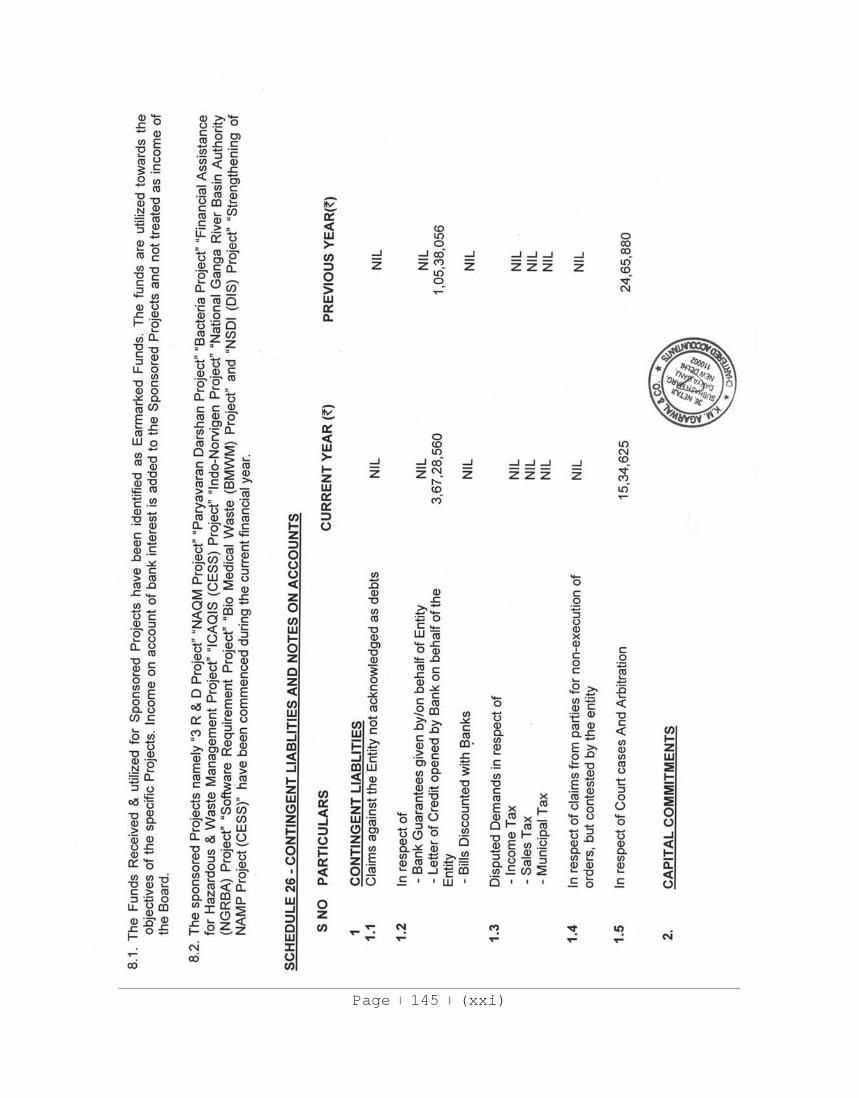
Page 145 (xxi)
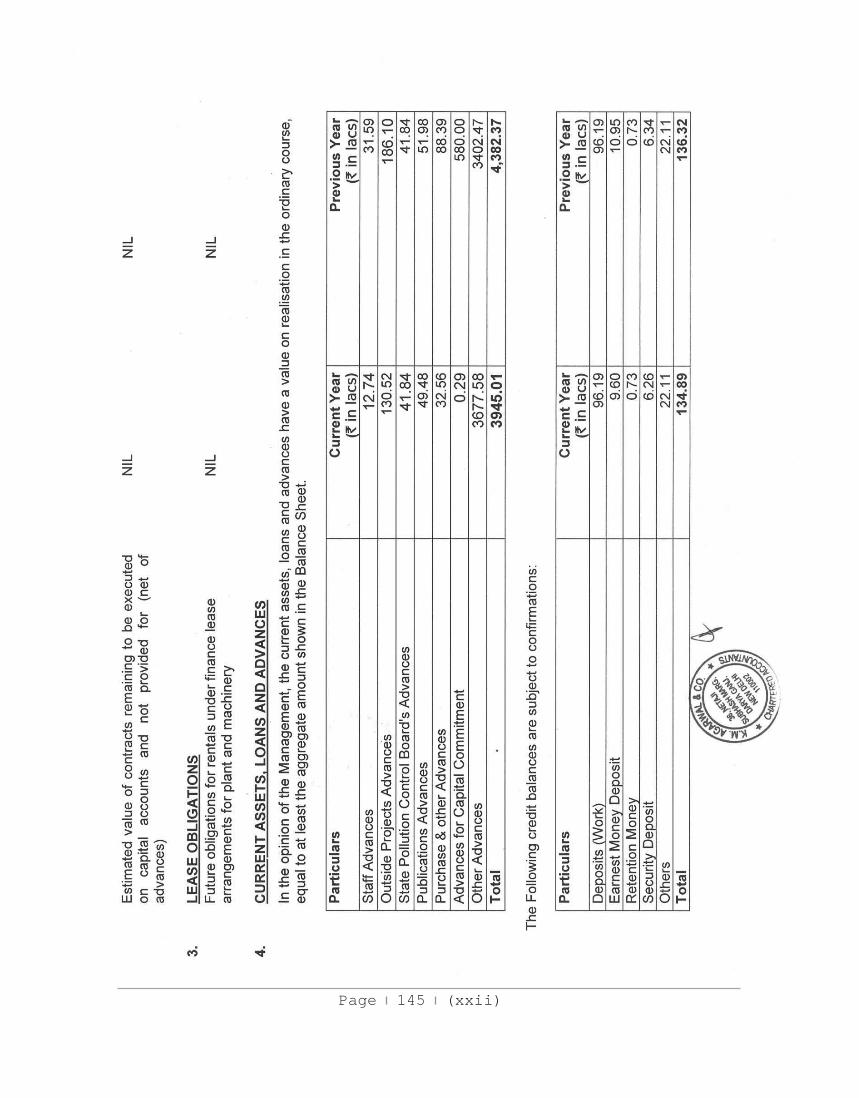
Page 145 (xxii)
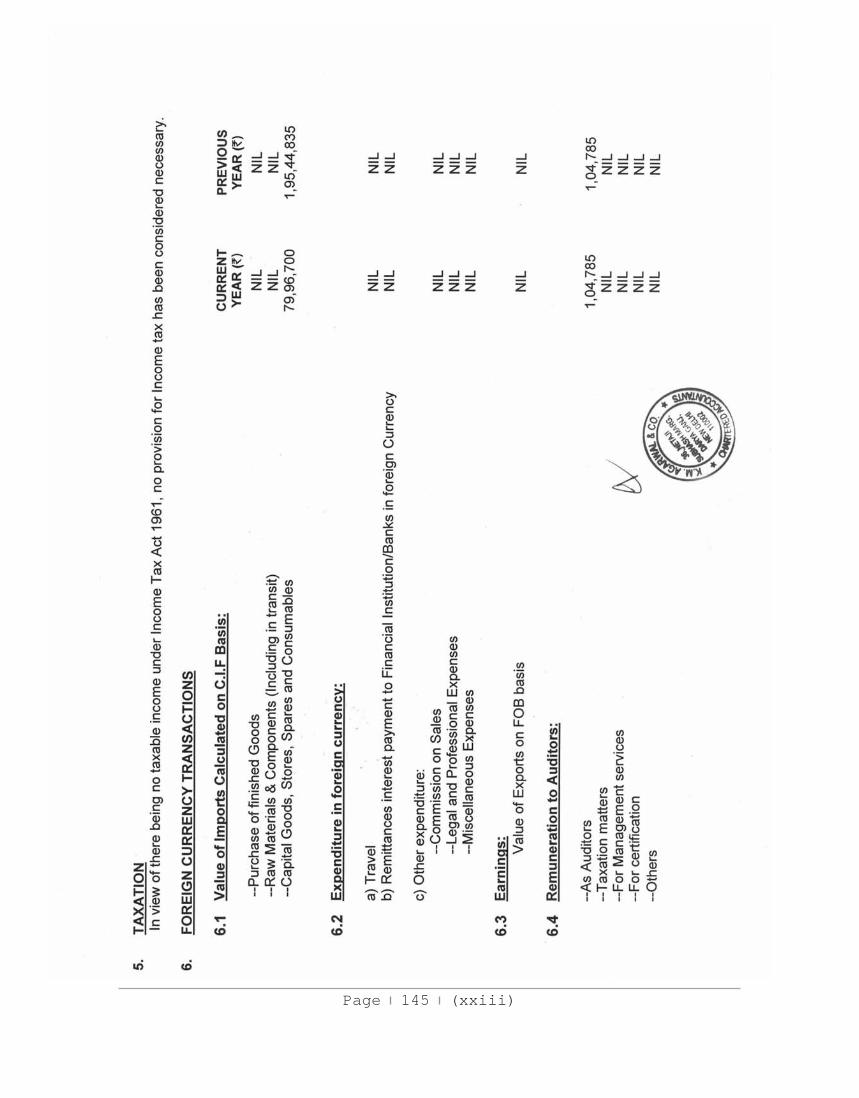
Page 145 (xxiii)
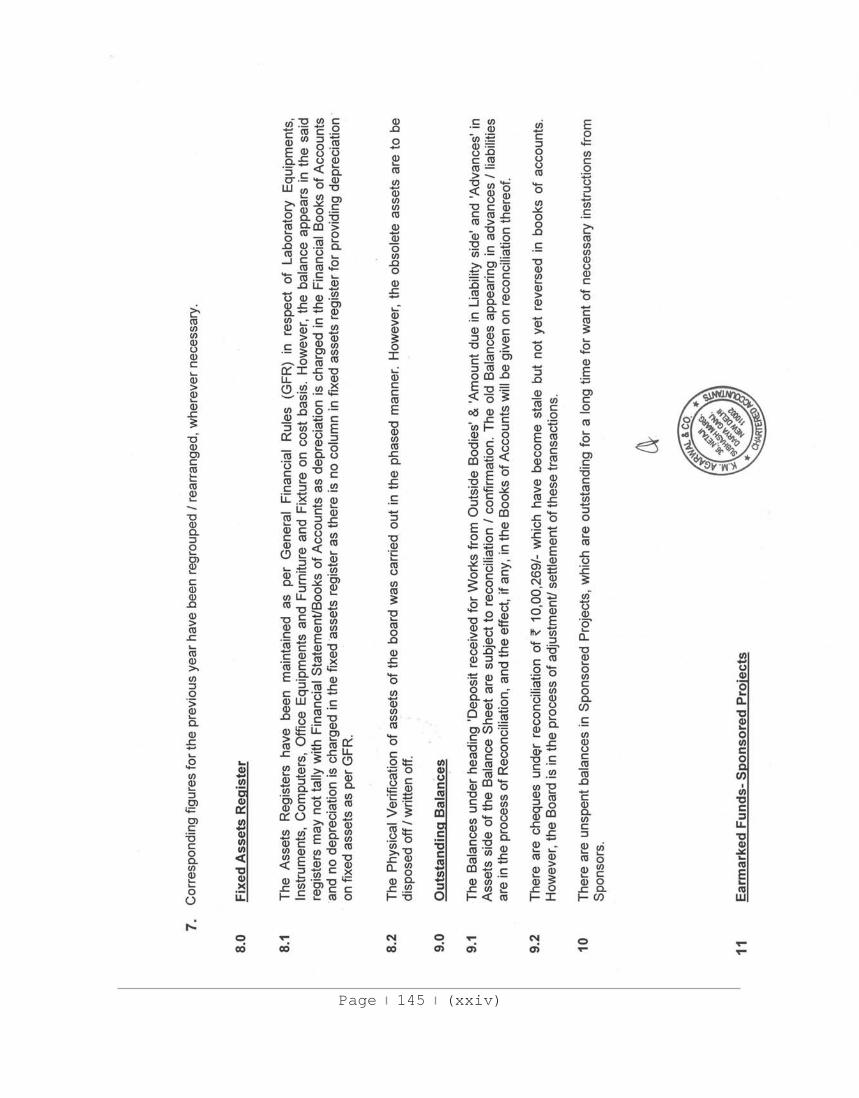
Page 145 (xxiv)
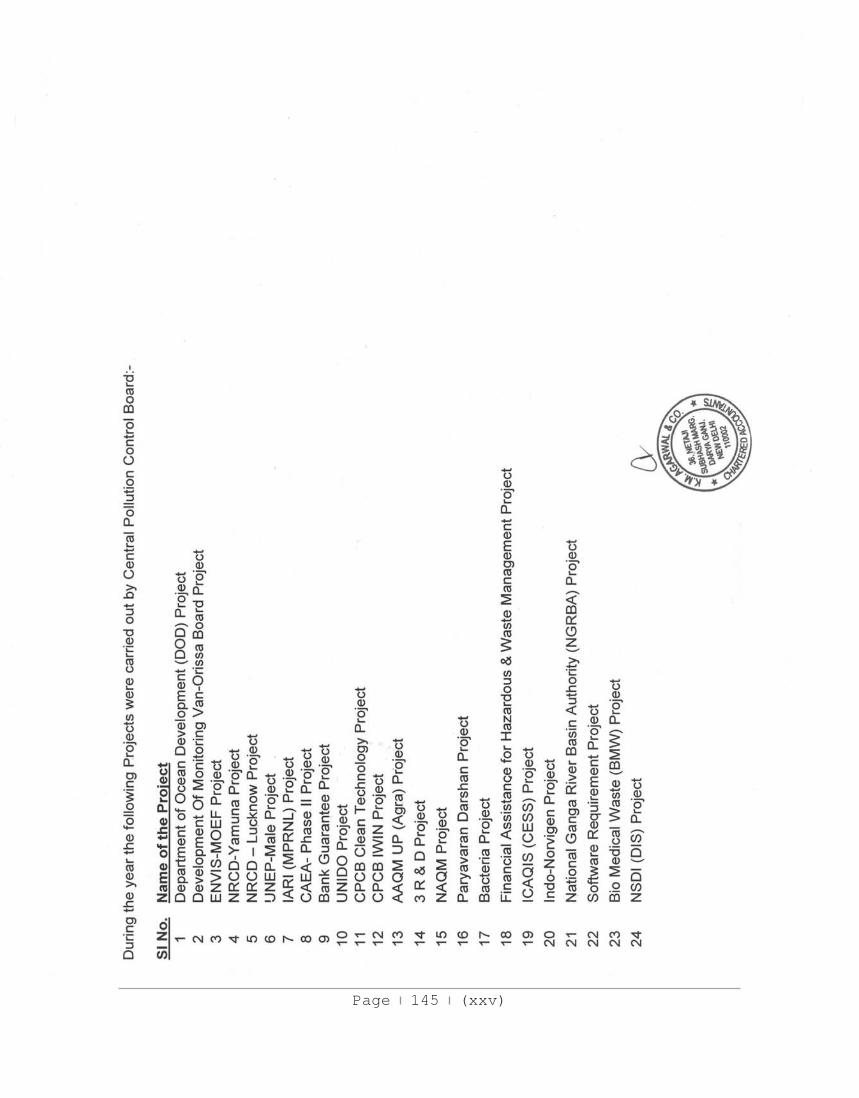
Page 145 (xxv)
Page 145 (xxvi)
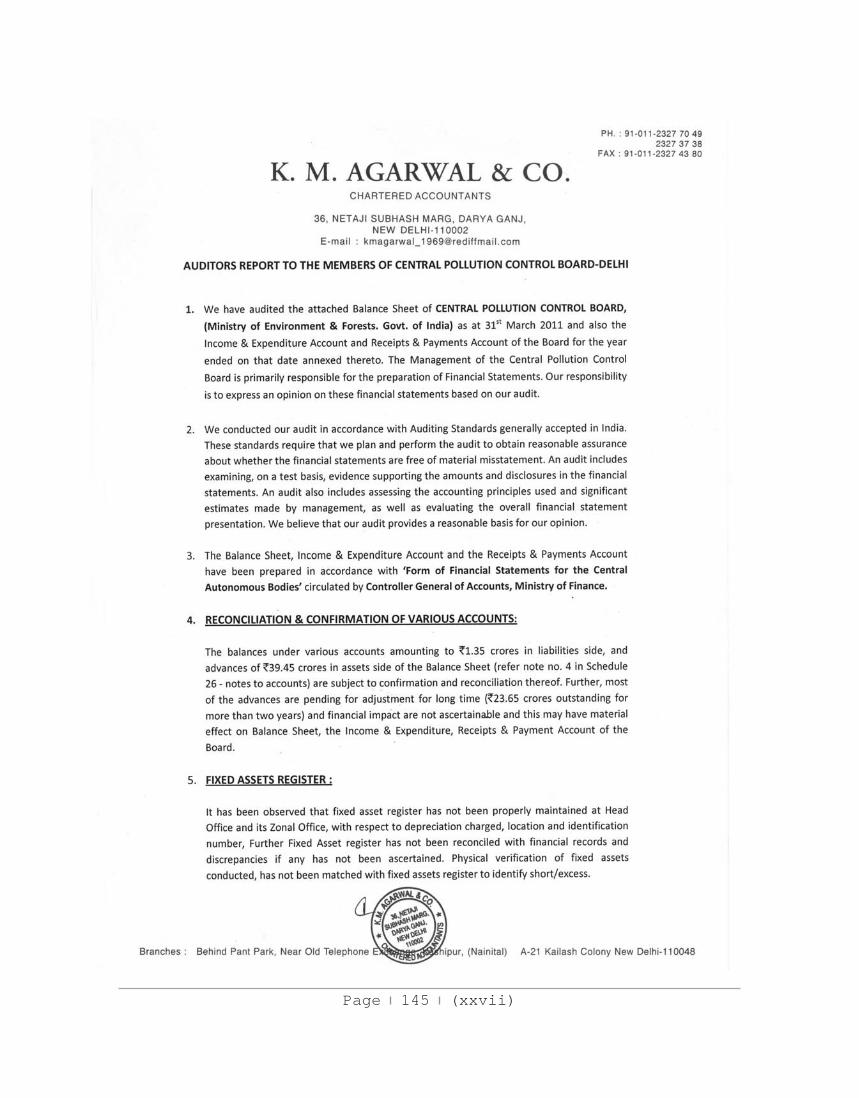
Page 145 (xxvii)
Page 145 (xxviii)
Page 145 (xxix)
Page 145A xxx
Page | 146
CHAPTER XIII
ANNUAL ACTION PLAN FOR THE YEAR 2011-12
13.0 INTRODUCTION The Annual Action Plan of Central Pollution Control Board for the Year 2011-12, focuses its attention on National Flagship Programmes and supported with various scientific & technological schemes. The programmes requiring higher outlays and difficult to be accommodated under the Plan grant, have been proposed under Water Cess, NGRBA and other Centrally Sponsored Schemes of Ministry of Environment & Forest. Thus, Annual Action Plan for the year 2011-12 constitute mixed efforts of R & D activities, on-going projects / schemes with emphasis on training and mass awareness programmes.
13.1 SALIENT ACHIEVEMENTS OF YEAR 2009-10
(A) Assessment of Pollution
Carried out monitoring at 1700 water quality monitoring stations covering 980 rivers, 117 lakes, 490 wells, 17 drains, 27 canals, 9 tanks, 15 creeks, 45 ponds etc under Water Quality Monitoring (WQM) Programme.
Carried out Ambient Air Quality monitoring at 424 stations covering 175 cities under National Ambient Air Quality Monitoring Programme (NAMP).
Initiated National Ambient Noise Monitoring Network (NANMN) and
starting with establishment of 35 Noise monitoring stations in 07 cities viz. Delhi, Mumbai, Hyderabad, Lucknow, Kolkata, Bangalore, Chennai
Operated Forty Five (45) Continuous Ambient Air Quality Monitoring
Stations (CAAQMS). The three (3) Continuous Air Quality Monitoring Stations are under installation.
Installation of open path system for monitoring ambient air quality.
Established LIDAR based Ambient Air Quality Forecasting System
during Common Wealth Games, 2010.
Page 145A xxxi
Page | 147
Following research and development studies have been carried out to assess air and water quality;
Urban Ambient Air Monitoring Quality in Kolkata and Estimation
of Ozone, Carbonyls, NOX and VOCs Emission completed and report published.
“Source Apportionment Studies” in 6 Cities namely Delhi,
Kanpur, Mumbai, Chennai, Pune and Ahmedabad have been completed and report published.
“Status of Vehicular Pollution Control Programme in India” is
completed and report published. Status of Water Quality in India completed and published.
National Ambient Air Quality Status completed and published.
Pollution problem of “River Ghaggar” is completed and report is
under print. (B) Industrial Pollution Control
On Random basis ESS inspections carried out at 152 highly polluting industries falling under 17 categories of highly polluting industries and 126 Directions have been issued to non-complying industries under Section 5 of The Environment (Protection) Act, 1986.
A demonstration project has been set-up in CPCB on Lyophilization for
preservation of animal skin / hides to eliminate use of common salt for Hides preservation at tanneries.
(C) Waste Management
Co-processing of hazardous and non hazardous incinerable waste has
been propagated in Cement kilns. Trial runs for co-processing of distillery spent wash was conducted in cement kilns and draft Guidelines for Co-processing of Distillery Spent Wash prepared.
Initiated Ambient Air Quality Monitoring at landfill sites Delhi to assess
the impact of burning of waste including plastics.
Page 145A xxxii
Page | 148
Ambient air quality monitoring has been initiated in respect of Dioxins
and Furans at 10 selected critically polluted problem areas.
Study on impact of plastic waste disposal on soil and water quality completed and report is under print.
Carried out 19 inspections of TSDFs, CBMWTFs and SLF (as a follow up
of Directions issued).
(D) Training, Mass Awareness and Environment Data Bank
A Memorandum of Undertaking (MoU) has been signed with (SINTEF) Norway for training exposure to CPCB and SPCBs officials on co-processing of hazardous waste.
Implementation of Raj-Bhasha (Hindi) in CPCB and organizing Hindi
Diwas, Workshop and Training Programmes for CPCB officials.
Seven hundred and fifty (750) episodes under Paryavaran Darshan Programme on regional environmental issues were shown by 18 Regional Kendras of Doordarshan and Doordarshan-National.
Thirty five (35) technical and scientific reports, 6 newsletters and 03
brochures have been published on various subjects.
An integrated software for creating Environmental Data Bank (EDB) and system for CAAQMS data communication have been developed.
A report on Pollution Mitigation (Vol.-I & II) having compilation of 133
research papers was released on 27th Oct, 2010 by Dr. Madhvan Nair, former Director, Indian Space Research Organization (ISRO) and President of Indian Science Congress. In addition, a Law book with an e-book (CD) was released by Hon’ble Minister of Environment and Forests, Sh. Jairam Ramesh on 28th February, 2011.
Conducted 19 national training programmes and 23 workshops /
seminars and 9 international training programme / workshop on various environmental pollution and prevention areas. These programmes were attended by staff of CPCB and SPCBs. In addition, 8 training
Page 145A xxxiii
Page | 149
programmes also conducted on various administrative matters for non-technical staff of CPCB.
13.2 THRUST AREAS FOR ABATEMENT OF POLLUTION During the year 2011-12 of the Eleventh Five Year Plan, Central Pollution Control Board would draw a five year plan from year 2012-13 to 2016-17 which will be based on the Approach Paper being prepared by the Planning Commission for 12th Five Year Plan and the initiatives and reforms taken by Ministry of Environment & Forests (MoEF) for securing better enforcement and compliance of environmental laws. The implementation of identified programmes has been grouped. The Central Pollution Control Board is executing these under Plan grant, Cess funding and other schemes of MoEF. The major thrust areas, which will be persuaded during year 2011-12, are as under:
Sponsored Projects:
A. Projects Sanctioned under CESS Fund (By MoEF)
1. Complete recycling of Municipal Solid Waste (including inerts)- (Rs. 0.06
Crore).
2. Strengthening of National Ambient Air Quality Monitoring Network (Rs.
5.86 Crore).
3. Indian cities Air Quality Information System (Rs. 1.41 Crore)
4. Innovative technology for Hides and Skin preservation (Rs. 1.0 Crore).
5. Software requirement study of computerization of CPCB (Rs. 0.02 Crore).
6. Paryavaran Darshan (Rs. 9.5 Crore).
7. Co-processing of Hazardous and other wastes in Cement Plants, Iron and
Steel and Power Plants (Rs. 5.04,67,200 under HSMD, MoEF funding).
8. Environmental Information System (EIS) on GIS / GPS platform: (Total
proposed Rs. 1308 Crore of which Rs. 286.0 Crore proposed under Cess).
9. Techno-economic feasibility study of Zero Liquid Discharge system
implemented in CETPs at Tirupur (Proposed Rs. 1.30 Crore).
10. Development for a National Database on Cleaner Technologies (CT),
evolution of a mechanism for fiscal measures for promotion of CT in
Page 145A xxxiv
Page | 150
India (Total Cost for the Project is Rs. 158.67 Lacs, sanctioned by MoEF
in January 2010).
B. Projects Sanctioned by Other Agencies:
1. Hydrology Project– HP-II: Hydrology Information System for Water
Resources Management (Rs. 20.4 Crore funds by Ministry of Water Resources through World Bank).
2. Bio-mimetic Sequestration of CO2 into Calcium Carbonate using Immobilized Enzyme and Whole Cell Bioreactor (Rs. 2.76 Crore recommended by Planning Commission to MoEF).
C. Externally Aided Projects:
1. Inventorisation of Dioxins and Furans in Northern and Eastern Zone of India (funded by UNIDO Rs. 0.70 Crore).
2. Recovery of alternative fuels and raw materials and treatment of organic hazardous waste through co-processing in resource and energy intensive industries in India (4,80,000 NOK funding by Norway Govt.)
D. Projects under NGRBA:
1. In-situ bio-remediation for sewage treatment (sanctioned: Rs. 19.85
Crore).
2. Bacteriophages for removal of faecal coliform bacteria (sanctioned: Rs.
15.70 Crore).
3. Evaluation of performance of in-situ sewage treatment-Guidelines and
Protocols (proposed: Rs. 4.2872 Crore).
4. Saltless preservation of hides and skin by Lyophilisation (sanctioned: Rs.
4.45 Crore).
5. Pollution inventorisation assessment and surveillance on Ganga River
Basin (sanctioned: Rs. 34.77 Crore).
E. Projects / Schemes proposed under Plan Fund of CPCB
Increasing Water Quality Monitoring Stations (WQMS) from 2000 Nos. to
2500. Nos.
Page 145A xxxv
Page | 151
Sanctioning of Ambient Air Quality Monitoring Stations from 665 Nos. to
700 Nos.
Setting of additional 35 noise monitoring stations in 07 cities.
Setting of continuous Ambient Air Quality Monitoring Stations in other
metro cities.
Up-gradation of 4 Zonal Office laboratories at par with Head Office.
Implementation of Municipal Solid Waste (MSW) Rules, 2000 in States and
Union Territories.
Implementation of Plastic Waste (Management and Handling) Rules, 2011
in States and Union Territories through State Pollution Control Boards
(SPCBs), Pollution Control Committees (PCCs) and Municipal Authorities.
Implementation of co-processing of incinerable hazardous and non-
hazardous waste including plastic waste in cement kilns, thermal power
and steel plants.
Encouraging use of plastic waste in road construction.
Inventorisation of Bio-medical Waste, Hazardous Waste, Plastic Waste,
Battery Waste generation in major cities in India.
Monitoring compliance in CETPs, STPs, CBMTFs, and TSDFs etc.
Implementation of Action Plan in 43 critically polluted industrial clusters
(CEPI).
Assessment of Green House Gases emissions in power plants, vehicles and
industries.
Implementation of clean technology processes in air polluting industries
like Coke-Oven Plants, Sponge Iron Plants, and Thermal Power Plants etc.
Development of standards for ‘Red category’ of industries.
On-line monitoring mechanism for ambient air and gaseous emissions.
Setting-up of environmental information system (EIS) on GIS / GPS
platform for formulating environment management policies.
Rejuvenation of tributaries for maintaining environmental flow in rivers.
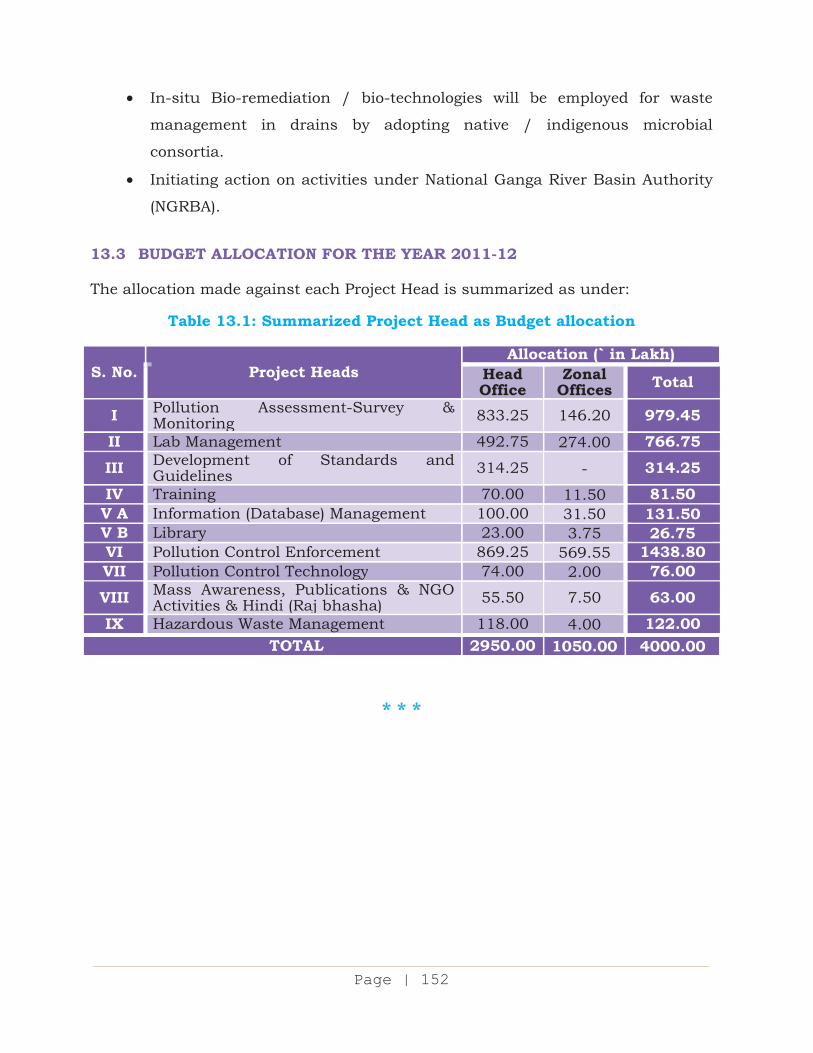
Page 145A xxxvi
Page | 152
In-situ Bio-remediation / bio-technologies will be employed for waste
management in drains by adopting native / indigenous microbial
consortia.
Initiating action on activities under National Ganga River Basin Authority
(NGRBA).
13.3 BUDGET ALLOCATION FOR THE YEAR 2011-12 The allocation made against each Project Head is summarized as under:
Table 13.1: Summarized Project Head as Budget allocation
S. No. Project Heads Allocation (` in Lakh)
Head Office
Zonal Offices Total
I Pollution Assessment-Survey & Monitoring 833.25 146.20 979.45
II Lab Management 492.75 274.00 766.75III Development of Standards and
Guidelines 314.25 - 314.25 IV Training 70.00 11.50 81.50V A Information (Database) Management 100.00 31.50 131.50V B Library 23.00 3.75 26.75VI Pollution Control Enforcement 869.25 569.55 1438.80VII Pollution Control Technology 74.00 2.00 76.00VIII Mass Awareness, Publications & NGO
Activities & Hindi (Raj bhasha) 55.50 7.50 63.00 IX Hazardous Waste Management 118.00 4.00 122.00
TOTAL 2950.00 1050.00 4000.00
* * *
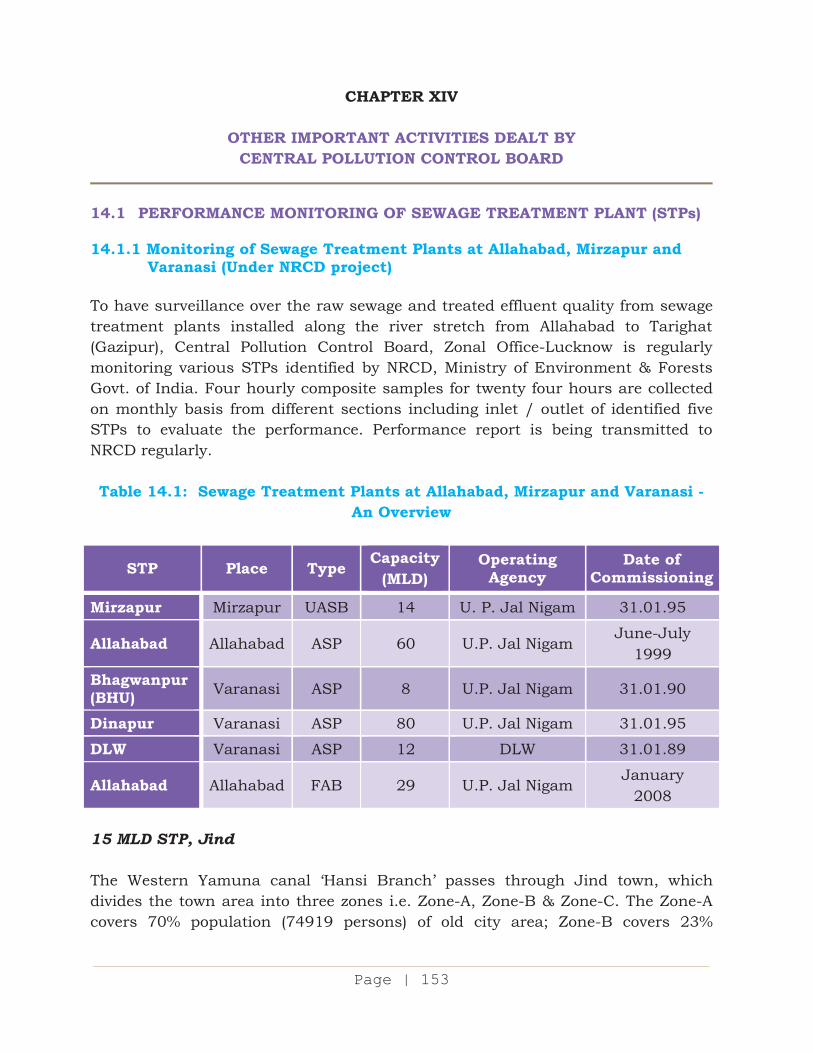
Page 145A xxxvii
Page | 153
CHAPTER XIV
OTHER IMPORTANT ACTIVITIES DEALT BY CENTRAL POLLUTION CONTROL BOARD
14.1 PERFORMANCE MONITORING OF SEWAGE TREATMENT PLANT (STPs) 14.1.1 Monitoring of Sewage Treatment Plants at Allahabad, Mirzapur and
Varanasi (Under NRCD project) To have surveillance over the raw sewage and treated effluent quality from sewage treatment plants installed along the river stretch from Allahabad to Tarighat (Gazipur), Central Pollution Control Board, Zonal Office-Lucknow is regularly monitoring various STPs identified by NRCD, Ministry of Environment & Forests Govt. of India. Four hourly composite samples for twenty four hours are collected on monthly basis from different sections including inlet / outlet of identified five STPs to evaluate the performance. Performance report is being transmitted to NRCD regularly. Table 14.1: Sewage Treatment Plants at Allahabad, Mirzapur and Varanasi -
An Overview
STP Place Type Capacity(MLD)
Operating Agency
Date of Commissioning
Mirzapur Mirzapur UASB 14 U. P. Jal Nigam 31.01.95
Allahabad Allahabad ASP 60 U.P. Jal Nigam June-July
1999
Bhagwanpur (BHU) Varanasi ASP 8 U.P. Jal Nigam 31.01.90
Dinapur Varanasi ASP 80 U.P. Jal Nigam 31.01.95
DLW Varanasi ASP 12 DLW 31.01.89
Allahabad Allahabad FAB 29 U.P. Jal Nigam January
2008
15 MLD STP, Jind The Western Yamuna canal ‘Hansi Branch’ passes through Jind town, which divides the town area into three zones i.e. Zone-A, Zone-B & Zone-C. The Zone-A covers 70% population (74919 persons) of old city area; Zone-B covers 23%
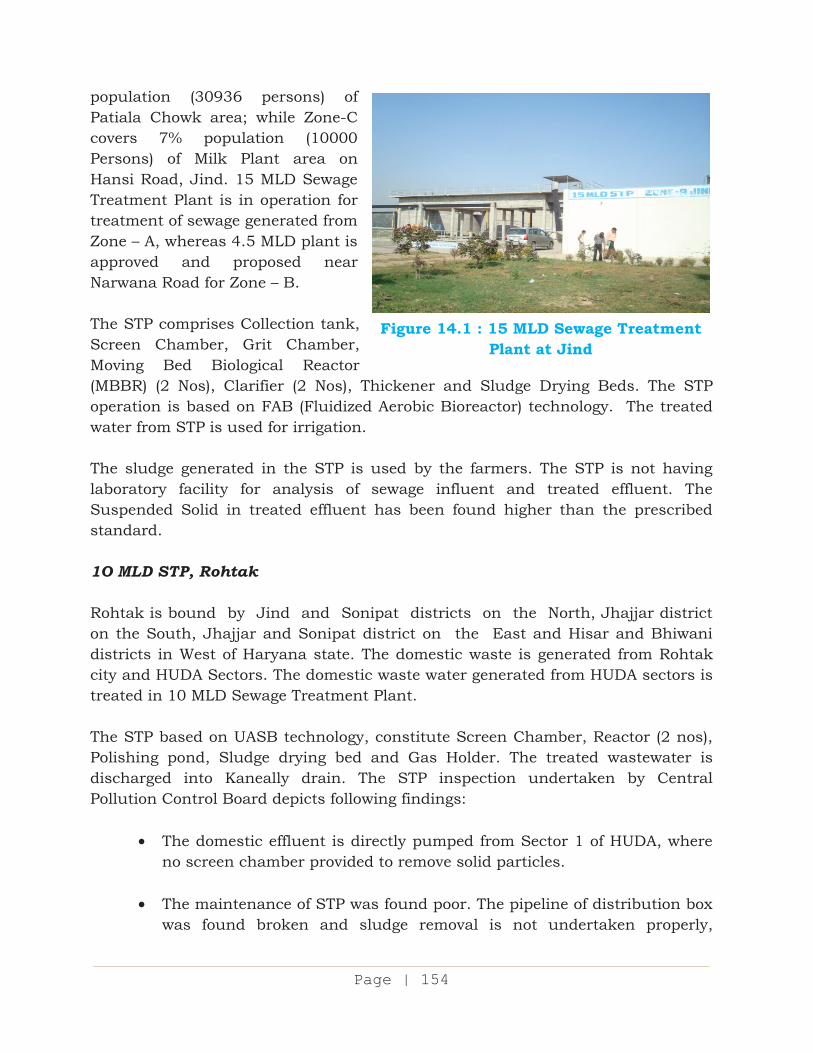
Page 145A xxxviii
Page | 154
population (30936 persons) of Patiala Chowk area; while Zone-C covers 7% population (10000 Persons) of Milk Plant area on Hansi Road, Jind. 15 MLD Sewage Treatment Plant is in operation for treatment of sewage generated from Zone – A, whereas 4.5 MLD plant is approved and proposed near Narwana Road for Zone – B. The STP comprises Collection tank, Screen Chamber, Grit Chamber, Moving Bed Biological Reactor (MBBR) (2 Nos), Clarifier (2 Nos), Thickener and Sludge Drying Beds. The STP operation is based on FAB (Fluidized Aerobic Bioreactor) technology. The treated water from STP is used for irrigation. The sludge generated in the STP is used by the farmers. The STP is not having laboratory facility for analysis of sewage influent and treated effluent. The Suspended Solid in treated effluent has been found higher than the prescribed standard. 1O MLD STP, Rohtak Rohtak is bound by Jind and Sonipat districts on the North, Jhajjar district on the South, Jhajjar and Sonipat district on the East and Hisar and Bhiwani districts in West of Haryana state. The domestic waste is generated from Rohtak city and HUDA Sectors. The domestic waste water generated from HUDA sectors is treated in 10 MLD Sewage Treatment Plant. The STP based on UASB technology, constitute Screen Chamber, Reactor (2 nos), Polishing pond, Sludge drying bed and Gas Holder. The treated wastewater is discharged into Kaneally drain. The STP inspection undertaken by Central Pollution Control Board depicts following findings:
The domestic effluent is directly pumped from Sector 1 of HUDA, where no screen chamber provided to remove solid particles.
The maintenance of STP was found poor. The pipeline of distribution box
was found broken and sludge removal is not undertaken properly,
Figure 14.1 : 15 MLD Sewage Treatment Plant at Jind
Page 145A xxxix
Page | 155
Sludge Drying Beds was dry. The Sludge from polishing pond is also not removed.
No trained man power available for STP operation. No analysis and gas
generation record is maintained at STP laboratory. STP Bhattian, Ludhiana, Punjab The Sewage treatment plant (111 MLD) based on UASB technology was constructed and commissioned in March 2007 by Punjab Water Supply and Sewerage Board, Ludhiana, Punjab under Satluj Action Plan at Bhattian village, Ludhiana. The other two Sewage treatment plants (STPs) constructed at Ludhiana city are at Jamalpur (48 MLD) and at Balloke152 MLD. The STP at Bhattian village provide service to the north-west side areas of Delhi-Amritsar Railway Line comprising Transport Nagar, Moti Nagar, Inner City, Jalandhar-bye pass, Salem Tabri etc. The inspection of Sewage treatment plant undertaken by Central Pollution Control Board depict following observations:
The waste water flow to STP varied from 100 MLD to 111 MLD during the visit.The waste water contains 82% domestic waste and 18% Industrial waste water from dying & textile units.
Plant efficiency was observed about 93 % in terms of BOD reduction and 83% in terms of COD reduction.
Performance of UASB reactors was satisfactory. Scum was observed deposited on reactors surface, may be due to improper cleaning of deposited material.
The treated wastewater is being discharged to river Sutluj in case it is not used for irrigation
STP is having sufficient number of sludge drying beds to handle the dried sludge and being disposed of as manure.
Total 250 m3/hr gas is generated from the plant, out of which 60% gas is used for laboratory and kitchen and 40% used for generator. One Gas holding tank was found completely filled, and excess gas flared
50 MLD activated Sludge process based ”SBR” (Sequential batch reactors) type plant was under construction under expansion plan.
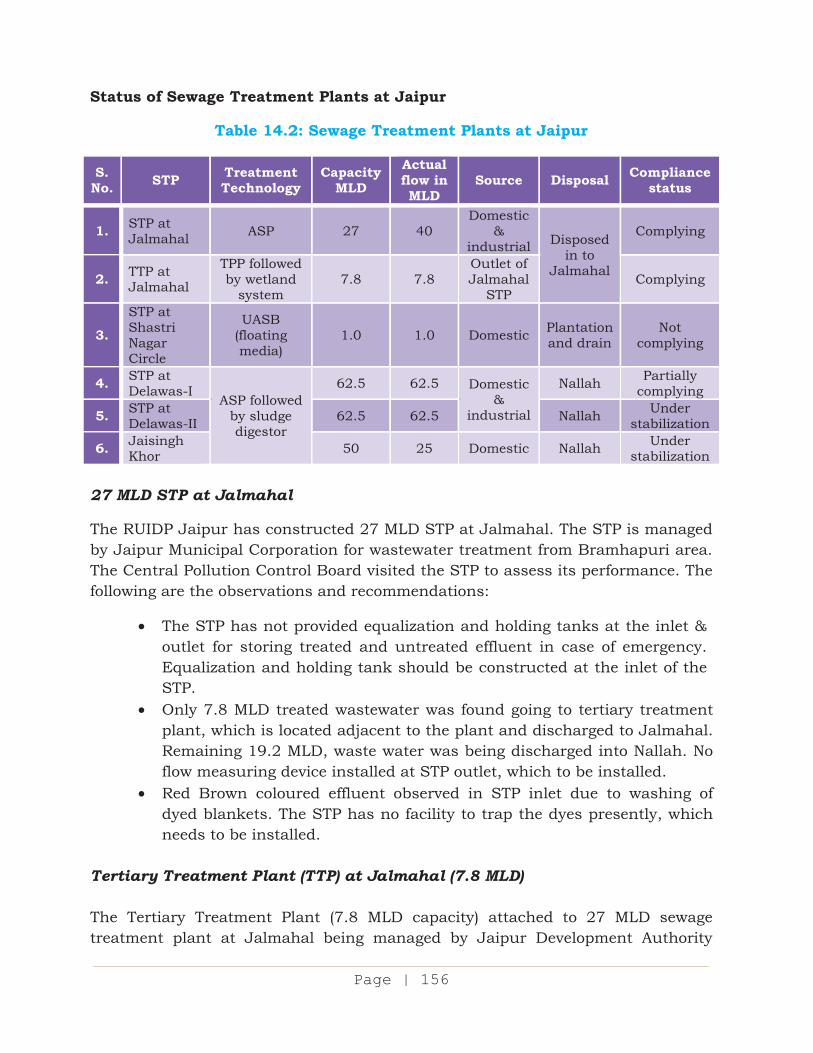
Page 145A xl
Page | 156
Status of Sewage Treatment Plants at Jaipur
Table 14.2: Sewage Treatment Plants at Jaipur
S. No. STP Treatment
Technology Capacity
MLD
Actual flow in MLD
Source Disposal Compliance status
1. STP at Jalmahal ASP 27 40
Domestic &
industrial Disposed in to
Jalmahal
Complying
2. TTP at Jalmahal
TPP followed by wetland
system 7.8 7.8
Outlet of Jalmahal
STP Complying
3. STP at Shastri Nagar Circle
UASB (floating media)
1.0 1.0 Domestic Plantation and drain
Not complying
4. STP at Delawas-I
ASP followed by sludge digestor
62.5 62.5 Domestic &
industrial
Nallah Partially complying
5. STP at Delawas-II 62.5 62.5 Nallah Under
stabilization
6. Jaisingh Khor 50 25 Domestic Nallah Under
stabilization 27 MLD STP at Jalmahal
The RUIDP Jaipur has constructed 27 MLD STP at Jalmahal. The STP is managed by Jaipur Municipal Corporation for wastewater treatment from Bramhapuri area. The Central Pollution Control Board visited the STP to assess its performance. The following are the observations and recommendations:
The STP has not provided equalization and holding tanks at the inlet & outlet for storing treated and untreated effluent in case of emergency. Equalization and holding tank should be constructed at the inlet of the STP.
Only 7.8 MLD treated wastewater was found going to tertiary treatment plant, which is located adjacent to the plant and discharged to Jalmahal. Remaining 19.2 MLD, waste water was being discharged into Nallah. No flow measuring device installed at STP outlet, which to be installed.
Red Brown coloured effluent observed in STP inlet due to washing of dyed blankets. The STP has no facility to trap the dyes presently, which needs to be installed.
Tertiary Treatment Plant (TTP) at Jalmahal (7.8 MLD) The Tertiary Treatment Plant (7.8 MLD capacity) attached to 27 MLD sewage treatment plant at Jalmahal being managed by Jaipur Development Authority
Page 145A xli
Page | 157
(JDA).The treatment system consist of collection, flash mixture, settling and wetland treatment. The Tertiary treatment plant was visited and following are the observations and recommendations:
Sludge dumped openly and clariflocculator was not in operation.
Foaming was observed at the inlet of parshal flume.Inlet flow meter was not in operation.
The treated water being released to Jalmahal for recreation purpose. The inlet collection sump should be constructed for feeding treatment
plant instead of trapping from the secondary clarifier outlet of STP. The Diesel Generating set has been provided as power backup to run the
biological system at the STP during power failure without any interruption.
The possibility should be explored for using treated wastewater (19.5 MLD) in plantations or enhance the capacity of TTP for treating and using the treated water for industrial or cooling purposes, instead of discharging to the drain.
STP Delawas (62.5 MLD) At Delawas, there are two STPs of 62.5 MLD capacity each. STP Unit I was commissioned on 15th Feb. 2006 while STP unit II is new and under stabilization. Both the STPs are having similar treatment system comprising coarse & fine screens, grit separators, primary clarifiers, diffused aeration, secondary clarifiers, sludge thickener, centrifuge, sludge digesters and gas holders. The generated gas is being used for power generation to run the blower for supplying air into diffused aeration system. The following are the observations and recommendations based on visit during March 2011:
The inlet flow was 62 MLD at unit I and 40 MLD at unit II. Proper records should be maintained for inlet flow with the installed parshal plum and flow measuring devices should also be installed at the final out let discharge point. The treated water was being discharged into the Amanishah Nallah.
The authority should construct tertiary treatment plant for reusing the treated wastewater instead of discharging it to drain.
Holding tank should be constructed for storing treated wastewater for reuse in plantation and cooling purposes.
The facility should be installed for trapping the dyes coming with effluents of cloth washing units at Sanganer and other residential localities.
Page 145A xlii
Page | 158
Sludge if any should be stored properly and used as manure. Green belt should be developed and the internal roads should be made pucca.
The STP Phase II should be stabilized and prescribed norms provided by Rajasthan State Pollution Control Board should be adhered.
The flare stacks should be checked regularly and adequate safety measures should be provided at gas holding tanks to prevent accidents.
For controlling noise pollution, enclosures should be provided at the gas generators and blowers.
STP at Jaisingh Khor (50 MLD) The STP at Jaisingh Khor village is a newly commissioned sewage treatment plant having 50 MLD capacity. The sewage treatment plant was visited by Central Pollution Control Board. The following are the observations and recommendations based on the visit:
The plant was not fully stabilized and only 50% of the flow was being received due to improper drainage system. The STP has no flow meters for inlet and outlet flow. Flow has been measured by using V-notch & parshal plum.
The treated wastewater from the STP was being discharged in the open drain and partly used by the farmers for agricultural purpose. The tertiary treatment plant should be constructed for reusing the treated wastewater for industrial as well as agricultural purpose instead of letting it into wastewater drain.
The records are not being maintained for inlet and outlet flow, sludge generation and its disposal. The STP sludge is reportedly used by farmers as manure.
Holding tank should be constructed for storing the treated wastewater for reuse in plantation. The unit should install facility for trapping dyes received as effluent from cloth washing units at Sanganer and other residential localities.
The flare stacks should be checked regularly and adequate safety measures should be provided for gas holding tanks to prevent accidents.
For controlling noise pollution, enclosures should be provided at the gas generators and blowers.
Page 145A xliii
Page | 159
STP at Shastri Nagar Circle (1.0 MLD) The 1.0 MLD Sewage Treatment Plant is located at Shastri Nagar Circle for treating domestic effluents. The treatment system consists of collection, reaction tank-I with media, reaction tank-II with media, tube settler and treated water storage tank. The sewage treatment plant was visited by Central Pollution Control Board. The observations and recommendations based on the visit are detailed ahead:
No inlet flow to STP was observed during visit as STP receives sewage effluents during night and morning hours only.
Chlorination of treated effluent needs to be done before using it for gardening purpose.
The STP should be operated properly and necessary measures to be taken to prevent foul smell. The STP should obtain consent to operate from Rajasthan State Pollution Control Board and strictly follow consent conditions. Skilled manpower should be posted for STP operation.
STP at Amberpet Hyderabad (Andhra Pradesh) The Sewage Treatment Plant having 339 MLD capacity has been operational since year 2009 at Amberpet, Hyderabad. The STP is provided with facilities of Primary settling tank, Up-Flow Anaerobic Sludge Blanket Reactors (UASB), Facultative Aerated Lagoon and Chlorination. The performance evaluation of Sewage Treatment Plants (STPs) is being carried out by Central Pollution Control Board regularly. The following are the observations and recommendations based on the performance evaluation visit:
There are three numbers of sludge pumping stations each with two pumps. The pumped sludge is passed through the filter belt press and dried sludge is dumped within STP site.
The gas collected from UASB are scrubbed with water and alkali, then used in three gas engines for 625 kW power production
The power generation was observed around 450 kW against the designed capacity of 625 kW. The power production will be maximum only when full capacity is reached.
The STP flow varies from 180 MLD to 260 MLD. The STP will likely to receive full capacity of 339 MLD, once the pipeline work by HWSSB in some unconnected area is completed,
The treated waste water is discharged to river Musi. The river water monitored indicates that it meets the prescribed standard.
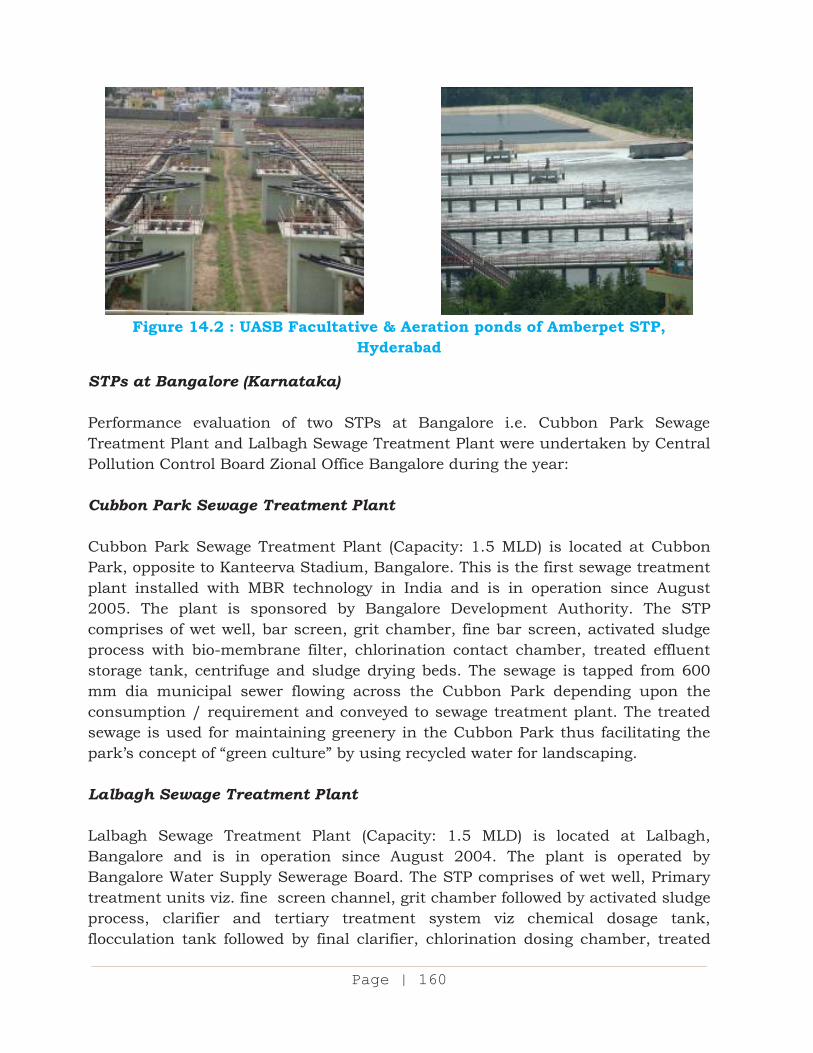
Page 145A xliv
Page | 160
Figure 14.2 : UASB Facultative & Aeration ponds of Amberpet STP,
Hyderabad
STPs at Bangalore (Karnataka) Performance evaluation of two STPs at Bangalore i.e. Cubbon Park Sewage Treatment Plant and Lalbagh Sewage Treatment Plant were undertaken by Central Pollution Control Board Zional Office Bangalore during the year: Cubbon Park Sewage Treatment Plant Cubbon Park Sewage Treatment Plant (Capacity: 1.5 MLD) is located at Cubbon Park, opposite to Kanteerva Stadium, Bangalore. This is the first sewage treatment plant installed with MBR technology in India and is in operation since August 2005. The plant is sponsored by Bangalore Development Authority. The STP comprises of wet well, bar screen, grit chamber, fine bar screen, activated sludge process with bio-membrane filter, chlorination contact chamber, treated effluent storage tank, centrifuge and sludge drying beds. The sewage is tapped from 600 mm dia municipal sewer flowing across the Cubbon Park depending upon the consumption / requirement and conveyed to sewage treatment plant. The treated sewage is used for maintaining greenery in the Cubbon Park thus facilitating the park’s concept of “green culture” by using recycled water for landscaping. Lalbagh Sewage Treatment Plant Lalbagh Sewage Treatment Plant (Capacity: 1.5 MLD) is located at Lalbagh, Bangalore and is in operation since August 2004. The plant is operated by Bangalore Water Supply Sewerage Board. The STP comprises of wet well, Primary treatment units viz. fine screen channel, grit chamber followed by activated sludge process, clarifier and tertiary treatment system viz chemical dosage tank, flocculation tank followed by final clarifier, chlorination dosing chamber, treated
Page 145A xlv
Page | 161
effluent storage tank, centrifuge and sludge drying beds. The treated effluents are carried to Lalbagh garden through HDPE pipes and used for gardening purpose. The observations based on performance evaluation studies are as below:
Both STPs are not having flow meter or ‘V’ notch at ETPs inlets and outlets to quantify domestic effluents received and treated.
Performance monitoring of STPs indicate that their performance are satisfactory.
The sludge generated from STPs is centrifuged to separate liquid and solids. The liquid is sent to wet well for further treatment. The solids are taken to sludge drying bed for further drying and then used as manure in the respective parks/gardens.
14.1.2 In-Situ Treatment of Sewage The wastewater management is an important aspect of water pollution. Class-I and Class-II towns in the country generate 38,254 MLD of which the treatment is provided for only 11,787 MLD (31%). The untreated sewage is accountable of pollution of rivers and lakes. Complete treatment of wastewater could not be seen immediately as it involves construction of Sewage Treatment Plants. The Central Pollution Control Board views the scenario seriously and taken initiatives for implementation of “In-situ Treatment of sewage” by application of microbial consortia in drains for interim remedial measure. The technology is able to reduce pollution load in terms of BOD, COD & Suspended Solids up to 80% and heavy metals and other chemicals upto 50%. The demonstrative project on “In-situ treatment of sewage” has been launched at Ramnagar Domora Drain, Bharatpur and A. B. Road Drain Indore. These projects are operational presently. The technology is further proposed to be utilized at four locations under National Ganga River Basin Authority (NGRBA) Scheme at Morigate Nala, Allahabad; Bakarganj Nala, Patna and City Drain Farukhabad and at Budha Nala, Ludhiana under National River Conservation Directorate (NRCD).
14.2 INDUSTRIAL POLLUTION CONTROL – COMMON EFFLUENT
TREATMENT PLANTS (CETPs) 14.2.1 Common Effluent Treatment Plants (CETPs) for Small Scale Industries The concept of Common Effluent Treatment Plant (CETP) was developed to achieve end-of-pipe treatment of combined wastewater at lower unit cost than could be
Page 145A xlvi
Page | 162
achieved by individual industries and to facilitate discharge, monitoring and enforcement by regulatory agencies to ensure regular satisfactory operation. The Ministry of Environment & Forests, Govt. of India (MoEF) introduced a financial support scheme (CETP Scheme) since 1994 to ensure their growth in an environmentally compatible manner. The scheme promotes establishment of common facilities for treatment of effluents generated from SSI units located in clusters through financial assistance in the form of 50% subsidy on capital (25% central subsidy plus matching 25% state subsidy) One hundred fourteen Common Effluent Treatment Plants (CETPs) for clusters of small-scale industry have been set up so far under this scheme. Some CETPs have also been set up under other financial support schemes of Central Government namely the Industrial Infrastructure Up-gradation Scheme (IIUS) of Department of Industrial Policy & Promotion, Ministry of Commerce and Industries, and the Textile Centres Infrastructure Development Scheme (TCIDS) of Ministry of Textiles, which provide capital subsidy to an extent of 75%. Because of these financial incentives by the Central Government, 149 CETPs have been established with combined treatment capacity of about 1174 MLD covering about 15000 polluting industries, while 23 CETPs are under-construction or proposed. State Pollution Control Boards (SPCBs) are primarily responsible to ensure regular compliance of prescribed effluent standards by the industries or CETPs in their jurisdiction, whereas Central Pollution Control Board (CPCB) coordinates with SPCBs for pollution control activities. CPCB requested all SPCBs in May 2007 to initiate monitoring programme for all CETPs within their jurisdiction at least every quarter and to take follow up action against industries / CETPs not complying with the prescribed standards. During September 2008, SPCBs were issued standing directions under Section 18 (1) (b) of the Water (Prevention and Control of Pollution) Act, 1974 to carryout monitoring of CETPs at least every quarter, take follow up action consequent to the monitoring, and report the action taken to CPCB every quarter. In the said directions it was specially pointed out that concerted efforts need to be made by SPCB to stop direct discharge of untreated industrial effluents from industries / industrial estates without connecting these to the CETPs, wherever applicable
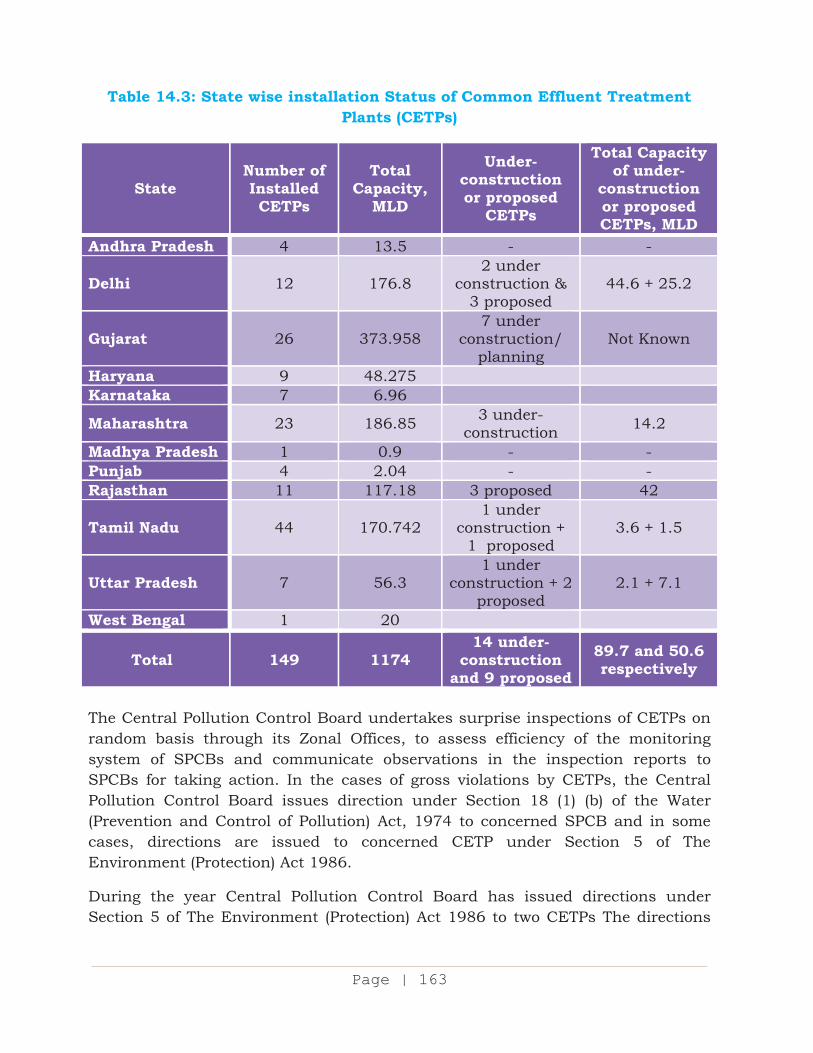
Page 145A xlvii
Page | 163
Table 14.3: State wise installation Status of Common Effluent Treatment Plants (CETPs)
State Number of Installed CETPs
Total Capacity,
MLD
Under-construction or proposed
CETPs
Total Capacity of under-
construction or proposed CETPs, MLD
Andhra Pradesh 4 13.5 - -
Delhi 12 176.8 2 under
construction & 3 proposed
44.6 + 25.2
Gujarat 26 373.958 7 under
construction/ planning
Not Known
Haryana 9 48.275 Karnataka 7 6.96
Maharashtra 23 186.85 3 under-construction 14.2
Madhya Pradesh 1 0.9 - - Punjab 4 2.04 - - Rajasthan 11 117.18 3 proposed 42
Tamil Nadu 44 170.742 1 under
construction + 1 proposed
3.6 + 1.5
Uttar Pradesh 7 56.3 1 under
construction + 2 proposed
2.1 + 7.1
West Bengal 1 20
Total 149 1174 14 under-
construction and 9 proposed
89.7 and 50.6 respectively
The Central Pollution Control Board undertakes surprise inspections of CETPs on random basis through its Zonal Offices, to assess efficiency of the monitoring system of SPCBs and communicate observations in the inspection reports to SPCBs for taking action. In the cases of gross violations by CETPs, the Central Pollution Control Board issues direction under Section 18 (1) (b) of the Water (Prevention and Control of Pollution) Act, 1974 to concerned SPCB and in some cases, directions are issued to concerned CETP under Section 5 of The Environment (Protection) Act 1986.
During the year Central Pollution Control Board has issued directions under Section 5 of The Environment (Protection) Act 1986 to two CETPs The directions
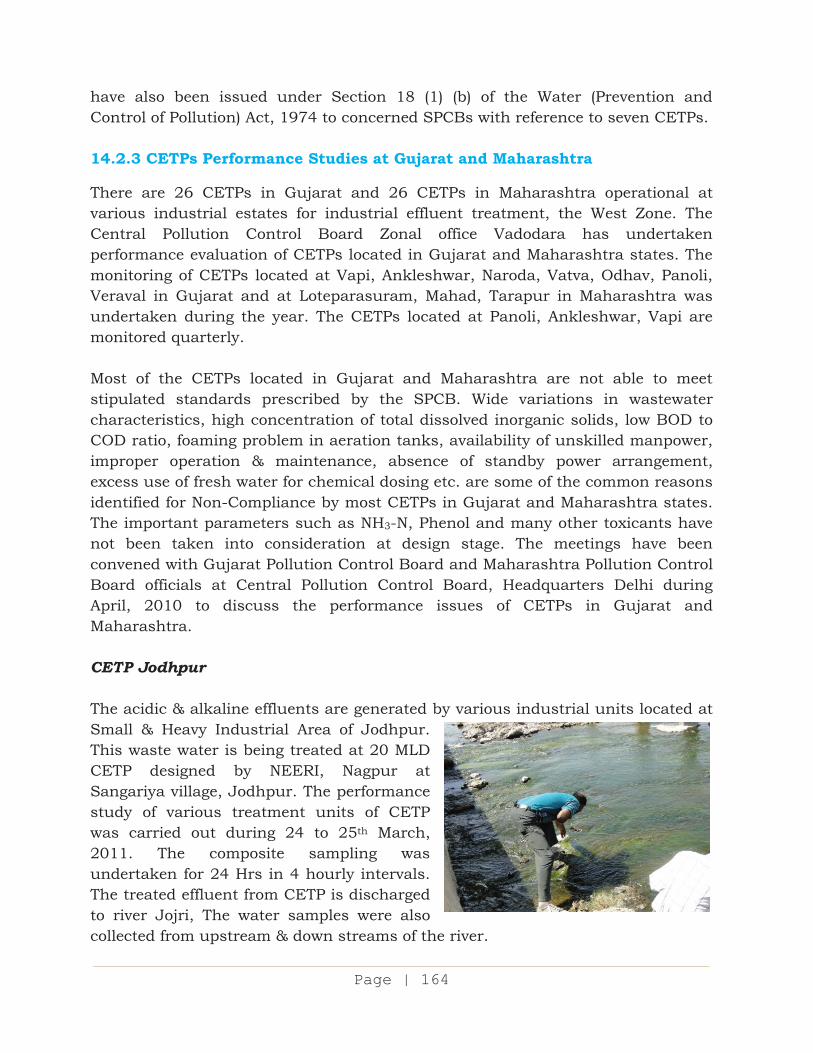
Page 145A xlviii
Page | 164
have also been issued under Section 18 (1) (b) of the Water (Prevention and Control of Pollution) Act, 1974 to concerned SPCBs with reference to seven CETPs. 14.2.3 CETPs Performance Studies at Gujarat and Maharashtra
There are 26 CETPs in Gujarat and 26 CETPs in Maharashtra operational at various industrial estates for industrial effluent treatment, the West Zone. The Central Pollution Control Board Zonal office Vadodara has undertaken performance evaluation of CETPs located in Gujarat and Maharashtra states. The monitoring of CETPs located at Vapi, Ankleshwar, Naroda, Vatva, Odhav, Panoli, Veraval in Gujarat and at Loteparasuram, Mahad, Tarapur in Maharashtra was undertaken during the year. The CETPs located at Panoli, Ankleshwar, Vapi are monitored quarterly. Most of the CETPs located in Gujarat and Maharashtra are not able to meet stipulated standards prescribed by the SPCB. Wide variations in wastewater characteristics, high concentration of total dissolved inorganic solids, low BOD to COD ratio, foaming problem in aeration tanks, availability of unskilled manpower, improper operation & maintenance, absence of standby power arrangement, excess use of fresh water for chemical dosing etc. are some of the common reasons identified for Non-Compliance by most CETPs in Gujarat and Maharashtra states. The important parameters such as NH3-N, Phenol and many other toxicants have not been taken into consideration at design stage. The meetings have been convened with Gujarat Pollution Control Board and Maharashtra Pollution Control Board officials at Central Pollution Control Board, Headquarters Delhi during April, 2010 to discuss the performance issues of CETPs in Gujarat and Maharashtra. CETP Jodhpur The acidic & alkaline effluents are generated by various industrial units located at Small & Heavy Industrial Area of Jodhpur. This waste water is being treated at 20 MLD CETP designed by NEERI, Nagpur at Sangariya village, Jodhpur. The performance study of various treatment units of CETP was carried out during 24 to 25th March, 2011. The composite sampling was undertaken for 24 Hrs in 4 hourly intervals. The treated effluent from CETP is discharged to river Jojri, The water samples were also collected from upstream & down streams of the river.
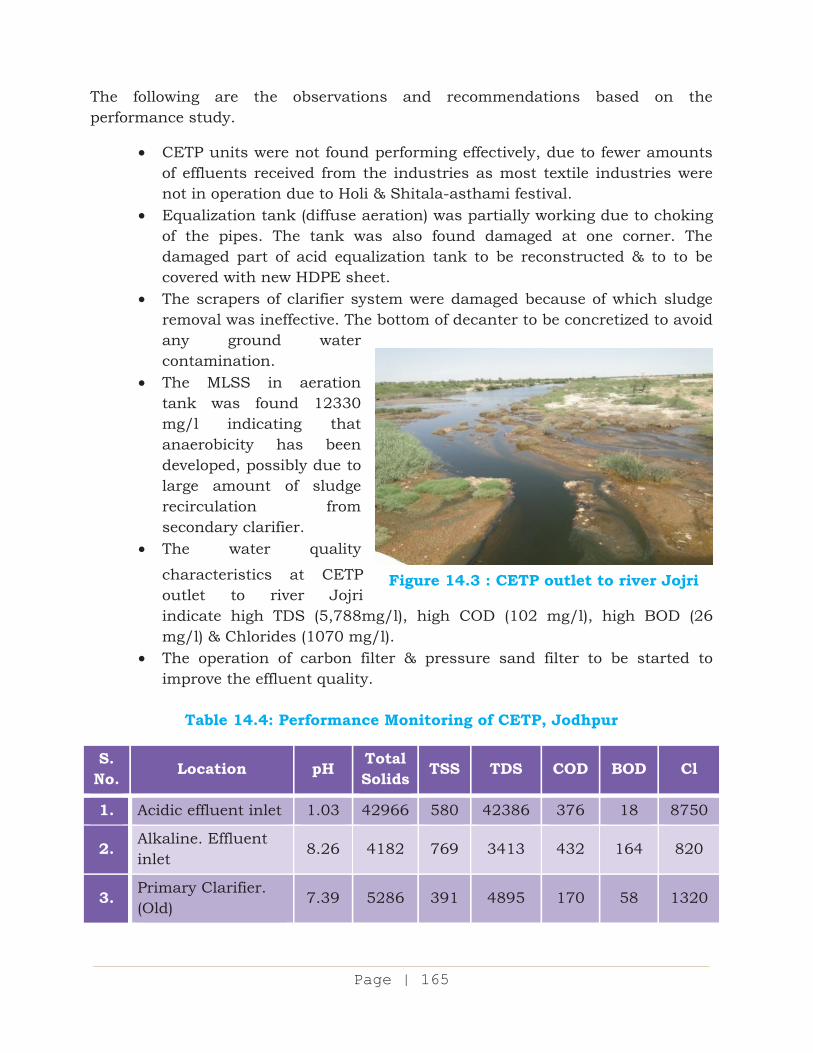
Page 145A xlix
Page | 165
The following are the observations and recommendations based on the performance study.
CETP units were not found performing effectively, due to fewer amounts of effluents received from the industries as most textile industries were not in operation due to Holi & Shitala-asthami festival.
Equalization tank (diffuse aeration) was partially working due to choking of the pipes. The tank was also found damaged at one corner. The damaged part of acid equalization tank to be reconstructed & to to be covered with new HDPE sheet.
The scrapers of clarifier system were damaged because of which sludge removal was ineffective. The bottom of decanter to be concretized to avoid any ground water contamination.
The MLSS in aeration tank was found 12330 mg/l indicating that anaerobicity has been developed, possibly due to large amount of sludge recirculation from secondary clarifier.
The water quality
characteristics at CETP outlet to river Jojri indicate high TDS (5,788mg/l), high COD (102 mg/l), high BOD (26 mg/l) & Chlorides (1070 mg/l).
The operation of carbon filter & pressure sand filter to be started to improve the effluent quality.
Table 14.4: Performance Monitoring of CETP, Jodhpur
S. No. Location pH Total
Solids TSS TDS COD BOD Cl
1. Acidic effluent inlet 1.03 42966 580 42386 376 18 8750
2. Alkaline. Effluent inlet
8.26 4182 769 3413 432 164 820
3. Primary Clarifier. (Old)
7.39 5286 391 4895 170 58 1320
Figure 14.3 : CETP outlet to river Jojri
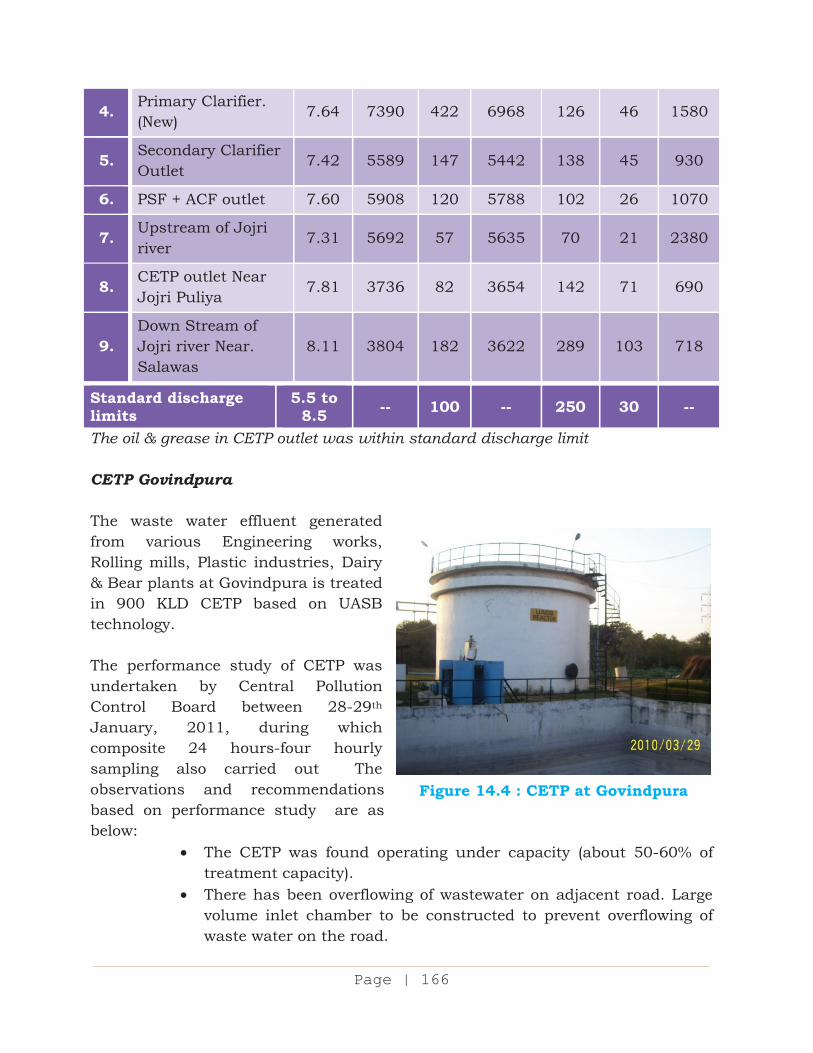
Page 145A l
Page | 166
4. Primary Clarifier. (New)
7.64 7390 422 6968 126 46 1580
5. Secondary Clarifier Outlet
7.42 5589 147 5442 138 45 930
6. PSF + ACF outlet 7.60 5908 120 5788 102 26 1070
7. Upstream of Jojri river
7.31 5692 57 5635 70 21 2380
8. CETP outlet Near Jojri Puliya
7.81 3736 82 3654 142 71 690
9. Down Stream of Jojri river Near. Salawas
8.11 3804 182 3622 289 103 718
Standard discharge limits
5.5 to 8.5 -- 100 -- 250 30 --
The oil & grease in CETP outlet was within standard discharge limit CETP Govindpura The waste water effluent generated from various Engineering works, Rolling mills, Plastic industries, Dairy & Bear plants at Govindpura is treated in 900 KLD CETP based on UASB technology.
The performance study of CETP was undertaken by Central Pollution Control Board between 28-29th January, 2011, during which composite 24 hours-four hourly sampling also carried out The observations and recommendations based on performance study are as below:
The CETP was found operating under capacity (about 50-60% of treatment capacity).
There has been overflowing of wastewater on adjacent road. Large volume inlet chamber to be constructed to prevent overflowing of waste water on the road.
Figure 14.4 : CETP at Govindpura
Page 145A li
Page | 167
The pipeline of chamber before the equalization tank was found chocked. The partial treatment was seen in disused aeration of equalization tank because of the chocking of pipes. which needs to be cleaned for effective diffused aeration.
The 90% COD reduction was observed after UASB treatment. The dried sludge is being used in premises as compost. The option
may be used to utilize generated methane as energy source. The effective performance of CETP to be maintained by regular
cleaning of various sub units CETP Bhiwadi The Common Effluent Treatment Plant (CETP), Bhiwadi has been constructed for treatment of generated industrial waste water from food processing units, pharma units, automobile units, textile and prickling units The CETP of 6 MLD capacity was designed by M/s SPANS Envirotech Pvt. Limited, New Delhi and operated by Bhiwadi Manufacturers Association (BMA). The performance study of common effluent treatment plant was carried out from 18 to 19 December 2010. The unit wise performance evaluation of CETP was undertaken, during which four hourly composite samples were collected and analyzed. The observations and recommendations based on the performance study are as below:
The RIICO has constructed CETP with capacity 6 MLD comprising of equalization, aeration and settling and sludge thickener for solid separation.
The CETP has been designed for hydraulic loading of 6 MLD while the actual flow at CETP was ranging between 9.0 to 12 MLD. It demand that the CETP capacity to be enhanced upto 15 MLD
The treated effluent was being discharged in storm water drain which ultimately join river Sabi. The flow meter and pH meter installed before Oil & Grease trap chamber were not operational.
The retention time at aeration tank was found short because of which these units were found inefficient.
Diffused aeration system has been provided in aeration tank but excess foam generation during aeration creates adverse effect and also reduces treatment efficiency. The MLSS in aeration tanks was in the range of 246 mg/l, which is well below than required concentration. .Grit and floating material removal system should be made mechanical.
Proper records should be maintained in laboratory for operational parameters as well as for generation and storage of CETP sludge.
Page 145A lii
Page | 168
Hazardous Waste generation return should be submitted timely to SPCB
The CETP Trust should periodically monitor effluent quality discharged by member units and ensure that the effluent should be pre-treated to desirable level for avoiding shock loads at CETP units.
The CETP operation and management should be improved to achieve the prescribed limits. The attention should also be given for timely cleaning of screened materials, dissolved oxygen levels in aeration tanks, MLVSS & F/M ratio of aeration tank and smooth overflow from primary settling tanks
14.2.4 CETPs at Tamilnadu Forty-three Common Effluent Treatment Plants are in operation in Tamilnadu of which 18 CETPs were inspected / monitored by Central Pollution Control Board during the year to asses their performance vis-à-vis compliance of standards. 14.2.5 CETPs in Tannery Sector Ten Common Effluent Treatment Plants operating for tannery sector with designed treatment capacity varying from 550 to 4000 KLD were monitored at Tamil Nadu during the year. It has been observed that the CETPs have capacity utilization varying from 13 to 84%. (Annual average), probably because of shutdown of operations or restriction imposed by authorities due to non-compliance of notified standards and various operational aspects. The average quantity of waste water generation varied from 20 to 55 lit per kg of raw hide processed as against a standard of 28 lit / kg.
Table 14.5: Monitoring of CETPs from Tannery sector at
Tamilnadu during year 2010
S. No. CETPs Location
No. of member
units
Treatmentcapacity
(KLD)
Capacity utilization
(Annual average)
Wastewater generation (lit) per kg of raw hide processed
1.
M/s. Talco-Dindigul Tanners Enviro Control System Pvt. Ltd
Dindigul 61 2533 34 % 55 lit
2.
M/s. Vaniyambadi Tanners Enviro Control
Vaniyambadi 131 4000 84 % 37 lit
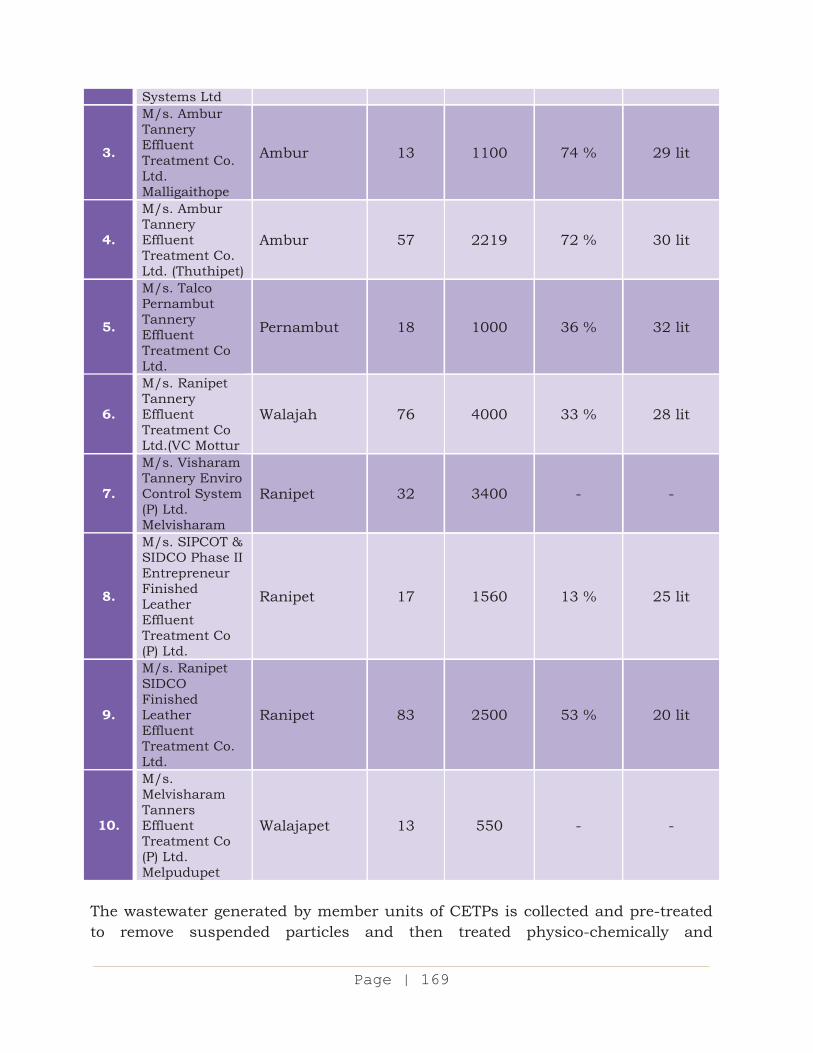
Page 145A liii
Page | 169
Systems Ltd
3.
M/s. Ambur Tannery Effluent Treatment Co. Ltd. Malligaithope
Ambur 13 1100 74 % 29 lit
4.
M/s. Ambur Tannery Effluent Treatment Co. Ltd. (Thuthipet)
Ambur 57 2219 72 % 30 lit
5.
M/s. Talco Pernambut Tannery Effluent Treatment Co Ltd.
Pernambut 18 1000 36 % 32 lit
6.
M/s. Ranipet Tannery Effluent Treatment Co Ltd.(VC Mottur
Walajah 76 4000 33 % 28 lit
7.
M/s. Visharam Tannery Enviro Control System (P) Ltd. Melvisharam
Ranipet 32 3400 - -
8.
M/s. SIPCOT & SIDCO Phase II Entrepreneur Finished Leather Effluent Treatment Co (P) Ltd.
Ranipet 17 1560 13 % 25 lit
9.
M/s. Ranipet SIDCO Finished Leather Effluent Treatment Co. Ltd.
Ranipet 83 2500 53 % 20 lit
10.
M/s. Melvisharam Tanners Effluent Treatment Co (P) Ltd. Melpudupet
Walajapet 13 550 - -
The wastewater generated by member units of CETPs is collected and pre-treated to remove suspended particles and then treated physico-chemically and
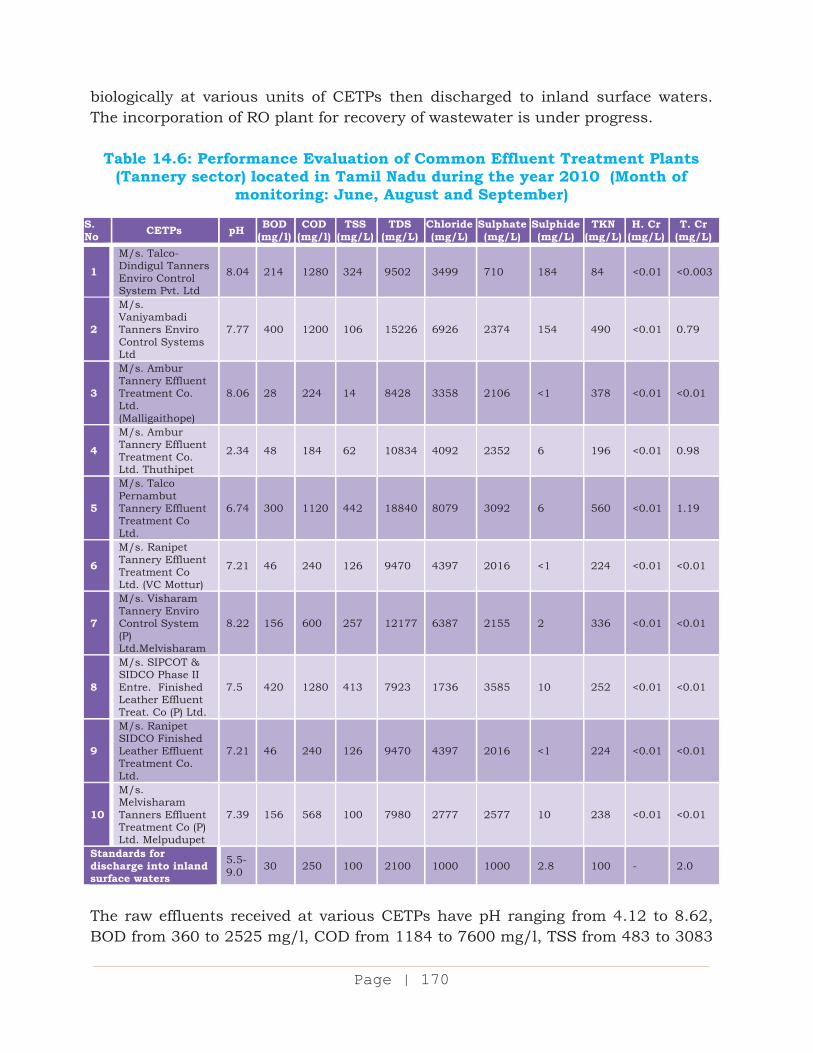
Page 145A liv
Page | 170
biologically at various units of CETPs then discharged to inland surface waters. The incorporation of RO plant for recovery of wastewater is under progress.
Table 14.6: Performance Evaluation of Common Effluent Treatment Plants (Tannery sector) located in Tamil Nadu during the year 2010 (Month of
monitoring: June, August and September)
S. No CETPs pH BOD
(mg/l) COD
(mg/l)TSS
(mg/L)TDS
(mg/L)Chloride (mg/L)
Sulphate (mg/L)
Sulphide (mg/L)
TKN (mg/L)
H. Cr (mg/L)
T. Cr (mg/L)
1
M/s. Talco-Dindigul Tanners Enviro Control System Pvt. Ltd
8.04 214 1280 324 9502 3499 710 184 84 <0.01 <0.003
2
M/s. Vaniyambadi Tanners Enviro Control Systems Ltd
7.77 400 1200 106 15226 6926 2374 154 490 <0.01 0.79
3
M/s. Ambur Tannery Effluent Treatment Co. Ltd. (Malligaithope)
8.06 28 224 14 8428 3358 2106 <1 378 <0.01 <0.01
4
M/s. Ambur Tannery Effluent Treatment Co. Ltd. Thuthipet
2.34 48 184 62 10834 4092 2352 6 196 <0.01 0.98
5
M/s. Talco Pernambut Tannery Effluent Treatment Co Ltd.
6.74 300 1120 442 18840 8079 3092 6 560 <0.01 1.19
6
M/s. Ranipet Tannery Effluent Treatment Co Ltd. (VC Mottur)
7.21 46 240 126 9470 4397 2016 <1 224 <0.01 <0.01
7
M/s. Visharam Tannery Enviro Control System (P) Ltd.Melvisharam
8.22 156 600 257 12177 6387 2155 2 336 <0.01 <0.01
8
M/s. SIPCOT & SIDCO Phase II Entre. Finished Leather Effluent Treat. Co (P) Ltd.
7.5 420 1280 413 7923 1736 3585 10 252 <0.01 <0.01
9
M/s. Ranipet SIDCO Finished Leather Effluent Treatment Co. Ltd.
7.21 46 240 126 9470 4397 2016 <1 224 <0.01 <0.01
10
M/s. Melvisharam Tanners Effluent Treatment Co (P) Ltd. Melpudupet
7.39 156 568 100 7980 2777 2577 10 238 <0.01 <0.01
Standards for discharge into inland surface waters
5.5-9.0 30 250 100 2100 1000 1000 2.8 100 - 2.0
The raw effluents received at various CETPs have pH ranging from 4.12 to 8.62, BOD from 360 to 2525 mg/l, COD from 1184 to 7600 mg/l, TSS from 483 to 3083
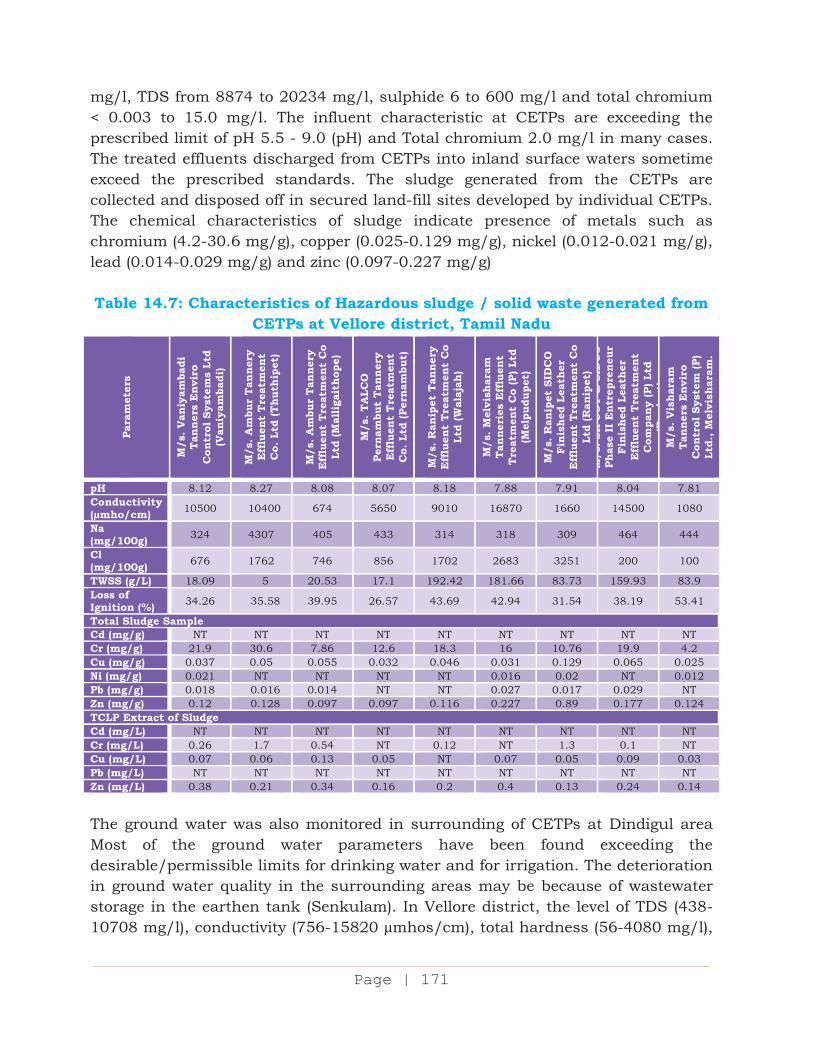
Page 145A lv
Page | 171
mg/l, TDS from 8874 to 20234 mg/l, sulphide 6 to 600 mg/l and total chromium < 0.003 to 15.0 mg/l. The influent characteristic at CETPs are exceeding the prescribed limit of pH 5.5 - 9.0 (pH) and Total chromium 2.0 mg/l in many cases. The treated effluents discharged from CETPs into inland surface waters sometime exceed the prescribed standards. The sludge generated from the CETPs are collected and disposed off in secured land-fill sites developed by individual CETPs. The chemical characteristics of sludge indicate presence of metals such as chromium (4.2-30.6 mg/g), copper (0.025-0.129 mg/g), nickel (0.012-0.021 mg/g), lead (0.014-0.029 mg/g) and zinc (0.097-0.227 mg/g) Table 14.7: Characteristics of Hazardous sludge / solid waste generated from
CETPs at Vellore district, Tamil Nadu
Para
met
ers
M/s
. Van
iyam
badi
Ta
nner
s E
nvir
o C
ontr
ol S
yste
ms
Ltd
(Van
iyam
badi
)
M/s
. Am
bur
Tan
nery
E
fflu
ent
Trea
tmen
t C
o. L
td (T
huth
ipet
)
M/s
. Am
bur
Tan
nery
E
fflu
ent
Trea
tmen
t C
o Lt
d (M
alli
gait
hope
)
M/s
. TA
LCO
Pe
rnam
but
Tann
ery
Eff
luen
t Tr
eatm
ent
Co.
Ltd
(Per
nam
but)
M/s
. Ran
ipet
Tan
nery
E
fflu
ent
Trea
tmen
t C
o Lt
d (W
alaj
ah)
M/s
. Mel
vish
aram
Ta
nner
ies
Eff
luen
t Tr
eatm
ent
Co
(P) L
td
(Mel
pudu
pet)
M/s
. Ran
ipet
SID
CO
Fi
nish
ed L
eath
er
Eff
luen
t Tr
eatm
ent
Co
Ltd
(Ran
ipet
) M
/s. S
IPC
OT
& S
IDC
O
Phas
e II
Ent
repr
eneu
r Fi
nish
ed L
eath
er
Eff
luen
t Tr
eatm
ent
Com
pany
(P) L
td
(Ri
t)M
/s. V
isha
ram
Ta
nner
s E
nvir
o C
ontr
ol S
yste
m (P
) Lt
d., M
elvi
shar
am.
pH 8.12 8.27 8.08 8.07 8.18 7.88 7.91 8.04 7.81Conductivity (µmho/cm) 10500 10400 674 5650 9010 16870 1660 14500 1080
Na (mg/100g) 324 4307 405 433 314 318 309 464 444
Cl (mg/100g) 676 1762 746 856 1702 2683 3251 200 100
TWSS (g/L) 18.09 5 20.53 17.1 192.42 181.66 83.73 159.93 83.9Loss of Ignition (%) 34.26 35.58 39.95 26.57 43.69 42.94 31.54 38.19 53.41
Total Sludge Sample Cd (mg/g) NT NT NT NT NT NT NT NT NTCr (mg/g) 21.9 30.6 7.86 12.6 18.3 16 10.76 19.9 4.2Cu (mg/g) 0.037 0.05 0.055 0.032 0.046 0.031 0.129 0.065 0.025Ni (mg/g) 0.021 NT NT NT NT 0.016 0.02 NT 0.012Pb (mg/g) 0.018 0.016 0.014 NT NT 0.027 0.017 0.029 NTZn (mg/g) 0.12 0.128 0.097 0.097 0.116 0.227 0.89 0.177 0.124TCLP Extract of Sludge Cd (mg/L) NT NT NT NT NT NT NT NT NTCr (mg/L) 0.26 1.7 0.54 NT 0.12 NT 1.3 0.1 NTCu (mg/L) 0.07 0.06 0.13 0.05 NT 0.07 0.05 0.09 0.03Pb (mg/L) NT NT NT NT NT NT NT NT NTZn (mg/L) 0.38 0.21 0.34 0.16 0.2 0.4 0.13 0.24 0.14
The ground water was also monitored in surrounding of CETPs at Dindigul area Most of the ground water parameters have been found exceeding the desirable/permissible limits for drinking water and for irrigation. The deterioration in ground water quality in the surrounding areas may be because of wastewater storage in the earthen tank (Senkulam). In Vellore district, the level of TDS (438-10708 mg/l), conductivity (756-15820 µmhos/cm), total hardness (56-4080 mg/l),
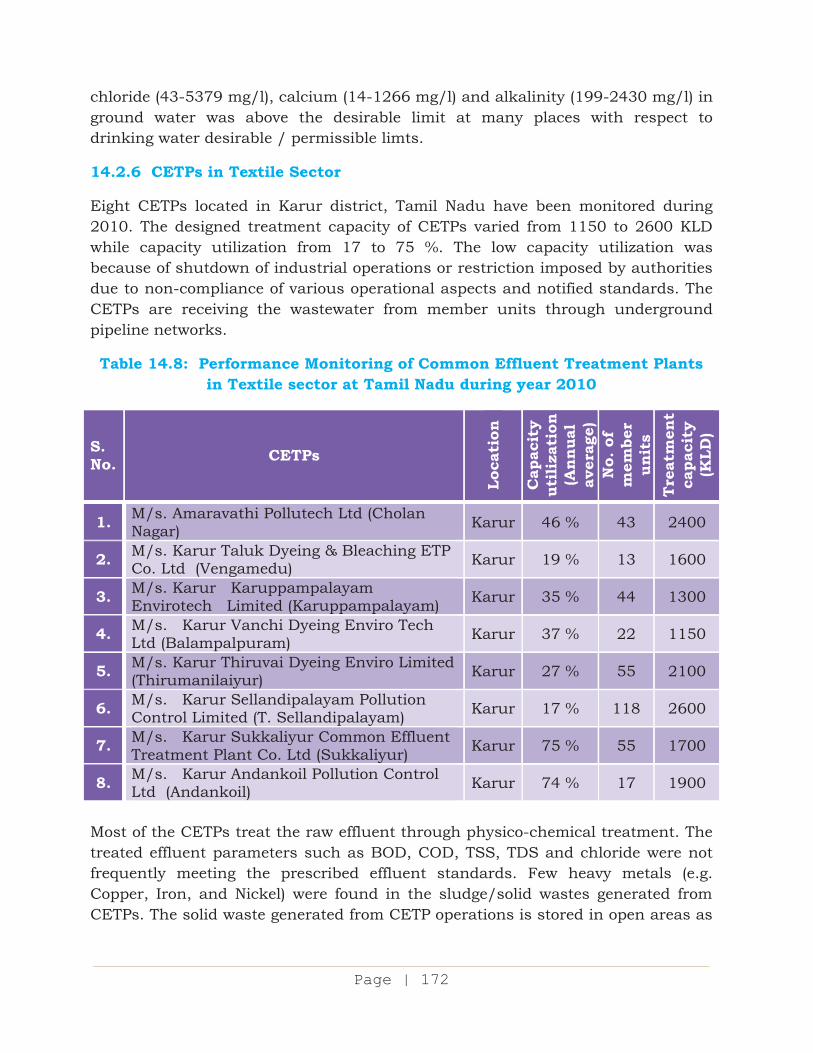
Page 145A lvi
Page | 172
chloride (43-5379 mg/l), calcium (14-1266 mg/l) and alkalinity (199-2430 mg/l) in ground water was above the desirable limit at many places with respect to drinking water desirable / permissible limts.
14.2.6 CETPs in Textile Sector
Eight CETPs located in Karur district, Tamil Nadu have been monitored during 2010. The designed treatment capacity of CETPs varied from 1150 to 2600 KLD while capacity utilization from 17 to 75 %. The low capacity utilization was because of shutdown of industrial operations or restriction imposed by authorities due to non-compliance of various operational aspects and notified standards. The CETPs are receiving the wastewater from member units through underground pipeline networks.
Table 14.8: Performance Monitoring of Common Effluent Treatment Plants in Textile sector at Tamil Nadu during year 2010
S. No. CETPs
Loca
tion
Cap
acit
y ut
iliza
tion
(A
nnua
l av
erag
e)
No.
of
mem
ber
unit
s Tr
eatm
ent
capa
city
(K
LD)
1. M/s. Amaravathi Pollutech Ltd (Cholan Nagar) Karur 46 % 43 2400
2. M/s. Karur Taluk Dyeing & Bleaching ETP Co. Ltd (Vengamedu) Karur 19 % 13 1600
3. M/s. Karur Karuppampalayam Envirotech Limited (Karuppampalayam) Karur 35 % 44 1300
4. M/s. Karur Vanchi Dyeing Enviro Tech Ltd (Balampalpuram) Karur 37 % 22 1150
5. M/s. Karur Thiruvai Dyeing Enviro Limited (Thirumanilaiyur) Karur 27 % 55 2100
6. M/s. Karur Sellandipalayam Pollution Control Limited (T. Sellandipalayam) Karur 17 % 118 2600
7. M/s. Karur Sukkaliyur Common Effluent Treatment Plant Co. Ltd (Sukkaliyur) Karur 75 % 55 1700
8. M/s. Karur Andankoil Pollution Control Ltd (Andankoil) Karur 74 % 17 1900
Most of the CETPs treat the raw effluent through physico-chemical treatment. The treated effluent parameters such as BOD, COD, TSS, TDS and chloride were not frequently meeting the prescribed effluent standards. Few heavy metals (e.g. Copper, Iron, and Nickel) were found in the sludge/solid wastes generated from CETPs. The solid waste generated from CETP operations is stored in open areas as
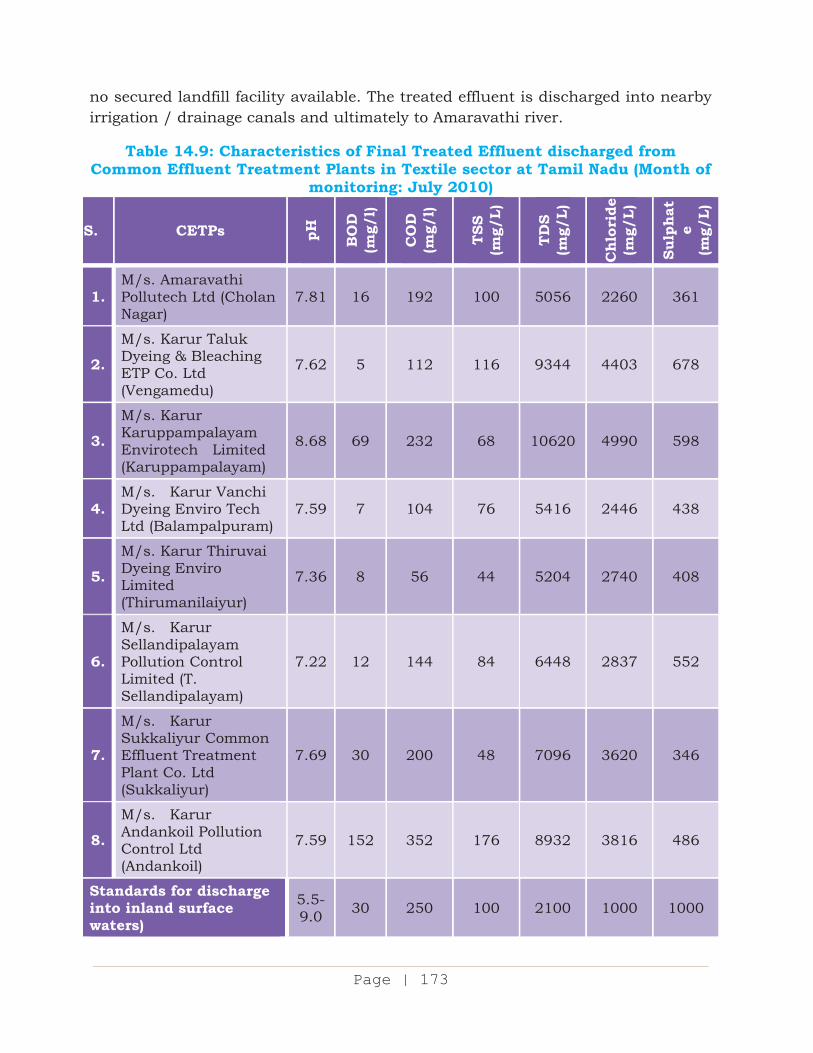
Page 145A lvii
Page | 173
no secured landfill facility available. The treated effluent is discharged into nearby irrigation / drainage canals and ultimately to Amaravathi river.
Table 14.9: Characteristics of Final Treated Effluent discharged from Common Effluent Treatment Plants in Textile sector at Tamil Nadu (Month of
monitoring: July 2010)
S. CETPs pH
BO
D
(mg/
l)
CO
D
(mg/
l)
TSS
(m
g/L)
TDS
(m
g/L)
Chl
orid
e (m
g/L)
Sulp
hat
e
(mg/
L)
1. M/s. Amaravathi Pollutech Ltd (Cholan Nagar)
7.81 16 192 100 5056 2260 361
2.
M/s. Karur Taluk Dyeing & Bleaching ETP Co. Ltd (Vengamedu)
7.62 5 112 116 9344 4403 678
3.
M/s. Karur Karuppampalayam Envirotech Limited (Karuppampalayam)
8.68 69 232 68 10620 4990 598
4. M/s. Karur Vanchi Dyeing Enviro Tech Ltd (Balampalpuram)
7.59 7 104 76 5416 2446 438
5.
M/s. Karur Thiruvai Dyeing Enviro Limited (Thirumanilaiyur)
7.36 8 56 44 5204 2740 408
6.
M/s. Karur Sellandipalayam Pollution Control Limited (T. Sellandipalayam)
7.22 12 144 84 6448 2837 552
7.
M/s. Karur Sukkaliyur Common Effluent Treatment Plant Co. Ltd (Sukkaliyur)
7.69 30 200 48 7096 3620 346
8.
M/s. Karur Andankoil Pollution Control Ltd (Andankoil)
7.59 152 352 176 8932 3816 486
Standards for discharge into inland surface waters)
5.5-9.0 30 250 100 2100 1000 1000
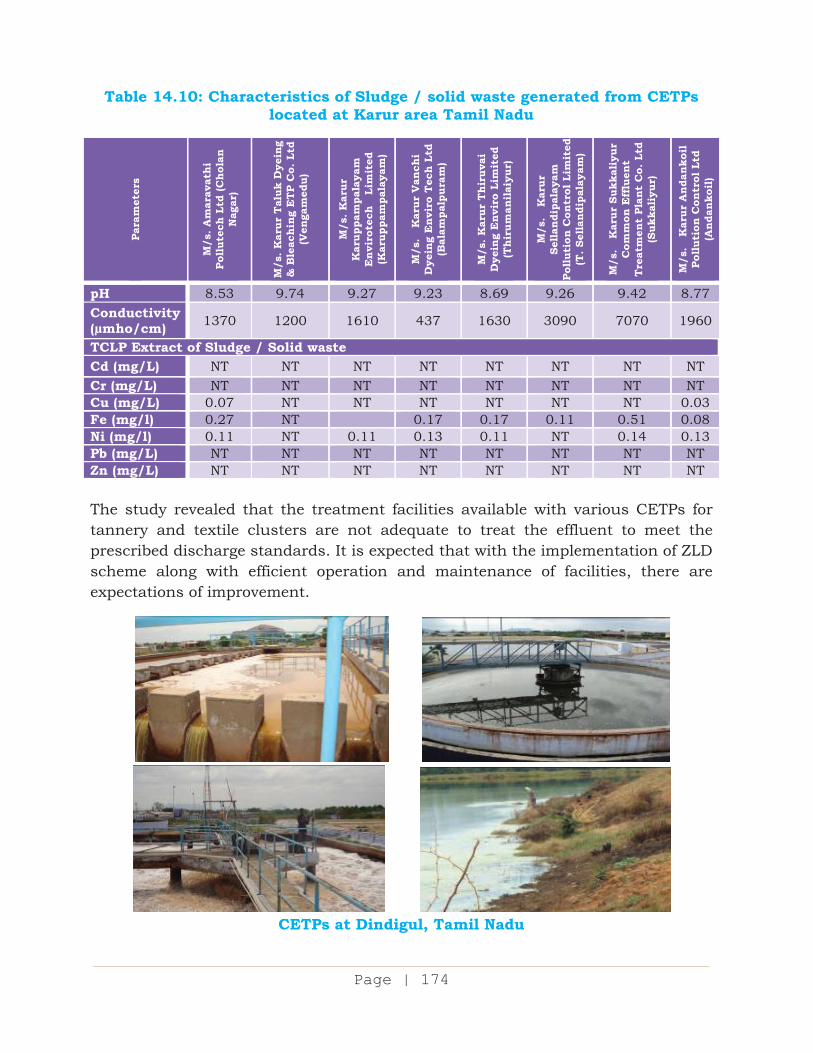
Page 145A lviii
Page | 174
Table 14.10: Characteristics of Sludge / solid waste generated from CETPs located at Karur area Tamil Nadu
Para
met
ers
M/s
. Am
arav
athi
Po
llute
ch L
td (C
hola
n N
agar
)
M/s
. Kar
ur T
aluk
Dye
ing
& B
leac
hing
ETP
Co.
Ltd
(V
enga
med
u)
M/s
. Kar
ur
Kar
uppa
mpa
laya
m
Env
irot
ech
Lim
ited
(K
arup
pam
pala
yam
)
M/s
. K
arur
Van
chi
Dye
ing
Env
iro
Tech
Ltd
(B
alam
palp
uram
)
M/s
. Kar
ur T
hiru
vai
Dye
ing
Env
iro
Lim
ited
(T
hiru
man
ilai
yur)
M/s
. K
arur
Se
lland
ipal
ayam
Po
lluti
on C
ontr
ol L
imit
ed
(T. S
ella
ndip
alay
am)
M/s
. K
arur
Suk
kaliy
ur
Com
mon
Eff
luen
t Tr
eatm
ent
Plan
t C
o. L
td
(Suk
kaliy
ur)
M/s
. K
arur
And
anko
il Po
lluti
on C
ontr
ol L
td
(And
anko
il)
pH 8.53 9.74 9.27 9.23 8.69 9.26 9.42 8.77 Conductivity (µmho/cm) 1370 1200 1610 437 1630 3090 7070 1960
TCLP Extract of Sludge / Solid waste Cd (mg/L) NT NT NT NT NT NT NT NT Cr (mg/L) NT NT NT NT NT NT NT NT Cu (mg/L) 0.07 NT NT NT NT NT NT 0.03 Fe (mg/l) 0.27 NT 0.17 0.17 0.11 0.51 0.08 Ni (mg/l) 0.11 NT 0.11 0.13 0.11 NT 0.14 0.13 Pb (mg/L) NT NT NT NT NT NT NT NT Zn (mg/L) NT NT NT NT NT NT NT NT The study revealed that the treatment facilities available with various CETPs for tannery and textile clusters are not adequate to treat the effluent to meet the prescribed discharge standards. It is expected that with the implementation of ZLD scheme along with efficient operation and maintenance of facilities, there are expectations of improvement.
CETPs at Dindigul, Tamil Nadu
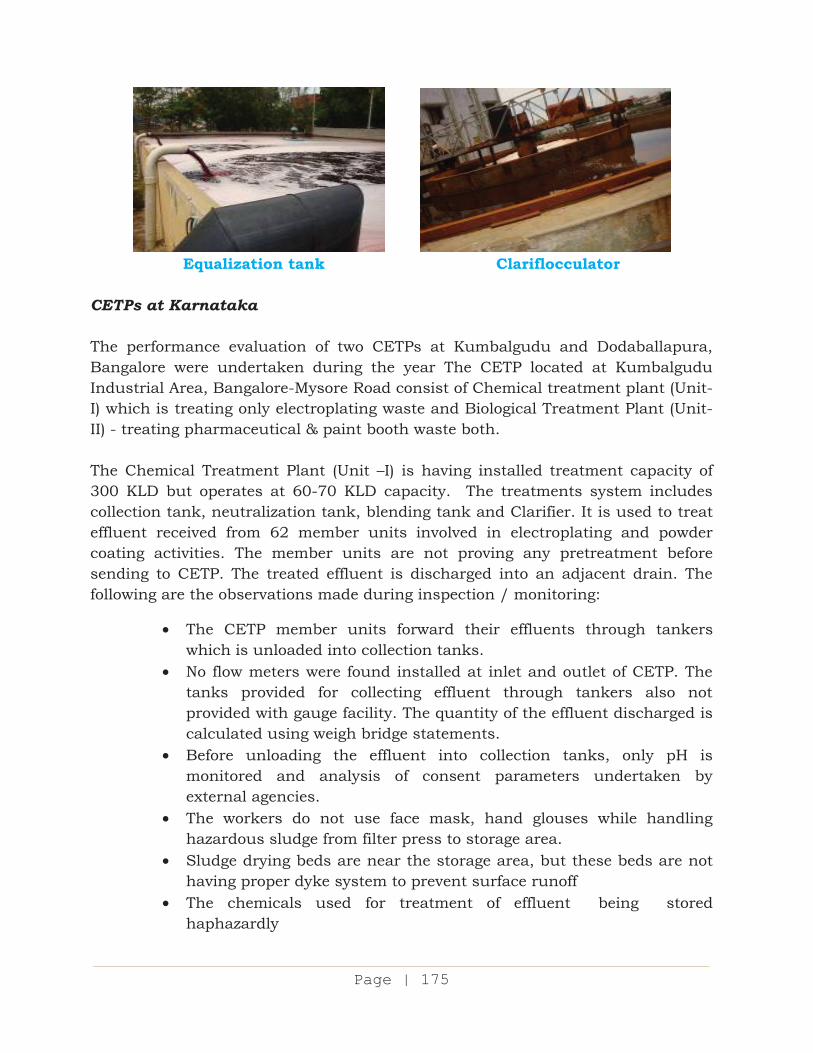
Page 145A lix
Page | 175
Equalization tank Clariflocculator
CETPs at Karnataka The performance evaluation of two CETPs at Kumbalgudu and Dodaballapura, Bangalore were undertaken during the year The CETP located at Kumbalgudu Industrial Area, Bangalore-Mysore Road consist of Chemical treatment plant (Unit-I) which is treating only electroplating waste and Biological Treatment Plant (Unit-II) - treating pharmaceutical & paint booth waste both. The Chemical Treatment Plant (Unit –I) is having installed treatment capacity of 300 KLD but operates at 60-70 KLD capacity. The treatments system includes collection tank, neutralization tank, blending tank and Clarifier. It is used to treat effluent received from 62 member units involved in electroplating and powder coating activities. The member units are not proving any pretreatment before sending to CETP. The treated effluent is discharged into an adjacent drain. The following are the observations made during inspection / monitoring:
The CETP member units forward their effluents through tankers which is unloaded into collection tanks.
No flow meters were found installed at inlet and outlet of CETP. The tanks provided for collecting effluent through tankers also not provided with gauge facility. The quantity of the effluent discharged is calculated using weigh bridge statements.
Before unloading the effluent into collection tanks, only pH is monitored and analysis of consent parameters undertaken by external agencies.
The workers do not use face mask, hand glouses while handling hazardous sludge from filter press to storage area.
Sludge drying beds are near the storage area, but these beds are not having proper dyke system to prevent surface runoff
The chemicals used for treatment of effluent being stored haphazardly
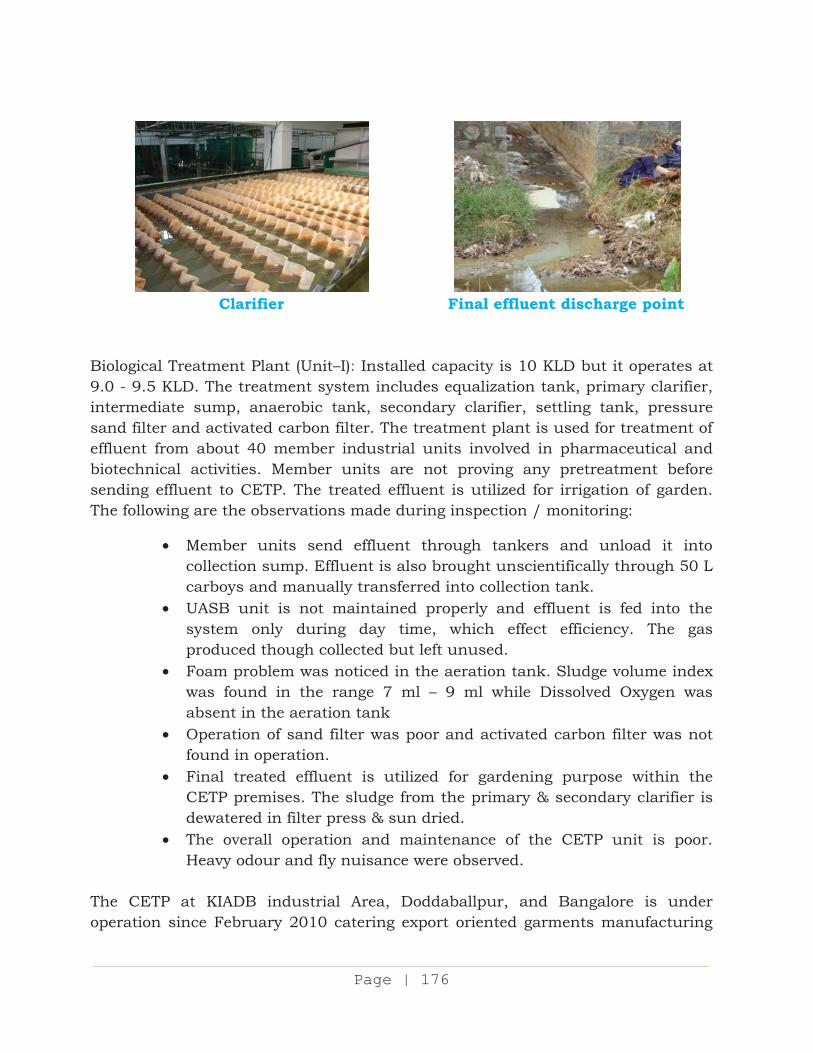
Page 145A lx
Page | 176
Clarifier
Final effluent discharge point
Biological Treatment Plant (Unit–I): Installed capacity is 10 KLD but it operates at 9.0 - 9.5 KLD. The treatment system includes equalization tank, primary clarifier, intermediate sump, anaerobic tank, secondary clarifier, settling tank, pressure sand filter and activated carbon filter. The treatment plant is used for treatment of effluent from about 40 member industrial units involved in pharmaceutical and biotechnical activities. Member units are not proving any pretreatment before sending effluent to CETP. The treated effluent is utilized for irrigation of garden. The following are the observations made during inspection / monitoring:
Member units send effluent through tankers and unload it into collection sump. Effluent is also brought unscientifically through 50 L carboys and manually transferred into collection tank.
UASB unit is not maintained properly and effluent is fed into the system only during day time, which effect efficiency. The gas produced though collected but left unused.
Foam problem was noticed in the aeration tank. Sludge volume index was found in the range 7 ml – 9 ml while Dissolved Oxygen was absent in the aeration tank
Operation of sand filter was poor and activated carbon filter was not found in operation.
Final treated effluent is utilized for gardening purpose within the CETP premises. The sludge from the primary & secondary clarifier is dewatered in filter press & sun dried.
The overall operation and maintenance of the CETP unit is poor. Heavy odour and fly nuisance were observed.
The CETP at KIADB industrial Area, Doddaballpur, and Bangalore is under operation since February 2010 catering export oriented garments manufacturing
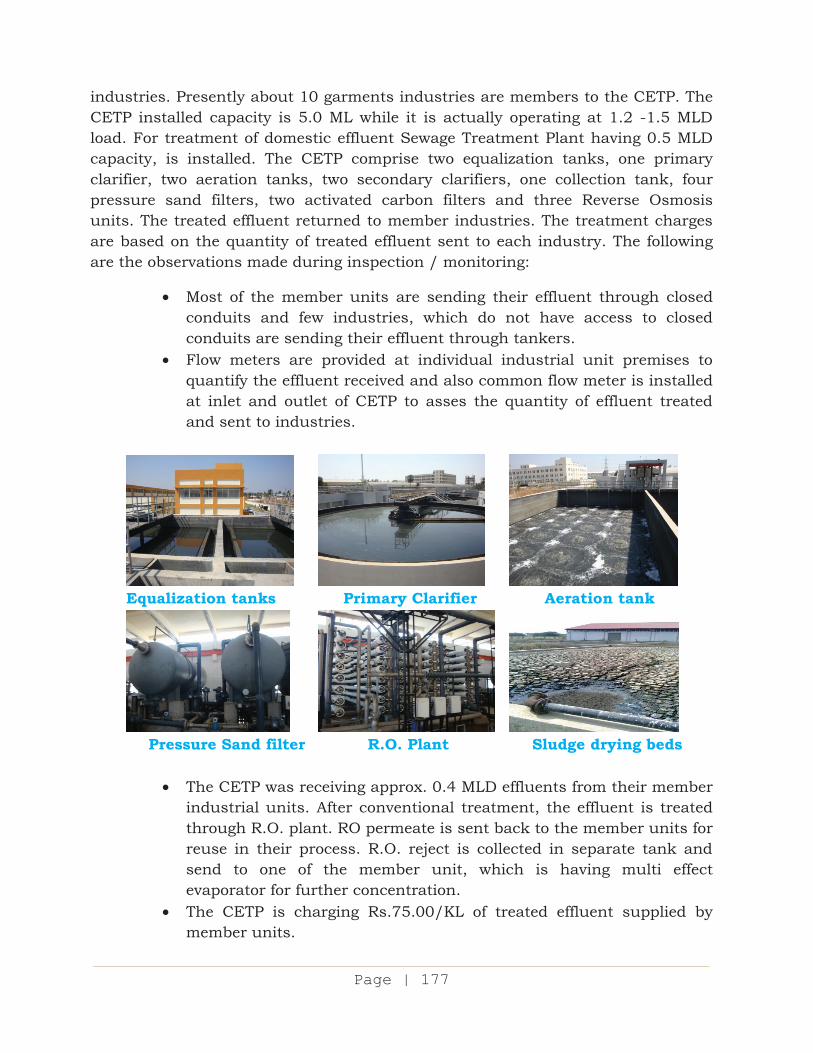
Page 145A lxi
Page | 177
industries. Presently about 10 garments industries are members to the CETP. The CETP installed capacity is 5.0 ML while it is actually operating at 1.2 -1.5 MLD load. For treatment of domestic effluent Sewage Treatment Plant having 0.5 MLD capacity, is installed. The CETP comprise two equalization tanks, one primary clarifier, two aeration tanks, two secondary clarifiers, one collection tank, four pressure sand filters, two activated carbon filters and three Reverse Osmosis units. The treated effluent returned to member industries. The treatment charges are based on the quantity of treated effluent sent to each industry. The following are the observations made during inspection / monitoring:
Most of the member units are sending their effluent through closed conduits and few industries, which do not have access to closed conduits are sending their effluent through tankers.
Flow meters are provided at individual industrial unit premises to quantify the effluent received and also common flow meter is installed at inlet and outlet of CETP to asses the quantity of effluent treated and sent to industries.
Equalization tanks Primary Clarifier Aeration tank
Pressure Sand filter R.O. Plant Sludge drying beds
The CETP was receiving approx. 0.4 MLD effluents from their member industrial units. After conventional treatment, the effluent is treated through R.O. plant. RO permeate is sent back to the member units for reuse in their process. R.O. reject is collected in separate tank and send to one of the member unit, which is having multi effect evaporator for further concentration.
The CETP is charging Rs.75.00/KL of treated effluent supplied by member units.
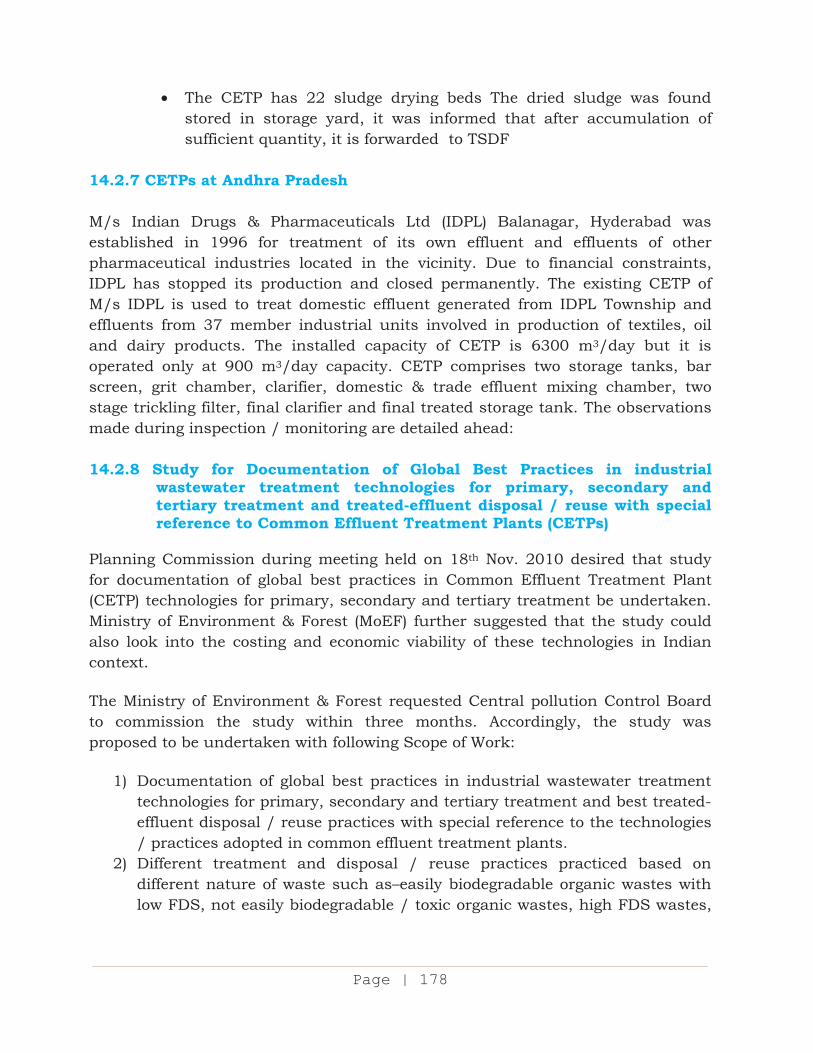
Page 145A lxii
Page | 178
The CETP has 22 sludge drying beds The dried sludge was found stored in storage yard, it was informed that after accumulation of sufficient quantity, it is forwarded to TSDF
14.2.7 CETPs at Andhra Pradesh M/s Indian Drugs & Pharmaceuticals Ltd (IDPL) Balanagar, Hyderabad was established in 1996 for treatment of its own effluent and effluents of other pharmaceutical industries located in the vicinity. Due to financial constraints, IDPL has stopped its production and closed permanently. The existing CETP of M/s IDPL is used to treat domestic effluent generated from IDPL Township and effluents from 37 member industrial units involved in production of textiles, oil and dairy products. The installed capacity of CETP is 6300 m3/day but it is operated only at 900 m3/day capacity. CETP comprises two storage tanks, bar screen, grit chamber, clarifier, domestic & trade effluent mixing chamber, two stage trickling filter, final clarifier and final treated storage tank. The observations made during inspection / monitoring are detailed ahead: 14.2.8 Study for Documentation of Global Best Practices in industrial
wastewater treatment technologies for primary, secondary and tertiary treatment and treated-effluent disposal / reuse with special reference to Common Effluent Treatment Plants (CETPs)
Planning Commission during meeting held on 18th Nov. 2010 desired that study for documentation of global best practices in Common Effluent Treatment Plant (CETP) technologies for primary, secondary and tertiary treatment be undertaken. Ministry of Environment & Forest (MoEF) further suggested that the study could also look into the costing and economic viability of these technologies in Indian context. The Ministry of Environment & Forest requested Central pollution Control Board to commission the study within three months. Accordingly, the study was proposed to be undertaken with following Scope of Work:
1) Documentation of global best practices in industrial wastewater treatment
technologies for primary, secondary and tertiary treatment and best treated-effluent disposal / reuse practices with special reference to the technologies / practices adopted in common effluent treatment plants.
2) Different treatment and disposal / reuse practices practiced based on different nature of waste such as–easily biodegradable organic wastes with low FDS, not easily biodegradable / toxic organic wastes, high FDS wastes,
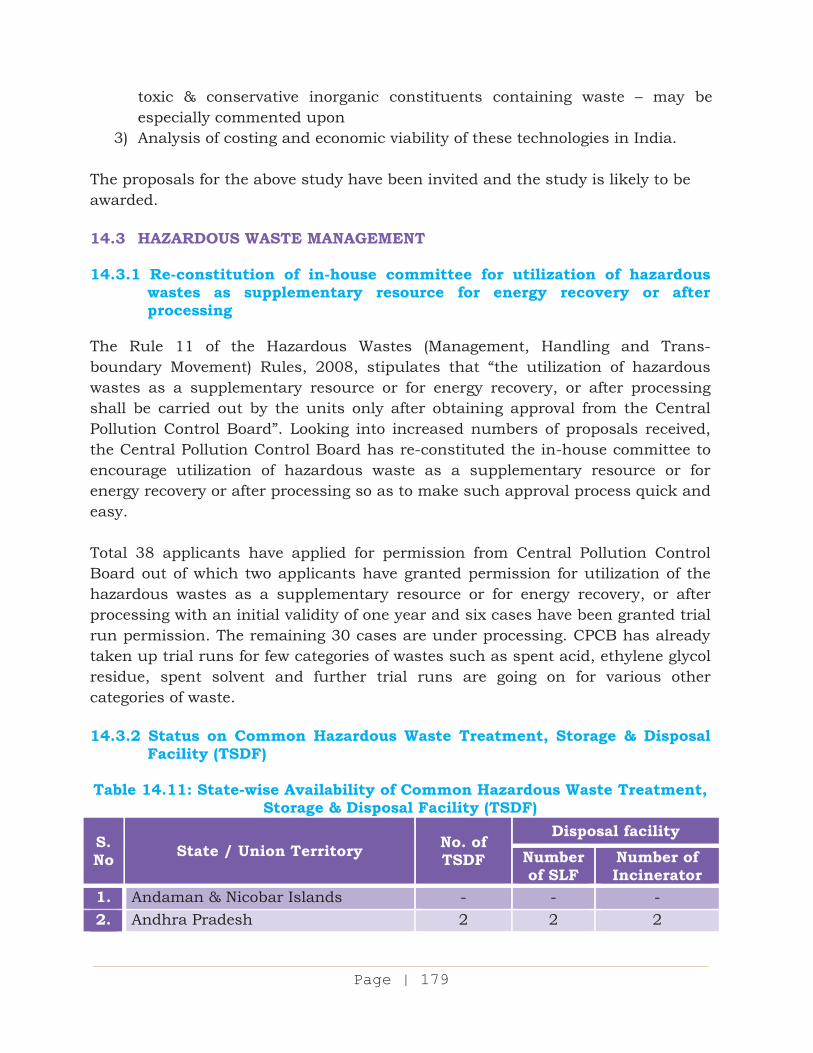
Page 145A lxiii
Page | 179
toxic & conservative inorganic constituents containing waste – may be especially commented upon
3) Analysis of costing and economic viability of these technologies in India. The proposals for the above study have been invited and the study is likely to be awarded. 14.3 HAZARDOUS WASTE MANAGEMENT
14.3.1 Re-constitution of in-house committee for utilization of hazardous
wastes as supplementary resource for energy recovery or after processing
The Rule 11 of the Hazardous Wastes (Management, Handling and Trans-boundary Movement) Rules, 2008, stipulates that “the utilization of hazardous wastes as a supplementary resource or for energy recovery, or after processing shall be carried out by the units only after obtaining approval from the Central Pollution Control Board”. Looking into increased numbers of proposals received, the Central Pollution Control Board has re-constituted the in-house committee to encourage utilization of hazardous waste as a supplementary resource or for energy recovery or after processing so as to make such approval process quick and easy. Total 38 applicants have applied for permission from Central Pollution Control Board out of which two applicants have granted permission for utilization of the hazardous wastes as a supplementary resource or for energy recovery, or after processing with an initial validity of one year and six cases have been granted trial run permission. The remaining 30 cases are under processing. CPCB has already taken up trial runs for few categories of wastes such as spent acid, ethylene glycol residue, spent solvent and further trial runs are going on for various other categories of waste.
14.3.2 Status on Common Hazardous Waste Treatment, Storage & Disposal
Facility (TSDF)
Table 14.11: State-wise Availability of Common Hazardous Waste Treatment, Storage & Disposal Facility (TSDF)
S. No State / Union Territory No. of
TSDF
Disposal facility Number of SLF
Number of Incinerator
1. Andaman & Nicobar Islands - - - 2. Andhra Pradesh 2 2 2
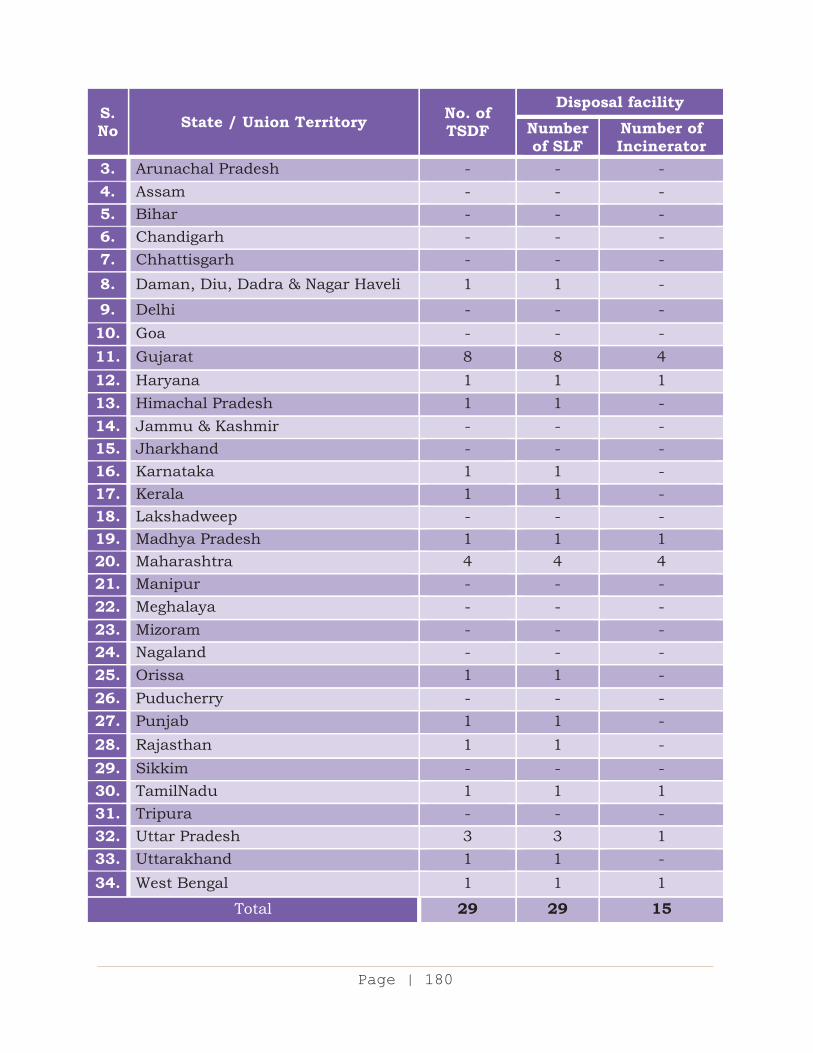
Page 145A lxiv
Page | 180
S. No State / Union Territory No. of
TSDF
Disposal facility Number of SLF
Number of Incinerator
3. Arunachal Pradesh - - - 4. Assam - - - 5. Bihar - - - 6. Chandigarh - - - 7. Chhattisgarh - - - 8. Daman, Diu, Dadra & Nagar Haveli 1 1 -
9. Delhi - - - 10. Goa - - - 11. Gujarat 8 8 4 12. Haryana 1 1 1 13. Himachal Pradesh 1 1 - 14. Jammu & Kashmir - - - 15. Jharkhand - - - 16. Karnataka 1 1 - 17. Kerala 1 1 - 18. Lakshadweep - - - 19. Madhya Pradesh 1 1 1 20. Maharashtra 4 4 4 21. Manipur - - - 22. Meghalaya - - - 23. Mizoram - - - 24. Nagaland - - - 25. Orissa 1 1 - 26. Puducherry - - - 27. Punjab 1 1 - 28. Rajasthan 1 1 - 29. Sikkim - - - 30. TamilNadu 1 1 1 31. Tripura - - - 32. Uttar Pradesh 3 3 1 33. Uttarakhand 1 1 - 34. West Bengal 1 1 1
Total 29 29 15
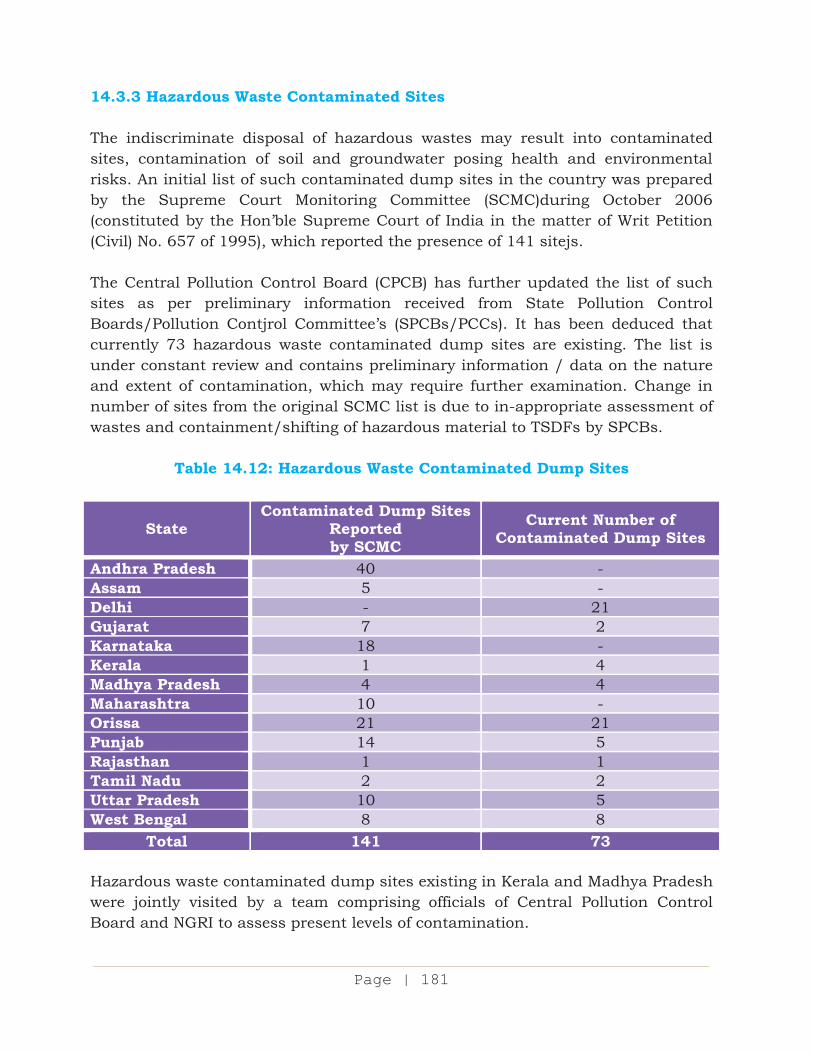
Page 145A lxv
Page | 181
14.3.3 Hazardous Waste Contaminated Sites The indiscriminate disposal of hazardous wastes may result into contaminated sites, contamination of soil and groundwater posing health and environmental risks. An initial list of such contaminated dump sites in the country was prepared by the Supreme Court Monitoring Committee (SCMC)during October 2006 (constituted by the Hon’ble Supreme Court of India in the matter of Writ Petition (Civil) No. 657 of 1995), which reported the presence of 141 sitejs. The Central Pollution Control Board (CPCB) has further updated the list of such sites as per preliminary information received from State Pollution Control Boards/Pollution Contjrol Committee’s (SPCBs/PCCs). It has been deduced that currently 73 hazardous waste contaminated dump sites are existing. The list is under constant review and contains preliminary information / data on the nature and extent of contamination, which may require further examination. Change in number of sites from the original SCMC list is due to in-appropriate assessment of wastes and containment/shifting of hazardous material to TSDFs by SPCBs.
Table 14.12: Hazardous Waste Contaminated Dump Sites
State Contaminated Dump Sites
Reported by SCMC
Current Number of Contaminated Dump Sites
Andhra Pradesh 40 - Assam 5 - Delhi - 21 Gujarat 7 2 Karnataka 18 - Kerala 1 4 Madhya Pradesh 4 4 Maharashtra 10 - Orissa 21 21 Punjab 14 5 Rajasthan 1 1 Tamil Nadu 2 2 Uttar Pradesh 10 5 West Bengal 8 8
Total 141 73 Hazardous waste contaminated dump sites existing in Kerala and Madhya Pradesh were jointly visited by a team comprising officials of Central Pollution Control Board and NGRI to assess present levels of contamination.
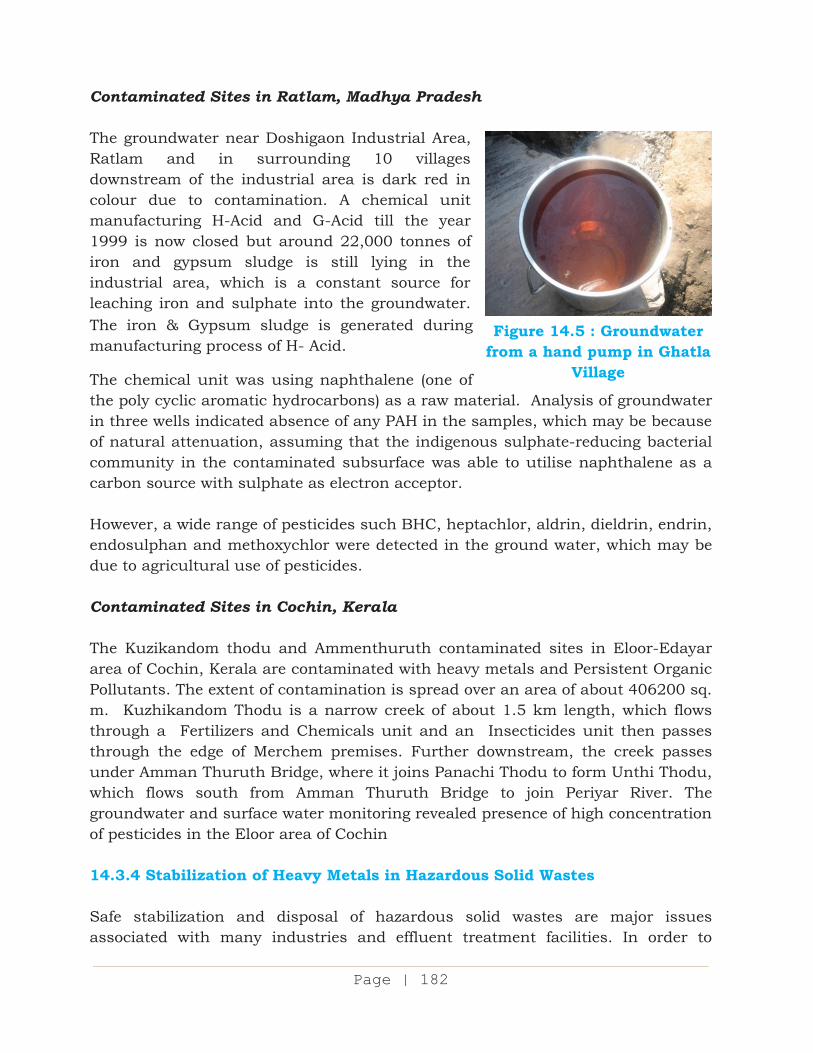
Page 145A lxvi
Page | 182
Contaminated Sites in Ratlam, Madhya Pradesh The groundwater near Doshigaon Industrial Area, Ratlam and in surrounding 10 villages downstream of the industrial area is dark red in colour due to contamination. A chemical unit manufacturing H-Acid and G-Acid till the year 1999 is now closed but around 22,000 tonnes of iron and gypsum sludge is still lying in the industrial area, which is a constant source for leaching iron and sulphate into the groundwater. The iron & Gypsum sludge is generated during manufacturing process of H- Acid.
The chemical unit was using naphthalene (one of the poly cyclic aromatic hydrocarbons) as a raw material. Analysis of groundwater in three wells indicated absence of any PAH in the samples, which may be because of natural attenuation, assuming that the indigenous sulphate-reducing bacterial community in the contaminated subsurface was able to utilise naphthalene as a carbon source with sulphate as electron acceptor. However, a wide range of pesticides such BHC, heptachlor, aldrin, dieldrin, endrin, endosulphan and methoxychlor were detected in the ground water, which may be due to agricultural use of pesticides. Contaminated Sites in Cochin, Kerala The Kuzikandom thodu and Ammenthuruth contaminated sites in Eloor-Edayar area of Cochin, Kerala are contaminated with heavy metals and Persistent Organic Pollutants. The extent of contamination is spread over an area of about 406200 sq. m. Kuzhikandom Thodu is a narrow creek of about 1.5 km length, which flows through a Fertilizers and Chemicals unit and an Insecticides unit then passes through the edge of Merchem premises. Further downstream, the creek passes under Amman Thuruth Bridge, where it joins Panachi Thodu to form Unthi Thodu, which flows south from Amman Thuruth Bridge to join Periyar River. The groundwater and surface water monitoring revealed presence of high concentration of pesticides in the Eloor area of Cochin 14.3.4 Stabilization of Heavy Metals in Hazardous Solid Wastes Safe stabilization and disposal of hazardous solid wastes are major issues associated with many industries and effluent treatment facilities. In order to
Figure 14.5 : Groundwater from a hand pump in Ghatla
Village
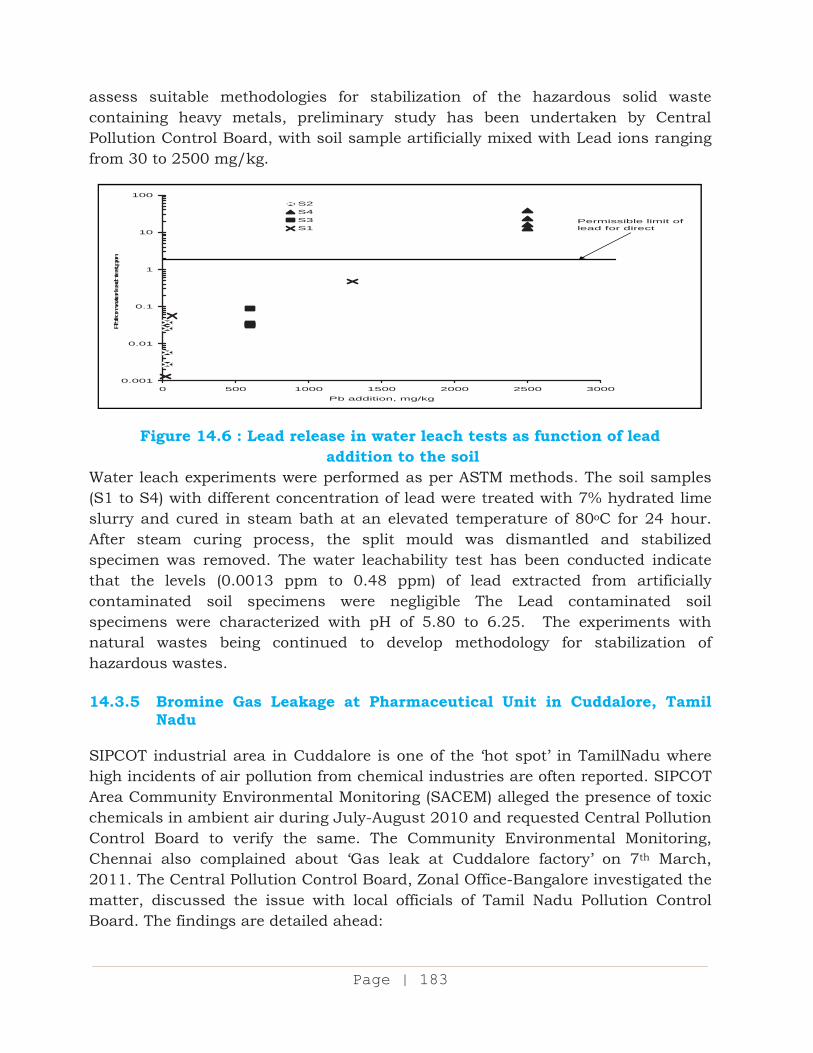
Page 145A lxvii
Page | 183
assess suitable methodologies for stabilization of the hazardous solid waste containing heavy metals, preliminary study has been undertaken by Central Pollution Control Board, with soil sample artificially mixed with Lead ions ranging from 30 to 2500 mg/kg.
Figure 14.6 : Lead release in water leach tests as function of lead addition to the soil
Water leach experiments were performed as per ASTM methods. The soil samples (S1 to S4) with different concentration of lead were treated with 7% hydrated lime slurry and cured in steam bath at an elevated temperature of 80oC for 24 hour. After steam curing process, the split mould was dismantled and stabilized specimen was removed. The water leachability test has been conducted indicate that the levels (0.0013 ppm to 0.48 ppm) of lead extracted from artificially contaminated soil specimens were negligible The Lead contaminated soil specimens were characterized with pH of 5.80 to 6.25. The experiments with natural wastes being continued to develop methodology for stabilization of hazardous wastes. 14.3.5 Bromine Gas Leakage at Pharmaceutical Unit in Cuddalore, Tamil
Nadu
SIPCOT industrial area in Cuddalore is one of the ‘hot spot’ in TamilNadu where high incidents of air pollution from chemical industries are often reported. SIPCOT Area Community Environmental Monitoring (SACEM) alleged the presence of toxic chemicals in ambient air during July-August 2010 and requested Central Pollution Control Board to verify the same. The Community Environmental Monitoring, Chennai also complained about ‘Gas leak at Cuddalore factory’ on 7th March, 2011. The Central Pollution Control Board, Zonal Office-Bangalore investigated the matter, discussed the issue with local officials of Tamil Nadu Pollution Control Board. The findings are detailed ahead:
0.001
0.01
0.1
1
10
100
0 500 1000 1500 2000 2500 3000
Pb addition, mg/kg
Pb from water leach test,ppm
S2S4S3S1
Permissible limit of lead for direct
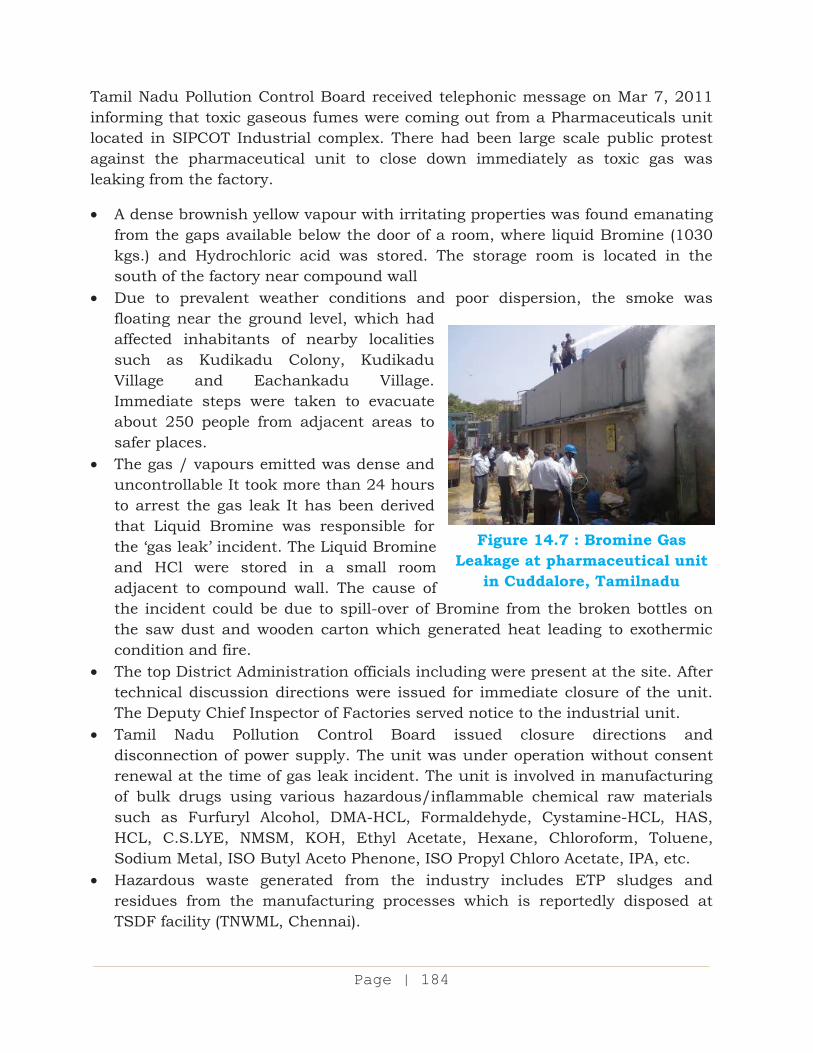
Page 145A lxviii
Page | 184
Tamil Nadu Pollution Control Board received telephonic message on Mar 7, 2011 informing that toxic gaseous fumes were coming out from a Pharmaceuticals unit located in SIPCOT Industrial complex. There had been large scale public protest against the pharmaceutical unit to close down immediately as toxic gas was leaking from the factory.
A dense brownish yellow vapour with irritating properties was found emanating from the gaps available below the door of a room, where liquid Bromine (1030 kgs.) and Hydrochloric acid was stored. The storage room is located in the south of the factory near compound wall
Due to prevalent weather conditions and poor dispersion, the smoke was floating near the ground level, which had affected inhabitants of nearby localities such as Kudikadu Colony, Kudikadu Village and Eachankadu Village. Immediate steps were taken to evacuate about 250 people from adjacent areas to safer places.
The gas / vapours emitted was dense and uncontrollable It took more than 24 hours to arrest the gas leak It has been derived that Liquid Bromine was responsible for the ‘gas leak’ incident. The Liquid Bromine and HCl were stored in a small room adjacent to compound wall. The cause of the incident could be due to spill-over of Bromine from the broken bottles on the saw dust and wooden carton which generated heat leading to exothermic condition and fire.
The top District Administration officials including were present at the site. After technical discussion directions were issued for immediate closure of the unit. The Deputy Chief Inspector of Factories served notice to the industrial unit.
Tamil Nadu Pollution Control Board issued closure directions and disconnection of power supply. The unit was under operation without consent renewal at the time of gas leak incident. The unit is involved in manufacturing of bulk drugs using various hazardous/inflammable chemical raw materials such as Furfuryl Alcohol, DMA-HCL, Formaldehyde, Cystamine-HCL, HAS, HCL, C.S.LYE, NMSM, KOH, Ethyl Acetate, Hexane, Chloroform, Toluene, Sodium Metal, ISO Butyl Aceto Phenone, ISO Propyl Chloro Acetate, IPA, etc.
Hazardous waste generated from the industry includes ETP sludges and residues from the manufacturing processes which is reportedly disposed at TSDF facility (TNWML, Chennai).
Figure 14.7 : Bromine Gas Leakage at pharmaceutical unit
in Cuddalore, Tamilnadu
Page 145A lxix
Page | 185
It was recommended that the industry shall prepare safety reports / safety audit reports through any of the reputed organization in accordance with MSIHC Rules, 1989 and implement its recommendations. The industry shall obtain renewal consent under The Water and Air Acts after ensuring compliance of consent conditions, MSIHC Rules, 1989 and HW Rules, 2008. 14.3.6 Registration of Hazardous wastes Recycling Units It is mandatory for the hazardous waste recycling units to register with Central Pollution Control Board as per provisions of Hazardous Wastes (Management, Handling and Trans-boundary Movement) Rules, 2008. The said provision was in force till August 31, 2010. The applications from 243 hazardous waste recycling units have been received till August 2010, These were processed for grant of registration for recycling of items as listed in schedule IV of the Hazardous Waste (Management Handling & Trans-boundary Movement) Rules, 2008, The Central Pollution Control Board, Western Zonal Office-Vadodara has inspected 58 industrial units located in western zone to develop Database of major potential wastes for co-processing in Cement / Thermal Power Plant / Iron & Steel / Sponge Iron industry in Gujarat & Maharashtra region and also for registration / renewal of registration as actual user of hazardous waste with environmentally sound management facility. The Hazardous Waste (Management Handling & Trans-boundary Movement) Rules, 2008, was amended in 2010 vide notification no. S.O.1996 (E) dated 13-08-2010 and accordingly the recycling units desirous of recycling of schedule IV items have to register with respective State Pollution Control Boards / Pollution Control Committees instead of Central Pollution Control Board. Accordingly 355 numbers of applications for grant / renewal of registration were transferred from CPCB to respective SPCBs / PCCs.
14.3.7 Status Report on Hazardous Wastes Generation Units
Hazardous Wastes generating units, located in Assam, have been visited by Central Pollution Control Board to compile information about the Characteristics of Hazardous Waste being generated by various Hazardous Waste Generating Units to prepare status report. The possibility of incineration of hazardous waste in Cement Kilns was also explored.
The characteristics of Hazardous Waste (Pickling sludge), being generated in a Cold Rolling Mill in Agartala was analyzed and found that it contains approximately 97.5% Iron Oxide (Fe2O3). The possibility of incineration of this waste in the Cement kilns is being explored. The status report is being compiled.
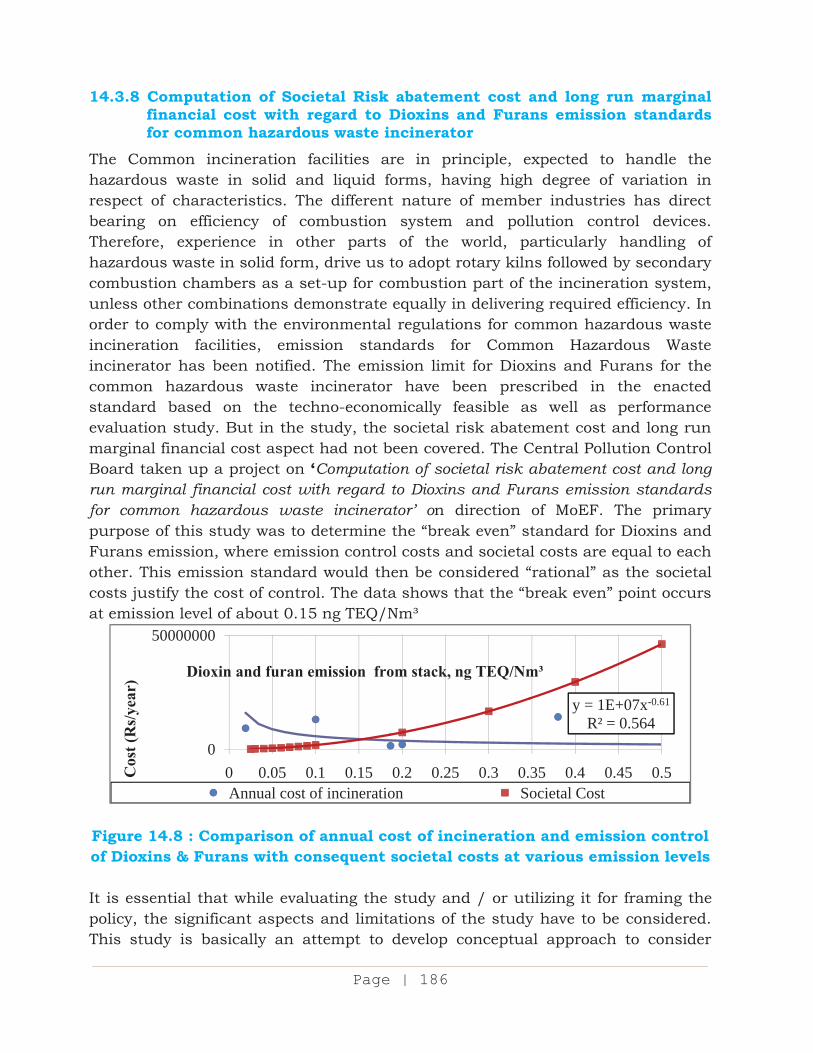
Page 145A lxx
Page | 186
14.3.8 Computation of Societal Risk abatement cost and long run marginal financial cost with regard to Dioxins and Furans emission standards for common hazardous waste incinerator
The Common incineration facilities are in principle, expected to handle the hazardous waste in solid and liquid forms, having high degree of variation in respect of characteristics. The different nature of member industries has direct bearing on efficiency of combustion system and pollution control devices. Therefore, experience in other parts of the world, particularly handling of hazardous waste in solid form, drive us to adopt rotary kilns followed by secondary combustion chambers as a set-up for combustion part of the incineration system, unless other combinations demonstrate equally in delivering required efficiency. In order to comply with the environmental regulations for common hazardous waste incineration facilities, emission standards for Common Hazardous Waste incinerator has been notified. The emission limit for Dioxins and Furans for the common hazardous waste incinerator have been prescribed in the enacted standard based on the techno-economically feasible as well as performance evaluation study. But in the study, the societal risk abatement cost and long run marginal financial cost aspect had not been covered. The Central Pollution Control Board taken up a project on ‘Computation of societal risk abatement cost and long run marginal financial cost with regard to Dioxins and Furans emission standards for common hazardous waste incinerator’ on direction of MoEF. The primary purpose of this study was to determine the “break even” standard for Dioxins and Furans emission, where emission control costs and societal costs are equal to each other. This emission standard would then be considered “rational” as the societal costs justify the cost of control. The data shows that the “break even” point occurs at emission level of about 0.15 ng TEQ/Nm³
Figure 14.8 : Comparison of annual cost of incineration and emission control of Dioxins & Furans with consequent societal costs at various emission levels
It is essential that while evaluating the study and / or utilizing it for framing the policy, the significant aspects and limitations of the study have to be considered. This study is basically an attempt to develop conceptual approach to consider
y = 1E+07x-0.61
R² = 0.5640
50000000
0 0.05 0.1 0.15 0.2 0.25 0.3 0.35 0.4 0.45 0.5Cos
t (R
s/ye
ar)
Annual cost of incineration Societal Cost
Dioxin and furan emission from stack, ng TEQ/Nm³
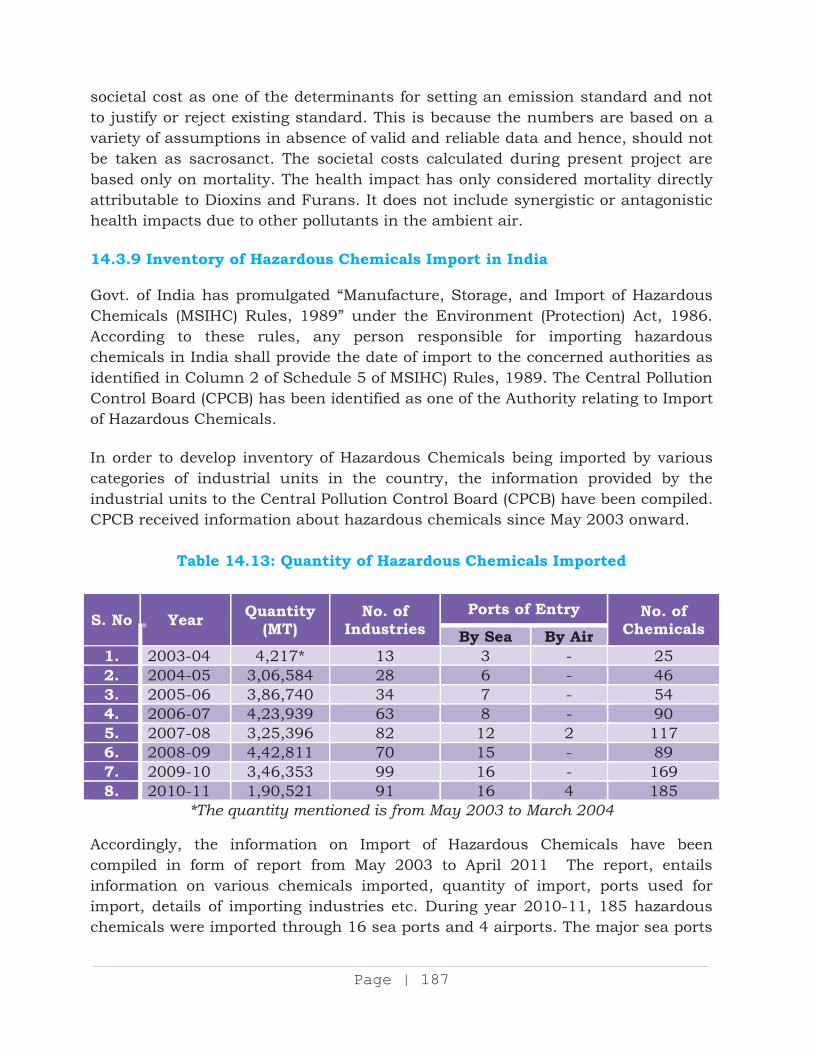
Page 145A lxxi
Page | 187
societal cost as one of the determinants for setting an emission standard and not to justify or reject existing standard. This is because the numbers are based on a variety of assumptions in absence of valid and reliable data and hence, should not be taken as sacrosanct. The societal costs calculated during present project are based only on mortality. The health impact has only considered mortality directly attributable to Dioxins and Furans. It does not include synergistic or antagonistic health impacts due to other pollutants in the ambient air. 14.3.9 Inventory of Hazardous Chemicals Import in India Govt. of India has promulgated “Manufacture, Storage, and Import of Hazardous Chemicals (MSIHC) Rules, 1989” under the Environment (Protection) Act, 1986. According to these rules, any person responsible for importing hazardous chemicals in India shall provide the date of import to the concerned authorities as identified in Column 2 of Schedule 5 of MSIHC) Rules, 1989. The Central Pollution Control Board (CPCB) has been identified as one of the Authority relating to Import of Hazardous Chemicals. In order to develop inventory of Hazardous Chemicals being imported by various categories of industrial units in the country, the information provided by the industrial units to the Central Pollution Control Board (CPCB) have been compiled. CPCB received information about hazardous chemicals since May 2003 onward.
Table 14.13: Quantity of Hazardous Chemicals Imported
S. No Year Quantity (MT)
No. of Industries
Ports of Entry No. of Chemicals By Sea By Air
1. 2003-04 4,217* 13 3 - 25 2. 2004-05 3,06,584 28 6 - 46 3. 2005-06 3,86,740 34 7 - 54 4. 2006-07 4,23,939 63 8 - 90 5. 2007-08 3,25,396 82 12 2 117 6. 2008-09 4,42,811 70 15 - 89 7. 2009-10 3,46,353 99 16 - 169 8. 2010-11 1,90,521 91 16 4 185
*The quantity mentioned is from May 2003 to March 2004
Accordingly, the information on Import of Hazardous Chemicals have been compiled in form of report from May 2003 to April 2011 The report, entails information on various chemicals imported, quantity of import, ports used for import, details of importing industries etc. During year 2010-11, 185 hazardous chemicals were imported through 16 sea ports and 4 airports. The major sea ports
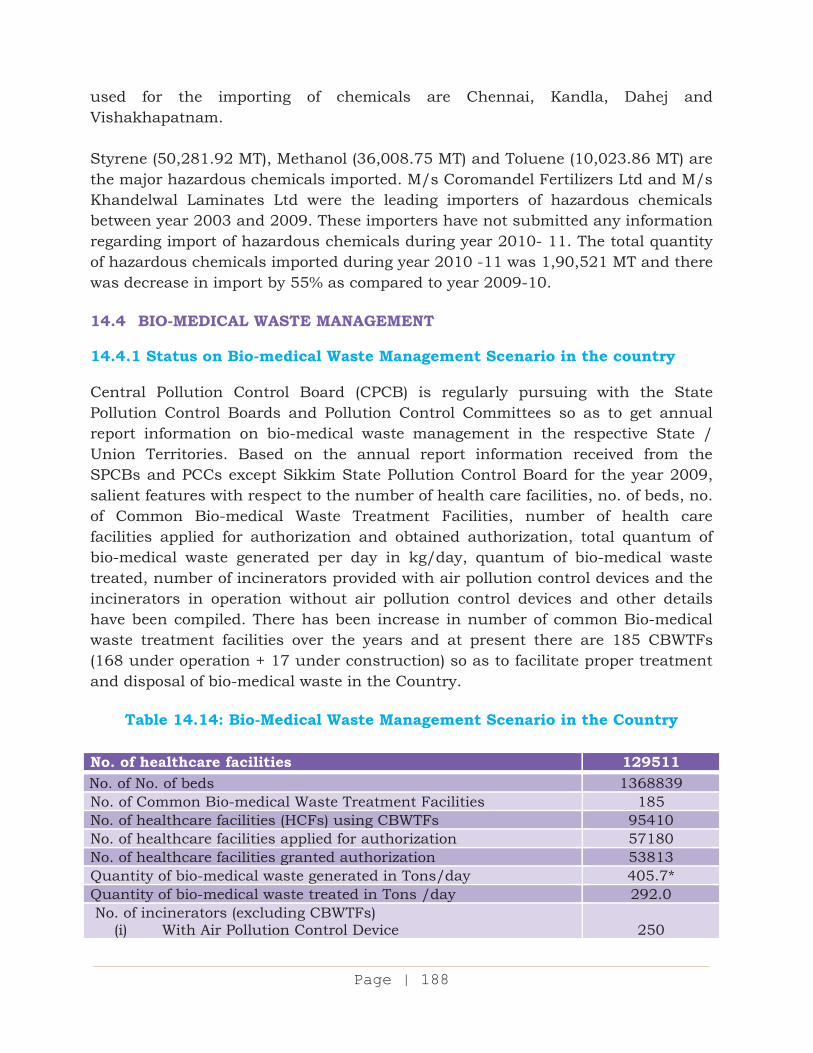
Page 145A lxxii
Page | 188
used for the importing of chemicals are Chennai, Kandla, Dahej and Vishakhapatnam. Styrene (50,281.92 MT), Methanol (36,008.75 MT) and Toluene (10,023.86 MT) are the major hazardous chemicals imported. M/s Coromandel Fertilizers Ltd and M/s Khandelwal Laminates Ltd were the leading importers of hazardous chemicals between year 2003 and 2009. These importers have not submitted any information regarding import of hazardous chemicals during year 2010- 11. The total quantity of hazardous chemicals imported during year 2010 -11 was 1,90,521 MT and there was decrease in import by 55% as compared to year 2009-10. 14.4 BIO-MEDICAL WASTE MANAGEMENT 14.4.1 Status on Bio-medical Waste Management Scenario in the country Central Pollution Control Board (CPCB) is regularly pursuing with the State Pollution Control Boards and Pollution Control Committees so as to get annual report information on bio-medical waste management in the respective State / Union Territories. Based on the annual report information received from the SPCBs and PCCs except Sikkim State Pollution Control Board for the year 2009, salient features with respect to the number of health care facilities, no. of beds, no. of Common Bio-medical Waste Treatment Facilities, number of health care facilities applied for authorization and obtained authorization, total quantum of bio-medical waste generated per day in kg/day, quantum of bio-medical waste treated, number of incinerators provided with air pollution control devices and the incinerators in operation without air pollution control devices and other details have been compiled. There has been increase in number of common Bio-medical waste treatment facilities over the years and at present there are 185 CBWTFs (168 under operation + 17 under construction) so as to facilitate proper treatment and disposal of bio-medical waste in the Country.
Table 14.14: Bio-Medical Waste Management Scenario in the Country
No. of healthcare facilities 129511 No. of No. of beds 1368839 No. of Common Bio-medical Waste Treatment Facilities 185 No. of healthcare facilities (HCFs) using CBWTFs 95410 No. of healthcare facilities applied for authorization 57180 No. of healthcare facilities granted authorization 53813 Quantity of bio-medical waste generated in Tons/day 405.7* Quantity of bio-medical waste treated in Tons /day 292.0 No. of incinerators (excluding CBWTFs)
(i) With Air Pollution Control Device
250
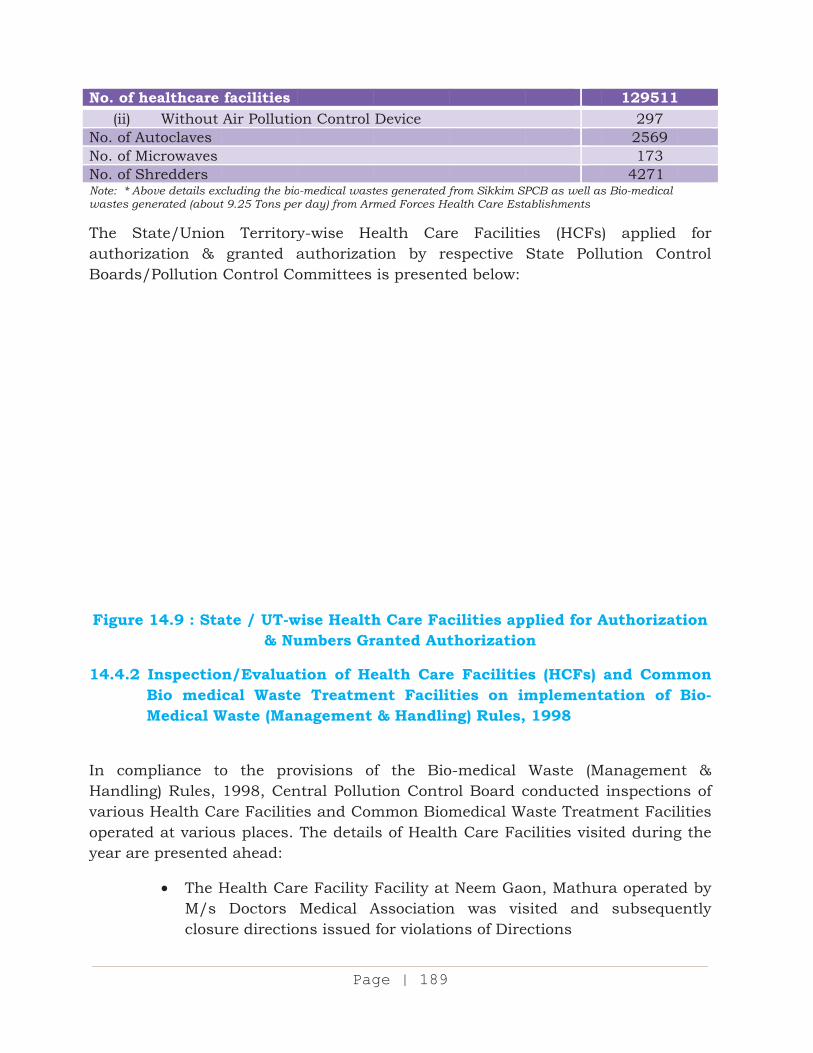
Page 145A lxxiii
No. of h(ii)
No. of AuNo. of MNo. of ShNote: * Abwastes gen The StauthorizBoards/
Figure
14.4.2
In comHandlinvarious operatedyear are
healthcare Without
utoclaves Microwaves
hredders bove details exnerated (about
tate/Unionzation & /Pollution
14.9 : Sta
InspectioBio mediMedical W
mpliance tong) Rules,
Health Cad at varioue presented
The HM/s closu
facilities Air Pollutio
cluding the biot 9.25 Tons pe
n Territorygranted aControl Co
ate / UT-w& Nu
n/Evaluatcal Waste
Waste (Man
o the pro1998, Cen
are Facilitieus places. d ahead:
Health CarDoctors
ure directio
Pag
on Control
o-medical wastr day) from Ar
y-wise Heauthorizatommittees
wise Healthumbers Gr
tion of Hee Treatmenagement
ovisions ontral Pollutes and ComThe detail
re Facility Medical A
ons issued
ge | 189
Device
tes generated fmed Forces He
ealth Carion by reis present
h Care Facranted Aut
ealth Careent Facili& Handlin
f the Biotion Contrmmon Biomls of Health
Facility at Associationfor violatio
from Sikkim SPealth Care Esta
re Facilitieespectiveted below:
cilities apthorizatio
e Facilitieties on imng) Rules,
o-medical rol Board cmedical Wh Care Fac
Neem Gaon was visons of Dire
PCB as well asablishments
es (HCFsState Poll
plied for An
es (HCFs) mplement 1998
Waste (Mconducted
Waste Treatmcilities visi
on, Mathusited and ections
129511297 2569 173
4271 s Bio-medical
) applied lution Con
Authorizat
and Commtation of
Managemeninspection
ment Facilited during
ra operatesubseque
for ntrol
tion
mon Bio-
nt & ns of lities g the
ed by ently
Page 145A lxxiv
Page | 190
Visited G.B.Pant Hospital, Rao Tularam Hospital, Lal Bahadur Shastri Hospital and Deen Dayal Upadhyaya Hospitals to assess the performance of ‘Sharp Blaster’.
Visit to Dharamshila & Rajiv Gandhi Cancer Research Hospital Rohini by the committee to understand Cytotoxic Drugs Storage & its disposal methods being followed by Health Care Facilities.
Inspection of M/s SMS Water Grace BMW Pvt. Ltd. (Common Bio-Medical Waste Treatment Facility) at Nilothi, Delhi, on 1st March.2011 for verification of equipments installed for treatment of bio-medical waste.
The Common Bio-Medical Waste Treatment Facility operated by M/s Vulcan Waste Management Pvt. Limited, Damdama Road, Village Bhondsi, Gurgaon, Haryana was visited three times to verify the compliance of Directions issued under Section 5 of the E(P) Act, 1986.
Inspection of thirteen Health Care Facilities located in Delhi, Noida & Gurgaon for sampling of waste water for analysis of mercury content. The result indicates that Total Mercury concentration in final outlet of ETP was between NT – 5 mg/l. The results forwarded to AIIMS, New Delhi.
14.4.3 Evaluation of New Proposed State-of-Art Treatment Technologies for
Safe disposal of Bio-Medical Waste
Central Pollution Control Board Organized 10th Expert Committee Meeting on 1st September, 2010 under the Chairmanship of Dr. T. K. Joshi, in which following three proposals of new State-of-Art Treatment Technologies for safe disposal of Bio Medical Waste were considered:
M/s Trade International for the Technology “PIWS 3000 (Static / Mobile)” Submitted vide letter No. Nil dated April 13, 2010
M/s AGA Process Solutions for “Microwave Disinfection System” Submitted vide letter No. Nil dated April 28, 2010;
“Portable dual Mediburn-Medical Bio-Waste Incinerator” Submitted vide letter No. Nil dated May 07, 2010 received from M/s Henna Marine Engineering DMCC, Vile Parle (E), Mumbai, Maharashtra
After deliberations in the meeting, following decisions were taken by the Expert Committee:
The proponent of “PIWS -3000 Unit” shall submit feasibility report to Central Pollution Control Board taking into account of heterogeneity of Bio-medical wastes, which shall include waste categories 1 & 2 as
Page 145A lxxv
Page | 191
stipulated under BMW Rules vis-à-vis performance and the performance results of the unit will be discussed in the committee for further consideration with regard to the approval required in the Bio-medical Waste (Management & Handling) Rules, 1998 and amendments thereof;
The proponent of “Microwave Disinfection Unit” shall conduct more research and disinfection efficacy testing of the system for treatment of anatomical & animal wastes and feasibility report of the same by some renowned Govt. Approved Laboratories shall be submitted to Central Pollution Control Board for further assessment. The proponent should also provide justification in regard to the suitability of their proposed system for the treatment of aforesaid bio-medical wastes;
The proposal of state-of-the-art- technology namely “Portable dual Mediburn-Medical Bio-Waste Incinerator” received from M/s Henna Marine Engineering, Vile Parle (E), Mumbai, Maharashtra shall stand rejected as the proponent has not appeared before the Expert Committee for various explanations.
In the 11th Expert Committee Meeting organized by Central Pollution Control Board, the proposal on ‘Plasma Pyrolysis Technology’ from FCIPT was again considered along with the proposal of “PIWS 3000 (Static / Mobile) i.e. shredding cum chemical disinfection received from M/s Trade International on 12th February, 2011. Further follow-up action has been taken by Central Pollution Control Board on the minutes of the meeting. 14.4.4 Monitoring of Common Bio-Medical Waste Treatment Facilities &
Armed Forces Health Care Establishments
The Central Pollution Control Board Zonal Office Vadodara carried out inspections and monitoring of the health care facilities of the armed forces, common bio-medical waste management facilities and other Health Care Facilities, Govt. Hospital located in Western Zone.
Armed Forces Health Care facilities Dockyard Dispensary, Naval Dockyard, Mumbai It provides preventive, promotive, curative and rehabilitative health care to all the workers & service personnel (about 11500 persons) of Naval Dockyard. In addition it provides emergency medical care to approximately 500 contract labourers. Naval Hospital, Powai, Mumbai
The hospital provides comprehensive medical cover including in-hospital and general treatment in basic specialties of medicine, surgery & gynecology to the
Page 145A lxxvi
Page | 192
industrial workers of Naval Dockyard (MB), Material Organization (Ghatkopar), NAD (Trombay) & NSD (Sewri) MI Room, Material Organization, NSD, Ghatkopar, Mumbai
It provides medical services to the industrial employees (about 2500) of Material Organization.
The above health care facilities of armed forces have tie-ups with Bio-Medical Waste disposal facilities. These health care facilities of armed forces have constituted BMW Management Committee and have framed their own “Standard Operating Procedure” for the management of BMW in order to ensure safe & hygienic disposal of Bio-Medical Waste from the hospital in conformity with the stipulated provisions of Bio-Medical Waste Management Rules. However these facilities are required to obtain Authorization issued by the Office of DGAFMS under Bio-medical Waste (M & H) Rules, 1998.
Common Bio-Medical Waste Treatment Facility (BMWTF)
M/s En-vision Enviro Engineers Pvt. Ltd., Surat, Gujarat
It covers 5237 healthcare facilities & caters 11187 beds. The facility has one CNG fired dual chamber incinerator of 200 kg/hr capacity, one horizontal autoclave of 125 kg/hr capacity and three shredders of total 400 kg/hr capacity. The effluents from the floor washing, vehicle washing and scrubber blow-down are collected into the collection tank of ETP. The treated effluent is discharged to the SMC underground drain which is connected to the STP, Bhatar.
M/s Care B.M.W. Incineration, Gandhinagar, Gujarat
It is an ISO-14001: 2004 certified facility, cover 2500 health care facilities and around 7500 beds. The facility has two dual chambered incinerators with 30 m height stack and ventury, followed by Water scrubber as APCD. The floor washing, vehicle washing and scrubber blow down water taken into the ETP and treated. The treated wastewater is reused as make-up water in scrubber. Semb Ramky Environmental Management Pvt.Ltd., Ahmedabad, Gujarat Around 3,000 - 3,600 kg/day of Bio-Medical Waste is treated at the facility and covers around 1382 Healthcare facilities and 9464 Beds. M/s PolluCare B.M.W. Pvt. Ltd., Ahmedabad, Gujarat
The facility covers more than 1100 health care facilities. The facility has one dual chambered incinerator of 200 kg/hr capacity with 30 m height stack and ventury,
Page 145A lxxvii
Page | 193
followed by Water scrubber as APCD. The facility has vertical autoclave, operated electrically.
None of the above common bio-medical waste treatment facilities have computerized barcode system. However, computerized waste receipt records (classified according to color code and month wise) are maintained by them.
Health Care Facility (HCF) of New Civil Hospital, Majura Gate, Surat Gujarat
New Civil Hospital is a multi-specialty 1050 bedded hospital. The Bio-Medical waste is generated from all the wards & departments. The hospital imparts treatment to incinerable bio-medical waste at its own incineration facility. However, it forwards other bio-medical wastes to Common Bio-Medical Waste Treatment Facility for treatment & disposal. The hospital does not operate separate STP and discharges the untreated wastewater into Surat Municipal Corporation’s underground drain, which is connected to STP.
14.4.5 Bio-Medical Waste Management in Central Zone
M/s Elite Engineers, Jabalpur, (M.P.) The Common Bio-medical Waste Treatment Facility at Jabalpur, Madhya Pradesh was established in the year 2006 for treatment of biomedical waste generated in Jabalpur and Katni. The facility was monitored by Central Pollution Control Board, Zonal Office-Bhopal. The observations are as below:
The facility has installed two chambered incinerator with incineration capacity of 100 kg per hour. The PLC device was not installed and facility was directed to install the same immediately.
The facility had also installed an autoclave of 100 lit/per cycle of 45 minutes capacity and shredder of 50 kg/hr to shred plastic contents of Bio-Medical Waste. The facility has also provided CC pit fitted with MS cover for sharp storage.
The stack monitoring was conducted for PM, SOx and HCl with measurement of CO2 and O2 percentage in flue gas. The PM concentration in stack emission was found 95 mg/Nm3 with 9.5% carbon dioxide in flue gas. The emission after CO2 correction will be 120 mg/Nm3.
The facility has installed ETP consisting of collection pit, chemical dosing tank and settling tanks. The finally treated effluent is stored in a tank and used for gardening. The ETP undertakes 60-70% removal of suspended solids and COD.
Page 145A lxxviii
Page | 194
M/s Hoswin Incinerators Pvt. Ltd. Indore (Madhya Pradesh)
The Common Bio-medical Waste Treatment Facility, Hoswin Incinerator Pvt. Ltd at Indore, Madhya Pradesh was established in January 2002 by Nursing Homes Association of Indore The facility was inspected on 9th June 2010.The status of compliance is as below:
The facility is using two types of containers of same capacity (30 Kg) and different colours (Blue and Yellow) for collection of Bio-Medical Waste from hospitals. Total 80 containers with lid were found in use for collection and storage of Bio-Medical Waste.
The facility has installed two chambered incinerator with PLC system for incineration capacity of 250 kg per hour. The incinerator is operational with automatic temperature recording device.
The facility has autoclave of 60 kg/per cycle of 45 minutes capacity for autoclaving of Bio-Medical Waste category 3, 4, 6 and 7. The PLC attached with autoclave has the facility to print set parameters only without indicating actual temperature and pressure.
The stack monitoring was conducted on the day of inspection for PM, NOx and HCl with measurement of CO2 and O2 percentage in flue gas. The Particulate Matter in stack emission was found 71.5 mg/Nm3
with 5 % CO2 in flue gas indicating about 2.4 times of dilution air for 12% CO2 correction. High concentration of NOx in flue gas, indicate excess dilution.
The facility has installed ETP consisting of equalization tank, lamella clarifier and three sludge drying beds for treatment of process waste.
14.4.6 Bio-Medical Waste Management in Eastern Region Status of Hospitals and CBMWTF in Eastern Region On the basis of information collected from State Pollution Control Board’s Regional offices and various other bodies, inspection cum monitoring was undertaken by Central Pollution Control Board Zonal Office Kolkata at randomly selected health care facilities and Common Bio-Medical Waste Treatment Facility. The findings are as below: Health Care Facilities / Hospitals M/s Peerless Hospital, Kolkata The Hospital has about 300 Beds with average occupancy of 60%. The Bio-Medical waste generation has been found as 48.83 Kg/day from OT, ICU, ICCU Pathology
Page 145A lxxix
Page | 195
Labs, Wards and OPDs. The category wise generation is 200 Kg/month for Category No.1; 125 Kg/month for category No. 3; 100 Kg/month for Category No. 4; 50 Kg/month for Category No. 5; 1375 Kg/month for Category No. 6; 1130 Kg/month for Category No. 7 and 500 litres/month for Category No. 8. The Bio medical Waste is segregated at its point of generation and stored in colored containers and plastic bags. The wastewater is being treated in ETP consisting of Storage tank followed by screening channel, aeration tank and secondary clarifier with bleaching powder dosing tank. The treated wastewater is discharged into the municipal drain. M/s Medica Super Specialty Hospital, Kolkata The Hospital has 158 Beds with average occupancy of 70%. The Bio-Medical waste generation has been found as 121 Kg/day from OT, ICU, ICCU Pathology Labs, Wards and OPDs. The category wise generation is 20208 g/annum in Blue Bag Category; 18404 g/annum for Yellow Bag Category and 5525 Kg/annum Sharps. The Bio medical waste is segregated at the point of generation, stored in colored containers and plastic bags. The waste is stored at a common collection point from where it is lifted by Common Bio Medical Waste Treatment Facility Operator. The wastewater is treated in ETP consisting of storage tank followed by screen chamber, equalization tank, primary settler, secondary settler, chlorine contact tank, multigrade filter and activated carbon filter. The treated water is stored from where it is used for flushing systems in toilets. The treated waste water after softening in softener is used for cooling tower of air conditioning system. M/s Fortis Hospital, Anandpur, Kolkata The Hospital has 167 Beds with average occupancy of 40%. The Bio-Medical waste generation has been found as 200g/bed/day from OT, ICU, ICCU Pathology Labs, Wards and OPDs. The category wise generation is 15% for Category No.1, 5% for category No. 3; 10% for Category No. 4; 3% for Category No. 5; 32% for Category No. 6; 35% for Category No. 7 and 15 litres/day for Category No. 8. The Bio medical Waste is segregated at its point of generation and stored in colored containers and plastic bags. The wastewater produced is treated in ETP constituting storage tank screen chamber, equalization tank, primary settler, secondary settler, chlorine contact tank, multigrade filter and activated carbon filter. The treated water is stored in a storage tank, from where it is used for flushing systems in toilets and also cooling tower for air conditioning system after softening.
Page 145A lxxx
Page | 196
M/s DeSun Hospital, Kolkata
The Hospital has 214 Beds with average occupancy of 90%. The Bio-Medical waste generation has been found as 49 Kg/day from OT, ICU, ICCU Pathology Labs, Wards and OPDs. Daily water consumption is 3600 Kiloliter. The category wise generation is182 Kg/month for Category No.1; 106 Kg/month for category No. 3; 27 Kg/month for Category No. 4; 545 Kg/month for Category No. 6; 623 Kg/month for Category No. 7 and 1047 liters / month for Category No. 8. Bio medical waste is segregated at point of generation and stored in colored containers and plastic bags. The wastewater produced is treated in ETP comprising of two Storage tanks with bleaching powder and chemical dosing system. The treated Wastewater is discharged into municipal drain.
Combined Bio Medical Waste Treatment Facility (CBMWTF)
SembRamky Environmental Management Pvt. Ltd., Howrah
Total Beds Covered - 30,000/day Waste collected–8,000Kg/day (7,000Kg incinerable & 1,000 Kg autoclavable); Autoclaving Capacity – 430 l/batch Segregation and Storage – In colour coded plastic bins, plastic bags and PPC containers. Incineration Capacity – 250 Kg/hr (temperature Min- 850 ± 50 oC, Max 1050 ± 50 oC); Shredding Capacity – 60 Kg/hr Water Consumption – 6.3 Kl/day Bore well water Wastewater Generation – 5.5 Kl/day (Industrial 3.5 Kl/day and Domestic 2 Kl/day)
The wastewater from water scrubber and other utilities is treated in Effluent Treatment Plant, which includes storage tank, baffled type settling chamber, secondary settling tank, pressure sand filter and activated carbon filter .The treatment is closed loop recirculation system, hence no treated wastewater is discharged SembRamky Environmental Management Pvt. Ltd, Kalyani
Total Beds Covered -30,000/day Waste collected–4,000Kg/day (3500 Kg incinerable & 500 Kg autoclavable)
Page 145A lxxxi
Page | 197
Segregation and Storage–In color coded plastic bins, plastic bags and PPC containers. Incineration Capacity – 250 Kg/hr (temperature Min-850 ± 50 °C, Max 1050 ± 50 °C), Shredding Capacity – 50 Kg/hr Autoclaving Capacity – 630 l/batch Water Consumption – 6 Kl/day Bore well water Wastewater Generation – 5.5 Kl/day (Industrial 3.5 Kl/day and Domestic 2 Kl/day)
The wastewater from water scrubber and other utilities is treated in Effluent Treatment Plant, which includes storage tank, baffled type settling chamber, secondary settling tank, pressures sand filter and activated carbon filter .The treatment is closed loop recirculation system, so the treated wastewater is not discharged. Green Zen Bio Pvt. Ltd., Siliguri
Coverage–Hospitals of Malda, Siliguri, Darjeeling and Coochbehar Region Waste collected – 1200 Kg/day Segregation and Storage – In color coded plastic bins, plastic bags and PPC containers. Incineration Capacity – 150 Kg/hr (temperature Min-850 ± 50 °C, Max 1050 ± 50 °C), Shredding Capacity – 250 Kg/hr Autoclaving Capacity – 648 l/batch Water Consumption – 3 Kl/day Bore well water
The wastewater from water scrubber and other utilities is treated in Effluent Treatment Plant, which includes storage tank, baffled type settling chamber, secondary settling tank, pressures sand filter and activated carbon filter. The treatment is closed loop recirculation system, so the treated wastewater is not discharged. 14.4.7 Common Biomedical Waste Treatment Facilities – Southern Region In South Zone, 36 Common Bio Medical Waste Treatment facilities are in operation of which six units were inspected during the year by Central Pollution Control Board, Zonal Office-Bangalore. Based on the monitoring results Central Pollution Control Board had issued Directions under Section (5) of the E (P) Act 1986 to all the six units. Based on action taken report, Bank Guarantee and directions from respective state pollution control boards, most of the units have upgraded their
Page 145A lxxxii
Page | 198
infrastructure facilities to improve performance. Periodic review and inspection of these units are being undertaken by Central Pollution Control Board. 14.5 STATUS OF IMPLEMENTATION OF MUNICIPAL SOLID WASTES
(MANAGEMENT AND HANDLING) RULES, 2000 (MSW RULES) The Urban Local bodies (ULBs) are directly responsible for implementation of Municipal Solid Waste (Management and Handling) Rules, 2000 for management of Municipal Solid wastes in their respective cities / Towns. As per Municipal Solid Waste Rules, 2000, each State Pollution Control Board / Pollution Control Committee requires to submit Annual Report to Central Pollution Control Board by 15th of September and Central Pollution Control Board is required to submit Consolidated Annual Review Report to Ministry of Environment & Forests by 15th of December every year. Since, proper information is not being received from Municipalities; the SPCBs/PCCs are unable to submit Annual Report as per the prescribed time.
Most of the municipalities are following intra-city activities with regard to house-to-house collection, storage, transportation but they are lacking in waste treatment and its scientific disposal in sanitary landfills. This shortfall is due to the funds constraint, skilled manpower and to some extent due to non- availability of space for construction of sanitary landfill sites. The common scenario is such that the town / city in the country are having 2-3 old dump sites posing threat to environmental pollution, which needs to be reclaimed and converted into secured landfill sites. The new landfill sites identified by ULBs are also facing public resistance and encroachment due to inadequate planning. Some good efforts regarding Municipal Solid Waste Management are observed in the state of Andhra Pradesh (Hyderabad, Guntur & Vijaywada); Goa; Gujarat (Ahmedabad, Surat, Rajkot, Vadodara); Madhya Pradesh (Bhopal & Gwalior); Maharashtra (Pune, Nashik, Nagpur & Mumbai); Uttar Pradesh (Lucknow & Kanpur) and Kolkata (39 Urban Local Bodies),
The sanitary landfills have been developed at Bangalore, Mangalore, Karwar, Puttur, Ankola, Surat, Alang, Nashik, Sonpeth, Ambad, Chandigarh, Bhopal, Ambala, Jodhpur, etc. Most of the waste processing technologies adopted are vermi-composting, aerobic composting and at some places Biogas, Waste-to-Energy projects also being operated.
14.5.1 Municipal Solid Waste Management Demonstration Projects
Ministry of Environment & Forests and Central Pollution Control Board have instituted a scheme for setting up of demonstration project on municipal solid waste management in accordance with Municipal Solid Waste Management (MSW)
Page 145A lxxxiii
Page | 199
Rules. The objective of the scheme is to demonstrate implementation of MSW Rules in an integrated manner. The scheme is based on cost sharing basis, where concerned local body is required to contribute 50% of total cost of the project. The status of demonstration projects undertaken at selected towns is as below:
S. No. State Towns Status
1. West Bengal North Dum-Dum & New Barrackpore
Completed
2. UT Chandigarh Chandigarh Completed
3. Tamil Nadu Udumalpet Delayed
4. Kerala Kozhikode (MoEF) -
5. Himachal Pradesh Mandi Completed Ph-I
6. Andhra Pradesh Suryapet Completed
7. Nagaland Kohima Delayed
8. Maharashtra Jalna Delayed
9. Arunachal Pradesh Itanagar Withdrawn
10. Sikkim South West District Delayed
11. Tripura Agartala Completed Ph-I
12. Gujarat AUDA (MoEF) -
14.5.2 Municipal Solid Waste Management related studies The Central Pollution Control Board has initiated following studies related to Municipal Solid Waste Management through State Governments and various State Agencies; Studies on Monitoring of Landfill The Central Pollution Control Board in association with CSIR-National Environmental Engineering Research Institute, Nagpur studied the “Groundwater Quality around landfill site of Bhalsawa and Ghazipur”. The study has been completed and the report published. Similarly, the study “Monitoring of Ground Water and Ambient air quality around landfill sites for compliance verification” in the States of Assam, Meghalaya, Andhra Pradesh and Himachal Pradesh have been sponsored by Central Pollution Control Board. The study has been completed at Assam while reports from other states are awaited.
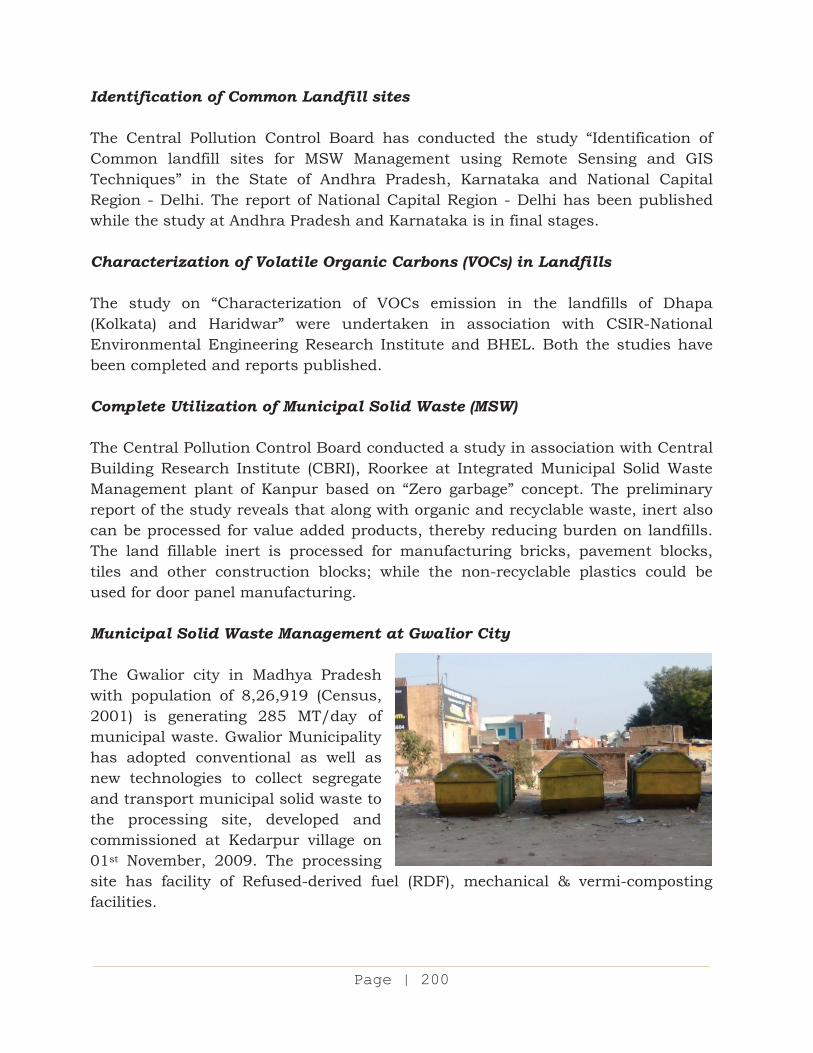
Page 145A lxxxiv
Page | 200
Identification of Common Landfill sites The Central Pollution Control Board has conducted the study “Identification of Common landfill sites for MSW Management using Remote Sensing and GIS Techniques” in the State of Andhra Pradesh, Karnataka and National Capital Region - Delhi. The report of National Capital Region - Delhi has been published while the study at Andhra Pradesh and Karnataka is in final stages. Characterization of Volatile Organic Carbons (VOCs) in Landfills The study on “Characterization of VOCs emission in the landfills of Dhapa (Kolkata) and Haridwar” were undertaken in association with CSIR-National Environmental Engineering Research Institute and BHEL. Both the studies have been completed and reports published. Complete Utilization of Municipal Solid Waste (MSW) The Central Pollution Control Board conducted a study in association with Central Building Research Institute (CBRI), Roorkee at Integrated Municipal Solid Waste Management plant of Kanpur based on “Zero garbage” concept. The preliminary report of the study reveals that along with organic and recyclable waste, inert also can be processed for value added products, thereby reducing burden on landfills. The land fillable inert is processed for manufacturing bricks, pavement blocks, tiles and other construction blocks; while the non-recyclable plastics could be used for door panel manufacturing. Municipal Solid Waste Management at Gwalior City The Gwalior city in Madhya Pradesh with population of 8,26,919 (Census, 2001) is generating 285 MT/day of municipal waste. Gwalior Municipality has adopted conventional as well as new technologies to collect segregate and transport municipal solid waste to the processing site, developed and commissioned at Kedarpur village on 01st November, 2009. The processing site has facility of Refused-derived fuel (RDF), mechanical & vermi-composting facilities.
Page 145A lxxxv
Page | 201
It has been found that 30% of the collected municipal solid waste (200 MT/day) has the RDF characteristics therefore being converted to RDF products of 7,000-8000 calorific values. The compost is prepared through 42 days of compost preparation time. 31 sheds for vermi-composting have been provided at processing site but these were not operational. The plant was not in operation after fire incident on 24th May 2010. Processing plant re-commissioned on 01st November 2010.
It was observed that very effective community-to-community garbage collection facility is in practice. The collection bins are in good conditions and were not overflowing with municipal solid waste. Because of effective waste collection facility, drains near roadsides were found clean and wastewater was flowing freely. Proper waste management was making the processing plant free of bad odour. The vehicles collecting and transporting waste were found covered with plastic cover. Processing plant has proper fencing, approach road; light is being provided. The pollution monitoring facility is not available still regular monitoring is being undertaken by Madhya Pradesh Pollution Control Board. It has been recommended to involve more vehicles to collect uncollected municipal solid waste (~80 MTD) and to develop pollution monitoring facility. Municipal Solid Waste Management at Jodhpur City The Jodhpur city in Rajasthan with human population of 1,110,000 (Census 2001) is generating 300 – 350 MT/day of municipal solid waste. Improper waste collection facility practiced is causing several environmental problems. However waste processing site at village Keru has been developed under Central Govt. scheme. The nuisance of municipal solid waste still persists in the city. Only 100 MT of municipal solid waste is accepted by processing plant for mechanical composting while rest is dumped by Nagar Nigam at dumping site. It was informed by Rajasthan State Pollution Control Board that dumping is carried out on unauthorized land. Biomedical Waste Treatment facility has also in operation at Keru village, because of which biomedical waste was not found along with Municipal Solid Waste. 14.5.3 Assessment of Municipal Solid Waste Management at Jodhpur and
Gwalior
A Centrally sponsored scheme was started during year 2002-03 to enable the concerned towns to take action for proper Solid Waste Management and drainage, which will avoid air crashes in the Air-field towns. The studies have been undertaken and Detailed Project Reports (DPR) for Gwalior & Jodhpur were submitted by National Buildings Construction Corporation (NBCC) & Housing
Page 145A lxxxvi
Page | 202
Urban Development Corporation (HUDCO). The reports have been approved by Central Public Health and Environmental Engineering Organization (CPHEEO) under the Ministry of Urban Development (MoUD). The funds were sanctioned for implementation.
14.5.4 Municipal Solid Waste Management at Chennai Chennai generates about 3200 MT of Municipal Solid Waste per day which is collected and disposed at two sites namely Kodungaiyur dumping site in North Chennai and Perungudi Dumping site in South Chennai. The representation regarding violation of Municipal Solid Wastes (Management and Handling) Rules, 2000 by Corporation of Chennai (COC) at Kodungaiyur dumping site was received at Central Pollution Control Board. The Municipal Solid Waste site was visited and detailed monitoring covering ambient air, ground water and leachate was carried out on 15-16 Dec. 2010. Kodungaiyur Dumping Site Kodungaiyur dumping site is a marshy land covering total area of about 350 acres. It is located at about 15 km from Chennai Central Railway Station. As reported this site is used for Municipal Solid Waste dumping for more than 25 years. With the development of city and increase in population many residential colonies have been developed in the vicinity. The surrounding land use pattern is typically residential over East, West and South while industrial over North. Bay of Bengal is about 3 km east of the site, Buckingham canal passes on eastern side. The road on southern side acts as buffer between residential areas and landfill site. M/s. Terra Firma Chennai Pvt. Ltd has proposed to setup an Integrated Solid Waste Processing Facility (1800 TPD) through windrow composting, reuse of refused derived fuel and rapid bio-methanation inside Kodungaiyur dumping site proposed in an area of about 100 acres. The Expert Appraisal Committee at MoEF recommended the proposal for Environmental Clearance in its 89th meeting. Presently no facilities are available for monitoring of wastes in the landfill site. The following are the observations:
Weigh Bridge is available with computer facilities to measure the quantity of waste brought to the landfill site. Waste compacting and covering of wastes with soil have not been carried out on day-to-day basis.
There is no proper leachate management system in place including collection and treatment.
The ground water quality parameters such as Total Hardness (221-506 mg/l), Chlorides (99-412 mg/l), Dissolved Solids (604-1597 mg/l) and Sulphates (77-249 mg/l) were found above the drinking water quality desirable limits at some locations.
Page 145A lxxxvii
Page | 203
14.5.5 Municipal Solid Waste Management at Bangalore
A public complaint was received against Integrated Municipal Solid Waste (MSW) Processing and Landfill Facility at Mavallipura, Bangalore stating that no modern solid waste management system being adopted, impact of the landfill is felt in around 20 villages, a big heap of solid waste has accumulated near the banks of the river and wells and the ground water is being polluted, causing hazardous situation for the villagers. The Central Pollution Control Board visited the unit on 27th September, 2010. The directions under Section 5 of The Environment (Protection) Act, 1986 were issued to Bruhat Bangalore Mahanagara Palika, Bangalore based on the findings.
14.5.6 Inventory of Municipal Solid Waste and Hazardous Waste Generation,
Treatment & Disposal System in Bihar and Jharkhand
With rapid urbanization and population growth, the Solid Waste Management (SWM) is becoming an acute problem. The Municipal Solid Waste Management in municipal areas is increasingly assuming importance due to legal intervention, emergence of newer technologies and rising public awareness towards cleanliness. Rapid industrialization has led to the generation of large quantities of hazardous wastes. The assessment of hazardous waste generation is presently based on the information provided by the hazardous waste generating industries. The Central Pollution Control Board has undertaken the Project on Inventorization of Municipal Solid Waste and Hazardous Waste generation, treatment & disposal Systems in Bihar and Jharkhand. The objectives of the Project study are:
Assessment of infrastructure facility available at various municipalities in
Bihar and Jharkhand with respect to CPCB guidelines.
Cross checking of existing infrastructure facility for storage / treatment /
disposal of wastes in hazardous waste generating industries in Bihar and
Jharkhand.
Existing status of management practices being adopted for municipal waste
and hazardous waste in the region.
Assess the present status of Treatment, Storage and Disposal Facility (TSDF)
in Bihar and Jharkhand.
Propose measures for mitigation of pollution in Municipal solid waste
management and Hazardous waste management in Bihar and Jharkhand.
Page 145A lxxxviii
Page | 204
The Salient findings based on the study are as below:
The Annual generation of Hazardous Waste from Jharkhand state is landfillable - 35336 MT, Incinerable - 4302MT and Recyclable 304375. Total current recycling / reuse of waste in the state are 192564 MT / Annum.
For Disposal of hazardous waste at Jharkhand, there is captive facility for 2807 MT/Annum in secured landfill and 1304 MT/Annum in incinerator.
The total quantity of Municipal Solid Waste (MSW) generated from Bihar shariff, Bhagalpur, Darbhanga, Gaya , Muzzaffarpur and Patna is approx. 1405 MT per day, out of which 1165 MT of waste is collected per day.
There are seven Municipal corporations in Bihar. Only six Municipal corporations have detailed Infrastructure facility. Out of 30 Nagar Parishad in Bihar, infrastructure facility is available at 22 Nagar Parishad only.
There is no facility for processing of Municipal Solid Waste in Bihar. The Municipal Solid Waste is disposed in unorganized way at low lying area by concerned municipalities.
Patna Municipal Corporation has taken initiative for scientific disposal of Municipal Solid Waste. Patna Waste Management Company Pvt. Limited has been formed by Ministry of Urban development, Govt. of Bihar, Municipal Corporation of Patna and Infrastructural development Pvt. Ltd. The capacity of Municipal Solid Waste Processing Plant will be approximately 1000 MTPD. The site has already been identified at Ramachak in Patna District. .The power generation (10 KV) facility from bio gas and land filling will be developed in this project...Environmental Impact Assessment (EIA) has already been accepted by Ministry of Environment & Forest.
The Hazardous waste generated from different industries in Bihar has been collected from 53 industries. The Hazardous waste generated include Used oil, Filter Residue, Oily sludge, Chrome bearing residue & sludge, spent catalyst etc.
There are no Treatment Storage & Disposal Facility (TSDF) in both the states.
14.5.7 Identification of Municipal Solid Waste Management Sites by Remote
Sensing Technique The Central Pollution Control Board in its Board Meeting decided to apply Remote Sensing Technique to identify landfill sites for disposal of municipal solid waste. In view of this, the Central Pollution Control Board has allotted projects to Karnataka State Remote Sensing Application Centre (KSRSAC) and Andhra Pradesh State
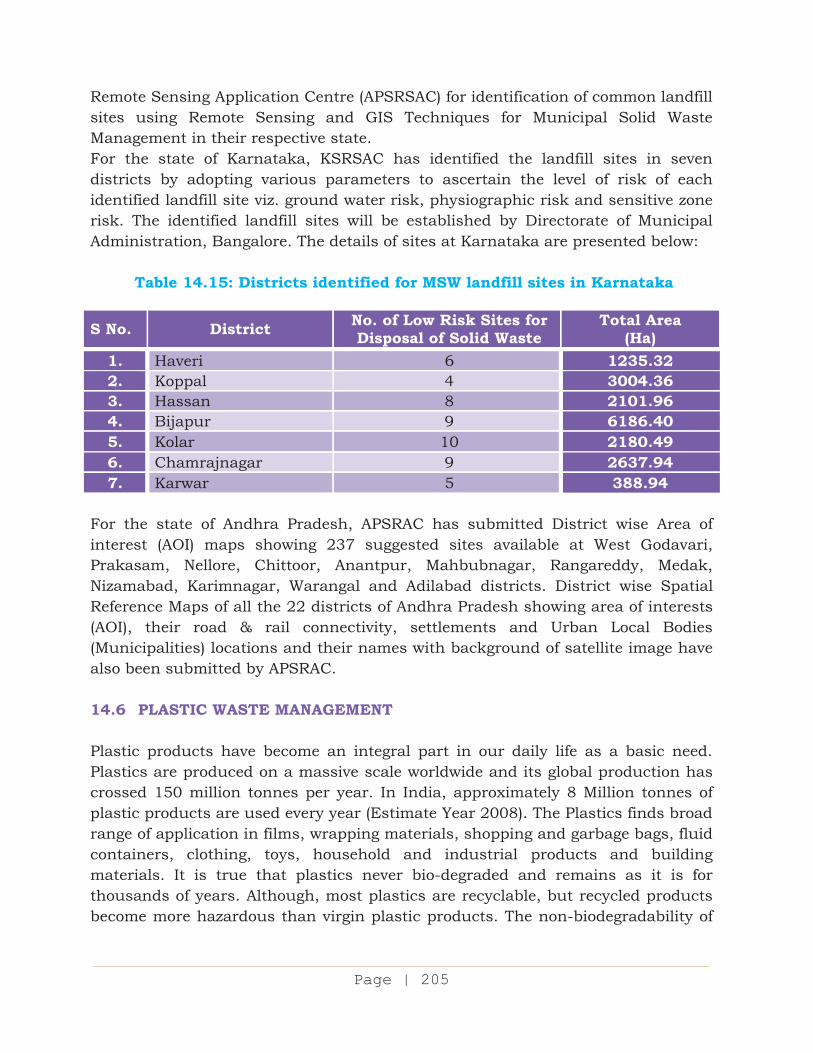
Page 145A lxxxix
Page | 205
Remote Sensing Application Centre (APSRSAC) for identification of common landfill sites using Remote Sensing and GIS Techniques for Municipal Solid Waste Management in their respective state. For the state of Karnataka, KSRSAC has identified the landfill sites in seven districts by adopting various parameters to ascertain the level of risk of each identified landfill site viz. ground water risk, physiographic risk and sensitive zone risk. The identified landfill sites will be established by Directorate of Municipal Administration, Bangalore. The details of sites at Karnataka are presented below:
Table 14.15: Districts identified for MSW landfill sites in Karnataka
S No. District No. of Low Risk Sites for Disposal of Solid Waste
Total Area (Ha)
1. Haveri 6 1235.32 2. Koppal 4 3004.36 3. Hassan 8 2101.96 4. Bijapur 9 6186.40 5. Kolar 10 2180.49 6. Chamrajnagar 9 2637.94 7. Karwar 5 388.94
For the state of Andhra Pradesh, APSRAC has submitted District wise Area of interest (AOI) maps showing 237 suggested sites available at West Godavari, Prakasam, Nellore, Chittoor, Anantpur, Mahbubnagar, Rangareddy, Medak, Nizamabad, Karimnagar, Warangal and Adilabad districts. District wise Spatial Reference Maps of all the 22 districts of Andhra Pradesh showing area of interests (AOI), their road & rail connectivity, settlements and Urban Local Bodies (Municipalities) locations and their names with background of satellite image have also been submitted by APSRAC. 14.6 PLASTIC WASTE MANAGEMENT Plastic products have become an integral part in our daily life as a basic need. Plastics are produced on a massive scale worldwide and its global production has crossed 150 million tonnes per year. In India, approximately 8 Million tonnes of plastic products are used every year (Estimate Year 2008). The Plastics finds broad range of application in films, wrapping materials, shopping and garbage bags, fluid containers, clothing, toys, household and industrial products and building materials. It is true that plastics never bio-degraded and remains as it is for thousands of years. Although, most plastics are recyclable, but recycled products become more hazardous than virgin plastic products. The non-biodegradability of
Page 145A xc
Page | 206
plastic products and unskilled processing of recycled plastics raises several critical environmental issues. Co-processing of Plastic Wastes in Cement Kiln Plastic waste generated from various cities and towns becomes part of municipal solid waste (MSW) in case it is not collected by rag pickers, recyclers etc. It is a matter of concern that disposal of plastic waste is causing many problems such as leaching impact on land and ground water, chocking of drains, land infertility, indiscriminate burning causing environmental hazards etc. Plastics waste being non-biodegradable is littered in most of the cities / towns and thereby giving an ugly appearance. It is estimated that approximately 15,342 tonnes/day (TPD) of plastic waste (per capita basis) is generated in the country. To mitigate plastic waste disposal problems, Central Pollution Control Board in association with Madhya Pradesh Pollution Control Board has taken initiative to use plastic waste in Cement plant at ACC, Kymore, Katni, Madhya Pradesh. The stack monitoring result revealed that emission values are found below the standard set for Common Hazardous Waste Incinerators. After getting encouraging results, Central Pollution Control Board has granted permission to many Cement plants to co-process the hazardous and non-hazardous (including plastic) waste in their kilns after trial burns. 14.7 MANAGEMENT OF E-WASTE
The Central Pollution Control Board has been actively involved in drafting of e-Waste (Management and Handling) Rules and contributed significantly. The draft rules were notified vide Govt. of India Gazette Notification S.O.1125 (E), dated 14th May, 2010 inviting objections and suggestions from all persons likely to be affected. The major highlights of these rules are that the producers have been given the responsibility for collection of e-Waste generated from the end of life of their products, in line with the principle of Extended Producer Responsibility, to ensure that such e-Waste are channelized to registered dismantlers or recyclers. The producer will also ensure collection and channelization through their authorized collection agencies.
14.8 NOISE POLLUTION CONTROL 14.8.1 Implementation of Noise (Regulation & Control) Rules
As decided in the 56th Conference of Member Secretaries and Chairmen, the working group has been constituted for implementation of Noise Rules & establishment of noise monitoring network in the country. Member Secretary
Page 145A xci
Page | 207
Karnataka State Pollution Control Board (KSPCB) has been designated as Chairman of the working group. The first meeting of the working group was held at Karnataka State Pollution Control Board, Bangalore on 23rd February 2011 and as a follow up of first meeting the second meeting was conducted on 18.3.2011. Prof. M. L. Munjal, Indian Insttute of Science (IISc), Bangalore has been invited in the second meeting. Important recommendations of the working group for implementation of noise rules are as below:
Every state has to identify the authority for the implementation of Noise Rules and notify accordingly. Central Pollution Control Board / Ministry of Environment & Forests may address a letter to the Secretaries of the concerned department of State in this regard. Further, while issuing notification, the function of such authority shall be defined explicitly by the State.
It is suggested to declare one more area i.e. mixed category area in addition to four categories already mentioned in the noise rules as most of the residential areas are overlapped with commercial areas. The ambient noise standard proposed for this mixed area is 60dB (A) during day time and 50dB (A) during night time. Central Pollution Control Board may take necessary action in this regard, if agreed.
Demarcation of the zones has to be made by the Urban Development
Department in each State. Central Pollution Control Board / Ministry of Environment & Forests may address a letter to all the Secretaries of Urban Development for demarcating the zones in consultation with respective State Board and other related departments.
The working group suggested that separate comprehensive Act could be
thought of, for example, the Environmental Noise (Monitoring, Prevention and Control) Act as present noise rules are very much ambiguous.
As per recommendation of the committee, the Central Pollution Control Board has written to all the Chief Secretaries of States / Union Territories for demarcation of noise zones and Identification of implementing authority. 14.8.2 Assessment of Vehicular Pollution Problem due to devotees /tourists
of Religious / Tourist places & Development of Vehicular Pollution Control & Ambient Air Quality Management
The Ventral Pollution Control Board has undertaken the study for fulfillment of following objectives:
Page 145A xcii
Page | 208
The assessment of vehicular pollution will be done at two places viz. Haridwar (as a religious Place) & Mussorrie (as one of the tourist place).
Assessment of Vehicular Pollution problems during peak and lean periods at Haridwar (as a religious place) and Mussorrie (as a tourist place) and estimation of emission load from vehicles
Assessment of ambient air quality during peak and lean season at various representative areas like main squares on the highway, parking areas, near main highways, entry points in the town etc.
Assessment of vehicular emission problem during peak and lean periods from various categories of vehicles and estimation of total pollution load from vehicles.
Development of Ambient Air Quality Management and Vehicular Pollution Control Plan for Haridwar (as a religious place) and Mussorrie (as a tourist place).
Formulation of Vehicular Pollution Control and Ambient Air Quality Management Plan.
The Project has been completed and the report is under finalization.
14.8.3 Development of Noise limit for Off Road Vehicles With the growth of the society, the number of off-road vehicles is increasing. These vehicles are not plying on the road to commute the public, but these are supporting vehicles for acceleration of the construction activity. There is no noise limit for these types of vehicles. These are causing nuisance to the society as these emits static high sound pressure. It was visualized to have some control on these types of vehicles.
The Central Pollution Control Board has received requests for development of noise limits for off-road vehicles, construction machinery and domestic appliances from Ministry of Environment & Forests. This issue has been discussed in 14th, 16th and 18th meeting of National Committee on Noise Pollution held at Central Pollution Control Board on August 30, 2006, May 15, 2007 and December 30, 2008 respectively. The Central Pollution Control Board has invited quotations from various Indian Institute of Technology, Indian Institute of Science, and Certification Agencies). The Project has been finalized and work awarded to Automobile Research Association of India (ARAI), Pune at the cost of approx. Rs. 17.00 lakh.
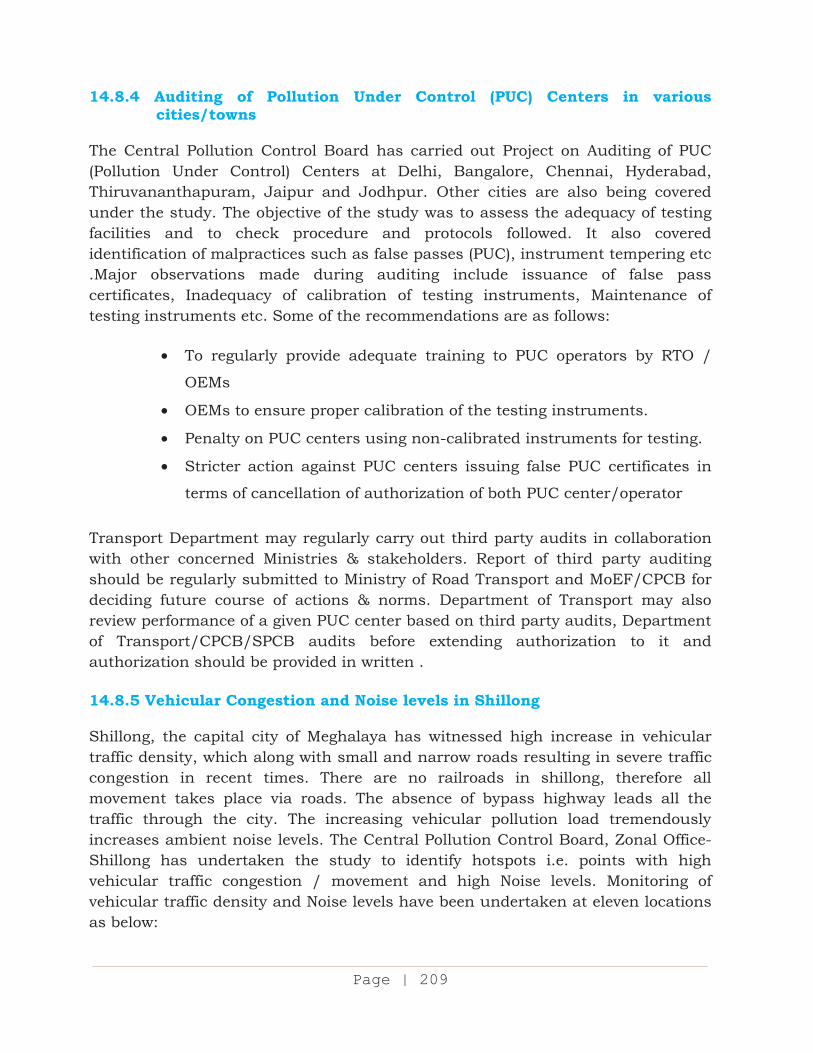
Page 145A xciii
Page | 209
14.8.4 Auditing of Pollution Under Control (PUC) Centers in various cities/towns
The Central Pollution Control Board has carried out Project on Auditing of PUC (Pollution Under Control) Centers at Delhi, Bangalore, Chennai, Hyderabad, Thiruvananthapuram, Jaipur and Jodhpur. Other cities are also being covered under the study. The objective of the study was to assess the adequacy of testing facilities and to check procedure and protocols followed. It also covered identification of malpractices such as false passes (PUC), instrument tempering etc .Major observations made during auditing include issuance of false pass certificates, Inadequacy of calibration of testing instruments, Maintenance of testing instruments etc. Some of the recommendations are as follows:
To regularly provide adequate training to PUC operators by RTO /
OEMs
OEMs to ensure proper calibration of the testing instruments.
Penalty on PUC centers using non-calibrated instruments for testing.
Stricter action against PUC centers issuing false PUC certificates in
terms of cancellation of authorization of both PUC center/operator
Transport Department may regularly carry out third party audits in collaboration with other concerned Ministries & stakeholders. Report of third party auditing should be regularly submitted to Ministry of Road Transport and MoEF/CPCB for deciding future course of actions & norms. Department of Transport may also review performance of a given PUC center based on third party audits, Department of Transport/CPCB/SPCB audits before extending authorization to it and authorization should be provided in written . 14.8.5 Vehicular Congestion and Noise levels in Shillong Shillong, the capital city of Meghalaya has witnessed high increase in vehicular traffic density, which along with small and narrow roads resulting in severe traffic congestion in recent times. There are no railroads in shillong, therefore all movement takes place via roads. The absence of bypass highway leads all the traffic through the city. The increasing vehicular pollution load tremendously increases ambient noise levels. The Central Pollution Control Board, Zonal Office-Shillong has undertaken the study to identify hotspots i.e. points with high vehicular traffic congestion / movement and high Noise levels. Monitoring of vehicular traffic density and Noise levels have been undertaken at eleven locations as below:
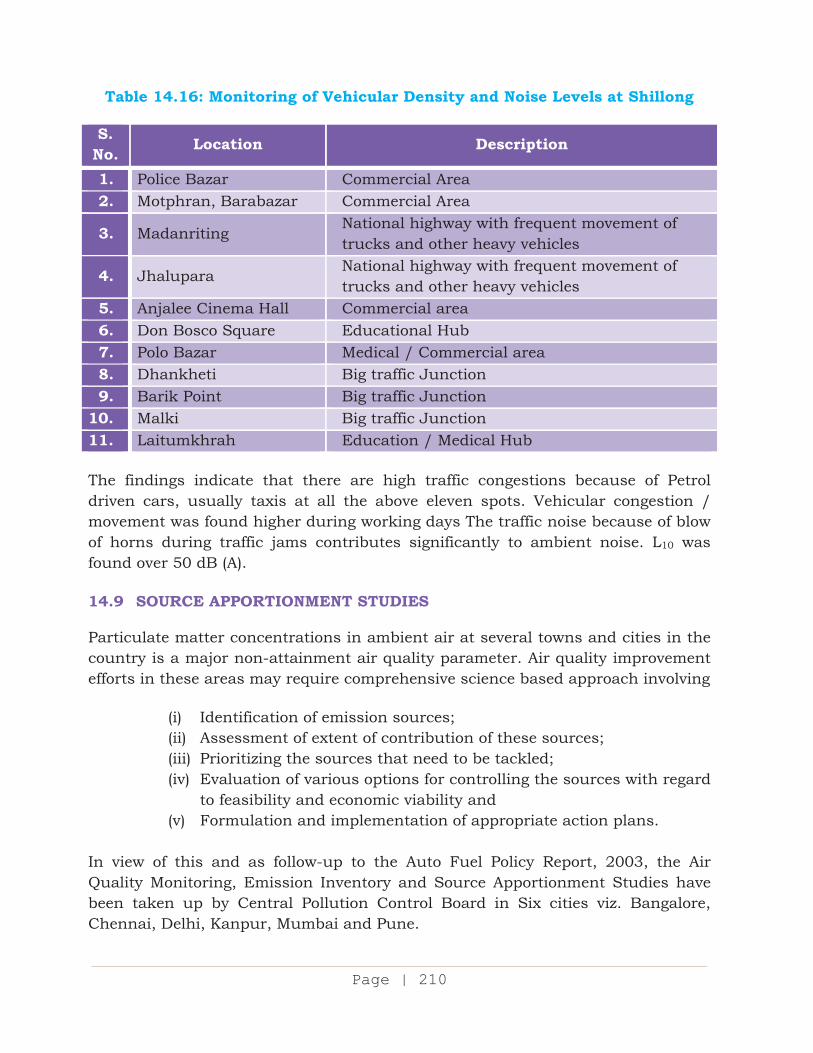
Page 145A xciv
Page | 210
Table 14.16: Monitoring of Vehicular Density and Noise Levels at Shillong S.
No. Location Description
1. Police Bazar Commercial Area 2. Motphran, Barabazar Commercial Area
3. Madanriting National highway with frequent movement of trucks and other heavy vehicles
4. Jhalupara National highway with frequent movement of trucks and other heavy vehicles
5. Anjalee Cinema Hall Commercial area 6. Don Bosco Square Educational Hub 7. Polo Bazar Medical / Commercial area 8. Dhankheti Big traffic Junction 9. Barik Point Big traffic Junction 10. Malki Big traffic Junction 11. Laitumkhrah Education / Medical Hub The findings indicate that there are high traffic congestions because of Petrol driven cars, usually taxis at all the above eleven spots. Vehicular congestion / movement was found higher during working days The traffic noise because of blow of horns during traffic jams contributes significantly to ambient noise. L10 was found over 50 dB (A). 14.9 SOURCE APPORTIONMENT STUDIES Particulate matter concentrations in ambient air at several towns and cities in the country is a major non-attainment air quality parameter. Air quality improvement efforts in these areas may require comprehensive science based approach involving
(i) Identification of emission sources; (ii) Assessment of extent of contribution of these sources; (iii) Prioritizing the sources that need to be tackled; (iv) Evaluation of various options for controlling the sources with regard
to feasibility and economic viability and (v) Formulation and implementation of appropriate action plans.
In view of this and as follow-up to the Auto Fuel Policy Report, 2003, the Air Quality Monitoring, Emission Inventory and Source Apportionment Studies have been taken up by Central Pollution Control Board in Six cities viz. Bangalore, Chennai, Delhi, Kanpur, Mumbai and Pune.
Page 145A xcv
Page | 211
A National Summary report has been prepared, which was reviewed by Steering & Technical Committees and also Peer Reviewed by International Experts. The Report was approved by the Govt. in December 2010. Major findings of the study are as follow:
Particulate Matter (PM) pollution problem is severe and NO2 is the emerging pollutant that requires immediate attention to control its emissions.
Though, there are city-specific variations among the dominance of sources, re-suspension of road dust and combustion sources including vehicles, refuse burning & Diesel Generating sets emerge as prominent particulate matter sources in all the cities.
Higher fraction of PM2.5 in PM10, and higher values of EC and OC (which have more sever health impacts) at kerbside locations indicate that control of vehicular exhaust would be an important element of any strategy or action plan for improving air quality and minimizing adverse effects on the health of people.
There have been found significant quantities of secondary particulate matter (SO4 and NO3) in PM10. It signifies long-range transport of particles in the city as well as formation of secondary particles. Any control strategy for reduction of particulates will have to consider control of SO2, NO2 and NH3.
An effective control strategy would require combination of engineering as well as non-engineering solutions. Prioritization of these solutions in addition to their effectiveness should also be driven by comparative account of short and long term implementation dilemma. Low cost with high effectiveness and low cost with shorter implementation period shall be a better option, when compared with high effectiveness with high costs or long implementation period.
The report suggested setting up of different working groups, which may be housed in the respective thematic Ministries, to deal with the sectoral recommendations of the study.
14.10 IMPACT OF INDUSTRIAL EMISSIONS ON AMBIENT AIR QUALITY AT
GREATER COCHIN (KERALA) - DISPERSION MODEL STUDY Greater Cochin Development Authority (GCDA) area has been identified as one of the critically polluted area in the country with CEPI score of 75.08. There are 83 red category industries in Greater Kochi area. Out of that 79 industries (i.e. 95% of the total) fall within the industrial clusters at Eloor-Edayar and Ambalamugal which together constitute 17.4 km2 or 2.8 % of Greater Kochi Area. The objective of the study was to model or predict the maximum ground level concentrations of pollutants arising from selected industrial emissions in Kochi and the impact or
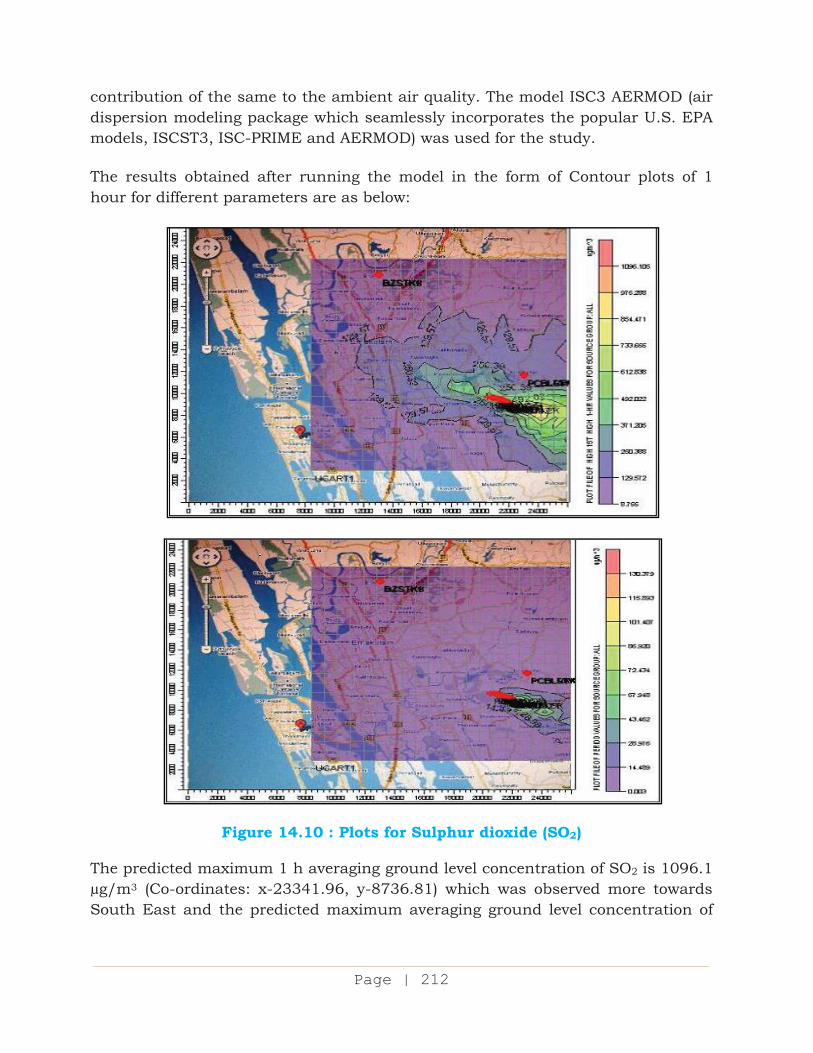
Page 145A xcvi
Page | 212
contribution of the same to the ambient air quality. The model ISC3 AERMOD (air dispersion modeling package which seamlessly incorporates the popular U.S. EPA models, ISCST3, ISC-PRIME and AERMOD) was used for the study. The results obtained after running the model in the form of Contour plots of 1 hour for different parameters are as below:
Figure 14.10 : Plots for Sulphur dioxide (SO2)
The predicted maximum 1 h averaging ground level concentration of SO2 is 1096.1 µg/m3 (Co-ordinates: x-23341.96, y-8736.81) which was observed more towards South East and the predicted maximum averaging ground level concentration of
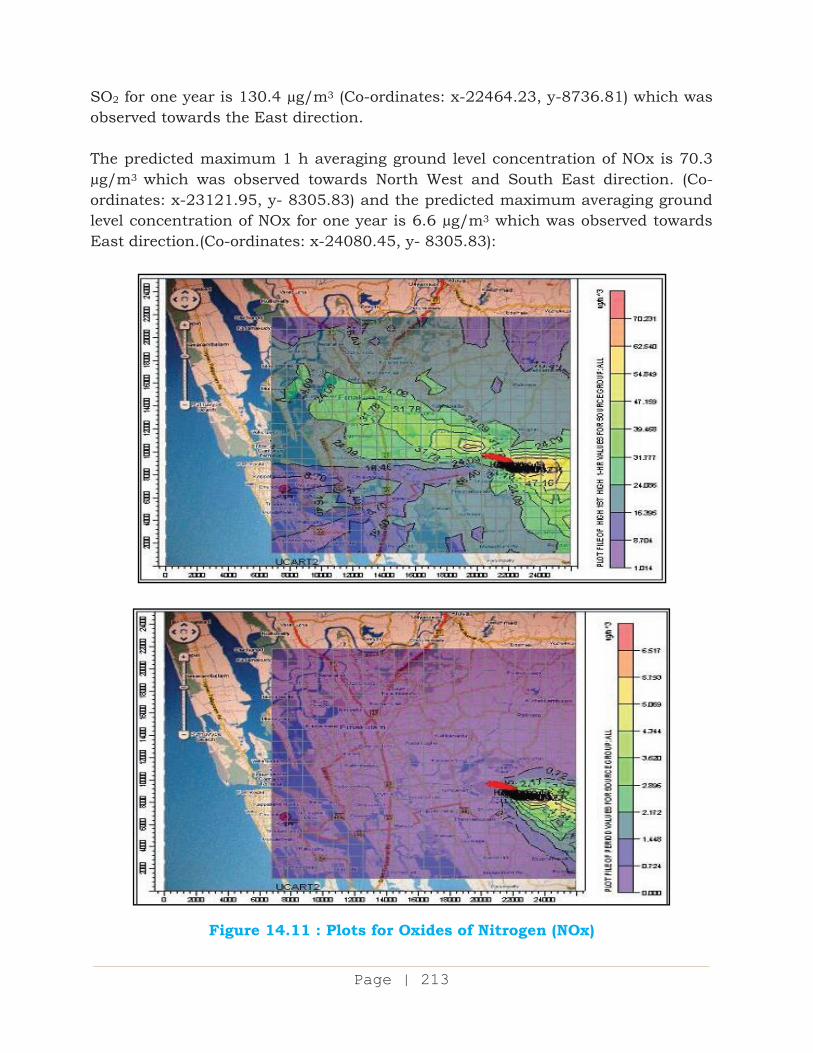
Page 145A xcvii
Page | 213
SO2 for one year is 130.4 µg/m3 (Co-ordinates: x-22464.23, y-8736.81) which was observed towards the East direction. The predicted maximum 1 h averaging ground level concentration of NOx is 70.3 µg/m3 which was observed towards North West and South East direction. (Co-ordinates: x-23121.95, y- 8305.83) and the predicted maximum averaging ground level concentration of NOx for one year is 6.6 µg/m3 which was observed towards East direction.(Co-ordinates: x-24080.45, y- 8305.83):
Figure 14.11 : Plots for Oxides of Nitrogen (NOx)
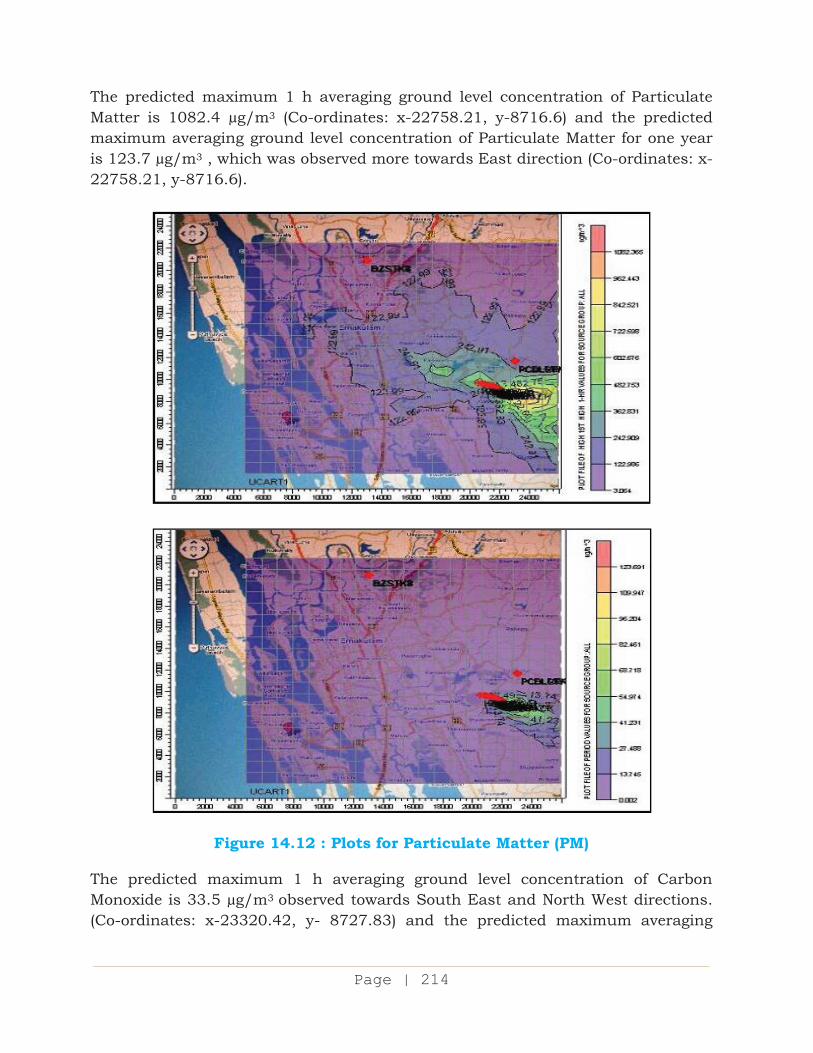
Page 145A xcviii
Page | 214
The predicted maximum 1 h averaging ground level concentration of Particulate Matter is 1082.4 µg/m3 (Co-ordinates: x-22758.21, y-8716.6) and the predicted maximum averaging ground level concentration of Particulate Matter for one year is 123.7 µg/m3 , which was observed more towards East direction (Co-ordinates: x-22758.21, y-8716.6).
Figure 14.12 : Plots for Particulate Matter (PM) The predicted maximum 1 h averaging ground level concentration of Carbon Monoxide is 33.5 µg/m3 observed towards South East and North West directions. (Co-ordinates: x-23320.42, y- 8727.83) and the predicted maximum averaging
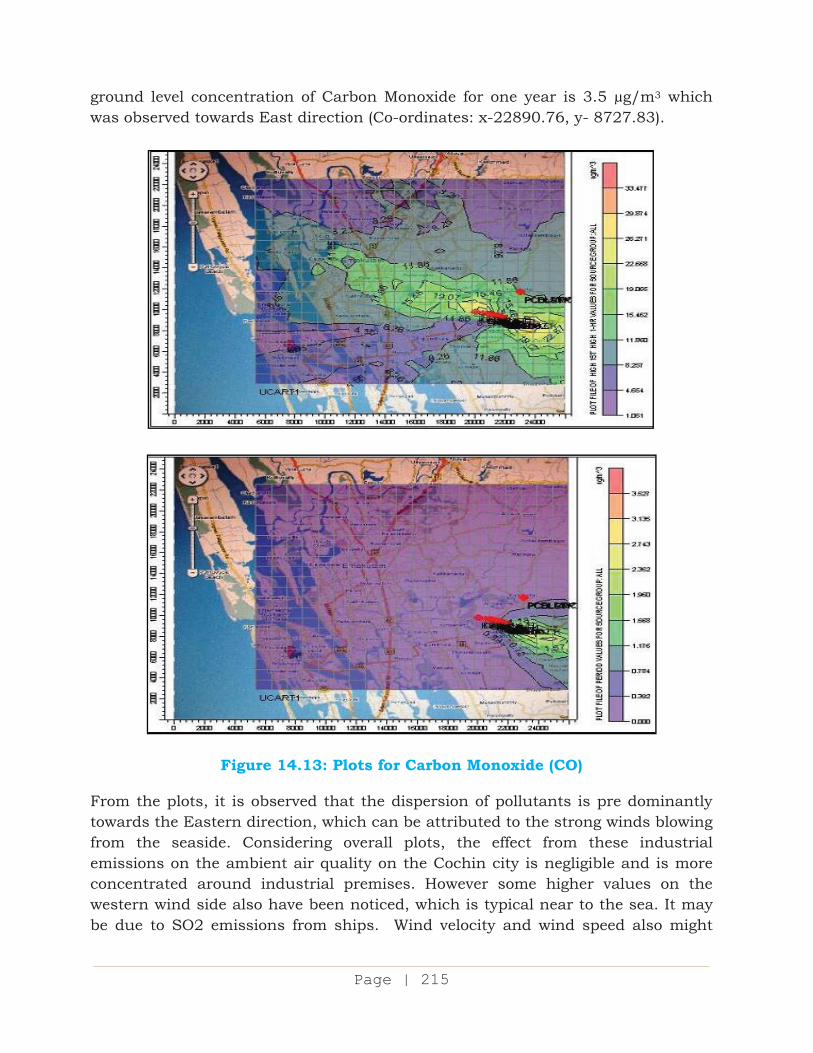
Page 145A xcix
Page | 215
ground level concentration of Carbon Monoxide for one year is 3.5 µg/m3 which was observed towards East direction (Co-ordinates: x-22890.76, y- 8727.83).
Figure 14.13: Plots for Carbon Monoxide (CO) From the plots, it is observed that the dispersion of pollutants is pre dominantly towards the Eastern direction, which can be attributed to the strong winds blowing from the seaside. Considering overall plots, the effect from these industrial emissions on the ambient air quality on the Cochin city is negligible and is more concentrated around industrial premises. However some higher values on the western wind side also have been noticed, which is typical near to the sea. It may be due to SO2 emissions from ships. Wind velocity and wind speed also might
Page 145A c
Page | 216
have an influence on the dispersion of pollutants. Comparing the results from the manual ambient air quality stations in this influencing zone shall reveal the exact impact of these pollutants. City being on both South and North directions of the source, the impact appears to be minimal. 14.11 FORMULATION OF GUIDELINES FOR IDOL IMMERSION
To curb the pollution problem in river / water bodies due to Immersion of Idols, the Central Pollution Control Board has laid down “Guidelines for Idol Immersion”, which has been published under Programme Objective Series: PROBES/136/2010 and also available on CPCB’s Website (www.cpcb.nic.in) The Guidelines has been forwarded to each State Government for necessary action at their end. 14.12 RECOGNITION OF LABORATORIES UNDER THE ENVIRONMENT
(PROTECTION) ACT, 1986 14.12.1 Environmental Laboratories Approved For Recognition by Central
Pollution Control Board under the Environment (Protection) Act, 1986
Central Pollution Control Board, Delhi has been delegated the powers by Government of India vide Gazette Notification No. S.O. 145 (E) dated February 21, 1991 for recognition of environmental laboratories of Govt. / Semi Govt. organization Public Sector Undertaking and Educational Institutions under section 12(1)(b) & 13 to carry out the functions entrusted to the Environmental laboratories under the Environment (Protection) Act, 1986 (Annexure VII). In exercise of power conferred, Central Pollution Control Board has approved the New/Renewal of recognition of following laboratories after recommendation of Expert Committee during the period April, 2010 to March, 2011: 155th Board Meeting (Held on 28.6.2010) 1. Environment Protection Training and Research Institute (EPTRI),
91/4, Gachi Bowli, Hyderabad- 500032, Andhra Pradesh
2. P.G. Department of Environment Management
Chhatrapati Shahu Institute of Business Education and Research (SIBER), University Road, Kolhapur- 416004, Maharashtra
Page 145A ci
Page | 217
3. Punjab Bio-Technology Incubator Agriculture and Food Testing Laboratory SCO: 7 & 8 (Top Floor), Phase-V
SAS Nagar, Mohali-160059, Punjab
157th Board Meeting (Held on 21.12.2010) 1. Regional Laboratory Maharashtra State Pollution Control Board 6th Floor, “Udyog Bhawan Civil Lines, Nagpur-440001, Maharashtra 2. Regional Laboratory Maharashtra State Pollution Control Board 1st Floor, Udyog Bhawan, Rathi Chowk, Trimbak Road Nashik-422007, Maharashtra
3. Regional Laboratory Maharashtra State Pollution Control Board “Paryavaran Bhavan”, A-4/1, Chikalthana MIDC, Behind Dhoot Hospital, Aurangabad- 431210, Maharashtra 14.12.2 Participation in Joint Inspections of Private and Government
Laboratories for Consideration of Recognition under The Environment (Protection) Act, 1986
Private Sector Laboratories
Central Pollution Control Board has participated in joint inspections with Ministry of Environment & Forests (MoEF) and respective State Pollution Control Boards for consideration of recognition of following private environmental laboratories under the Environment (Protection) Act, 1986 during the year 2010-2011:
M/s Min Mec Enviro. Lab, Delhi M/s GRC Laboratory, Noida, U. P. M/s Chandigarh Pollution Testing Laboratory, Mohali, Punjab M/s Environment Management Quality Center, Mohali, Punjab M/s Newcon Consultancy & Laboratories, Ghaziabad, U. P. M/s Spectro Analytical Labs Ltd., New Delhi M/s Klean Laboratories Ltd., Pune, Maharashtra.
Page 145A cii
Page | 218
Government / Public Sector Laboratories Central Pollution Control Board has participated in joint inspections alongwith State Pollution Control Board/CPCB Zonal offices for the following laboratories for consideration of their recognition under the Environment (Protection) Act, 1986 during the year:
(i) Regional laboratory
Maharashtra State Pollution Control Board, Nagpur (ii) Regional laboratory
Maharashtra State Pollution Control Board, Nashik (iii) Regional laboratory
Maharashtra State Pollution Control Board, Aurangabad (iv) Central Laboratory
Uttar Pradesh Pollution Control Board, Lucknow, U. P. (v) Regional Laboratory
Madhya Pradesh Pollution Control Board, Jabalpur (vi) Regional Laboratory
Madhya Pradesh Pollution Control Board, Indore
14.12.3 Participation in Joint Inspections of Govt. / Pvt. Laboratories with Punjab Pollution Control Board for Consideration of Recognition under The Water / Air Act
• M/s ECO Pro Engineers Pvt. Ltd., Ghaziabad, U. P. • M/s Spectro Analytical Labs Ltd., Delhi • M/s SGS India Pvt. Ltd., Gurgaon, Haryana • M/s Haryana Test House, Panipat, Haryana • M/s International Testing Centre, Panchkula, Haryana • M/s Punjab Bio-Technology & Incubator, Mohali, Punjab • M/s Industrial Testing Laboratory, Patiala, Punjab
14.12.4 Analytical Quality Control (AQC/Water) for Central and State
Pollution Control Boards, Pollution Control Committees and for Laboratories Recognized under the E (P) Act, 1986
Central Pollution Control Board (CPCB) is maintaining vast water quality monitoring network with aim to evaluate the status of water quality of different sources in which monitoring is undertaken at 1019 water quality monitoring stations under GEMS, MINARS, GAP and YAP Programmes comprising rivers, lakes, wells, and ground waters spread over 27 States and 6 Union Territories through various State Pollution Control Boards (SPCB). Comparability of data within the collaborative programme, becomes the key challenge to the water
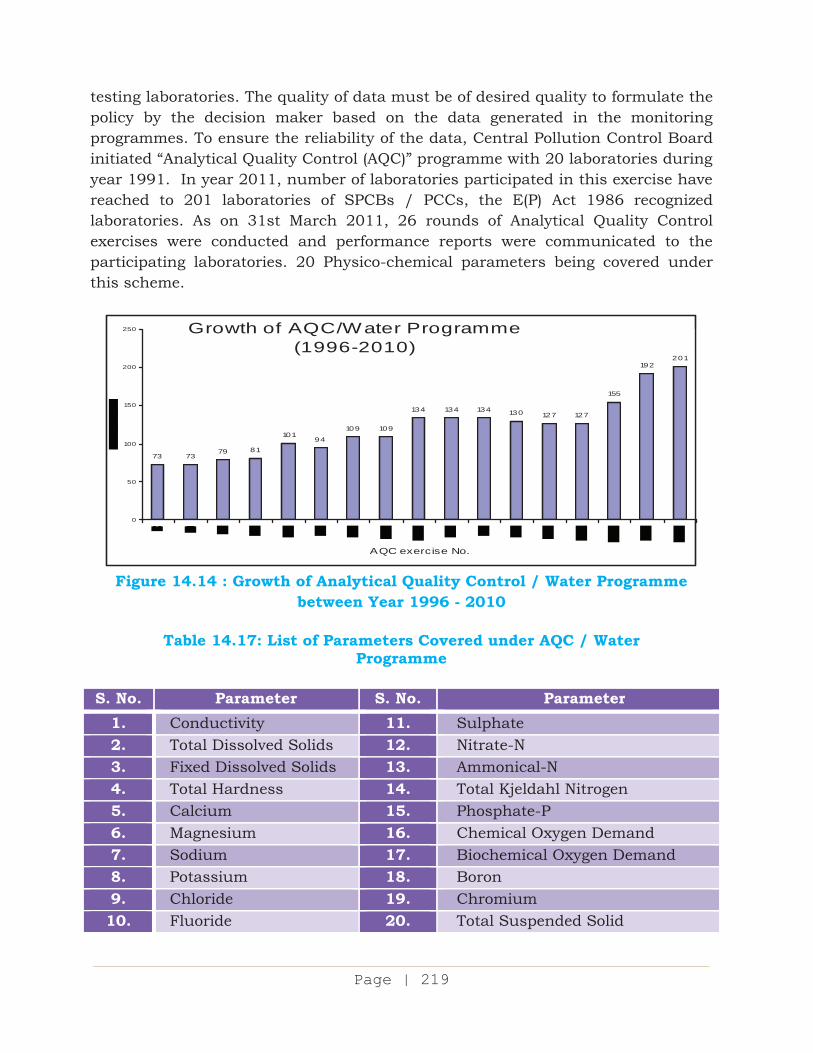
Page 145A ciii
Page | 219
testing laboratories. The quality of data must be of desired quality to formulate the policy by the decision maker based on the data generated in the monitoring programmes. To ensure the reliability of the data, Central Pollution Control Board initiated “Analytical Quality Control (AQC)” programme with 20 laboratories during year 1991. In year 2011, number of laboratories participated in this exercise have reached to 201 laboratories of SPCBs / PCCs, the E(P) Act 1986 recognized laboratories. As on 31st March 2011, 26 rounds of Analytical Quality Control exercises were conducted and performance reports were communicated to the participating laboratories. 20 Physico-chemical parameters being covered under this scheme.
Figure 14.14 : Growth of Analytical Quality Control / Water Programme
between Year 1996 - 2010
Table 14.17: List of Parameters Covered under AQC / Water Programme
S. No. Parameter S. No. Parameter
1. Conductivity 11. Sulphate 2. Total Dissolved Solids 12. Nitrate-N 3. Fixed Dissolved Solids 13. Ammonical-N 4. Total Hardness 14. Total Kjeldahl Nitrogen 5. Calcium 15. Phosphate-P 6. Magnesium 16. Chemical Oxygen Demand 7. Sodium 17. Biochemical Oxygen Demand 8. Potassium 18. Boron 9. Chloride 19. Chromium 10. Fluoride 20. Total Suspended Solid
Growth of AQC/Water Programme (1996-2010)
73 7379 81
10194
109 109
134 134 134 130 127 127
155
192201
0
50
100
150
200
250
AQC exercise No.
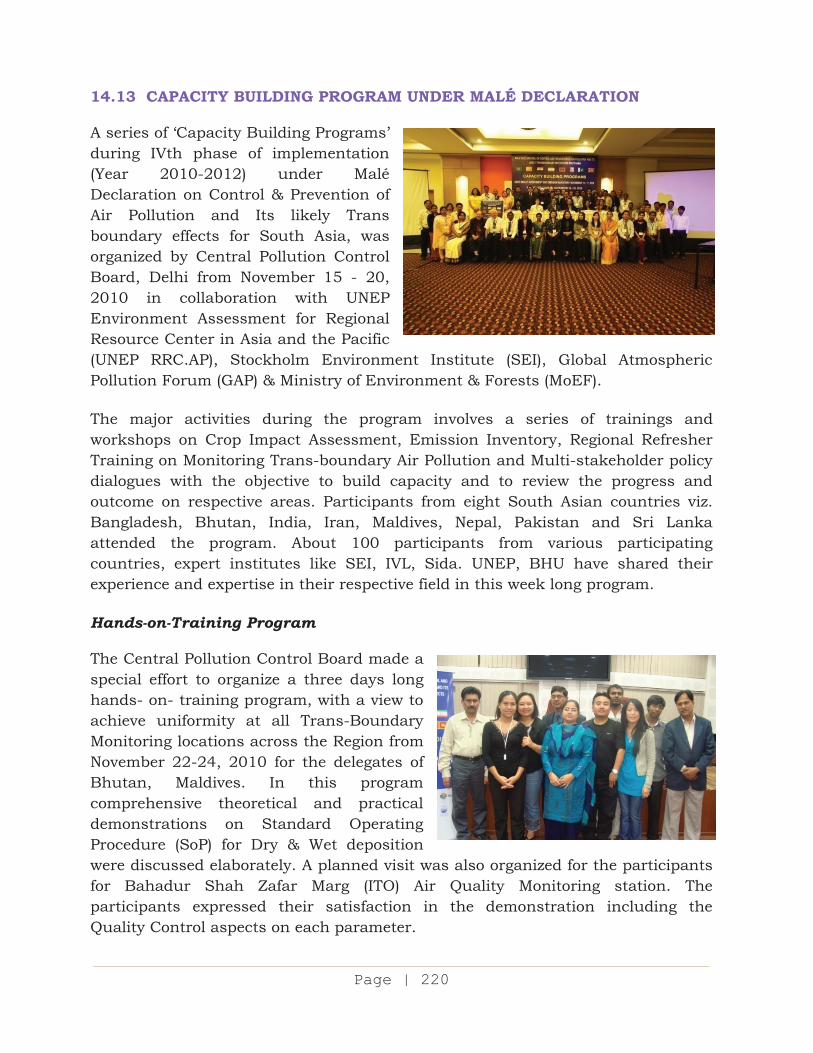
Page 145A civ
Page | 220
14.13 CAPACITY BUILDING PROGRAM UNDER MALÉ DECLARATION A series of ‘Capacity Building Programs’ during IVth phase of implementation (Year 2010-2012) under Malé Declaration on Control & Prevention of Air Pollution and Its likely Trans boundary effects for South Asia, was organized by Central Pollution Control Board, Delhi from November 15 - 20, 2010 in collaboration with UNEP Environment Assessment for Regional Resource Center in Asia and the Pacific (UNEP RRC.AP), Stockholm Environment Institute (SEI), Global Atmospheric Pollution Forum (GAP) & Ministry of Environment & Forests (MoEF). The major activities during the program involves a series of trainings and workshops on Crop Impact Assessment, Emission Inventory, Regional Refresher Training on Monitoring Trans-boundary Air Pollution and Multi-stakeholder policy dialogues with the objective to build capacity and to review the progress and outcome on respective areas. Participants from eight South Asian countries viz. Bangladesh, Bhutan, India, Iran, Maldives, Nepal, Pakistan and Sri Lanka attended the program. About 100 participants from various participating countries, expert institutes like SEI, IVL, Sida. UNEP, BHU have shared their experience and expertise in their respective field in this week long program. Hands-on-Training Program The Central Pollution Control Board made a special effort to organize a three days long hands- on- training program, with a view to achieve uniformity at all Trans-Boundary Monitoring locations across the Region from November 22-24, 2010 for the delegates of Bhutan, Maldives. In this program comprehensive theoretical and practical demonstrations on Standard Operating Procedure (SoP) for Dry & Wet deposition were discussed elaborately. A planned visit was also organized for the participants for Bahadur Shah Zafar Marg (ITO) Air Quality Monitoring station. The participants expressed their satisfaction in the demonstration including the Quality Control aspects on each parameter.
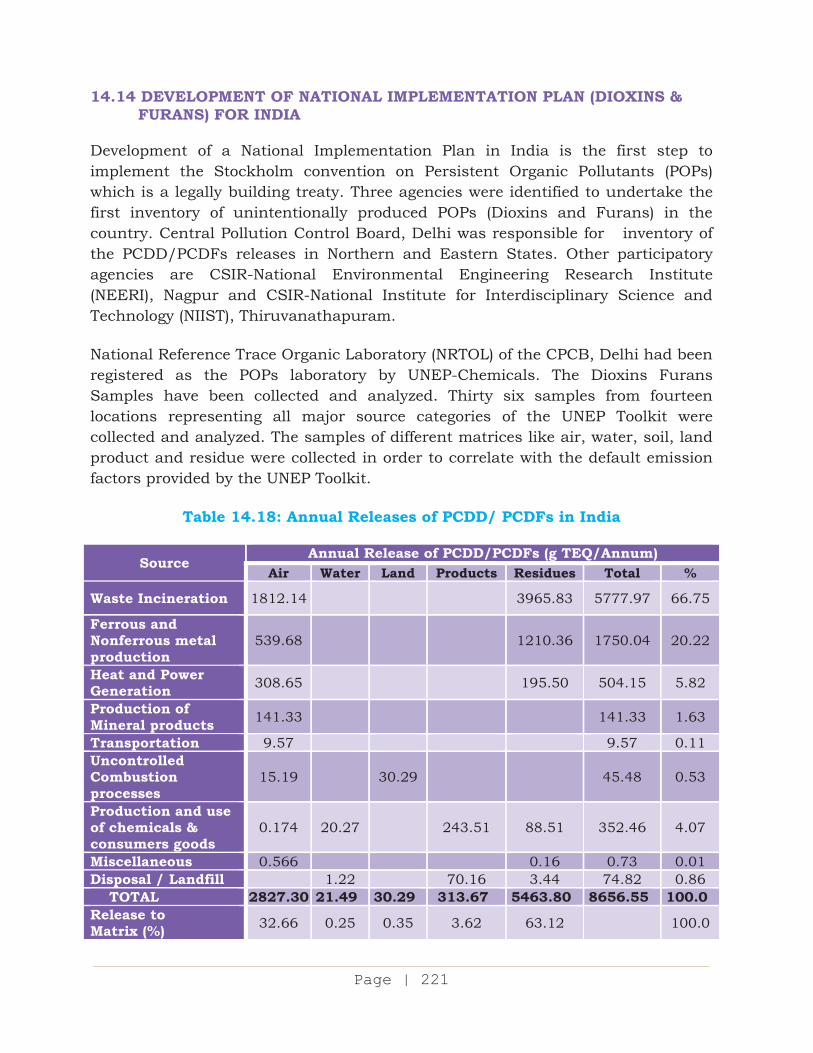
Page 145A cv
Page | 221
14.14 DEVELOPMENT OF NATIONAL IMPLEMENTATION PLAN (DIOXINS & FURANS) FOR INDIA Development of a National Implementation Plan in India is the first step to implement the Stockholm convention on Persistent Organic Pollutants (POPs) which is a legally building treaty. Three agencies were identified to undertake the first inventory of unintentionally produced POPs (Dioxins and Furans) in the country. Central Pollution Control Board, Delhi was responsible for inventory of the PCDD/PCDFs releases in Northern and Eastern States. Other participatory agencies are CSIR-National Environmental Engineering Research Institute (NEERI), Nagpur and CSIR-National Institute for Interdisciplinary Science and Technology (NIIST), Thiruvanathapuram. National Reference Trace Organic Laboratory (NRTOL) of the CPCB, Delhi had been registered as the POPs laboratory by UNEP-Chemicals. The Dioxins Furans Samples have been collected and analyzed. Thirty six samples from fourteen locations representing all major source categories of the UNEP Toolkit were collected and analyzed. The samples of different matrices like air, water, soil, land product and residue were collected in order to correlate with the default emission factors provided by the UNEP Toolkit.
Table 14.18: Annual Releases of PCDD/ PCDFs in India
Source Annual Release of PCDD/PCDFs (g TEQ/Annum)
Air Water Land Products Residues Total %
Waste Incineration 1812.14 3965.83 5777.97 66.75
Ferrous and Nonferrous metal production
539.68 1210.36 1750.04 20.22
Heat and Power Generation 308.65 195.50 504.15 5.82
Production of Mineral products 141.33 141.33 1.63
Transportation 9.57 9.57 0.11 Uncontrolled Combustion processes
15.19 30.29 45.48 0.53
Production and use of chemicals & consumers goods
0.174 20.27 243.51 88.51 352.46 4.07
Miscellaneous 0.566 0.16 0.73 0.01 Disposal / Landfill 1.22 70.16 3.44 74.82 0.86 TOTAL 2827.30 21.49 30.29 313.67 5463.80 8656.55 100.0Release to Matrix (%) 32.66 0.25 0.35 3.62 63.12 100.0
Page 145A cvi
Page | 222
The assessment of meaningful total estimate of Dioxins and Furans generation from each of the main categories (and sub-categories) of industrial operations in the large, medium and small scale industries across the country is difficult to arrive. However, the annual PCDD/PCDFs releases have been calculated using UNEP Toolkit and it was estimated at 8656.55 g TEQ/Annum. The major contribution of PCDD/PCDFs emissions are from Waste incineration, ferrous and Non-ferrous metal production categories followed by Heat and Power generation. 14.15 CLEAN TECHNOLOGIES FOR POLLUTION CONTROL 14.15.1 National Award for Prevention of Pollution and Rajiv Gandhi
Environment Award for Clean Technology for the Year 2009-10 The Rajiv Gandhi Environment Award is provided annually to encourage industrial units, particularly those in highly polluting categories taken suitable steps in terms of use of clean technologies and practices to prevent & reduce environmental pollution. Total 63 industries from different categories participated for the Award during the year 2009 -10. The nominations were scrutinized; 51 nominations short listed for further inspection by Central Pollution Control Board to verify their claims. The identified industries have been inspected and evaluation reports submitted to Ministry of Environment & Forests for final selection. 14.15.2 Clean Technologies for Small & Medium Enterprises (SMEs) The Central Pollution Control Board initiated the project ‘Development of a National Database on Cleaner Technologies (CT), evolution of a mechanism for financial appraisal of CT based projects and application of fiscal measures for promotion of CT in India’ during 2009-10. The Small Medium Enterprises (SMEs) contribute significantly and account for 8% of the country’s GDP (45 % manufacturing output and 40 % of India’s exports). As per the 4th All-India Census of MSMEs, the number of enterprises is estimated to be about 26 million and these provide employment to an estimated 60 million persons. The State-wise distribution of SMEs indicate that more than 55% of these enterprises are operating in six States viz. Uttar Pradesh, Maharashtra, Tamil Nadu, West Bengal, Andhra Pradesh and Karnataka. The project identified 17 SMEs industrial sectors viz. Reprocessing of Non- Ferrous metals, waste / used oil, Pulp & Paper, Distilleries, Electroplating, Tanneries, Dyes & Dye Intermediates, Drugs & Drug Intermediates, Pesticides & Pesticide Intermediates, Coke Oven, Foundries, Textiles, Brick Kiln and Sponge Iron. Sectoral reports were prepared based on data available with SPCBs / PCCs and with CPCB Zonal Offices.
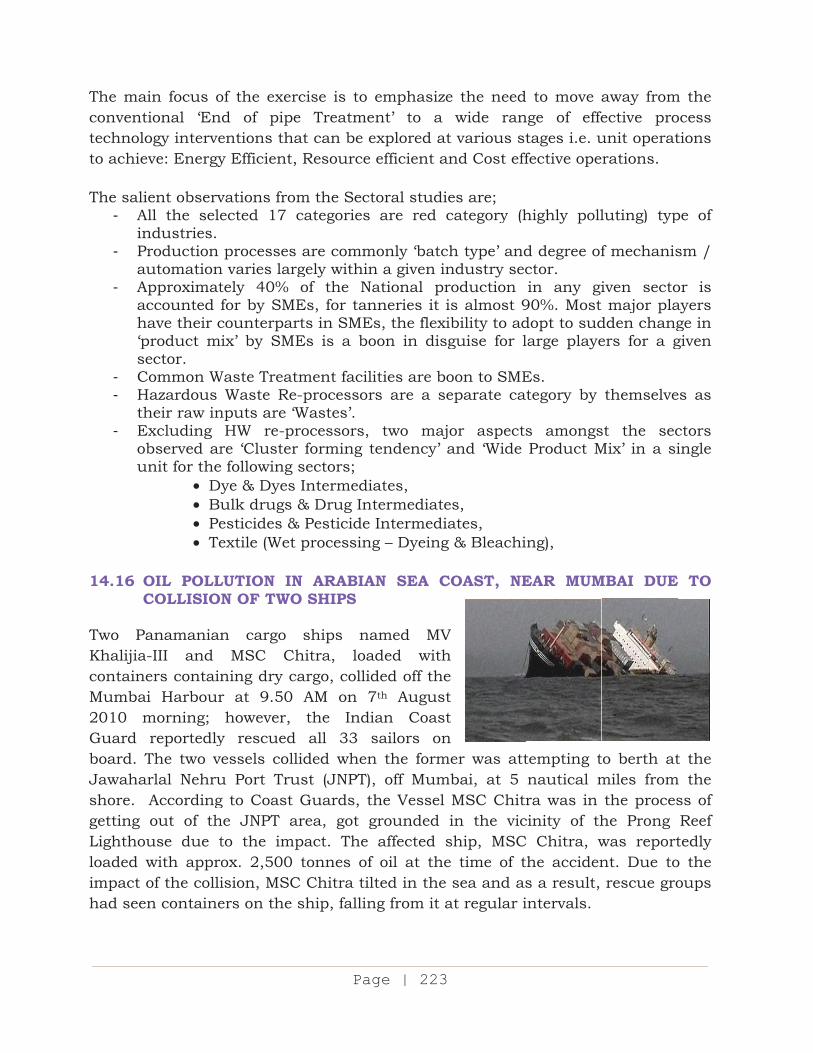
Page 145A cvii
The maconventtechnoloto achie The sali
- Ain
- Pa
- Aah‘ps
- C- H
th- E
ou
14.16 O
C Two PKhalijiacontainMumba2010 mGuard board. TJawahashore. getting Lightholoaded impact had see
ain focus otional ‘Enogy interveeve: Energy
ient observAll the selendustries. Production automationApproximataccounted fhave their cproduct mector.
Common WHazardous heir raw in
Excluding bserved ar
unit for the Dy Bu Pe Te
OIL POLLCOLLISION
anamaniana-III and ers contain
ai Harbourmorning; reportedly
The two varlal Nehru
Accordingout of thuse due twith approof the colli
en containe
of the exerd of pipeentions thay Efficient,
vations fromected 17 c
processes n varies largtely 40% for by SMEcounterparix’ by SME
Waste TreatWaste Re
nputs are ‘WHW re-pr
re ‘Cluster following ye & Dyes ulk drugs esticides &extile (Wet
LUTION INN OF TWO
n cargo MSC Ch
ning dry car at 9.50 however,
y rescued essels collu Port Trug to Coast he JNPT ato the impox. 2,500 ision, MSCers on the
Pag
rcise is to e Treatmeat can be eResource
m the Sectcategories
are commgely withinof the NaEs, for tanrts in SMEEs is a bo
tment facili-processorWastes’. rocessors, r forming tsectors; Intermedia& Drug Int
& Pesticide processing
N ARABIAO SHIPS
ships nahitra, loaargo, collidAM on 7the Indiall 33 s
lided whenust (JNPT),Guards, th
area, got gpact. The tonnes of
C Chitra tilship, fallin
ge | 223
emphasizeent’ to a explored atefficient an
toral studieare red c
monly ‘batchn a given inational prnneries it is, the flexi
oon in disg
ities are bors are a se
two majtendency’ a
ates, termediateIntermediag – Dyeing
AN SEA C
amed MVaded withded off the7th Augustian Coastsailors onn the form, off Mumhe Vessel grounded affected s
f oil at thelted in the ng from it a
e the needwide ran
t various stnd Cost eff
es are; category (h
h type’ andndustry secroduction is almost 9ibility to adguise for l
oon to SMEeparate ca
or aspectand ‘Wide
es, ates, & Bleachi
COAST, NE
V h e t t n
mer was attmbai, at 5
MSC Chitin the vicship, MSCe time of tsea and as
at regular i
d to move ange of effetages i.e. ufective ope
highly poll
d degree ofctor. in any gi
90%. Most dopt to sudlarge playe
Es. ategory by
s amongsProduct M
ing),
EAR MUM
tempting tnautical mra was in
cinity of thC Chitra, wthe accidens a result, intervals.
away fromective prounit operatrations.
luting) typ
f mechanis
iven sectomajor pla
dden changers for a g
themselve
st the secMix’ in a si
MBAI DUE
to berth atmiles fromthe proces
he Prong was reportnt. Due torescue gro
m the ocess tions
pe of
sm /
or is ayers ge in given
es as
ctors ingle
E TO
t the m the
ss of Reef tedly o the oups
Page 145A cviii
Page | 224
The areas affected due to oil pollution are Geeta Nagar, Mumbai, Vashi, Navi Mumbai, Coloba, Mumbai, U S Club, Mumbai, Navy Nagar, Mumbai, Uran, Raigad, Elephanta Caves, Mumbai, Kihima Beach, Raigad, Awas Beach Raigad etc. Immediately after the incident the Central Pollution Control Board, Zonal office-West has advised Gujarat State Pollution Control Board and Daman Pollution Control Committee to have a close watch on the Gujarat coast to assess any impact of the incident. The Central Pollution Control Board Zonal Office-Vadodara deputed a team of officials during 9th– 12th August 2010. The team has visited various beaches for environmental assessment. The sea water quality has been monitored at five locations at Greater Mumbai viz. Gateway of India, Pilot bander (near Coloba point), Nariman point (Marine drive), Girgaon chowpaty and Hazi ali Tomb and at three locations at Navi Mumbai and Raigad namely Pirwadi Beach, (Uran) Karanja and Mora bander. Some oil slicks were also observed at Gateway of India, while oily patches on the rocks at Nariman Point (Marine Drive). Floating containers in sea were observed from Pirwadi beach (Uran) while the packaging material and packets of tea etc. were found lying on the beach. 14.17 ENVIRONMENTAL DATA BANK – DATA BASE MANAGEMENT 14.17.1 Data Base Management at Central Pollution Control Board The Central Pollution Control Board’s headquarters and all Zonal offices are equipped with Computers, Laptops & Peripherals for database management. Antivirus software had been installed in the systems. The new computers have been procured for newly recruited officials. The strengthening of database management activities are undertaken as per the requirements from time to time. Hindi software had also been installed in the computers as an effort towards Rajbhasha implementation. All data related to National Ambient Air Quality Monitoring Network, Water Quality Monitoring Network, Noise Pollution Network, SODAR, BAM, and Meteorological Systems had been downloaded and stored in systematic manner. All archives of the information being computerized and stored in computers in a systematic manner. Actions had taken for Annual Maintenance Contract, Data security and regular upkeep/maintenance of all the computers modem and data stations. 14.18 NEW CONSTRUCTION / RENOVATION OF CPCB OFFICES BUILDINGS 14.18.1 Building Construction Project – Zonal Office Bhopal For construction of office cum laboratory building of Central Pollution Control Board (CPCB) Zonal Office Bhopal, Madhya Pradesh State Government had allotted 5,000 sq. ft. land during year 2005, at E-5, Paryavaran Parisar, Arera
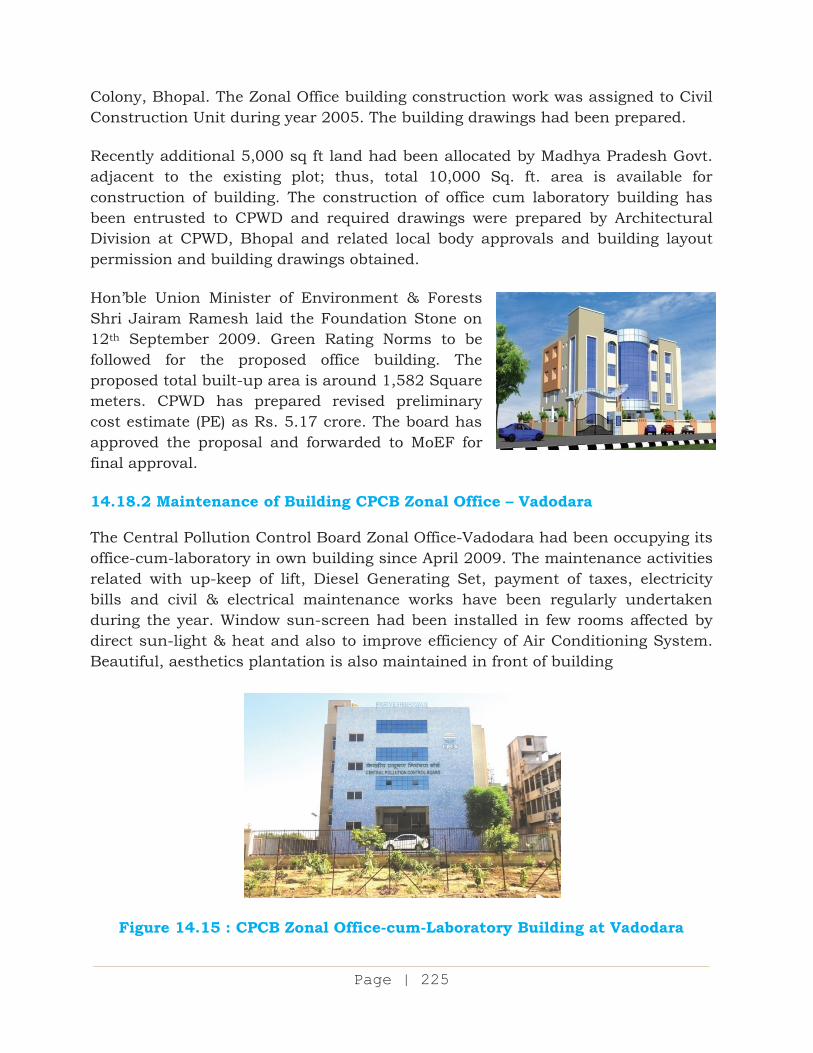
Page 145A cix
Page | 225
Colony, Bhopal. The Zonal Office building construction work was assigned to Civil Construction Unit during year 2005. The building drawings had been prepared. Recently additional 5,000 sq ft land had been allocated by Madhya Pradesh Govt. adjacent to the existing plot; thus, total 10,000 Sq. ft. area is available for construction of building. The construction of office cum laboratory building has been entrusted to CPWD and required drawings were prepared by Architectural Division at CPWD, Bhopal and related local body approvals and building layout permission and building drawings obtained.
Hon’ble Union Minister of Environment & Forests Shri Jairam Ramesh laid the Foundation Stone on 12th September 2009. Green Rating Norms to be followed for the proposed office building. The proposed total built-up area is around 1,582 Square meters. CPWD has prepared revised preliminary cost estimate (PE) as Rs. 5.17 crore. The board has approved the proposal and forwarded to MoEF for final approval. 14.18.2 Maintenance of Building CPCB Zonal Office – Vadodara The Central Pollution Control Board Zonal Office-Vadodara had been occupying its office-cum-laboratory in own building since April 2009. The maintenance activities related with up-keep of lift, Diesel Generating Set, payment of taxes, electricity bills and civil & electrical maintenance works have been regularly undertaken during the year. Window sun-screen had been installed in few rooms affected by direct sun-light & heat and also to improve efficiency of Air Conditioning System. Beautiful, aesthetics plantation is also maintained in front of building
Figure 14.15 : CPCB Zonal Office-cum-Laboratory Building at Vadodara
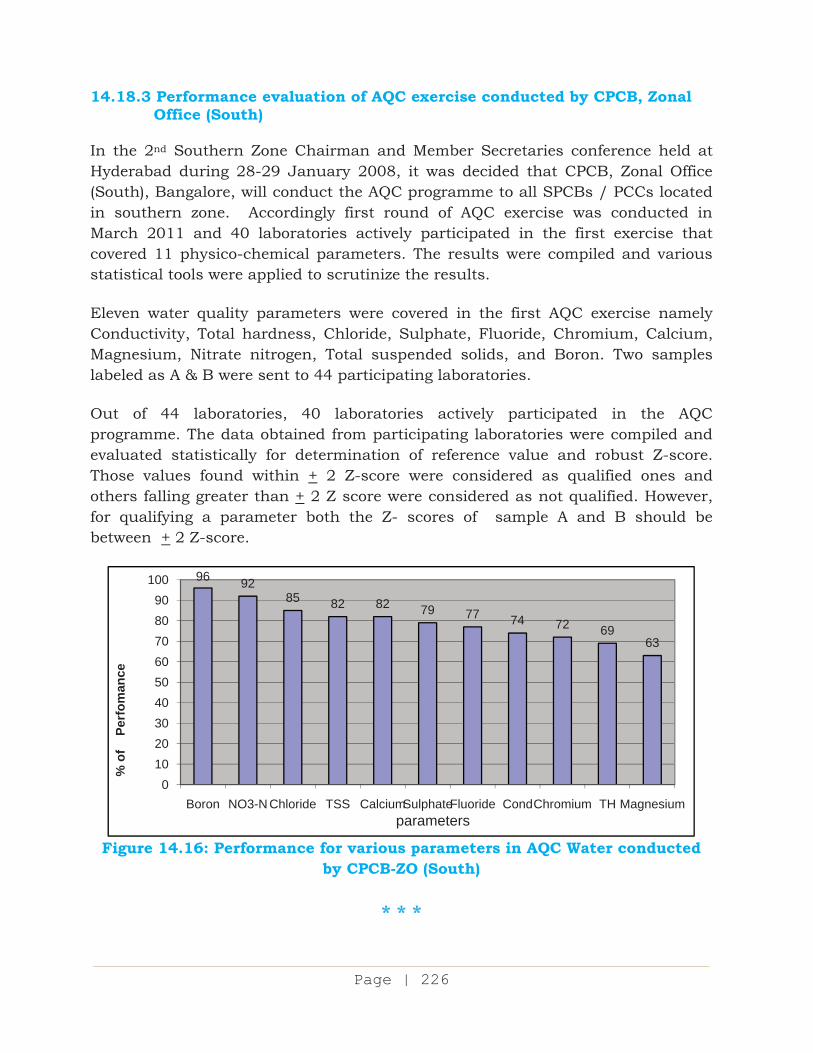
Page 145A cx
Page | 226
14.18.3 Performance evaluation of AQC exercise conducted by CPCB, Zonal Office (South)
In the 2nd Southern Zone Chairman and Member Secretaries conference held at Hyderabad during 28-29 January 2008, it was decided that CPCB, Zonal Office (South), Bangalore, will conduct the AQC programme to all SPCBs / PCCs located in southern zone. Accordingly first round of AQC exercise was conducted in March 2011 and 40 laboratories actively participated in the first exercise that covered 11 physico-chemical parameters. The results were compiled and various statistical tools were applied to scrutinize the results. Eleven water quality parameters were covered in the first AQC exercise namely Conductivity, Total hardness, Chloride, Sulphate, Fluoride, Chromium, Calcium, Magnesium, Nitrate nitrogen, Total suspended solids, and Boron. Two samples labeled as A & B were sent to 44 participating laboratories. Out of 44 laboratories, 40 laboratories actively participated in the AQC programme. The data obtained from participating laboratories were compiled and evaluated statistically for determination of reference value and robust Z-score. Those values found within + 2 Z-score were considered as qualified ones and others falling greater than + 2 Z score were considered as not qualified. However, for qualifying a parameter both the Z- scores of sample A and B should be between + 2 Z-score.
Figure 14.16: Performance for various parameters in AQC Water conducted
by CPCB-ZO (South)
* * *
96 9285 82 82 79 77 74 72 69
63
0102030405060708090
100
Boron NO3-N Chloride TSS CalciumSulphateFluoride CondChromium TH Magnesium
% o
f P
erfo
man
ce
parameters
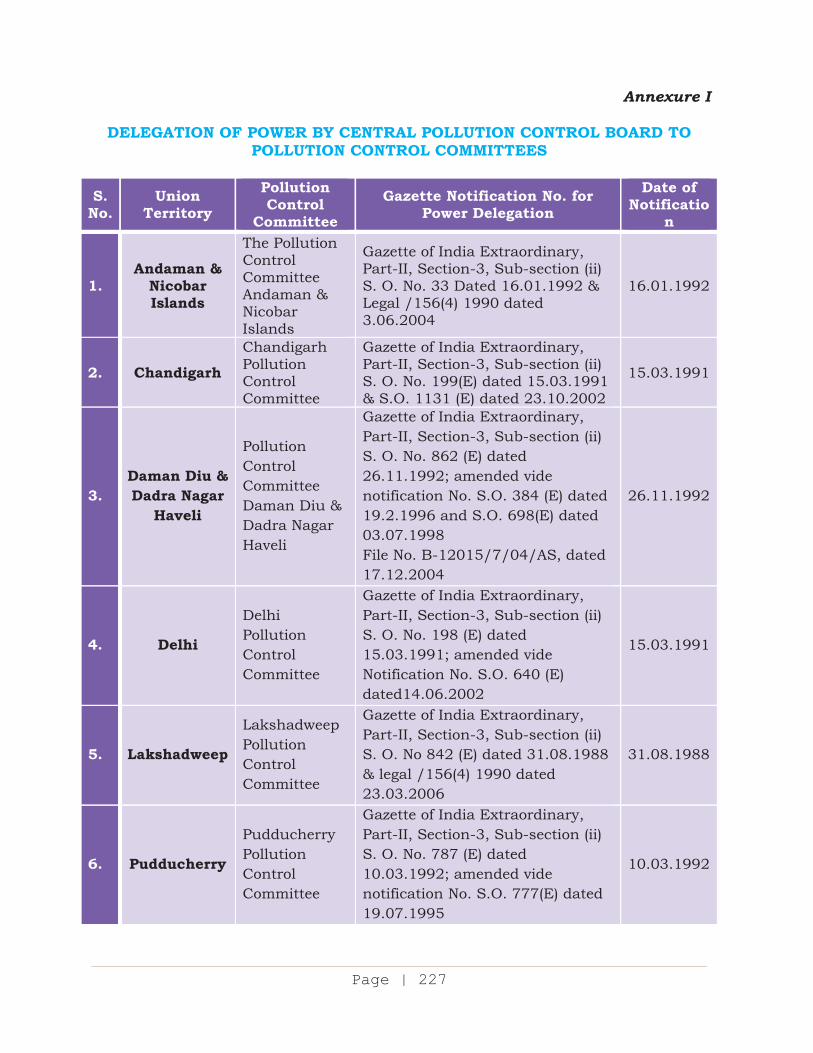
Page 145A cxi
Page | 227
Annexure I
DELEGATION OF POWER BY CENTRAL POLLUTION CONTROL BOARD TO POLLUTION CONTROL COMMITTEES
S. No.
Union Territory
Pollution Control
Committee
Gazette Notification No. for Power Delegation
Date of Notificatio
n
1. Andaman &
Nicobar Islands
The Pollution Control Committee Andaman & Nicobar Islands
Gazette of India Extraordinary, Part-II, Section-3, Sub-section (ii) S. O. No. 33 Dated 16.01.1992 & Legal /156(4) 1990 dated 3.06.2004
16.01.1992
2. Chandigarh
Chandigarh Pollution Control Committee
Gazette of India Extraordinary, Part-II, Section-3, Sub-section (ii) S. O. No. 199(E) dated 15.03.1991 & S.O. 1131 (E) dated 23.10.2002
15.03.1991
3. Daman Diu & Dadra Nagar
Haveli
Pollution Control Committee Daman Diu & Dadra Nagar Haveli
Gazette of India Extraordinary, Part-II, Section-3, Sub-section (ii) S. O. No. 862 (E) dated 26.11.1992; amended vide notification No. S.O. 384 (E) dated 19.2.1996 and S.O. 698(E) dated 03.07.1998 File No. B-12015/7/04/AS, dated 17.12.2004
26.11.1992
4. Delhi
Delhi Pollution Control Committee
Gazette of India Extraordinary, Part-II, Section-3, Sub-section (ii) S. O. No. 198 (E) dated 15.03.1991; amended vide Notification No. S.O. 640 (E) dated14.06.2002
15.03.1991
5. Lakshadweep
Lakshadweep Pollution Control Committee
Gazette of India Extraordinary, Part-II, Section-3, Sub-section (ii) S. O. No 842 (E) dated 31.08.1988 & legal /156(4) 1990 dated 23.03.2006
31.08.1988
6. Pudducherry
Pudducherry Pollution Control Committee
Gazette of India Extraordinary, Part-II, Section-3, Sub-section (ii) S. O. No. 787 (E) dated 10.03.1992; amended vide notification No. S.O. 777(E) dated 19.07.1995
10.03.1992
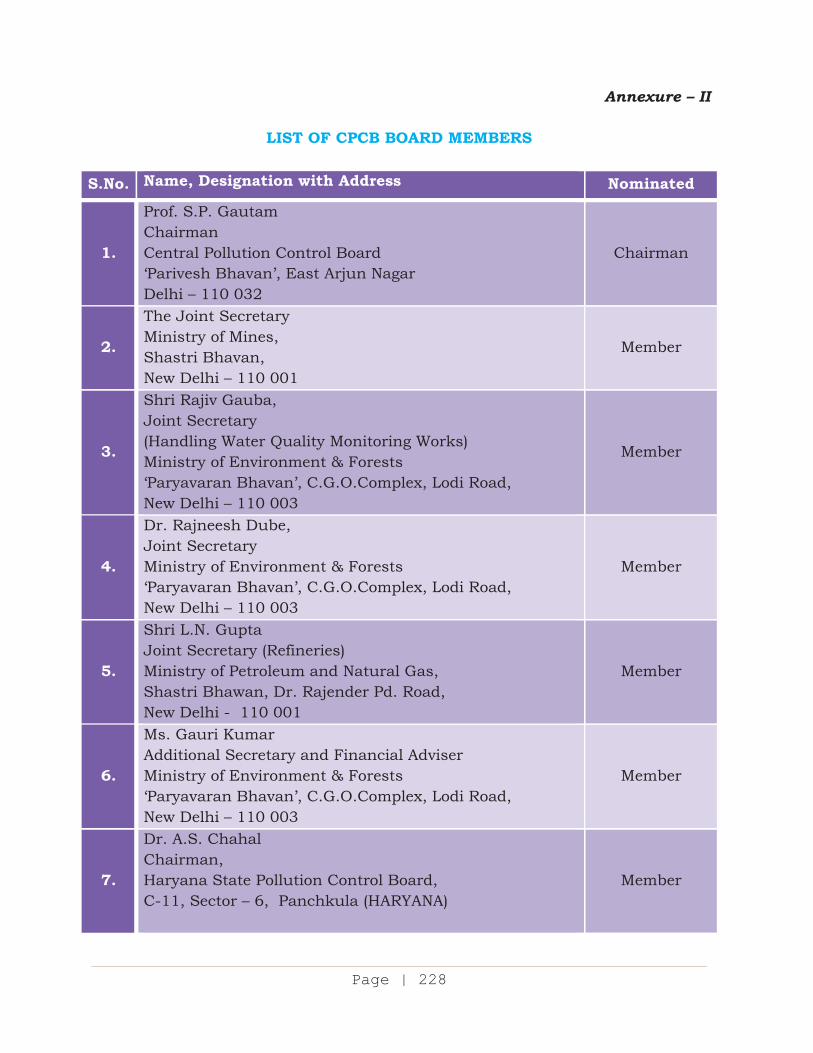
Page 145A cxii
Page | 228
Annexure – II
LIST OF CPCB BOARD MEMBERS
S.No. Name, Designation with Address Nominated
1.
Prof. S.P. Gautam Chairman Central Pollution Control Board ‘Parivesh Bhavan’, East Arjun Nagar Delhi – 110 032
Chairman
2.
The Joint Secretary Ministry of Mines, Shastri Bhavan, New Delhi – 110 001
Member
3.
Shri Rajiv Gauba, Joint Secretary (Handling Water Quality Monitoring Works) Ministry of Environment & Forests ‘Paryavaran Bhavan’, C.G.O.Complex, Lodi Road, New Delhi – 110 003
Member
4.
Dr. Rajneesh Dube, Joint Secretary Ministry of Environment & Forests ‘Paryavaran Bhavan’, C.G.O.Complex, Lodi Road, New Delhi – 110 003
Member
5.
Shri L.N. Gupta Joint Secretary (Refineries) Ministry of Petroleum and Natural Gas, Shastri Bhawan, Dr. Rajender Pd. Road, New Delhi - 110 001
Member
6.
Ms. Gauri Kumar Additional Secretary and Financial Adviser Ministry of Environment & Forests ‘Paryavaran Bhavan’, C.G.O.Complex, Lodi Road, New Delhi – 110 003
Member
7.
Dr. A.S. Chahal Chairman, Haryana State Pollution Control Board, C-11, Sector – 6, Panchkula (HARYANA)
Member
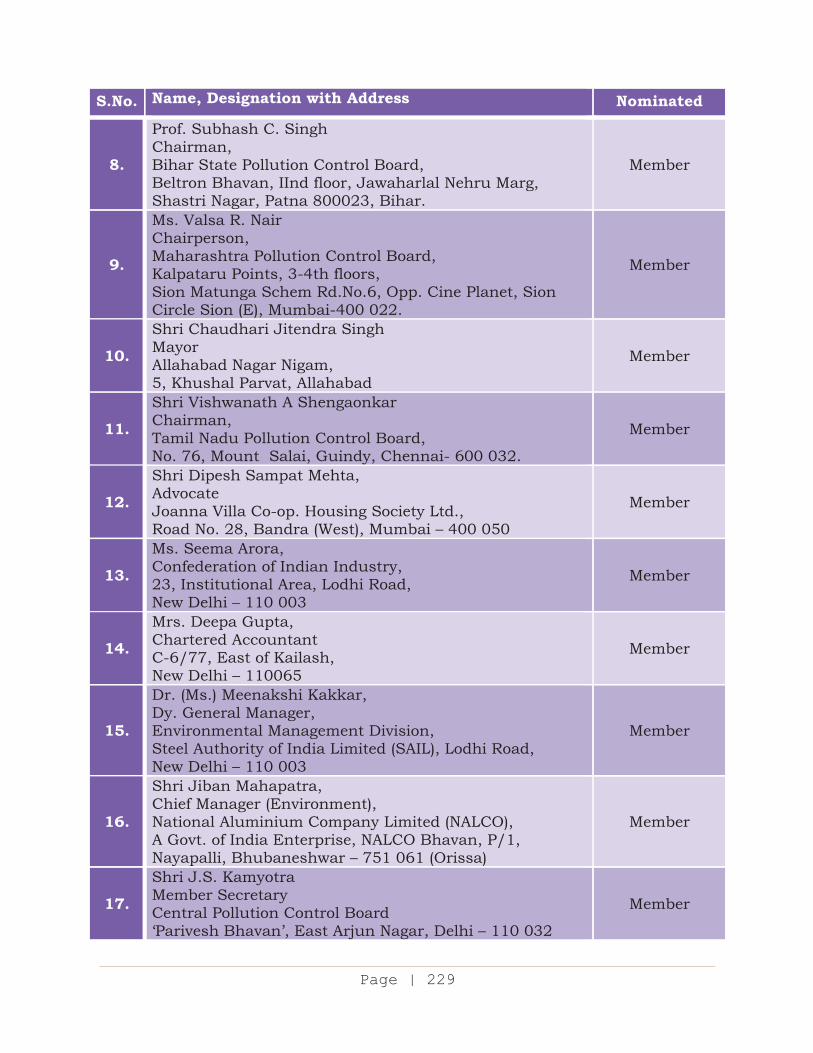
Page 145A cxiii
Page | 229
S.No. Name, Designation with Address Nominated
8.
Prof. Subhash C. Singh Chairman, Bihar State Pollution Control Board, Beltron Bhavan, IInd floor, Jawaharlal Nehru Marg, Shastri Nagar, Patna 800023, Bihar.
Member
9.
Ms. Valsa R. Nair Chairperson, Maharashtra Pollution Control Board, Kalpataru Points, 3-4th floors, Sion Matunga Schem Rd.No.6, Opp. Cine Planet, Sion Circle Sion (E), Mumbai-400 022.
Member
10.
Shri Chaudhari Jitendra Singh Mayor Allahabad Nagar Nigam, 5, Khushal Parvat, Allahabad
Member
11. Shri Vishwanath A Shengaonkar Chairman, Tamil Nadu Pollution Control Board, No. 76, Mount Salai, Guindy, Chennai- 600 032.
Member
12.
Shri Dipesh Sampat Mehta, Advocate Joanna Villa Co-op. Housing Society Ltd., Road No. 28, Bandra (West), Mumbai – 400 050
Member
13.
Ms. Seema Arora, Confederation of Indian Industry, 23, Institutional Area, Lodhi Road, New Delhi – 110 003
Member
14. Mrs. Deepa Gupta, Chartered Accountant C-6/77, East of Kailash, New Delhi – 110065
Member
15.
Dr. (Ms.) Meenakshi Kakkar, Dy. General Manager, Environmental Management Division, Steel Authority of India Limited (SAIL), Lodhi Road, New Delhi – 110 003
Member
16.
Shri Jiban Mahapatra, Chief Manager (Environment), National Aluminium Company Limited (NALCO), A Govt. of India Enterprise, NALCO Bhavan, P/1, Nayapalli, Bhubaneshwar – 751 061 (Orissa)
Member
17.
Shri J.S. Kamyotra Member Secretary Central Pollution Control Board ‘Parivesh Bhavan’, East Arjun Nagar, Delhi – 110 032
Member
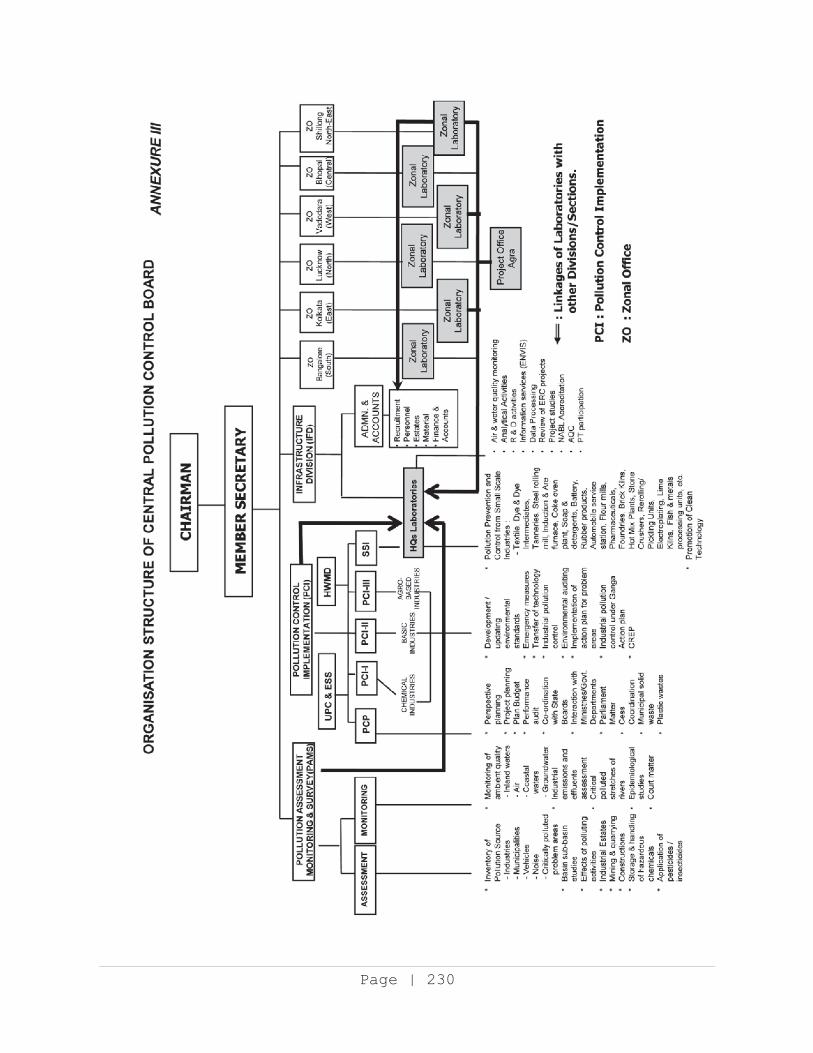
Page 147A 235
Pagge | 230
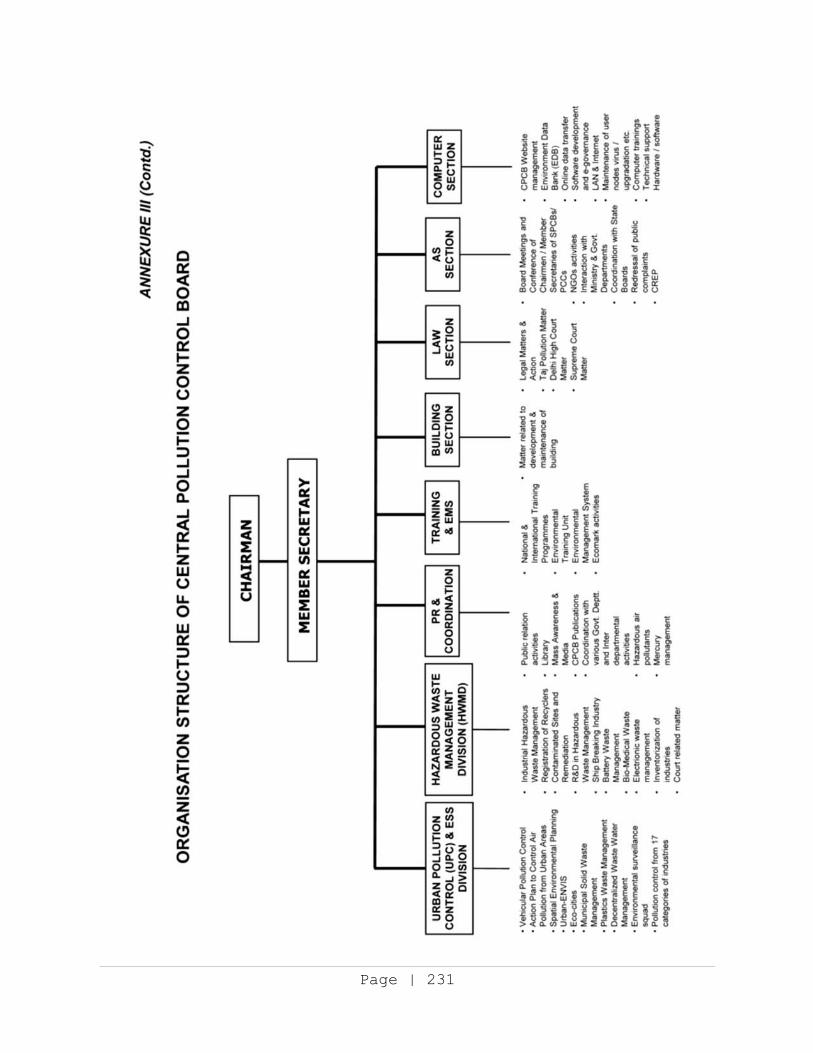
Page 147A 236
Pagge | 231
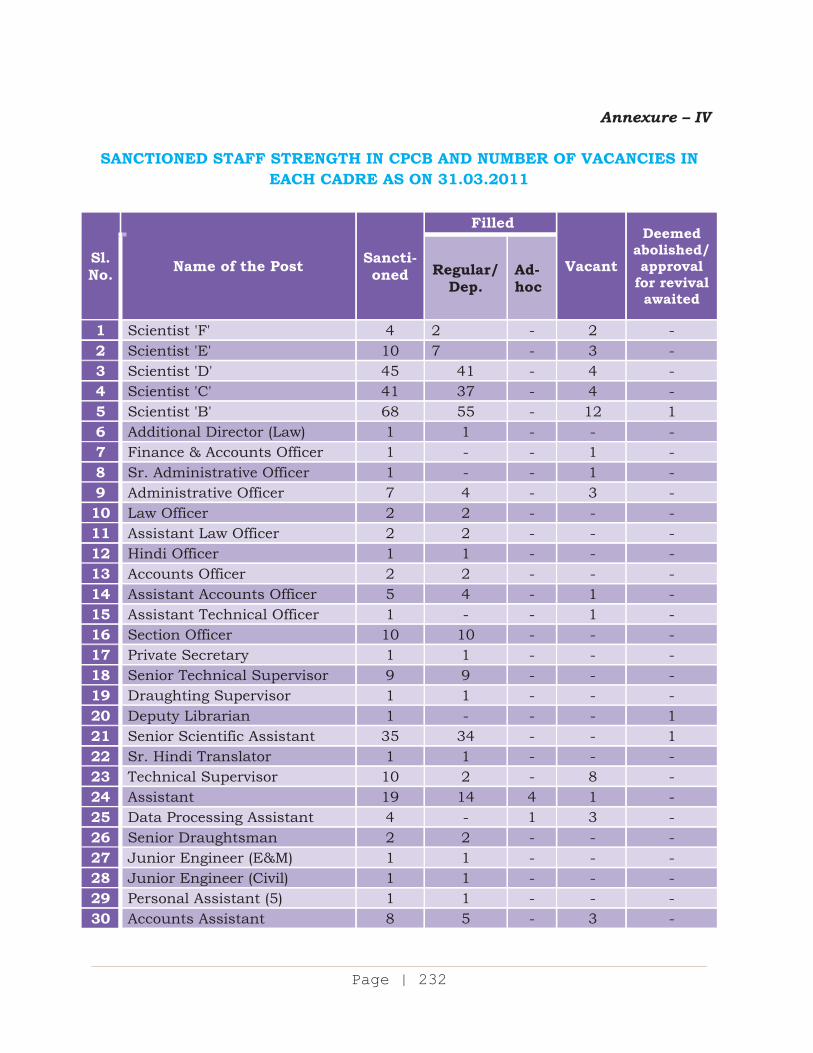
Page 145A cxvi
Page | 232
Annexure – IV
SANCTIONED STAFF STRENGTH IN CPCB AND NUMBER OF VACANCIES IN
EACH CADRE AS ON 31.03.2011
Sl. No. Name of the Post Sancti-
oned
Filled
Vacant
Deemed abolished/ approval
for revival awaited
Regular/ Dep.
Ad-hoc
1 Scientist 'F' 4 2 - 2 - 2 Scientist 'E' 10 7 - 3 - 3 Scientist 'D' 45 41 - 4 - 4 Scientist 'C' 41 37 - 4 - 5 Scientist 'B' 68 55 - 12 1 6 Additional Director (Law) 1 1 - - - 7 Finance & Accounts Officer 1 - - 1 - 8 Sr. Administrative Officer 1 - - 1 - 9 Administrative Officer 7 4 - 3 - 10 Law Officer 2 2 - - - 11 Assistant Law Officer 2 2 - - - 12 Hindi Officer 1 1 - - - 13 Accounts Officer 2 2 - - - 14 Assistant Accounts Officer 5 4 - 1 - 15 Assistant Technical Officer 1 - - 1 - 16 Section Officer 10 10 - - - 17 Private Secretary 1 1 - - - 18 Senior Technical Supervisor 9 9 - - - 19 Draughting Supervisor 1 1 - - - 20 Deputy Librarian 1 - - - 1 21 Senior Scientific Assistant 35 34 - - 1 22 Sr. Hindi Translator 1 1 - - - 23 Technical Supervisor 10 2 - 8 - 24 Assistant 19 14 4 1 - 25 Data Processing Assistant 4 - 1 3 - 26 Senior Draughtsman 2 2 - - - 27 Junior Engineer (E&M) 1 1 - - - 28 Junior Engineer (Civil) 1 1 - - - 29 Personal Assistant (5) 1 1 - - - 30 Accounts Assistant 8 5 - 3 -
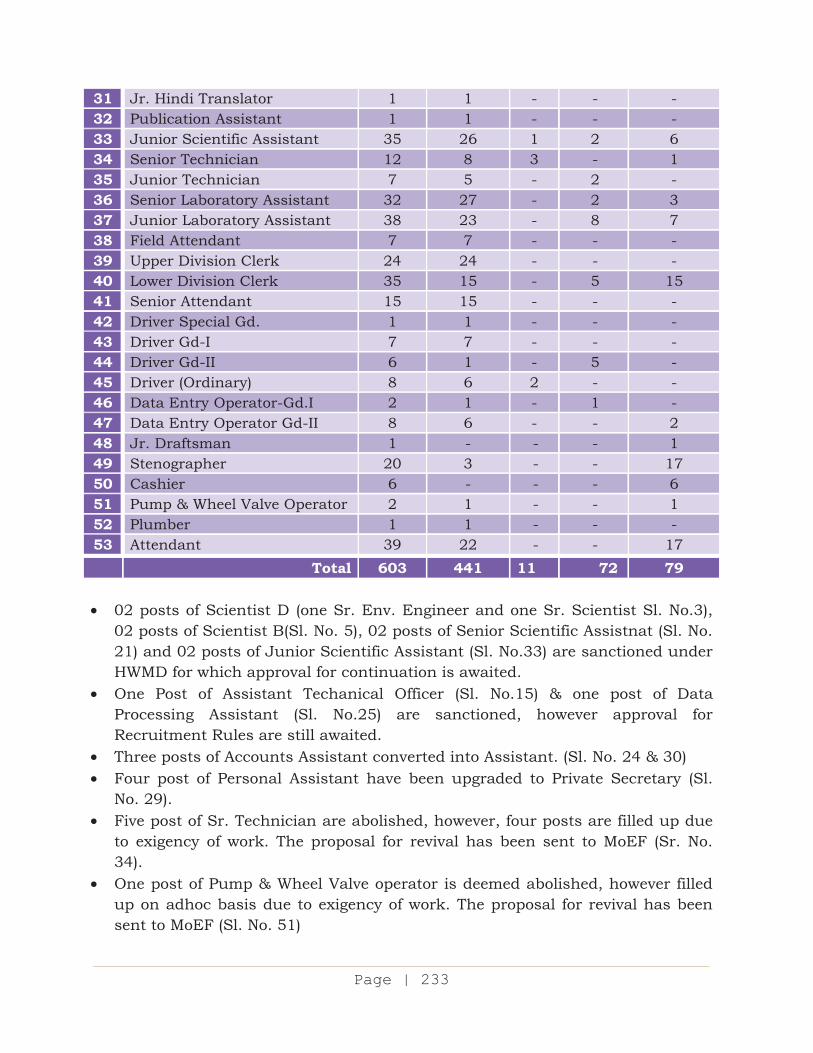
Page 145A cxvii
Page | 233
31 Jr. Hindi Translator 1 1 - - - 32 Publication Assistant 1 1 - - - 33 Junior Scientific Assistant 35 26 1 2 6 34 Senior Technician 12 8 3 - 1 35 Junior Technician 7 5 - 2 - 36 Senior Laboratory Assistant 32 27 - 2 3 37 Junior Laboratory Assistant 38 23 - 8 7 38 Field Attendant 7 7 - - - 39 Upper Division Clerk 24 24 - - - 40 Lower Division Clerk 35 15 - 5 15 41 Senior Attendant 15 15 - - - 42 Driver Special Gd. 1 1 - - - 43 Driver Gd-I 7 7 - - - 44 Driver Gd-II 6 1 - 5 - 45 Driver (Ordinary) 8 6 2 - - 46 Data Entry Operator-Gd.I 2 1 - 1 - 47 Data Entry Operator Gd-II 8 6 - - 2 48 Jr. Draftsman 1 - - - 1 49 Stenographer 20 3 - - 17 50 Cashier 6 - - - 6 51 Pump & Wheel Valve Operator 2 1 - - 1 52 Plumber 1 1 - - - 53 Attendant 39 22 - - 17 Total 603 441 11 72 79 02 posts of Scientist D (one Sr. Env. Engineer and one Sr. Scientist Sl. No.3),
02 posts of Scientist B(Sl. No. 5), 02 posts of Senior Scientific Assistnat (Sl. No. 21) and 02 posts of Junior Scientific Assistant (Sl. No.33) are sanctioned under HWMD for which approval for continuation is awaited.
One Post of Assistant Techanical Officer (Sl. No.15) & one post of Data Processing Assistant (Sl. No.25) are sanctioned, however approval for Recruitment Rules are still awaited.
Three posts of Accounts Assistant converted into Assistant. (Sl. No. 24 & 30) Four post of Personal Assistant have been upgraded to Private Secretary (Sl.
No. 29). Five post of Sr. Technician are abolished, however, four posts are filled up due
to exigency of work. The proposal for revival has been sent to MoEF (Sr. No. 34).
One post of Pump & Wheel Valve operator is deemed abolished, however filled up on adhoc basis due to exigency of work. The proposal for revival has been sent to MoEF (Sl. No. 51)
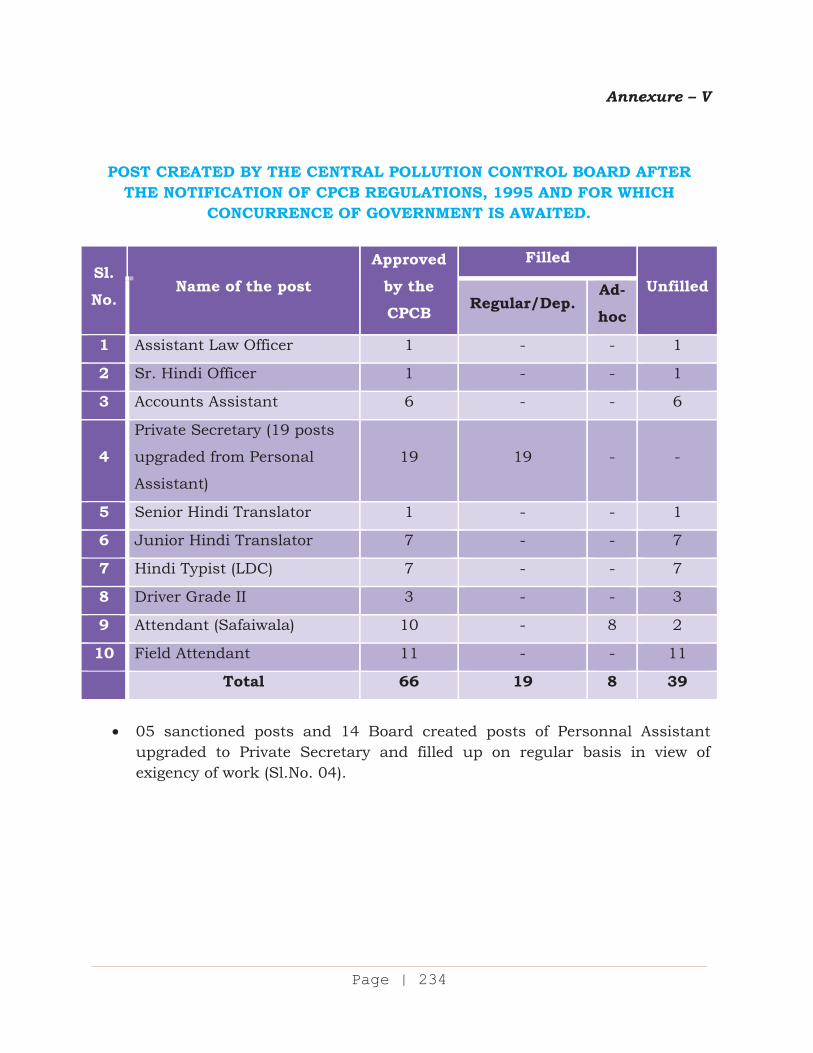
Page 145A cxviii
Page | 234
Annexure – V
POST CREATED BY THE CENTRAL POLLUTION CONTROL BOARD AFTER THE NOTIFICATION OF CPCB REGULATIONS, 1995 AND FOR WHICH
CONCURRENCE OF GOVERNMENT IS AWAITED.
Sl. No.
Name of the post
Approved
by the CPCB
Filled
UnfilledRegular/Dep.
Ad-
hoc
1 Assistant Law Officer 1 - - 1
2 Sr. Hindi Officer 1 - - 1
3 Accounts Assistant 6 - - 6
4 Private Secretary (19 posts
upgraded from Personal
Assistant)
19 19 - -
5 Senior Hindi Translator 1 - - 1
6 Junior Hindi Translator 7 - - 7
7 Hindi Typist (LDC) 7 - - 7
8 Driver Grade II 3 - - 3
9 Attendant (Safaiwala) 10 - 8 2
10 Field Attendant 11 - - 11
Total 66 19 8 39
05 sanctioned posts and 14 Board created posts of Personnal Assistant
upgraded to Private Secretary and filled up on regular basis in view of exigency of work (Sl.No. 04).
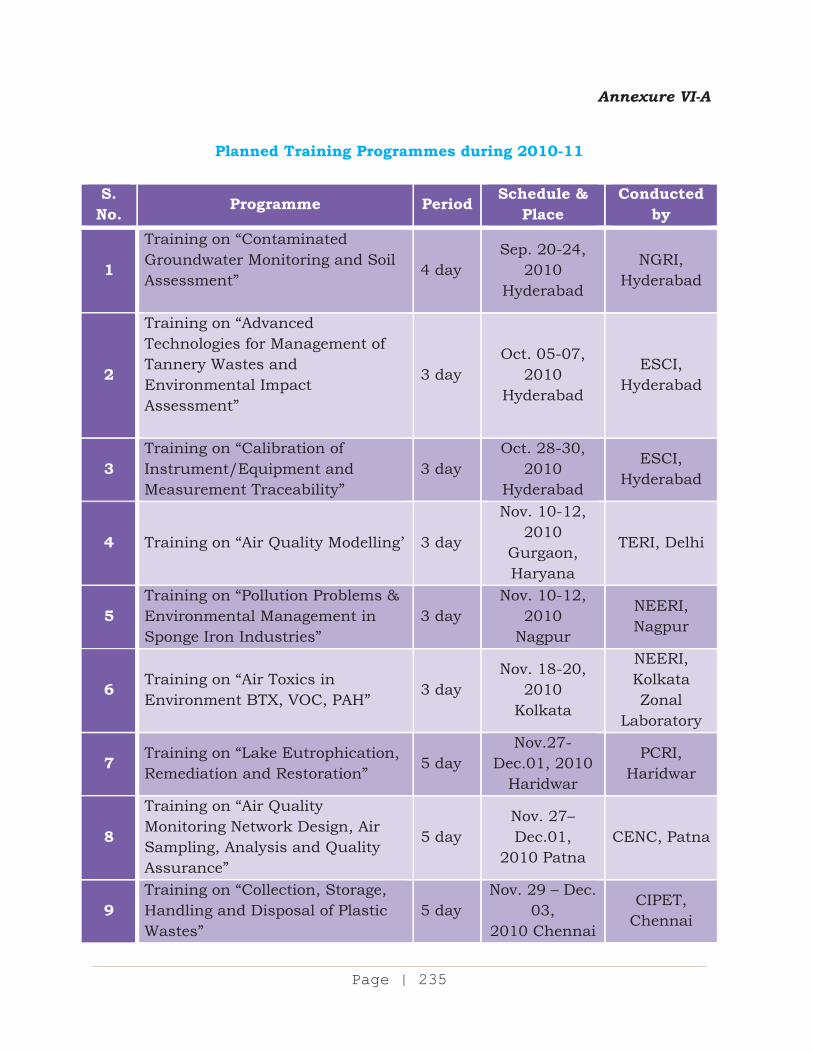
Page 145A cxix
Page | 235
Annexure VI-A
Planned Training Programmes during 2010-11
S. No. Programme Period Schedule &
Place Conducted
by
1
Training on “Contaminated Groundwater Monitoring and Soil Assessment”
4 day Sep. 20-24,
2010 Hyderabad
NGRI, Hyderabad
2
Training on “Advanced Technologies for Management of Tannery Wastes and Environmental Impact Assessment”
3 day Oct. 05-07,
2010 Hyderabad
ESCI, Hyderabad
3 Training on “Calibration of Instrument/Equipment and Measurement Traceability”
3 day Oct. 28-30,
2010 Hyderabad
ESCI, Hyderabad
4 Training on “Air Quality Modelling’ 3 day
Nov. 10-12, 2010
Gurgaon, Haryana
TERI, Delhi
5 Training on “Pollution Problems & Environmental Management in Sponge Iron Industries”
3 day Nov. 10-12,
2010 Nagpur
NEERI, Nagpur
6 Training on “Air Toxics in Environment BTX, VOC, PAH”
3 day Nov. 18-20,
2010 Kolkata
NEERI, Kolkata Zonal
Laboratory
7 Training on “Lake Eutrophication, Remediation and Restoration”
5 day Nov.27-
Dec.01, 2010 Haridwar
PCRI, Haridwar
8
Training on “Air Quality Monitoring Network Design, Air Sampling, Analysis and Quality Assurance”
5 day Nov. 27– Dec.01,
2010 Patna CENC, Patna
9 Training on “Collection, Storage, Handling and Disposal of Plastic Wastes”
5 day Nov. 29 – Dec.
03, 2010 Chennai
CIPET, Chennai
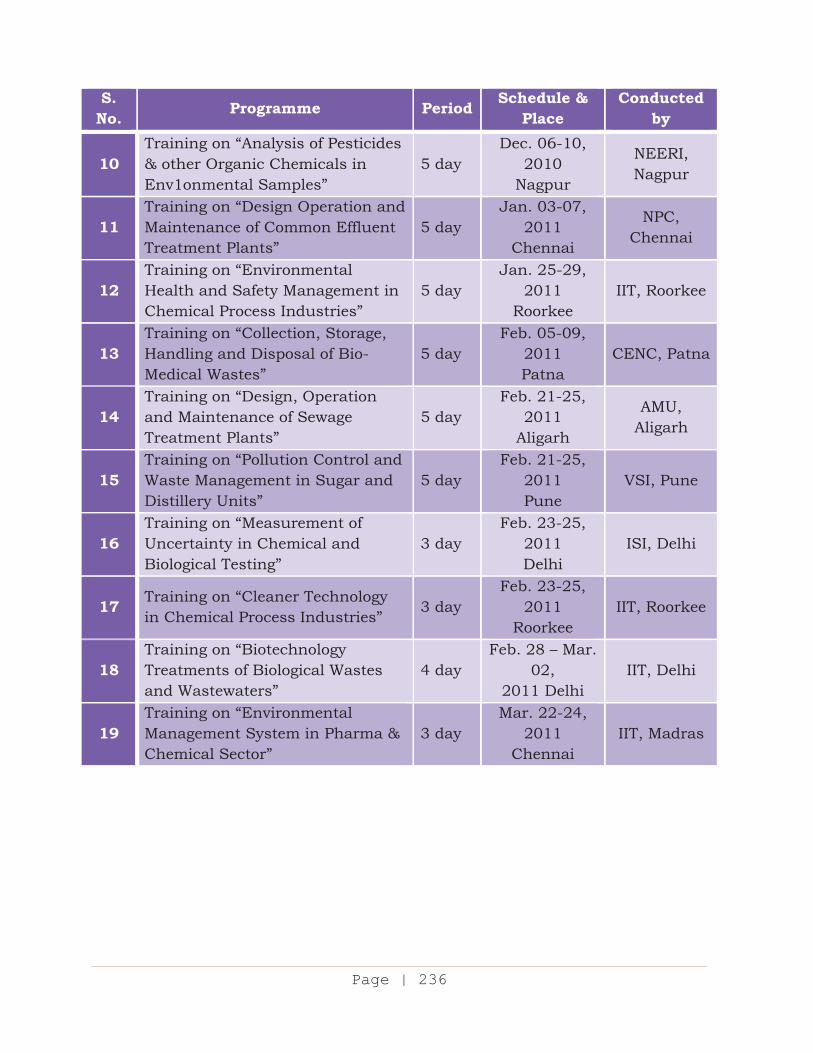
Page 145A cxx
Page | 236
S. No. Programme Period Schedule &
Place Conducted
by
10 Training on “Analysis of Pesticides & other Organic Chemicals in Env1onmental Samples”
5 day Dec. 06-10,
2010 Nagpur
NEERI, Nagpur
11 Training on “Design Operation and Maintenance of Common Effluent Treatment Plants”
5 day Jan. 03-07,
2011 Chennai
NPC, Chennai
12 Training on “Environmental Health and Safety Management in Chemical Process Industries”
5 day Jan. 25-29,
2011 Roorkee
IIT, Roorkee
13 Training on “Collection, Storage, Handling and Disposal of Bio-Medical Wastes”
5 day Feb. 05-09,
2011 Patna
CENC, Patna
14 Training on “Design, Operation and Maintenance of Sewage Treatment Plants”
5 day Feb. 21-25,
2011 Aligarh
AMU, Aligarh
15 Training on “Pollution Control and Waste Management in Sugar and Distillery Units”
5 day Feb. 21-25,
2011 Pune
VSI, Pune
16 Training on “Measurement of Uncertainty in Chemical and Biological Testing”
3 day Feb. 23-25,
2011 Delhi
ISI, Delhi
17 Training on “Cleaner Technology in Chemical Process Industries”
3 day Feb. 23-25,
2011 Roorkee
IIT, Roorkee
18 Training on “Biotechnology Treatments of Biological Wastes and Wastewaters”
4 day Feb. 28 – Mar.
02, 2011 Delhi
IIT, Delhi
19 Training on “Environmental Management System in Pharma & Chemical Sector”
3 day Mar. 22-24,
2011 Chennai
IIT, Madras
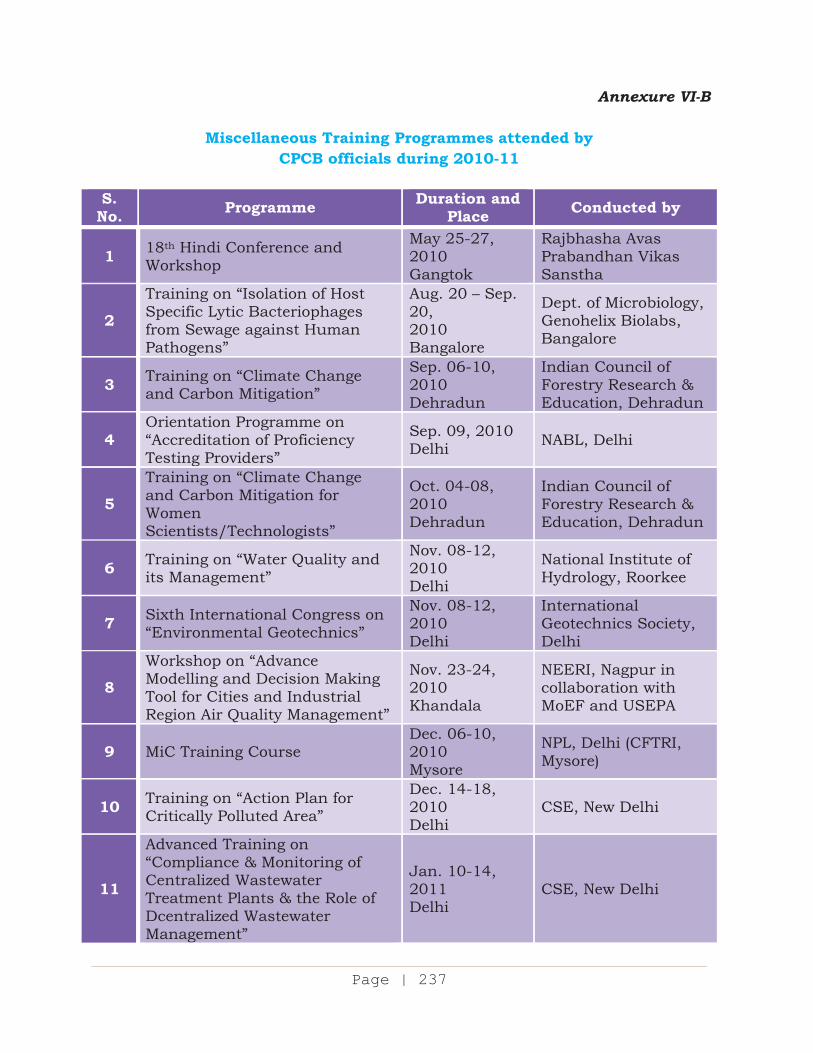
Page 145A cxxi
Page | 237
Annexure VI-B
Miscellaneous Training Programmes attended by CPCB officials during 2010-11
S.
No. Programme Duration and Place Conducted by
1 18th Hindi Conference and Workshop
May 25-27, 2010 Gangtok
Rajbhasha Avas Prabandhan Vikas Sanstha
2
Training on “Isolation of Host Specific Lytic Bacteriophages from Sewage against Human Pathogens”
Aug. 20 – Sep. 20, 2010 Bangalore
Dept. of Microbiology, Genohelix Biolabs, Bangalore
3 Training on “Climate Change and Carbon Mitigation”
Sep. 06-10, 2010 Dehradun
Indian Council of Forestry Research & Education, Dehradun
4 Orientation Programme on “Accreditation of Proficiency Testing Providers”
Sep. 09, 2010 Delhi NABL, Delhi
5 Training on “Climate Change and Carbon Mitigation for Women Scientists/Technologists”
Oct. 04-08, 2010 Dehradun
Indian Council of Forestry Research & Education, Dehradun
6 Training on “Water Quality and its Management”
Nov. 08-12, 2010 Delhi
National Institute of Hydrology, Roorkee
7 Sixth International Congress on “Environmental Geotechnics”
Nov. 08-12, 2010 Delhi
International Geotechnics Society, Delhi
8 Workshop on “Advance Modelling and Decision Making Tool for Cities and Industrial Region Air Quality Management”
Nov. 23-24, 2010 Khandala
NEERI, Nagpur in collaboration with MoEF and USEPA
9 MiC Training Course Dec. 06-10, 2010 Mysore
NPL, Delhi (CFTRI, Mysore)
10 Training on “Action Plan for Critically Polluted Area”
Dec. 14-18, 2010 Delhi
CSE, New Delhi
11
Advanced Training on “Compliance & Monitoring of Centralized Wastewater Treatment Plants & the Role of Dcentralized Wastewater Management”
Jan. 10-14, 2011 Delhi
CSE, New Delhi
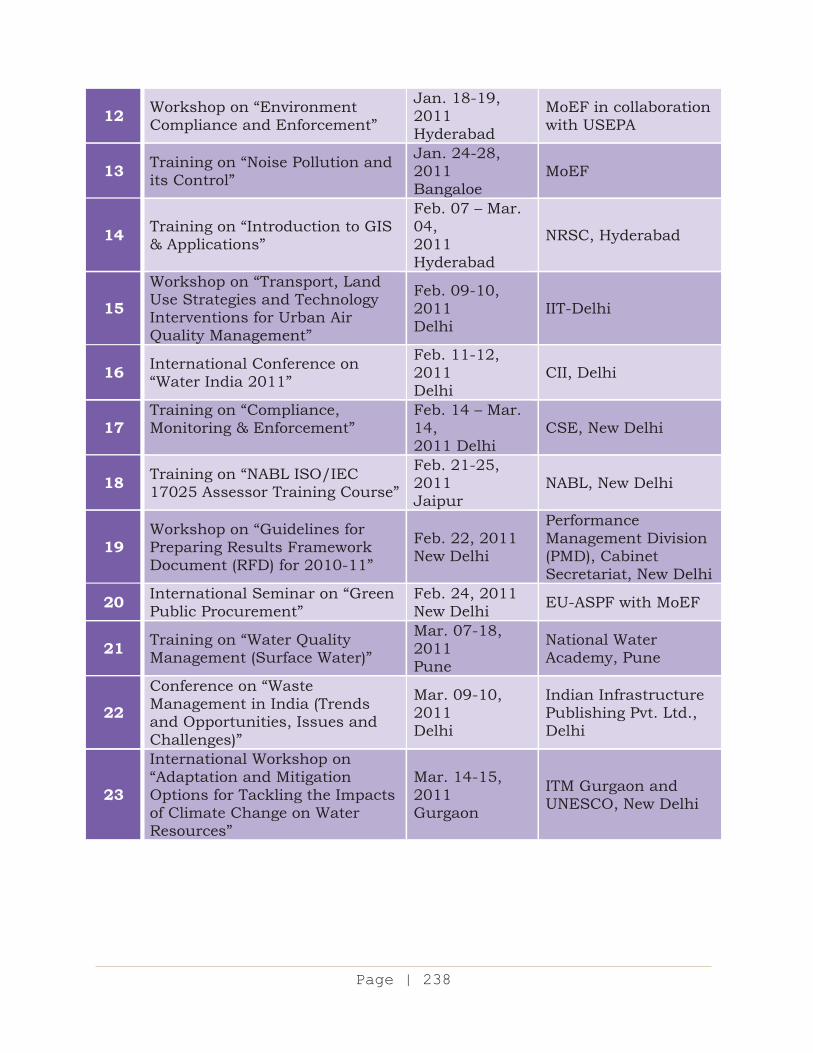
Page 145A cxxii
Page | 238
12 Workshop on “Environment Compliance and Enforcement”
Jan. 18-19, 2011 Hyderabad
MoEF in collaboration with USEPA
13 Training on “Noise Pollution and its Control”
Jan. 24-28, 2011 Bangaloe
MoEF
14 Training on “Introduction to GIS & Applications”
Feb. 07 – Mar. 04, 2011 Hyderabad
NRSC, Hyderabad
15 Workshop on “Transport, Land Use Strategies and Technology Interventions for Urban Air Quality Management”
Feb. 09-10, 2011 Delhi
IIT-Delhi
16 International Conference on “Water India 2011”
Feb. 11-12, 2011 Delhi
CII, Delhi
17 Training on “Compliance, Monitoring & Enforcement”
Feb. 14 – Mar. 14, 2011 Delhi
CSE, New Delhi
18 Training on “NABL ISO/IEC 17025 Assessor Training Course”
Feb. 21-25, 2011 Jaipur
NABL, New Delhi
19 Workshop on “Guidelines for Preparing Results Framework Document (RFD) for 2010-11”
Feb. 22, 2011 New Delhi
Performance Management Division (PMD), Cabinet Secretariat, New Delhi
20 International Seminar on “Green Public Procurement”
Feb. 24, 2011 New Delhi EU-ASPF with MoEF
21 Training on “Water Quality Management (Surface Water)”
Mar. 07-18, 2011 Pune
National Water Academy, Pune
22 Conference on “Waste Management in India (Trends and Opportunities, Issues and Challenges)”
Mar. 09-10, 2011 Delhi
Indian Infrastructure Publishing Pvt. Ltd., Delhi
23
International Workshop on “Adaptation and Mitigation Options for Tackling the Impacts of Climate Change on Water Resources”
Mar. 14-15, 2011 Gurgaon
ITM Gurgaon and UNESCO, New Delhi
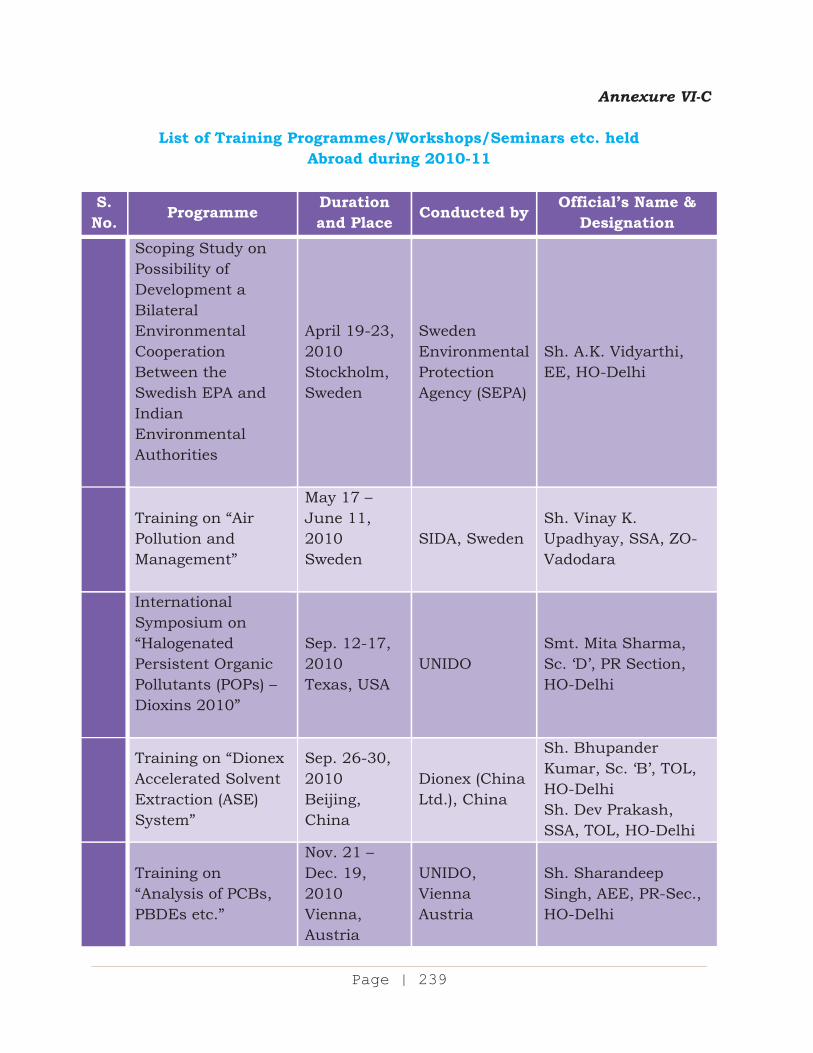
Page 145A cxxiii
Page | 239
Annexure VI-C
List of Training Programmes/Workshops/Seminars etc. held Abroad during 2010-11
S.
No. Programme Duration and Place Conducted by Official’s Name &
Designation
Scoping Study on Possibility of Development a Bilateral Environmental Cooperation Between the Swedish EPA and Indian Environmental Authorities
April 19-23, 2010 Stockholm, Sweden
Sweden Environmental Protection Agency (SEPA)
Sh. A.K. Vidyarthi, EE, HO-Delhi
Training on “Air Pollution and Management”
May 17 – June 11, 2010 Sweden
SIDA, Sweden Sh. Vinay K. Upadhyay, SSA, ZO-Vadodara
International Symposium on “Halogenated Persistent Organic Pollutants (POPs) – Dioxins 2010”
Sep. 12-17, 2010 Texas, USA
UNIDO Smt. Mita Sharma, Sc. ‘D’, PR Section, HO-Delhi
Training on “Dionex Accelerated Solvent Extraction (ASE) System”
Sep. 26-30, 2010 Beijing, China
Dionex (China Ltd.), China
Sh. Bhupander Kumar, Sc. ‘B’, TOL, HO-Delhi Sh. Dev Prakash, SSA, TOL, HO-Delhi
Training on “Analysis of PCBs, PBDEs etc.”
Nov. 21 – Dec. 19, 2010 Vienna, Austria
UNIDO, Vienna Austria
Sh. Sharandeep Singh, AEE, PR-Sec., HO-Delhi
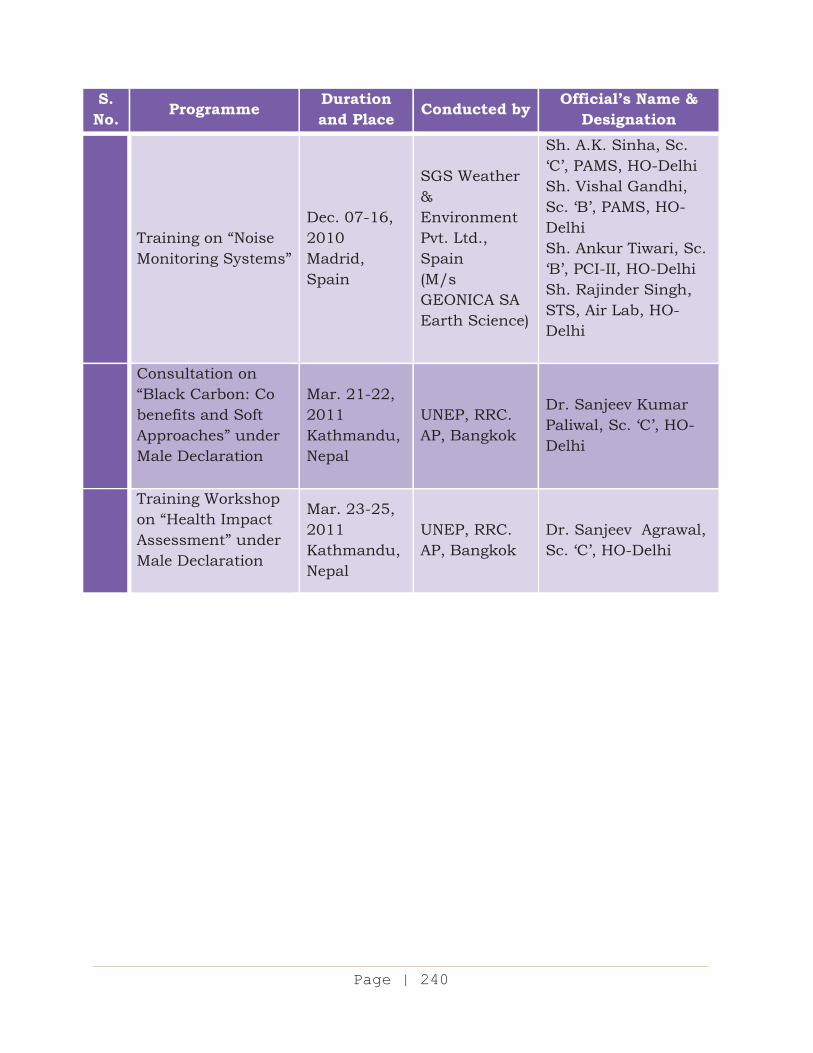
Page 145A cxxiv
Page | 240
S. No. Programme Duration
and Place Conducted by Official’s Name & Designation
Training on “Noise Monitoring Systems”
Dec. 07-16, 2010 Madrid, Spain
SGS Weather & Environment Pvt. Ltd., Spain (M/s GEONICA SA Earth Science)
Sh. A.K. Sinha, Sc. ‘C’, PAMS, HO-Delhi Sh. Vishal Gandhi, Sc. ‘B’, PAMS, HO-Delhi Sh. Ankur Tiwari, Sc. ‘B’, PCI-II, HO-Delhi Sh. Rajinder Singh, STS, Air Lab, HO-Delhi
Consultation on “Black Carbon: Co benefits and Soft Approaches” under Male Declaration
Mar. 21-22, 2011 Kathmandu, Nepal
UNEP, RRC. AP, Bangkok
Dr. Sanjeev Kumar Paliwal, Sc. ‘C’, HO-Delhi
Training Workshop on “Health Impact Assessment” under Male Declaration
Mar. 23-25, 2011 Kathmandu, Nepal
UNEP, RRC. AP, Bangkok
Dr. Sanjeev Agrawal, Sc. ‘C’, HO-Delhi
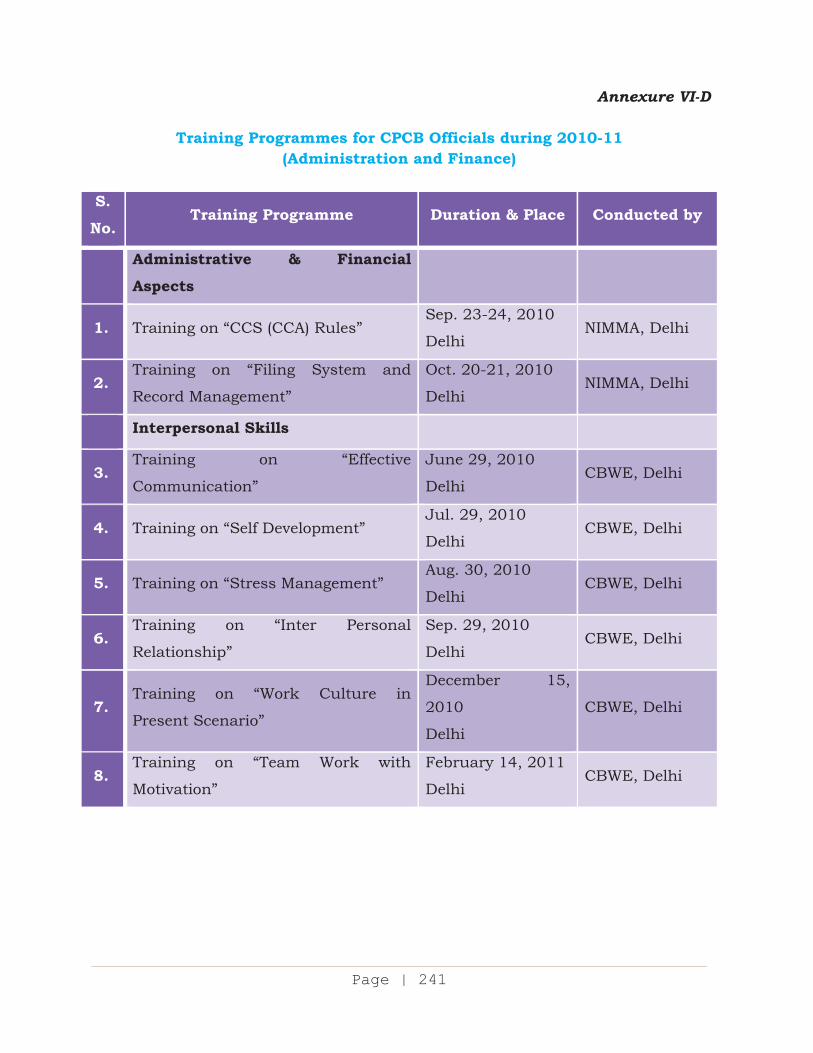
Page 145A cxxv
Page | 241
Annexure VI-D
Training Programmes for CPCB Officials during 2010-11 (Administration and Finance)
S.
No. Training Programme Duration & Place Conducted by
Administrative & Financial
Aspects
1. Training on “CCS (CCA) Rules” Sep. 23-24, 2010
Delhi NIMMA, Delhi
2. Training on “Filing System and
Record Management”
Oct. 20-21, 2010
Delhi NIMMA, Delhi
Interpersonal Skills
3. Training on “Effective
Communication”
June 29, 2010
Delhi CBWE, Delhi
4. Training on “Self Development” Jul. 29, 2010
Delhi CBWE, Delhi
5. Training on “Stress Management” Aug. 30, 2010
Delhi CBWE, Delhi
6. Training on “Inter Personal
Relationship”
Sep. 29, 2010
Delhi CBWE, Delhi
7. Training on “Work Culture in
Present Scenario”
December 15,
2010
Delhi
CBWE, Delhi
8. Training on “Team Work with
Motivation”
February 14, 2011
Delhi CBWE, Delhi
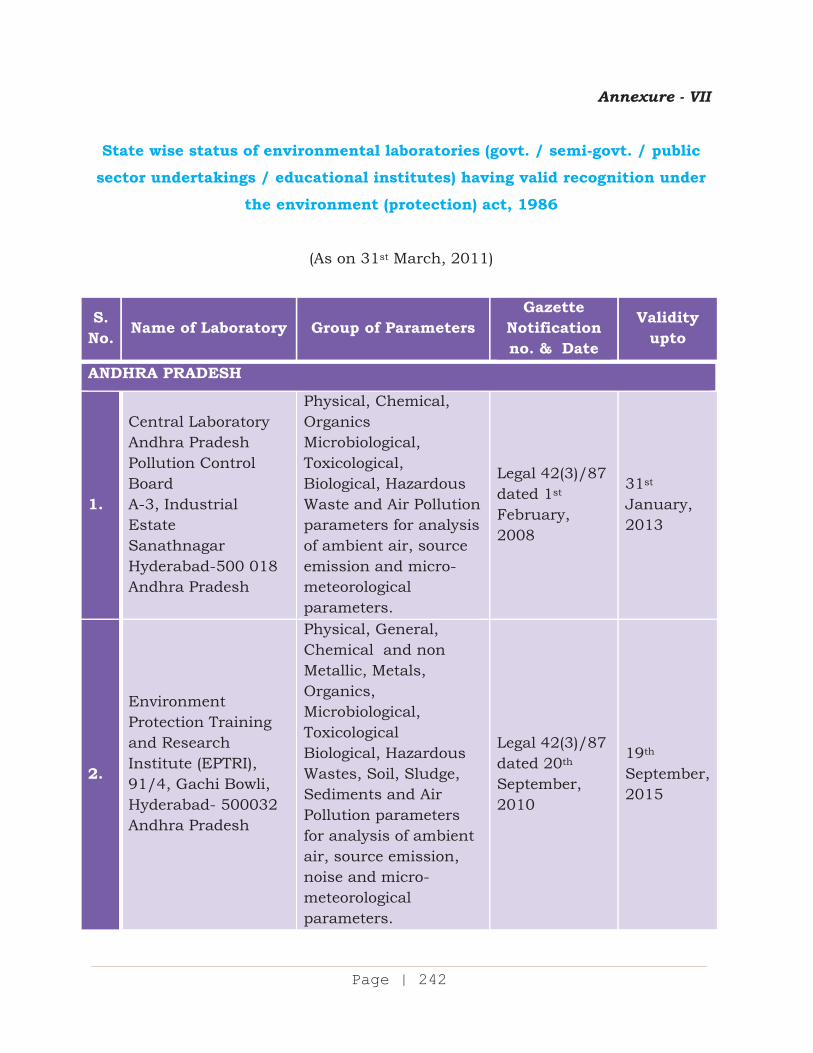
Page 145A cxxvi
Page | 242
Annexure - VII
State wise status of environmental laboratories (govt. / semi-govt. / public sector undertakings / educational institutes) having valid recognition under
the environment (protection) act, 1986
(As on 31st March, 2011)
S. No. Name of Laboratory Group of Parameters
Gazette Notification no. & Date
Validity upto
ANDHRA PRADESH
1.
Central Laboratory Andhra Pradesh Pollution Control Board A-3, Industrial Estate Sanathnagar Hyderabad-500 018 Andhra Pradesh
Physical, Chemical, Organics Microbiological, Toxicological, Biological, Hazardous Waste and Air Pollution parameters for analysis of ambient air, source emission and micro-meteorological parameters.
Legal 42(3)/87 dated 1st February, 2008
31st January, 2013
2.
Environment Protection Training and Research Institute (EPTRI), 91/4, Gachi Bowli, Hyderabad- 500032 Andhra Pradesh
Physical, General, Chemical and non Metallic, Metals, Organics, Microbiological, Toxicological Biological, Hazardous Wastes, Soil, Sludge, Sediments and Air Pollution parameters for analysis of ambient air, source emission, noise and micro-meteorological parameters.
Legal 42(3)/87 dated 20th September, 2010
19th September, 2015
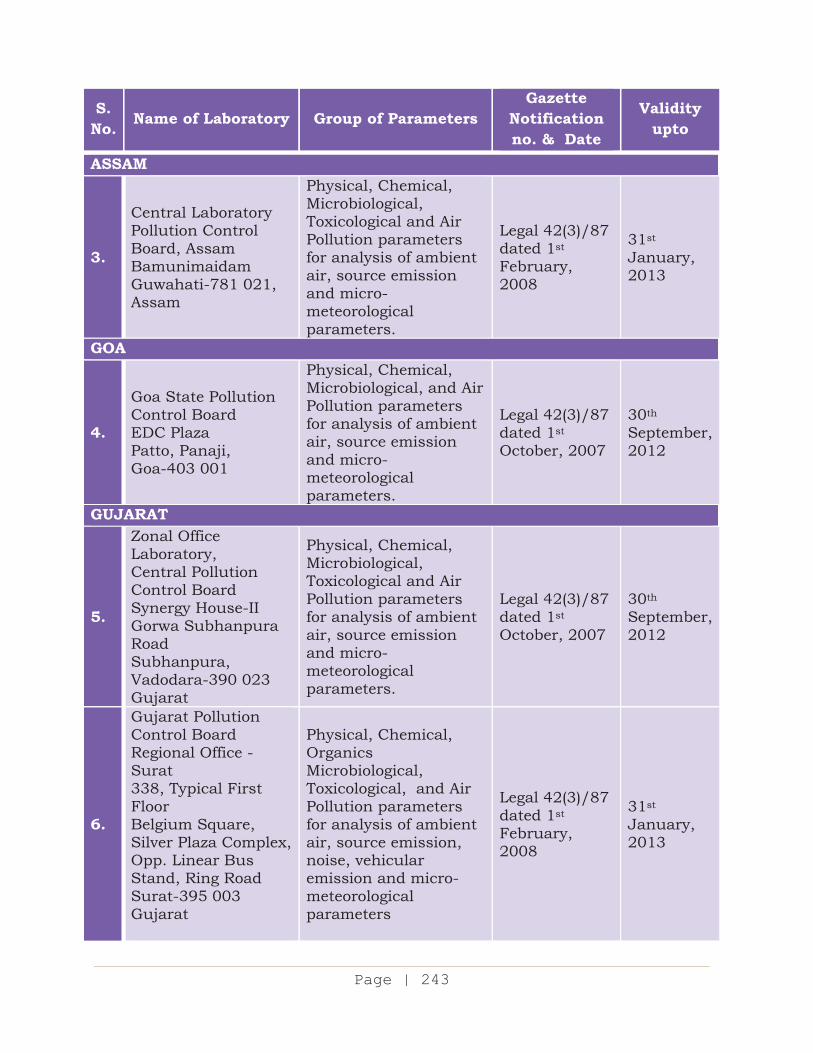
Page 145A cxxvii
Page | 243
S. No. Name of Laboratory Group of Parameters
Gazette Notification no. & Date
Validity upto
ASSAM
3.
Central Laboratory Pollution Control Board, Assam Bamunimaidam Guwahati-781 021, Assam
Physical, Chemical, Microbiological, Toxicological and Air Pollution parameters for analysis of ambient air, source emission and micro-meteorological parameters.
Legal 42(3)/87 dated 1st February, 2008
31st January, 2013
GOA
4.
Goa State Pollution Control Board EDC Plaza Patto, Panaji, Goa-403 001
Physical, Chemical, Microbiological, and Air Pollution parameters for analysis of ambient air, source emission and micro-meteorological parameters.
Legal 42(3)/87 dated 1st October, 2007
30th September, 2012
GUJARAT
5.
Zonal Office Laboratory, Central Pollution Control Board Synergy House-II Gorwa Subhanpura Road Subhanpura, Vadodara-390 023 Gujarat
Physical, Chemical, Microbiological, Toxicological and Air Pollution parameters for analysis of ambient air, source emission and micro-meteorological parameters.
Legal 42(3)/87 dated 1st October, 2007
30th September, 2012
6.
Gujarat Pollution Control Board Regional Office - Surat 338, Typical First Floor Belgium Square, Silver Plaza Complex, Opp. Linear Bus Stand, Ring Road Surat-395 003 Gujarat
Physical, Chemical, Organics Microbiological, Toxicological, and Air Pollution parameters for analysis of ambient air, source emission, noise, vehicular emission and micro-meteorological parameters
Legal 42(3)/87 dated 1st February, 2008
31st January, 2013
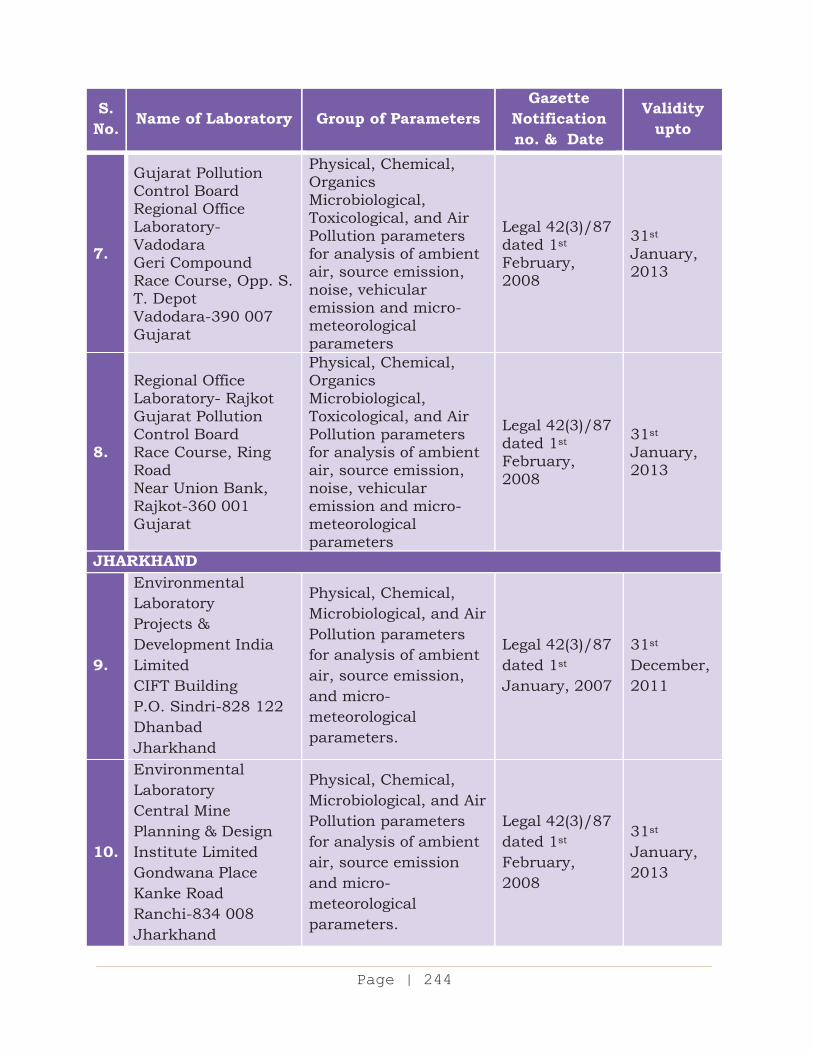
Page 145A cxxviii
Page | 244
S. No. Name of Laboratory Group of Parameters
Gazette Notification no. & Date
Validity upto
7.
Gujarat Pollution Control Board Regional Office Laboratory- Vadodara Geri Compound Race Course, Opp. S. T. Depot Vadodara-390 007 Gujarat
Physical, Chemical, Organics Microbiological, Toxicological, and Air Pollution parameters for analysis of ambient air, source emission, noise, vehicular emission and micro-meteorological parameters
Legal 42(3)/87 dated 1st February, 2008
31st January, 2013
8.
Regional Office Laboratory- Rajkot Gujarat Pollution Control Board Race Course, Ring Road Near Union Bank, Rajkot-360 001 Gujarat
Physical, Chemical, Organics Microbiological, Toxicological, and Air Pollution parameters for analysis of ambient air, source emission, noise, vehicular emission and micro-meteorological parameters
Legal 42(3)/87 dated 1st February, 2008
31st January, 2013
JHARKHAND
9.
Environmental Laboratory Projects & Development India Limited CIFT Building P.O. Sindri-828 122 Dhanbad Jharkhand
Physical, Chemical, Microbiological, and Air Pollution parameters for analysis of ambient air, source emission, and micro-meteorological parameters.
Legal 42(3)/87 dated 1st January, 2007
31st December, 2011
10.
Environmental Laboratory Central Mine Planning & Design Institute Limited Gondwana Place Kanke Road Ranchi-834 008 Jharkhand
Physical, Chemical, Microbiological, and Air Pollution parameters for analysis of ambient air, source emission and micro-meteorological parameters.
Legal 42(3)/87 dated 1st February, 2008
31st January, 2013
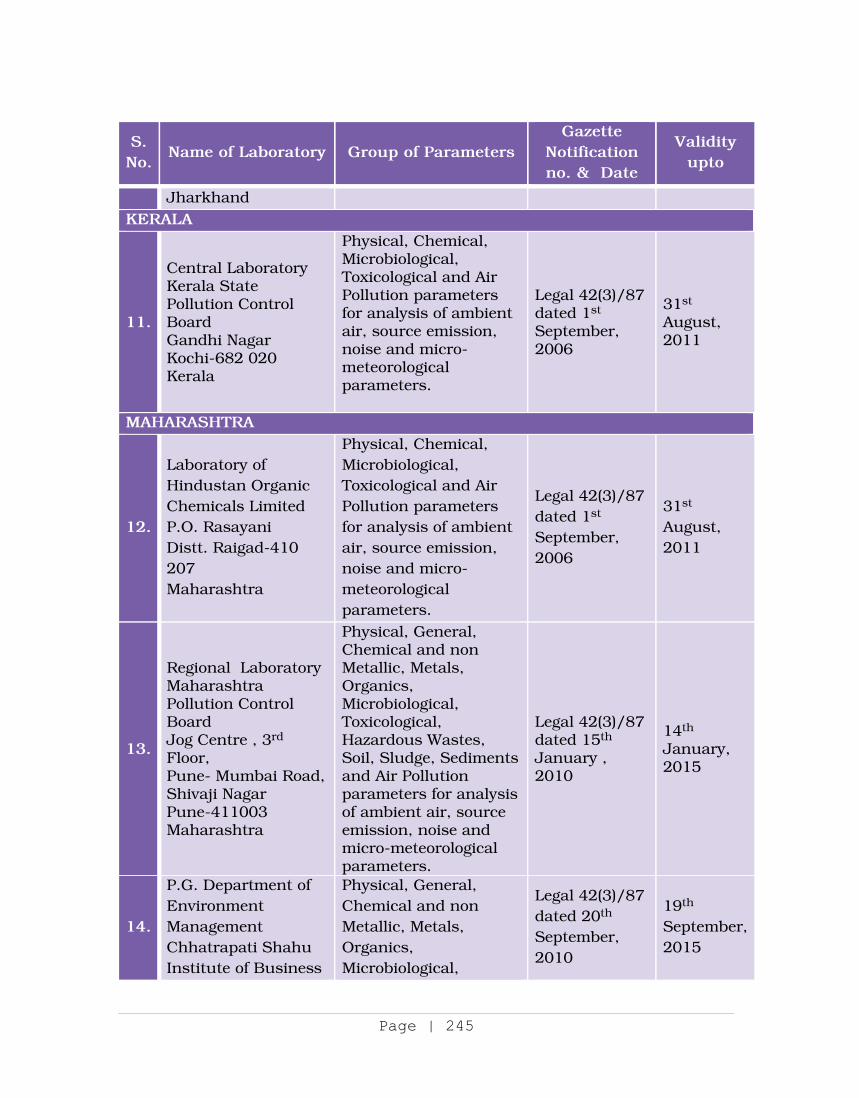
Page 147A 250
Page | 245
S. No. Name of Laboratory Group of Parameters
Gazette Notification no. & Date
Validity upto
KERALA
11.
Central Laboratory Kerala State Pollution Control Board Gandhi Nagar Kochi-682 020 Kerala
Physical, Chemical, Microbiological, Toxicological and Air Pollution parameters for analysis of ambient air, source emission, noise and micro-meteorological parameters.
Legal 42(3)/87 dated 1st September, 2006
31st August, 2011
MAHARASHTRA
12.
Laboratory of Hindustan Organic Chemicals Limited P.O. Rasayani Distt. Raigad-410 207 Maharashtra
Physical, Chemical, Microbiological, Toxicological and Air Pollution parameters for analysis of ambient air, source emission, noise and micro-meteorological parameters.
Legal 42(3)/87 dated 1st September, 2006
31st August, 2011
13.
Regional Laboratory Maharashtra Pollution Control Board Jog Centre , 3rd Floor, Pune- Mumbai Road, Shivaji Nagar Pune-411003 Maharashtra
Physical, General, Chemical and non Metallic, Metals, Organics, Microbiological, Toxicological, Hazardous Wastes, Soil, Sludge, Sediments and Air Pollution parameters for analysis of ambient air, source emission, noise and micro-meteorological parameters.
Legal 42(3)/87 dated 15th January , 2010
14th January, 2015
14.
P.G. Department of Environment Management Chhatrapati Shahu Institute of Business Education and
Physical, General, Chemical and non Metallic, Metals, Organics, Microbiological, Toxicological,
Legal 42(3)/87 dated 20th September, 2010
19th September, 2015
Page | 255
S. No.
Name of Laboratory Group of Parameters Gazette
Notification no. & Date
Validity upto
Jharkhand KERALA
11.
Central Laboratory Kerala State Pollution Control Board Gandhi Nagar Kochi-682 020 Kerala
Physical, Chemical, Microbiological, Toxicological and Air Pollution parameters for analysis of ambient air, source emission, noise and micro-meteorological parameters.
Legal 42(3)/87 dated 1st September, 2006
31st August, 2011
MAHARASHTRA
12.
Laboratory of Hindustan Organic Chemicals Limited P.O. Rasayani Distt. Raigad-410 207 Maharashtra
Physical, Chemical, Microbiological, Toxicological and Air Pollution parameters for analysis of ambient air, source emission, noise and micro-meteorological parameters.
Legal 42(3)/87 dated 1st September, 2006
31st August, 2011
13.
Regional Laboratory Maharashtra Pollution Control Board Jog Centre , 3rd Floor, Pune- Mumbai Road, Shivaji Nagar Pune-411003 Maharashtra
Physical, General, Chemical and non Metallic, Metals, Organics, Microbiological, Toxicological, Hazardous Wastes, Soil, Sludge, Sediments and Air Pollution parameters for analysis of ambient air, source emission, noise and micro-meteorological parameters.
Legal 42(3)/87 dated 15th January , 2010
14th January, 2015
14.
P.G. Department of Environment Management Chhatrapati Shahu Institute of Business
Physical, General, Chemical and non Metallic, Metals, Organics, Microbiological,
Legal 42(3)/87 dated 20th September, 2010
19th September, 2015
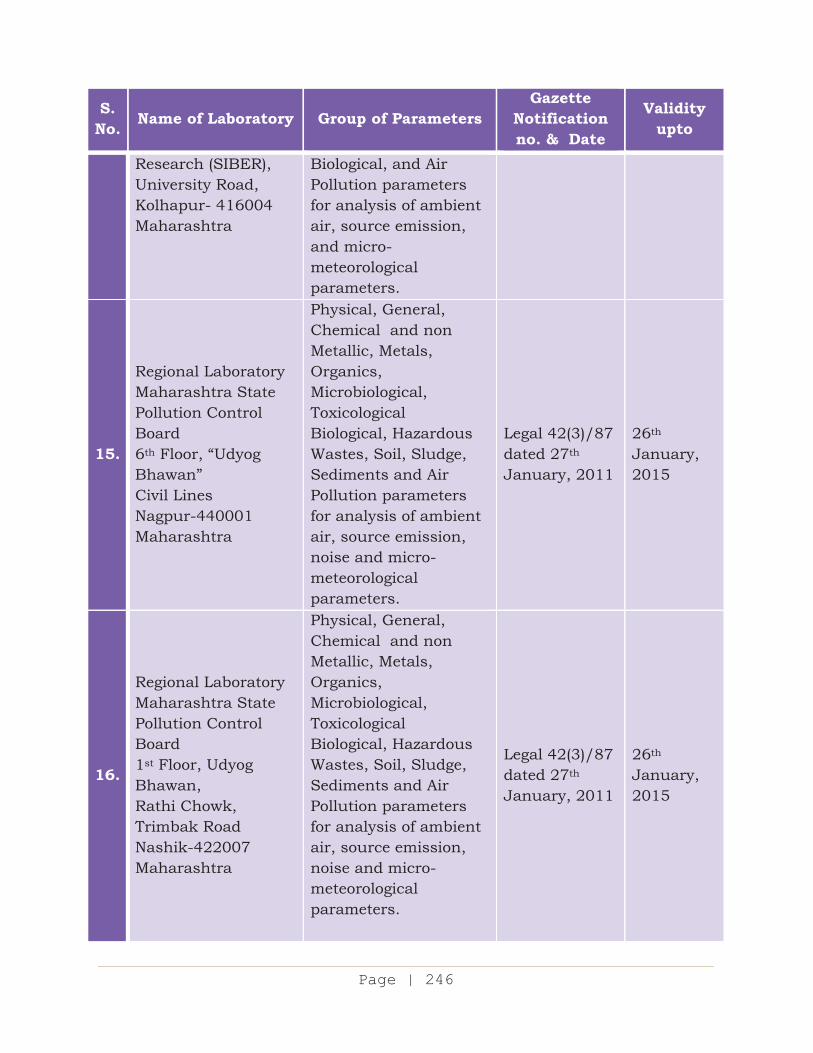
Page 145A cxxx
Page | 246
S. No. Name of Laboratory Group of Parameters
Gazette Notification no. & Date
Validity upto
Research (SIBER), University Road, Kolhapur- 416004 Maharashtra
Biological, and Air Pollution parameters for analysis of ambient air, source emission, and micro-meteorological parameters.
15.
Regional Laboratory Maharashtra State Pollution Control Board 6th Floor, “Udyog Bhawan” Civil Lines Nagpur-440001 Maharashtra
Physical, General, Chemical and non Metallic, Metals, Organics, Microbiological, Toxicological Biological, Hazardous Wastes, Soil, Sludge, Sediments and Air Pollution parameters for analysis of ambient air, source emission, noise and micro-meteorological parameters.
Legal 42(3)/87 dated 27th January, 2011
26th January, 2015
16.
Regional Laboratory Maharashtra State Pollution Control Board 1st Floor, Udyog Bhawan, Rathi Chowk, Trimbak Road Nashik-422007 Maharashtra
Physical, General, Chemical and non Metallic, Metals, Organics, Microbiological, Toxicological Biological, Hazardous Wastes, Soil, Sludge, Sediments and Air Pollution parameters for analysis of ambient air, source emission, noise and micro-meteorological parameters.
Legal 42(3)/87 dated 27th January, 2011
26th January, 2015
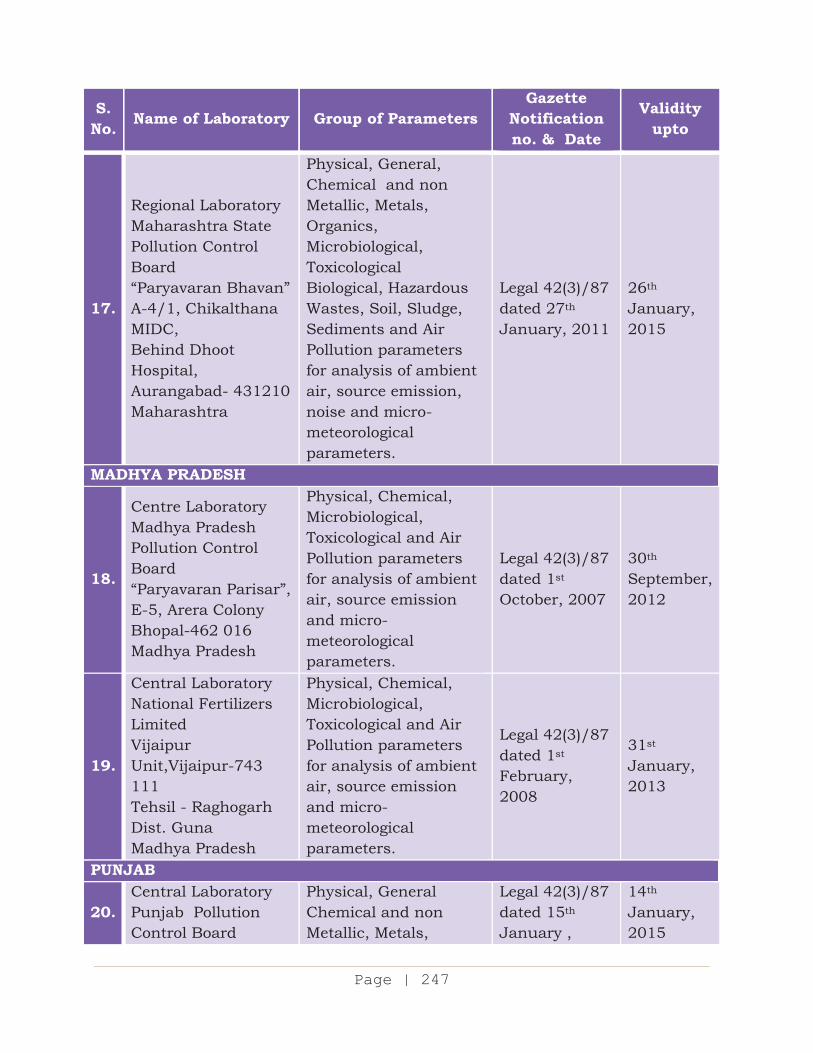
Page 145A cxxxi
Page | 247
S. No. Name of Laboratory Group of Parameters
Gazette Notification no. & Date
Validity upto
17.
Regional Laboratory Maharashtra State Pollution Control Board “Paryavaran Bhavan” A-4/1, Chikalthana MIDC, Behind Dhoot Hospital, Aurangabad- 431210 Maharashtra
Physical, General, Chemical and non Metallic, Metals, Organics, Microbiological, Toxicological Biological, Hazardous Wastes, Soil, Sludge, Sediments and Air Pollution parameters for analysis of ambient air, source emission, noise and micro-meteorological parameters.
Legal 42(3)/87 dated 27th January, 2011
26th January, 2015
MADHYA PRADESH
18.
Centre Laboratory Madhya Pradesh Pollution Control Board “Paryavaran Parisar”, E-5, Arera Colony Bhopal-462 016 Madhya Pradesh
Physical, Chemical, Microbiological, Toxicological and Air Pollution parameters for analysis of ambient air, source emission and micro-meteorological parameters.
Legal 42(3)/87 dated 1st October, 2007
30th September, 2012
19.
Central Laboratory National Fertilizers Limited Vijaipur Unit,Vijaipur-743 111 Tehsil - Raghogarh Dist. Guna Madhya Pradesh
Physical, Chemical, Microbiological, Toxicological and Air Pollution parameters for analysis of ambient air, source emission and micro-meteorological parameters.
Legal 42(3)/87 dated 1st February, 2008
31st January, 2013
PUNJAB
20. Central Laboratory Punjab Pollution Control Board
Physical, General Chemical and non Metallic, Metals,
Legal 42(3)/87 dated 15th January ,
14th January, 2015
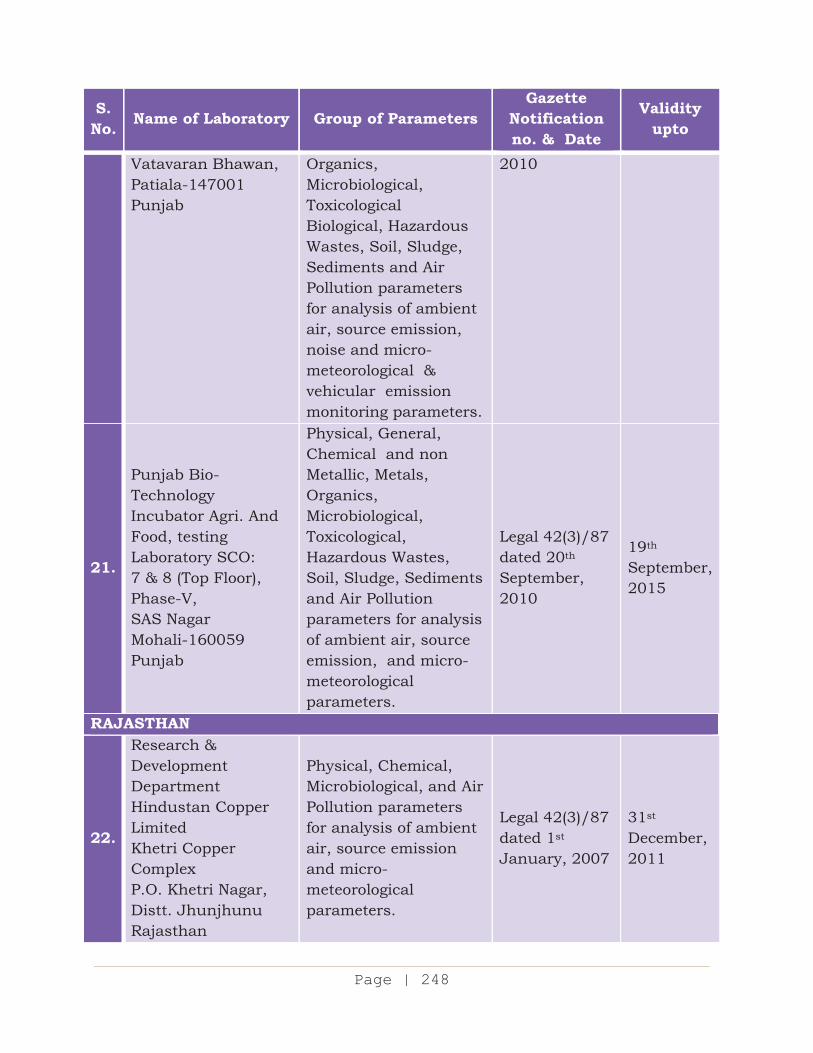
Page 145A cxxxii
Page | 248
S. No. Name of Laboratory Group of Parameters
Gazette Notification no. & Date
Validity upto
Vatavaran Bhawan, Patiala-147001 Punjab
Organics, Microbiological, Toxicological Biological, Hazardous Wastes, Soil, Sludge, Sediments and Air Pollution parameters for analysis of ambient air, source emission, noise and micro-meteorological & vehicular emission monitoring parameters.
2010
21.
Punjab Bio- Technology Incubator Agri. And Food, testing Laboratory SCO: 7 & 8 (Top Floor), Phase-V, SAS Nagar Mohali-160059 Punjab
Physical, General, Chemical and non Metallic, Metals, Organics, Microbiological, Toxicological, Hazardous Wastes, Soil, Sludge, Sediments and Air Pollution parameters for analysis of ambient air, source emission, and micro-meteorological parameters.
Legal 42(3)/87 dated 20th September, 2010
19th September, 2015
RAJASTHAN
22.
Research & Development Department Hindustan Copper Limited Khetri Copper Complex P.O. Khetri Nagar, Distt. Jhunjhunu Rajasthan
Physical, Chemical, Microbiological, and Air Pollution parameters for analysis of ambient air, source emission and micro-meteorological parameters.
Legal 42(3)/87 dated 1st January, 2007
31st December, 2011
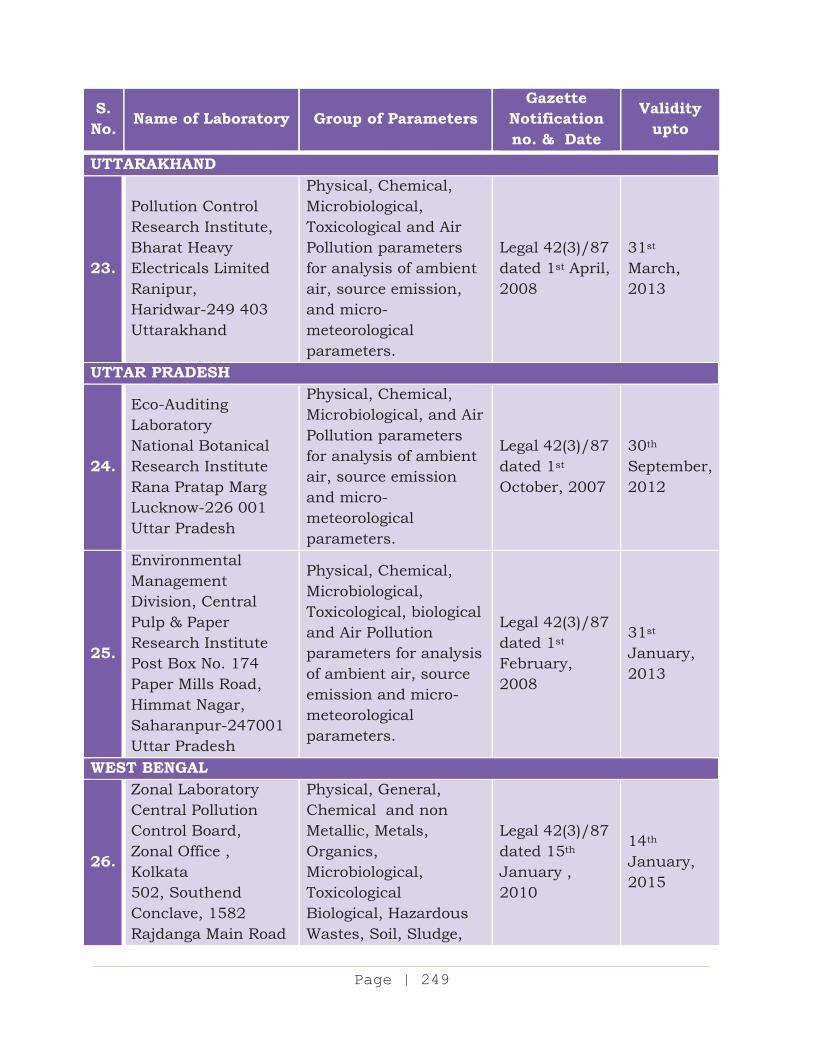
Page 145A cxxxiii
Page | 249
S. No. Name of Laboratory Group of Parameters
Gazette Notification no. & Date
Validity upto
UTTARAKHAND
23.
Pollution Control Research Institute, Bharat Heavy Electricals Limited Ranipur, Haridwar-249 403 Uttarakhand
Physical, Chemical, Microbiological, Toxicological and Air Pollution parameters for analysis of ambient air, source emission, and micro-meteorological parameters.
Legal 42(3)/87 dated 1st April, 2008
31st March, 2013
UTTAR PRADESH
24.
Eco-Auditing Laboratory National Botanical Research Institute Rana Pratap Marg Lucknow-226 001 Uttar Pradesh
Physical, Chemical, Microbiological, and Air Pollution parameters for analysis of ambient air, source emission and micro-meteorological parameters.
Legal 42(3)/87 dated 1st October, 2007
30th September, 2012
25.
Environmental Management Division, Central Pulp & Paper Research Institute Post Box No. 174 Paper Mills Road, Himmat Nagar, Saharanpur-247001 Uttar Pradesh
Physical, Chemical, Microbiological, Toxicological, biological and Air Pollution parameters for analysis of ambient air, source emission and micro-meteorological parameters.
Legal 42(3)/87 dated 1st February, 2008
31st January, 2013
WEST BENGAL
26.
Zonal Laboratory Central Pollution Control Board, Zonal Office , Kolkata 502, Southend Conclave, 1582 Rajdanga Main Road
Physical, General, Chemical and non Metallic, Metals, Organics, Microbiological, Toxicological Biological, Hazardous Wastes, Soil, Sludge,
Legal 42(3)/87 dated 15th January , 2010
14th January, 2015
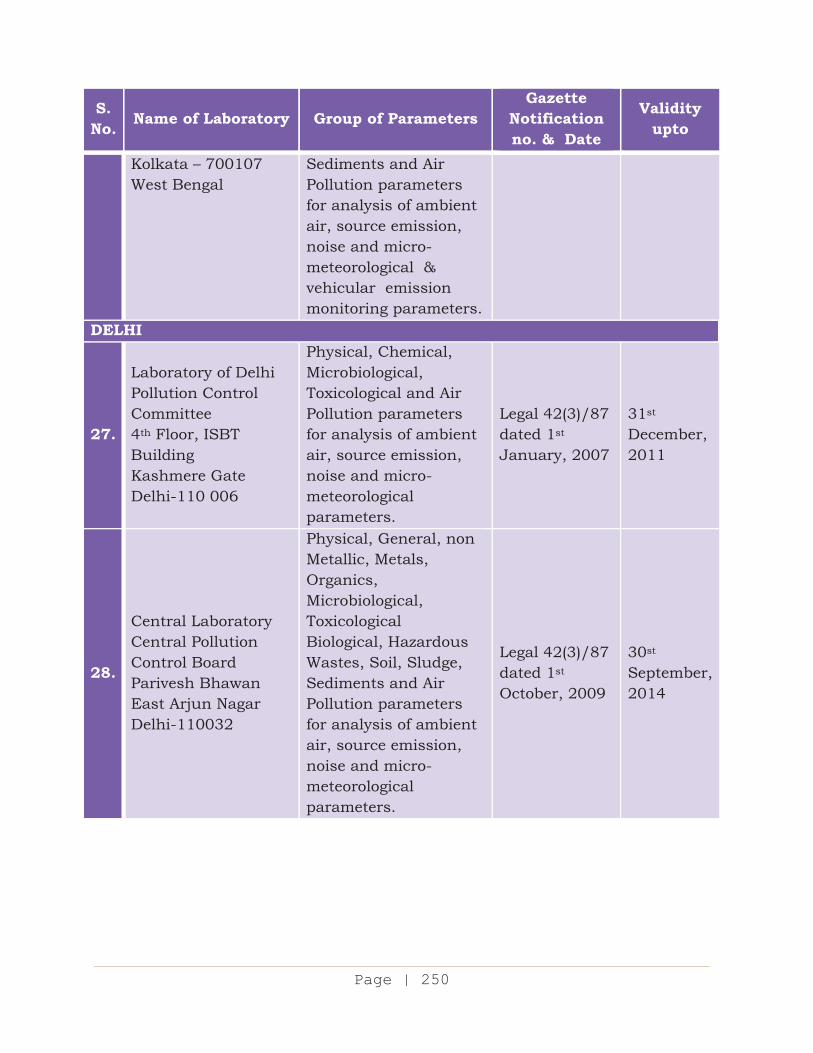
Page 145A cxxxiv
Page | 250
S. No. Name of Laboratory Group of Parameters
Gazette Notification no. & Date
Validity upto
Kolkata – 700107 West Bengal
Sediments and Air Pollution parameters for analysis of ambient air, source emission, noise and micro-meteorological & vehicular emission monitoring parameters.
DELHI
27.
Laboratory of Delhi Pollution Control Committee 4th Floor, ISBT Building Kashmere Gate Delhi-110 006
Physical, Chemical, Microbiological, Toxicological and Air Pollution parameters for analysis of ambient air, source emission, noise and micro-meteorological parameters.
Legal 42(3)/87 dated 1st January, 2007
31st December, 2011
28.
Central Laboratory Central Pollution Control Board Parivesh Bhawan East Arjun Nagar Delhi-110032
Physical, General, non Metallic, Metals, Organics, Microbiological, Toxicological Biological, Hazardous Wastes, Soil, Sludge, Sediments and Air Pollution parameters for analysis of ambient air, source emission, noise and micro-meteorological parameters.
Legal 42(3)/87 dated 1st October, 2009
30st September, 2014
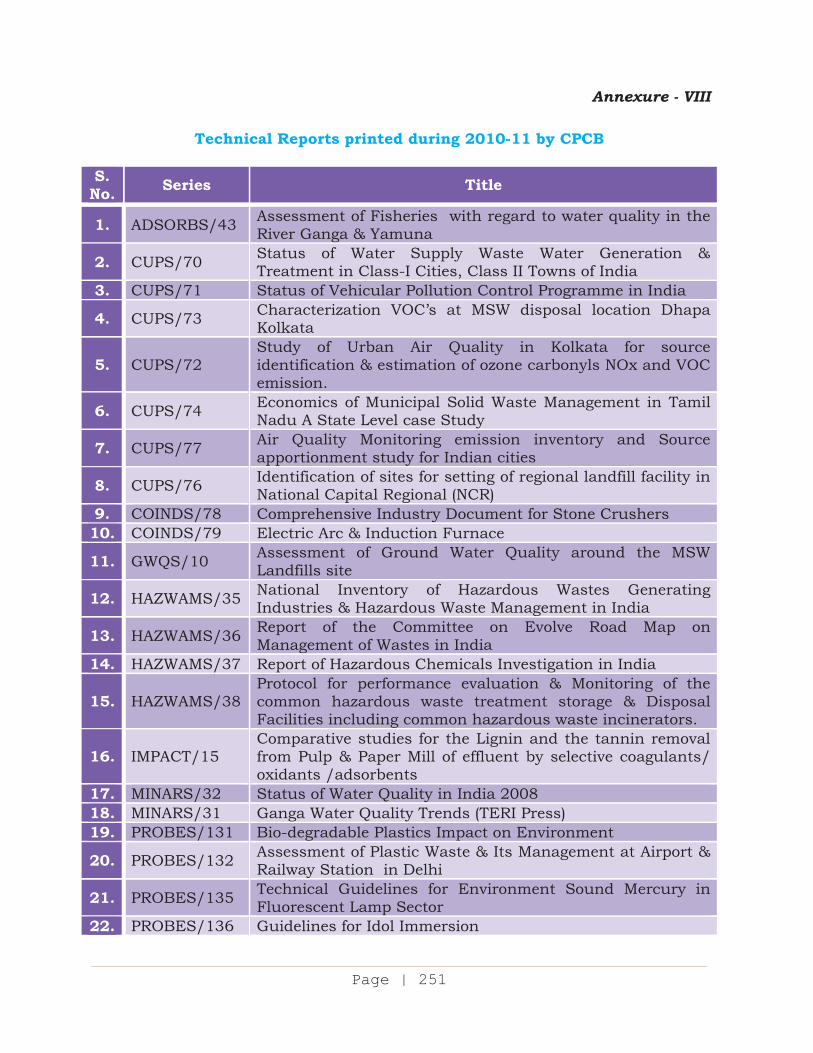
Page 145A cxxxv
Page | 251
Annexure - VIII
Technical Reports printed during 2010-11 by CPCB S.
No. Series Title
1. ADSORBS/43 Assessment of Fisheries with regard to water quality in the River Ganga & Yamuna
2. CUPS/70 Status of Water Supply Waste Water Generation & Treatment in Class-I Cities, Class II Towns of India
3. CUPS/71 Status of Vehicular Pollution Control Programme in India
4. CUPS/73 Characterization VOC’s at MSW disposal location Dhapa Kolkata
5. CUPS/72 Study of Urban Air Quality in Kolkata for source identification & estimation of ozone carbonyls NOx and VOC emission.
6. CUPS/74 Economics of Municipal Solid Waste Management in Tamil Nadu A State Level case Study
7. CUPS/77 Air Quality Monitoring emission inventory and Source apportionment study for Indian cities
8. CUPS/76 Identification of sites for setting of regional landfill facility in National Capital Regional (NCR)
9. COINDS/78 Comprehensive Industry Document for Stone Crushers 10. COINDS/79 Electric Arc & Induction Furnace
11. GWQS/10 Assessment of Ground Water Quality around the MSW Landfills site
12. HAZWAMS/35 National Inventory of Hazardous Wastes Generating Industries & Hazardous Waste Management in India
13. HAZWAMS/36 Report of the Committee on Evolve Road Map on Management of Wastes in India
14. HAZWAMS/37 Report of Hazardous Chemicals Investigation in India
15. HAZWAMS/38 Protocol for performance evaluation & Monitoring of the common hazardous waste treatment storage & Disposal Facilities including common hazardous waste incinerators.
16. IMPACT/15 Comparative studies for the Lignin and the tannin removal from Pulp & Paper Mill of effluent by selective coagulants/ oxidants /adsorbents
17. MINARS/32 Status of Water Quality in India 2008 18. MINARS/31 Ganga Water Quality Trends (TERI Press) 19. PROBES/131 Bio-degradable Plastics Impact on Environment
20. PROBES/132 Assessment of Plastic Waste & Its Management at Airport & Railway Station in Delhi
21. PROBES/135 Technical Guidelines for Environment Sound Mercury in Fluorescent Lamp Sector
22. PROBES/136 Guidelines for Idol Immersion
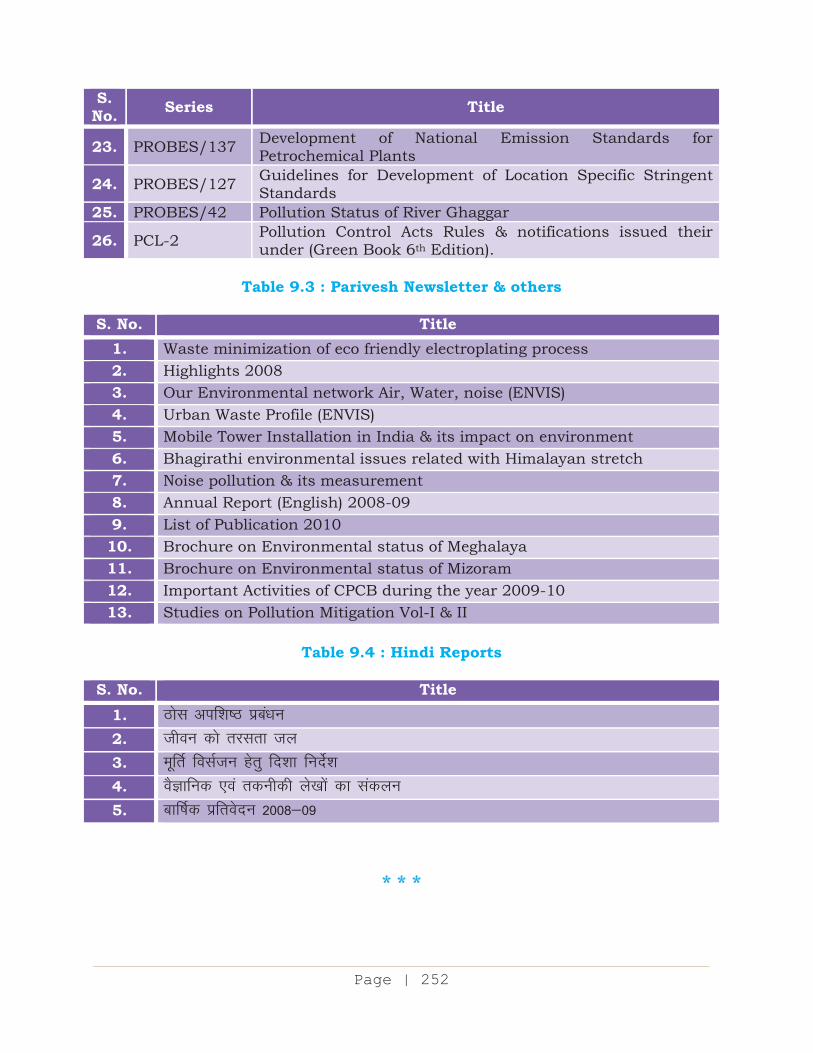
Page 145A cxxxvi
Page | 252
S. No. Series Title
23. PROBES/137 Development of National Emission Standards for Petrochemical Plants
24. PROBES/127 Guidelines for Development of Location Specific Stringent Standards
25. PROBES/42 Pollution Status of River Ghaggar
26. PCL-2 Pollution Control Acts Rules & notifications issued their under (Green Book 6th Edition).
Table 9.3 : Parivesh Newsletter & others
S. No. Title
1. Waste minimization of eco friendly electroplating process 2. Highlights 2008 3. Our Environmental network Air, Water, noise (ENVIS) 4. Urban Waste Profile (ENVIS) 5. Mobile Tower Installation in India & its impact on environment 6. Bhagirathi environmental issues related with Himalayan stretch 7. Noise pollution & its measurement 8. Annual Report (English) 2008-09 9. List of Publication 2010 10. Brochure on Environmental status of Meghalaya 11. Brochure on Environmental status of Mizoram 12. Important Activities of CPCB during the year 2009-10 13. Studies on Pollution Mitigation Vol-I & II
Table 9.4 : Hindi Reports
S. No. Title
1. Bksl vif’k"B izca/ku 2. thou dks rjlrk ty 3. ewfrZ folZtu gsrq fn’kk funZs’k4. oSKkfud ,oa rduhdh ys[kksa dk ladyu5. Ckkf"kZd izfrosnu 2008&09
* * *