Embed Size (px)
Citation preview

Donohue et al. Published in JRNC 1
Nuclear Forensic Applications Involving High Spatial Resolution 1
Analysis of Trinitite Cross-Sections 2
Patrick H. Donohue1*, Antonio Simonetti1, Elizabeth C. Koeman1, Sara Mana1,2, Peter C. 3
Burns1,3 4
1Civil & Environmental Engineering & Earth Sciences, University of Notre Dame, Notre Dame, 5
IN 46556 6
2Department of Earth and Environmental Sciences, University of Iowa, 121 Trowbridge Hall, 7
Iowa City, IA 52242 8
3Department of Chemistry and Biochemistry, University of Notre Dame, Notre Dame, IN 46556 9
Note: This is not the final published version of the paper. As an accepted manuscript, this file has not been copy 10 edited and/or formatted for publication. The final published version is available at 11 http://dx.doi.org/10.1007/s10967-015-4097-2 12
Abstract 13
This study reports a comprehensive cross-sectional analysis of major and trace element 14
abundances and 240Pu/239Pu ratios within vertically oriented Trinitite thin sections. The upper 15
glassy layer (~2 mm thick) represents fused desert sand combined with devolatilized fallout from 16
the debris cloud. The vertical distribution of 240Pu/239Pu ratios indicates that residual fuel was 17
incorporated deeper (up to ~10 mm depth) into Trinitite than previously reported. This requires 18
thorough mixing and disturbance of the upper cm of the blast site prior to or during the initial 19
melting of the desert sand resulting from the nuclear explosion. 20
Keywords 21
Nuclear forensics, Trinitite, laser ablation, post-detonation material 22
Introduction 23

Donohue et al. Published in JRNC 2
Nuclear proliferation and expanding access to nuclear technology has increased the potential of a 24
nuclear incident or unauthorized detonation [1, 2]. Such an event would create post-detonation 25
material (PDM) containing mixed major and trace element and isotopic characteristics from both 26
the nuclear device and impacted environment. Indeed, tens of thousands of tons of PDMs were 27
generated prior to the worldwide ban on nuclear testing [3]. Characterizing nuclear explosion 28
processes and their effects on the surrounding environment is a major objective of nuclear 29
forensics. Developing methods for rapid and accurate source attribution may help to deter such 30
incidents. However, the chemical and isotopic signatures in PDMs are apparently 31
heterogeneously distributed [e.g., 4, 5], which may result in inaccurate interpretations. For 32
example, the heterogeneous distribution of Ba and Cs in PDMs, used in blast yield calculations, 33
can lead to variable and improbable yield estimates [6]. Thus, the nature of PDM sample 34
collection and analysis must be carefully considered in order to develop the most effective 35
strategies for obtaining accurate forensic information. 36
One effective avenue for developing nuclear forensic strategies is investigating historical PDMs, 37
such as Trinitite. The latter was chosen because it is a relatively well-characterized PDM since 38
the bomb design and isotopic composition of the nuclear fuel used in the explosion are known 39
[7-9], and it formed in a geologically simple environment [10]. The arkosic sand in the desert at 40
ground zero (GZ) included quartz, feldspars (K- and Na-rich end-members), carbonates, sulfates, 41
chlorides, zircon, hornblende, olivine, monazite, apatite, magnetite, ilmenite, augite, and illite [4, 42
9, 11-13]. Bellucci et al. [4] determined the major and trace element composition of Trinitite is 43
influenced primarily by incipient melting of the local arkosic sand and incorporation of 44
anthropogenic components (e.g., blast tower, bomb material). 45
The nuclear device (“Gadget”) exploded at Trinity was an implosion-type plutonium bomb, with 46
tamper shells of U and Be [7]. The aerial extent of Trinitite was non-uniform, but extended ~370 47
m radially away from GZ [14]. The intense heat (>1000 K at GZ, >8000 K in the fireball [3]) 48
from the blast was short lived, as the ambient ground temperature was rapidly cooled by air 49
driven inward by updrafts. However, there is evidence for melt flow and settling during this brief 50
time [9, 15]. Glass thickens at the base of slopes facing GZ [10], and thin section element maps 51
show regions of Si-, Ca-, and K-rich melt [4]. In addition, vesicle morphology indicates Trinitite 52

Donohue et al. Published in JRNC 3
remained in a molten or semi-molten state long enough for vesicles to partially coalesce and 53
deform. 54
The uppermost region of the desert sand was irradiated during the blast, and fallback particles 55
subsequently increased the surface concentration of radioactivity, as demonstrated by alpha track 56
radiography and beta spectroscopy [e.g., 16]. The activities of γ-emitting particles (e.g., 241Am, 57 152Eu) are similar for both the glassy and sandy sides of Trinitite [17]. High-activity regions are 58
typically the focus of forensic investigations, as they are considered most likely to reveal bomb-59
like signatures [16, 17]. The 240Pu/239Pu ratio of Gadget is calculated to be 0.0129 ± 0.003 [8]. 60
Previous in-situ studies of Trinitite report 240Pu/239Pu ratios between 0.012 and 0.026 [4, 16, 18], 61
signatures consistent with super-grade Pu fuel used by Gadget (< 3% 240Pu by weight) [8]. Sharp 62
et al. [18] performed an analytical transect through a vertical thin section of Trinitite and found 63
weapons grade Pu signatures at ~1.5 mm depth. 64
Previous investigations of Trinitite have focused on: 1– documenting the nature of bomb-related 65
inclusions found on blast melt surfaces [19]; 2– determining the abundances of radionuclides 66
(fission and activation products and isotopic composition of Pu) [16]; 3– characterizing the U 67
[20] and Pb [21] isotope systematics; and 4– reporting the oxygen isotope compositions [13]. 68
These previous studies have used bulk sample analysis [e.g., 13, 22], or have involved detailed 69
investigations conducted at high spatial resolution (10s to 100s micron scale; e.g., [4, 20, 21]). 70
However, in the case of the latter, the location of spot analyses within Trinitite petrographic thin 71
sections were dictated primarily by identifying areas of high alpha particle emissions (regions 72
rich in U and/or Pu) within Trinitite as revealed by alpha radiography (e.g., [16]; Fig. 1). Thus, 73
detailed, high spatial resolution investigations of individual Trinitite samples, such as conducting 74
systematic (vertical) traverses across samples, were not carried out. 75
Donohue et al. Published in JRNC 4
76
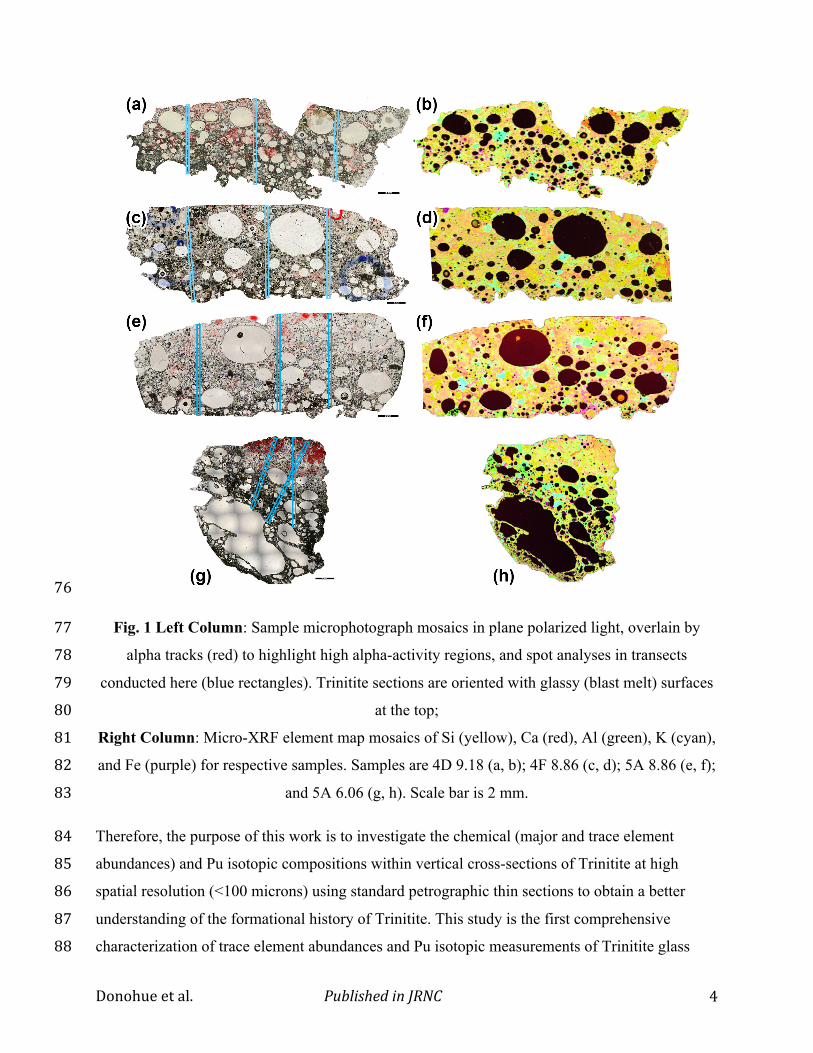
Fig. 1 Left Column: Sample microphotograph mosaics in plane polarized light, overlain by 77
alpha tracks (red) to highlight high alpha-activity regions, and spot analyses in transects 78
conducted here (blue rectangles). Trinitite sections are oriented with glassy (blast melt) surfaces 79
at the top; 80
Right Column: Micro-XRF element map mosaics of Si (yellow), Ca (red), Al (green), K (cyan), 81
and Fe (purple) for respective samples. Samples are 4D 9.18 (a, b); 4F 8.86 (c, d); 5A 8.86 (e, f); 82
and 5A 6.06 (g, h). Scale bar is 2 mm. 83
Therefore, the purpose of this work is to investigate the chemical (major and trace element 84
abundances) and Pu isotopic compositions within vertical cross-sections of Trinitite at high 85
spatial resolution (<100 microns) using standard petrographic thin sections to obtain a better 86
understanding of the formational history of Trinitite. This study is the first comprehensive 87
characterization of trace element abundances and Pu isotopic measurements of Trinitite glass 88

Donohue et al. Published in JRNC 5
with depth. It is hypothesized that the near-surface (upper few millimeters) geochemistry in 89
Trinitite will reflect a greater contribution from the nuclear device and infrastructure components 90
present at GZ (e.g., Fe, Pu, U). Many of the physical dynamics of the blast (i.e., the interaction 91
between device-related forces and the surrounding geology) are recorded in Trinitite. The 92
resulting vertical distributions of radionuclides are likely related to post-detonation formation 93
and transport mechanisms of nuclear and natural materials subsequent bomb detonation. 94
Samples 95
Three vertical-cut thin sections (4D 9.18, 4F 8.86, and 5A 8.86) and one oblique-cut section 96
(relative to the horizontal surface; 5A 6.06) were selected from our sample collection using 97
multiple criteria to verify orientation. For example, vertical-cut thin sections transition from an 98
upper glassy layer to a coarser-grained base (Fig. 1). The oblique-cut section from sample 5A 99
6.06 also exhibits this transition (Fig. 1g, h). The sample naming convention for Trinitite [c.f., 100
20] groups samples by morphology or notable characteristics, followed by the original sample 101
weight. This classification scheme allows a first order separation of sample types based on 102
sample shape or the presence of surface inclusions. The sample types in this study include the 103
following groups: 4D, unusual blue inclusions; 4F, glassy blue-green inclusions, thought to 104
originate from quartz; and two 5A types, which have a dark surface and lighter-colored glass 105
base. Samples were classified by and purchased from a commercial provider (Mineralogical 106
Resource Co.; http://www.minresco.com). 107
Trinitite was removed from GZ and buried in 1952 to reduce environmental risk [8], thus few 108
samples exist that were collected in-situ. Variations in 152Eu activity, which is highest at GZ, 109
have been used to calculate original distances from the blast [8, 22]. For the samples investigated 110
here, the calculated distances range from 51 ± 2 m (samples 5A 6.06, 5A 8.86) to 68 ± 7 m 111
(sample 4D 9.18) [22]. The 152Eu activity of sample 4F 8.86 was too low to yield a reliable 112
distance calculation [22]. 113
Additional characteristics such as alpha track concentration and major element maps (Fig. 1) 114
were used for planning vertical transects. A typical vertical section of Trinitite has an alpha track 115
density highest at the upper surface, with little to none in the substrate. Vertical transect spot 116
analyses were conducted along relatively continuous and tightly constrained paths with minimal 117
Donohue et al. Published in JRNC 6
vesicles (Fig. 1). Regions (≳75 µm) of continuous glass that are free of vesicles and unmelted 118
(precursor) mineral grains were selected for laser ablation analysis in order to minimize the 119
contribution of the latter and hence not bias the determined trace element abundances. 120
Methodology 121
Imaging 122
Thin sections were imaged at 5× magnification and images were composited in Adobe© 123
Photoshop©. The resulting photomosaics have resolutions of ~33 pixels per 0.05 mm. Spatially 124
resolved alpha track radiography [c.f., 17] was conducted using methods described in Wallace et 125
al. [16]. Alpha tracks were imaged and mosaicked using the same process as for sample 126
microphotographs, and subsequently overlain onto the sample to identify high alpha activity 127
regions. 128
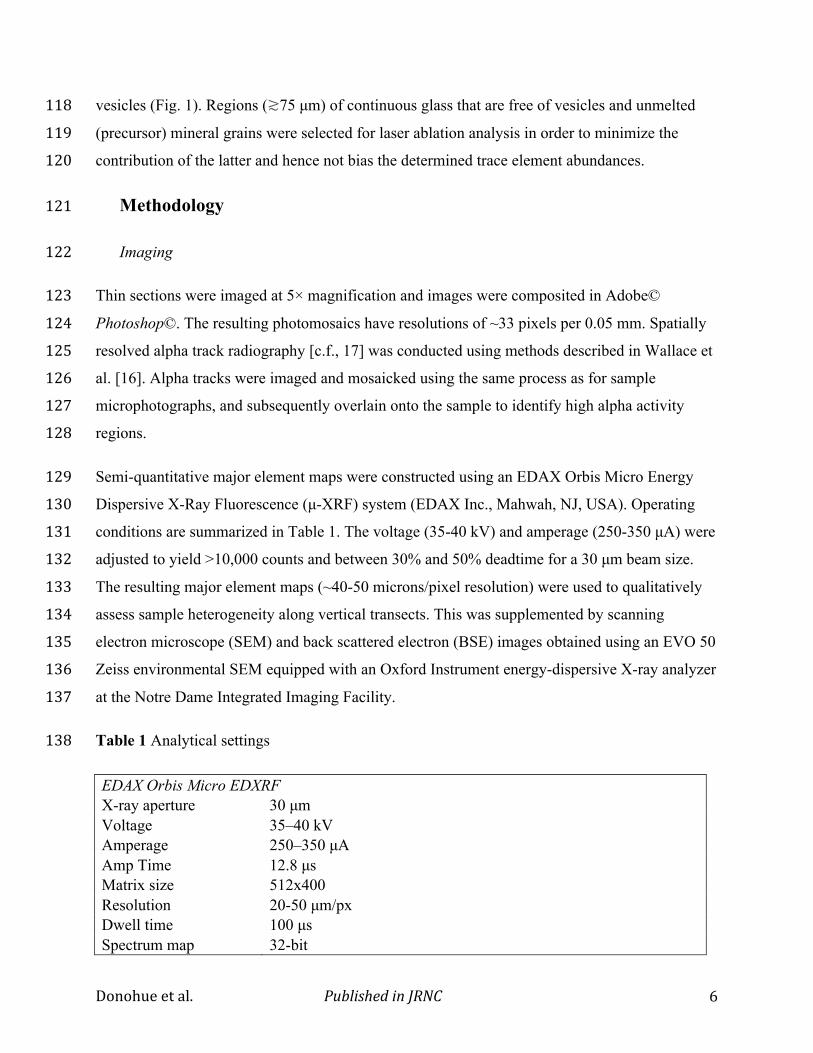
Semi-quantitative major element maps were constructed using an EDAX Orbis Micro Energy 129
Dispersive X-Ray Fluorescence (µ-XRF) system (EDAX Inc., Mahwah, NJ, USA). Operating 130
conditions are summarized in Table 1. The voltage (35-40 kV) and amperage (250-350 µA) were 131
adjusted to yield >10,000 counts and between 30% and 50% deadtime for a 30 µm beam size. 132
The resulting major element maps (~40-50 microns/pixel resolution) were used to qualitatively 133
assess sample heterogeneity along vertical transects. This was supplemented by scanning 134
electron microscope (SEM) and back scattered electron (BSE) images obtained using an EVO 50 135
Zeiss environmental SEM equipped with an Oxford Instrument energy-dispersive X-ray analyzer 136
at the Notre Dame Integrated Imaging Facility. 137
Table 1 Analytical settings 138
EDAX Orbis Micro EDXRF X-ray aperture 30 µm Voltage 35–40 kV Amperage 250–350 µA Amp Time 12.8 µs Matrix size 512x400 Resolution 20-50 µm/px Dwell time 100 µs Spectrum map 32-bit

Donohue et al. Published in JRNC 7
Acquisition time 6.5 h NewWave UP213 LA-ICP-MS and ThermoFinnigan Element 2 ICP-MS Laser Type Nd:YAG Brand New Wave Research Wavelength 213 nm Pulse duration 5 ns Spot size 40 µm Repetition rate 5 Hz Fluence 10-12 J cm-2 Resolution mode Low Scan mode E-scan
Scanned masses
43Ca, 47Ti, 53Cr, 55Mn, 56Fe, 59Co, 60Ni, 63Cu, 65Cu, 64Zn, 66Zn, 67Zn, 68Zn, 69Ga, 71Ga, 85Rb, 86Sr, 89Y, 90Zr, 92Zr, 93Nb, 99Tc, 100Ru, 101Ru, 102Ru, 104Ru, 117Sn, 126Te, 133Cs, 137Ba, 138Ba, 139La, 140Ce, 141Pr, 147Nd, 147Sm, 149Sm, 152Sm, 154Sm, 151Eu, 153Eu, 160Gd, 159Tb, 163Dy, 165Ho, 166Er, 169Tm, 172Yb, 175Lu, 180Hf, 181Ta, 184W, 206Pb, 207Pb, 208Pb, 232Th, 233U, 234U, 235U, 236U, 238U, 239-242Pu, 244Pu
External standard NIST SRM 612 Data reduction software GLITTER©
Electron Microprobe (EMP) Analysis 139
Abundances of major and minor elements (Si, Ca, Al, K, Fe, Mg, Na, Mn, and Ti) in Trinitite 140
glass were obtained using a Cameca SX50 electron microprobe (EMP) at the University of 141
Chicago (Chicago, Illinois). Operating conditions were 15 kV accelerating potential and 30 nA 142
probe current with a 15 µm spot size. The larger spot size was used to minimize volatilization of 143
Na and K, and reduce the effects of local heterogeneities on element determination. Selected 144
regions of analysis were chosen based on homogeneity (as interpreted from BSE and µ-XRF 145
images) for distances ≳75 µm from EMP points for subsequent LA-ICP-MS investigation. Relict 146
quartz grains (areas identified as containing >90 % SiO2) were avoided during analysis. 147
Standardization was performed using well-characterized in-house standards of manganese 148
hortonolite (SiO2, FeO, MgO, MnO), anorthite (CaO, Al2O3), microcline (K2O), Amelia Albite 149
(Na2O), synthetic Ti (TiO2), and synthetic Cr (Cr2O3). Internal uncertainties (2σ) based on 150
counting statistics are ≤2 % for SiO2, Al2O3, and CaO; ≤5 % for FeO, Na2O, K2O, TiO2, Cr2O3, 151
and MgO; and ≤10 % for MnO. 152

Donohue et al. Published in JRNC 8
LA-ICP-MS Analysis 153
Trace element analyses were performed using a ThermoFinnegan Element2 high-resolution ICP-154
MS (Thermo Scientific, Bremen, Germany) coupled to a New Wave UP213 Nd:YAG laser 155
ablation system (ESI, Portland, OR, USA). Operating conditions (Table 1) were 5 Hz pulse rate 156
and 40 µm spot size for a corresponding fluence of 10-12 J cm-2. Background signals were 157
monitored for ~60 s. For the final 20 s the laser was on and shuttered to stabilize power output 158
prior to ablation of the standard and unknowns. The sample ion signals were subsequently 159
analyzed for ~60 s during ablation. Repeated measurements (two prior and two subsequent to the 160
unknowns) of the external standard NIST SRM 612 glass bracketed every analysis of ten or 161
fewer Trinitite samples. This method was facilitated by the UP213 sample chamber, which 162
accommodated simultaneously both the sample and NIST SRM 612 standard wafer. Trace 163
element concentrations, internal uncertainties (1σ), and limits of detection were determined using 164
the program GLITTER©, which allows for the reduction of time-resolved signal analysis ([23]; 165
http://www.glitter.gemoc.com). Pu and U isotopic ratios were calculated based on average 166
background-subtracted count rates of monitored isotopes using the method of Wallace et al. [16]. 167
Results 168
Major and trace elements 169
Major and trace element results from 228 EMP analyses and corresponding LA-ICP-MS 170
measurements are summarized in Table 2 and Figs. 2, 3, and 4. Results for individual analyses 171
are listed in Supplemental Table S1. Typical Trinitite glass is composed predominantly of SiO2 172
(58-70 wt.%), with variable amounts of Al2O3 (10–20 wt.%), CaO (4–15 wt.%), K2O (2–6 173
wt.%), and FeO (1–5 wt.%). Subgroups of Trinitite glass are defined by the influence of common 174
precursor minerals present within the desert sand at GZ, including high-Si regions (>80 wt.% 175
SiO2) due to localized quartz melting. Ca-rich Trinitite (>10 wt.% CaO) and K-rich glass (>6 176
wt.% K2O) are likely attributable to the melting of calcite and K-feldspar, respectively (Fig. 2a). 177
High-Fe glass (>5 wt.% FeO) is typically dark in plane polarized light, and some Fe-rich regions 178
are centered near anhedral magnetite grains. The high temperature produced by the nuclear blast 179
(>1470 ⁰C; [15]) vitrified most of the precursor desert minerals. However, relict grains of quartz 180
are common, with fewer K-feldspar grains, zircons, and trace other minerals [24]. Micro-XRF 181

Donohue et al. Published in JRNC 9
maps reveal these relict quartz and K-feldspar regions (yellow and blue, respectively, in Fig. 1) 182
are 0.5–2 mm in size. 183
Table 2 Average major element oxide (wt.%), and trace element abundances (ppm with 184
associated 1σ uncertainty) for common varieties of Trinitite glass 185
Typical glass High-Si High-Ca High-K High-Fe n* 18 2 9 12 4 FeO 2.27 1.72 2.40 0.63 13.2 MnO 0.08 0.03 0.06 0.01 0.65 Na2O 2.68 1.27 1.24 3.31 1.57 Al2O3 15.0 4.80 9.93 18.5 9.88 MgO 1.13 0.46 1.10 0.18 0.91 K2O 4.32 2.67 1.75 9.74 2.36 CaO 6.87 3.09 24.5 1.29 6.27 TiO2 0.42 0.25 0.35 0.07 13.4 SiO2 66 85 58 66 49 Cr2O3 0.01 0.00 0.01 0.00 0.02
SUM 98.83 99.16 99.04 99.43 97.66 Co 5.25 ± 0.30 b.d. 5.31 ± 0.25 2.41 ± 0.20 b.d. Cu 14.0 ± 1.0 6.00 ± 0.52 16.0 ± 1.4 4.38 ± 0.65 45.6 ± 7.8 Ga 12.7 ± 0.6 b.d. 11.7 ± 0.5 13.2 ± 0.8 b.d. Rb 177 ± 7 39.8 ± 4.0 59.4 ± 3.8 371 ± 22 68.0 ± 5.8 Sr 339 ± 48 112 ± 16 372 ± 41 150 ± 15 257 ± 39 Y 10.5 ± 1.0 5.14 ± 0.44 14.7 ± 1.0 1.15 ± 0.14 21.8 ± 1.8 Zr 54.8 ± 3.0 20.9 ± 1.6 67.0 ± 4.8 5.67 ± 0.36 89.4 ± 6.0 Nb 9.68 ± 0.78 2.42 ± 0.18 7.97 ± 0.68 0.94 ± 0.08 81.8 ± 4.4 Sn 1.49 ± 0.28 0.60 ± 0.16 1.05 ± 0.26 1.13 ± 0.32 1.67 ± 0.33 Cs 5.27 ± 0.26 1.17 ± 0.05 1.58 ± 0.09 11.4 ± 0.6 2.24 ± 0.15 Ba 1022 ± 46 243 ± 8 639 ± 26 1891 ± 86 637 ± 31 La 18.4 ± 0.8 7.22 ± 0.25 22.2 ± 1.0 4.54 ± 0.24 20.1 ± 1.0 Ce 39.0 ± 1.3 13.6 ± 0.45 40.2 ± 1.9 2.68 ± 0.12 44.3 ± 2.2 Pr 4.13 ± 0.16 1.72 ± 0.07 4.83 ± 0.22 0.31 ± 0.02 4.63 ± 0.23 Nd 14.5 ± 0.7 6.33 ± 0.26 17.9 ± 0.9 1.15 ± 0.09 17.6 ± 0.9 Sm 2.63 ± 0.17 1.10 ± 0.09 3.26 ± 0.22 0.29 ± 0.04 3.66 ± 0.29 Eu 0.72 ± 0.07 0.31 ± 0.02 0.76 ± 0.05 0.56 ± 0.05 0.79 ± 0.06 Gd 2.24 ± 0.14 1.00 ± 0.07 2.77 ± 0.15 0.24 ± 0.05 3.42 ± 0.22 Tb 0.32 ± 0.03 0.14 ± 0.02 0.42 ± 0.03 0.04 ± 0.02 0.51 ± 0.04 Dy 1.84 ± 0.12 0.82 ± 0.05 2.54 ± 0.16 0.25 ± 0.03 3.74 ± 0.25 Ho 0.36 ± 0.03 0.18 ± 0.01 0.51 ± 0.03 0.04 ± 0.01 0.77 ± 0.05 Er 1.11 ± 0.08 0.54 ± 0.04 1.51 ± 0.10 0.16 ± 0.02 2.38 ± 0.17

Donohue et al. Published in JRNC 10
Tm 0.18 ± 0.02 0.07 ± 0.01 0.24 ± 0.02 0.02 ± 0.01 0.40 ± 0.03 Yb 1.23 ± 0.10 0.54 ± 0.05 1.76 ± 0.12 0.17 ± 0.03 2.96 ± 0.20 Lu 0.19 ± 0.02 0.09 ± 0.01 0.25 ± 0.02 0.02 ± 0.01 0.45 ± 0.04 Hf 2.62 ± 0.13 1.19 ± 0.06 3.41 ± 0.17 0.26 ± 0.02 5.16 ± 0.26 Ta 0.56 ± 0.04 0.17 ± 0.01 0.58 ± 0.04 0.17 ± 0.02 5.28 ± 0.22 W 0.58 ± 0.06 0.18 ± 0.02 0.57 ± 0.06 0.07 ± 0.02 1.43 ± 0.11 Pb 19.1 ± 1.0 2.35 ± 0.12 9.45 ± 0.57 59.9 ± 3.2 20.7 ± 1.2 Th 7.97 ± 0.41 2.87 ± 0.10 8.86 ± 0.37 0.50 ± 0.03 7.42 ± 0.34 U 1.93 ± 0.09 0.92 ± 0.06 3.41 ± 0.16 0.60 ± 0.03 4.24 ± 0.43 Pu cps 198 ± 12 198 ± 14 913 ± 25 95 180 ± 14 240Pu/239Pu 0.017 ± 0.021 0.009 0.022 0.004 0.034 ± 0.033 235U/238U 0.009 ± 0.002 0.005 ± 0.001 0.008 ± 0.001 0.171 0.009 ± 0.001
186
Fig. 2 Major element variation diagrams of Trinitite glass. (a) Trends toward high CaO and high 187
K2O reflect calcite and K-feldspar contributions, respectively. (b) Trinitite glass consists 188
predominantly of SiO2. (c) FeO and TiO2 wt.% abundances are positively correlated. (d) High 189
Al2O3 contents at corresponding low FeO wt.% abundances indicates feldspar dominating the 190
minor element signature in some analyses. Uncertainties in EMP analyses are smaller than the 191
size of symbols shown. 192
0 2 4 6 8
10 12 14 16
0 5 10 15 20 25 30
K 2O
(wt.%
)
CaO (wt.%)
5A 8.86 5A 6.06
4F 8.86 4D 9.18
0.001
0.01
0.1
1
10
100
0 2 4 6 8 10 12
TiO 2
(wt.%
)
FeO (wt.%)
0
2 4 6 8
10 12
20 40 60 80 100
FeO
(wt.%
)
SiO2 (wt.%)
0
5
10
15
20
25
0 2 4 6 8 10 12
Al2O
3 (wt
.%)
FeO (wt.%)
(a) (b)
(c) (d)

Donohue et al. Published in JRNC 11
High-Ca regions (>10 wt.% CaO) are in general characterized by higher U and Pu contents 193
compared to lower-Ca regions (Fig. 3a-b), which corroborates similar trends observed in Trinitite 194
by Wallace et al. [16] and Fahey et al. [9]. For most analyses with high-Ca contents, the 195
corresponding U abundances are consistent with that of un-melted sand (i.e., ~3.2 ppm; [4]), 196
indicating a natural source (Fig. 3a). Many elements show orders of magnitude variation but with 197
few correlations, such as the abundances of Cu vs. Pb (Fig. 3c); both elements are abundant in 198
Trinitite containing red surface inclusions [4]. In addition, both Zr and Hf contents define orders 199
of magnitude variation at a constant Zr/Hf ratio of 0.045 (Fig. 3d), which is consistent and 200
attributable to the precursor, low modal amount (<1%) of zircon within the sand at Trinity. 201
202
Fig. 3 Major and trace element diagrams of Trinitite glass analyses. (a) U concentrations in high 203
Ca regions are consistent with unmelted Trinitite sand [4]. U enrichment is more likely to reflect 204
anthropogenic input. (b) There also appears to be a positive correlation between Pu and CaO. 205
0.01
0.1
1
10
100
1000
1 10 100 1000 10000
Hf (p
pm)
Zr (ppm)
1
10
100
1000
10000
0 5 10 15 20 25 30
239 P
u (c
ps)
CaO (wt.%) 0 2 4 6 8
10 12 14 16 18 20
0 5 10 15 20 25 30
U (p
pm)
CaO (wt.%)
5A 8.86
5A 6.06
4F 8.86 4D 9.18
0
50
100
150
200
250
300
350
400
0 20 40 60 80 100 120 140
Pb (p
pm)
Cu (ppm)
(a) (b)
(c) (d)

Donohue et al. Published in JRNC 12
The 239Pu ion signal, counts per second (cps), is used as a proxy for the absolute abundances of 206
Pu. The latter cannot be calculated since it is not contained within the NIST SRM 612 standard; 207
(c) Pb (ppm) vs. Cu (ppm). (d) Constant Hf/Zr ratio (0.045 ± 0.002) indicates zircon control for 208
these elements. Dashed gray lines in all plots indicate the pertinent concentrations for those 209
elements within un-melted arkosic sand [4]; moreover, the abundance of Pu in the sand (Fig. 3b) 210
is zero prior to the Trinity nuclear detonation. 211
The average arkosic sand from the Trinity site [4] exhibits a concave up rare earth element 212
(REE) pattern (chondrite normalized), with a negative light REE (LREE) slope, slight negative 213
Eu-anomaly, and flat heavy REE (HREE) profile (Fig. 4). The majority of individual glass 214
analyses reported here (190 of 228 measurements) exhibit REE profiles similar to that for the un-215
melted sand, although absolute concentrations vary by as much as a factor of three. The 216
dominant factors controlling the REE budgets of bulk Trinitite are believed to be the variable 217
contributions by quartz, feldspars, and trace amounts of accessory minerals such as zircon, 218
monazite, and apatite [4]. Significant plagioclase contribution to Ca-rich regions (>10 wt.% 219
CaO) is reflected by a positive Eu-anomaly in chondrite normalized REE-patterns and overall 220
lower concentrations (i.e., diluted REE profile; Fig. 4a, c, d). In general, analyses exhibiting the 221
lowest REE chondrite normalized values are characterized by the highest K abundances. 222
Moreover, some Trinitite analyses have typical LREE and elevated HREE signatures, which may 223
reflect zircon contributions; these analyses are also characterized by elevated Zr contents. Other 224
identifiable mineral influences include apatite by the REE-enriched (~1000× chondrite) profile 225
(Fig. 4a), and monazite/apatite by the steep negative REE profile (Fig. 4c). 226

Donohue et al. Published in JRNC 13
227
Fig. 4 Chondrite normalized rare earth element profiles for the four samples investigated here 228
compared to un-melted sand (bold black line with solid circles) from the sandy side of Trinitite 229
[4]. The green field represents the majority of analyses, which define patterns that are subparallel 230
to the un-melted sand. Gray lines with unfilled symbols represent patterns for more ‘unusual’ 231
analyses that reflect signatures for specific mineral contributions. 232
Cross-section transects 233
Three transects were conducted across each sample, with an average spacing of 0.24 to 1.0 mm 234
per sample, and a maximum depth of ~10 mm (Fig. 1). The average distance between EMP 235
points in the upper 2 mm was ~0.3 mm, and average spacing increased with depth (from glassy 236
top side) due to increasing vesicle and mineral fragment abundances. Within each transect, the 237
proportion of silicate mineral fragments increased with depth. In general, vesicle size decreases 238
with increasing depth. There is also a tendency for vesicles to be ovoid and elongated parallel to 239
the sample surface. In an investigation of a single Trinitite sample, Sharp et al. [18] noted three 240
distinct regions, comprising an uppermost glassy layer, middle transitional-glassy layer, and 241
lower, relatively un-melted mineral fragments. In this study, there does not appear to be a layer 242
with significant un-melted material, but the uppermost glass-dominated layer is present and 243
1
10
100
1000
Ce Pr Nd Sm Eu Gd Tb Dy Ho Er Tm Yb Lu
(c) 5A 8.86
CI ch
ondr
ite n
orma
lized
0.1
1
10
100
La Ce Pr Nd Sm Eu Gd Tb Dy Ho Er Tm Yb Lu
(d) 5A 6.06
La
1
10
100
La Ce Pr Nd Sm Eu Gd Tb Dy Ho Er Tm Yb Lu
(b) 4F 8.86
1
10
100
1000
La Ce Pr Nd Sm Eu Gd Tb Dy Ho Er Tm Yb Lu
CI ch
ondr
ite n
orma
lized
(a) 4D 9.18apatite
feldspar
monazite?
zircon
feldspar
feldspar
zircon
feldspar
quartz/calcite
quartz/calcite

Donohue et al. Published in JRNC 14
covers a transitional mixture of glass and mineral fragments. In each vertically oriented sample, 244
this transition begins at ~2 mm depth. 245
In Fig. 5, only analyses with typical Trinitite REE profiles are shown (see discussion section). 246
The upper 2 mm is most likely to contain major U enrichment, with these enriched regions found 247
in high alpha track density regions, although this feature is not prevalent in every sample (Fig. 248
5e–g). The glassy portion of obliquely cut 5A 6.06 also records U enrichment in the outer 2 mm 249
(Fig. 5h). The calculated 240Pu/239Pu ratio of the Gadget is 0.0128 [8]; however, recent studies of 250
Trinitite measured 240Pu/239Pu ratios ranging between 0.0176 [9], ~0.021 [e.g., 16] and ~0.026 251
(average of [18]). This fingerprint dominates the upper 2 mm of Trinitite samples investigated 252
here (Fig. 5i–l), and the ratio increases slightly with depth in sample 4D 9.18. However, in each 253
sample a weapons grade 240Pu/239Pu ratio is also identified at depths up to ~10 mm. 254

Donohue et al. Published in JRNC 15
255
Fig. 5 Analytical transects through the samples. In vertical cross-sections, the most significant 256
deviations are recorded in the upper 2 mm. The dashed line in (e–h) represents the concentration 257
of U in un-melted sand (U = 3.2 ppm; [4]). In (i–l), the thick gray bar (enveloped by the dashed 258
0
1
2
3
4
5
6
7
8
9 0 2 4 6 8 10 12 14
U (ppm)
5A 8.86
0 1 2 3 4 5 6 7 8 9
10 11
0 4 8 12 16 20 di
stan
ce fr
om ed
ge (m
m)
U (ppm)
5A 6.06
0 1 2 3 4 5 6 7 8 9
10 11
0 2 4 6 8 10 12 14 U (ppm)
4F 8.86
0
1
2
3
4
5
6
7
8 0 2 4 6 8 10 12 14
dept
h (m
m)
U (ppm)
4D 9.18 0
1
2
3
4
5
6
7
8
9 0 5 10 15 20 25 30
CaO (wt.%)
0 1 2 3 4 5 6 7 8 9
10 11
0 5 10 15 20 25 30 CaO (wt.%)
0 1 2 3 4 5 6 7 8 9
10 11
0 5 10 15 20 25 30 CaO (wt.%)
0
1
2
3
4
5
6
7
8 0 5 10 15 20 25 30
dept
h (m
m)
CaO (wt.%)
dist
ance
from
edge
(mm
)
0
1
2
3
4
5
6
7
8
9 0.001 0.01 0.1 1 10
0
1
2
3
4
5
6 0.001 0.01 0.1 1 10
0 1 2 3 4 5 6 7 8 9
10 11 0.001 0.01 0.1 1 10
0
1
2
3
4
5
6
7
8 0.001 0.01 0.1 1 10
dist
ance
from
edge
(mm
)
dept
h (m
m)
corrected 240Pu/239Pu corrected 240Pu/239Pu corrected 240Pu/239Pu corrected 240Pu/239Pu
bomb ratio natural ratio
(a) (b) (c) (d)
(e) (f) (g) (h)
(i) (j) (k) (l)

Donohue et al. Published in JRNC 16
lines) represents the range in bomb Pu signatures for the Trinity device [9, 16, 18], while the 259
dashed line represents the natural fallout Pu ratio for the region surrounding GZ [25]. A bomb-260
like signature is found at depths >6 mm in all vertically oriented samples. Uncertainties are 261
reported as relative standard deviations (2σ). 262
Discussion 263
Mineralogical control on Trinitite composition 264
The textural and chemical heterogeneity of Trinitite, as demonstrated in Figs. 2, 3, and 4, has 265
been previously reported [4, 12, 16]. Glass composition is strongly influenced by precursor sand 266
components (e.g., calcite influence on CaO abundance in Fig. 2a), which can potentially mask 267
anthropogenic contributions. A major goal of nuclear forensics is to distinguish between 268
anthropogenic components and device signatures within PDMs. Bellucci et al. [4] identified 269
anthropogenic contributions on the basis of deviations from expected trends in mineral control 270
lines, and comparing trace element abundances within Trinitite to those for un-melted sand 271
composition. An alternative, simpler approach adopted here is to utilize the characteristic 272
chondrite normalized REE profile of un-melted Trinitite to quickly identify characteristic 273
minerals present in the desert sand at GZ (Fig. 4). As shown in Fig. 4, the majority of chondrite 274
normalized REE profiles of Trinitite glass are subparallel to the un-melted sand composition, and 275
vary only relative to absolute abundances. The latter feature can be attributed to dilution from 276
predominant REE-poor phases present in the sand, primarily quartz, calcite, and feldspar. 277
Specific REE patterns can also be attributed to strong influence by specific mineral components. 278
For example, plagioclase feldspar is identified by a positive Eu-anomaly and slight LREE 279
enrichment at lower chondrite normalized values (Fig. 4). In relation to controlling the REE 280
budget of Trinitite, trace accessory minerals such as apatite, monazite, and zircon are 281
characterized by high concentrations of REEs; i.e., apatite and monazite are a major source of the 282
LREEs and Th, whereas zircon controls the budget of the HREEs, U, Hf, and Zr. The Hf/Zr ratio 283
of 0.045 (Fig. 3d) is consistent with natural zircon containing ~60 wt.% ZrO2 and ~2 to 3 wt.% 284
HfO2. Other accessory minerals present in the precursor desert sand, such as ilmenite, will exert 285
an important control on the distribution of Ta and Nb abundances within Trinitite. Therefore, on 286
the basis of the trace element abundances and resulting patterns (e.g., Fig. 4), it is important to 287

Donohue et al. Published in JRNC 17
identify the trace element signatures of accessory minerals that are present to minimize their 288
inaccurate attribution to device components. 289
Hence, we have applied this mineral component ‘filter’ to all of the high spatial resolution 290
analyses conducted here. The remaining analyses display remarkable homogeneity as the 291
variation in REE abundances is reduced to within an order of magnitude. This relatively rapid 292
‘filtering’ method was used in Fig. 5, where only samples with subparallel REE profiles to un-293
melted Trinitite are shown. Thus, other explanations must be considered for regions where, for 294
example, U abundance is not controlled by melted minerals (e.g., monazite). Of the three vertical 295
cross-sections, U enrichment was found only in sample 4F 8.86 (Fig. 5f), in the upper 2 mm 296
glassy portion. The obliquely cut sample 5A 6.06 also exhibited U enrichment limited to the 297
glassy section. The limited occurrence and presence of U only at the surface of Trinitite suggests 298
an anthropogenic source, likely from the Gadget device tamper [7]. Also, these two samples 299
formed >74 m (4F 8.86) and 51 m (5A 6.06) from GZ, which reflect the heterogeneous 300
distribution of device components. Pu concentrations, using Pu ion signals as a proxy, did not 301
reveal systematic variations with depth. For each sample, the highest Pu abundance was typically 302
found in the upper 2 mm, although deeper analyses often yielded regions with similar ion signal 303
intensities. Additionally, regions of high Pu abundance below 2 mm depth were never more than 304
a factor of two higher than Pu yields from the upper 2 mm. Thus, similar degrees of Pu 305
enrichment occur at variable depths within Trinitite cross-sections. 306
The petrography and vesicle morphology of the three vertical thin sections supports an origin by 307
in-situ melting [12, 15, 17] and subsequent deposition of fallback particles [17, 18]. The 308
dichotomy between an upper glassy layer with few, relatively large vesicles, and a highly 309
vesicular lower region has been observed in other Trinitite samples [18, 26]. The heterogeneous 310
distribution of pooled glass is demonstrated by the difference in thickness between this study, 311
where it is ~2 mm thick, the 2.5 mm thick glass of Giuli et al. [26], and the 1 mm thick glassy 312
region of Sharp et al. [18]. In addition, Trinitite was not created as a uniform, flat layer of glass. 313
Photos of the desert surface shortly after the blast reveals a patchy network of glass with 314
centimeter scale voids [c.f., 8]. As a result, many Trinitite fragments are rounded, and the glassy, 315
devolatilized layer may be present on the sides of some samples. Further studies of vesicle 316

Donohue et al. Published in JRNC 18
development and mineral vitrification in nuclear blast melt may be aided by investigation of 317
synthetic/surrogate Trinitite-like nuclear debris [27]. 318
Implications of plutonium distribution 319
As discussed previously, Trinitite is thought to have formed by a combination of in-situ melting 320
and deposition of debris cloud material [4, 17, 18]. The uppermost surface would be quenched to 321
a semi-solid glass by the air. This would then trap subsurface heat at temperatures above the 322
boiling point of water for a sufficiently long period of time to form bubbles in the molten glass. 323
This formation agrees with the glassy layer of Trinitite blast melt, observed vesicle distribution, 324
and non-mineral-associated contribution of U to the uppermost surface (Fig. 5e-h). In contrast, 325
the identification of a weapons grade Pu signature at depth (Fig. 5i-l) is more difficult to 326
reconcile with these methods of formation. Material from the debris cloud must have penetrated 327
to depths >6 mm, which is unlikely if only in-situ melting dominated below 2 mm depth. 328
The presence of supergrade Pu isotope signatures at depth requires thorough disturbance and 329
mixing of the local sand during the blast. The samples investigated here originated between 50 330
and 370 m (the maximum extent of Trinitite) from GZ. At a radial distance of 410 m, the peak 331
pressure of the excess velocity was 45.2 psi [28]. Focused on sand-sized particles, this pressure 332
would be sufficient to disturb the upper surface surrounding GZ. By comparison, earthen 333
embankments up to 730 m from GZ were also scoured away [28]. We propose that the upper 334
surface was briefly and vigorously mixed to depths of at least 1 cm, with variation dependent 335
upon proximity to GZ and local topography. The majority of device-related material would not 336
be entrained in this zone, as it would remain in the vapor cloud for several seconds. In-situ 337
melting and heating by debris cloud material would then proceed. Mixing during initial melting 338
would allow the degree of homogenization observed in the primary Trinitite glass composition. 339
In-situ LA-ICP-MS analyses with the highest ion signals of 239Pu yield calculated isotopic 340 240Pu/239Pu ratios that range between 0.012 and 0.026, which correspond to those for the Trinity 341
device (Fig. 6). A negative correlation exists between 240Pu/239Pu and 239Pu for ion signals <1000 342
cps (counts per second). In particular, there is a linear lower limit of 240Pu/239Pu for samples with 343
<1000 cps. The counting statistics for the measurement of extremely low 240Pu ion signals (n = 344
1-2 cps) renders the calculated 240Pu/239Pu ratios for such analyses essentially invalid. Analysis 345

Donohue et al. Published in JRNC 19
of the NIST SRM 612 standard wafer, which does not contain Pu, frequently yielded 239Pu ion 346
signals of 2 cps or more. Thus, caution must be taken when interpreting the Pu isotope ratios as a 347
function of measured ion signals. For example, the increasing 240Pu/239Pu ratio with decreasing 348
count rates (Fig. 6) is not attributable to mixing between the bomb-device and natural 349
background [25]. The “natural 240Pu/239Pu ratio” of 0.176 within the region of Alamogordo, NM 350
represents the atom ratio for global fallout as a result of two decades of nuclear testing [25, 28], 351
which had not yet occurred before the Trinity test. It has also been demonstrated that vitrification 352
and the arid environment at the Trinity site has resulted in no observable leaching of radioactive 353
components into the surrounding environment [12]. An alternative explanation is that natural 354
fallout and bomb-related Pu may have mixed during petrographic thin section preparation of the 355
Trinitite samples as water was used in their fabrication. However, the validity of this 356
interpretation needs to be further investigated. 357
358
Fig. 6 239Pu count rates from LA-ICP-MS analyses compared to calculated 240Pu/239Pu ratios 359
(corrected using the method of [16]). (a) Analyses recording higher 239Pu ion signals (>1000 cps) 360
are less variable and are more likely to reflect a nuclear device signature (thick gray bar). (b) 361
Portion of (a) with a lower cutoff of 200 cps 239Pu. Uncertainties are relative standard deviation 362
(2σ). Light gray dashed line in plot 6a represents the Pu isotope composition for the natural 363
background at Trinity in 1978 [25]. 364
Conclusions 365
0
0.01
0.02
0.03
0.04
0.05
0.06
0.07
0.08
0.09
0.10
100 1000 10000 0.001
0.01
0.1
1
10
1 10 100 1000 10000
240 P
u/23
9 Pu
(cor
rect
ed)
239Pu (cps)
240 P
u/23
9 Pu
(cor
rect
ed)
239Pu (cps)
5A 8.86b
5A 6.06a
4F 8.86c 4D 9.18b
(a) (b)

Donohue et al. Published in JRNC 20
Trinitite is heterogeneous by nature, and contributions by various mineral phases present within 366
the desert sand at GZ during melting after the nuclear explosion are identifiable using high 367
spatial resolution analysis. The major and trace element signatures of common minerals found in 368
arkosic sand are used as a rapid filtering method to remove their natural, geological background 369
contribution to the Trinitite glass composition. The resulting chemical distributions demonstrate 370
a higher degree of homogeneity for trace elements than previously interpreted, and 371
anthropogenic contributions are easier to identify. Pu from the device, as interpreted from the 372
supergrade 240Pu/239Pu signature, is found deeper (up to ~1 cm) within Trinitite than previously 373
described. Incorporation of device Pu requires rapid mixing of local sand by the initial blast 374
wave, prior to and possibly during initial melting. 375
Acknowledgments 376
We thank Dr. Ian Steele for assistance with electron microprobe analyses at the University of 377
Chicago. Sandy Dillard of the Brazos Valley Petrographic Thin Section Services Lab (Bryan, 378
Texas) is thanked for production of thin sections of Trinitite. We also wish to thank the Center 379
for Environmental Science and Technology at the University of Notre Dame for use of the µ-380
XRF. This manuscript was improved by comments from two anonymous reviewers, and we 381
thank Zsolt Revay for editorial handling. This research is funded by DOE/NNSA grant PDP11-382
40/DE-NA0001112. 383
References 384
1. Mayer K, Wallenius M, Fanghänel T (2007) Nuclear forensic science—From cradle to 385 maturity. J Alloys and Compounds 444-445:50–56. doi: 10.1016/j.jallcom.2007.01.164 386
2. Mayer K (2013) Expand nuclear forensics. Nature 503:461–462. 387
3. Los Alamos National Laboratory (2005) Nuclear Weapons Journal. Nuclear Weapons Journal 388 1–47. 389
4. Bellucci JJ, Simonetti A, Koeman EC, Wallace C, Burns PC (2014) A detailed geochemical 390 investigation of post-nuclear detonation trinitite glass at high spatial resolution: Delineating 391 anthropogenic vs. natural components. Chem Geol 365:69–86. doi: 392 10.1016/j.chemgeo.2013.12.001 393
5. Eppich GR, Knight KB, Jacomb-Hood TW, Spriggs GD, Hutcheon ID (2014) Constraints on 394 fallout melt glass formation from a near-surface nuclear test. J Radioanal Nucl Chem 395

Donohue et al. Published in JRNC 21
302:593–609. doi: 10.1007/s10967-014-3293-9 396
6. Schlauf D, Siemon K, Weber R, Esterlund RA, Molzahn D, Patzelt P (1997) Trinitite redux: 397 Comment on “‘Determining the yield of the Trinity nuclear device via gamma-ray 398 spectroscopy,’” by David Atkatz and Christopher Bragg [Am. J. Phys. 63, 411–413 (1995)]. 399 Am J Phys 65:1110–1112. 400
7. Rhodes R (1986) The Making of the Atomic Bomb. Simon and Schuster, New York 401
8. Parekh PP, Semkow TM, Torres MA, Haines DK, Cooper JM, Rosenberg PM, Kitto ME 402 (2006) Radioactivity in Trinitite six decades later. J Environ Radioact 85:103–120. doi: 403 10.1016/j.jenvrad.2005.01.017 404
9. Fahey AJ, Zeissler CJ, Newbury DE, Davis J, Lindstrom RM (2010) Postdetonation nuclear 405 debris for attribution. P Natl Acad Sci 107:20207–20212. doi: 10.1073/pnas.1010631107 406
10. Staritzky E (1950) Thermal effects of atomic bomb explosions on soils at Trinity and 407 Eniwetok. Los Alamos Sci Lab 21:1–21. 408
11. Pettijohn FJ (1963) Chapter S: The chemical composition of sandstones—excluding 409 carbonate and volcanic sands. In: Fleischer M (ed) Data of Geochemistry. pp 440–s (19 pp) 410
12. Eby GN, Hermes R, Charnley N, Smoliga JA (2010) Trinitite - the atomic rock. Geol Today 411 180–185. 412
13. Koeman EC, Simonetti A, Chen W, Burns PC (2013) Oxygen Isotope Composition of 413 Trinitite Postdetonation Materials. Anal Chem 85:11913–11919. doi: 10.1021/ac402757p 414
14. Storms B (1965) Trinity. Atom 2 8:1–34. 415
15. Ross CS (1948) Optical properties of glass from Alamogordo, New Mexico. Am Mineral 416 33:360–362. 417
16. Wallace C, Bellucci JJ, Simonetti A, Hainley T, Koeman EC, Burns PC (2013) A multi-418 method approach for determination of radionuclide distribution in trinitite. J Radioanal Nucl 419 Chem 298:993–1003. doi: 10.1007/s10967-013-2497-8 420
17. Belloni F, Himbert J, Marzocchi O, Romanello V (2011) Investigating incorporation and 421 distribution of radionuclides in trinitite. J Environ Radioact 102:852–862. doi: 422 10.1016/j.jenvrad.2011.05.003 423
18. Sharp N, McDonough WF, Ticknor BW, Ash RD, Piccoli PM, Borg DT (2014) Rapid 424 analysis of trinitite with nuclear forensic applications for post-detonation material analyses. J 425 Radioanal Nucl Chem. doi: 10.1007/s10967-014-3285-9 426
19. Bellucci JJ, Simonetti A (2012) Nuclear forensics: searching for nuclear device debris in 427 trinitite-hosted inclusions. J Radioanal Nucl Chem 293:313–319. doi: 10.1007/s10967-012-428 1654-9 429
Donohue et al. Published in JRNC 22
20. Bellucci JJ, Simonetti A, Wallace C, Koeman EC, Burns PC (2013) Isotopic Fingerprinting 430 of the World’s First Nuclear Device Using Post-Detonation Materials. Anal Chem 85:4195–431 4198. doi: 10.1021/ac400577p 432
21. Bellucci JJ, Simonetti A, Wallace C, Koeman EC, Burns PC (2013) Lead Isotopic 433 Composition of Trinitite Melt Glass: Evidence for the Presence of Canadian Industrial Lead 434 in the First Atomic Weapon Test. Anal Chem 85:7588–7593. doi: 10.1021/ac4016648 435
22. Bellucci JJ, Wallace C, Koeman EC, Simonetti A, Burns PC, Kieser J, Port E, Walczak T 436 (2013) Distribution and behavior of some radionuclides associated with the Trinity nuclear 437 test. J Radioanal Nucl Chem 295:2049–2057. doi: 10.1007/s10967-012-2201-4 438
23. van Achterbergh E, Ryan CG, Jackson SE, Griffin WL (2001) Data reduction software for 439 LA-ICP-MS: Appendix. In: Sylvester PJ (ed) Laser ablation-ICP-mass spectrometry in the 440 Earth Sciences: Principles and applications. Mineralogical Association of Canada, Short 441 Course Series, pp 239–243 442
24. Mana S, Simonetti A, Koeman EC, Donohue PH, Burns PC (2014) Detailed textural, 443 geochemical, and U-Pb geochronological investigation of detrital zircons within Trinitite 444 post-detonation material. Geol Soc Am Abs Prog 46:103. 445
25. Douglas RL (1978) Levels and distribution of environmental plutonium around the Trinity 446 site. EPA Tech Note ORP/LV-78-3:1–51. 447
26. Giuli G, Pratesi G, Eeckhout SG, Koeberl C, Paris E (2010) Iron reduction in silicate glass 448 produced during the 1945 nuclear test at the Trinity site (Alamogordo, New Mexico, USA). 449 Geol Soc Am Spec Publ 465:653–660. doi: 10.1130/2010.2465(32) 450
27. Molgaard JJ, Auxier JD, Giminaro AV, Oldham CJ, Cook MT, Young SA, Hall HL (2015) 451 Development of synthetic nuclear melt glass for forensic analysis. J Radioanal Nucl Chem 452 1–9. doi: 10.1007/s10967-015-3941-8 453
28. Bainbridge KT (1976) Trinity. Los Alamos Sci Lab LA-6300-H:1–82. 454
455


