Embed Size (px)
Citation preview
International Journal of Heat and Mass Transfer 63 (2013) 351–360
Contents lists available at SciVerse ScienceDirect
International Journal of Heat and Mass Transfer
journal homepage: www.elsevier .com/locate / i jhmt
Numerical and experimental analysis of composite fouling in corrugatedplate heat exchangers
0017-9310/$ - see front matter � 2013 Elsevier Ltd. All rights reserved.http://dx.doi.org/10.1016/j.ijheatmasstransfer.2013.03.073
⇑ Corresponding author. Tel./fax: +86 571 87952244.E-mail address: [email protected] (W. Li).
Wei Li a,⇑, Hong-xia Li a, Guan-qiu Li a, Shi-chune Yao b
a Department of Energy Engineering, Zhejiang University, Hangzhou 310027, PR Chinab Department of Mechanical Engineering, Carnegie Mellon University, Pittsburgh, PA 15213, United States
a r t i c l e i n f o
Article history:Received 4 August 2012Received in revised form 24 March 2013Accepted 29 March 2013Available online 1 May 2013
Keywords:FoulingNumerical simulationVon-Karman analogyPlate heat exchanger
a b s t r a c t
This paper provides a numerical and experimental analysis on precipitation and particulate fouling incorrugated plate heat exchangers with different geometric parameters which are plate height, plate spac-ing, and plate angle. The Realizable j–e model with non-equilibrium wall functions is used in the 3Dnumerical simulation considering the realistic geometries of the flow channel to obtained Nusselt num-ber and wall shear stress, while Von-Karman analogy is used to obtain mass transfer coefficient. Numer-ical analysis is verified by experimental study. The predicted influence of fluid velocity in foulingresistance is compatible with experimental data that it can help to optimize the design of plate heatexchangers. This investigation significantly simplifies the fouling analysis of complex flow fields andcan be used to assess the fouling potential of corrugated plate heat exchangers.
� 2013 Elsevier Ltd. All rights reserved.
1. Introduction
Plate heat exchanger (PHE) has been widely used in manyindustrial applications, such as food, oil, heat-recovery etc., be-cause of its outstanding heat transfer performance, easy mainte-nance, compactness, and convenience to increase heat transferarea etc. [1]. Corrugations in plate heat exchangers enhance heattransfer rate by increasing heat transfer area and increasing turbu-lence mixing at low flow rates. However, fouling brings many con-cerns in the applications of PHEs. The heat transfer coefficient offouled PHEs can be even lower than the heat exchangers with noenhanced surfaces.
Fouling is a comprehensive and complex problem, which hasmany influential factors. Many researchers have investigated theeffects of geometry design and process conditions on fouling per-formance for tubes. In a number cases the fouling models wereestablished. Kim and Webb conducted accelerated particulate foul-ing experiments in three repeated rib tubes and a plain tube. Themass transfer rate is assumed to control the particle transport pro-cess, and the wall shear stress is assumed to control the removalprocess [1]. Webb and Li [2] took 2 years to perform practical cool-ing tower water fouling in a series of a series of seven helical-ribtubes and a smooth tube. The j factor analogy was used to calculatethe asymptotic fouling resistance [3]. Naess et al. [4] reported anexperimental study of accelerated particulate fouling tests fromreal industrial gas streams on bare and finned tubes in cross flow.
Asymptotic fouling behavior was observed for both finned and un-finned tubes. The major part of the deposit was formed on the rearsection of the tubes, where shear forces were low and protectedfrom impaction of larger particles. Cho’s team continued to developanti-fouling technology [5]. They investigated the effect of a self-cleaning filter on the performance of physical water treatment coilfor the mitigation of mineral fouling in a concentric counter flowheat exchanger.
Recent studies on fouling inside PHE are following. Merheb et al.[6] monitored the fouling inside PHE in real time, using multipleoptimized non-intrusive sensors. Low-frequency acoustic wavespropagated through the plates, and these waves were analyzed todetect fouling inside the PHE. Mahdi et al. [7] proposed a two-dimensional dynamic model for milk fouling to predict the perfor-mance of a PHE using material balance equations. Their resultsshowed fouling was highly dependent on the various process oper-ating conditions. Lei et al. [8] tested the effects of surface roughnessand textures of the PHE on calcium carbonate fouling, and foundthat the growth rate, the distribution and the crystal size of calciumcarbonate fouling were strongly dependent on the surface textureand finish. Jun et al. [9] accounted for the hydrodynamics of fluidflow using a 2D model, which was capable of predicting the temper-ature distribution of flow with higher accuracy than a 1D model.Georgiadis and Macchietto [10] predicted the milk deposit patternson the plate surfaces, which were expected to pave the way to orga-nize and optimize the operating conditions for reducing the extracost involved in fouling. Izadi et al. [11] tested the effects of differentparameters, such as surface roughness, flow velocity, and concen-tration on the calcium carbonate scale formation process by using
Nomenclature
Ac cross-section area, m2
B time constant, 1/sCb bulk concentration, kg m3
C1, C2 constantsCp specific heat, J/kg KDAB Brownian diffusivity (DAB = (KBT)/(3ðìdp)), m2/sDh hydraulic diameter of plate heat exchangers, mf fanning friction factor, dimensionlessGj, Gb generation rates of turbulence kinetic energy due to the
mean velocity gradients and to buoyancy, respectivelyI turbulence intensity, dimensionlessj Colburn j-factor (¼ StP
2=3r ), dimensionless
KB Boltzmann constant (=1.38E�23), J/KKm the mass transfer coefficient, m/sk, kt, kf thermal conductivity, turbulent thermal conductivity,
thermal conductivity of fouling deposit, W/m KL flow channel length inside plate heat exchangers, mNu Nusselt number, dimensionlessp pressure, PaP sticking probability, dimensionlessPr Prandtl number, dimensionlessRe Reynolds number, dimensionlessRf fouling resistance of heat conduction, K/WR�f asymptotic fouling resistance, K/WSj, Se user-defined source termsSc Schmidt number (Sc = í/DAB), dimensionlessSh Sherwood number, dimensionlesst time, s
T temperature, Ku average flow velocity through plates, m/sui, ui i-axis velocity component and time-averaged value, m/suT the friction velocity, uT = (ôs/ñ)1/2
u0 flow velocity in centrality of the PHE, m/sy+ dimensionless wall distance (y+ = (uT y)/m)
Greek symbolsDP pressure drop between inlet and outlet, Pass wall shear stress, Pae turbulence kinetic energy dissipation ratej turbulence kinetic energyì, ìt dynamic viscosity, turbulent dynamic viscosity, Pa sñ, ñf density of fluid, density of fouling deposit, kg/m3
Ud fouling deposition rate, kg/m2 sUr fouling removal rate, kg/m2 sr fouling process index, dimensionlessój, óe constantsn the deposit bond strength, dimensionlessm, mt kinematic viscosity, turbulent kinematic viscosity, m2/s
Subscriptsi, j refers to an axis (X, Y or Z)t turbulentr the reference point
352 W. Li et al. / International Journal of Heat and Mass Transfer 63 (2013) 351–360
a monitoring system. Balasubramanian and Puri [12] tested threecoated plates, and Lectrofluor-641TM was the best of them, whichwas provided with the decrease in thermal energy consumptionabout 15.86% at the same flow rate. From the above understanding,it appears that further research is needed to strengthen the foulingcharacteristic of PHEs, especially in the influences of different geom-etry designs and flow velocities.
With the development of CFD, numerical studies have beenconducted recently to predict the heat transfer and fouling perfor-mance. Lozano et al. [13] analyzed the flow distribution in the PHEwithout considering the heat transfer by creating a 3D modelwhich consists of a single channel. Galeazzo et al. [14] have con-ducted 3D modeling of an industrial PHE with non-chevron typein order to simplify computational efforts. They have investigatedparallel and series flow arrangements and validated it with exper-imental data. Kho and Muèller-steinhagen [15] used their CFD codeto simulate the flow and temperature distribution to predict theCaSO4 fouling performance in a flat PHE channel. The j–e modelis capable of predicting the overall flow characteristics with rea-sonable accuracy and in relatively short CPU time. The studies ofIlulian et al. [16] considered more complex and realistic geometriesof the fluid distribution regions, and assessed the laminar and two-equation turbulent models. Bonis and Ruocco [17] performed a twodimensional model for a single channel of PHE at laminar flow toinvestigate the influence of temperature and velocity on the foul-ing performance, and proved that CFD modeling results can be ap-plied to geometry optimization.
Literature is severely lacking for fouling models that are able topredict fouling potential in PHEs. From mass balance and numericalsimulation in the investigation on the flow and heat transfer perfor-mance of plate heat exchangers, we use Von-Karman analogy topredict the fouling performance in three corrugated plate heatexchangers with different geometries. Additionally, the influences
of fluid velocity and geometries of PHEs have been discussed andcompared with experimental data, which can be used to optimizethe designs of PHE generally and broaden its further applications.
2. Fouling model
Kern and Seaton [18] assumed deposit accumulation was resultof two simultaneous opposing processes: fouling deposition andfouling removal. The deposition rate is proportional to mass trans-fer coefficient; the removal rate is directly related to wall shearstress:
Rf ¼ R�f 1� eBt� �
; R�f ¼ KmPCbi=oskf ~nf ; B ¼ os=i ð1Þ
The asymptotic fouling resistance can be calculated through Eq.(1) providing that Km, P, ss and n are known. The Von Karman anal-ogy is used to calculate Km. Reynolds analogy and Prandtl analogydo not consider the influence of buffer region, which may producedeviation. The three-region model of Von-Karman analogy isadopted for the analysis for better accuracy [19–21]:
Sh ¼ KmDh=~nDAB
¼ ðf=2ÞScRe=1þ ðf=2Þ0:5 � ½5ðSc � 1Þ þ 5Lnðð5Sc þ 1Þ=6Þ� ð2Þ
The friction number is computed by Eq. (3):
f ¼ deDP=ð2L~nu2Þ ð3Þ
For smooth surfaces, wall shear stress is obtained using the fric-tion factor (ss = fñu2/2). For rough surfaces, a fraction of the pressuredrop may be due to profile drag on roughness elements. However inthe fouling formation, the profile drag does not contribute to the re-moval process. Only wall shear stress is assumed to contribute tothe removal of the particles from the wall according to Kern and Sea-ton [18]. Thus, it is necessary to quantify wall shear stress. Li et al.
W. Li et al. / International Journal of Heat and Mass Transfer 63 (2013) 351–360 353
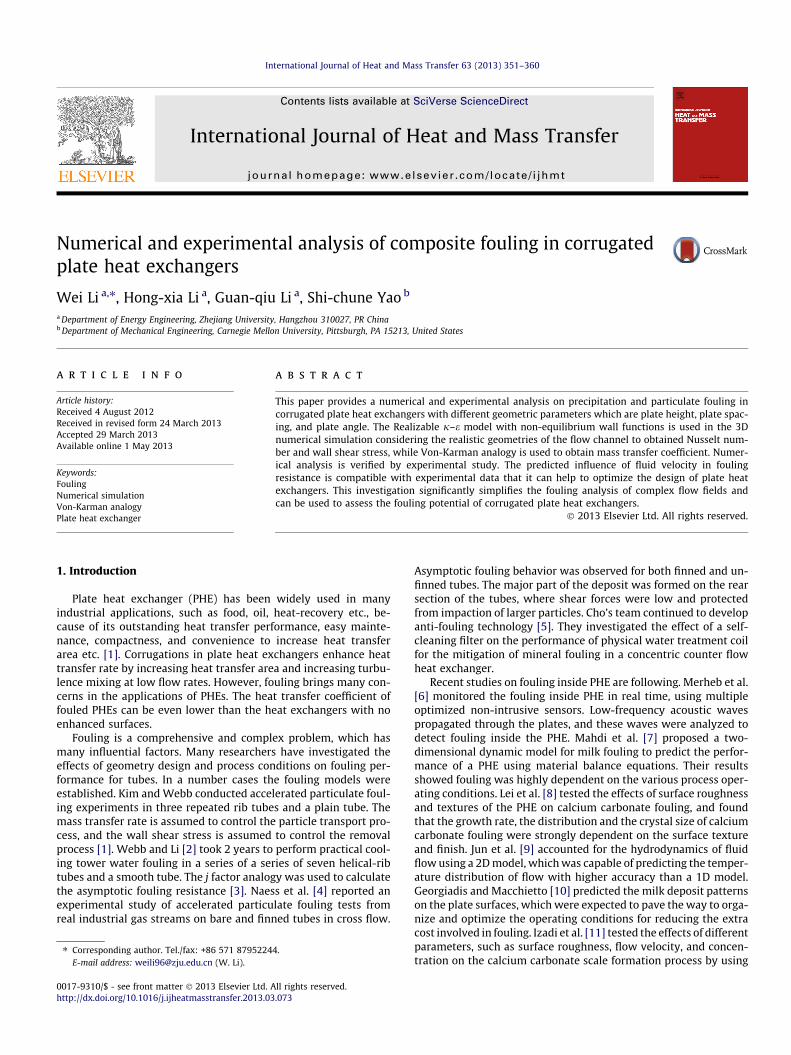
[19–21] investigated fouling in enhanced tubes. Experimentalmethod was used to obtain wall shear stress. They assume that pro-file drag is small relative to wall shear stress in the tubes. Eq. (4) isused to compute ss. It is also mentioned that the surface shear stressis not proportional to pressure drop in the helically rib tubes, be-cause of pressure drag caused by flow separation. Kim and Webb[1] proposed a four region model in Eq. (5) to quantify wall shearstress based on flow structure between the tube ribs (Fig. 1). Inthe Eq. (5), s1 and s3 are calculated from Lewis’s model [22], ands2 and s4 are obtained from the measurements by Lawallee andPopovich[23].
ss ¼ DPAc=Aw ð4Þ
ss ¼ s1A1 þ s2A2 þ s3A3 þ s4A4 ð5Þ
In PHE, neither Li’s nor Kim’s method is valid because the flowstructure is more complex in PHE than that in enhanced tubes.Flow separation and swirl happens at various places due to thecompact and diversified channel. So the use of Eq. (4) to obtainss in PHE may bring significant errors. In this study, numerical sim-ulation is utilized to compute ss. In the numerical modeling of thispaper, the centroid of the wall-adjacent cell falls within the loga-rithmic region of boundary layer, and wall shear stress ss can besolved by the Eqs. (6) and (7) [24]:
u=uT ¼ ðLnEðquT yuÞÞ=k ð6Þ
uT ¼ ðos=~nÞ1=2 ð7Þ
where u is the velocity parallel to the wall, y is the distance from thewall. k is the Von-Karman constant (0.4187) and E = 9.793.
2.1. Calculation domain
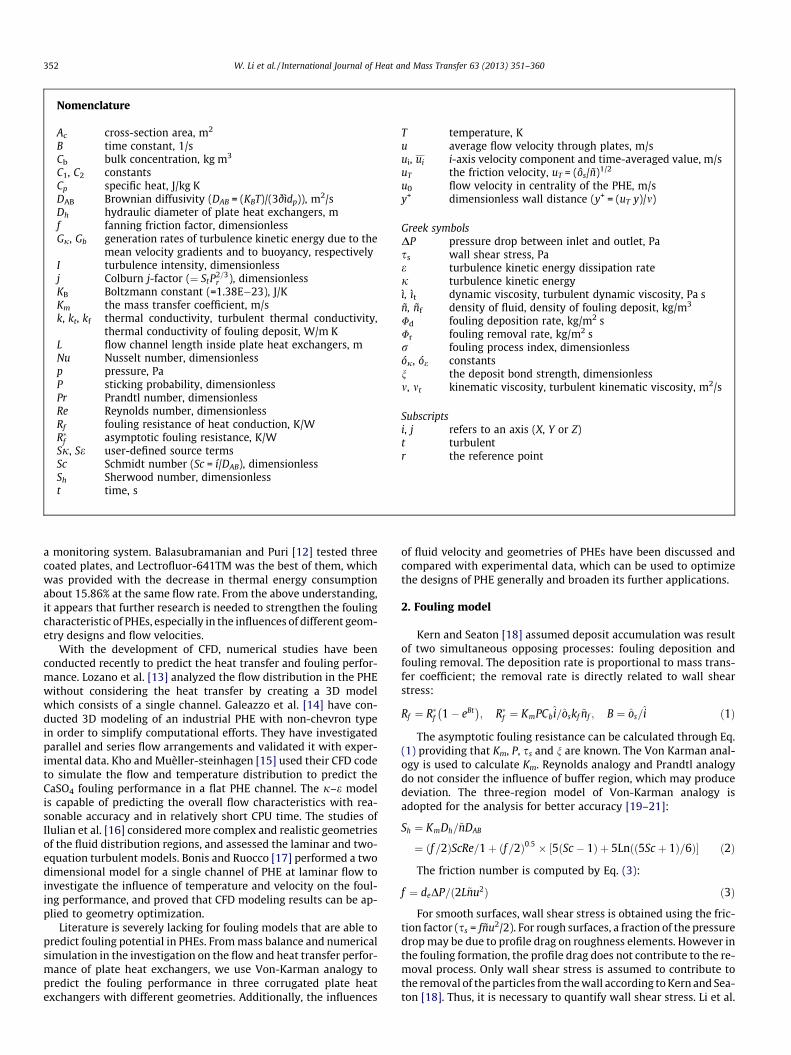
The calculation domain is for one fluid passage confined be-tween the plates. The exact geometry of the channels is consideredin the modeling, i.e. the flow domain is extending up to the gasketsand from the inlets to the outlets, taking into accounting all geo-metrical details of the fluid entrance regions of the chevron plates.Table 1 shows the three different geometries of the commerciallyused corrugated PHEs, and more details are available on the web-site [25]. Take BRM01 PHE for example, in Fig. 2a, it can be noticedthat the width, length and height of the channels are, respectively,aligned with the X, Y and Z axis. The plate dimensions are mea-sured using the plate angle, plate height, corrugation pitch, andplate thickness marked in Fig. 2b. The values of the three differentgeometric parameters are shown in Table 1. The flow domain canbe seen in Fig. 2c, in which it can be noticed that the inlet and exitports for the fluid are located on the same side.
2.2. Governing equations
It is worth nothing that for a PHE channel flow, turbulence mayoccur even for a Reynolds number as low as 400 for a plate-angleU = 60� [26]. For higher Reynolds number, the flow is indeed tur-bulent. Previous studies [26,27] have shown that the flow in aPHE has a complex 3D structure, with streamline curvature,
Fig. 1. The four region wa
swirl/rotation and with separation and reattachment of the bound-ary layer. For such flow field, the DNS or LES approaches are themost accurate but require large computational resources. To thebest of our knowledge only two turbulence models have been con-sidered suitable for a 3D simulation of a PHE: j–x SST [27] andRealizable j–e [28,29] models. For the Realizable j–e models, Iu-lian et al. [16] have tested three variants of wall treatment: stan-dard wall functions, non-equilibrium wall functions, andenhanced wall treatment. Comparing the two models, the Realiz-able j–e model with non-equilibrium wall functions is adoptedin this study. For the steady-state turbulent flow of an incompress-ible fluid, the equations of mass, momentum and energy are [30]:
@ðq � uiÞ@xi
¼ 0 ð8Þ
uj@ðq � uiÞ@xi
¼ @p@xiþ @
@xiðlþ ltÞ �
@ui
@xj
� �
Cp � uj@ðq � TÞ@xj
¼ @
@xjðkþ ktÞ �
@T@xj
� �ð9Þ
The equations for the kinetic turbulent energy j and the rate ofdissipation of the turbulence kinetic energy e corresponding to theRealizable j–e model are:
uj@ q � jð Þ@xj
¼ @
@xjlþ lt
rj
� �� @j@xj
� �þ Gj þ Gb � q � e� YM
þ Sj ð10Þ
uj@ q � eð Þ@xj
¼ @
@xjlþ lt
re
� �� @e@xj
� �þ q � C1 � Se þ Gb � q � C2 �
e2
jþffiffiffiffim�p
eð11Þ
The problem under consideration is for steady-state flow. Thefluid is considered to have constant specific heat, density, viscosity,and conductivity. Gravity forces are neglected. Therefore thehydrodynamic and thermal fields are coupled, and the effects ofbuoyancy are not taken into account.
2.3. Boundary conditions
At the inlet the velocity and temperature of the water are spec-ified according to the experiment conditions. For a boundary con-dition for the turbulence we chose the turbulence intensity andhydraulic diameter as the specification method. The hydraulicdiameter Dh is the double of the gap between two consecutiveplates and has a value shown in Table 1. The turbulence intensitywas estimated using the following correlation:
I ¼ 0:16Re�1=8 ð12Þ
For the outlets, the pressure outlet condition is used. The work-ing fluid is water. The property parameters of the water is obtainedusing NIST-REFPROP from the average temperature and averagepressure of the inlet and outlet in PHEs
ll shear stress model.
Table 1Geometry parameters of plate heat exchangers.
Plate no. Plate angle Plate height (mm) Corrugation pitch (mm) Plate thickness (mm) Dh
BRM01 65� 2.0 7 0.5 4BR05 60� 2.5 10 0.5 5BRM07 60� 2.0 8 0.5 4
Fig. 2. (a) View of the plates, dimensions and coordinate system; (b) Shape and dimensions of the corrugations; (c) The calculation flow domain.
Fig. 3. Comparison of various grids for the average temperature.
354 W. Li et al. / International Journal of Heat and Mass Transfer 63 (2013) 351–360
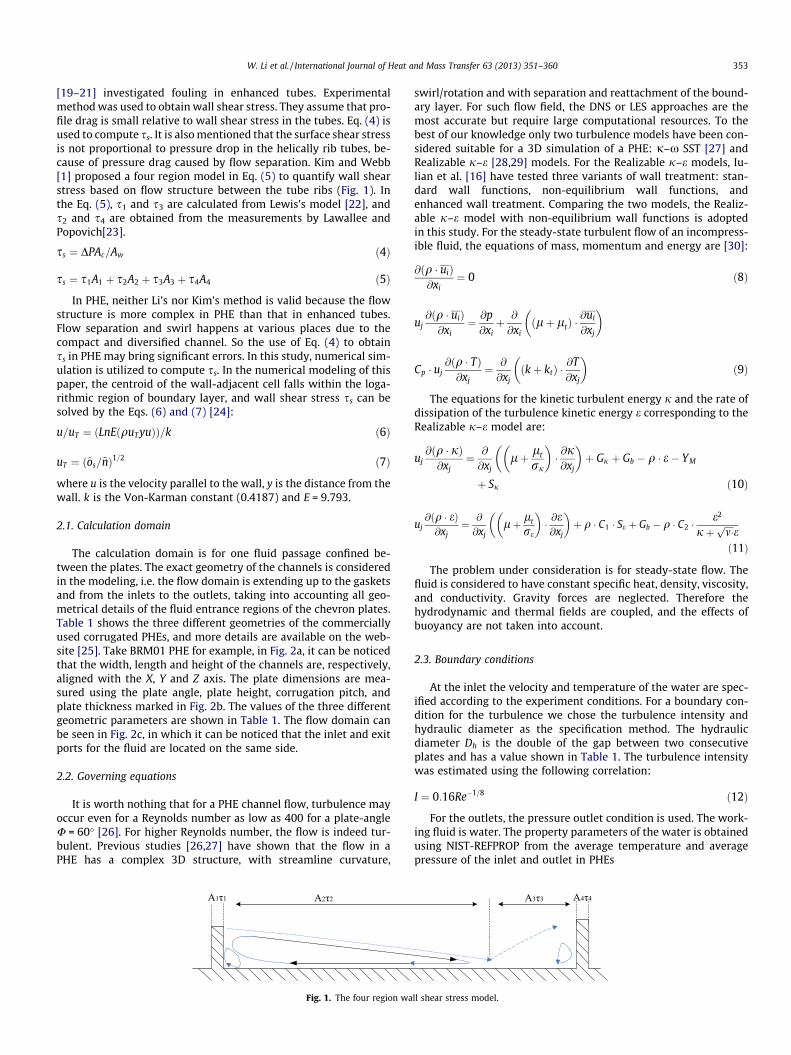
2.4. Grid sensitivity analysis
In general, an appropriate mesh for a simulation is dependenton the boundary conditions, geometry, and the chosen wall treat-ment. The Realizable j–e turbulence model states that, when usingthe wall functions, the first gird point should be in the logarithmicsublayer (30 < y+ < 300). In the case of a PHE modeling, it is extre-mely difficult to create a good mesh for the 30 < y+ < 300 condi-tions, because the geometry is complicated and the channel’s gap(the dimension along the Y axis) can be vary from 0.2 (where thealmost touching points are located) to 2.5 mm (the maximum dis-tance between the plates). The boundary layer thickness also variesand in some regions it presents flow separation and reattachmentphenomena.
In order to assess the influence of the gird resolution on thesolution, 10 grids were created and tested by meshing the volumeswith different interval sizes (1.5, 1.3, 1.2, 1.1, 1.0, 0.9, 0.7, 0.6, 0.5and 0.4 mm). For each grid, one turbulent simulation is performed(0.2 m/s; Re = 3600, temperatures at the inlets is 50 �C). The massconservation for the fluid and the overall energy balance for theheat exchanger were verified. These constrains were respectedfor all simulations with a maximum error of 0.08%. For the massconservation, any trend with the reduction of the mesh intervalcannot be observed. However, for the energy conservation, it wasnoticed that the energy balance improves with a decrease of themesh size. Furthermore, we compared the evolutions of the aver-age temperature of the fluid over the middle transversal sectionsalong the length of the plate. Fig. 3 present the results for the com-
parison at Re = 3600, for which the differences are more accentu-ated. In the simulated case, one can notice that 0.6 and 0.7 mminterval size grids give the most closed results. The maximum dif-ference between results obtained with the 0.6 and 0.7 mm sizegrids is 0.0038 K. Furthermore, the trend near 0.6 mm size grid issmoother than anywhere else. The differences between the predic-tions of the 0.6 mm and the 1 mm grids are quite large: 0.005 K.
(a)
(b)
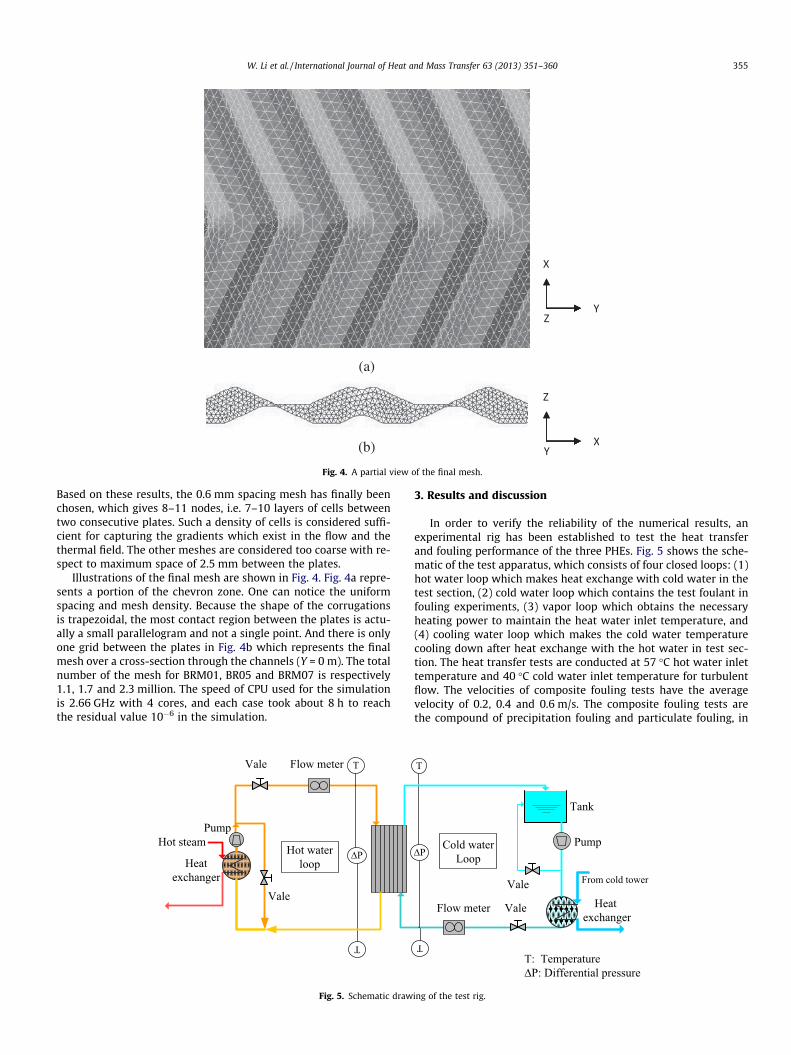
Fig. 4. A partial view of the final mesh.
W. Li et al. / International Journal of Heat and Mass Transfer 63 (2013) 351–360 355
Based on these results, the 0.6 mm spacing mesh has finally beenchosen, which gives 8–11 nodes, i.e. 7–10 layers of cells betweentwo consecutive plates. Such a density of cells is considered suffi-cient for capturing the gradients which exist in the flow and thethermal field. The other meshes are considered too coarse with re-spect to maximum space of 2.5 mm between the plates.
Illustrations of the final mesh are shown in Fig. 4. Fig. 4a repre-sents a portion of the chevron zone. One can notice the uniformspacing and mesh density. Because the shape of the corrugationsis trapezoidal, the most contact region between the plates is actu-ally a small parallelogram and not a single point. And there is onlyone grid between the plates in Fig. 4b which represents the finalmesh over a cross-section through the channels (Y = 0 m). The totalnumber of the mesh for BRM01, BR05 and BRM07 is respectively1.1, 1.7 and 2.3 million. The speed of CPU used for the simulationis 2.66 GHz with 4 cores, and each case took about 8 h to reachthe residual value 10�6 in the simulation.
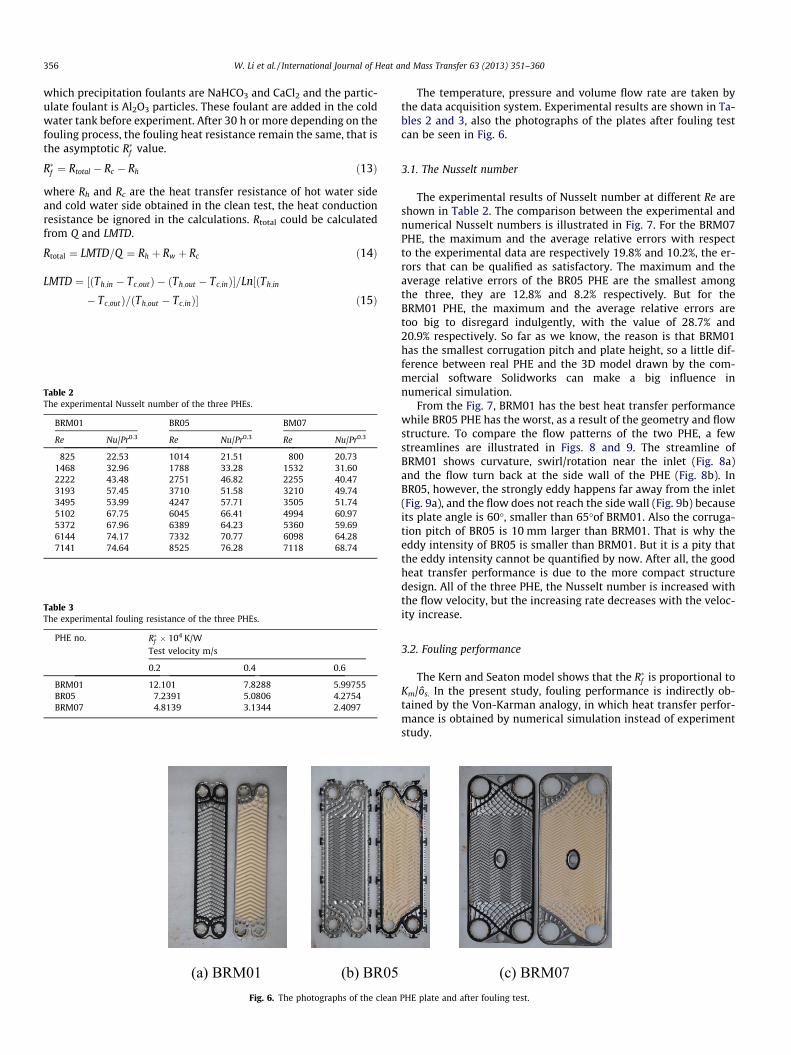
Fig. 5. Schematic draw
3. Results and discussion
In order to verify the reliability of the numerical results, anexperimental rig has been established to test the heat transferand fouling performance of the three PHEs. Fig. 5 shows the sche-matic of the test apparatus, which consists of four closed loops: (1)hot water loop which makes heat exchange with cold water in thetest section, (2) cold water loop which contains the test foulant infouling experiments, (3) vapor loop which obtains the necessaryheating power to maintain the heat water inlet temperature, and(4) cooling water loop which makes the cold water temperaturecooling down after heat exchange with the hot water in test sec-tion. The heat transfer tests are conducted at 57 �C hot water inlettemperature and 40 �C cold water inlet temperature for turbulentflow. The velocities of composite fouling tests have the averagevelocity of 0.2, 0.4 and 0.6 m/s. The composite fouling tests arethe compound of precipitation fouling and particulate fouling, in
ing of the test rig.
356 W. Li et al. / International Journal of Heat and Mass Transfer 63 (2013) 351–360
which precipitation foulants are NaHCO3 and CaCl2 and the partic-ulate foulant is Al2O3 particles. These foulant are added in the coldwater tank before experiment. After 30 h or more depending on thefouling process, the fouling heat resistance remain the same, that isthe asymptotic R�f value.
R�f ¼ Rtotal � Rc � Rh ð13Þ
where Rh and Rc are the heat transfer resistance of hot water sideand cold water side obtained in the clean test, the heat conductionresistance be ignored in the calculations. Rtotal could be calculatedfrom Q and LMTD.
Rtotal ¼ LMTD=Q ¼ Rh þ Rw þ Rc ð14Þ
LMTD ¼ ½ðTh;in � Tc;outÞ � ðTh;out � Tc;inÞ�=Ln½ðTh;in
� Tc;outÞ=ðTh;out � Tc;inÞ� ð15Þ
Table 2The experimental Nusselt number of the three PHEs.
BRM01 BR05 BM07
Re Nu/Pr0.3 Re Nu/Pr0.3 Re Nu/Pr0.3
825 22.53 1014 21.51 800 20.731468 32.96 1788 33.28 1532 31.602222 43.48 2751 46.82 2255 40.473193 57.45 3710 51.58 3210 49.743495 53.99 4247 57.71 3505 51.745102 67.75 6045 66.41 4994 60.975372 67.96 6389 64.23 5360 59.696144 74.17 7332 70.77 6098 64.287141 74.64 8525 76.28 7118 68.74
Table 3The experimental fouling resistance of the three PHEs.
PHE no. R�f � 104 K/WTest velocity m/s
0.2 0.4 0.6
BRM01 12.101 7.8288 5.99755BR05 7.2391 5.0806 4.2754BRM07 4.8139 3.1344 2.4097
Fig. 6. The photographs of the clean
The temperature, pressure and volume flow rate are taken bythe data acquisition system. Experimental results are shown in Ta-bles 2 and 3, also the photographs of the plates after fouling testcan be seen in Fig. 6.
3.1. The Nusselt number
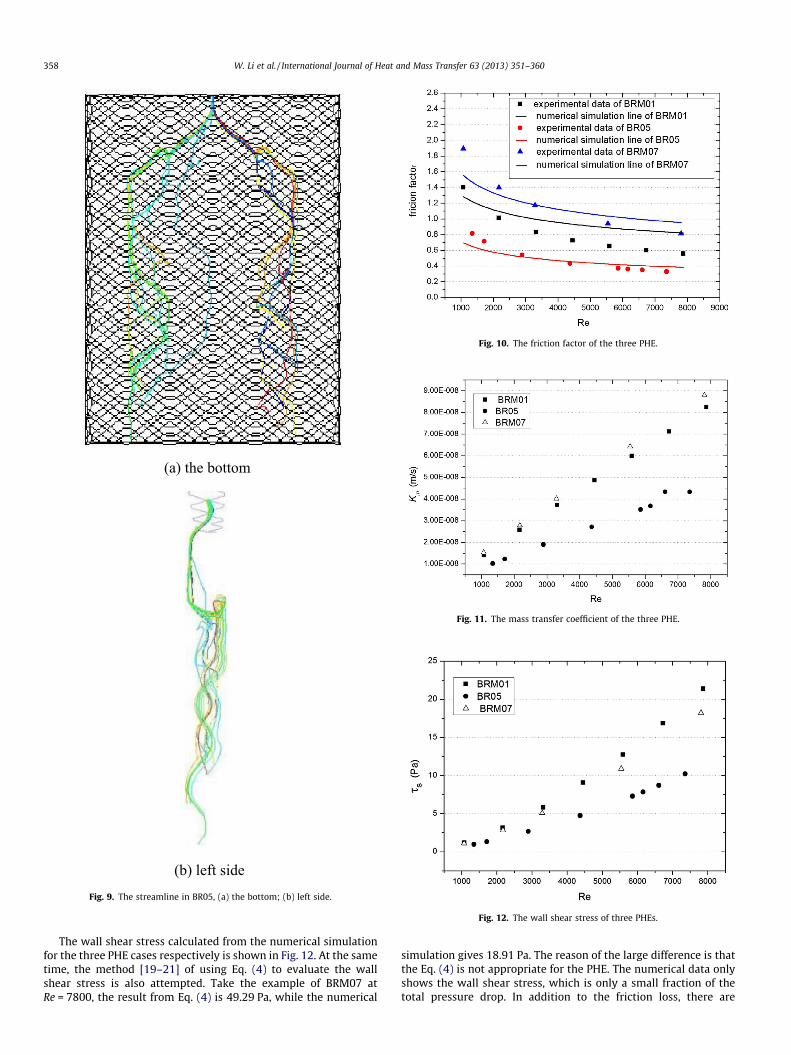
The experimental results of Nusselt number at different Re areshown in Table 2. The comparison between the experimental andnumerical Nusselt numbers is illustrated in Fig. 7. For the BRM07PHE, the maximum and the average relative errors with respectto the experimental data are respectively 19.8% and 10.2%, the er-rors that can be qualified as satisfactory. The maximum and theaverage relative errors of the BR05 PHE are the smallest amongthe three, they are 12.8% and 8.2% respectively. But for theBRM01 PHE, the maximum and the average relative errors aretoo big to disregard indulgently, with the value of 28.7% and20.9% respectively. So far as we know, the reason is that BRM01has the smallest corrugation pitch and plate height, so a little dif-ference between real PHE and the 3D model drawn by the com-mercial software Solidworks can make a big influence innumerical simulation.
From the Fig. 7, BRM01 has the best heat transfer performancewhile BR05 PHE has the worst, as a result of the geometry and flowstructure. To compare the flow patterns of the two PHE, a fewstreamlines are illustrated in Figs. 8 and 9. The streamline ofBRM01 shows curvature, swirl/rotation near the inlet (Fig. 8a)and the flow turn back at the side wall of the PHE (Fig. 8b). InBR05, however, the strongly eddy happens far away from the inlet(Fig. 9a), and the flow does not reach the side wall (Fig. 9b) becauseits plate angle is 60�, smaller than 65�of BRM01. Also the corruga-tion pitch of BR05 is 10 mm larger than BRM01. That is why theeddy intensity of BR05 is smaller than BRM01. But it is a pity thatthe eddy intensity cannot be quantified by now. After all, the goodheat transfer performance is due to the more compact structuredesign. All of the three PHE, the Nusselt number is increased withthe flow velocity, but the increasing rate decreases with the veloc-ity increase.
3.2. Fouling performance
The Kern and Seaton model shows that the R�f is proportional toKm/ôs. In the present study, fouling performance is indirectly ob-tained by the Von-Karman analogy, in which heat transfer perfor-mance is obtained by numerical simulation instead of experimentstudy.
PHE plate and after fouling test.
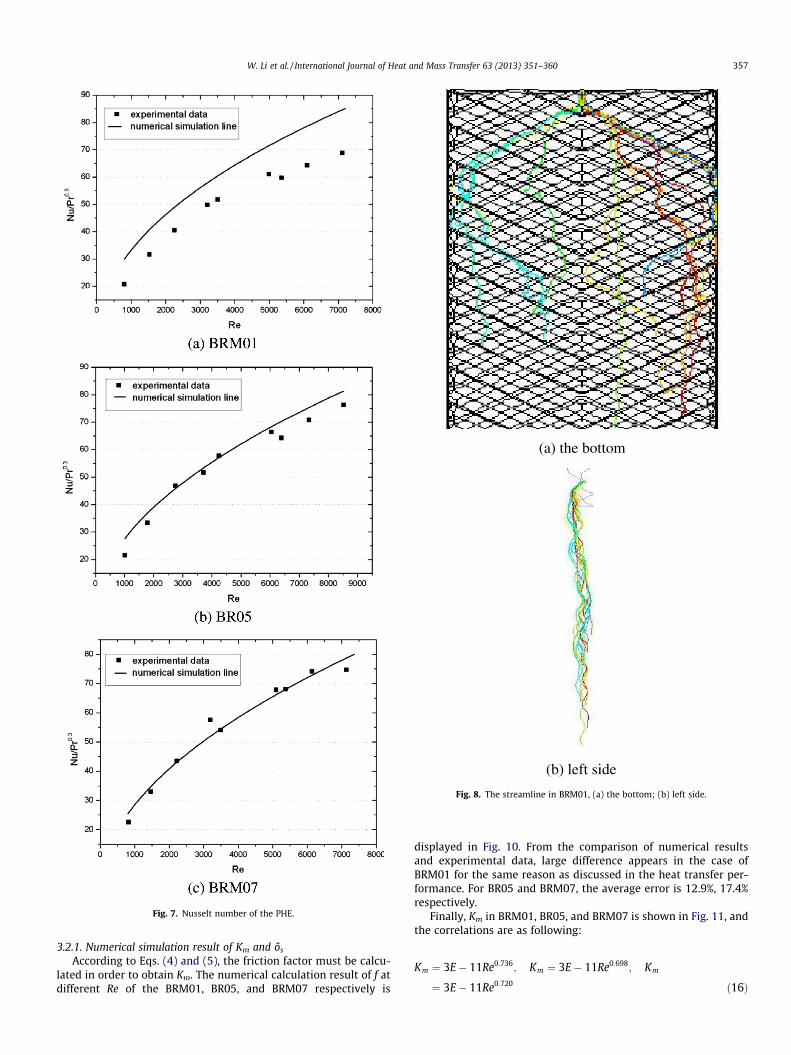
Fig. 7. Nusselt number of the PHE.
(a) the bottom
(b) left side
Fig. 8. The streamline in BRM01, (a) the bottom; (b) left side.
W. Li et al. / International Journal of Heat and Mass Transfer 63 (2013) 351–360 357
3.2.1. Numerical simulation result of Km and ôs
According to Eqs. (4) and (5), the friction factor must be calcu-lated in order to obtain Km. The numerical calculation result of f atdifferent Re of the BRM01, BR05, and BRM07 respectively is
displayed in Fig. 10. From the comparison of numerical resultsand experimental data, large difference appears in the case ofBRM01 for the same reason as discussed in the heat transfer per-formance. For BR05 and BRM07, the average error is 12.9%, 17.4%respectively.
Finally, Km in BRM01, BR05, and BRM07 is shown in Fig. 11, andthe correlations are as following:
Km ¼ 3E� 11Re0:736; Km ¼ 3E� 11Re0:698; Km
¼ 3E� 11Re0:720 ð16Þ
(a) the bottom
(b) left sideFig. 9. The streamline in BR05, (a) the bottom; (b) left side.
Fig. 10. The friction factor of the three PHE.
Fig. 11. The mass transfer coefficient of the three PHE.
Fig. 12. The wall shear stress of three PHEs.
358 W. Li et al. / International Journal of Heat and Mass Transfer 63 (2013) 351–360
The wall shear stress calculated from the numerical simulationfor the three PHE cases respectively is shown in Fig. 12. At the sametime, the method [19–21] of using Eq. (4) to evaluate the wallshear stress is also attempted. Take the example of BRM07 atRe = 7800, the result from Eq. (4) is 49.29 Pa, while the numerical
simulation gives 18.91 Pa. The reason of the large difference is thatthe Eq. (4) is not appropriate for the PHE. The numerical data onlyshows the wall shear stress, which is only a small fraction of thetotal pressure drop. In addition to the friction loss, there are
W. Li et al. / International Journal of Heat and Mass Transfer 63 (2013) 351–360 359
additional pressure drop due to the streamline curvature, swirl/rotation, separation, and reattachment of the boundary layer inthe PHE channel, and the sudden expansion or contraction at theentrance or exit.
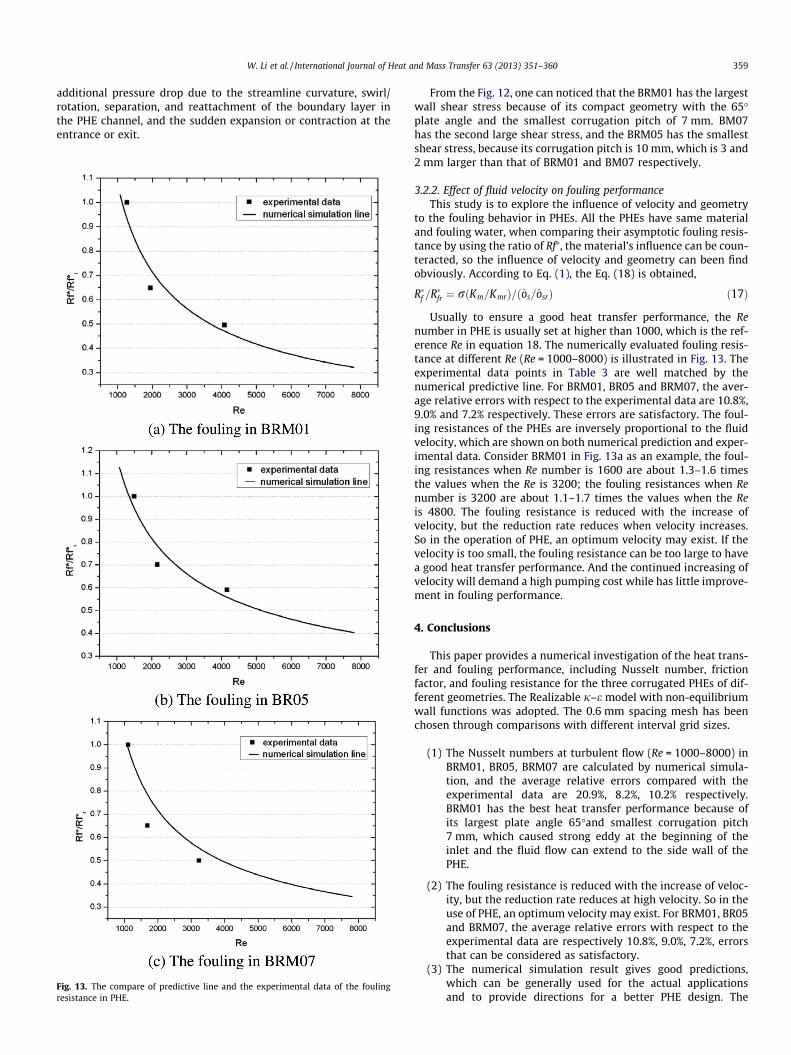
Fig. 13. The compare of predictive line and the experimental data of the foulingresistance in PHE.
From the Fig. 12, one can noticed that the BRM01 has the largestwall shear stress because of its compact geometry with the 65�plate angle and the smallest corrugation pitch of 7 mm. BM07has the second large shear stress, and the BRM05 has the smallestshear stress, because its corrugation pitch is 10 mm, which is 3 and2 mm larger than that of BRM01 and BM07 respectively.
3.2.2. Effect of fluid velocity on fouling performanceThis study is to explore the influence of velocity and geometry
to the fouling behavior in PHEs. All the PHEs have same materialand fouling water, when comparing their asymptotic fouling resis-tance by using the ratio of Rf⁄, the material’s influence can be coun-teracted, so the influence of velocity and geometry can been findobviously. According to Eq. (1), the Eq. (18) is obtained,
R�f =R�fr ¼ rðKm=KmrÞ=ðos=osrÞ ð17Þ
Usually to ensure a good heat transfer performance, the Renumber in PHE is usually set at higher than 1000, which is the ref-erence Re in equation 18. The numerically evaluated fouling resis-tance at different Re (Re = 1000–8000) is illustrated in Fig. 13. Theexperimental data points in Table 3 are well matched by thenumerical predictive line. For BRM01, BR05 and BRM07, the aver-age relative errors with respect to the experimental data are 10.8%,9.0% and 7.2% respectively. These errors are satisfactory. The foul-ing resistances of the PHEs are inversely proportional to the fluidvelocity, which are shown on both numerical prediction and exper-imental data. Consider BRM01 in Fig. 13a as an example, the foul-ing resistances when Re number is 1600 are about 1.3–1.6 timesthe values when the Re is 3200; the fouling resistances when Renumber is 3200 are about 1.1–1.7 times the values when the Reis 4800. The fouling resistance is reduced with the increase ofvelocity, but the reduction rate reduces when velocity increases.So in the operation of PHE, an optimum velocity may exist. If thevelocity is too small, the fouling resistance can be too large to havea good heat transfer performance. And the continued increasing ofvelocity will demand a high pumping cost while has little improve-ment in fouling performance.
4. Conclusions
This paper provides a numerical investigation of the heat trans-fer and fouling performance, including Nusselt number, frictionfactor, and fouling resistance for the three corrugated PHEs of dif-ferent geometries. The Realizable j–e model with non-equilibriumwall functions was adopted. The 0.6 mm spacing mesh has beenchosen through comparisons with different interval grid sizes.
(1) The Nusselt numbers at turbulent flow (Re = 1000–8000) inBRM01, BR05, BRM07 are calculated by numerical simula-tion, and the average relative errors compared with theexperimental data are 20.9%, 8.2%, 10.2% respectively.BRM01 has the best heat transfer performance because ofits largest plate angle 65�and smallest corrugation pitch7 mm, which caused strong eddy at the beginning of theinlet and the fluid flow can extend to the side wall of thePHE.
(2) The fouling resistance is reduced with the increase of veloc-ity, but the reduction rate reduces at high velocity. So in theuse of PHE, an optimum velocity may exist. For BRM01, BR05and BRM07, the average relative errors with respect to theexperimental data are respectively 10.8%, 9.0%, 7.2%, errorsthat can be considered as satisfactory.
(3) The numerical simulation result gives good predictions,which can be generally used for the actual applicationsand to provide directions for a better PHE design. The
360 W. Li et al. / International Journal of Heat and Mass Transfer 63 (2013) 351–360
numerical analysis is verified by experimental study. Theinvestigation significantly simplifies the fouling analysis ofcomplex flow fields and can be used to assess the foulingpotential of corrugated plate heat exchangers.
Acknowledgments
This work was supported by the National Science Foundation ofChina (No. 51210011 and No. 51076070) and the National KeyTechnology R&D Program ‘‘Highly-Effective Energy-Saving Tech-niques for Combined Buildings’’ (2012BAA10B01). We would liketo delicate this work to the memory of Dr. Ralph Webb.
References
[1] R.L. Webb, N.H. Kim, Principles of Enhanced Heat Transfer, second ed., Taylor &Francis Group, New York, 2004.
[2] R.L. Webb, W. Li, Fouling in enhanced tubes using cooling tower water: part I:long-term fouling data, Int. J. Heat Mass Transfer 43 (2000) 3567–3578.
[3] Wei Li, The internal surface area basis, a key issue of modeling fouling inenhanced heat transfer tubes, Int. J. Heat Mass Transfer 46 (2003) 4345–4349.
[4] E. Naess, T. Slungaard, O.K. Sonju, Experimental investigation of particulatefouling in waste heat recovery from the aluminum industry, in: The 13thInternational Heat and Mass Transfer Conference in Sydney, 2006.
[5] Yong Yang, Hyoungsup Kim, Alexander Fridman, Young I. Cho, Effect of aplasma-assisted self-cleaning filter on the performance of PWT coil for themitigation of mineral fouling in a heat exchanger, Int. J. Heat Mass Transfer 53(2010) 412–422.
[6] B. Merheb, G. Nassar, B. Nongaillard, G. Delaplace, J.C. Leuliet, Design andperformance of a low-frequency non-intrusive acoustic technique formonitoring fouling in plate heat exchangers, J. Food Eng. 82 (2007) 518–527.
[7] Y. Mahdi, A. Mouheb, L. Oufer, A dynamic model for milk fouling in a plate heatexchanger, Appl. Math. Model. 33 (2009) 648–662.
[8] Chengwang Lei, Zhongxiao Peng, Thomas Day, Xinping Yan, Xiuqin Bai,Chengqing Yuan, Experimental observation of surface morphology effect oncrystallization fouling inplate heat exchangers, Int. Commun. Heat MassTransfer 38 (2011) 25–30.
[9] S. Jun, V.M. Puri, R.F. Roberts, A dynamic model for thermal performance ofplate heat exchangers, Trans. ASAE 47 (2003) 213–222.
[10] M.C. Georgiadis, S. Macchietto, Dynamic modelling and simulation of plateheat exchangers under milk fouling, Chem. Eng. Sci. 55 (2000) 1605–1619.
[11] M. Izadi, D.K. Aidun, P. Marzocca, H. Lee, Integrated experimental investigationof seawater composite fouling effect on the 90/10 Cu/Ni tube, Appl. Therm.Eng. J. 31 (2011) 2464–2473.
[12] S. Balasubramanian, V.M. Puri, Thermal energy savings in pilot-scale plate heatexchanger system during product processing using modified surfaces, J. FoodEng. 91 (2009) 608–611.
[13] A. Lozano, F. Barreras, N. Fueyo, S. Santodomingo, The flow in an oil/waterplate heat exchanger for the automotive industry, Appl. Therm. Eng. 28 (2008)1109–1117.
[14] F.C.C. Galeazzo, R.Y. Miura, J.A.W. Gut, C.C. Tadini, Experimental and numericalheat transfer in a plate heat exchanger, Chem. Eng. Sci. 61 (2006) 7133–7138.
[15] T. Kho, H. Muller-Steenhagen, An experimental and numerical investigation ofheat transfer fouling and fluid flow in flat plate heat exchangers, Inst. Chem.Eng. Trans. IChemE 77 (1999) 124–130.
[16] Iulian Gherasim, Nicolas Galanis, Cong Tam Nguyen, Heat transfer and fluidflow in a plate heat exchanger Part II: assessment of laminar and two-equationturbulent models, Int. J. Therm. Sci. 50 (2011) 1499–1511.
[17] Maria Valeria De Bonis, Gianpaolo Ruocco, Conjugate fluid flow and kineticsmodeling for heat exchanger fouling simulation, Int. J. Therm. Sci. 48 (2009)2006–2012.
[18] D.Q. Kern, R.A.A. Seaton, Theoretical analysis of thermal surface fouling, Br.Chem. Eng. 4 (1959) 258–262.
[19] Wei Li, Guan-qiu Li, Zhengjiang Zhang, Xu Zhiming, Modeling cooling towerfouling in helical- rib tubes based on Von-Karman analogy, Int. J. Heat MassTransfers 53 (2010) 2715–2721.
[20] Wei Li, Guan-qiu Li, Zhike Wang, Zhengjiang Zhang, Xu Zhiming, Analysis ofcooling tower fouling in enhanced tubes based on Prandtl analogy, J. EnhancedHeat Transfer 18 (2011) 513–526.
[21] Wei Li, Guan-qiu Li, Zhengjiang Zhang, Zhiming Xu, Analysis of foulingcharacteristic in enhanced tubes using multiple analogies, in: The 14thInternational Heat Transfer Congress, IHTC14-22529, Washington D.C., USA,2010.
[22] M.J. Lewis, An elementary analysis for predicting the momentum and heattransfer characteristics of a hydraulically rough surface, ASME J. Heat Transfer97 (1975) 249–254.
[23] H.C. Lavallee, A.T. Popovich, Fluid flow near roughness elements investigatedby photolysis method, Chem. Eng. Sci. 29 (1974) 49–59.
[24] Frank M. White, Fluid Mechanics, McGraw Hill Higher Education Press, NewYork, 2003. pp. 356–360.
[25] http://www.shnanhua.zcom/en/proshow.asp?classid=16&id=447.[26] W.W. Focke, J. Zachariades, I. Olivier, The effect of the corrugation inclinat
handbook ion angle on the thermo-hydraulic performance of plate heatexchangers, Int. J. Heat Mass Transfer 28 (1985) 1469–1479.
[27] A.G. Kanaris, A.A. Mouza, S.V. Paras, Flow and heat transfer prediction in acorrugated plate heat exchanger using a CFD code, Chem. Eng. Technol. 29(2006) 923–930.
[28] Y.C. Tsai, F.B. Liu, P.T. Shen, Investigations of the pressure drop and flowdistribution in a chevron-type plate heat exchanger, Int. Commun. Heat MassTransfer 36 (2009) 574–578.
[29] S. Jain, A. Joshi, P.K. Bansal, A new approach to numerical simulation of smallsized plate heat exchangers with chevron plates, J. Heat Transfer 129 (2007)291–297.
[30] W.J. Minkowycz, E.M. Sparrow, J.Y. Murthy, Handbook of Numerical HeatTransfer, Wiley Press, Hoboken, 2006. pp. 191–224.


