Embed Size (px)
Citation preview

lable at ScienceDirect
European Journal of Mechanics A/Solids 29 (2010) 119–131
Contents lists avai
European Journal of Mechanics A/Solids
journal homepage: www.elsevier .com/locate/e jmsol
Numerical homogenization of cracking processes in thin fibre-epoxy layers
M.V. Cid Alfaro a, A.S.J. Suiker a,*, C.V. Verhoosel a, R. de Borst b
a Delft University of Technology, Kluyverweg 1, P.O. Box 5058, NL-2600 GB, Delft, The Netherlandsb Eindhoven University of Technology, P.O. Box 513, NL-5600 MB, Eindhoven, The Netherlands
a r t i c l e i n f o
Article history:Received 18 May 2009Accepted 30 September 2009Available online 9 October 2009
Keywords:Adhesive layersCohesive zone modelDiscrete fractureFibre debondingMatrix cracking
* Corresponding author. Tel.: þ31 15 2781629; fax:E-mail address: [email protected] (A.S.J. Suike
0997-7538/$ – see front matter � 2009 Elsevier Masdoi:10.1016/j.euromechsol.2009.09.006
a b s t r a c t
Discrete microscale fracture processes in thin fibre-epoxy layers are connected to a mesoscale traction-separation law through a numerical homogenization framework. The microscale fracture processes arestudied with the finite element method, where cracking within the epoxy and debonding between fibresand epoxy is simulated by placing interface elements furnished with a mixed-mode interface damagemodel in between the continuum elements modelling the fibres and epoxy. It is demonstrated how theeffective traction-separation response and the corresponding microscale fracture patterns undermesoscale tensile conditions depend on the sample size, the fibre volume fraction and the presence ofimperfections.
� 2009 Elsevier Masson SAS. All rights reserved.
1. Introduction
Finite element simulations serve as an important tool forstudying the complex failure behaviour of fibre-epoxy systems andoptimizing their performance in (macroscopic) engineering appli-cations. However, the execution of a direct numerical simulation onthe mechanical response of an engineering structure, where all thedetails of the underlying microstructure are incorporated, requiresa very fine finite element mesh, thus leading to an impracticalamount of computational time. A more efficient approach for thispurpose is to use material models that represent the mechanicalresponse of the underlying microstructure in an effective fashion,as derived by means of analytical and/or numerical homogeniza-tion techniques.
Analytical homogenization techniques often lead to computa-tionally efficient models. Nevertheless, these models typically failto describe the effective material response accurately when theunderlying microstructure is complex and is characterised bya strongly non-linear constitutive behaviour. Under these condi-tions the use of a numerical homogenization method is recom-mendable. In the case of continuum models, numericalhomogenization is based on computationally averaging thegenerated microstructural stress and deformation over a represen-tative volume element (RVE), thereby implicitly (i.e., not in closed-form) establishing an effective, mesoscopic constitutive relation
þ31 15 2611465.r).
son SAS. All rights reserved.
between the average stress and deformation. Over the past twodecades, various approaches have been developed along this line(Suquet, 1985; Guedes and Kikuchi, 1990; Ghosh et al., 1995; Ghoshet al., 1996; Miehe et al., 1999; Kouznetsova et al., 2001; Kouznet-sova et al., 2002; Miehe and Koch, 2002; Pelissou et al., 2009).These approaches rely on a local periodicity of the microstructurein the direct neighborhood of the RVE, but do not impose period-icity over the complete macroscopic structure under consideration(i.e., global periodicity is not required). The macroscopic structurethus contains mesoscopic material points for which the specificmicroscopic RVEs are assumed to be periodic only in a small vicinityof the material points.
Although numerical homogenization approaches for bulkcontinuum problems have been reported widely in the literature,numerical homogenization frameworks for thin layer problems arelacking. Only recently a first step into this direction has been madeby Geubelle and co-workers (Matous et al., 2008; Kulkarni et al.,2009), where a mesoscale cohesive zone formulation was derivedfrom numerically homogenizing the microscale failure processes ina thin, heterogeneous adhesive, as simulated with an isotropicdamage model. The present paper also focuses on the derivation ofa mesoscale cohesive zone model from the numerical homogeni-zation of microscale fracture processes in a thin layer. Thehomogenization framework developed here shows similaritieswith that of Geubelle and co-workers (Matous et al., 2008; Kulkarniet al., 2009). It is essentially obtained as a special case of thenumerical homogenization of a bulk material sample loaded underperiodic boundary conditions, by collapsing the mesoscale thick-ness of the bulk sample into a (cohesive) surface, but the derivation
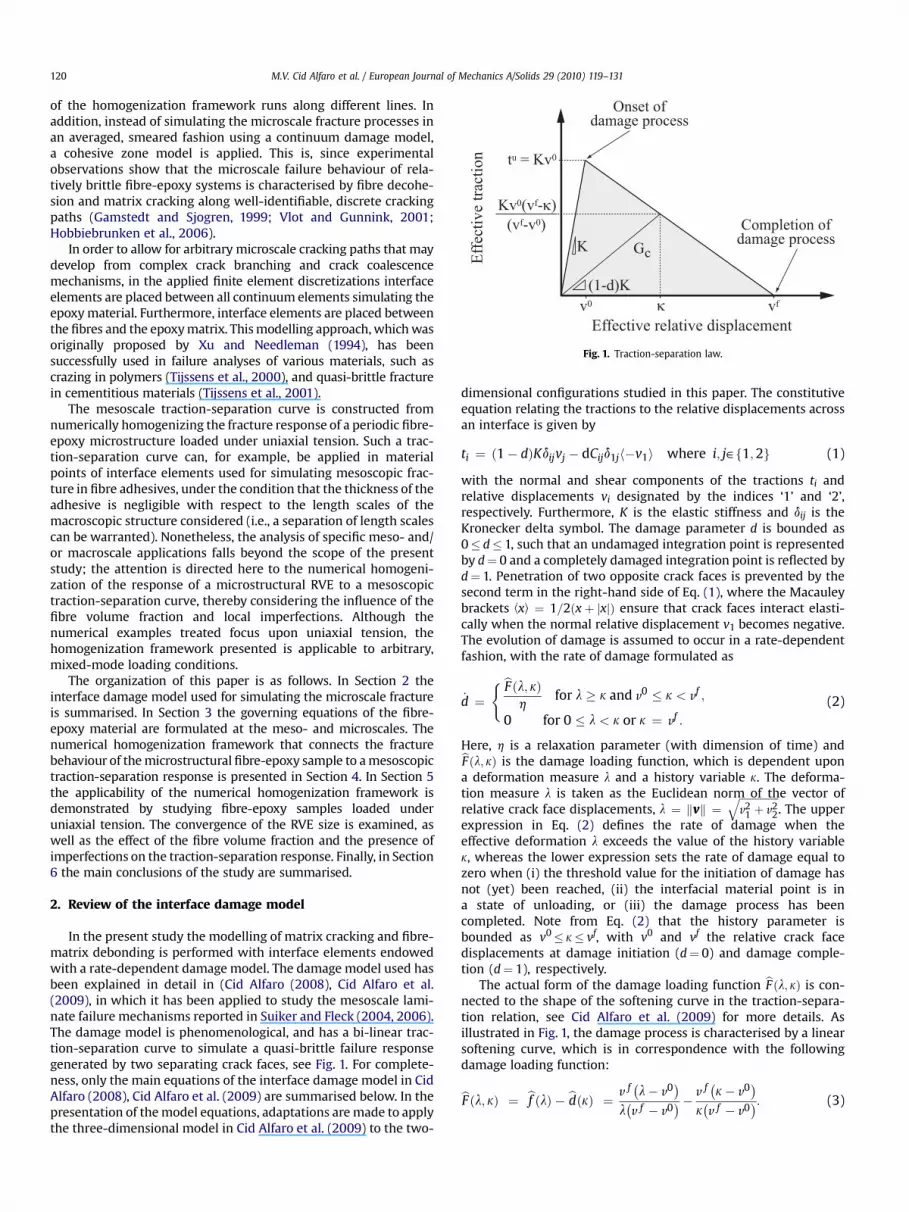
Fig. 1. Traction-separation law.
M.V. Cid Alfaro et al. / European Journal of Mechanics A/Solids 29 (2010) 119–131120
of the homogenization framework runs along different lines. Inaddition, instead of simulating the microscale fracture processes inan averaged, smeared fashion using a continuum damage model,a cohesive zone model is applied. This is, since experimentalobservations show that the microscale failure behaviour of rela-tively brittle fibre-epoxy systems is characterised by fibre decohe-sion and matrix cracking along well-identifiable, discrete crackingpaths (Gamstedt and Sjogren, 1999; Vlot and Gunnink, 2001;Hobbiebrunken et al., 2006).
In order to allow for arbitrary microscale cracking paths that maydevelop from complex crack branching and crack coalescencemechanisms, in the applied finite element discretizations interfaceelements are placed between all continuum elements simulating theepoxy material. Furthermore, interface elements are placed betweenthe fibres and the epoxy matrix. This modelling approach, which wasoriginally proposed by Xu and Needleman (1994), has beensuccessfully used in failure analyses of various materials, such ascrazing in polymers (Tijssens et al., 2000), and quasi-brittle fracturein cementitious materials (Tijssens et al., 2001).
The mesoscale traction-separation curve is constructed fromnumerically homogenizing the fracture response of a periodic fibre-epoxy microstructure loaded under uniaxial tension. Such a trac-tion-separation curve can, for example, be applied in materialpoints of interface elements used for simulating mesoscopic frac-ture in fibre adhesives, under the condition that the thickness of theadhesive is negligible with respect to the length scales of themacroscopic structure considered (i.e., a separation of length scalescan be warranted). Nonetheless, the analysis of specific meso- and/or macroscale applications falls beyond the scope of the presentstudy; the attention is directed here to the numerical homogeni-zation of the response of a microstructural RVE to a mesoscopictraction-separation curve, thereby considering the influence of thefibre volume fraction and local imperfections. Although thenumerical examples treated focus upon uniaxial tension, thehomogenization framework presented is applicable to arbitrary,mixed-mode loading conditions.
The organization of this paper is as follows. In Section 2 theinterface damage model used for simulating the microscale fractureis summarised. In Section 3 the governing equations of the fibre-epoxy material are formulated at the meso- and microscales. Thenumerical homogenization framework that connects the fracturebehaviour of the microstructural fibre-epoxy sample to a mesoscopictraction-separation response is presented in Section 4. In Section 5the applicability of the numerical homogenization framework isdemonstrated by studying fibre-epoxy samples loaded underuniaxial tension. The convergence of the RVE size is examined, aswell as the effect of the fibre volume fraction and the presence ofimperfections on the traction-separation response. Finally, in Section6 the main conclusions of the study are summarised.
2. Review of the interface damage model
In the present study the modelling of matrix cracking and fibre-matrix debonding is performed with interface elements endowedwith a rate-dependent damage model. The damage model used hasbeen explained in detail in (Cid Alfaro (2008), Cid Alfaro et al.(2009), in which it has been applied to study the mesoscale lami-nate failure mechanisms reported in Suiker and Fleck (2004, 2006).The damage model is phenomenological, and has a bi-linear trac-tion-separation curve to simulate a quasi-brittle failure responsegenerated by two separating crack faces, see Fig. 1. For complete-ness, only the main equations of the interface damage model in CidAlfaro (2008), Cid Alfaro et al. (2009) are summarised below. In thepresentation of the model equations, adaptations are made to applythe three-dimensional model in Cid Alfaro et al. (2009) to the two-
dimensional configurations studied in this paper. The constitutiveequation relating the tractions to the relative displacements acrossan interface is given by
ti ¼ ð1� dÞKdijvj � dCijd1jh�v1i where i; j˛f1;2g (1)
with the normal and shear components of the tractions ti andrelative displacements vi designated by the indices ‘1’ and ‘2’,respectively. Furthermore, K is the elastic stiffness and dij is theKronecker delta symbol. The damage parameter d is bounded as0� d� 1, such that an undamaged integration point is representedby d¼ 0 and a completely damaged integration point is reflected byd¼ 1. Penetration of two opposite crack faces is prevented by thesecond term in the right-hand side of Eq. (1), where the Macauleybrackets CxD ¼ 1=2ðxþ jxjÞ ensure that crack faces interact elasti-cally when the normal relative displacement v1 becomes negative.The evolution of damage is assumed to occur in a rate-dependentfashion, with the rate of damage formulated as
_d ¼( bF ðl; kÞ
hfor l � k and v0 � k < vf ;
0 for 0 � l < k or k ¼ vf :
(2)
Here, h is a relaxation parameter (with dimension of time) andbF ðl; kÞ is the damage loading function, which is dependent upona deformation measure l and a history variable k. The deforma-tion measure l is taken as the Euclidean norm of the vector ofrelative crack face displacements, l ¼ kvk ¼
ffiffiffiffiffiffiffiffiffiffiffiffiffiffiffiv2
1 þ v22
q. The upper
expression in Eq. (2) defines the rate of damage when theeffective deformation l exceeds the value of the history variablek, whereas the lower expression sets the rate of damage equal tozero when (i) the threshold value for the initiation of damage hasnot (yet) been reached, (ii) the interfacial material point is ina state of unloading, or (iii) the damage process has beencompleted. Note from Eq. (2) that the history parameter isbounded as v0� k� vf, with v0 and vf the relative crack facedisplacements at damage initiation (d¼ 0) and damage comple-tion (d¼ 1), respectively.
The actual form of the damage loading function bF ðl; kÞ is con-nected to the shape of the softening curve in the traction-separa-tion relation, see Cid Alfaro et al. (2009) for more details. Asillustrated in Fig. 1, the damage process is characterised by a linearsoftening curve, which is in correspondence with the followingdamage loading function:
bF ðl; kÞ ¼ bf ðlÞ � bdðkÞ ¼ v f�l� v0
�l�v f � v0
�� v f�k� v0
�k�v f � v0
�: (3)

Fig. 2. Mesoscopic domain UM (left) and microscopic domain Um (right). The mesoscopic domain is crossed by an adhesive layer GMcoh. The failure behaviour in a material point of the
adhesive layer is connected to the failure response of the microscopic domain (i.e., a fibre-epoxy sample), as characterised by cracking across the domain width b along the internalboundary GM
coh. The boundary conditions at the outer edges Gm of the microscopic domain are periodic.
M.V. Cid Alfaro et al. / European Journal of Mechanics A/Solids 29 (2010) 119–131 121
It can be observed from Eq. (2) that in the limit case of therelaxation parameter going to zero, h / 0, the rate-independentloading condition is recovered: bF ðl; kÞ ¼ 0, which, as shown by Eq.(3), corresponds to l¼ k.
In order to simulate fracture processes of arbitrary mode-mixity,the relative displacements at damage initiation, v0, and damagecompletion, vf, are made dependent of a mode-mixity parameter b,see also Turon et al. (2006), i.e.,
b ¼ v2
v2 þ hv1i: (4)
In correspondence with this expression, under pure mode Iloading conditions v2¼ 0 and thus b¼ 0, whereas under pure modeII loading conditions v1¼0 and thus b¼ 1. The functions v0 ¼ bv0ðbÞand vf ¼ bvf ðbÞ can be computed adopting an energy-based, mixed-mode failure criterion from linear elastic fracture mechanics, seeCid Alfaro et al. (2009), Turon et al. (2006). For this purpose,a fracture criterion is taken that is often used to characterize mixed-mode toughness data for brittle interfacial fracture (Hutchinsonand Suo, 1992; Jensen, 1990):
GI
GI;cþ GII
GII;c¼ 1; (5)
Fig. 3. Two different boundary conditions for the
with GI and GII the mode I and mode II energy release rates, and GI,c
and GII,c the toughnesses under pure mode I and pure mode IIloading conditions respectively. From Eqs. (4) and (5), the effectiverelative displacements at damage initiation and damage comple-tion can be, respectively, computed as
v0 ¼ bv0ðbÞ ¼ v01v0
2
ffiffiffiffiffiffiffiffiffiffiffiffiffiffiffiffiffiffiffiffiffiffiffiffiffiffiffiffiffiffiffiffiffiffiffiffiffiffiffiffiffiffiffiffi1þ 2b2 � 2b�
bv01
�2þ�ð1� bÞv0
2
�2
vuut ; (6)
and
v f ¼bv f ðbÞ ¼2�
1þ2b2�2b�
Kv0
" ð1�bÞ2
GI;c
!þ
b2
GII;c
!#�1
; (7)
where v01 ¼ tu
1=K and v02 ¼ tu
2=K are the relative displacements atwhich damage initiates under pure mode I and pure mode IIloading conditions, respectively, and tu
1 and tu2 are the ultimate
tractions under pure mode I and pure mode II conditions,respectively. More details about the above interface damagemodel and its numerical discretization can be found in Cid Alfaroet al. (2009).
microscale RVE, as indicated at node nr. 2.

Fig. 4. Geometry and boundary conditions of fibre-epoxy samples with a fibre volume fraction of 0.3. The diameter of the glass fibres is 10 mm.
M.V. Cid Alfaro et al. / European Journal of Mechanics A/Solids 29 (2010) 119–131122
3. Micro and mesoscale modelling
Consider a mesoscopic domain UM3R2 with an externalboundary GM, see Fig. 2. The external boundary is subjected todisplacements uM and tractions tM at GM
u and GMt , respectively. The
mesoscopic domain is crossed by an adhesive layer GMcoh. The
response in a material point of the adhesive layer is connected tothe lower-scale response of a heterogeneous, microscopic domainUm3R2. The microscopic domain is represented by a fibre-epoxysample of width b. Fracture in the microscopic domain occursalong the cracking path Gm
coh. The boundary conditions at the outeredges Gm of the microscopic domain are assumed to be periodic.Further, for establishing a connection between formulations at themeso- and microscale levels, it is assumed that the microscopicdomain can be considered as a representative volume element(RVE).
3.1. Governing equations at the mesoscale
The equilibrium condition for an arbitrary material point in themesoscopic domain UM depicted in Fig. 2 is
sMij;j ¼ 0 in UM
; (8)
where sijM represents the Cauchy stress, with the superscript M
denoting the mesoscopic character of the variable. The tensorindices can have the values i, j ˛ {1,2}, in correspondence with the
Fig. 5. Geometry and boundary conditions of fibre-epoxy samples with a
two-dimensional, orthogonal coordinate system shown in Fig. 2.Note that, for reasons of convenience, the body forces have beenomitted in Eq. (8). In addition, the boundary conditions for themesoscopic domain are given bysM
ij nj ¼ tMi on GM
t ; (9)
uMi ¼ buM
i on GMu ; (10)
where tiM and buM
i respectively are the tractions and displacements,as prescribed on the corresponding external boundaries GM
t and GMu
with outward normal ni. Note that the total external boundary isgiven by GM ¼ GM
t WGMu . The cohesive surface GM
coh can be consid-ered as an internal boundary, for which the tractions tM
i are relatedto the Cauchy stress sM
ij through the equilibrium condition
sMij nj ¼ tM
i on GMcoh: (11)
Applying the standard variational method, the principle ofvirtual work at the mesoscale, under the neglection of body forces,leads to the following expressionZUM
sMij d3M
ij dUMþZ
GMcoh
tMi dEuM
i FdGMcoh
|fflfflfflfflfflfflfflfflfflfflfflfflfflfflfflffl{zfflfflfflfflfflfflfflfflfflfflfflfflfflfflfflffl}dWM
coh
¼Z
GMt
tMi duM
i dGMt ; (12)
fibre volume fraction of 0.5. The diameter of the glass fibres is 10 mm.

Table 1Number of elements used for samples of different size and volume fraction Vf, seeFigs. 4 and 5.
Sample shape Vf Continuumelements
Fibre-epoxyint. elems.
Epoxyint. elems.
Total
Square 0.3 5194 772 5001 10967Square 0.5 9906 1679 6747 18332Rectangular 0.3 10390 1549 10035 21974Rectangular 0.5 19720 3360 13409 36489
Table 2Material properties of the fibre-epoxy sample.
Parameter(s) Value(s)
FibreYoung’s modulus E¼ 86.9 [GPa]Poisson’s ratio n¼ 0.23EpoxyYoung’s modulus E¼ 3.9 [GPa]Poisson’s ratio n¼ 0.37Fibre-epoxy interface & epoxy interfaceElastic stiffness K¼ 1� 108 [N/mm3]Ultimate normal and shear strengths tu
i ¼ tu2 ¼ tu
adh ¼ 50 ½MPa�Mode I and mode II fracture toughnesses GI,c¼GII,c¼Gc,adh¼ 0.5 [N/mm]Relaxation parameter h¼ 0.002 [s]
M.V. Cid Alfaro et al. / European Journal of Mechanics A/Solids 29 (2010) 119–131 123
which holds for any admissible variational mesoscale displacementduM
i . Here, 3Mij represents the mesoscopic engineering strain, and
the symbol E�F¼ ð�þ���Þ denotes the jump of a quantity (i.e., thedisplacement) across the cohesive surface, with � designating theupper and lower faces of the cohesive surface. As can be observedfrom the above expression, the quantity dWM
coh represents thevirtual work of the cohesive surface.
3.2. Governing equations at the microscale
Similar to the mesoscale equilibrium condition (8), the equi-librium requirement for a material point within the microscopicRVE Um shown in Fig. 2 can be expressed as
smij;j ¼ 0 in Um
; (13)
where the boundary conditions are
smij nj ¼ ti on Gm
t ; (14)
Displacement jump [u2]M [mm]
0 0.01 0.02 0.030
10
20
30
40
50
60a
t noitcart lamro
N2M
]aPM[
Rectangular-shaped specimen
Squared-shaped specimen
Fig. 6. Mesoscopic traction-separation response for the square-shaped and rectangular-shafraction Vf¼ 0.5.
ui ¼ bui on Gmu : (15)
Here, ti and bui are the tractions and displacements at the cor-responding external boundaries Gm
t and Gmu of the microscopic RVE,
with the superscript m indicating the microscopic character ofthese parameters. The total external boundary of the RVE is givenby Gm ¼ Gm
t WGmu . In order to keep the notation in forthcoming
sections concise, the index m will not be used for all microscalevariables introduced in this section, i.e., note that it has beenomitted for the tractions ti and the displacements ui in Eqs. (14) and(15). As a next step, equilibrium at the microscale cohesive surfaceGm
coh is prescribed by
smij nj ¼ ti on Gm
coh; (16)
Similar to Eq. (12), the principle of virtual work at the microscaleleads toZUm
smij d3m
ij dUm þZ
Gmcoh
tidEuiFdGmcoh ¼
ZGm
t
tiduidGmt ; (17)
which must be satisfied for any admissible variational microscaledisplacement dui. In the above expression, 3m
ij is the microscalestrain tensor.
4. Connection between the microscale and mesoscale
In order to establish a connection between the responses of themicroscale and mesoscale domains shown in Fig. 2, the microscaledisplacement field ui is expressed in terms of the mesoscaledisplacement field uM
j and a fluctuating displacement field ~ui as
ui
�xM
j ; xmk
�¼ uM
i
�xM
j
�þ ~ui
�xm
k
�; (18)
where, as illustrated in Fig. 2, xMj and xm
k denote the locations ofthe mesoscale and microscale material points at which uM
i and ~uiare evaluated, respectively. Essentially, the fluctuating displace-ment field ~ui accounts for the displacement variations generatedby the microstructural inhomogeneities, as measured withrespect to the (average) mesoscopic displacement of the micro-scale RVE.
b
Displacement jump [u2]M [mm]
0 0.01 0.02 0.030
10
20
30
40
50
60
t noitcart lamro
N2M
]aPM[
Rectangular-shaped specimen
Squared-shaped specimen
ped samples shown in Figs. 4 and 5 a) Fibre volume fraction Vf¼ 0.3. b) Fibre volume

Fig. 7. Axial normal stress s22 depicted in deformed, cracked configurations, for the square-shaped sample in Fig. 4(a) (which has a fibre volume fraction of 0.3). The deformed statesare taken at relative displacements Eu2F
M ¼ 0:0008165; 0:00146 and 0:00257 mm, respectively.
M.V. Cid Alfaro et al. / European Journal of Mechanics A/Solids 29 (2010) 119–131124
4.1. Formulation of boundary conditions on the RVE
In correspondence with the decomposition given by Eq. (18),periodic boundary conditions for the microscale RVE can beformulated as
~uTi ðs1Þ ¼ ~uB
i ðs1Þ;tTi ðs1Þ ¼ �tB
i ðs1Þ;~uL
i ðs2Þ ¼ ~uRi ðs2Þ;
tLi ðs2Þ ¼ �tR
i ðs2Þ;
(19)
where s1 is a local coordinate along the GmT and Gm
B boundaries ofthe RVE, and s2 is a local coordinate along the Gm
L and GmR
boundaries of the RVE. The first two boundary conditions for theTop (T) and bottom (B) edges of the RVE reflect the periodicity inthe xm
2 direction, where the second boundary condition ensuresthat the total work generated by the periodic boundary condi-tions is zero. Similarly, the last two boundary conditions for theleft (L) and right (R) edges of the RVE warrant periodicity in thexm
1 direction.The displacements of the four corner nodes of the microscale
RVE in Fig. 2 correspond to the (uniform) mesoscopic deformationof a material point in the cohesive interface GM
coh. Hence, thedisplacement jump across the mesoscale cohesive interface maybe expressed in terms of the displacement difference of twoopposite corner nodes at the top and bottom surfaces of theRVE as
EuMi F ¼ uM;T
i � uM;Bi ¼ u4
i � u1i ¼ u3
i � u2i : (20)
In accordance with this condition, the microscale displacementfluctuations are equal to zero at the four RVE corner nodes, i.e.,
~uni ¼ 0 with n˛f1;2;3;4g: (21)
Combining Eqs. (21) and (18) with Eq. (19), the periodicdisplacement boundary conditions, Eq. (19), may be reformulatedas
uTi ðs1Þ ¼ uB
i ðs1Þþu4i �u1
i
�or; uT
i ðs1Þ ¼ uBi ðs1Þþu3
i �u2i
�;
uRi ðs2Þ ¼ uL
i ðs2Þþu2i �u1
i
�or; uR
i ðs2Þ ¼ uLi ðs2Þþu3
i �u4i
�:
(22)
The above form of the periodic displacement boundary condi-tions is suitable for implementation within a finite element code.
4.2. Derivation of the mesoscopic interfacial traction
For establishing an expression for the mesoscopic traction,tMi , in a material point at the mesoscale cohesive interface GM
coh,the averaging principle proposed by Hill (Hill, 1967) is applied.This principle states that the spatial average of the virtual workat the microscale, dWm, needs to be equal to the virtual work ina local material point of the mesoscale cohesive interface, dwM
coh,i.e.,
dWm ¼ dwMcoh: (23)
Since the local virtual work and total virtual work for themesoscale cohesive interface are related as
dWMcoh ¼
ZGM
coh
dwMcohdGM
coh; (24)
where the total virtual work is given by the second term in Eq. (12),the local virtual work of the mesoscale cohesive interface isexpressed by
dwMcoh ¼ tM
i dEuMi F: (25)
In addition, the average virtual work at the microscale isdetermined by contributions of the cohesive interface GM
coh and theadjacent continuum Um as
dWm ¼ 1b
dWm ¼ 1b
8><>:Z
Um
smij d3m
ij dUmþZ
Gmcoh
tidEuiFdGmcoh
9>=>;: (26)
Note from the above expression that the averaging procedureis performed by dividing the total virtual work of the microscaleRVE by its width b. The height of the RVE does not need to betaken into account here, since the actual mesoscale geometricalobject is a cohesive surface GM
coh with zero thickness. Invoking Eq.(17), the term in between the curly braces in Eq. (26) may berewritten as
dWm ¼ 1b
ZGm
t
tiduidGmt : (27)

Fig. 8. Axial normal stress s22 depicted in deformed, cracked configurations, related tothe rectangular-shaped sample in Fig. 4(b) (which has a fibre volume fraction of 0.3).The deformed states are taken at relative displacements Eu2F
M ¼ 0:000815; 0:00186and 0:00314 mm, respectively.
M.V. Cid Alfaro et al. / European Journal of Mechanics A/Solids 29 (2010) 119–131 125
Substituting the displacement decomposition, Eq. (18), into Eq.(27) then leads to
dWm ¼ 1b
0B@ ZGm
t
ti duMi dGm
t þZ
Gmt
ti d~uidGmt
1CA: (28)
The second integral term in the right-hand side of Eq. (28) maybe developed asZGm
t
tid~uidGmt ¼
ZGm
L
tLi d~uL
i dGmL þ
ZGm
R
tRi d~uR
i dGmR
þZ
GmT
tTi d~uT
i dGmT þ
ZGm
B
tBi d~uB
i dGmB
¼Z
Gmt
tTi
�d~uT
i � d~uBi
ds1 þ
ZGm
t
tRi
�d~uR
i � d~uLi
ds2
¼ 0; (29)
in which the boundary conditions, Eq. (19) are substituted toarrive at the final result that the microscopic fluctuations fielddoes not contribute to the average microscale virtual work.As mentioned previously, s1 here is a local coordinate along theGm
T and GmB boundaries of the RVE, and s2 is a local coordinate
along the GmL and Gm
R boundaries of the RVE. As a next step, thefirst integral term in the right-hand side of Eq. (28) is developedasZGm
t
tiduMi dGm
t ¼Z
GmL
tLi duM;L
i dGmL þ
ZGm
R
tRi duM;R
i dGmR
þZ
GmT
tTi duM;T
i dGmT þ
ZGm
B
tBi duM;B
i dGmB
¼Z
Gmt
tTi
�duM;T
i �duM;Bi
�ds1þ
ZGm
t
tRi
�duM;R
i �duM;Li
�ds2
¼�
du4i �du1
i
� ZGm
t
tTi ds1þ
�du2
i �du1i
� ZGm
t
tRi ds2 (30)
where the periodicity conditions given by Eqs. (19) and (22) areinserted to arrive at the final expression. In order to develop thisexpression further, the specific boundary conditions of themicroscale RVE need to be invoked. Within a finite elementsetting, the boundary conditions, Eq. (20), can be applied in twodifferent ways, which are depicted in Fig. 3 as ‘Case 1’ and ‘Case 2’.The essential difference between these two cases relates to thehorizontal displacement of the right corner node at the bottomRVE edge (i.e., node 2), which is unconstrained for Case 1 and fullyconstrained for Case 2. Correspondingly, the boundary conditionsfor Case 1 introduce the following constraints on the RVE
du11 ¼ du1
2 ¼ 0;Z
GmR
tR1dGm
R ¼ 0; du22 ¼ 0; (31)
where the third constraint essentially corresponds to a zeroaverage normal stress in the xm
1 direction of the RVE (which is inagreement with an unconstrained displacement of node 2 in thex1
m-direction). In contrast, the boundary conditions for Case 2imply
du11 ¼ du1
2 ¼ 0; du21 ¼ du2
2 ¼ 0; (32)
where the third constraint in the above expression corresponds toa zero displacement of node 2 in the xm
1 direction of the RVE.Despite the different boundary conditions for Cases 1 and 2,substitution of either Eq. (31) or Eq. (32) into Eq. (30) leads to anidentical result, namelyZGm
t
tiduMi dGm
t ¼ du4i
ZGm
T
tTi dGm
T : (33)
Subsequently, inserting Eq. (33) together with Eq. (29) into Eq.(28) gives
dWm ¼ 1b
ZGm
T
tTi dGm
T du4i : (34)

Fig. 9. Axial normal stress s22 depicted in deformed, cracked configurations, related to the square-shaped sample in Fig. 5(a) (which has a fibre volume fraction of 0.5). Thedeformed states are taken at relative displacements Eu2F
M ¼ 0:000669; 0:00136 and 0:00265 mm, respectively.
M.V. Cid Alfaro et al. / European Journal of Mechanics A/Solids 29 (2010) 119–131126
In accordance with Eq. (23), this expression needs to beequated with the virtual work in a local material point of themesoscopic cohesive interface, dwM
coh, given by Eq. (25), whichleads to
tMi dEuM
i F ¼ 1b
ZGm
T
tTi dGm
T du4i : (35)
Since EuMi F ¼ u4
i for both Case 1 and Case 2, see Fig. 3, the aboveexpression generally results in
tMi ¼
1b
ZGm
T
tTi dGm
T : (36)
Obviously, within a finite element discretization the integralterm in the right-hand side of Eq. (36) is approximated by thesummation of the nodal forces at the top edge of the RVE. AlthoughEq. (36) is applicable to both types of RVE boundary conditionsdepicted in Fig. 3, the results computed with this expression will benevertheless different, as a result of the different responses of thetwo microscale RVEs. Here, it is difficult to say which of the twoRVEs generally provides a more accurate representation for thebehaviour at the mesoscale, since this typically depends on thecharacteristics of the macroscopic boundary value problem underconsideration. Hence, for the numerical simulations presented inthe forthcoming sections, the boundary conditions of the RVE arechosen somewhat arbitrarily in accordance with Case 1.
5. Numerical simulations of a fibre-epoxy specimen subjectedto uniaxial tension
In the present section a mesoscale traction-separation curve isderived from the failure response of a microscale fibre-epoxysample using the homogenization framework presented in Section4.2. Although the homogenization framework can be applied tosamples subjected to arbitrary combinations of tensile and shearloading, for simplicity the examples studied focus upon uniaxialtension.
5.1. Geometry and boundary conditions of the fibre-epoxy samples
An important requirement in a numerical homogenizationstudy is to check whether a loaded specimen converges to an RVE
upon an increase in size. In the present communication thisconvergence study is done for a layer with a specific thickness, thuskeeping the length scale in the thickness direction (i.e., the sampleheight) fixed. In the longitudinal direction the length scale is variedby considering two different sample widths. Note that thisapproach is different from a convergence study on RVEs for bulkmaterials, where the length scales in all dimensional directions ofthe sample are varied, see for example, Pelissou et al. (2009).
For each of the two samples two different fibre volume fractionsare considered, i.e., Vf¼ 0.3 and 0.5, see Figs. 4 and 5. The samplesare subjected to uniaxial tension by prescribing the verticaldisplacement, bu2, at the top edge of the sample. Quasi-staticloading conditions are warranted by using a relatively smallnominal strain rate of _bu2=h ¼ 4� 10�3 s�1, where h is the sampleheight. Periodic boundary conditions are prescribed at the left andright edges of the sample, as explained in Section 4.1. Thedisplacement at the bottom edge of the sample is constrained in thevertical direction, and the displacement of the node at the bottom-left corner of the specimen is also constrained in the horizontaldirection, see Figs. 4 and 5. These boundary conditions are incorrespondence with Case 1 depicted in Fig. 3(a).
The first sample studied is square-shaped, with a width (andheight) equal to b¼ h¼ 0.125 mm. The second sample is rectan-gular-shaped, where, in comparison with the square-shapedsample, the width is chosen two times larger, i.e., b¼ 0.250 mm,while the height h is kept the same. Essentially, the chosen sampleheight is representative of the thickness of fibre-epoxy layers usedin GLARE (Vlot and Gunnink, 2001). These fibre-epoxy layers arecomposed of an FM94 epoxy and S2 glass fibres of 10 mm indiameter. As illustrated in Figs. 4 and 5, the internal materialstructure of the samples relates to a random fibre distribution thatis geometrically periodic in the x1 direction.
5.2. Finite element model
The finite element model used for the microscale computationsis plane-strain and thus is representative of fibres with a relativelylarge (actually infinite) length. The fibres and the epoxy matrix aremeshed with 6-node triangular elements equipped with a 7-pointGauss quadrature. Debonding between fibre and matrix is simu-lated with the interface damage model summarised in Section 2,using 6-node interface elements equipped with a 3-point Newton-Cotes quadrature. Fracture processes within the epoxy material are

Fig. 10. Axial normal stress s22 depicted in deformed, cracked configurations, relatedto the rectangular-shaped sample in Fig. 5(b) (which has a fibre volume fraction of 0.5).The deformed states are taken at relative displacements Eu2F
M ¼ 0:000669; 0:00134and 0:00345 mm, respectively.
Fig. 11. A delaminating crack in a fibre-metal laminate, taken from Vlot and Gunnink (2001).prepreg layer, which is close to the interface with the aluminium layer.
M.V. Cid Alfaro et al. / European Journal of Mechanics A/Solids 29 (2010) 119–131 127
also simulated with the interface damage model, placing 6-nodeinterface elements furnished with a 3-point Newton-Cotes quad-rature in between triangular continuum elements constructing theepoxy matrix. This modelling approach for the simulation of frac-ture was originally proposed by Xu and Needleman (1994), andwarrants that the crack initiation and propagation processes in thesample are naturally determined by the geometry and boundaryconditions applied, and by the parameter values used in theinterface traction-separation law. The influence of the finiteelement discretization on the fracture response can be minimisedby choosing a sufficiently fine, randomly oriented mesh. None-theless, the mesh fineness is bounded by a maximum in order tolimit the artificial response contributions related to the use of aninterface ‘dummy’ stiffness in the traction-separation law, see Eq.(1). In fact, the application of interface elements with an elasticdummy stiffness causes that the elastic response of the finiteelement model does not converge to that of an ideal continuum inthe limit of an ‘infinitely fine’ mesh. The number of continuumelements and interface elements used in the finite element meshesof the samples in Figs. 4 and 5 are listed in Table 1. Note from thistable that the number of elements used for modelling the rectan-gular sample is about two times the number of elements used forthe square sample. Mesh refinement studies reported in Cid Alfaro(2008) indicate that for this mesh density the fracture response iscomputed with high accuracy.
The material parameters of the S2 glass fibre, the FM94 epoxyand the interfaces between fibres and epoxy and within the epoxyare listed in Table 2. The elastic material properties for the fibre andthe epoxy matrix have been adopted from Hagenbeek (2005). Thevalue of the elastic stiffness K of the interfaces is taken relativelyhigh, such that the interfacial deformations in the elastic regime arenegligibly small. Values for the ultimate strengths and toughnessesof the epoxy material and of fibre-epoxy interface could not befound in the literature, and therefore are estimated from the failureresponse of delamination tests on double spliced GLARE specimens(Hashagen and de Borst, 2000). The toughness values listed in Table2 indicate that the FM94 epoxy used in these experimental speci-mens is relatively brittle, both in tension and in shear. It is worthmentioning that the prepreg layer of a more recent generation ofGLARE laminates is a factor 5–8 tougher, due to improvements inthe manufacturing process and the use of an improved epoxymaterial with better mechanical properties, see van den Brande andSinke (2004). For simplicity, for the epoxy and fibre-epoxy inter-faces the strength and toughness values are taken the same. Here,the subscripts ‘coh’ and ‘adh’ used in the denotation of the
The crack propagates at the transition between the fibre-low and fibre-rich areas of the

(i) (ii) (iii) (iv)
Fig. 12. Four fibre-epoxy samples with different locations and/or number of imperfections. The fibre volume fraction of the sample is 0.3 and imperfections are indicated in red. (Forinterpretation of the references to colour in this figure legend, the reader is referred to the web version of this article.)
(ii),(iii)
(i),(ii),(iii)
Imperfection upper region (i)
Imperfection lower region (ii)
Two imperfections (iii)
Without imperfection
Two imperfections (iv)
Displacement jump [u2]M [mm]
0 0.01 0.02 0.030
10
20
30
40
50
60
t noitcart lamro
N2M
]aPM[
Fig. 13. Mesoscopic traction-separation law corresponding to the square-shapedsample with a fibre volume fraction of 0.3 (shown in Fig. 4(a)), plotted for a differentnumber and position of imperfections, see Fig. 12.
M.V. Cid Alfaro et al. / European Journal of Mechanics A/Solids 29 (2010) 119–131128
parameters refer to the cohesive strength of the epoxy material andthe adhesive strength of the fibre-epoxy interface, respectively. Thevalue of the relaxation parameter h is taken relatively small in orderto closely approach the limit case of rate-independent crackgrowth. Additional simulations not presented here have shownthat the introduction of a small rate-dependency is necessary toavoid numerical convergence problems caused by crackbifurcations.
Fig. 14. Axial normal stress s22 depicted in deformed, cracked configurations, for case (irespectively.
5.3. Influence of sample size and fibre volume fraction
The failure responses of the samples with the two differentwidths are mutually compared to assess the convergence of thenumerical result upon an increasing microstructural samplevolume, see also, for example, Pelissou et al. (2009). The meso-scopic traction-separation relation obtained after applying thehomogenization approach presented in Section 4.3.2 to thenumerical results is shown in Fig. 6. It can be observed that for bothvolume fractions the traction-separation responses of the square-shaped and rectangular-shaped samples are similar, indicating thatthe square-shaped sample is sufficiently large for being consideredas an RVE. Essentially, the traction-separation responses closelyfollow the mode I traction-separation law of the epoxy material.This is due to the fact that the failure process develops locallythrough the epoxy material in a mode I dominated fashion (i.e., theorientation of the failure crack is approximately perpendicular tothe direction of the tensile loading). This can be observed from Figs.7 and 8 for the square-shaped and rectangular-shaped specimenswith a fibre volume fraction of 0.3, respectively, and from Figs. 9and 10 for the square-shaped and rectangular-shaped specimenswith a fibre volume fraction of 0.5, respectively. In all cases thecrack clearly grows through the fibre-low (or epoxy-rich) area closeto the top edge of the specimen. This position of the dominantfailure crack is in agreement with experimental observations ondelamination failure in fibre-metal laminates (Vlot and Gunnink,2001). These experiments show that mesoscale delaminationbetween the prepreg layer and the aluminium layer at the micro-scale occurs by cracking at the edge of the fibre-low area, which isclose to the edge of the prepreg layer, see Fig. 11. Since the fibres are
) in Fig. 12. The deformed states are taken at Eu2F
M ¼ 0:821; 1:940 and 5:985 mm,

Fig. 15. Axial normal stress s22 depicted in deformed, cracked configurations, for case (ii) in Fig. 12. The deformed states are taken at Eu2F
M ¼ 0:821; 1:854 and 5:863 mm,respectively.
M.V. Cid Alfaro et al. / European Journal of Mechanics A/Solids 29 (2010) 119–131 129
hardly involved in this failure mechanism, a change in the fibrevolume fraction from 0.3 to 0.5 changes the sample response onlymildly. Because the present analysis shows that the square-shapedsample can be considered as a representative volume element, thissample will be used for the forthcoming computations in thiscommunication.
5.4. Influence of imperfections on failure response
In order to study how the homogenized traction-separationresponse is influenced by imperfections at fibre-epoxy interfaces,four different configurations are considered, see Fig. 12. The fibrevolume fraction of the sample is 0.3 and the imperfections arerepresented by a local absence of the adhesive bonding strength atspecific fibre-epoxy interfaces. As illustrated in Fig. 12, the fourconfigurations considered are characterised by: (i) A singleimperfection in the upper region of the sample (i.e., in the left-topquadrant), (ii) A single imperfection in the lower region of thesample (i.e., in the right-bottom quadrant), (iii) Two imperfectionsin the upper and lower regions of the sample (i.e., a combination of
Fig. 16. Axial normal stress s22 depicted in deformed, cracked configurations, for case (iirespectively.
configurations (i) and (ii)), and (iv) Two imperfections in the upperand lower regions of the sample, where the upper imperfectioncoincides with that in configuration (i) and the lower imperfectionis placed somewhat higher than that of configuration (ii).
The mesoscopic traction-separation response for the differentconfigurations in Fig. 12 is plotted in Fig. 13. For comparison, theresponse of the specimen without imperfections, plotted inFig. 6(a), has also been included in this figure. The correspondingfracture patterns are depicted in Figs. 14–17. For all configurationsthe imperfections clearly act as nucleation sites for crack develop-ment. In addition, their location typically is included in the geom-etry of the dominant failure crack that develops upon completefailure of the fibre-epoxy specimen. An exception in this respect,however, is the imperfection located in the upper half of configu-ration (iii), see Fig. 16; this imperfection initially acts as a nucleationsite for cracking but eventually is not included in the geometry ofthe dominant failure crack, due to a local unloading upon defor-mation. This is an important difference with configuration (iv),where both imperfections are included in the geometry of thedominant failure crack, see Fig. 17. The net result of this behaviour is
i) in Fig. 12. The deformed states are taken at Eu2F
M ¼ 0:821; 1:985 and 5:894 mm,

Fig. 17. Axial normal stress s22 depicted in deformed, cracked configurations, for the case (iv) in Fig. 12. The deformed states are taken at Eu2F
M ¼ 0:822; 1:856 and 8:041 mm,respectively.
M.V. Cid Alfaro et al. / European Journal of Mechanics A/Solids 29 (2010) 119–131130
that the total crack length of configuration (iv) is substantiallylarger than that of configuration (iii), which thus requires moreenergy dissipation in order to fail the sample. Correspondingly, theeffective fracture toughness of configuration (iv) is larger than thatof configuration (iii), see Fig. 13, and also is larger than that of thesample without imperfections. Hence, it may be concluded that thepresence of imperfections in a fibre-epoxy sample may havea positive effect on the effective fracture toughness. From thecomparison of the fracture patterns for configurations (iii) and (iv)it can be further concluded that the two imperfections bothcontribute to the geometry of the dominant failure crack (therebyenhancing the effective fracture toughness) only if the distancebetween the imperfections in the tensile direction (i.e., in thethickness direction of the layer) is not too large.
6. Concluding remarks
In this paper a numerical homogenization framework has beenpresented that links the microscale response of a fibre-epoxysample to a mesoscale traction-separation curve that can be usedfor simulating the failure response of a (material point in a) cohe-sive interface. The formulation is based on Hill’s averaging prin-ciple, which states that the spatial average of the virtual work at themicroscale is equal to the virtual work in a local material point ofthe mesoscale cohesive interface. Microscale numerical simulationsare performed on a fibre-epoxy sample subjected to uniaxialtension. Two different sample sizes are analysed for two differentvalues of the fibre volume fraction, Vf¼ 0.3 and 0.5. When theinterface between fibres and epoxy is of a higher strength than theepoxy itself, the numerical response is characterised by a failurepattern that develops mainly through the epoxy matrix, as a resultof which the failure response is not very sensitive to a change in thefibre volume fraction. The numerical results converge uponincreasing the sample size, confirming that the sample sizeapproaches a representative volume element (RVE). The influenceon the effective sample response by the number and position ofinitial imperfections within the specimen is also studied. Theimperfections generally trigger crack nucleation, and their locationtypically is included in the geometry of the dominant failure crackthat develops upon deformation. As a result of this behaviour,imperfections can increase the length of the dominant failure crack
(as compared to the crack length for a sample without imperfec-tions), and thus may enhance the effective fracture toughness of thesample.
The present numerical homogenization technique computes thecomplex failure response of fibre-epoxy samples in a robust andaccurate manner. Although the examples studied are limited tofibre-epoxy samples subjected to uniaxial tension, it is emphasisedthat the averaging relations proposed in Section 4.2, in principle,can be applied to arbitrary mixed-mode (i.e., tensile and shear)loading conditions.
The simulations for fibre-epoxy samples loaded under uniaxialtension have shown that the differences between the effective failureresponse of the fibre-epoxy layer and the microscopic failure behav-iour of the epoxy matrix are small, see Fig. 6. This is partly due to thefact that the cracking processes are described with a discrete damagemodel, which makes it possible to capture a local, mode I-drivenfailure behaviour in an accurate fashion. A more diffusive, continuumdamage model, such as that used by Geubelle and co-workers in theirhomogenization framework (Matous et al., 2008; Kulkarni et al.,2009), by definition will lead to a larger difference between the localfailure behaviour and the effective failure response of a fibre-epoxylayer. It is also expected that under mixed-mode loading conditionsthis difference will be larger than under the mode I loading conditionsstudied in this manuscript, since under increasing mode-mixity thefracture patterns in fibre-epoxy systems typically become moredistributive (or less localised), see Kulkarni et al. (2009). In addition, asobserved in recent micromechanical computations (Cid Alfaro et al.,in press), this difference may further become larger when thestrength of the fibre-epoxy interface is lower than the strength of theepoxy. This is, because under such conditions the cracking path isforced to run along the perimeter of fibres and consequently increasesin length, thereby enlarging the effective fracture toughness of thefibre-epoxy system (similar to what has been demonstrated in thispaper for samples with imperfections at fibre-epoxy interfaces).These issues are interesting topics for future studies.
Acknowledgements
This work is part of the research project DLR.5790 - DFG 509‘‘Multiscale Methods in Computational Mechanics’’. The authorsgratefully acknowledge the financial support of this research project

M.V. Cid Alfaro et al. / European Journal of Mechanics A/Solids 29 (2010) 119–131 131
by the Stichting Technische Wetenschappen (STW), the Netherlands,and the Deutsche Forschungsgemeinschaft (DFG), Germany.
References
Cid Alfaro, M.V., Suiker, A.S.J., de Borst, R., Remmers, J.J.C., 2009. Analysis of fractureand delamination in laminates using 3D numerical modelling. EngineeringFracture Mechanics 76, 761–780.
Cid Alfaro, M.V., Suiker, A.S.J., de Borst, R. Transverse failure behaviour of fibreepoxy systems. Journal of Composite Materials, in press.
Cid Alfaro, M.V. Multiscale Analyses of Fibre Metal Laminates. PhD thesis, DelftUniversity of Technology, Delft, 2008.
Gamstedt, E.K., Sjogren, B.A., 1999. Micromechanisms in tension-compressionfatigue of composite laminates containing transverse plies. Composites Scienceand Technology 59, 167–178.
Ghosh, S., Lee, K., Moorthy, S., 1995. Multiple scale analysis of heterogeneous elasticstructures using homogenization theory and Voronoi cell finite elementmethod. International Journal of Solids and Structures 32, 27–62.
Ghosh, S., Lee, K., Moorthy, S., 1996. Two scale analysis of heterogeneous elastic-plasticmaterials with asymptotic homogenization and Voronoi cell finite element model.Computer Methods in Applied Mechanics and Engineering 132, 63–116.
Guedes, J.M., Kikuchi, N., 1990. Preprocessing and postprocessing for materialsbased on the homogenization method with adaptive finite-element methods.Computer Methods in Applied Mechanics and Engineering 83, 143–198.
Hagenbeek, M.. Characterization of Fibre Metal Laminates Under Thermo-mechanical loadings. PhD thesis, Delft University of Technology, Delft, 2005.
Hashagen, F., de Borst, R., 2000. Numerical assessment of delamination in fibremetal laminates. Computer Methods in Applied Mechanics and Engineering185, 141–159.
Hill, R., 1967. The essential structure of constitutive laws for metal composites andpolycrystals. Journal of the Mechanics and Physics of Solids 15, 79–95.
Hobbiebrunken, T., Hojo, M., Adachi, T., de Jong, C., Fiedler, B., 2006. Evaluation ofinterfacial strength in CF/epoxies using FEM and in-situ experiments.Composites Part A 38, 2248–2256.
Hutchinson, J.W., Suo, Z., 1992. Mixed mode cracking in layered materials. Advancesin Applied Mechanics 29, 63–191.
Jensen, H.M., 1990. Mixed mode interface fracture criteria. Acta Metallurgica etMaterialia 38, 2637–2644.
Kouznetsova, V., Brekelmans, W.A.M., Baaijens, F.P.T., 2001. An approach to micro-macro modeling of heterogeneous materials. Computational Mechanics 27, 37–48.
Kouznetsova, V., Geers, M.G.D., Brekelmans, W.A.M., 2002. Multi-scale constitutivemodelling of heterogeneous materials with a gradient-enhanced computational
homogenization scheme. International Journal for Numerical Methods inEngineering 54, 1235–1260.
Kulkarni, M.G., Geubelle, P.H., Matous, K., 2009. Multi-scale modelling of hetero-geneous adhesives: effect of particle decohesion. Mechanics of Materials 41,573–583.
Matous, K., Kulkarni, M.G., Geubelle, P.H., 2008. Multiscale cohesive failuremodeling of heterogeneous adhesives. Journal of the Mechanics and Physics ofSolids 56, 1511–1533.
Miehe, C., Koch, A., 2002. Computational micro-to-macro transitions of discretizedmicrostructures undergoing small strains. Archive of Applied Mechanics 72,300–317.
Miehe, C., Schroder, J., Schotte, J., 1999. Computational homogenization analysisin finite plasticity. Simulation of texture development in polycrystallinematerials. Computer Methods in Applied Mechanics and Engineering 171,387–418.
Pelissou, C., Baccou, J., Monerie, Y., Perales, F., 2009. Determination of the size of therepresentative volume element for random quasi-brittle composites. Interna-tional Journal of Solids and Structures 46, 2842–2855.
Suiker, A.S.J., Fleck, N.A., 2004. Crack tunneling and plane-strain delamination inlayered solids. International Journal of Fracture 125, 1–32.
Suiker, A.S.J., Fleck, N.A., 2006. Modelling of fatigue crack tunneling and delami-nation in layered composites. Composites Part A: Applied Science andManufacturing 37, 1722–1733.
Suquet, P.M., 1985. Local and global aspects in the mathematical theory ofplasticity. In: Sawczuk, A., Bianchi, G. (Eds.), Plasticity Today: Modelling,Methods and Applications. Elsevier Applied Science Publishers, London, pp.279–310.
Tijssens, M.G.A., van der Giessen, E., Sluys, L.J., 2000. Simulation of mode I crackgrowth in polymers by crazing. International Journal of Solids and Structures 37,7307–7327.
Tijssens, M.G.A., Sluys, L.J., van der Giessen, E., 2001. Simulation of fracture ofcementitious composites with explicit modeling of microstructural features.Engineering Fracture Mechanics 68, 1245–1263.
Turon, A., Camanho, P.P., Costa, J., Davila, C.G., 2006. A damage model for thesimulation of delamination in advanced composites under variable-modeloading. Mechanics of Materials 38, 1072–1089.
van den Brande, J., Sinke, J., 2004. FIMELAS – Numerical Modelling of Fibre-metalLaminates: Microscopic Damage Models. Technical Report B2V-04-02. DelftUniversity of Technology, Netherlands.
Vlot, A., Gunnink, J.W., 2001. Fibre Metal Laminates – an Introduction. KluwerAcademic Publishers, Dordrecht.
Xu, X.P., Needleman, A., 1994. Numerical simulations of fast crack growth in brittlesolids. Journal of the Mechanics and Physics of Solids 42, 1397–1407.


