Embed Size (px)
Citation preview
Fuel 109 (2013) 445–460
Contents lists available at SciVerse ScienceDi rect
Fuel
journal homepage: www.elsevier .com/locate / fuel
Numerical investigation of oxy-natural-gas combustion in asemi-industrial furnace: Validation of CFD sub-models
0016-2361/$ - see front matter � 2013 Elsevier Ltd. All rights reserved.http://dx.doi.org/10.1016/j.fuel.2013.02.061
⇑ Corresponding author. Address: Dipartimento di Ingegneria Civile e Industriale,Università di Pisa, Largo L. Lazzarino 2, I-56126 Pisa, Italy. Tel.: +39 0502217897;fax: +39 0502217866.
E-mail address: [email protected] (C. Galletti).
Chiara Galletti a,⇑, Giovanni Coraggio b, Leonardo Tognotti a,b
a Dipartimento di Ingegneria Civile e Industriale, Università di Pisa, Pisa, Italy b International Flame Research Foundation, Livorno, Italy
h i g h l i g h t s
� Comparison between CFD predictions and in-flame measurements of 3 MW oxy-NG tests.� Modeling strategies required to diminish the computational time.� Inadequacy of fast chemistry approaches to treat the turbulence/chemistry interaction.� Strong influence of the spectral model on predictions.
a r t i c l e i n f o
Article history:Received 12 May 2012 Received in revised form 19 December 2012 Accepted 25 February 2013 Available online 19 March 2013
Keywords:Oxy-fuel combustion Semi-industrial tests Spectral models Computational fluid dynamics Eddy Dissipation Concept
a b s t r a c t
The modeling through computational fluid dynamics of oxy-natural-gas combustion experimental tests in a 3 MW semi-industrial furnace equipped with a low NOx burner is discussed. Since the complex geometry of the burner and the size of the furnace, a modeli ng strategy has been adopted to diminish the computational time and thus to make the simulations affordable. The model aims at validating dif- ferent sub-models (e.g. combustion/kinetics, radiation/spectr al) for oxy-natural-gas fired conditions through the comparison of predictions and in-flame measurements of temperat ure and chemical species.It is found that fast chem istry approaches are unable to predict the temperature field. The spectral model was also found to play a fundamental role for the correct analysis of such scale devices. Uncertainties inexperimental and modeling results are discussed and compared.
� 2013 Elsevier Ltd. All rights reserved.
1. Introduction
Nowadays large attention is paid to oxy-fuel combustion, moti- vated by the possibility of coupling such technology to CO2 captureand storage (CCS) techniques for reducing greenhou se gases emis- sion. In oxy-fuel combustion, a mixture of oxygen and recycled fluegases is used instead of air for the fuel oxidation. Conseque ntly, agas consisting of CO2 and H2O is obtained, with a concentratio nof CO2 ready for sequestra tion. Flue gases are recycled in order tomake up the volume of the missing N2 and ensure the thermal capacity needed for the subsequent heat transfer operation in the boiler. Comprehensiv e reviews on oxy-fuel combustion are pro- vided by Wall et al. [1], Toftegaar d et al. [2] and Chen et al. [3].
In recent years there has been a large increase of the use of sim- ulation tools, such as those based on Computational Fluid
Dynamics (CFD). These tools could provide a strong asset for the developmen t of novel combusti on technologie s such as oxy-fuel combusti on. In particular, CFD calculations may be applied directly to the industrial scale of interest, thus avoiding scaling-up the re- sults from lab-scale experiments . This appears especially relevant for combustion processes , for which scale-up procedures are gen- erally complicated by the strong interactio n between turbulence,reaction kinetics, heat release and radiation. However the use ofCFD for the investigatio n and design of combustion systems faces some problems related to lack of rigorous validation of CFD mod- els. This issue is very important as CFD sub-models for turbulent combusti on (combustion models, kinetic schemes, and spectral models) have been generally developed for air-combustion cases and need to be validated and eventually revised for novel applica- tions. Indeed one of the main research topics in oxy-fuel combus- tion is the developmen t of suited models for CO2-enrichedatmosph ere [1].
CFD simulations at the industrial scales are computational demanding so that simplified models have to be generally adopted for the chemistry and radiative properties treatment.

446 C. Galletti et al. / Fuel 109 (2013) 445–460
Global oxidation mechanisms are likely to be used for the mod- eling of industrial oxy-fuel combustion furnaces, due to the high computational costs of such simulatio ns. However, available global reaction mechanisms have been formulat ed for conventi onal air combustion. The substitution of CO2 to N2 in oxy-fuel combustion may change the relevance of different elementar y reactions, thus leading to a modification of the global rates [4]. Andersen et al.[5] evaluated the performanc e the two-step mechanism s of West- brook and Drier [6], and the four-step mechanism of Jones and Lindstedt [7], for predicting a plug flow reactor fed with propane in both air and oxy-conditions (characterized by 28% O2 and 72%CO2). The two global schemes are largely employed to model meth- ane oxidation in conventional combusti on systems. Andersen et al.compared the results from these models to those from a detailed kinetic mechanism, finding that the predictio n of CO levels was strongly unsatisfactory, so they suggested a revision of both mod- els. The modification was found to be effective especially for the model of Westbrook and Drier. Moreover the authors recom- mended the use of finite rate approaches to model the turbu- lence/chem istry interaction. As a matter of fact the ‘‘mixed-is- burned’’ approach for the turbulence/ chemistry interaction treat- ment and traditionally used for air combustion modeling, is not likely to be applicable in reaction systems where reverse reactions play an important role, as is the case under oxy-fuel condition s due to CO2 decomposition at high temperat ures. Recently Frassoldati et al. [8] investiga ted the performance of the JL scheme for oxy- combustion of methane without flue gas recycle (thus using pure O2 as oxidizer) by performing calculations in laminar counter-flowdiffusion flames. The authors concluded that the water vapor dis- sociation reactions should be included in the mechanism to ad- dress the high temperature condition s with pure O2.
In addition to combustion/chemistry models, research needs inoxy-fuel combustion regard also spectral models. The Weighted-Sum of Gray Gases (WSGG) model is often adopted to evaluate thespectral properties of the participating medium; however modelcoefficients such as those of the 1-clear/3-gray gases model by Smithet al. [9], the most employed in numerical investigations of furnaces,have been generally derived for conventional air combustion. In oxy-fuel combustion the large amount of CO2 and H2O enhances the radi-ative transfer: so there is concern about the spectral model behaviorfor such a case, as it lies out of the region for which the spectral modelhas been tuned [9–13]. As a matter Gupta et al. [10] showed how theWSGG model by [9] under-predicts strongly the absorption coeffi-cient in oxy-fuel conditions for large beam lengths, thus this aspectshould mostly affect the modeling of large scale furnaces. Thoseinvestigations were based on the comparison between the WSGGmodel prediction and those obtained with banded models.
Recently some attempts have been made to improve the WSGG model in case of oxy-fuel combustion. For instance [10] proposedto introduce an additional gray gas to the 1-clear/3-gray gases model of [9] in order better consider CO2 rich atmosph ere. Such a modification was performed by evaluating the radiated proper- ties through a Wide Band Model. Lately Johansson et al. [13] ana-lyzed the radiative conditions in boilers with large pressure path- lengths for different H2O/CO2 ratios through a Statistical Narrow Band model. The authors proposed two revisions of the WSGG model based on 1-clear/3-gray and 1-clear/4-gray gases for water vapor to carbon dioxide partial pressures ratios of 0.125 and 1,which were better able to fit radiation propertie s in oxy-fuel con- ditions. Similarly Yin et al. [15] provided new oxy-fuel WSGG coef- ficients for different H2O and CO2 partial pressures. Such a model was lately tested by Yin et al. [16] who found that the effect ofthe spectral model was negligible for a 0.8 MW furnace under oxy-natural- gas condition s, whereas affected strongly the heat transfer on a 609 MW utility boiler. The authors also analyzed the effect of three different global kinetic models of the simulatio n
of oxy-fuel experiments in the 0.8 MW furnace, finding a strong impact of the chemistry on predictio ns.
Ströhle [14] carried out an analysis of the radiative properties ina gas turbine combustor, again showing that the WSGG model with coefficients by [9] was unable to predict spectral properties for high CO2 concentration. The author then analyzed the performanc eof different wide band correlate d-k method (WBCK).
In the present work, CFD simulatio ns of experiments conducte dwith a 3 MW low-NOx burner installed in the FoSper furnace, areplica (placed at the ENEL experimental facility of Livorno, Italy)of the IFRF furnace n.1, in oxy-fired conditions fed with NG[17,18] (oxy-NG) are performed. Even though coal is the main fuel considered for oxy-fuel units (and there are several modeling activities on coal combustion, e.g. [19], as also reviewed by [3]),there are applicati ons for which gas-fired oxy-fuel conditions are considered as in gas turbine combustors. Moreover the gaseous combusti on modeling can help shedding light into gas radiation under oxy-fuel condition s in general.
Often CFD sub-models are tested on lab-scale devices, numeri- cally and/or experimentally; however FoSper can provide datasets for validating them directly at the large scales were different effect may arise. For instance to our knowledge the data used by [16] areso far the only large-scale data used to understa nd the effect of aspectral model in real furnaces. As a matter of fact, FoSper has rep- resented a reference case for a number of modeling activities with commerc ial and in-house codes during the last decades (e.g. [20]).However , no formalized procedures have been provided in such studies, for the assessment of the level of agreement between experime nts and simulations.
2. Validation and uncertain ties quantification approach
The approach followed is fully described in recent IFRF Report [21]. The concept is based on the proper Design of Experiment (DoE) that is necessary for developing a joint experimental and modeling activity. In other words, in planning semi-industr ial scale campaign s, one should try to answer the questions of what data and informat ion is needed for modeling, and what is needed for validation before to design the experimental matrix. Within the validation activity, it is important to assess the level of agreement between the experime ntal data and computational results with quantifiable metrics and taking into account uncertainties in the experime nt and in the model.
The validation activity can be performed at different levels ofcomplexi ty that can be derived from the complete system through the construction of hierarchies which decompose the system ofinterest into levels of decreasing complexi ty [22]. The construction of hierarchies can also help in designing validation experiments .The errors associated to experiments (intrinsic, statistical errors,measuring position) have been discussed in [23]. The modeling ap- proach should take into account the existence of ‘‘scenario’’ uncer- tainties (heat fluxes/temperature at the furnace wall), the complexi ty of the burner that needs grid reduction strategie s(numerical solution error), the proper choice of kinetic and radia- tion submodels (modeling uncertainti es), and finally some criteria of comparing experimental results and model predictions (valida-tion metrics: quantitative evaluation of agreement between exper- iments and model predictions).
In the following sections the application of the validation ap- proach is described for the present oxy-NG investigation.
3. Experimen tal campaigns
The FoSper furnace is described in details in [17]. It has an inter- nal square cross-sectio n of 2 m � 2 m, is approximat ely 6.25 m

C. Galletti et al. / Fuel 109 (2013) 445–460 447
long and is made of 11 independen tly water-cooled refractory- lined sections Fig. 1a). Seven cooling loops are used to extract suf- ficient energy from the combustion chamber to maintain a temper- ature history compara ble to a radiant section of a full-scale boiler operating with air. The cooling water flow rate and temperature for each section and loop are continuously monitored in order todetermine the total heat extractio n from the furnace.
The TEA-C (Fig. 1b) is a Low NOx burner developed by Enel and Ansaldo used in industrial utility boilers; to allow the testing onthe FoSper furnace, a scaled-down prototype of 3 MW thermal power was used. In this prototype the oxidizer feeding is done by a wind-box with a vertical entrance, the oxidizer goes into the burner through two separate ducts – secondary and tertiary – both having an axial movable swirler and a damper that controls the flow rate distribut ion. Two different sets of inclined palettes pro- duce the swirling of the oxidizer with two different angles: the sec- ondary duct palettes are inclined by 45� and the tertiary duct palettes are inclined by 30�. These sets of palettes are indepen- dently movable along the axis of the burner and their position determines the intensity of the swirling, i.e. the swirl is higher when the palettes are close to the exit of the burner (Fig. 1b). For the oxy-NG tests considered herein, oxygen is fed, after mixing with RFG, through the secondary and tertiary duct. The primary duct, positioned on burner axis, provides the oxidizer/coal mixture to the combustion chamber with pulverized coal experime nts (notconsidered in the present study). It is equipped by an internal axial swirler and a nozzle which makes a separation between coal rich and lean jets in order to enhance the in-flame NOx reduction effect.The primary oxidizer flow is maintained active even with NGexperiments .
For the NG firing operation, eight lances inject the fuel through nozzles having two holes with an axis which forms a 45� anglewith the burner axis.
Fig. 1. (a) FoSper furnace
The experime ntal campaigns considered in the present paper regard NG combustion in oxy-fired conditions using a recycle ratio of R = 0.69 [17]. The retrofitting of the furnace for oxy-fired condi- tions is described in details in [18] even though a brief description is provided here. Flue gases coming from the furnace are sucked bya fan for flue gas extraction set upstream the bag filters. This fan isused also to control the pressure inside the combustion chamber.The flue gases go in the first convective section (flue/water heat ex- changer) where they are cooled down to about 673 K, and then cross the Ljungström exchange r that further reduce their tempera- ture down to about 423 K, by giving heat to the comburent. Then,cool flue gases are treated with two bag filters, and afterwards they are divided in two streams, one is sent to the stack and the other isrecycled. A sketch of the plant is shown in Fig. 2 where solid lines refer to standard air operation ; dashed lines refer to the RFG and dashed-d otted lines to oxygen.
Table 1 reports the experime ntal condition s used for the pres- ent investigatio n. Details about different runs (i.e. air tests and oxy-NG combustion tests with a different recycled flue gas ratio)can be found in [17].
In oxy-NG combustion conditions, the furnace is kept in over pressure condition in order to limit the air in-leakage in the com- bustion chamber. The same setting of the furnace used in oxy com- bustion condition s has been kept also in the conventi onal combusti on trials in order to perform a better comparison of the results.
The standard suction pyrometer is used to measure temperature and concentratio n of CO, CO2, NO, O2 inside the furnace. The instru- ment is inserted into the furnace through specifically designed 14insertion windows (which provide the necessary seal and prevent the risk of flame escape out of the ports) in order to get the in-flameprofiles of temperature and main gas species. In the standard suc- tion pyrometer a platinum–rhodium thermocoupl e, protected from
and (b) TEA-C burner.

Fig. 2. FoSper plant: dashed line: recycled gas line; dotted/dashed line: oxygen line.
Table 1Operating conditions for oxy-NG runs [17].
NG flow rate 267 Nm3/hNG temperature 14.3 �COxygen 730 kg/h Oxygen temperature 15.3 �CPrimary RFG 700 kg/h PrimaryRFG temperature 125 �CSecondary/tertiary RFG 1447 kg/h Secondary/tertiary RFG temperature 250 �CSwirler setting 0–100%Dumper setting 100–100%Recycle ratio 0.69 Fuel thermal input 2.7 MWt
Flue gas temperature 1050 �CTotal heat extracted 1.186 MWO2 in flue gas 3.2%CO in flue gas 11 ppm CO2 in flue gas 68.7%NOx in flue gas 120 ppm
448 C. Galletti et al. / Fuel 109 (2013) 445–460
chemical attack by a sintered alumina sheath, is surrounded by two concentric radiation shields. The gases are drawn between the shields and over the sheath with high velocity so that the equilib- rium thermocoupl e temperat ure is nearly that of gases without the need for correctio n. The gases sampled in the flame are drawn into a bubbler to separate the solid particles , go to a hot filter and then to the analyzing system. The concentr ations of the CO, CO2,NO, are measure d with infrared analysis and the O2 concentr ation with paramag netic analyzer.
A global estimation of the experimental uncertainties associ- ated to the temperature and gas concentr ation measurements ,has been recently performed [21] and they result to be always less than 5%. Regarding the accuracy in the determination of the probe position, the error with respect to the furnace axes can be up to 1–2 cm. Moreove r it should be remarked that the measurements ob- tained with the suction pyrometer are an average of the value ofthe temperature (or gas composition) over a gas region of approx- imately 3 cm size inside the furnace.
Temperatur e at the furnace walls were also measure d through thermocoupl es inserted by of a few mm inside the refractory material.
4. Numerical model
4.1. Computationa l grid and domain
The numerica l model was develope d with the fluid dynamics package Fluent by Ansys Inc. Due to the burner/furnace symmetries,just one quarter of the furnace was modeled in order to decrease the CPU time of the simulations. Fluid domains were used for the burner and the furnace, whereas the cooling loops were modeled as solid domains. This was made in order to facilitate the setting of heat extraction boundary condition from the cooling loops.
Due to the complexity of the burner much effort was devoted tothe optimization of the grid. In particularly, two domains were chosen:
– a complete domain , in which the burner was represented in all details;
– a reduced domain in which the burner was ‘‘cut’’ by representing just a portion of the secondary and tertiary ducts.
The surfaces used to cut the complete domain are shown inFig. 3 and correspond s to the secondar y (blue color) and tertiary (red color) duct inlet surfaces for the reduced domain.
The idea is to perform preliminary runs on the complex domain in isothermal conditions and thus to use obtained profiles of veloc- ity, turbulence characteri stics, temperature , species mass fractions to set proper boundary conditions at the secondary and tertiary duct inlets of the reduced domain. It is worth noting that such pro- files must be derived from non-reactive complete domain simula- tions, as there are no available measure ments. This procedure issomewhat different from that reported by Peters and Weber [26]for the modeling of flames in the IFRF furnace No. 1. In that work,the aforementi oned authors could employ the laser Doppler veloc- imetry (LDV) technique to get profiles of velocity and turbulent characteri stics at the air inlet duct to be used for the furnace mod- eling. Moreove r the geometry of the aerodynamicall y air staged burner used in their investigatio ns allowed the adoption of a 2D(axisymmetric swirled) domain, so that LDV data could be taken just along a calibration line. In the present work, there is no optical access to the interiors of the TEA-C burner, so that the use of LDV techniqu e is prevented. Moreover the strong 3D flow generated bythe TEA-C burner would require a characterizati on of the velocity and turbulence field across measureme nt surfaces rather than along lines.
Grid independency studies were applied to both domains. Both grids were made of tetrahedr ons and hexahedr ons in the burner and its quarl, whereas a structured grid was used for the furnace.In order to make it possible, cooling loops were assumed to have a square cross section of perimeter equal to that of their real cross section circumfe rence. Special refinements near the burner were

Fig. 3. Surfaces used to cut the complete domain, corresponding to secondary (blue) and tertiary (red) duct inlets for the reduced domain. (For interpretation ofthe references to colour in this figure legend, the reader is referred to the web version of this article.)
C. Galletti et al. / Fuel 109 (2013) 445–460 449
also adopted. The complex domain leaded to a grid consisting of4.5 M cell (Fig. 4a), whereas the reduced domain leaded to 3.4 Mcells (Fig. 4b). As a matter of fact, such 30% reduction in computa- tional cells allows a considerable time savings because of the large computational cost of the simulatio ns.
Fig. 4. Details of the grids for the (a) complete and (b) reduced domains.
4.2. Validation procedure and choice of boundary conditionsIn the framework of oxy-NG combusti on experiments in the FoSper furnace, important validation aspects regard:
– the geometry, due to the complexity of the burner;– the choice of the turbulence model, due to the presence of
swirled flows;– the choice of the combustion model/kineti c mechanisms;– the choice of radiation/spectr al models.
Moreover some boundary conditions (BCs) have to be properly set as not directly available from the experime ntal campaign. This is the case of air leakage, which unavoidably occurs when retrofit-ting existing air-fired furnaces to oxy-fired conditions. The amount of air leakage is reconstructed by performing a mass balance on the system based on the flue gas compositi on; however uncertainties still exist on the location of the air leakage. In the present work the air leakage was evaluated to be 194 kg/h by performing mass balances and trying to minimize the errors on both CO2 and O2
measureme nts; however one can chose to minimize the error onjust one species. Air leakage occurs not in the furnace but also inthe circuit. The distribution of air leakage from the furnace walls is hard to evaluate. Moreover, as mentioned previousl y, the furnace is kept at slight over-pres sure in order to reduce air leakage; for this reason it is assumed that air leakage occurs mainly in the gas circuit. Therefore, in the present simulatio ns air leakage is con- sidered by adding air to the primary and secondary recycled fluegases streams, and distributing it proportionally to the two stream mass flow rates. Logically this procedure has to be validated.
For the BCs at the furnace walls, two options were investigated :a wall temperature profile (and emissivity) from measurements and a heat flux obtained from an energy balance on the overall fur- nace. The latter was found to be unable of correctly estimating the temperature field. In particular, an over-predic tion of temperature in the bulk of the furnace by more than 300 K was observed at the
first measuring port (z = 0.17 m), indicating that the hypothesis ofa uniform heat flux leads to wrong BCs at the refractory walls. The knowled ge of a temperature profile along the furnace walls leads to a strong improvement of predictio ns. Therefore wall tempera- ture measurements are very attractive for providing boundary con- ditions to the numerica l model.
According to the above points, a modeling program was definedand this is illustrate d in the scheme of Fig. 5. This consisted mainly of four steps:
(1) In the first step, isothermal tests in air (with velocity mea- surements) were performed and results compare s to predic- tions obtained with different turbulence models. The standard k-e turbulence model was compare d to the SST k-x model and to the Reynolds Stress models, which are more suited for the swirled flow under investigations. The simula- tion of such tests was performed with the complete domain.
(2) In the second step, BCs from gaseous combustion experi- ments (mass flow rates, species concentrations and temper- atures) were used to set non-reactive simulatio ns with the complete geometry.
(3) In the third step, the same simulations of step 2 were per- formed on the reduced geometry. To do that, velocity, turbu- lence characterist ics, temperature and species mass fractions profiles were extracted from the simulations ofstep 2 and set as BCs to the inlets of the secondary and ter- tiary ducts. If such approach is correct, velocity profilesinside the furnace obtained with simulatio ns of steps 2and 3 should coincide.
(4) In the fourth step, gas combustion tests are simulated with the reduced domain. Inlet BCs are obtained from previous step. Simulate d results are compared with available mea- surements of temperature and species concentr ations inside the furnace.

Fig. 5. Validation program for oxy-NG combustion tests in FoSper furnace.
450 C. Galletti et al. / Fuel 109 (2013) 445–460
The level of agreement between experiments and predictions isevaluated through the use of error validation metrics [27]. It is pos- sible to define an average relative error, normalizi ng the absolute error by the estimate d sample mean and summing over the range of the input variable:
~E�ye
����������
avg
¼ 1N
XN
i¼1
ym;i � �ye;i
�ye;i
�������� ð1Þ
where N is the number of observed points, ym,i and ye,i are the mean measureme nt and the predicted value of variable y at the point i.The relative error is used for temperat ure.
For species concentratio ns it will be referred to average abso- lute errors, defined as
j~Ejavg ¼1N
XN
i¼1
jym;i � �ye;ij ð2Þ
because chemical species concentration s may tend to zero value insome positions, thus leading to numerica l divergence .
4.3. Physical model
The reactive simulations were carried out by resolving Favre- averaged Navier–Stokes equations by means of a stationar y pres- sure-based solver with double precision .
A property u can be decomposed into ~u , which represents the Favre-avera ge, and ~u00, according to:
~u ¼ qu�q
ð3Þ
u ¼ eu þu00 ð4Þ
The application of such average to the Navier–Stokes, species and enthalpy transport equations leads to:
rðq~uÞ ¼ 0 ð5Þ
rðq~u~uÞ ¼ �r�p�rðq gu00u00 Þ þ rs ð6Þ
rðqeY k ~uÞ ¼ rJk �rðq gY 00ku00 Þ þ _wk ð7Þ
rðq~h~u ¼ rðJh þ fusÞ � rðq gh00u00 Þ þ euF þ Q rad ð8Þ
Hence, in the Eqs. (3-8) ~u, eY k and ~h represent the Favre-aver- aged velocity, mass fraction of the kth species and enthalpy,respectivel y. q, p, Jk, Jh, Q rad and s are the standard time-averag eddensity, static pressure, species and heat diffusive fluxes, radiant heat and stress tensor. The latter is expressed in terms of velocity field and viscosity through the costituitive equation.
The Reynolds stress tensor �q gu00u00 should be expresse ndthrough the turbulence model. In the present case, reactive simu- lations were performed with the shear stress transport (SST) k–xmodel of [24]. Such a model is based on the k–x model formula- tion in the near wall region and switches to the standard k–e modelin far field using suited blending function. The model is expected tobe more accurate than the standard k–e model in presence of swirl- ing flows.
Recently Chen and Ghoniem [25] showed that the SST model k–x could capture the flow structure in a swirl oxy-coal burner bet- ter than the RNG and standard k–e model.
Actually, the performanc e of different turbulence models in pre- dicting the flow field in FoSper furnace equipped with TEA-C bur- ner has been previously compare d for isothermal tests [21],however differenc es should be expected in the performanc e of tur- bulence models between non- and reactive condition s [17,28], sothat results are of little significance.
Two different turbulence/chem istry interaction models were compare d: the Eddy Dissipation Model (EDM) by Magnussen and Hjertager [29] and the Eddy Dissipati on Concept (EDC) byMagnussen [30]. In the EDM model the chemical reactions are governed by turbulent mixing so that reaction rates are ex- pressed as a function of the turbulent characteri stics, basically the turbulent kinetic energy and its dissipatio n. This model islargely used for simulating combustion furnaces, however it does not account for finite rate chemistry effects, it being based on amixed is burnt approach. According to EDC, combustion occurs in regions (‘‘fine structure s’’) of the flow where the dissipation

C. Galletti et al. / Fuel 109 (2013) 445–460 451
of turbulent kinetic energy takes place; such regions are treated as perfectly stirred reactors (PSR). The mass fraction of the finestructures, ck, and the mean residence time of the fluid within the fine structures, s⁄, are provided by an energy cascade model,which describes the energy dissipation process as a function ofthe characteri stic scales. Thus such a model is able to account for chemistry effect. To reduce the computational time, the in situ adaptive tabulation (ISAT) method of Pope [31] with var- ious error tolerances (decreased gradually) was employed when using EDC. Results were found to be independent on the ISAT er- ror tolerance when this was lower than 10�5.
The NG fuel was modeled as a mixture of CH4 (85.7% by vol),C2H6 (5.4% by vol), C3H8 (2.2% by vol), N2 (5.5% by vol), CO2 (1.2%by vol).
Different global kinetic mechanisms were tested for the fuel oxidation. The global kinetic mechanis m of Westbrook and Drier [6] consisting of fuel oxidation (CH4, C2H6, C3H8) to CO and subse- quently oxidation of CO to CO2 is employed and will be denoted asWDair.
CH4 þ 1:5O2 ) COþ 2H2OCOþ 0:5O2 ) CO2
CO2 ) COþ 0:5O2
ð9Þ
Andersen et al. [5] proposed a modification of the rates of the CO/CO2 subset (second and third reactions ) to better predict oxy- fuel combusti on; such a version is also tested and will be denoted as WDoxy.
The 4-step global kinetic mechanis m by Jones and Lindstedt [7],namely JLair, was also employed for the CH4 oxidation subset, as itis extensively used for the modeling of industrial combustion devices.
CH4 þ 0:5O2 ) COþ 2H2
CH4 þH2O) COþ 3H2
H2 þ 0:5O2 () H2OH2Oþ CO() CO2 þH2
ð10Þ
The mechanis m consists of two irreversible reactions describin gthe initial oxidation steps of a hydrocarbon through addition with O2 and H2O, respectively, and formatio n of CO and H2. The third and fourth reversible reactions control the rate of reaction for COand H2. The revised version of the model proposed by [5], consist- ing of a modification of the third reaction rates, is also used, as will be denoted as JLoxy.
All kinetic schemes are summarized in Table 2.
Table 2Kinetic mechanisms WDair [6] and JLair [7], and revised versions WDoxy and JLoxy [5]. U
Mechanism Reactions A
WDair [6] CH4 + 1.5 O2) CO + 2 H2O 1.59 � 1013
CO + 0.5 O2) CO2 3.98 � 1014
CO2) CO + 0.5 O2 6.16 � 1013
WDoxy [5] CH4 + 1.5 O2) CO + 2 H2O 1.59 � 1013
CO + 0.5 O2) CO2 3.98 � 108
CO2) CO + 0.5 O2 6.16 � 1013
JLair [7] CH4 + 0.5 O2) CO + 2 H2 7.82 � 1013
CH4 + H2O) CO + 3 H2 3.00 � 1011
H2 + 0.5 O2 () H2O 4.45 � 1018
CO + H2O () CO2 + H2 2.75 � 1012
JLoxy [5] CH4 + 0.5 O2) CO + 2 H2 7.82 � 1013
CH4 + H2O) CO + 3 H2 3.00 � 1011
H2 + 0.5 O2) H2O 5.00 � 1020
H2O) H2 + 0.5 O2 2.93 � 1020
CO + H2O () CO2 + H2 2.75 � 1012
The P1 radiation model was employed although some simula- tions were performed also with the Discrete Ordinate model. The gas phase spectral properties were evaluated through the WSGG model, which computes the gas emissivity as:
e ¼X
i
aiðTÞ½1� expð�jiðpH2O þ pCO2ÞsÞ� ð11Þ
where s is the radiation beam length, pH2O and pCO2are the partial
pressures of the absorbing gases H2O and CO2. The weight aj repre-sents the fraction of the blackbody radiation that belongs to the spectral regions where the absorption coefficient is ji. The weights depend on temperatur e according to:
aiðTÞ ¼X
j
bi;jðT=TrefÞj�1 ð12Þ
Two different WSGG models were applied:
– the WSGG model available in the code which is a 1-clear/3 -gray gas model with coefficients from [32];
– a revised version proposed by Johansson et al. [13] for oxy-fuel condition s, which is a 1-clear/4-gray gas model optimized for H2O to CO2 partial pressure ratio of 0.125, which better approx- imates the dry flue gas recirculation of the present oxy-NG campaign s.
The latter model was applied by defining an ad hoc subroutine written in C++ language and its coefficients are reported in Table 3.
The emissivity of the furnace walls was set to 0.7.A mass flow rate condition was given to the primary duct inlet,
whereas profiles of velocity components, turbulent characteri stics as well as species concentration (computed from non-reactive runs on the complete domains) were given to the inlet section of the secondar y and tertiary ducts. A pressure outlet condition was set for the furnace exit. As mentioned previousl y, a temperature pro- file was given to the furnace walls, whereas a heat extraction,available from measure ments [17], was set for each cooling loop,thus treating them individually .
The second order upwind discretizatio n scheme was applied for the spatial discretiza tion. To help solution converge nce, such ascheme was initialized on results obtained with a first order scheme. Convergence was ensured by all residuals below 10�5, ex- cept for the continuity equation for which residuals were of about 10�4. Moreove r the stabilizati on of physical quantities was moni- tored at different location inside the furnace.
Typically, runs with EDC needed about 20 days to be completed using 32 processor s, whereas EDM runs were much faster.
nits are in cm, s, cal, mol.
b Ea Reaction order
0 47,800 [CH 4]0.7[O2]0.8
0 40,700 [CO][O 2]0.25[H2O]0.5
0 40,700 [CO 2]0 47,800 [CH 4]0.7[O2]0.8
0 10,000 [CO][O 2]0.25[H2O]0.5
�0.97 78,400 [CO 2] [H2O]0.5[O2]�0.25
0 30,000 [CH 4]0.5[O2]1.25
0 30,000 [CH 4][H2O]�1 40,000 [H2]0.5[O2]2.25[H2O]�1
0 20,000 [CO] [H2O]0 30,000 [CH 4]0.5[O2]1.25
0 30,000 [CH 4][H2O]�1 30,000 [H2]0.25[O2]1.25
�0.877 97,900 [H2]�0.75[O2] [H2O]0 20,000 [CO] [H2O]

Table 3Constants of the 1-clear/3-gray gases WSGG model by [13].
i 1 2 3 4
ji 0.0408 0.4217 5.2010 122.48 b1 0.2719 0.3677 0.2324 0.1058 b2 0.0896 �0.1284 �0.1214 �0.0602b3 �0.0327 �0.0030 0.0170 0.0080
Fig. 6. Distribution (calculated from complete domain simulations) across the secondary and tertiary duct inlets for the reduced domain, of (a) axial velocity (m/s), (b) tangential velocity (m/s) and (b) turbulent kinetic energy (m2/s2).
452 C. Galletti et al. / Fuel 109 (2013) 445–460
5. Results
5.1. Verification of reduced domain
Fig. 6 shows the distribut ion of axial and tangential velocities,as well as turbulent kinetic energy, across the reduced domain in- let surfaces for the secondar y and tertiary ducts. Such distributions were obtained from calculations on the complete domain. It can benoticed the strong 3D features for the flow field.
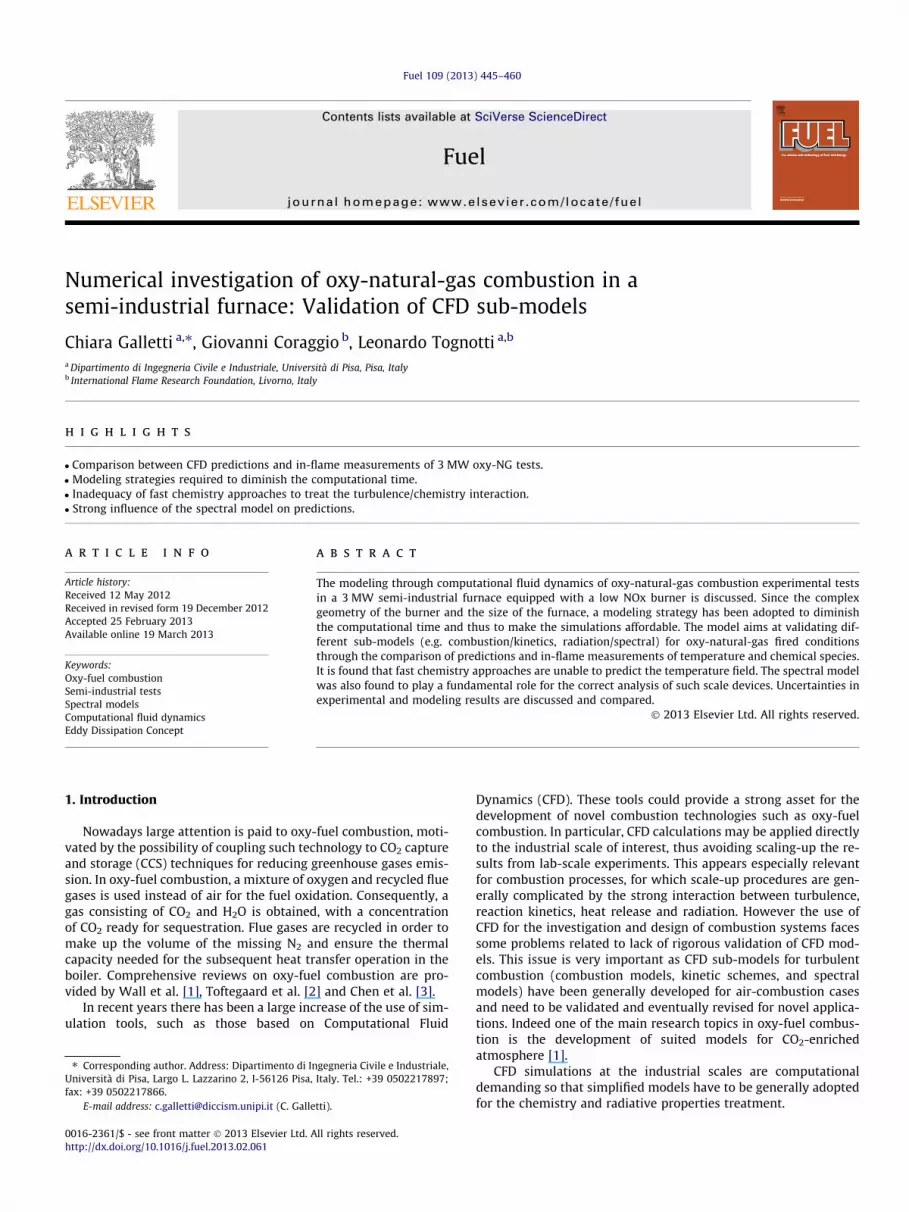
The reduced domain was verified through comparison ofvelocity profiles obtained at different axial distances z in the fur- nace with the completed domain for non-reactive tests (seescheme of Fig. 5). Fig. 7a and b shows such comparis on for the ax- ial and tangential velocities, respectively . It can be noticed that the agreement is satisfactory, thus allowing operating with the reduced domain in order to decrease the computational time ofabout 30%.
5.2. Effect of combustion model
Fig. 8a and b shows the transverse distribution of temperature and O2 molar fraction (dry), respectively, within the furnace pre- dicted with the EDC model and WDair scheme. It can be noticed the complex shape of the flame, which is generate d from the TEA-C burner. The 3-dimensional ity of the flame is well evident from the temperat ure distribut ion in cross sections of the furnaces correspondi ng to the first (z = 0.17 m) and second (z = 0.46 m)measuring ports (see Fig. 9b and d, respectivel y). The TEA-C burner generates a flame which is not axisymmetri c, but varies with the angular coordinate, because of the peculiar injection of GN and oxi- dizer through three different nozzles. This angular dependence smoothers far away from the burner. Fig. 9a and c shows the much different distribut ions obtained with the EDM model and for the same WDair scheme, thus highlight ing the strong effect of the tur- bulence/chem istry interactio n treatment on the temperature field.
Fig. 10 compare s the measure d radial profiles of temperatures and CO2 with those predicted with the two different combustion models. It can be noticed that temperature experimental data atthe first port (z = 0.17 m, see Fig. 10a) show high temperatures for r = 0.15–0.2 m. Such peak temperatures are not detectable bythe EDM combusti on model, which predicts a low temperature re- gion, the maximum temperature being of 1461 K for r = 0.15–0.2 m. This does not mean that EDM does not predict a flame front for z = 0.17 m, but rather than the flame front does not cross the horizontal plane corresponding to the insertion of the pyrometer in the furnace (see transverse contours of Fig. 9a). However, even considering uncertainti es in the measureme nts location by assum- ing that the suction pyrometer is not measuring precisely on the horizontal plane, but at maximum 2 cm far (according to the experimental experience) the poor performanc e of the EDM model cannot be justified [33]. The EDC model performs much better as itis able to correctly predict the temperature peaks in such a loca- tion, even though values are higher than measured ones for r = 0.15–0.2 m. This could be imputed to the global mechanisms used in the present work which usually tend to over-estimate the temperature s with respect to more complex schemes. The
better performanc e of the EDC model is confirmed also by the error metrics of temperatures reported in the first and second columns of Table 4. The EDM model showed a relative error of 23.2% atz = 0.17 m and of 14.7% globally, whereas the EDC model provided a relative error of 14.3% at z = 0.17 m and 10% globally. The same conclusio ns can be also drawn from the CO2 concentr ation profilesof Fig. 10a. Only the EDC model is able to capture the measure d
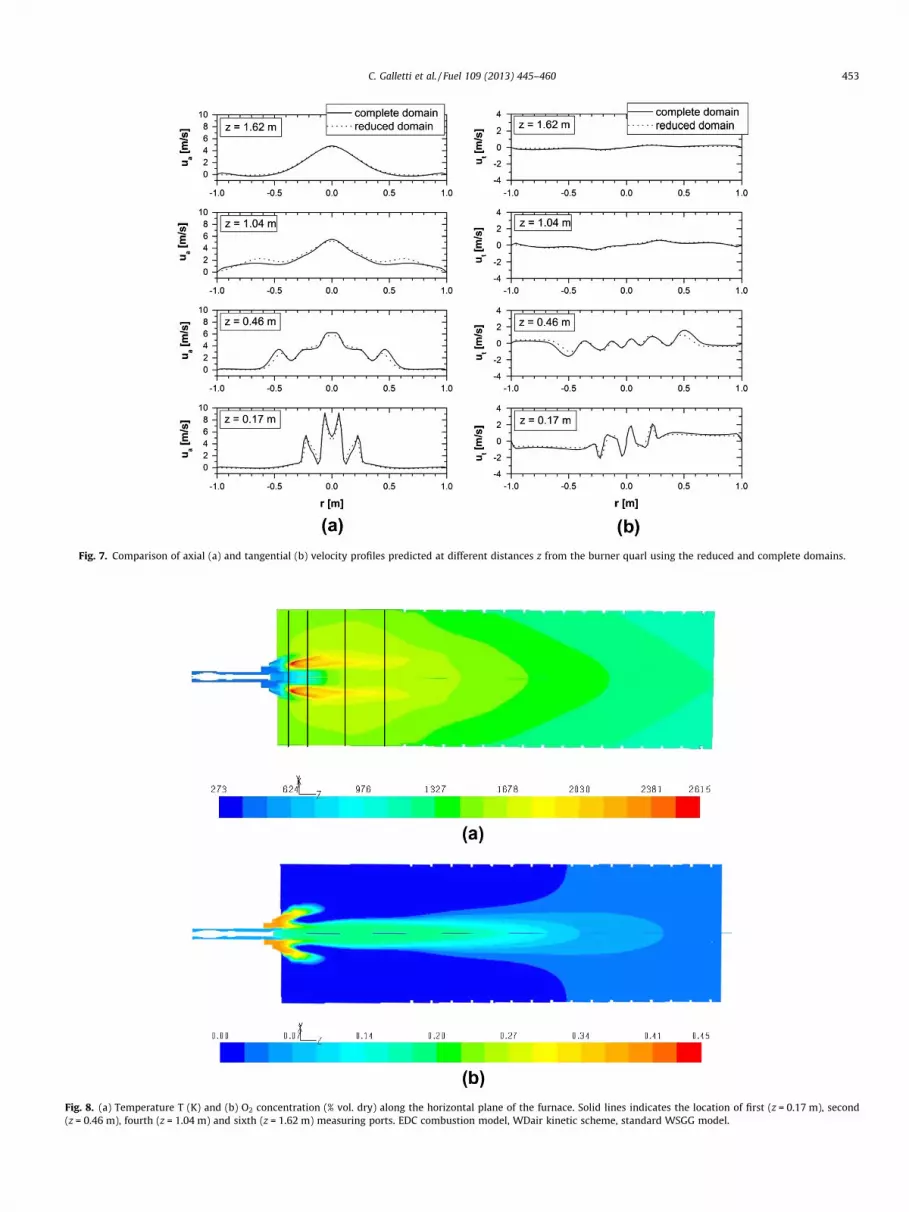
Fig. 7. Comparison of axial (a) and tangential (b) velocity profiles predicted at different distances z from the burner quarl using the reduced and complete domains.
Fig. 8. (a) Temperature T (K) and (b) O2 concentration (% vol. dry) along the horizontal plane of the furnace. Solid lines indicates the location of first (z = 0.17 m), second (z = 0.46 m), fourth (z = 1.04 m) and sixth (z = 1.62 m) measuring ports. EDC combustion model, WDair kinetic scheme, standard WSGG model.
C. Galletti et al. / Fuel 109 (2013) 445–460 453

Fig. 9. Temperature distribution T (K) in cross sections of the furnace corresponding to (a and b) first (z = 0.17 m) and (c and d) second (z = 0.46 m) measuring ports obtained with: (a–c) EDM and (b–d) EDC combustion models. WDair kinetic scheme, standard WSGG model.
454 C. Galletti et al. / Fuel 109 (2013) 445–460
CO2 peak at r = 0.15–0.2 m, and thus the CO2 trend (see also valida- tion metrics reported in the first and second columns of Table 5).
At further distances (second port, z = 0.46 m see Fig. 10b), the EDM and the EDC model predictions are much closer. The EDM model estimate s temperatures above of 2200 K for r = 0.18–0.3 K,whereas the maximum experimental temperature in such a region is 2000 K (at r = 0.2 m). The EDC model captures perfectly the tem- perature values for r = 0.15, 0.2 and 0.3 m whereas it predicts high- er values for r = 0.25 m. It could be desirable to have more experimental points as the distances between them may hidden the presence of experimental peaks in some locations; however it should be taken into account the difficulty in carrying out semi-industr ial experimental campaigns. The CO2 radial profile atz = 0.46 m indicated that the EDC model correctly predicts a con- centration peak for r = 0.175 m and the trend for larger radial dis- tances although some over prediction of CO2 concentratio n isobserved for r = 0.3–0.5 m. Its performance is anyway superior tothat of the EDM model as confirmed also by the absolute validation metrics, which were of 6.6% and 4% for the EDM and EDC model,respectively .
At z = 1.04 m (Fig. 10c) the impact of the combustion model is less visible, with smaller differences between prediction with EDM and EDC. The temperature profiles are well captured except for the tem- perature measurement in the axis (T = 1113 K for r = 0) which is lar- gely over-predicted by both models. The CO2 radial profile shows significant discrepancies although the trends are correct.
Finally at z = 1.62 m (Fig. 10d) EDM and EDC predict similar pro- files which capture well the temperature measurements ,
indicating a proper energy balance in the furnace. The CO2 radialprofile shows some significant discrepancie s. However, such dis- crepancie s were found to decrease for larger distances from the burner, indicating a correct air leakage evaluation through mass balances in the systems. It is worth noting that such agreement could not be achieved by performing the mass balance with differ- ent criteria, as for instance by minimizing the errors on just one species (e.g. O2) instead of both (CO2 and O2).
5.3. Effect of kinetic scheme
The effect of kinetic schemes on the predictio ns is shown inFig. 11, which reports the comparison between measured radial profiles of temperature and CO2 and those predicted different ki- netic schemes coupled to turbulence through the EDC model. Asmentioned earlier, all schemes are global, as the large computa- tional cost of the simulatio ns prevented from using more complex kinetics. It can be noticed that the choice of the kinetic schemes af- fects strongly the predictions.
As for temperat ure, all models except for JLoxy, are able to cap- ture trends. In particular at z = 0.17 m (Fig. 11a) they correctly pre- dict the presence and position of the temperature peak, as well asthe decrease for temperature with a further increase of the radial distance. It can be also noticed how the modification of the WDscheme proposed by [5] is very effective in reducing the too high temperat ure peak predicted by the original WD global scheme.The CO2 concentratio n profiles indicate a better performance ofthe WDair and WDoxy schemes, as the JLair scheme detects low

Fig. 10. Comparison between experimental temperature and CO2 concentration and those predicted with EDM and EDC combustion model at different measuring ports: (a)z = 0.17 m, (b) z = 0.46 m, (c) z = 1.04 m, and (d) z = 1.62 m. WDair kinetic scheme, standard WSGG model.
C. Galletti et al. / Fuel 109 (2013) 445–460 455
CO2 levels at r = 0.2 m, not noticed by the measureme nts. The JLoxy shows the worse predictions as proved by the validation metrics for temperature , CO2 and O2 (see Tables 4–6, respectively ). Similar conclusions may be drawn from the comparison at z = 0.46 m(Fig. 11b).
With further distances (z = 1.04 m, see Fig. 11b) the impact ofthe kinetic schemes on the temperat ure profiles is lower, indicat- ing that the heat release is almost completed. However CO2 profilesshow significant differences between predictio ns and measure -ments. The JLair and JLoxy schemes better capture the low CO2

Fig. 10. (continued)
Table 4Error metrics (average relative error), eEye
������avg½%�, of temperature, evalu ated globally and
for each measuring port, as obtained with different sub-models.
EDM EDC EDC EDC EDC EDC WDair WDair WDoxy JLair JLoxy WDair WSGG WSGG WSGG WSGG WSGG WSGGoxy
Port1 (z = 0.17 m) 23.2 14.3 14.7 11.0 27.9 13Port2 (z = 0.46 m) 12.7 12.3 14.1 10.3 12.7 8.5 Port4 (z = 1.02 m) 6.2 7.3 8.3 7.4 6.9 5.6 Port6 (z = 1.64 m) 2.8 3.0 2.6 3.1 3.8 4.8 Average (all ports) 12.8 10.2 11.0 9.3 15.3 8.7
Table 5Error metrics (average absolute error), jeEjavg½%� of CO2, evaluated globally and for each measuring port, as obtained with different sub-models.
EDM EDC EDC EDC EDC EDC WDair WDair WDoxy JLair JLoxy WDair WSGG WSGG WSGG WSGG WSGG WSGGoxy
Port1 (z = 0.17 m) 8.0 3.6 5.7 9.1 9.7 5.1 Port2 (z = 0.46 m) 6.6 4 8.4 3.5 5.1 7.3 Port4 (z = 1.02 m) 6.3 5.8 5.8 2.2 9.0 6.0 Port6 (z = 1.64 m) 5.9 7 4.7 2.8 10.4 4.4 Port10 (z = 3.84 m) 2.4 1.1 2.4 1.6 3 2.5 Port14 (z = 6.2 m) 2.4 0.6 2.5 0.6 8.6 2.8 Average (all ports) 5.6 4.2 5.9 7.3 8.0 5.4
456 C. Galletti et al. / Fuel 109 (2013) 445–460
levels at r = 0.3 m, whereas the WDair and WDoxy schemes per- form better with increasing radial distances.
At z = 1.62 m the temperature profiles are well predicted (ex-cept for the low temperat ure point at r = 0), whereas some discrep- ancies are found for CO2. The CO2 measure ments are only well captured at the following measuring ports (z = 3.84 m), as evinced by the validation metrics of Table 5, indicating errors lower than 2.5%.
The same conclusio ns may be drawn from the comparison ofmeasured and predicted O2. The graphica l comparis on is not re- ported here, but the validation metrics for all models are given inTable 6.
CO measureme nts could not be exploited effectively as in many locations the measurements exceeded the upper threshold level ofthe instruments . Results seems to indicate that the better
agreement was achieved with the revised version of WD, WDoxy,thus confirming the effectivenes s of the revision proposed by [5]however further experime ntal data are needed for validate the ki- netic schemes., standard WSGG model.shows the example of prop- agation of model uncertainty into predicted temperat ure profilesat two ports, illustrating also the temperature experimental uncer- tainty. Given the same turbulence/chem istry interaction model (EDC) the graphs show the effect of the choice of the kinetic scheme on the modeling results: it can be noticed the wide range of temperat ures obtained with the different models. As for the temperat ure experimental uncertainties, these have been obtained by considering all possible sources of errors related to the use ofthe suction pyrometer (i.e. errors due to inefficient convective heat transfer; errors related to gas velocity, conduction and radiation;errors of the voltmeters and of the thermocouple; statistical er- rors). Details of the experimental uncertainty evaluation can befound in [21].
The graphs of Fig. 12 give an idea of the importance of perform- ing a hierarchical sensitivity analysis on different modeling issues:for instance it can be noticed how the low temperat ure data near the axis lies well outside of the range of predictions spanned bythe different models, thus demanding for further explanation.
5.4. Effect of spectral model
The spectral model was also found to play an important role,indicating that this aspect should be addressed for the modeling of such semi-industr ial tests. Fig. 13 shows the comparison be- tween experimental profiles of temperat ure and those predicted with the standard and revised WSGG spectral models, using the EDC combustion model and the WDair kinetic scheme. It can benoticed that the use of a revised WSGG for oxy-fuel condition s lar- gely improves the temperat ure predictions near the furnace axis. Insuch a manner the low temperature region near the axis is well captured at z = 0.17 m and z = 0.46 m. At z = 1.02 m some under- predictio n of temperature is observed, however results are much more in agreement than those obtained with the standard version of the WSGG. This is also well represented by the validation error metrics which show that the lowest deviation from experime nts was achieved through the revised version of WSGG (see Table 4).We believe that further improvements could be achieved by adapt- ing the WSGG polynomials to the real conditions of the present investiga tions.

Fig. 11. Comparison between experimental temperature and CO2 concentration and those predicted with different kinetic schemes at different measuring ports: (a)z = 0.17 m, (b) z = 0.46 m, (c) z = 1.04 m, and (d) z = 1.62 m. EDC combustion model, standard WSGG model.
C. Galletti et al. / Fuel 109 (2013) 445–460 457
6. Discussion and conclusion s
Numerical simulations of a semi-indus trial furnace equipped with a low NOx burner and operated in oxy-fired condition s have been performed trying to validate different sub-models.
The validation procedure faces some criticism, when applied tosemi-industr ial devices, especially because the scale of the burner/ furnace requires significantly demanding computational grid, sothat efforts are needed in order to optimize the computati onal time. The validation approach followed herein demonstrated that

Fig. 11. (continued)
Table 6Error metrics (average absolute error), jeEjavg½%�, of O2, evaluated globally and for each measuring port, as obtained with different sub-models.
EDM EDC EDC EDC EDC EDC WDair WDair WDoxy JLair JLoxy WDair WSGG WSGG WSGG WSGG WSGG WSGGoxy
Port1 (z = 0.17 m) 9.9 5.0 6.6 4.5 12.1 4.3 Port2 (z = 0.46 m) 5.9 3.9 4.2 3.5 5.5 4.5 Port4 (z = 1.02 m) 2.5 2.0 1.6 2.2 3.3 1.8 Port6 (z = 1.64 m) 3.0 2.7 2.3 2.8 3.4 2.3 Port10 (z = 3.84 m) 2.6 1.3 1.5 1.6 2.4 1.7 Port14 (z = 6.2 m) 0.9 0.8 1.7 0.6 2.2 0.8 Average (all ports) 6.3 3.4 3.8 3.2 6.4 3.3
458 C. Galletti et al. / Fuel 109 (2013) 445–460
uncertainties due to the choice of different sub-models and bound- ary conditions are greater than experimental uncertainties .
Other issues regard some uncertainties related to air leakage which unavoidably occurs when retro-fitting existing air-fired fur- naces for oxy-fuel combustion. Provided that the amount of air leakage can be reconstru cted from available measureme nts onthe flue gas composition by performi ng a mass balance, the
Fig. 12. Propagation of model uncertainty into predicted temperature profiles (EDC mode(b) port 4 (z = 1.04 m): error bars represent experimental uncertainties of local mean te
location of the air leakage cannot be known precisely and has tobe assumed.
The work has shown that the turbulence/ chemistry interaction treatment plays a major role in determining the temperat ure and species fields, thus indicating the inadequacy of fast chemistry ap- proaches . The Eddy Dissipati on Concept was found to provide sat- isfactory predictio ns of the temperature and major species field.Oxidation mechanis ms, here addresse d only through global schemes , are also found to affect considerably predictions; how- ever a precise conclusion on the superiority of one scheme may be not drawn as the CO measureme nts could not be fully exploited.So far, slightly better results seem to be obtained with the WDscheme modified for oxy-fuel conditions, whereas the JL schemes show larger discrepancie s. However it should be pointed out that a revision of the global mechanism should be made by taking into considerati on the specific conditions of the present runs, which were characteri zed by a strong air leakage, thus by the presence of a non-negligible amount of N2 in the reaction region.
Finally, a strong influence of the spectral model was observed:only a revised version for oxy-fuel condition was found to be able to capture a low temperat ure region near the furnace axis,
l and different kinetic schemes, standard WSGG model) at (a) port 2 (z = 0.46) m and mperatures.

Fig. 13. Comparison between experimental temperature and that predicted with standard and revised WSGG model at different measuring ports: (a) z = 0.17 m, (b)z = 0.46 m, (c) z = 1.04 m, and (d) z = 1.62 m. EDC combustion model, WDair kinetic scheme.
C. Galletti et al. / Fuel 109 (2013) 445–460 459
although the WSGG model should be optimized for the precise conditions of the present oxy-fuel experiments. Therefore it is rec- ommended to use spectral modes suited for oxy-fuel conditions especially when dealing with large scale furnaces.
Future work will concentrate on the revision of kinetic schemes for the specific conditions of the present investigatio ns and on pre- dictions of NO emissions.
Acknowled gments
We would like to thank Ing. A. Rallo and S. Pelagallo who carried out a large part of the computati onal runs.
References
[1] Wall T, Liu Y, Spero C, Elliott L, Khare S, Rathnam R, et al. An overview onoxyfuel coal combustion—state of the art research and technology development. Chem Eng Res Des 2009;87:1003–16.
[2] Toftegaard MB, Brix J, Jensen PA, Glarborg P, Jensen AD. Oxy-fuel combustion ofsolid fuels. Progr Energy Comb Sci 2010;36:581–625.
[3] Chen L, Zheng Yong S, Ghoniem AF. Oxy-fuel combustion of pulverized coal:characterization, fundamentals, stabilization and CFD modeling. Prog Energy Combust Sci 2012;38:156–214.
[4] Glarborg P, Bentzen LLB. Chemical effects of a high CO2 concentration in oxy- fuel combustion of methane. Energy Fuels 2008;22:291–6.
[5] Andersen J, Rasmussen CL, Giselsson T, Glarborg P. Global combustion mechanisms for use in CFD modeling under oxy-fuel conditions. Energy Fuels 2009;23:1279–389.
[6] Westbrook CK, Dryer FK. Simplified reaction mechanisms for the oxidation ofhydrocarbon. Combust Sci Technol 1981;27:31–43.
[7] Jones WP, Lindstedt RP. Global reaction schemes for hydrocarbon combustion.Combust Flame 1988;73:233–49.
[8] Frassoldati A, Cuoci A, Faravelli T, Ranzi E, Candusso C, Tolazzi D, Simplifiedkinetic schemes for oxy-fuel combustion. In: 1st Int. Conf. on Sustainable Fossil Fuels for Future Energy – S4FE (2009) Rome, Italy.
[9] Smith F, Shen ZF, Friedman JN. Evaluation of coefficients for the weighted sum of gray gases model. J Heat Transfer 1982;104:602–8.
[10] Gupta R, Khare S, Wall T. Adaptation of gas emissivity models for CFD based radiative transfer in large air-fired and oxy-fired furnaces. Sheraton Sand Key,Clearwater, FL, USA: Coal Technology Association; 2006.
[11] Wang L, Endrud NE, Turns SR, D́Agostini MD, Slavejkov AG. A study of the influence of oxygen index on soot, radiation, and emission characteristics ofturbulent jet flames. Combust Sci Technol 2002;174:45–72.
[12] Andersson K, Johansson R, Johnsson F, Leckner B. Radiation intensity ofpropane-fired oxy-fuel flames: implications for soot formation. Energy Fuels 2008;22:1535–41.
[13] Johansson R, Andersson K, Leckner B, Thunman H. Models for gaseous radiative heat transfer applied to oxy-fuel conditions in boilers. Int J Heat Mass Trans 2010;53:220–30.
[14] Ströhle J. Wide band correlated-k approaches for non-grey radiation modelling in oxy-fuel combustion with dry recycling. Fuel 2011;90:3007–13.
[15] Yin C, Johansen LCR, Rosendahl LA, Kær SK. New weighted sum of gray gases model applicable to computational fluid dynamics (CFD) modeling of oxy-fuel combustion: derivation, validation, and implementation. Energy Fuels 2010;24:6275–82.
[16] Yin C, Rosendahl LA, Kær SK. Chemistry and radiation in oxy-fuel combustion:a computational fluid dynamics modeling study. Fuel 2011;90:2519–29.
[17] Coraggio G, Laiola M. Combustion of NG and pulverised coal in a mixture ofoxygen and RFG. IFRF Report n. F110/y/01, 2009.
[18] Coraggio G, Tognotti L, Cumbo D, Rossi N, Brunetti J. Retrofitting oxy-fuel technology in a semi-industrial plant: flame characteristics and NOx

460 C. Galletti et al. / Fuel 109 (2013) 445–460
production from a low NOx burner fed with natural gas. Proc Combust Inst 2011;33:3423–30.
[19] Toporov D, Bocian P, Heil P, Kellermann A, Stadler H, Tschunko S, et al. Detailed investigation of a pulverized fuel swirl flame in CO2/O2 atmosphere. Combust Flame 2008;155:605–18.
[20] Weber R, Peters AAF, Breithaupt PP, Visser BM. Mathematical modeling ofswirling flames of pulverized coal: what can combustion engineers expect from modeling? J Fluids Eng 1995;117:289–97.
[21] Parente A, Coraggio G, Galletti C, Tognotti L. Verification, validation and uncertainties quantification in industrial combustion modelling: some practical tools. IFRF Report n. G25/y/01, 2011.
[22] Oberkampf WL, Trucano TG. Validation in computational fluid dynamics. Prog Aerosp Sci 2002;38:209–72.
[23] Galletti C, Parente A, Coraggio G, Tognotti L. Estimation of uncertainties inexperimental data and model predictions for a semi-industrial furnace. IFRF members conference, vol. 16, Boston, 2009.
[24] Menter FR. Two-equation eddy-viscosity turbulence models for engineering applications. AIAA J 1994;32:1598–605.
[25] Chen L, Ghoniem AF. Simulation of oxy-coal combustion in a 100 kWth test facility using RANS and LES: a validation study. Energy Fuels 2012;26:4783–98.
[26] Peters AAF, Weber R. Mathematical modeling of a 2.4 MW swirling pulverized coal flame. Combust Sci Technol 1997;172:131–82.
[27] Oberkampf WL, Barone MF. Measures of agreement between computation and experiment: validation metrics. J Comput Phys 2006;217:5–38.
[28] Weber R, Dugue J. Combustion accelerated swirling flows in high confinements. Prog Energy Combust Sci 1972;18:349–67.
[29] Magnussen BF, Hjertager BH. On mathematical modeling of turbulent combustion with special emphasis on soot formation. Proc Combust Inst 1976;16:719–29.
[30] Magnussen BF. On the structure of turbulence and a generalized eddy dissipation concept for chemical reaction in turbulent flow. In: 19th AIAA aerospace science meeting, St. Louis, Missouri; 1981.
[31] Pope SB. Computationally efficient implementation of combustion chemistry using in situ adaptive tabulation. Combust Theory Model 1997;1:44–63.
[32] Coppalle A, Vervisch P. The total emissivities of high-temperature flames.Combust Flame 1983;49:101–8.
[33] Galletti C, Modesti A, Pelagallo S, Brunetti I, Rossi N, Tognotti L. Validation ofoxy-combustion modelling via semi-industrial furnace tests. In: Proceedings of PTSE. Ischia, Italy, June 2010.

![Cholesteric Liquid-Crystal Copolyester, Poly[oxycarbonyl- 1,4-phenylene- oxy - 1,4 terephthaloyl- oxy- 1,4-phenylene- carbonyloxy (1,2-dodecane)] [C34H36O8]n, Synthesized from Racemic](https://img.pdfslide.net/doc/110x75/63372842605aada553005a30/cholesteric-liquid-crystal-copolyester-polyoxycarbonyl-14-phenylene-oxy-14.jpg)