Embed Size (px)
Citation preview

New Jersey Collaborating Center for Nursing
Nursing Data and Analysis
Educational Capacity 2018-2019 Workforce Supply Data 2019-2020 Workforce Demand Data 2019
Nursing Data and Analysis
New Jersey Collaborating Center for Nursing
Edna Cadmus PhD, RN, NEA-BC, FAANExecutive Director
Pamela B. de Cordova, PhD, RN-BCNurse Scientist
Susan Weaver, PhD, RN, CRNI, NEA-BCNurse Scientist
Arun Ravichandran, MSData Analyst
Emilio La Fontaine, BAData Analyst
Victoria Field, BAAdministrative SupportZohar Hasson, BA
Administrative Assistant
Vision• To be the dominant voice on nursing workforce solutions for New Jersey citizens.
Mission• Ensure that competent, future-oriented, diverse nursing providers are available in sufficient
numbers and preparation to meet the demand of the evolving healthcare system in New Jersey.
• Transform the healthcare system through research and innovative model programs.
• Create a central repository for education practice and research related to the nursing workforce.
• Engage academic/practice partners, inter-professional colleagues, government and legislativeagencies, consumers, business, and industry.
• Promote a positive image for nursing.
The correct reference is as follows:New Jersey Collaborating Center for Nursing. (2021). Nursing data and analysis. Newark, NJ;
NJCCN.https://www.njccn.org/nursing-workforce-supply-and-demand/
NOTE:
Any future modifications to this report will be published electronically.For the most recent data on the New Jersey Nursing Workforce, visit www.njccn.org.
i
Contents
Introduction iiiHow to Use the Report . . . . . . . . . . . . . . . . . . . . . . . . . . . . . . . . . . . ivExecutive Summary . . . . . . . . . . . . . . . . . . . . . . . . . . . . . . . . . . . . . v
1 Educational Capacity Report 1Educational Capacity Report-RN . . . . . . . . . . . . . . . . . . . . . . . . . . . . . 1Educational Capacity Report-LPN . . . . . . . . . . . . . . . . . . . . . . . . . . . . 14Nurse Faculty Report . . . . . . . . . . . . . . . . . . . . . . . . . . . . . . . . . . . . 19
2 Workforce Supply Data 27Registered Nurse Profile . . . . . . . . . . . . . . . . . . . . . . . . . . . . . . . . . . 27Advanced Practice Nurse Profile . . . . . . . . . . . . . . . . . . . . . . . . . . . . . . 36Licensed Practical Nurse Profile . . . . . . . . . . . . . . . . . . . . . . . . . . . . . . 45Update to Nurse Retirement Projection . . . . . . . . . . . . . . . . . . . . . . . . . . 52
3 Workforce Demand Data 57Registered Nurse Demand Profile . . . . . . . . . . . . . . . . . . . . . . . . . . . . . 58Nurse Practitioner Demand Profile . . . . . . . . . . . . . . . . . . . . . . . . . . . . 63Licensed Practical Nurse Profile . . . . . . . . . . . . . . . . . . . . . . . . . . . . . . 67
4 Home Health Aide Profile 71Home Health Aide Workforce Profile . . . . . . . . . . . . . . . . . . . . . . . . . . . 71
Appendices 79Glossary . . . . . . . . . . . . . . . . . . . . . . . . . . . . . . . . . . . . . . . . . . . 79Methodology . . . . . . . . . . . . . . . . . . . . . . . . . . . . . . . . . . . . . . . . 82References . . . . . . . . . . . . . . . . . . . . . . . . . . . . . . . . . . . . . . . . . . 84Acknowledgements . . . . . . . . . . . . . . . . . . . . . . . . . . . . . . . . . . . . . 86
ii
Introduction
The New Jersey Collaborating Center for Nursing (NJCCN) is the primary source for data on NewJersey’s nursing workforce. NJCCN serves as a catalyst for the implementation of innovative educationand practice models using data to create programs that address needs in the state. To that end,NJCCN conducts an annual survey of all nursing education programs on behalf of the New JerseyBoard of Nursing (NJBON). This Educational Capacity Survey allows NJCCN to monitor enrollmentand graduation trends as well as demographics of both students and faculty. These data contributeto the supply data.
Working collaboratively with NJBON, NJCCN also collects workforce data at time of licensure re-newal for Registered Nurses (RNs), Licensed Practical Nurses (LPNs), and Advanced Practice Nurses(APNs). In 2018, NJBON transitioned its survey questions to the Nursys® Licensure and Workforcetool to align with national datasets. The Educational Capacity and Workforce data together createour understanding of the supply of nurses in New Jersey.
Based on the national trends and the need to monitor and prepare the workforce, NJCCN hasdetermined that using real-time demand data is an important first step in evaluating demand fornursing in New Jersey. While survey data for a specific industry is important, the limited response rateof surveys and the delays in obtaining primary data in real-time do not make these methods a first-tier approach. Quality data are a prerequisite for effective workforce planning and policymaking forthe nursing workforce. Healthcare workforce forecasting models provide a means for making futureprojections, which can be valuable in quantifying the supply, distribution, and demand of nursesand are critical to designing programs and policies that will ensure access to care and an effectivehealthcare system (Bienemy, 2015).
Forecasting nursing workforce supply and demand is complex. State-level data may be moredetailed than national data, leading state-level projections to differ substantially from their nationalcounterparts. Some variables, such as changes in healthcare or population shifts within New Jersey,may be too difficult to factor into the model. Though the goal is to provide current data on supplyand demand, one must view this report in the context of volatility. Workforce data should to beviewed with the following caveats:
• National estimates may differ from state data substantially
• Nurses work in teams and therefore other healthcare workforce members data are also importantto consider (e.g. Certified Nursing Assistants, Home Health Aides, and MDs)
• Projections that are further out in years have a greater error rate
• Data are only as good as the information that is provided by the respondent
iii

How to Use the Report
This report is broken up into the following chapters, with references and a glossary at the end:
• Chapter 1: Educational Capacity Report
• Chapter 2: Workforce Supply Data
• Chapter 3: Workforce Demand Data
• Chapter 4: Home Health Aide Profile
iv
Executive Summary
The World Health Assembly designated 2020 as the year of the nurse and midwife. This representsthe 200th anniversary of Florence Nightingale’s birth. She is recognized in history for her data-driveninterventions that improved health outcomes. The 2021 edition of the Nursing Data and AnalysisReport provides important insights on the workforce supply and demand data across settings. Thispast year has brought unprecedented factors that influence the data presented and will even be moretelling in the 2021 report. In addition to the aging baby boomers, the impact of COVID-19 iscontributing to some of the challenges seen in the data. The nursing pipeline may become impactedby the shortage of faculty across programs.
Areas That Need Focus
• Faculty recruitment, retention, diversity, equity, and inclusion needs to be addressed at a statelevel.
• Student diversity in the educational programs that are at a higher degree level need to beaddressed with a clear and actionable plan.
• National Council Licensure Exam (NCLEX) pass rates for LPNs in NJ are lower than thenational average and need to be addressed.
• Retirement shifting to lower age brackets will impact workforce shortages in certain specialties.
• Home Health Aide workforce data is needed as there is a growing demand for these workers.
Supply and Demand Projections for New Jersey
Registered Nurses
• Educational levels impact how quickly new graduates find positions. The higher the educationallevel the faster the job attainment.
• Enrollment in nursing programs is relative flat, there has been increase in BSN generic andaccelerated enrollment.
• Pre-licensure student’s racial and ethnic diversity continues to mirror the diversity of NJ’spopulation
• Post-licensure MSN and DNP enrollment and graduates continue to grow but are less diverse.
Licensed Practical Nurses
• Most racially and ethnically diverse nursing workforce
• Majority find jobs within 7 months.
• NCLEX pass rates in NJ are below the U.S. pass rates by 11%.
v
Faculty
• Vacancy rates for faculty both full-time and part-time continue to grow which will impact thepipeline of new enrollees to nursing programs.
• Faculty are primarily white and do not mirror the enrollment population across all programsexcept for LPN programs where there is greater diversity.
Current Workforce
• More than half of RNs are working in hospital settings; NPs are working in primary care; LPNsare working in nursing home/extending care, assisted living.
• Plans for retirement: RNs (5%); APNs (3%); LPNs (4%) over next licensure renewal period.
• Retirement age bracket has shifted downward into lower age bracket for the first time. Withthe pandemic effects, we need to monitor trends over the next year.
Demand
• Varies by county as to demand needs. Lower than average rate of demand for RNs; average rateof demand for APNs and LPNs.
vi
Chapter 1
Educational Capacity Report
This chapter presents program information and statistics on students and faculty in New Jersey’snursing education programs. These data were self-reported by schools in the 2018-2019 surveys. Thissurvey is distributed annually by NJCCN and compliance is reported to the NJBON. To reduceduplication and survey fatigue, data were obtained from the American Association of Colleges ofNursing (AACN) and a shorter survey was provided to BSN and higher deans and directors.
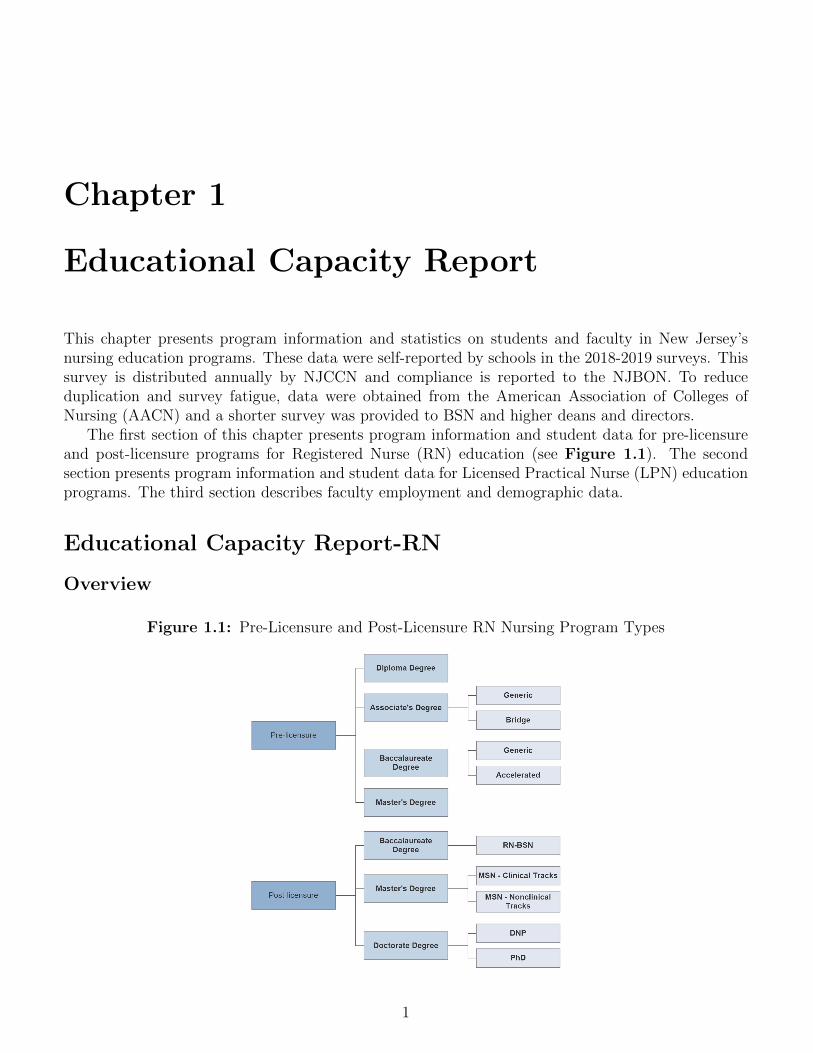
The first section of this chapter presents program information and student data for pre-licensureand post-licensure programs for Registered Nurse (RN) education (see Figure 1.1). The secondsection presents program information and student data for Licensed Practical Nurse (LPN) educationprograms. The third section describes faculty employment and demographic data.
Educational Capacity Report-RN
Overview
Figure 1.1: Pre-Licensure and Post-Licensure RN Nursing Program Types
1
There are 48 schools in New Jersey that provide RN education (pre-licensure and post-licensure).This report includes data for the 45 schools that responded to NJCCN’s Educational Capacity Sur-vey. Pre-licensure programs qualify graduates to sit for the National Council Licensure Examinationfor Registered Nurses (NCLEX-RN). These include Diploma in Nursing (DIP); Associate Degree inNursing (ADN); Baccalaureate of Science in Nursing (BSN); and Pre-licensure Master’s in Nursing(Pre-licensure MSN). Please note that though Associate Degree programs may be Associate Degreein Nursing (ADN), Associate of Science Degree in Nursing (ASN) or Associate of Applied Sciencein Nursing (AAS), for the purposes of this report, all Associate Degree Programs are abbreviated asADN.
Post-licensure programs provide additional credentials for graduates who have already attainedtheir RN licensure. These include RN-BSN Programs for Registered Nurses who obtained their degreeat the Diploma or Associate level; Post-Licensure Master’s Degrees (Post-licensure MSN) in clinicalor non-clinical tracks; Doctorate of Nursing Practice (DNP); and Doctor of Philosophy in Nursing(PhD).
New Jersey schools offer the following pre-licensure and post-licensure programs. Each school mayhave multiple programs. For example, one school could have both a Generic ADN and an ADN-Bridgeprogram.
NOTE: Data for the rest of this chapter only include respondent programs/schools.
Table 1.1: New Jersey RN Programs
Pre-licensure Nursing Programs5 Diploma18 Associate (14 Generic, 10 Bridge)22 Baccalaureate (22 Generic, 11 Accelerated)1 Pre-licensure Master’sPost-licensure Nursing Programs17 RN-BSN12 Post-licensure Master’s, Clinical Tracks13 Post-licensure Master’s, Non-Clinical Tracks10 Doctorate of Nursing Practice3 Doctor of Philosophy (PhD) in Nursing
2
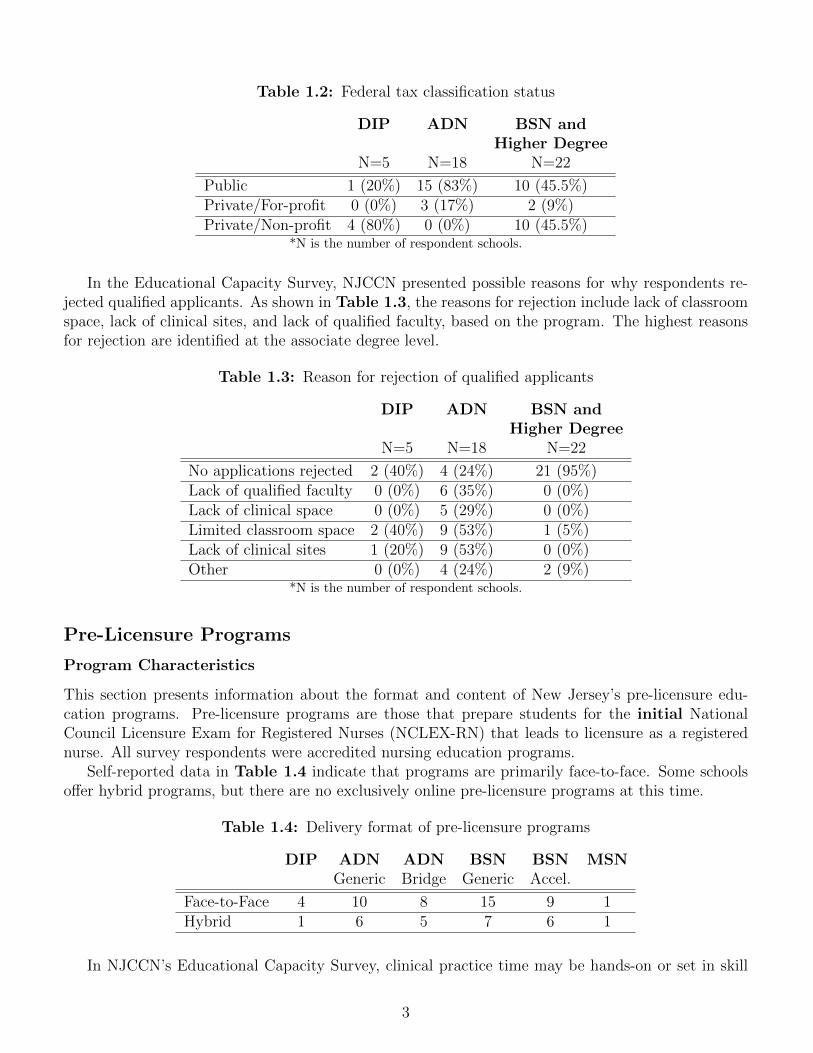
Table 1.2: Federal tax classification status
DIP ADN BSN andHigher Degree
N=5 N=18 N=22
Public 1 (20%) 15 (83%) 10 (45.5%)Private/For-profit 0 (0%) 3 (17%) 2 (9%)Private/Non-profit 4 (80%) 0 (0%) 10 (45.5%)
*N is the number of respondent schools.
In the Educational Capacity Survey, NJCCN presented possible reasons for why respondents re-jected qualified applicants. As shown in Table 1.3, the reasons for rejection include lack of classroomspace, lack of clinical sites, and lack of qualified faculty, based on the program. The highest reasonsfor rejection are identified at the associate degree level.
Table 1.3: Reason for rejection of qualified applicants
DIP ADN BSN andHigher Degree
N=5 N=18 N=22
No applications rejected 2 (40%) 4 (24%) 21 (95%)Lack of qualified faculty 0 (0%) 6 (35%) 0 (0%)Lack of clinical space 0 (0%) 5 (29%) 0 (0%)Limited classroom space 2 (40%) 9 (53%) 1 (5%)Lack of clinical sites 1 (20%) 9 (53%) 0 (0%)Other 0 (0%) 4 (24%) 2 (9%)
*N is the number of respondent schools.
Pre-Licensure Programs
Program Characteristics
This section presents information about the format and content of New Jersey’s pre-licensure edu-cation programs. Pre-licensure programs are those that prepare students for the initial NationalCouncil Licensure Exam for Registered Nurses (NCLEX-RN) that leads to licensure as a registerednurse. All survey respondents were accredited nursing education programs.
Self-reported data in Table 1.4 indicate that programs are primarily face-to-face. Some schoolsoffer hybrid programs, but there are no exclusively online pre-licensure programs at this time.
Table 1.4: Delivery format of pre-licensure programs
DIP ADN ADN BSN BSN MSNGeneric Bridge Generic Accel.
Face-to-Face 4 10 8 15 9 1Hybrid 1 6 5 7 6 1
In NJCCN’s Educational Capacity Survey, clinical practice time may be hands-on or set in skill
3
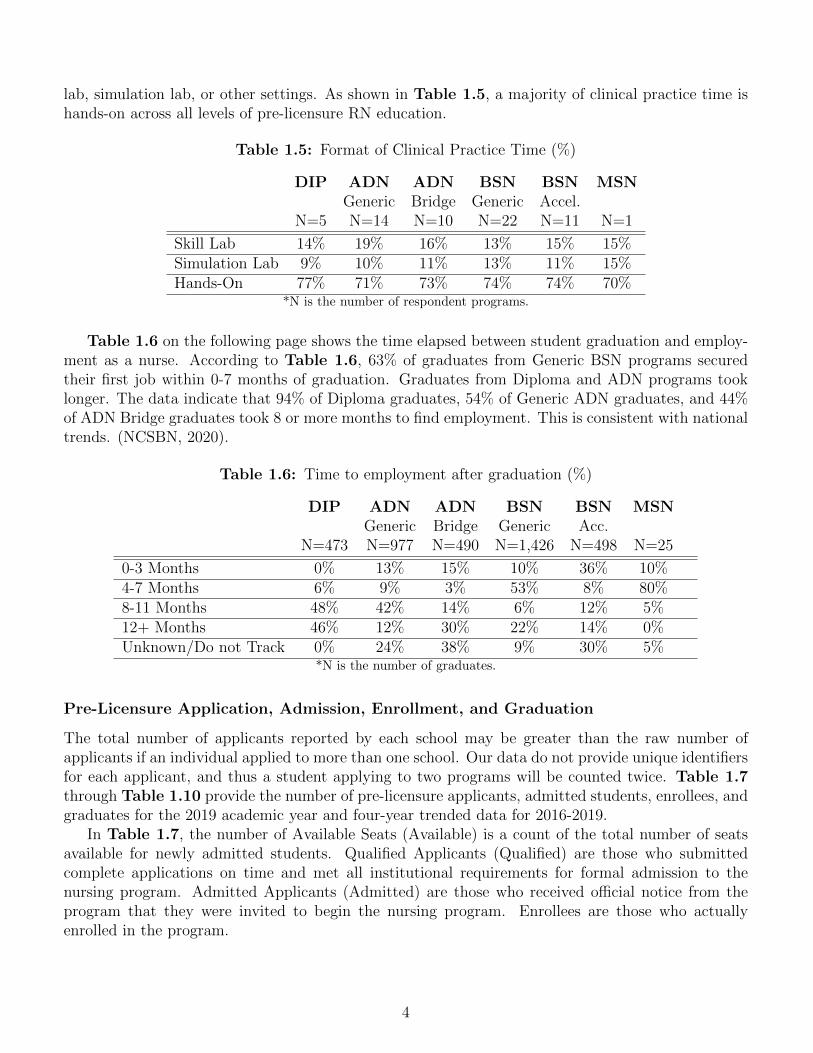
lab, simulation lab, or other settings. As shown in Table 1.5, a majority of clinical practice time ishands-on across all levels of pre-licensure RN education.
Table 1.5: Format of Clinical Practice Time (%)
DIP ADN ADN BSN BSN MSNGeneric Bridge Generic Accel.
N=5 N=14 N=10 N=22 N=11 N=1
Skill Lab 14% 19% 16% 13% 15% 15%Simulation Lab 9% 10% 11% 13% 11% 15%Hands-On 77% 71% 73% 74% 74% 70%
*N is the number of respondent programs.
Table 1.6 on the following page shows the time elapsed between student graduation and employ-ment as a nurse. According to Table 1.6, 63% of graduates from Generic BSN programs securedtheir first job within 0-7 months of graduation. Graduates from Diploma and ADN programs tooklonger. The data indicate that 94% of Diploma graduates, 54% of Generic ADN graduates, and 44%of ADN Bridge graduates took 8 or more months to find employment. This is consistent with nationaltrends. (NCSBN, 2020).
Table 1.6: Time to employment after graduation (%)
DIP ADN ADN BSN BSN MSNGeneric Bridge Generic Acc.
N=473 N=977 N=490 N=1,426 N=498 N=25
0-3 Months 0% 13% 15% 10% 36% 10%4-7 Months 6% 9% 3% 53% 8% 80%8-11 Months 48% 42% 14% 6% 12% 5%12+ Months 46% 12% 30% 22% 14% 0%Unknown/Do not Track 0% 24% 38% 9% 30% 5%
*N is the number of graduates.
Pre-Licensure Application, Admission, Enrollment, and Graduation
The total number of applicants reported by each school may be greater than the raw number ofapplicants if an individual applied to more than one school. Our data do not provide unique identifiersfor each applicant, and thus a student applying to two programs will be counted twice. Table 1.7through Table 1.10 provide the number of pre-licensure applicants, admitted students, enrollees, andgraduates for the 2019 academic year and four-year trended data for 2016-2019.
In Table 1.7, the number of Available Seats (Available) is a count of the total number of seatsavailable for newly admitted students. Qualified Applicants (Qualified) are those who submittedcomplete applications on time and met all institutional requirements for formal admission to thenursing program. Admitted Applicants (Admitted) are those who received official notice from theprogram that they were invited to begin the nursing program. Enrollees are those who actuallyenrolled in the program.
4
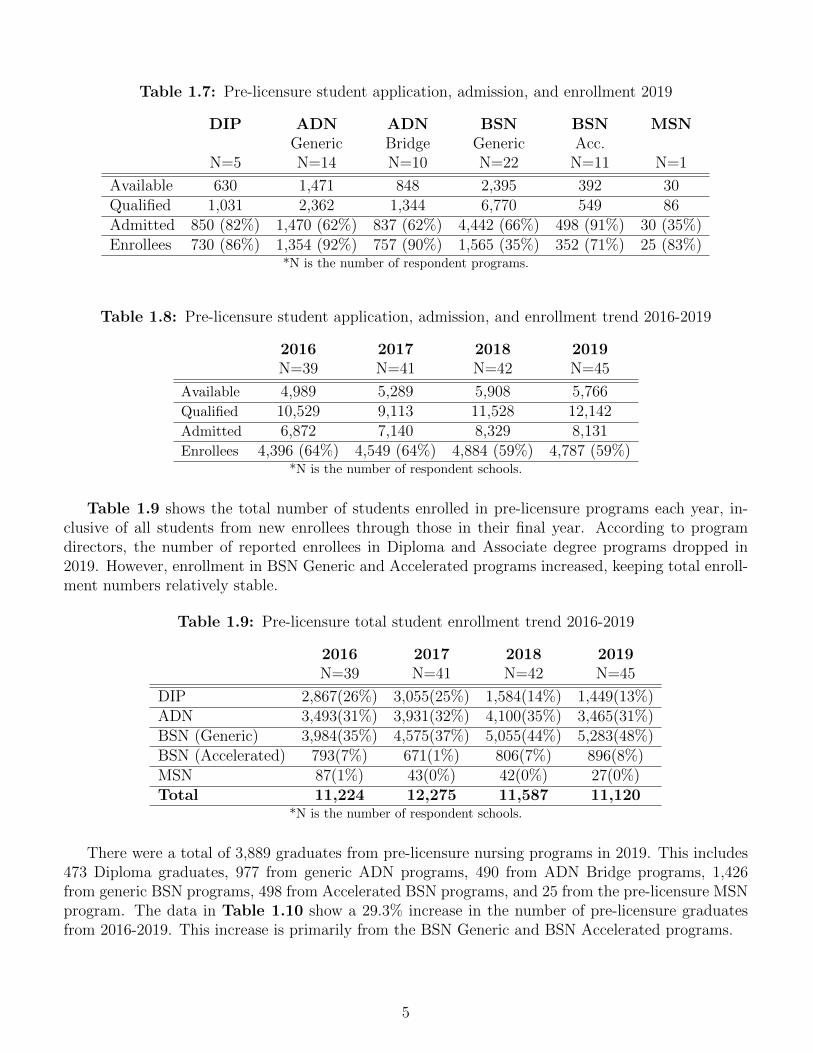
Table 1.7: Pre-licensure student application, admission, and enrollment 2019
DIP ADN ADN BSN BSN MSNGeneric Bridge Generic Acc.
N=5 N=14 N=10 N=22 N=11 N=1
Available 630 1,471 848 2,395 392 30Qualified 1,031 2,362 1,344 6,770 549 86Admitted 850 (82%) 1,470 (62%) 837 (62%) 4,442 (66%) 498 (91%) 30 (35%)Enrollees 730 (86%) 1,354 (92%) 757 (90%) 1,565 (35%) 352 (71%) 25 (83%)
*N is the number of respondent programs.
Table 1.8: Pre-licensure student application, admission, and enrollment trend 2016-2019
2016 2017 2018 2019N=39 N=41 N=42 N=45
Available 4,989 5,289 5,908 5,766Qualified 10,529 9,113 11,528 12,142Admitted 6,872 7,140 8,329 8,131Enrollees 4,396 (64%) 4,549 (64%) 4,884 (59%) 4,787 (59%)
*N is the number of respondent schools.
Table 1.9 shows the total number of students enrolled in pre-licensure programs each year, in-clusive of all students from new enrollees through those in their final year. According to programdirectors, the number of reported enrollees in Diploma and Associate degree programs dropped in2019. However, enrollment in BSN Generic and Accelerated programs increased, keeping total enroll-ment numbers relatively stable.
Table 1.9: Pre-licensure total student enrollment trend 2016-2019
2016 2017 2018 2019N=39 N=41 N=42 N=45
DIP 2,867(26%) 3,055(25%) 1,584(14%) 1,449(13%)ADN 3,493(31%) 3,931(32%) 4,100(35%) 3,465(31%)BSN (Generic) 3,984(35%) 4,575(37%) 5,055(44%) 5,283(48%)BSN (Accelerated) 793(7%) 671(1%) 806(7%) 896(8%)MSN 87(1%) 43(0%) 42(0%) 27(0%)Total 11,224 12,275 11,587 11,120
*N is the number of respondent schools.
There were a total of 3,889 graduates from pre-licensure nursing programs in 2019. This includes473 Diploma graduates, 977 from generic ADN programs, 490 from ADN Bridge programs, 1,426from generic BSN programs, 498 from Accelerated BSN programs, and 25 from the pre-licensure MSNprogram. The data in Table 1.10 show a 29.3% increase in the number of pre-licensure graduatesfrom 2016-2019. This increase is primarily from the BSN Generic and BSN Accelerated programs.
5
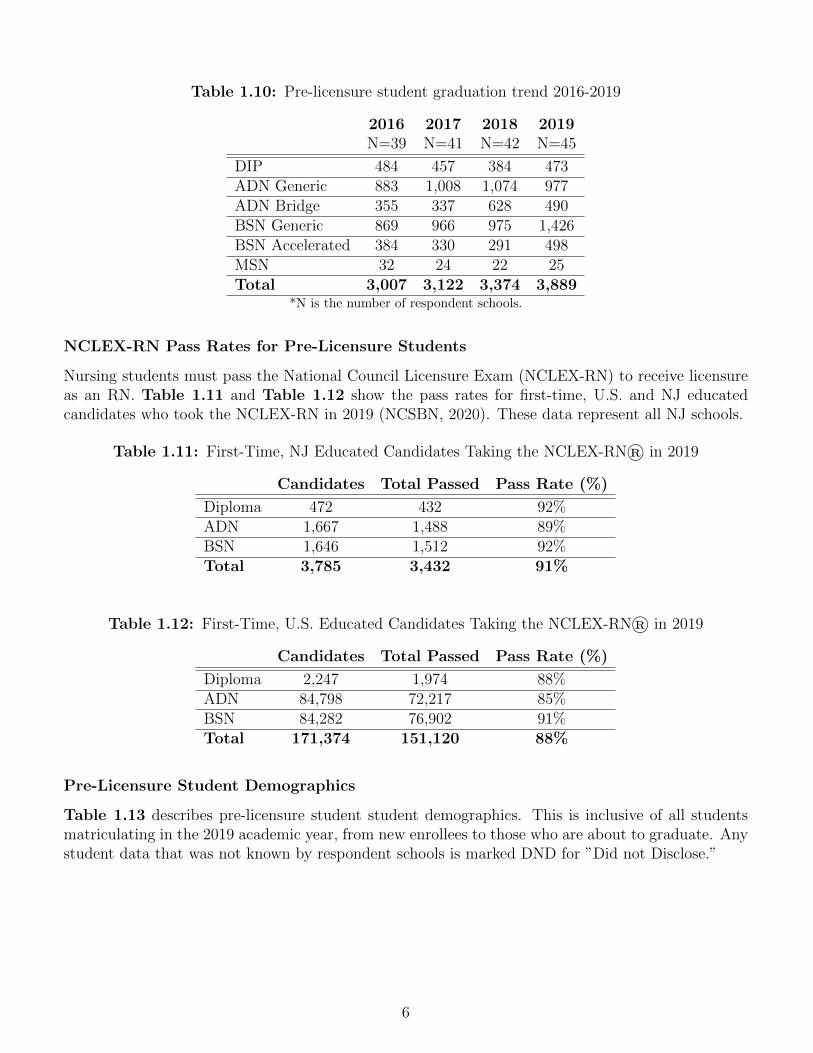
Table 1.10: Pre-licensure student graduation trend 2016-2019
2016 2017 2018 2019N=39 N=41 N=42 N=45
DIP 484 457 384 473ADN Generic 883 1,008 1,074 977ADN Bridge 355 337 628 490BSN Generic 869 966 975 1,426BSN Accelerated 384 330 291 498MSN 32 24 22 25Total 3,007 3,122 3,374 3,889
*N is the number of respondent schools.
NCLEX-RN Pass Rates for Pre-Licensure Students
Nursing students must pass the National Council Licensure Exam (NCLEX-RN) to receive licensureas an RN. Table 1.11 and Table 1.12 show the pass rates for first-time, U.S. and NJ educatedcandidates who took the NCLEX-RN in 2019 (NCSBN, 2020). These data represent all NJ schools.
Table 1.11: First-Time, NJ Educated Candidates Taking the NCLEX-RN® in 2019
Candidates Total Passed Pass Rate (%)
Diploma 472 432 92%ADN 1,667 1,488 89%BSN 1,646 1,512 92%Total 3,785 3,432 91%
Table 1.12: First-Time, U.S. Educated Candidates Taking the NCLEX-RN® in 2019
Candidates Total Passed Pass Rate (%)
Diploma 2,247 1,974 88%ADN 84,798 72,217 85%BSN 84,282 76,902 91%Total 171,374 151,120 88%
Pre-Licensure Student Demographics
Table 1.13 describes pre-licensure student student demographics. This is inclusive of all studentsmatriculating in the 2019 academic year, from new enrollees to those who are about to graduate. Anystudent data that was not known by respondent schools is marked DND for ”Did not Disclose.”
6
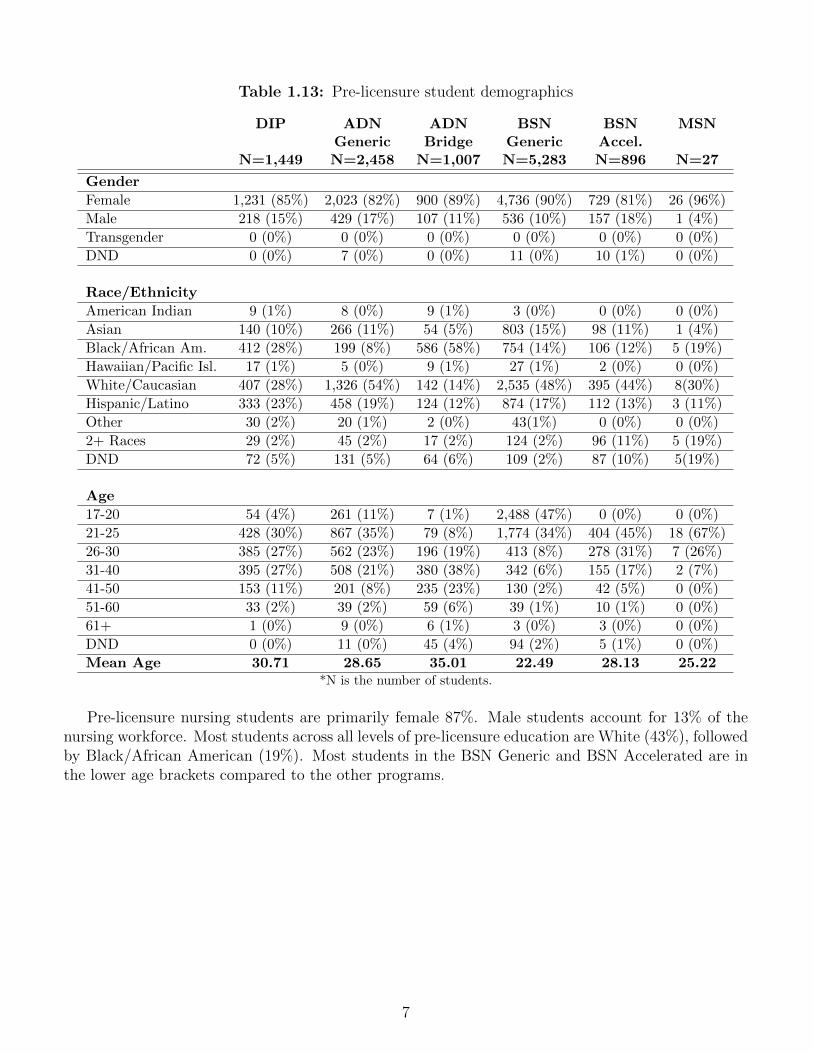
Table 1.13: Pre-licensure student demographics
DIP ADN ADN BSN BSN MSNGeneric Bridge Generic Accel.
N=1,449 N=2,458 N=1,007 N=5,283 N=896 N=27
Gender
Female 1,231 (85%) 2,023 (82%) 900 (89%) 4,736 (90%) 729 (81%) 26 (96%)
Male 218 (15%) 429 (17%) 107 (11%) 536 (10%) 157 (18%) 1 (4%)
Transgender 0 (0%) 0 (0%) 0 (0%) 0 (0%) 0 (0%) 0 (0%)
DND 0 (0%) 7 (0%) 0 (0%) 11 (0%) 10 (1%) 0 (0%)
Race/Ethnicity
American Indian 9 (1%) 8 (0%) 9 (1%) 3 (0%) 0 (0%) 0 (0%)
Asian 140 (10%) 266 (11%) 54 (5%) 803 (15%) 98 (11%) 1 (4%)
Black/African Am. 412 (28%) 199 (8%) 586 (58%) 754 (14%) 106 (12%) 5 (19%)
Hawaiian/Pacific Isl. 17 (1%) 5 (0%) 9 (1%) 27 (1%) 2 (0%) 0 (0%)
White/Caucasian 407 (28%) 1,326 (54%) 142 (14%) 2,535 (48%) 395 (44%) 8(30%)
Hispanic/Latino 333 (23%) 458 (19%) 124 (12%) 874 (17%) 112 (13%) 3 (11%)
Other 30 (2%) 20 (1%) 2 (0%) 43(1%) 0 (0%) 0 (0%)
2+ Races 29 (2%) 45 (2%) 17 (2%) 124 (2%) 96 (11%) 5 (19%)
DND 72 (5%) 131 (5%) 64 (6%) 109 (2%) 87 (10%) 5(19%)
Age
17-20 54 (4%) 261 (11%) 7 (1%) 2,488 (47%) 0 (0%) 0 (0%)
21-25 428 (30%) 867 (35%) 79 (8%) 1,774 (34%) 404 (45%) 18 (67%)
26-30 385 (27%) 562 (23%) 196 (19%) 413 (8%) 278 (31%) 7 (26%)
31-40 395 (27%) 508 (21%) 380 (38%) 342 (6%) 155 (17%) 2 (7%)
41-50 153 (11%) 201 (8%) 235 (23%) 130 (2%) 42 (5%) 0 (0%)
51-60 33 (2%) 39 (2%) 59 (6%) 39 (1%) 10 (1%) 0 (0%)
61+ 1 (0%) 9 (0%) 6 (1%) 3 (0%) 3 (0%) 0 (0%)
DND 0 (0%) 11 (0%) 45 (4%) 94 (2%) 5 (1%) 0 (0%)
Mean Age 30.71 28.65 35.01 22.49 28.13 25.22*N is the number of students.
Pre-licensure nursing students are primarily female 87%. Male students account for 13% of thenursing workforce. Most students across all levels of pre-licensure education are White (43%), followedby Black/African American (19%). Most students in the BSN Generic and BSN Accelerated are inthe lower age brackets compared to the other programs.
7
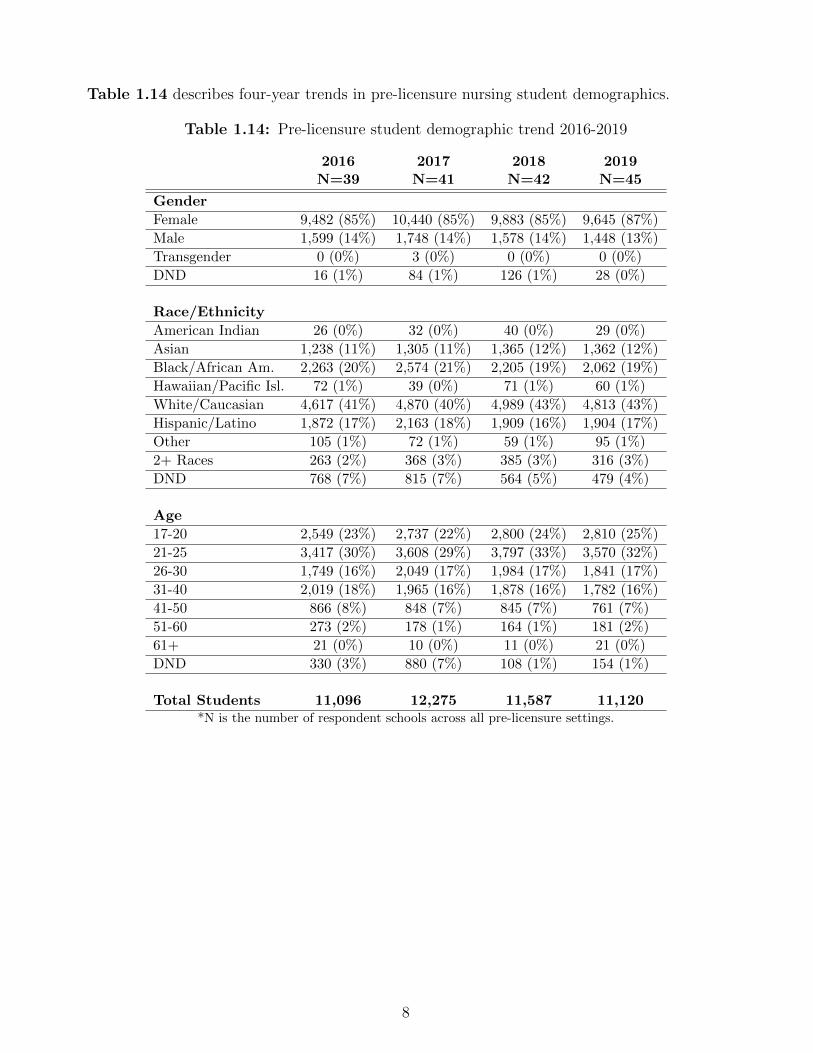
Table 1.14 describes four-year trends in pre-licensure nursing student demographics.
Table 1.14: Pre-licensure student demographic trend 2016-2019
2016 2017 2018 2019N=39 N=41 N=42 N=45
Gender
Female 9,482 (85%) 10,440 (85%) 9,883 (85%) 9,645 (87%)
Male 1,599 (14%) 1,748 (14%) 1,578 (14%) 1,448 (13%)
Transgender 0 (0%) 3 (0%) 0 (0%) 0 (0%)
DND 16 (1%) 84 (1%) 126 (1%) 28 (0%)
Race/Ethnicity
American Indian 26 (0%) 32 (0%) 40 (0%) 29 (0%)
Asian 1,238 (11%) 1,305 (11%) 1,365 (12%) 1,362 (12%)
Black/African Am. 2,263 (20%) 2,574 (21%) 2,205 (19%) 2,062 (19%)
Hawaiian/Pacific Isl. 72 (1%) 39 (0%) 71 (1%) 60 (1%)
White/Caucasian 4,617 (41%) 4,870 (40%) 4,989 (43%) 4,813 (43%)
Hispanic/Latino 1,872 (17%) 2,163 (18%) 1,909 (16%) 1,904 (17%)
Other 105 (1%) 72 (1%) 59 (1%) 95 (1%)
2+ Races 263 (2%) 368 (3%) 385 (3%) 316 (3%)
DND 768 (7%) 815 (7%) 564 (5%) 479 (4%)
Age
17-20 2,549 (23%) 2,737 (22%) 2,800 (24%) 2,810 (25%)
21-25 3,417 (30%) 3,608 (29%) 3,797 (33%) 3,570 (32%)
26-30 1,749 (16%) 2,049 (17%) 1,984 (17%) 1,841 (17%)
31-40 2,019 (18%) 1,965 (16%) 1,878 (16%) 1,782 (16%)
41-50 866 (8%) 848 (7%) 845 (7%) 761 (7%)
51-60 273 (2%) 178 (1%) 164 (1%) 181 (2%)
61+ 21 (0%) 10 (0%) 11 (0%) 21 (0%)
DND 330 (3%) 880 (7%) 108 (1%) 154 (1%)
Total Students 11,096 12,275 11,587 11,120*N is the number of respondent schools across all pre-licensure settings.
8
Post-Licensure Programs
Program Characteristics
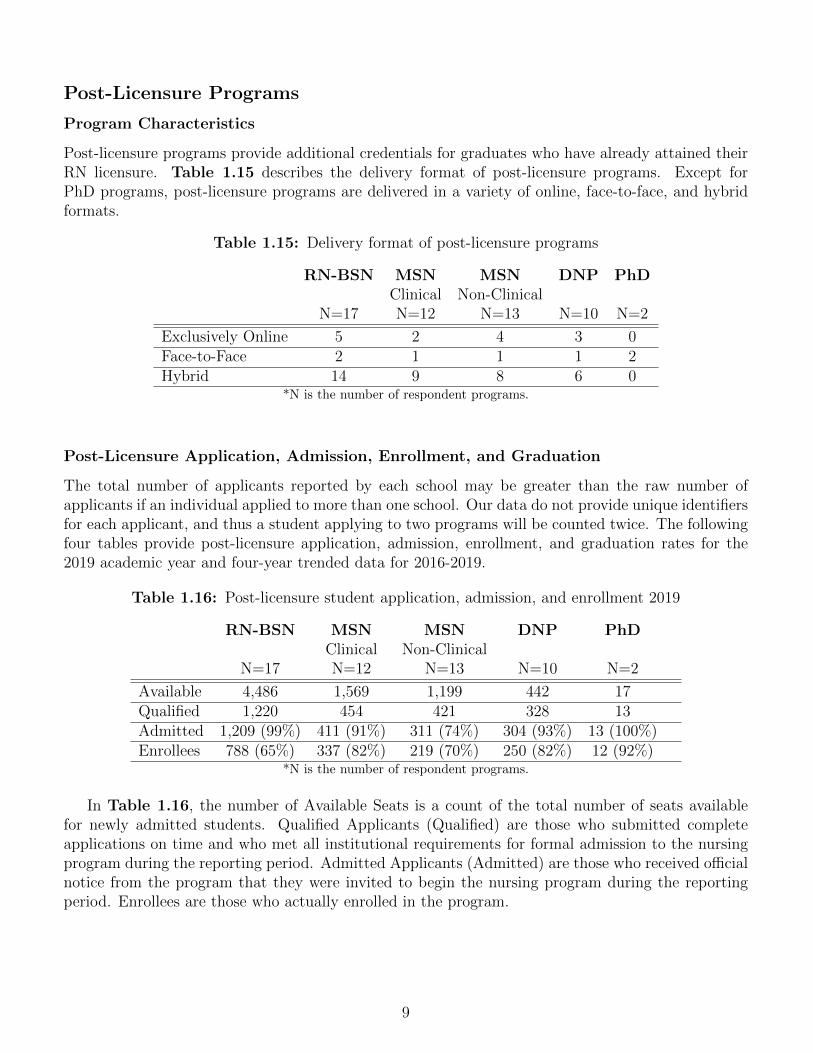
Post-licensure programs provide additional credentials for graduates who have already attained theirRN licensure. Table 1.15 describes the delivery format of post-licensure programs. Except forPhD programs, post-licensure programs are delivered in a variety of online, face-to-face, and hybridformats.
Table 1.15: Delivery format of post-licensure programs
RN-BSN MSN MSN DNP PhDClinical Non-Clinical
N=17 N=12 N=13 N=10 N=2
Exclusively Online 5 2 4 3 0Face-to-Face 2 1 1 1 2Hybrid 14 9 8 6 0
*N is the number of respondent programs.
Post-Licensure Application, Admission, Enrollment, and Graduation
The total number of applicants reported by each school may be greater than the raw number ofapplicants if an individual applied to more than one school. Our data do not provide unique identifiersfor each applicant, and thus a student applying to two programs will be counted twice. The followingfour tables provide post-licensure application, admission, enrollment, and graduation rates for the2019 academic year and four-year trended data for 2016-2019.
Table 1.16: Post-licensure student application, admission, and enrollment 2019
RN-BSN MSN MSN DNP PhDClinical Non-Clinical
N=17 N=12 N=13 N=10 N=2
Available 4,486 1,569 1,199 442 17Qualified 1,220 454 421 328 13Admitted 1,209 (99%) 411 (91%) 311 (74%) 304 (93%) 13 (100%)Enrollees 788 (65%) 337 (82%) 219 (70%) 250 (82%) 12 (92%)
*N is the number of respondent programs.
In Table 1.16, the number of Available Seats is a count of the total number of seats availablefor newly admitted students. Qualified Applicants (Qualified) are those who submitted completeapplications on time and who met all institutional requirements for formal admission to the nursingprogram during the reporting period. Admitted Applicants (Admitted) are those who received officialnotice from the program that they were invited to begin the nursing program during the reportingperiod. Enrollees are those who actually enrolled in the program.
9
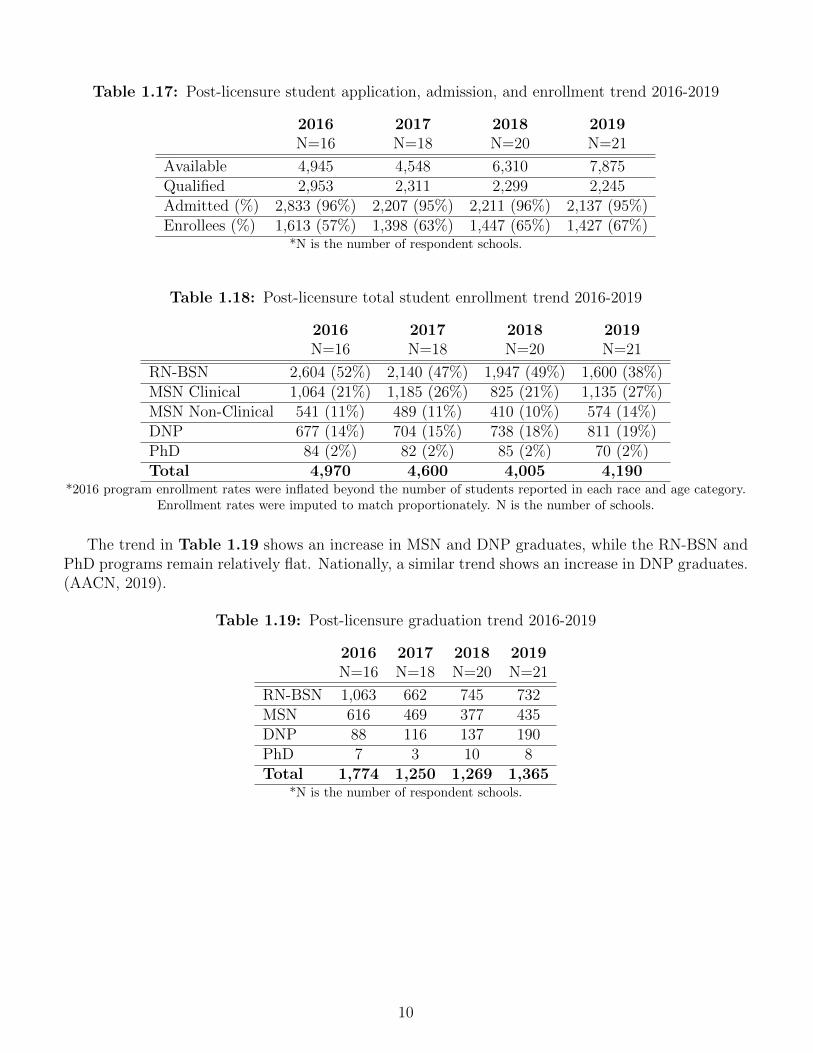
Table 1.17: Post-licensure student application, admission, and enrollment trend 2016-2019
2016 2017 2018 2019N=16 N=18 N=20 N=21
Available 4,945 4,548 6,310 7,875Qualified 2,953 2,311 2,299 2,245Admitted (%) 2,833 (96%) 2,207 (95%) 2,211 (96%) 2,137 (95%)Enrollees (%) 1,613 (57%) 1,398 (63%) 1,447 (65%) 1,427 (67%)
*N is the number of respondent schools.
Table 1.18: Post-licensure total student enrollment trend 2016-2019
2016 2017 2018 2019N=16 N=18 N=20 N=21
RN-BSN 2,604 (52%) 2,140 (47%) 1,947 (49%) 1,600 (38%)MSN Clinical 1,064 (21%) 1,185 (26%) 825 (21%) 1,135 (27%)MSN Non-Clinical 541 (11%) 489 (11%) 410 (10%) 574 (14%)DNP 677 (14%) 704 (15%) 738 (18%) 811 (19%)PhD 84 (2%) 82 (2%) 85 (2%) 70 (2%)Total 4,970 4,600 4,005 4,190
*2016 program enrollment rates were inflated beyond the number of students reported in each race and age category.Enrollment rates were imputed to match proportionately. N is the number of schools.
The trend in Table 1.19 shows an increase in MSN and DNP graduates, while the RN-BSN andPhD programs remain relatively flat. Nationally, a similar trend shows an increase in DNP graduates.(AACN, 2019).
Table 1.19: Post-licensure graduation trend 2016-2019
2016 2017 2018 2019N=16 N=18 N=20 N=21
RN-BSN 1,063 662 745 732MSN 616 469 377 435DNP 88 116 137 190PhD 7 3 10 8Total 1,774 1,250 1,269 1,365
*N is the number of respondent schools.
10
Post-Licensure Student Demographics
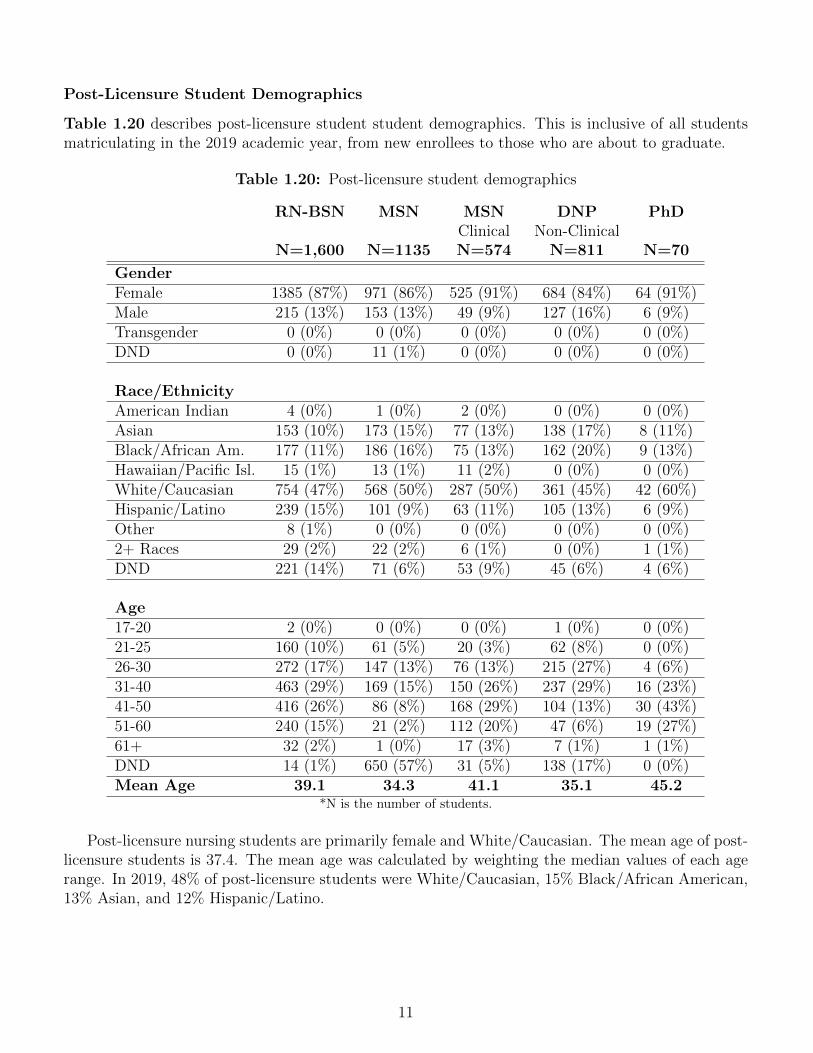
Table 1.20 describes post-licensure student student demographics. This is inclusive of all studentsmatriculating in the 2019 academic year, from new enrollees to those who are about to graduate.
Table 1.20: Post-licensure student demographics
RN-BSN MSN MSN DNP PhDClinical Non-Clinical
N=1,600 N=1135 N=574 N=811 N=70
GenderFemale 1385 (87%) 971 (86%) 525 (91%) 684 (84%) 64 (91%)Male 215 (13%) 153 (13%) 49 (9%) 127 (16%) 6 (9%)Transgender 0 (0%) 0 (0%) 0 (0%) 0 (0%) 0 (0%)DND 0 (0%) 11 (1%) 0 (0%) 0 (0%) 0 (0%)
Race/EthnicityAmerican Indian 4 (0%) 1 (0%) 2 (0%) 0 (0%) 0 (0%)Asian 153 (10%) 173 (15%) 77 (13%) 138 (17%) 8 (11%)Black/African Am. 177 (11%) 186 (16%) 75 (13%) 162 (20%) 9 (13%)Hawaiian/Pacific Isl. 15 (1%) 13 (1%) 11 (2%) 0 (0%) 0 (0%)White/Caucasian 754 (47%) 568 (50%) 287 (50%) 361 (45%) 42 (60%)Hispanic/Latino 239 (15%) 101 (9%) 63 (11%) 105 (13%) 6 (9%)Other 8 (1%) 0 (0%) 0 (0%) 0 (0%) 0 (0%)2+ Races 29 (2%) 22 (2%) 6 (1%) 0 (0%) 1 (1%)DND 221 (14%) 71 (6%) 53 (9%) 45 (6%) 4 (6%)
Age17-20 2 (0%) 0 (0%) 0 (0%) 1 (0%) 0 (0%)21-25 160 (10%) 61 (5%) 20 (3%) 62 (8%) 0 (0%)26-30 272 (17%) 147 (13%) 76 (13%) 215 (27%) 4 (6%)31-40 463 (29%) 169 (15%) 150 (26%) 237 (29%) 16 (23%)41-50 416 (26%) 86 (8%) 168 (29%) 104 (13%) 30 (43%)51-60 240 (15%) 21 (2%) 112 (20%) 47 (6%) 19 (27%)61+ 32 (2%) 1 (0%) 17 (3%) 7 (1%) 1 (1%)DND 14 (1%) 650 (57%) 31 (5%) 138 (17%) 0 (0%)Mean Age 39.1 34.3 41.1 35.1 45.2
*N is the number of students.
Post-licensure nursing students are primarily female and White/Caucasian. The mean age of post-licensure students is 37.4. The mean age was calculated by weighting the median values of each agerange. In 2019, 48% of post-licensure students were White/Caucasian, 15% Black/African American,13% Asian, and 12% Hispanic/Latino.
11
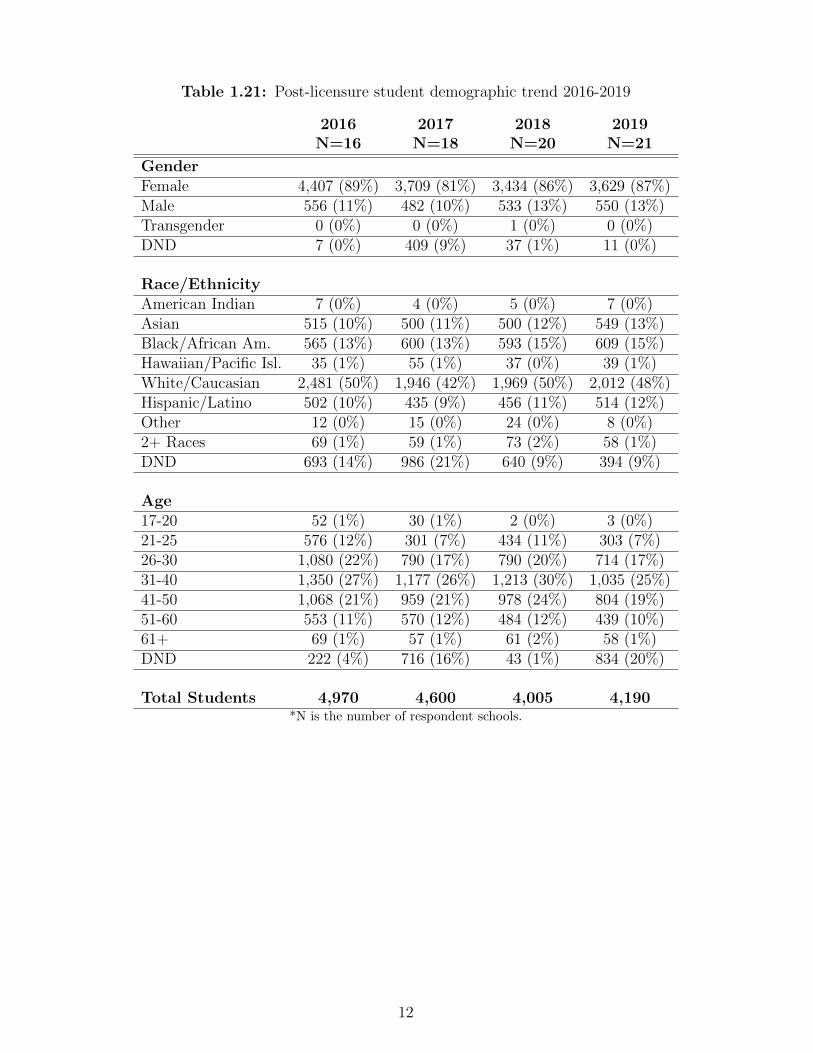
Table 1.21: Post-licensure student demographic trend 2016-2019
2016 2017 2018 2019N=16 N=18 N=20 N=21
GenderFemale 4,407 (89%) 3,709 (81%) 3,434 (86%) 3,629 (87%)Male 556 (11%) 482 (10%) 533 (13%) 550 (13%)Transgender 0 (0%) 0 (0%) 1 (0%) 0 (0%)DND 7 (0%) 409 (9%) 37 (1%) 11 (0%)
Race/EthnicityAmerican Indian 7 (0%) 4 (0%) 5 (0%) 7 (0%)Asian 515 (10%) 500 (11%) 500 (12%) 549 (13%)Black/African Am. 565 (13%) 600 (13%) 593 (15%) 609 (15%)Hawaiian/Pacific Isl. 35 (1%) 55 (1%) 37 (0%) 39 (1%)White/Caucasian 2,481 (50%) 1,946 (42%) 1,969 (50%) 2,012 (48%)Hispanic/Latino 502 (10%) 435 (9%) 456 (11%) 514 (12%)Other 12 (0%) 15 (0%) 24 (0%) 8 (0%)2+ Races 69 (1%) 59 (1%) 73 (2%) 58 (1%)DND 693 (14%) 986 (21%) 640 (9%) 394 (9%)
Age17-20 52 (1%) 30 (1%) 2 (0%) 3 (0%)21-25 576 (12%) 301 (7%) 434 (11%) 303 (7%)26-30 1,080 (22%) 790 (17%) 790 (20%) 714 (17%)31-40 1,350 (27%) 1,177 (26%) 1,213 (30%) 1,035 (25%)41-50 1,068 (21%) 959 (21%) 978 (24%) 804 (19%)51-60 553 (11%) 570 (12%) 484 (12%) 439 (10%)61+ 69 (1%) 57 (1%) 61 (2%) 58 (1%)DND 222 (4%) 716 (16%) 43 (1%) 834 (20%)
Total Students 4,970 4,600 4,005 4,190*N is the number of respondent schools.
12
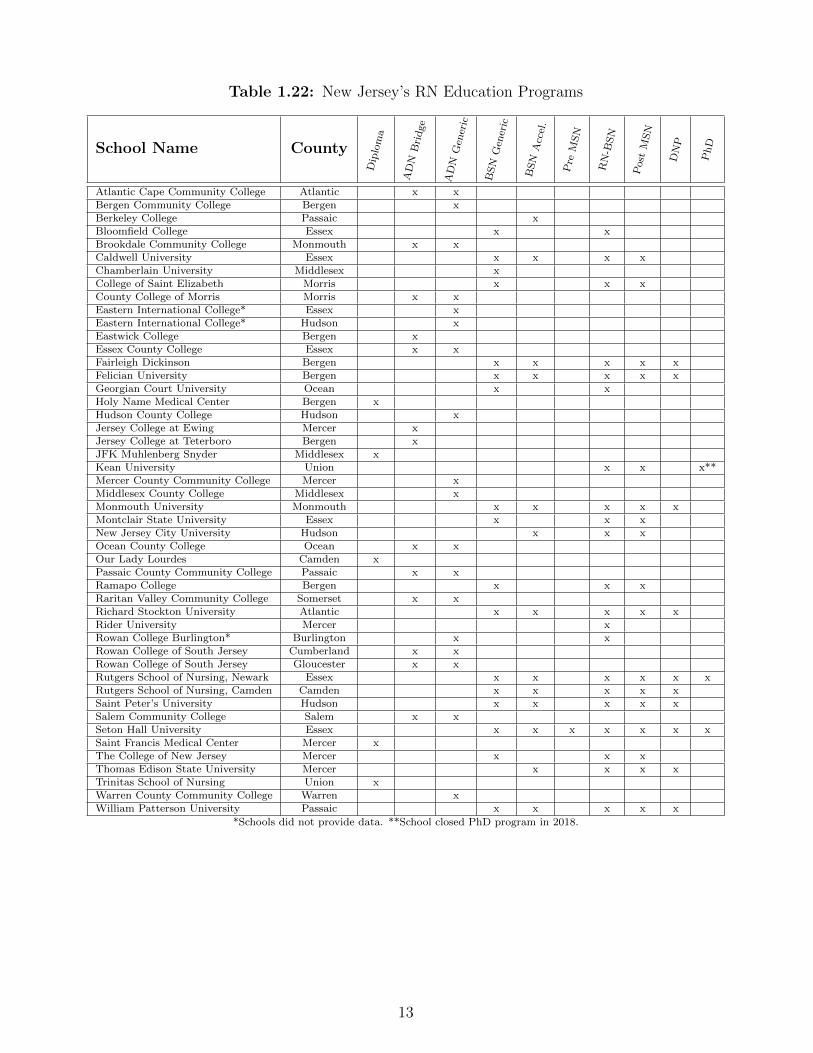
Table 1.22: New Jersey’s RN Education Programs
School Name County
Dip
lom
a
AD
NB
ridge
AD
NG
ener
ic
BSN
Gen
eric
BSN
Acc
el.
Pre
MSN
RN
-BSN
Post
MSN
DN
P
PhD
Atlantic Cape Community College Atlantic x xBergen Community College Bergen xBerkeley College Passaic xBloomfield College Essex x xBrookdale Community College Monmouth x xCaldwell University Essex x x x xChamberlain University Middlesex xCollege of Saint Elizabeth Morris x x xCounty College of Morris Morris x xEastern International College* Essex xEastern International College* Hudson xEastwick College Bergen xEssex County College Essex x xFairleigh Dickinson Bergen x x x x xFelician University Bergen x x x x xGeorgian Court University Ocean x xHoly Name Medical Center Bergen xHudson County College Hudson xJersey College at Ewing Mercer xJersey College at Teterboro Bergen xJFK Muhlenberg Snyder Middlesex xKean University Union x x x**Mercer County Community College Mercer xMiddlesex County College Middlesex xMonmouth University Monmouth x x x x xMontclair State University Essex x x xNew Jersey City University Hudson x x xOcean County College Ocean x xOur Lady Lourdes Camden xPassaic County Community College Passaic x xRamapo College Bergen x x xRaritan Valley Community College Somerset x xRichard Stockton University Atlantic x x x x xRider University Mercer xRowan College Burlington* Burlington x xRowan College of South Jersey Cumberland x xRowan College of South Jersey Gloucester x xRutgers School of Nursing, Newark Essex x x x x x xRutgers School of Nursing, Camden Camden x x x x xSaint Peter’s University Hudson x x x x xSalem Community College Salem x xSeton Hall University Essex x x x x x x xSaint Francis Medical Center Mercer xThe College of New Jersey Mercer x x xThomas Edison State University Mercer x x x xTrinitas School of Nursing Union xWarren County Community College Warren xWilliam Patterson University Passaic x x x x x
*Schools did not provide data. **School closed PhD program in 2018.
13
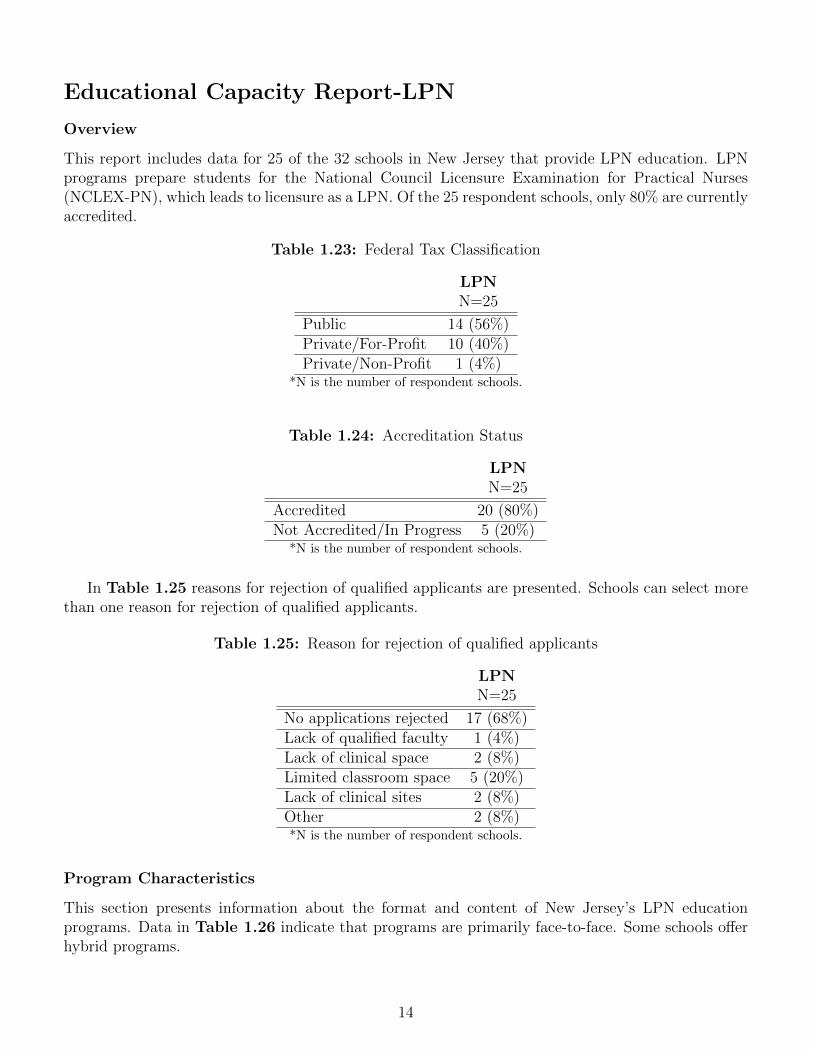
Educational Capacity Report-LPN
Overview
This report includes data for 25 of the 32 schools in New Jersey that provide LPN education. LPNprograms prepare students for the National Council Licensure Examination for Practical Nurses(NCLEX-PN), which leads to licensure as a LPN. Of the 25 respondent schools, only 80% are currentlyaccredited.
Table 1.23: Federal Tax Classification
LPNN=25
Public 14 (56%)Private/For-Profit 10 (40%)Private/Non-Profit 1 (4%)
*N is the number of respondent schools.
Table 1.24: Accreditation Status
LPNN=25
Accredited 20 (80%)Not Accredited/In Progress 5 (20%)
*N is the number of respondent schools.
In Table 1.25 reasons for rejection of qualified applicants are presented. Schools can select morethan one reason for rejection of qualified applicants.
Table 1.25: Reason for rejection of qualified applicants
LPNN=25
No applications rejected 17 (68%)Lack of qualified faculty 1 (4%)Lack of clinical space 2 (8%)Limited classroom space 5 (20%)Lack of clinical sites 2 (8%)Other 2 (8%)*N is the number of respondent schools.
Program Characteristics
This section presents information about the format and content of New Jersey’s LPN educationprograms. Data in Table 1.26 indicate that programs are primarily face-to-face. Some schools offerhybrid programs.
14
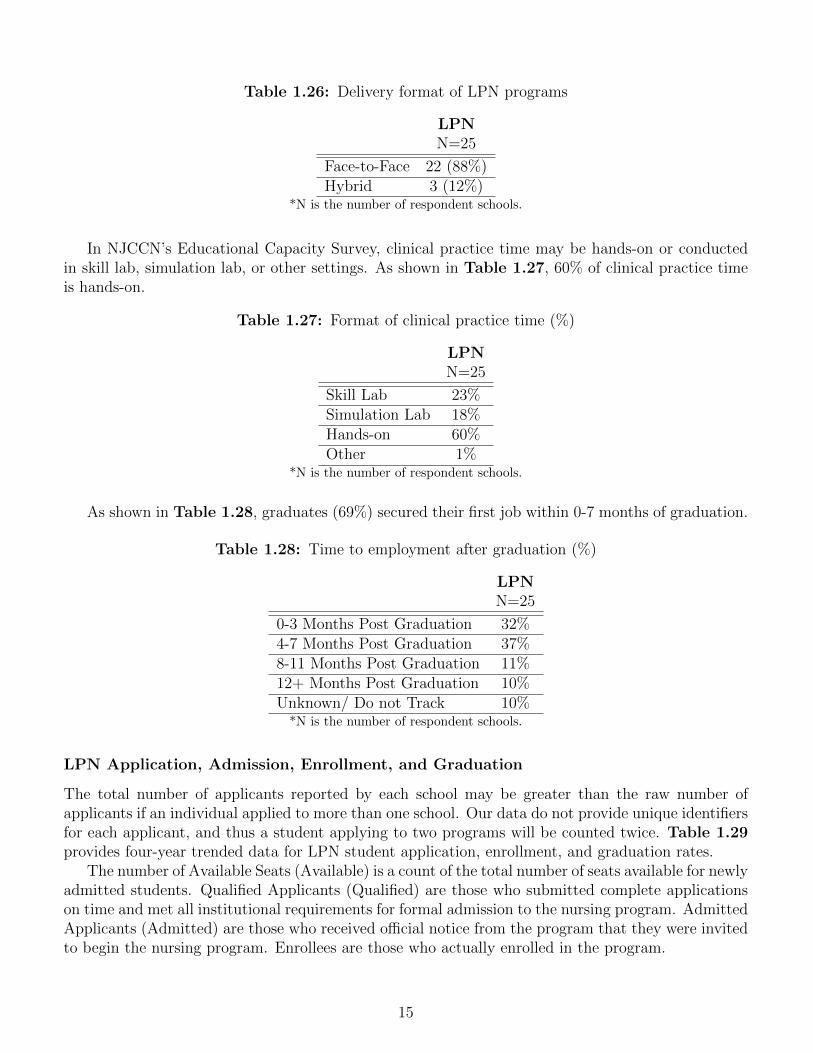
Table 1.26: Delivery format of LPN programs
LPNN=25
Face-to-Face 22 (88%)Hybrid 3 (12%)
*N is the number of respondent schools.
In NJCCN’s Educational Capacity Survey, clinical practice time may be hands-on or conductedin skill lab, simulation lab, or other settings. As shown in Table 1.27, 60% of clinical practice timeis hands-on.
Table 1.27: Format of clinical practice time (%)
LPNN=25
Skill Lab 23%Simulation Lab 18%Hands-on 60%Other 1%
*N is the number of respondent schools.
As shown in Table 1.28, graduates (69%) secured their first job within 0-7 months of graduation.
Table 1.28: Time to employment after graduation (%)
LPNN=25
0-3 Months Post Graduation 32%4-7 Months Post Graduation 37%8-11 Months Post Graduation 11%12+ Months Post Graduation 10%Unknown/ Do not Track 10%
*N is the number of respondent schools.
LPN Application, Admission, Enrollment, and Graduation
The total number of applicants reported by each school may be greater than the raw number ofapplicants if an individual applied to more than one school. Our data do not provide unique identifiersfor each applicant, and thus a student applying to two programs will be counted twice. Table 1.29provides four-year trended data for LPN student application, enrollment, and graduation rates.
The number of Available Seats (Available) is a count of the total number of seats available for newlyadmitted students. Qualified Applicants (Qualified) are those who submitted complete applicationson time and met all institutional requirements for formal admission to the nursing program. AdmittedApplicants (Admitted) are those who received official notice from the program that they were invitedto begin the nursing program. Enrollees are those who actually enrolled in the program.
15
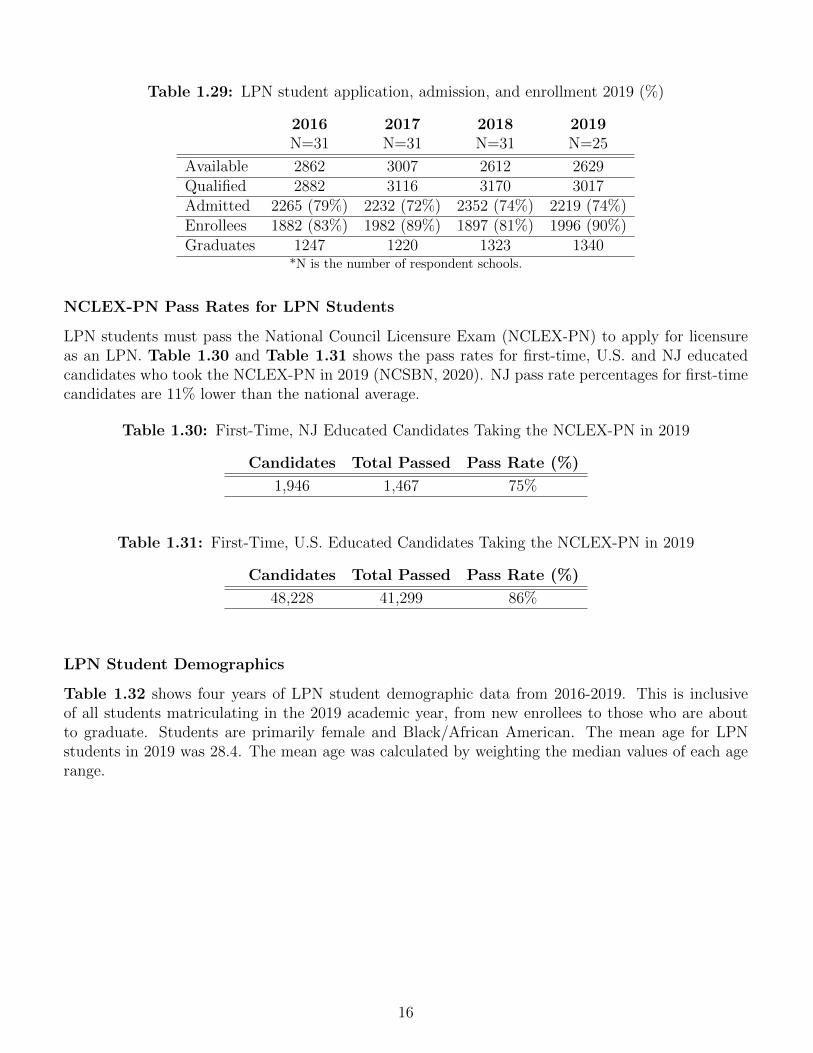
Table 1.29: LPN student application, admission, and enrollment 2019 (%)
2016 2017 2018 2019N=31 N=31 N=31 N=25
Available 2862 3007 2612 2629Qualified 2882 3116 3170 3017Admitted 2265 (79%) 2232 (72%) 2352 (74%) 2219 (74%)Enrollees 1882 (83%) 1982 (89%) 1897 (81%) 1996 (90%)Graduates 1247 1220 1323 1340
*N is the number of respondent schools.
NCLEX-PN Pass Rates for LPN Students
LPN students must pass the National Council Licensure Exam (NCLEX-PN) to apply for licensureas an LPN. Table 1.30 and Table 1.31 shows the pass rates for first-time, U.S. and NJ educatedcandidates who took the NCLEX-PN in 2019 (NCSBN, 2020). NJ pass rate percentages for first-timecandidates are 11% lower than the national average.
Table 1.30: First-Time, NJ Educated Candidates Taking the NCLEX-PN in 2019
Candidates Total Passed Pass Rate (%)
1,946 1,467 75%
Table 1.31: First-Time, U.S. Educated Candidates Taking the NCLEX-PN in 2019
Candidates Total Passed Pass Rate (%)
48,228 41,299 86%
LPN Student Demographics
Table 1.32 shows four years of LPN student demographic data from 2016-2019. This is inclusiveof all students matriculating in the 2019 academic year, from new enrollees to those who are aboutto graduate. Students are primarily female and Black/African American. The mean age for LPNstudents in 2019 was 28.4. The mean age was calculated by weighting the median values of each agerange.
16
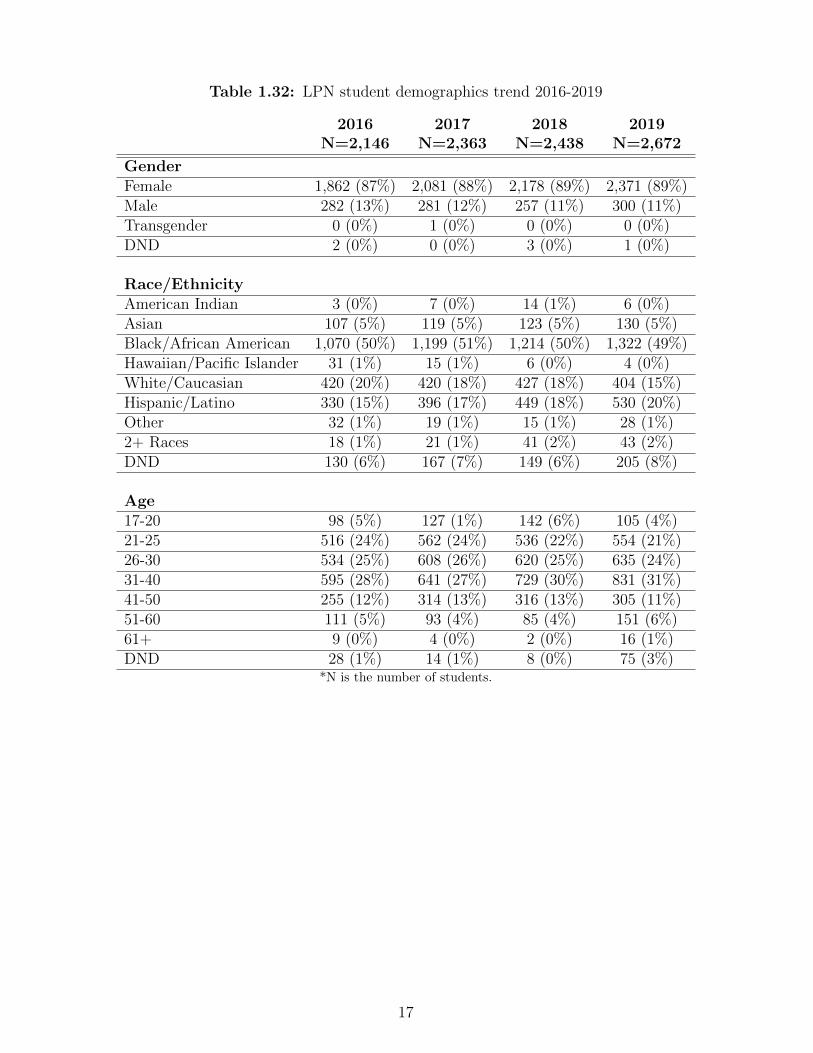
Table 1.32: LPN student demographics trend 2016-2019
2016 2017 2018 2019N=2,146 N=2,363 N=2,438 N=2,672
GenderFemale 1,862 (87%) 2,081 (88%) 2,178 (89%) 2,371 (89%)Male 282 (13%) 281 (12%) 257 (11%) 300 (11%)Transgender 0 (0%) 1 (0%) 0 (0%) 0 (0%)DND 2 (0%) 0 (0%) 3 (0%) 1 (0%)
Race/EthnicityAmerican Indian 3 (0%) 7 (0%) 14 (1%) 6 (0%)Asian 107 (5%) 119 (5%) 123 (5%) 130 (5%)Black/African American 1,070 (50%) 1,199 (51%) 1,214 (50%) 1,322 (49%)Hawaiian/Pacific Islander 31 (1%) 15 (1%) 6 (0%) 4 (0%)White/Caucasian 420 (20%) 420 (18%) 427 (18%) 404 (15%)Hispanic/Latino 330 (15%) 396 (17%) 449 (18%) 530 (20%)Other 32 (1%) 19 (1%) 15 (1%) 28 (1%)2+ Races 18 (1%) 21 (1%) 41 (2%) 43 (2%)DND 130 (6%) 167 (7%) 149 (6%) 205 (8%)
Age17-20 98 (5%) 127 (1%) 142 (6%) 105 (4%)21-25 516 (24%) 562 (24%) 536 (22%) 554 (21%)26-30 534 (25%) 608 (26%) 620 (25%) 635 (24%)31-40 595 (28%) 641 (27%) 729 (30%) 831 (31%)41-50 255 (12%) 314 (13%) 316 (13%) 305 (11%)51-60 111 (5%) 93 (4%) 85 (4%) 151 (6%)61+ 9 (0%) 4 (0%) 2 (0%) 16 (1%)DND 28 (1%) 14 (1%) 8 (0%) 75 (3%)
*N is the number of students.
17
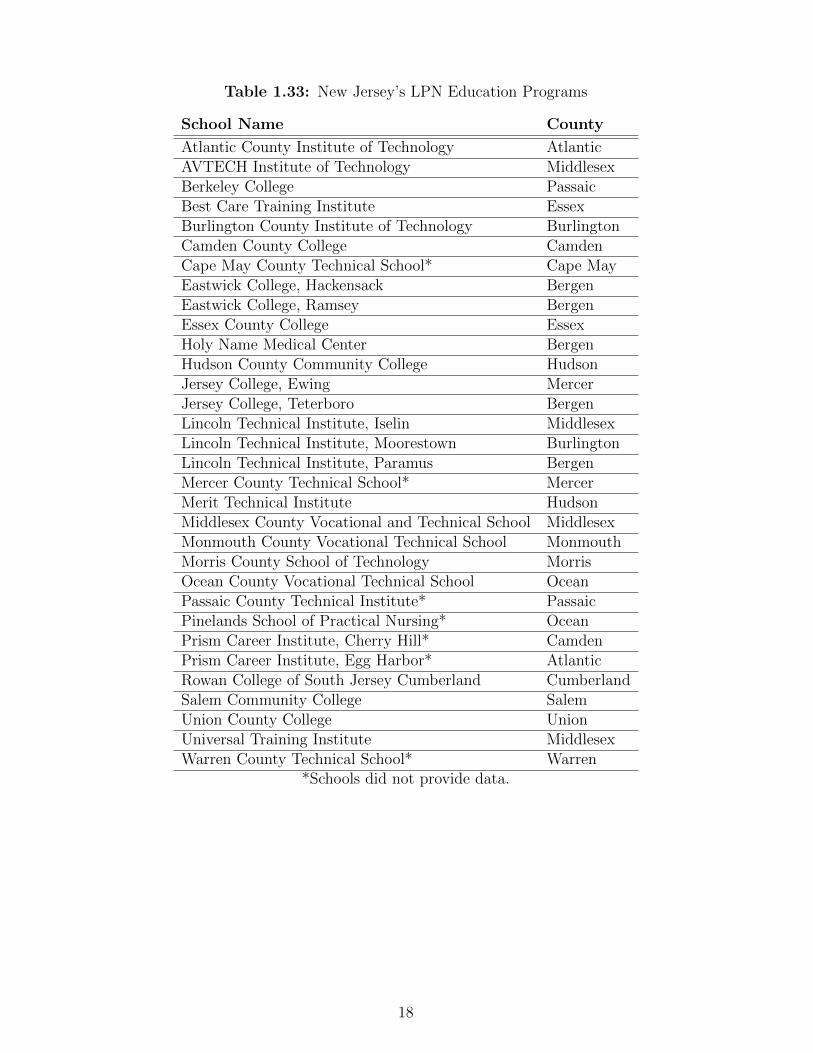
Table 1.33: New Jersey’s LPN Education Programs
School Name County
Atlantic County Institute of Technology AtlanticAVTECH Institute of Technology MiddlesexBerkeley College PassaicBest Care Training Institute EssexBurlington County Institute of Technology BurlingtonCamden County College CamdenCape May County Technical School* Cape MayEastwick College, Hackensack BergenEastwick College, Ramsey BergenEssex County College EssexHoly Name Medical Center BergenHudson County Community College HudsonJersey College, Ewing MercerJersey College, Teterboro BergenLincoln Technical Institute, Iselin MiddlesexLincoln Technical Institute, Moorestown BurlingtonLincoln Technical Institute, Paramus BergenMercer County Technical School* MercerMerit Technical Institute HudsonMiddlesex County Vocational and Technical School MiddlesexMonmouth County Vocational Technical School MonmouthMorris County School of Technology MorrisOcean County Vocational Technical School OceanPassaic County Technical Institute* PassaicPinelands School of Practical Nursing* OceanPrism Career Institute, Cherry Hill* CamdenPrism Career Institute, Egg Harbor* AtlanticRowan College of South Jersey Cumberland CumberlandSalem Community College SalemUnion County College UnionUniversal Training Institute MiddlesexWarren County Technical School* Warren
*Schools did not provide data.
18
Nursing Faculty Report
Faculty for Pre- and Post-licensure RN Programs
Employment
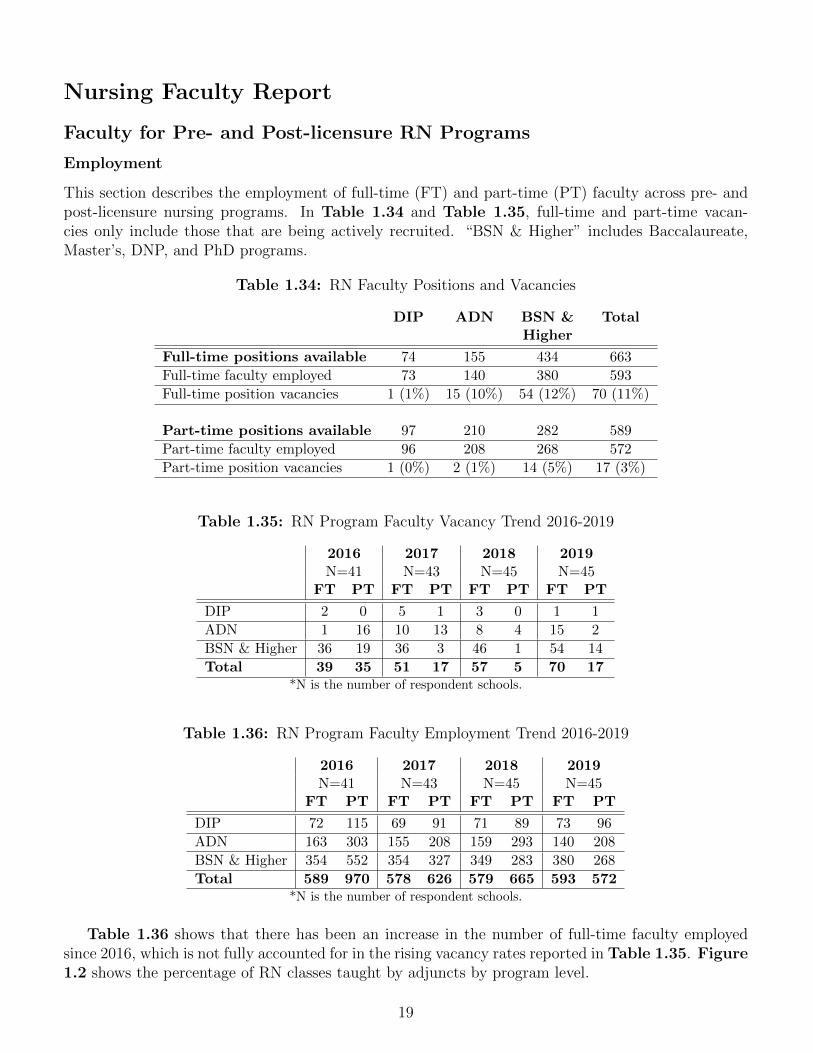
This section describes the employment of full-time (FT) and part-time (PT) faculty across pre- andpost-licensure nursing programs. In Table 1.34 and Table 1.35, full-time and part-time vacan-cies only include those that are being actively recruited. “BSN & Higher” includes Baccalaureate,Master’s, DNP, and PhD programs.
Table 1.34: RN Faculty Positions and Vacancies
DIP ADN BSN & TotalHigher
Full-time positions available 74 155 434 663
Full-time faculty employed 73 140 380 593
Full-time position vacancies 1 (1%) 15 (10%) 54 (12%) 70 (11%)
Part-time positions available 97 210 282 589
Part-time faculty employed 96 208 268 572
Part-time position vacancies 1 (0%) 2 (1%) 14 (5%) 17 (3%)
Table 1.35: RN Program Faculty Vacancy Trend 2016-2019
2016 2017 2018 2019N=41 N=43 N=45 N=45
FT PT FT PT FT PT FT PT
DIP 2 0 5 1 3 0 1 1
ADN 1 16 10 13 8 4 15 2
BSN & Higher 36 19 36 3 46 1 54 14
Total 39 35 51 17 57 5 70 17*N is the number of respondent schools.
Table 1.36: RN Program Faculty Employment Trend 2016-2019
2016 2017 2018 2019N=41 N=43 N=45 N=45
FT PT FT PT FT PT FT PT
DIP 72 115 69 91 71 89 73 96
ADN 163 303 155 208 159 293 140 208
BSN & Higher 354 552 354 327 349 283 380 268
Total 589 970 578 626 579 665 593 572*N is the number of respondent schools.
Table 1.36 shows that there has been an increase in the number of full-time faculty employedsince 2016, which is not fully accounted for in the rising vacancy rates reported in Table 1.35. Figure1.2 shows the percentage of RN classes taught by adjuncts by program level.
19
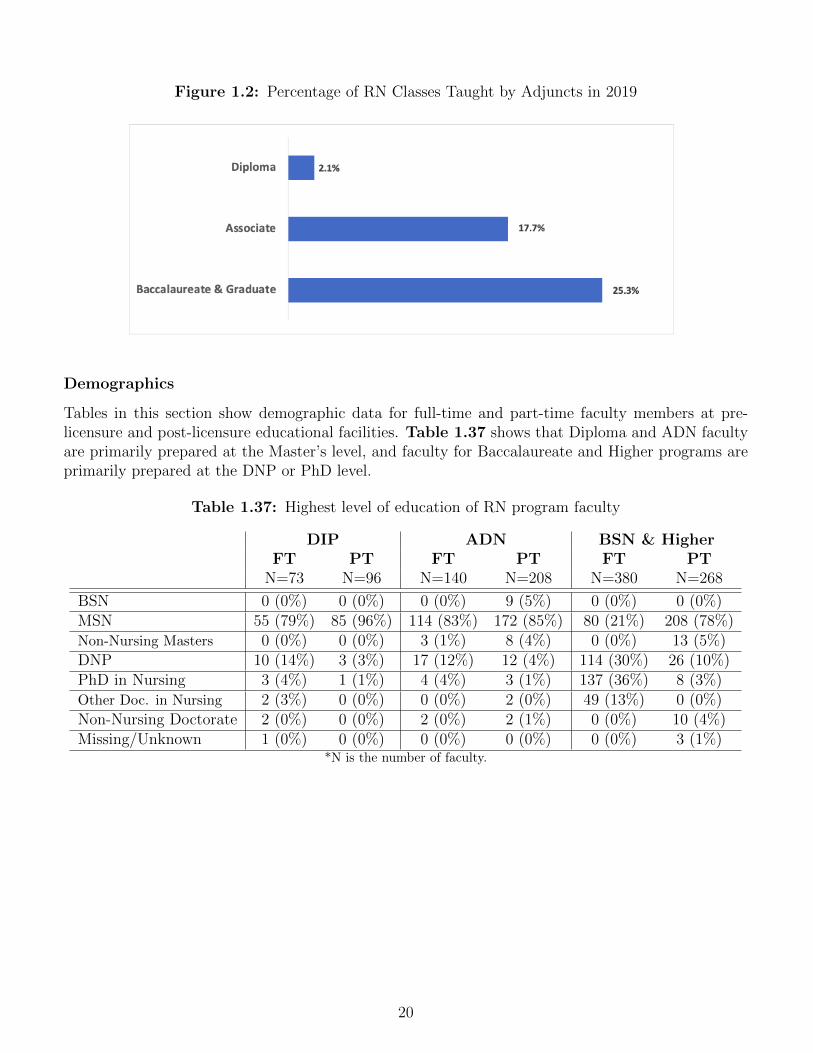
Figure 1.2: Percentage of RN Classes Taught by Adjuncts in 2019
Demographics
Tables in this section show demographic data for full-time and part-time faculty members at pre-licensure and post-licensure educational facilities. Table 1.37 shows that Diploma and ADN facultyare primarily prepared at the Master’s level, and faculty for Baccalaureate and Higher programs areprimarily prepared at the DNP or PhD level.
Table 1.37: Highest level of education of RN program faculty
DIP ADN BSN & HigherFT PT FT PT FT PT
N=73 N=96 N=140 N=208 N=380 N=268
BSN 0 (0%) 0 (0%) 0 (0%) 9 (5%) 0 (0%) 0 (0%)MSN 55 (79%) 85 (96%) 114 (83%) 172 (85%) 80 (21%) 208 (78%)Non-Nursing Masters 0 (0%) 0 (0%) 3 (1%) 8 (4%) 0 (0%) 13 (5%)DNP 10 (14%) 3 (3%) 17 (12%) 12 (4%) 114 (30%) 26 (10%)PhD in Nursing 3 (4%) 1 (1%) 4 (4%) 3 (1%) 137 (36%) 8 (3%)Other Doc. in Nursing 2 (3%) 0 (0%) 0 (0%) 2 (0%) 49 (13%) 0 (0%)Non-Nursing Doctorate 2 (0%) 0 (0%) 2 (0%) 2 (1%) 0 (0%) 10 (4%)Missing/Unknown 1 (0%) 0 (0%) 0 (0%) 0 (0%) 0 (0%) 3 (1%)
*N is the number of faculty.
20
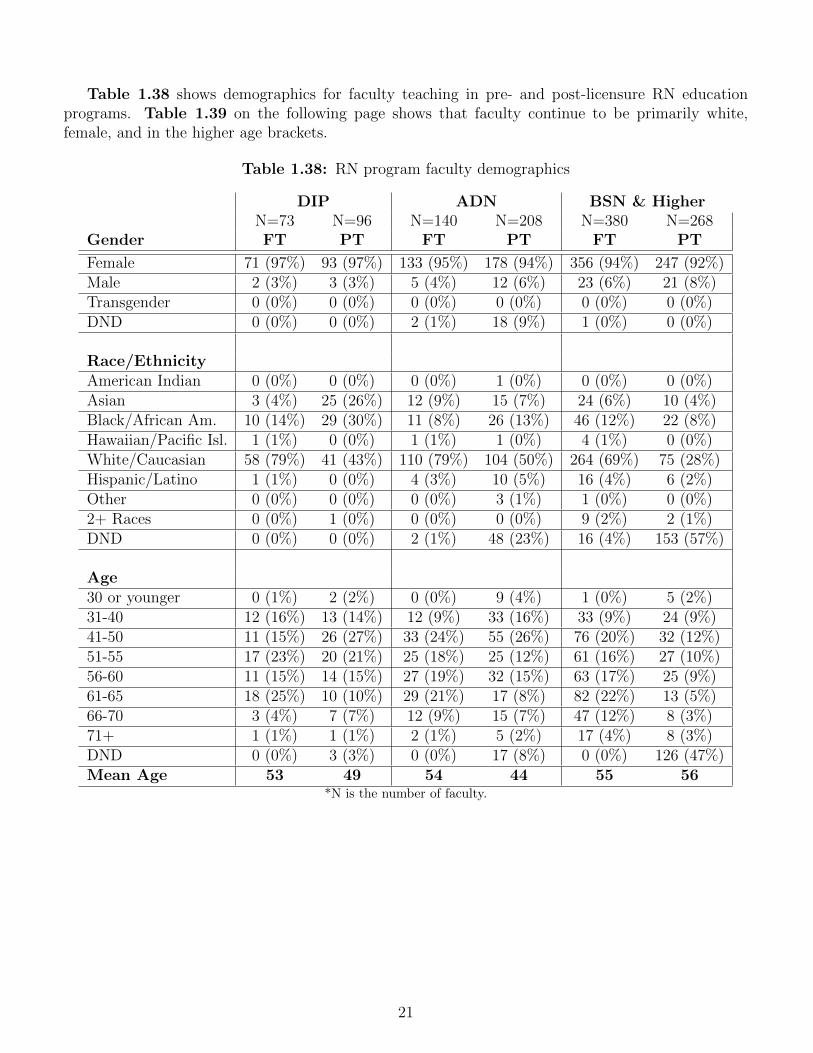
Table 1.38 shows demographics for faculty teaching in pre- and post-licensure RN educationprograms. Table 1.39 on the following page shows that faculty continue to be primarily white,female, and in the higher age brackets.
Table 1.38: RN program faculty demographics
DIP ADN BSN & HigherN=73 N=96 N=140 N=208 N=380 N=268
Gender FT PT FT PT FT PT
Female 71 (97%) 93 (97%) 133 (95%) 178 (94%) 356 (94%) 247 (92%)Male 2 (3%) 3 (3%) 5 (4%) 12 (6%) 23 (6%) 21 (8%)Transgender 0 (0%) 0 (0%) 0 (0%) 0 (0%) 0 (0%) 0 (0%)DND 0 (0%) 0 (0%) 2 (1%) 18 (9%) 1 (0%) 0 (0%)
Race/EthnicityAmerican Indian 0 (0%) 0 (0%) 0 (0%) 1 (0%) 0 (0%) 0 (0%)Asian 3 (4%) 25 (26%) 12 (9%) 15 (7%) 24 (6%) 10 (4%)Black/African Am. 10 (14%) 29 (30%) 11 (8%) 26 (13%) 46 (12%) 22 (8%)Hawaiian/Pacific Isl. 1 (1%) 0 (0%) 1 (1%) 1 (0%) 4 (1%) 0 (0%)White/Caucasian 58 (79%) 41 (43%) 110 (79%) 104 (50%) 264 (69%) 75 (28%)Hispanic/Latino 1 (1%) 0 (0%) 4 (3%) 10 (5%) 16 (4%) 6 (2%)Other 0 (0%) 0 (0%) 0 (0%) 3 (1%) 1 (0%) 0 (0%)2+ Races 0 (0%) 1 (0%) 0 (0%) 0 (0%) 9 (2%) 2 (1%)DND 0 (0%) 0 (0%) 2 (1%) 48 (23%) 16 (4%) 153 (57%)
Age30 or younger 0 (1%) 2 (2%) 0 (0%) 9 (4%) 1 (0%) 5 (2%)31-40 12 (16%) 13 (14%) 12 (9%) 33 (16%) 33 (9%) 24 (9%)41-50 11 (15%) 26 (27%) 33 (24%) 55 (26%) 76 (20%) 32 (12%)51-55 17 (23%) 20 (21%) 25 (18%) 25 (12%) 61 (16%) 27 (10%)56-60 11 (15%) 14 (15%) 27 (19%) 32 (15%) 63 (17%) 25 (9%)61-65 18 (25%) 10 (10%) 29 (21%) 17 (8%) 82 (22%) 13 (5%)66-70 3 (4%) 7 (7%) 12 (9%) 15 (7%) 47 (12%) 8 (3%)71+ 1 (1%) 1 (1%) 2 (1%) 5 (2%) 17 (4%) 8 (3%)DND 0 (0%) 3 (3%) 0 (0%) 17 (8%) 0 (0%) 126 (47%)Mean Age 53 49 54 44 55 56
*N is the number of faculty.
21
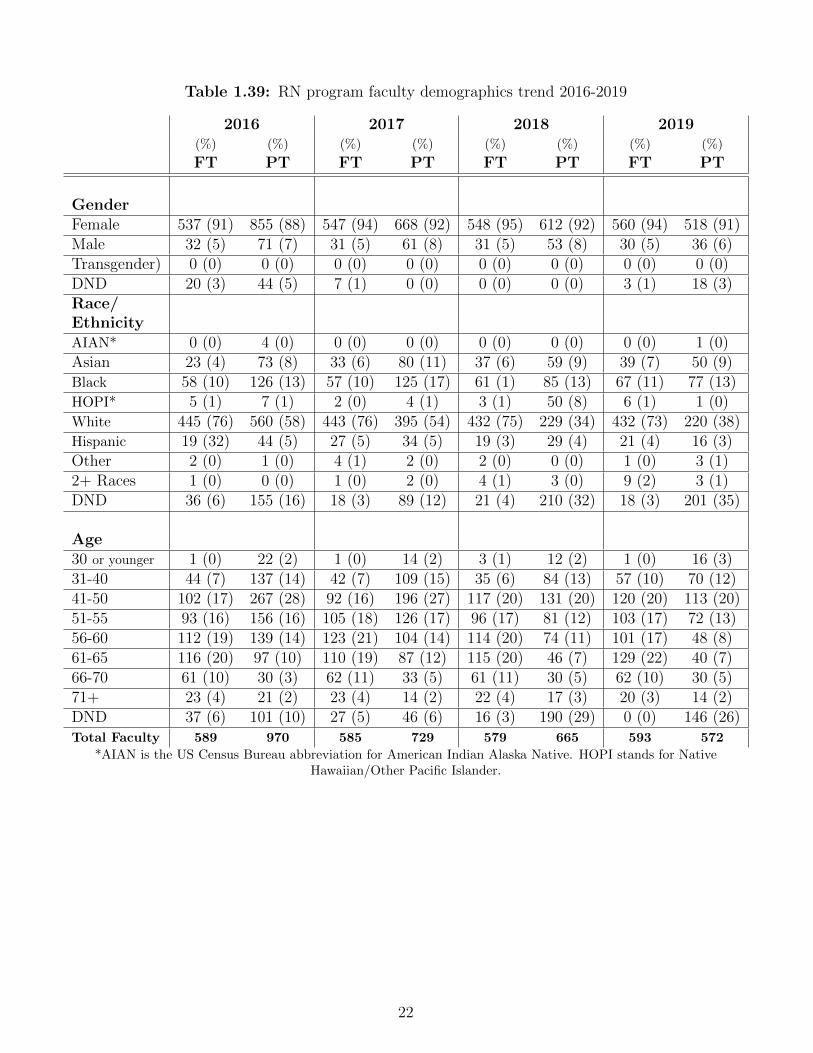
Table 1.39: RN program faculty demographics trend 2016-2019
2016 2017 2018 2019(%) (%) (%) (%) (%) (%) (%) (%)
FT PT FT PT FT PT FT PT
GenderFemale 537 (91) 855 (88) 547 (94) 668 (92) 548 (95) 612 (92) 560 (94) 518 (91)Male 32 (5) 71 (7) 31 (5) 61 (8) 31 (5) 53 (8) 30 (5) 36 (6)Transgender) 0 (0) 0 (0) 0 (0) 0 (0) 0 (0) 0 (0) 0 (0) 0 (0)DND 20 (3) 44 (5) 7 (1) 0 (0) 0 (0) 0 (0) 3 (1) 18 (3)Race/EthnicityAIAN* 0 (0) 4 (0) 0 (0) 0 (0) 0 (0) 0 (0) 0 (0) 1 (0)Asian 23 (4) 73 (8) 33 (6) 80 (11) 37 (6) 59 (9) 39 (7) 50 (9)Black 58 (10) 126 (13) 57 (10) 125 (17) 61 (1) 85 (13) 67 (11) 77 (13)HOPI* 5 (1) 7 (1) 2 (0) 4 (1) 3 (1) 50 (8) 6 (1) 1 (0)White 445 (76) 560 (58) 443 (76) 395 (54) 432 (75) 229 (34) 432 (73) 220 (38)Hispanic 19 (32) 44 (5) 27 (5) 34 (5) 19 (3) 29 (4) 21 (4) 16 (3)Other 2 (0) 1 (0) 4 (1) 2 (0) 2 (0) 0 (0) 1 (0) 3 (1)2+ Races 1 (0) 0 (0) 1 (0) 2 (0) 4 (1) 3 (0) 9 (2) 3 (1)DND 36 (6) 155 (16) 18 (3) 89 (12) 21 (4) 210 (32) 18 (3) 201 (35)
Age30 or younger 1 (0) 22 (2) 1 (0) 14 (2) 3 (1) 12 (2) 1 (0) 16 (3)31-40 44 (7) 137 (14) 42 (7) 109 (15) 35 (6) 84 (13) 57 (10) 70 (12)41-50 102 (17) 267 (28) 92 (16) 196 (27) 117 (20) 131 (20) 120 (20) 113 (20)51-55 93 (16) 156 (16) 105 (18) 126 (17) 96 (17) 81 (12) 103 (17) 72 (13)56-60 112 (19) 139 (14) 123 (21) 104 (14) 114 (20) 74 (11) 101 (17) 48 (8)61-65 116 (20) 97 (10) 110 (19) 87 (12) 115 (20) 46 (7) 129 (22) 40 (7)66-70 61 (10) 30 (3) 62 (11) 33 (5) 61 (11) 30 (5) 62 (10) 30 (5)71+ 23 (4) 21 (2) 23 (4) 14 (2) 22 (4) 17 (3) 20 (3) 14 (2)DND 37 (6) 101 (10) 27 (5) 46 (6) 16 (3) 190 (29) 0 (0) 146 (26)Total Faculty 589 970 585 729 579 665 593 572
*AIAN is the US Census Bureau abbreviation for American Indian Alaska Native. HOPI stands for NativeHawaiian/Other Pacific Islander.
22
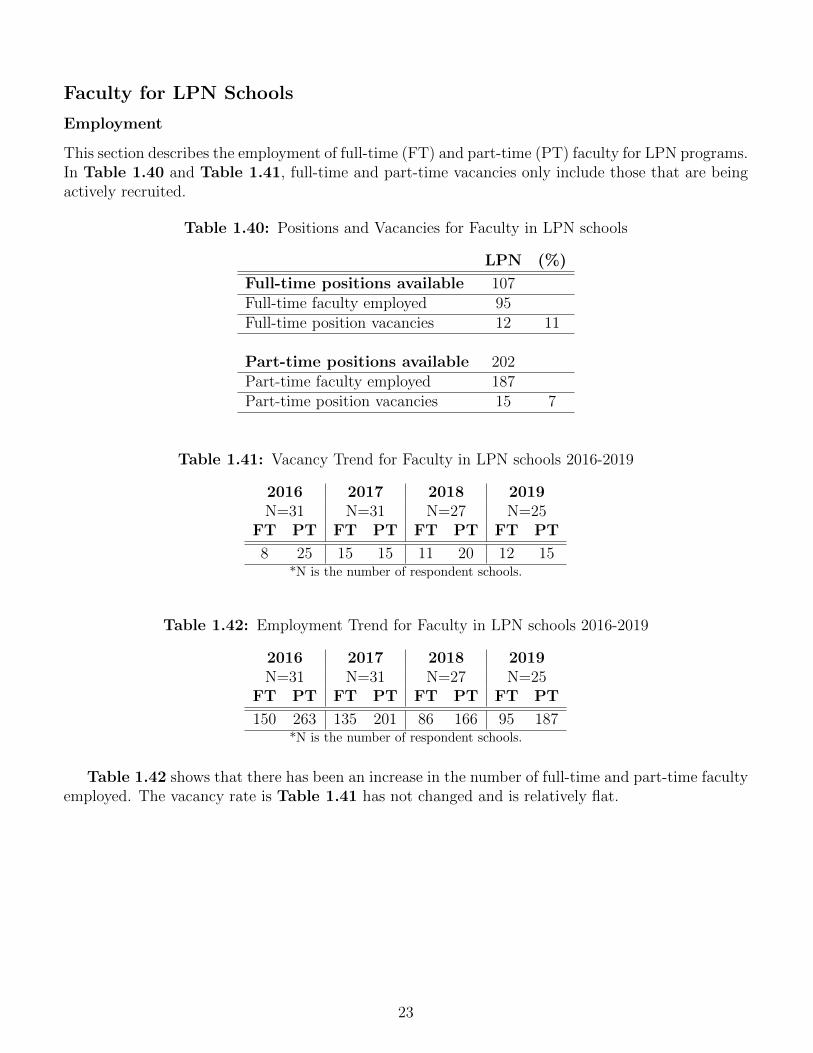
Faculty for LPN Schools
Employment
This section describes the employment of full-time (FT) and part-time (PT) faculty for LPN programs.In Table 1.40 and Table 1.41, full-time and part-time vacancies only include those that are beingactively recruited.
Table 1.40: Positions and Vacancies for Faculty in LPN schools
LPN (%)
Full-time positions available 107Full-time faculty employed 95Full-time position vacancies 12 11
Part-time positions available 202Part-time faculty employed 187Part-time position vacancies 15 7
Table 1.41: Vacancy Trend for Faculty in LPN schools 2016-2019
2016 2017 2018 2019N=31 N=31 N=27 N=25
FT PT FT PT FT PT FT PT
8 25 15 15 11 20 12 15*N is the number of respondent schools.
Table 1.42: Employment Trend for Faculty in LPN schools 2016-2019
2016 2017 2018 2019N=31 N=31 N=27 N=25
FT PT FT PT FT PT FT PT
150 263 135 201 86 166 95 187*N is the number of respondent schools.
Table 1.42 shows that there has been an increase in the number of full-time and part-time facultyemployed. The vacancy rate is Table 1.41 has not changed and is relatively flat.
23
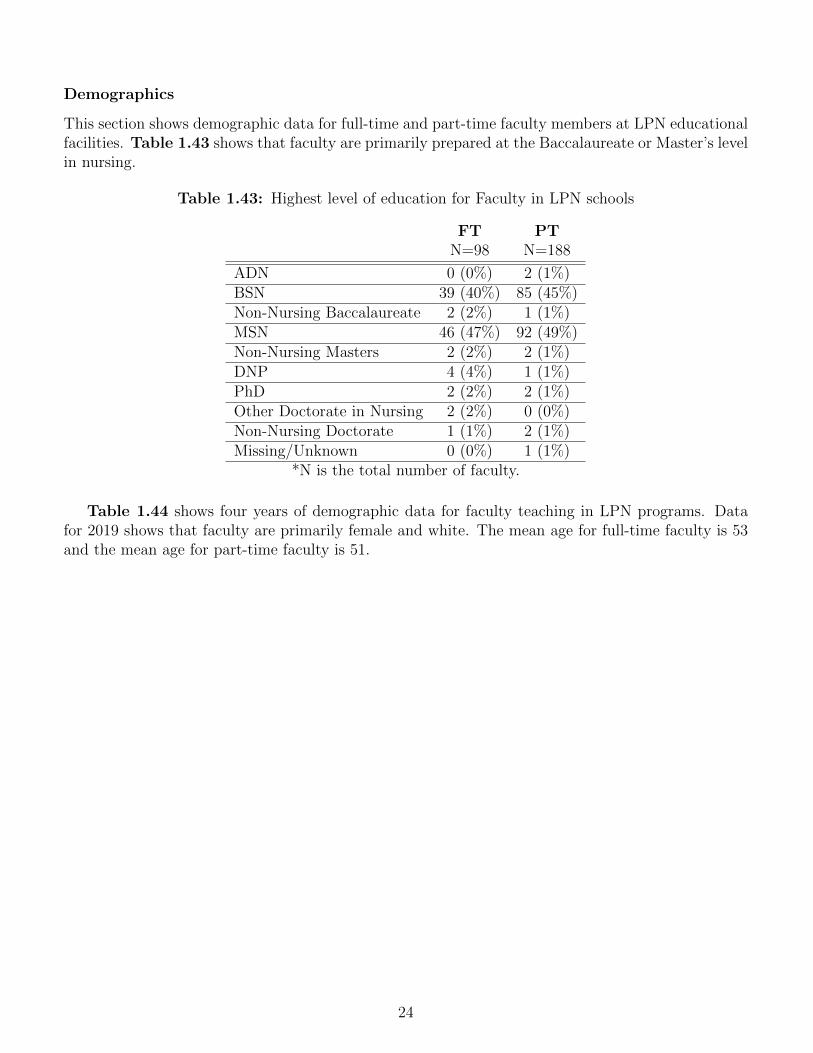
Demographics
This section shows demographic data for full-time and part-time faculty members at LPN educationalfacilities. Table 1.43 shows that faculty are primarily prepared at the Baccalaureate or Master’s levelin nursing.
Table 1.43: Highest level of education for Faculty in LPN schools
FT PTN=98 N=188
ADN 0 (0%) 2 (1%)BSN 39 (40%) 85 (45%)Non-Nursing Baccalaureate 2 (2%) 1 (1%)MSN 46 (47%) 92 (49%)Non-Nursing Masters 2 (2%) 2 (1%)DNP 4 (4%) 1 (1%)PhD 2 (2%) 2 (1%)Other Doctorate in Nursing 2 (2%) 0 (0%)Non-Nursing Doctorate 1 (1%) 2 (1%)Missing/Unknown 0 (0%) 1 (1%)
*N is the total number of faculty.
Table 1.44 shows four years of demographic data for faculty teaching in LPN programs. Datafor 2019 shows that faculty are primarily female and white. The mean age for full-time faculty is 53and the mean age for part-time faculty is 51.
24
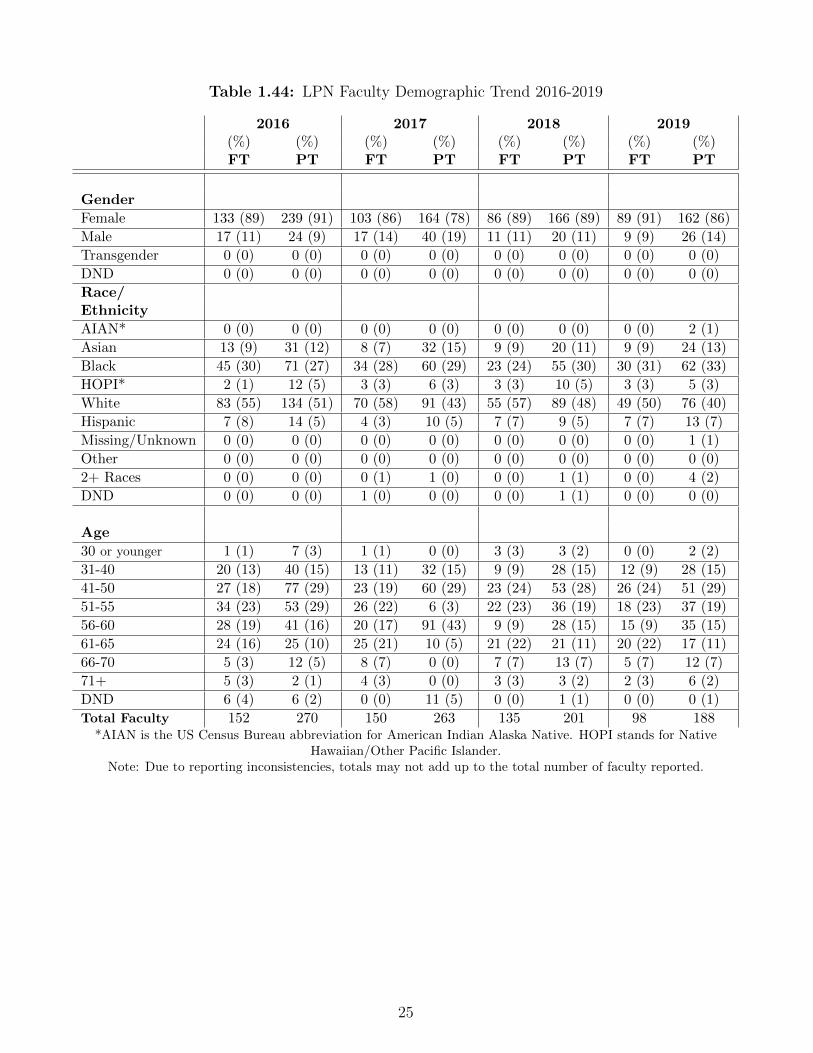
Table 1.44: LPN Faculty Demographic Trend 2016-2019
2016 2017 2018 2019(%) (%) (%) (%) (%) (%) (%) (%)FT PT FT PT FT PT FT PT
Gender
Female 133 (89) 239 (91) 103 (86) 164 (78) 86 (89) 166 (89) 89 (91) 162 (86)
Male 17 (11) 24 (9) 17 (14) 40 (19) 11 (11) 20 (11) 9 (9) 26 (14)
Transgender 0 (0) 0 (0) 0 (0) 0 (0) 0 (0) 0 (0) 0 (0) 0 (0)
DND 0 (0) 0 (0) 0 (0) 0 (0) 0 (0) 0 (0) 0 (0) 0 (0)
Race/Ethnicity
AIAN* 0 (0) 0 (0) 0 (0) 0 (0) 0 (0) 0 (0) 0 (0) 2 (1)
Asian 13 (9) 31 (12) 8 (7) 32 (15) 9 (9) 20 (11) 9 (9) 24 (13)
Black 45 (30) 71 (27) 34 (28) 60 (29) 23 (24) 55 (30) 30 (31) 62 (33)
HOPI* 2 (1) 12 (5) 3 (3) 6 (3) 3 (3) 10 (5) 3 (3) 5 (3)
White 83 (55) 134 (51) 70 (58) 91 (43) 55 (57) 89 (48) 49 (50) 76 (40)
Hispanic 7 (8) 14 (5) 4 (3) 10 (5) 7 (7) 9 (5) 7 (7) 13 (7)
Missing/Unknown 0 (0) 0 (0) 0 (0) 0 (0) 0 (0) 0 (0) 0 (0) 1 (1)
Other 0 (0) 0 (0) 0 (0) 0 (0) 0 (0) 0 (0) 0 (0) 0 (0)
2+ Races 0 (0) 0 (0) 0 (1) 1 (0) 0 (0) 1 (1) 0 (0) 4 (2)
DND 0 (0) 0 (0) 1 (0) 0 (0) 0 (0) 1 (1) 0 (0) 0 (0)
Age
30 or younger 1 (1) 7 (3) 1 (1) 0 (0) 3 (3) 3 (2) 0 (0) 2 (2)
31-40 20 (13) 40 (15) 13 (11) 32 (15) 9 (9) 28 (15) 12 (9) 28 (15)
41-50 27 (18) 77 (29) 23 (19) 60 (29) 23 (24) 53 (28) 26 (24) 51 (29)
51-55 34 (23) 53 (29) 26 (22) 6 (3) 22 (23) 36 (19) 18 (23) 37 (19)
56-60 28 (19) 41 (16) 20 (17) 91 (43) 9 (9) 28 (15) 15 (9) 35 (15)
61-65 24 (16) 25 (10) 25 (21) 10 (5) 21 (22) 21 (11) 20 (22) 17 (11)
66-70 5 (3) 12 (5) 8 (7) 0 (0) 7 (7) 13 (7) 5 (7) 12 (7)
71+ 5 (3) 2 (1) 4 (3) 0 (0) 3 (3) 3 (2) 2 (3) 6 (2)
DND 6 (4) 6 (2) 0 (0) 11 (5) 0 (0) 1 (1) 0 (0) 0 (1)
Total Faculty 152 270 150 263 135 201 98 188*AIAN is the US Census Bureau abbreviation for American Indian Alaska Native. HOPI stands for Native
Hawaiian/Other Pacific Islander.Note: Due to reporting inconsistencies, totals may not add up to the total number of faculty reported.
25

26
Chapter 2
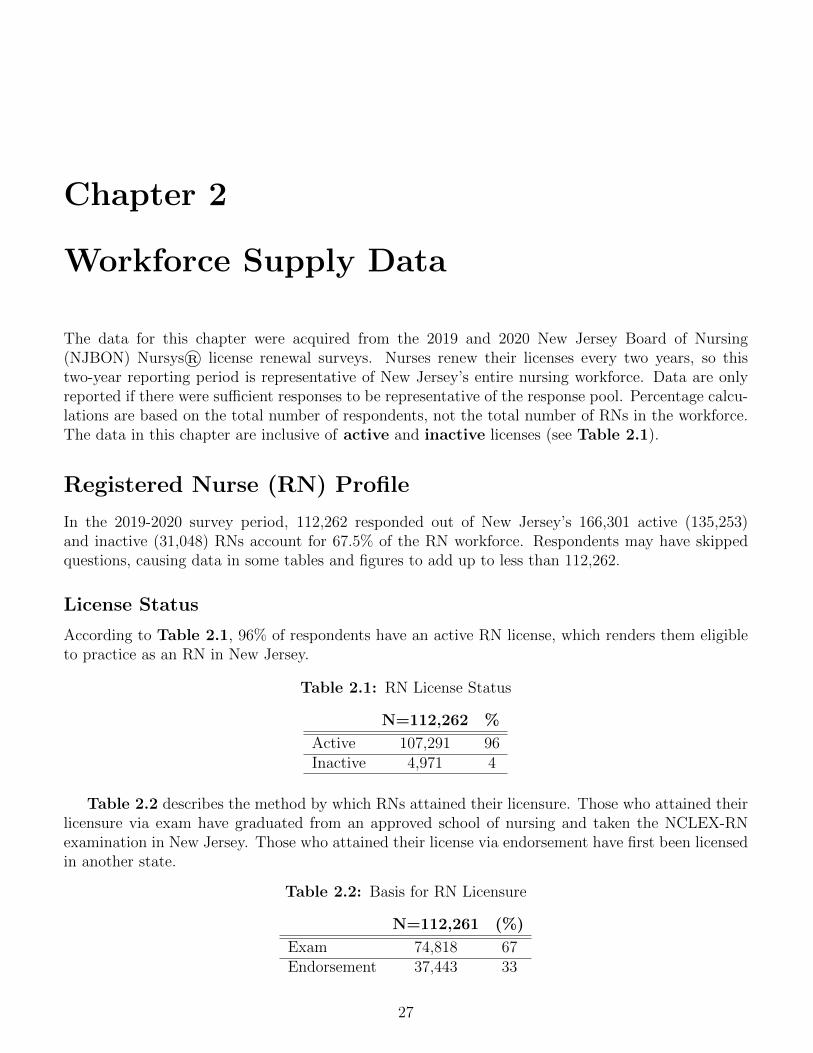
Workforce Supply Data
The data for this chapter were acquired from the 2019 and 2020 New Jersey Board of Nursing(NJBON) Nursys® license renewal surveys. Nurses renew their licenses every two years, so thistwo-year reporting period is representative of New Jersey’s entire nursing workforce. Data are onlyreported if there were sufficient responses to be representative of the response pool. Percentage calcu-lations are based on the total number of respondents, not the total number of RNs in the workforce.The data in this chapter are inclusive of active and inactive licenses (see Table 2.1).
Registered Nurse (RN) Profile
In the 2019-2020 survey period, 112,262 responded out of New Jersey’s 166,301 active (135,253)and inactive (31,048) RNs account for 67.5% of the RN workforce. Respondents may have skippedquestions, causing data in some tables and figures to add up to less than 112,262.
License Status
According to Table 2.1, 96% of respondents have an active RN license, which renders them eligibleto practice as an RN in New Jersey.
Table 2.1: RN License Status
N=112,262 %
Active 107,291 96Inactive 4,971 4
Table 2.2 describes the method by which RNs attained their licensure. Those who attained theirlicensure via exam have graduated from an approved school of nursing and taken the NCLEX-RNexamination in New Jersey. Those who attained their license via endorsement have first been licensedin another state.
Table 2.2: Basis for RN Licensure
N=112,261 (%)
Exam 74,818 67Endorsement 37,443 33
27
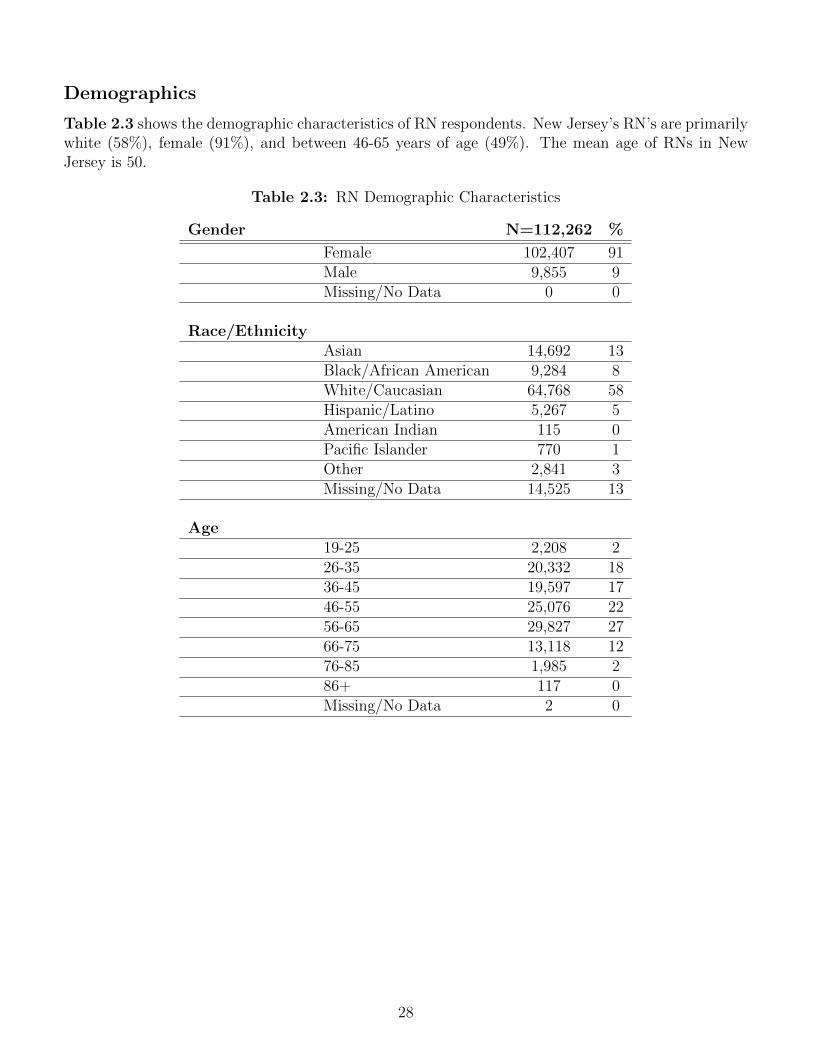
Demographics
Table 2.3 shows the demographic characteristics of RN respondents. New Jersey’s RN’s are primarilywhite (58%), female (91%), and between 46-65 years of age (49%). The mean age of RNs in NewJersey is 50.
Table 2.3: RN Demographic Characteristics
Gender N=112,262 %
Female 102,407 91Male 9,855 9Missing/No Data 0 0
Race/EthnicityAsian 14,692 13Black/African American 9,284 8White/Caucasian 64,768 58Hispanic/Latino 5,267 5American Indian 115 0Pacific Islander 770 1Other 2,841 3Missing/No Data 14,525 13
Age19-25 2,208 226-35 20,332 1836-45 19,597 1746-55 25,076 2256-65 29,827 2766-75 13,118 1276-85 1,985 286+ 117 0Missing/No Data 2 0
28
Education
The National Academy of Medicine (formerly the Institute of Medicine) recommended that 80% ofnurses be prepared at the baccalaureate or higher level by 2020. NJCCN has monitored New Jersey’sprogress towards that goal via the Nurse License Renewal Survey.
Table 2.4 describes the highest degree of nursing education currently held by respondents whowere renewing their RN license. Of the 89,618 respondents, excluding those who did not provide data(Missing/invalid), 67% have a Baccalaureate or higher degree in nursing, and 33% have an Associate’sDegree or Diploma in nursing.
Table 2.4: RN Highest Level of Education*
N=89,618 %
Diploma in Nursing 4,667 5Associate’s Degree in Nursing 24,729 28Baccalaureate Degree in Nursing 51,138 57Master’s Degree in Nursing 8,215 9DNP, PhD, or Other Doctoral Degree in Nursing 869 1
*The 22,644 missing/invalid data are excluded.
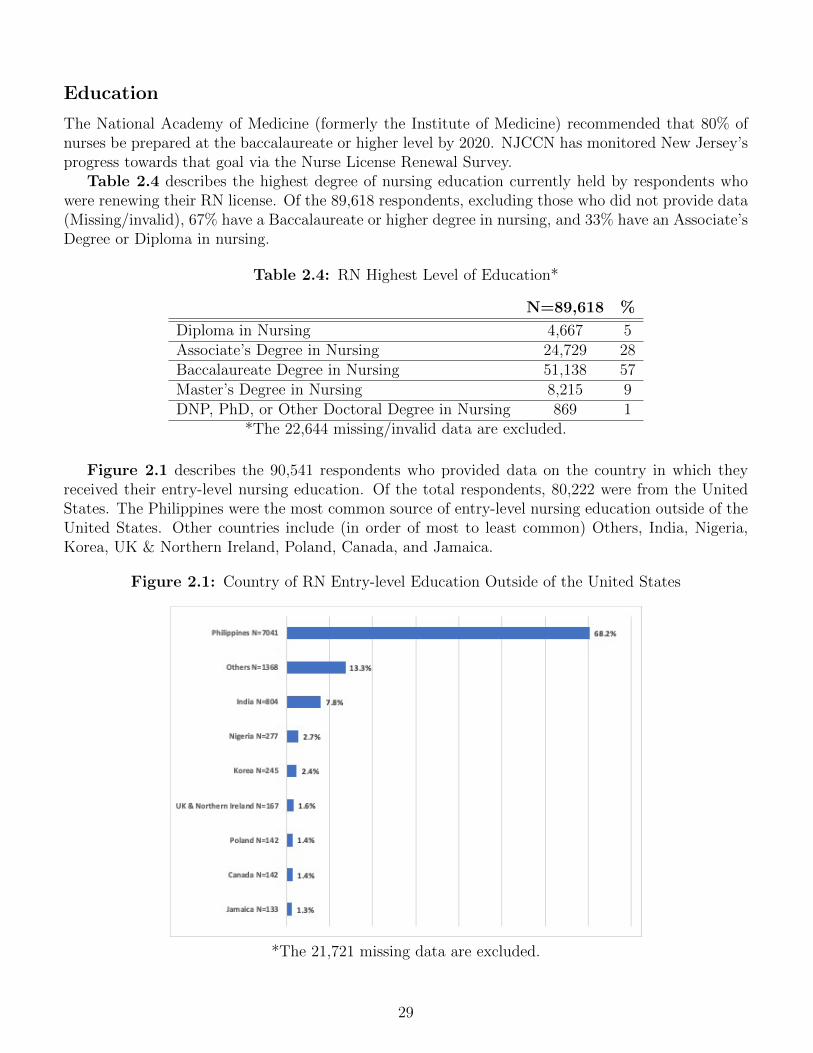
Figure 2.1 describes the 90,541 respondents who provided data on the country in which theyreceived their entry-level nursing education. Of the total respondents, 80,222 were from the UnitedStates. The Philippines were the most common source of entry-level nursing education outside of theUnited States. Other countries include (in order of most to least common) Others, India, Nigeria,Korea, UK & Northern Ireland, Poland, Canada, and Jamaica.
Figure 2.1: Country of RN Entry-level Education Outside of the United States
*The 21,721 missing data are excluded.
29
Employment Characteristics
Table 2.5 describes the employment status of the 91,100 RNs who reported their employment status.“Employed in nursing” is defined as being employed in a position that requires an RN license.
Table 2.5: RN Employment Status*
N=91,100 %
Employed in nursing full-time 67,016 74Employed in nursing part-time 8,733 10Employed in nursing per diem 5,159 6Volunteering (only) in nursing 527 1Retired 4,799 5Unemployed, seeking work in nursing 2,491 3Employed in a field other than nursing 2,375 2
*The 21,162 missing data are excluded.
Respondents were asked to report the number of positions that they are currently holding asa nurse. The following table shows their answers, indicating that a portion of New Jersey’s RNworkforce is holding multiple RN positions.
Table 2.6: Number of RN Positions*
N=82,806 %
1 position 68,430 832 positions 12,990 163 positions 1,384 24 positions 2 0
*The 29,455 missing data are excluded.
30
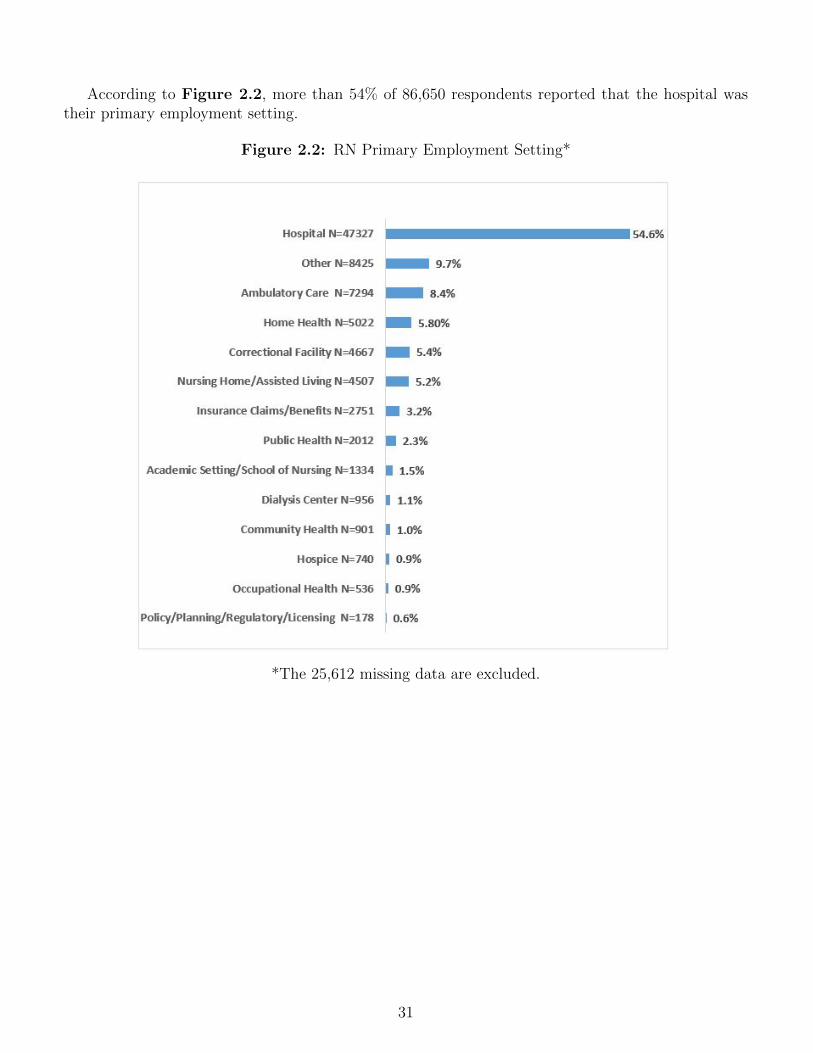
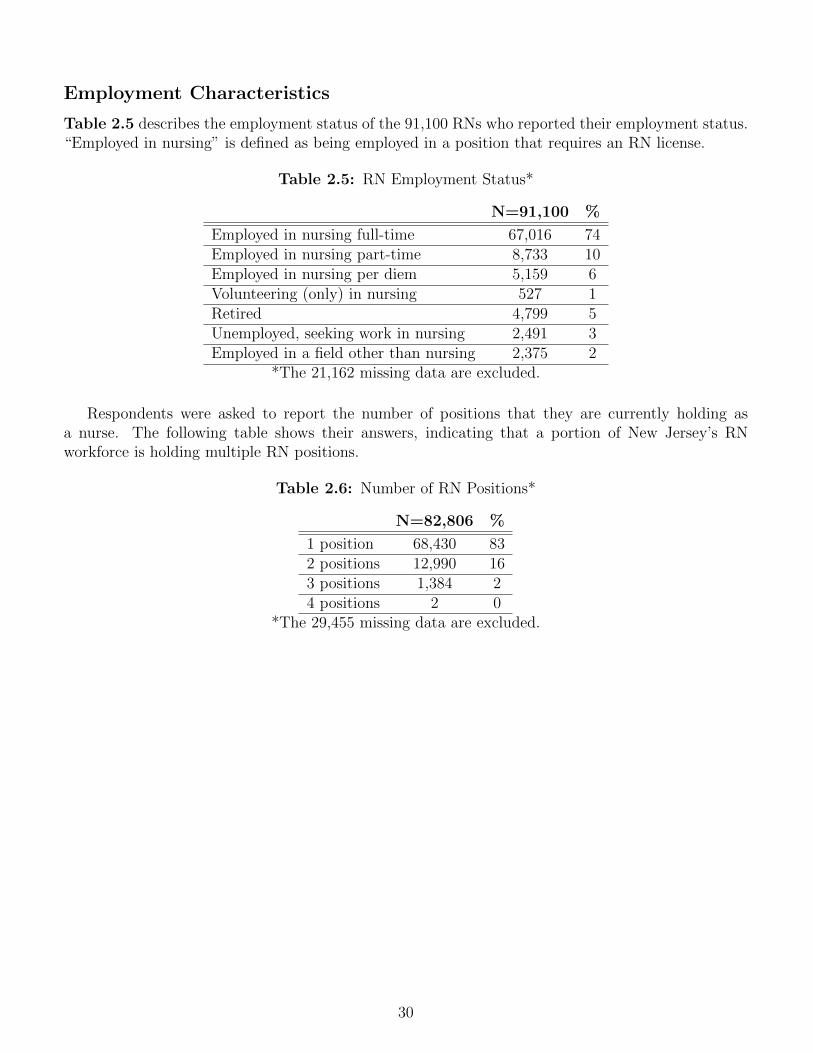
According to Figure 2.2, more than 54% of 86,650 respondents reported that the hospital wastheir primary employment setting.
Figure 2.2: RN Primary Employment Setting*
*The 25,612 missing data are excluded.
31
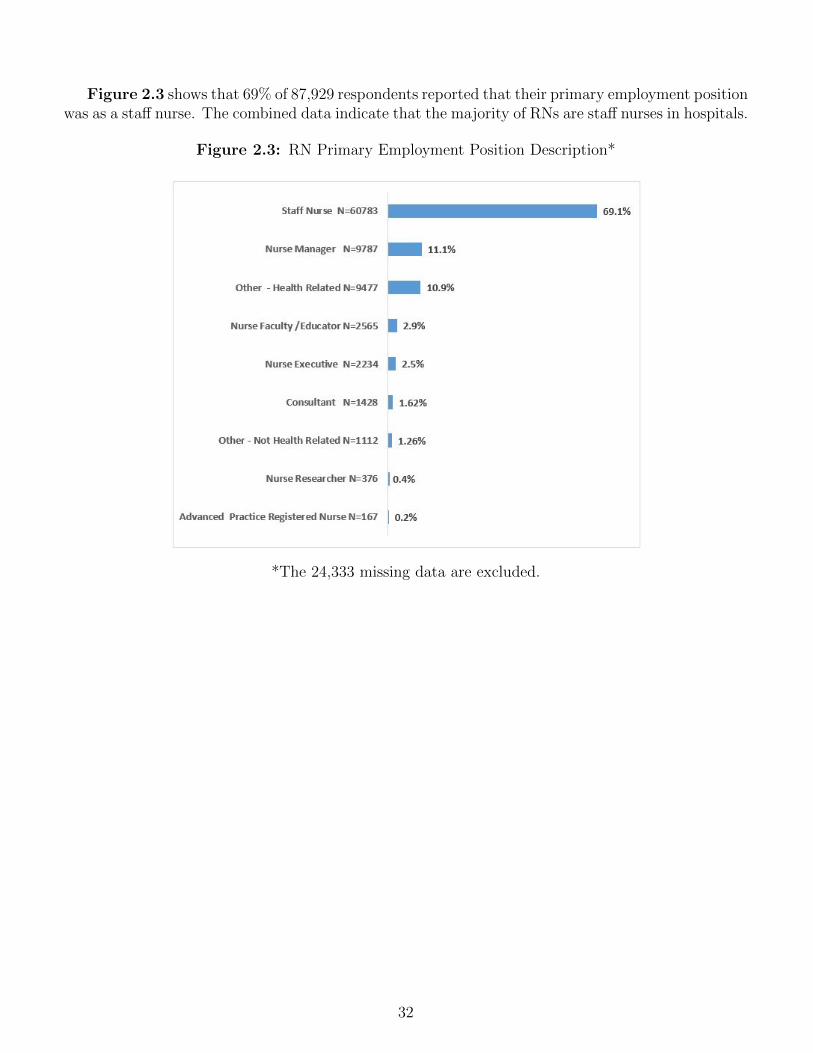
Figure 2.3 shows that 69% of 87,929 respondents reported that their primary employment positionwas as a staff nurse. The combined data indicate that the majority of RNs are staff nurses in hospitals.
Figure 2.3: RN Primary Employment Position Description*
*The 24,333 missing data are excluded.
32
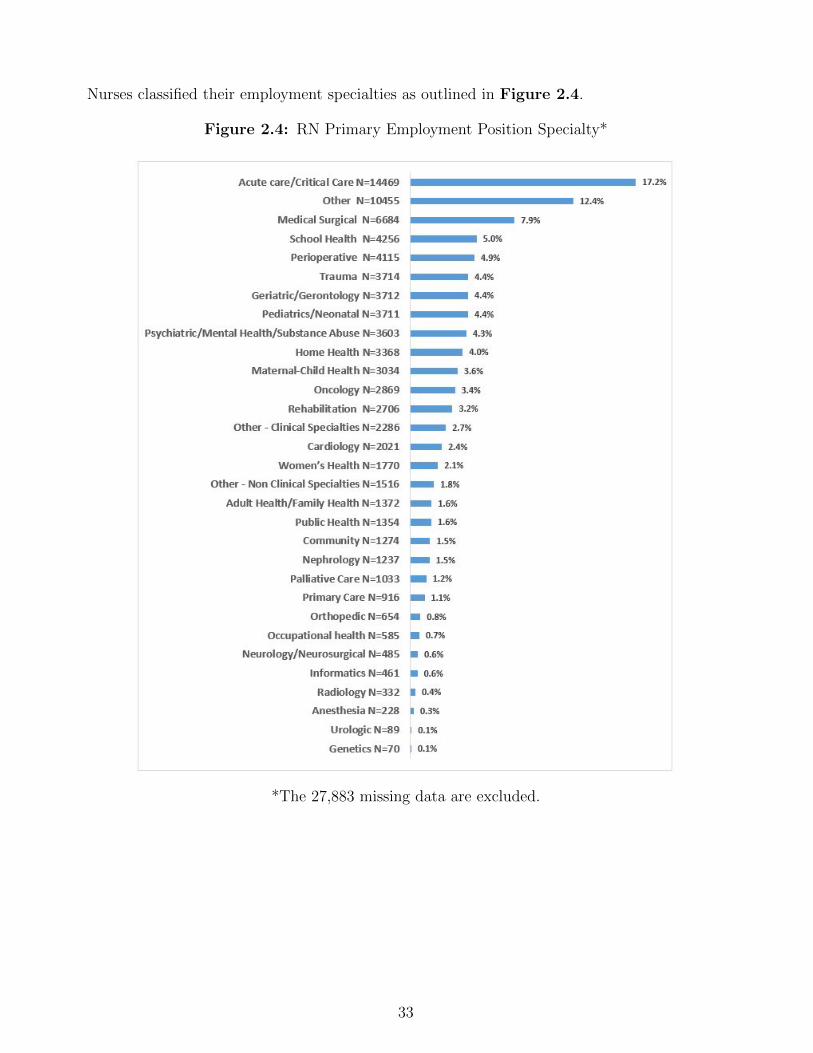
Nurses classified their employment specialties as outlined in Figure 2.4.
Figure 2.4: RN Primary Employment Position Specialty*
*The 27,883 missing data are excluded.
33
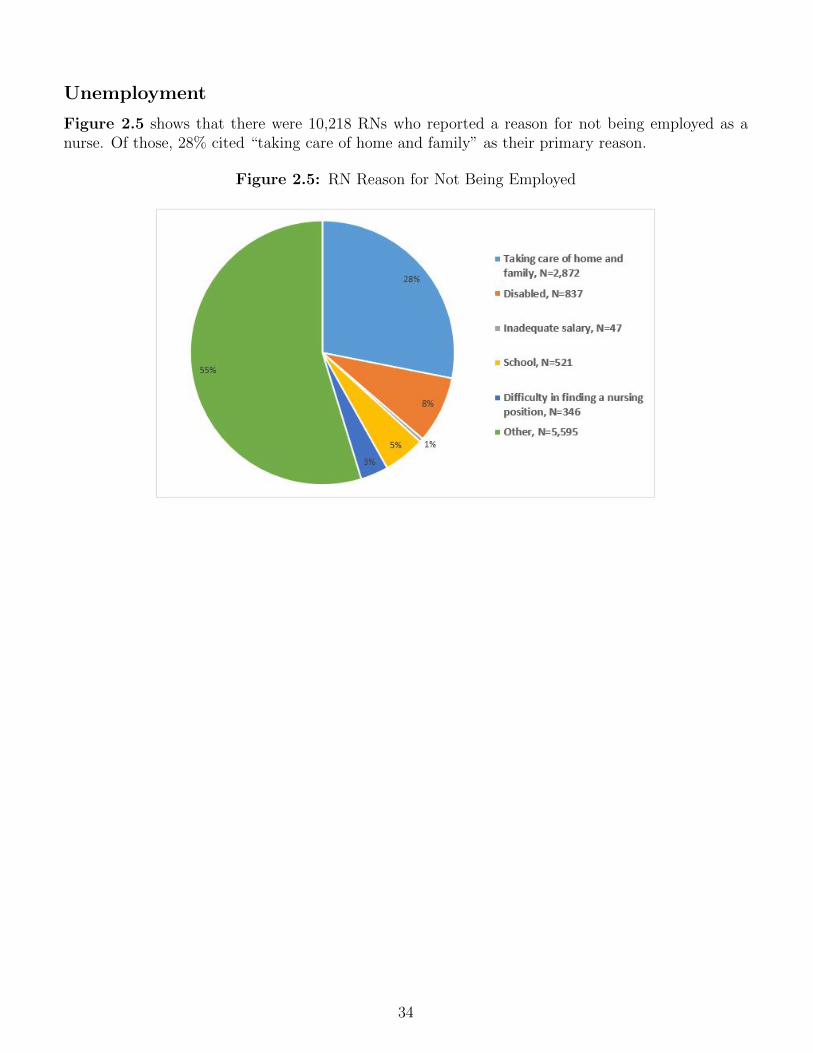
Unemployment
Figure 2.5 shows that there were 10,218 RNs who reported a reason for not being employed as anurse. Of those, 28% cited “taking care of home and family” as their primary reason.
Figure 2.5: RN Reason for Not Being Employed
34
Retirement
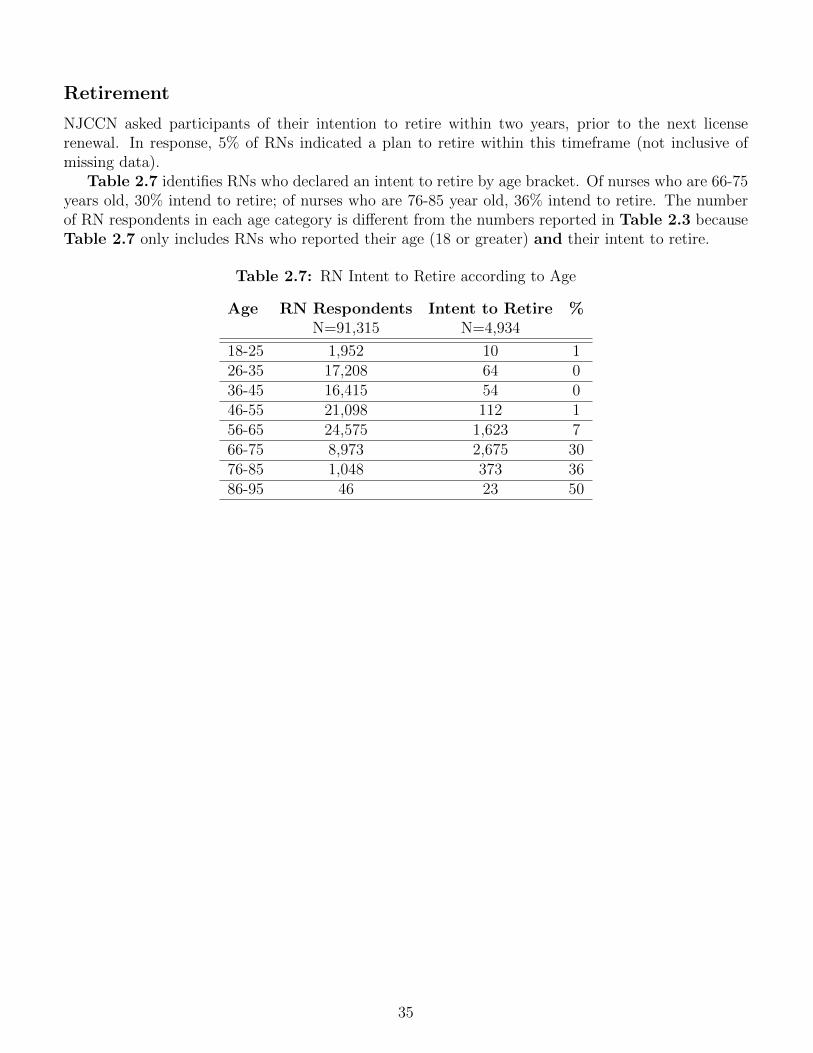
NJCCN asked participants of their intention to retire within two years, prior to the next licenserenewal. In response, 5% of RNs indicated a plan to retire within this timeframe (not inclusive ofmissing data).
Table 2.7 identifies RNs who declared an intent to retire by age bracket. Of nurses who are 66-75years old, 30% intend to retire; of nurses who are 76-85 year old, 36% intend to retire. The numberof RN respondents in each age category is different from the numbers reported in Table 2.3 becauseTable 2.7 only includes RNs who reported their age (18 or greater) and their intent to retire.
Table 2.7: RN Intent to Retire according to Age
Age RN Respondents Intent to Retire %N=91,315 N=4,934
18-25 1,952 10 126-35 17,208 64 036-45 16,415 54 046-55 21,098 112 156-65 24,575 1,623 766-75 8,973 2,675 3076-85 1,048 373 3686-95 46 23 50
35
Advanced Practice Nurse (APN) Profile
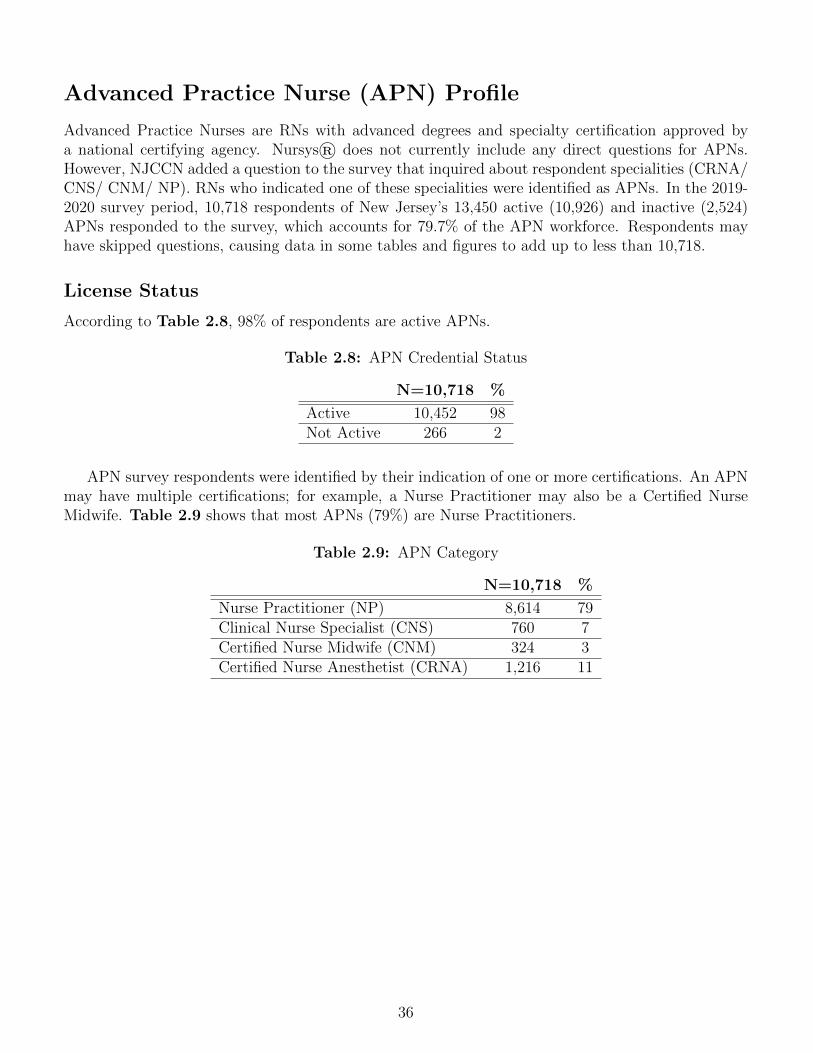
Advanced Practice Nurses are RNs with advanced degrees and specialty certification approved bya national certifying agency. Nursys® does not currently include any direct questions for APNs.However, NJCCN added a question to the survey that inquired about respondent specialities (CRNA/CNS/ CNM/ NP). RNs who indicated one of these specialities were identified as APNs. In the 2019-2020 survey period, 10,718 respondents of New Jersey’s 13,450 active (10,926) and inactive (2,524)APNs responded to the survey, which accounts for 79.7% of the APN workforce. Respondents mayhave skipped questions, causing data in some tables and figures to add up to less than 10,718.
License Status
According to Table 2.8, 98% of respondents are active APNs.
Table 2.8: APN Credential Status
N=10,718 %
Active 10,452 98Not Active 266 2
APN survey respondents were identified by their indication of one or more certifications. An APNmay have multiple certifications; for example, a Nurse Practitioner may also be a Certified NurseMidwife. Table 2.9 shows that most APNs (79%) are Nurse Practitioners.
Table 2.9: APN Category
N=10,718 %
Nurse Practitioner (NP) 8,614 79Clinical Nurse Specialist (CNS) 760 7Certified Nurse Midwife (CNM) 324 3Certified Nurse Anesthetist (CRNA) 1,216 11
36
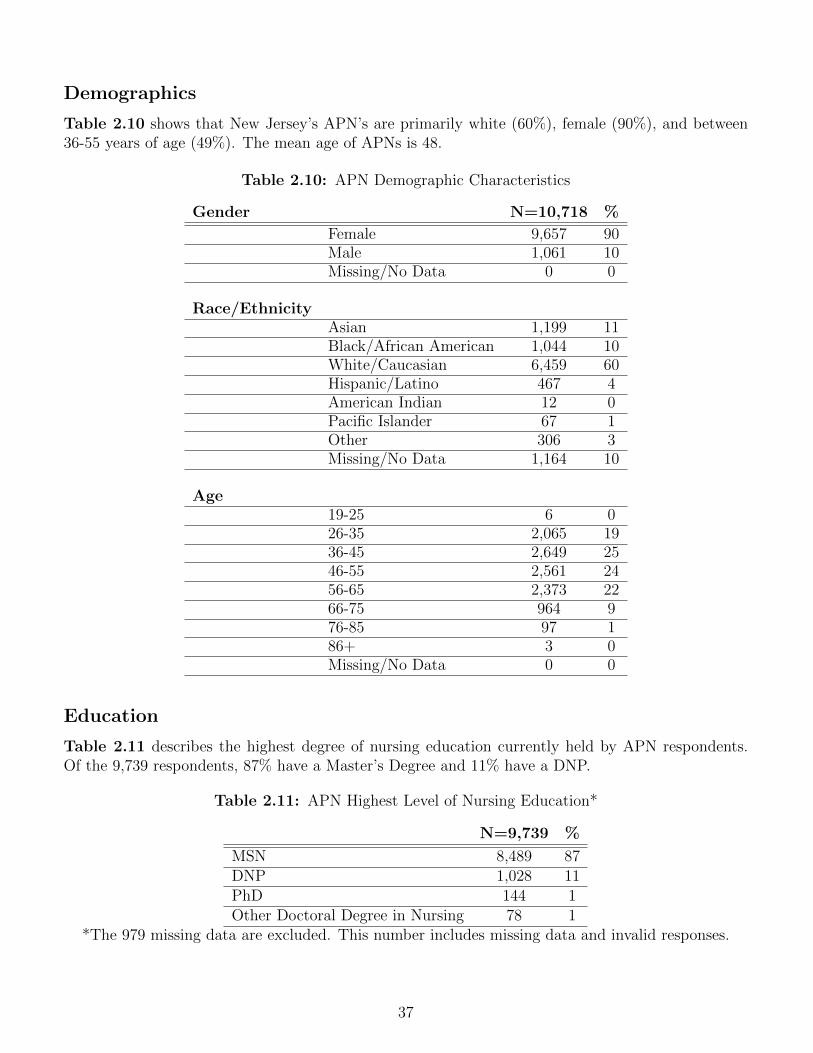
Demographics
Table 2.10 shows that New Jersey’s APN’s are primarily white (60%), female (90%), and between36-55 years of age (49%). The mean age of APNs is 48.
Table 2.10: APN Demographic Characteristics
Gender N=10,718 %
Female 9,657 90Male 1,061 10Missing/No Data 0 0
Race/EthnicityAsian 1,199 11Black/African American 1,044 10White/Caucasian 6,459 60Hispanic/Latino 467 4American Indian 12 0Pacific Islander 67 1Other 306 3Missing/No Data 1,164 10
Age19-25 6 026-35 2,065 1936-45 2,649 2546-55 2,561 2456-65 2,373 2266-75 964 976-85 97 186+ 3 0Missing/No Data 0 0
Education
Table 2.11 describes the highest degree of nursing education currently held by APN respondents.Of the 9,739 respondents, 87% have a Master’s Degree and 11% have a DNP.
Table 2.11: APN Highest Level of Nursing Education*
N=9,739 %
MSN 8,489 87DNP 1,028 11PhD 144 1Other Doctoral Degree in Nursing 78 1
*The 979 missing data are excluded. This number includes missing data and invalid responses.
37
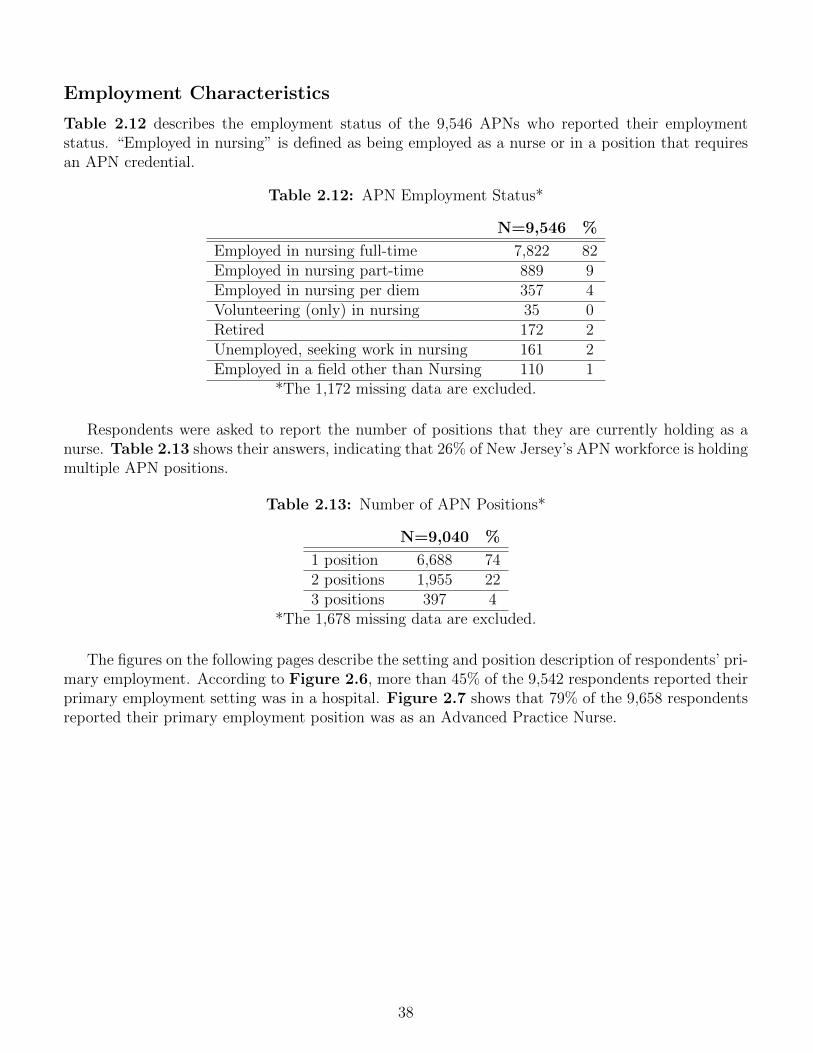
Employment Characteristics
Table 2.12 describes the employment status of the 9,546 APNs who reported their employmentstatus. “Employed in nursing” is defined as being employed as a nurse or in a position that requiresan APN credential.
Table 2.12: APN Employment Status*
N=9,546 %
Employed in nursing full-time 7,822 82Employed in nursing part-time 889 9Employed in nursing per diem 357 4Volunteering (only) in nursing 35 0Retired 172 2Unemployed, seeking work in nursing 161 2Employed in a field other than Nursing 110 1
*The 1,172 missing data are excluded.
Respondents were asked to report the number of positions that they are currently holding as anurse. Table 2.13 shows their answers, indicating that 26% of New Jersey’s APN workforce is holdingmultiple APN positions.
Table 2.13: Number of APN Positions*
N=9,040 %
1 position 6,688 742 positions 1,955 223 positions 397 4
*The 1,678 missing data are excluded.
The figures on the following pages describe the setting and position description of respondents’ pri-mary employment. According to Figure 2.6, more than 45% of the 9,542 respondents reported theirprimary employment setting was in a hospital. Figure 2.7 shows that 79% of the 9,658 respondentsreported their primary employment position was as an Advanced Practice Nurse.
38
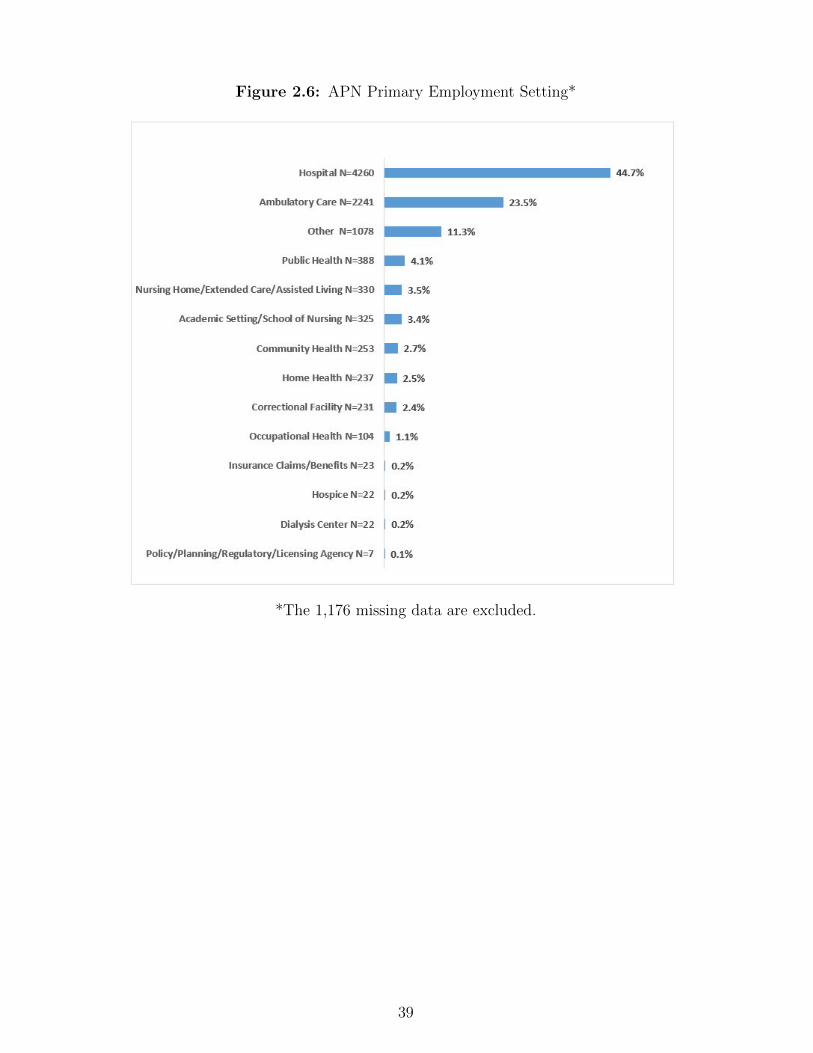
Figure 2.6: APN Primary Employment Setting*
*The 1,176 missing data are excluded.
39
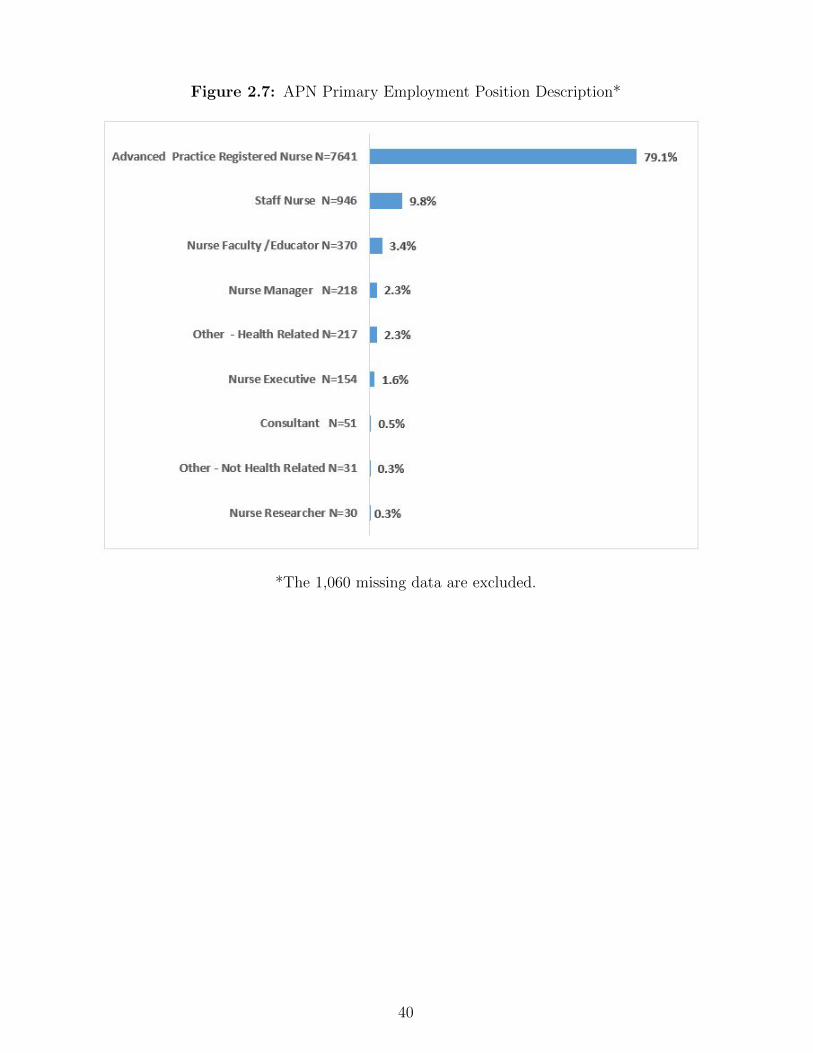
Figure 2.7: APN Primary Employment Position Description*
*The 1,060 missing data are excluded.
40
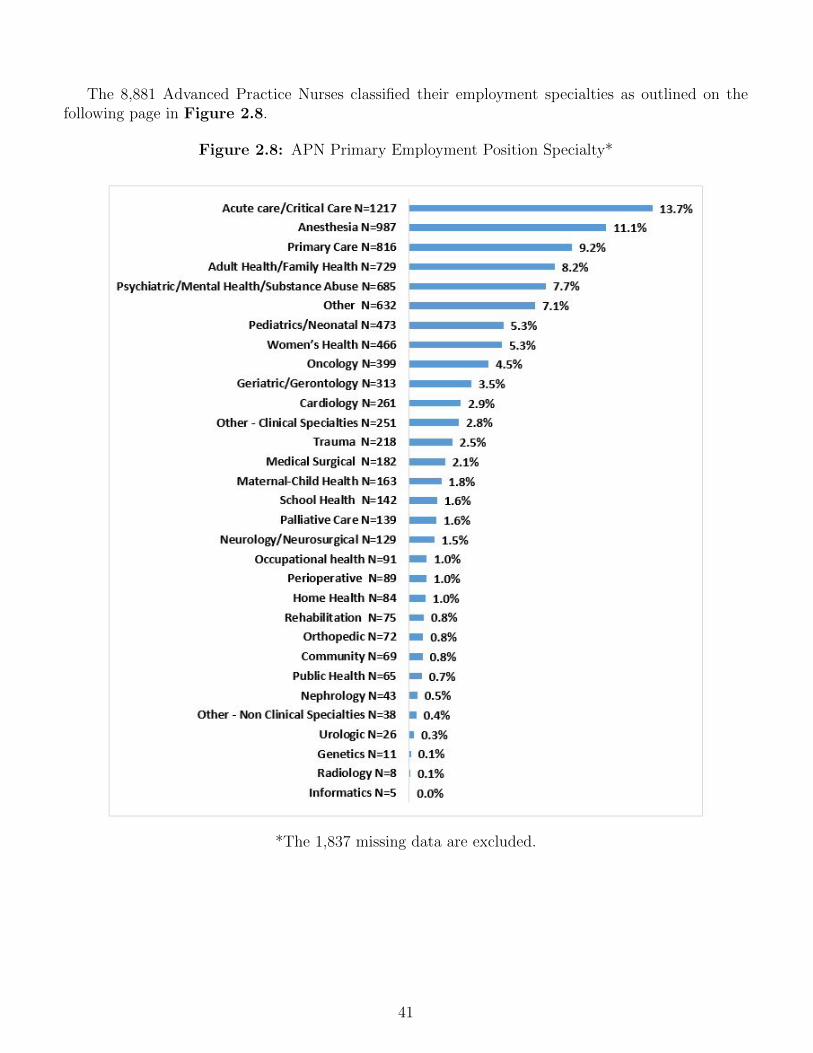
The 8,881 Advanced Practice Nurses classified their employment specialties as outlined on thefollowing page in Figure 2.8.
Figure 2.8: APN Primary Employment Position Specialty*
*The 1,837 missing data are excluded.
41
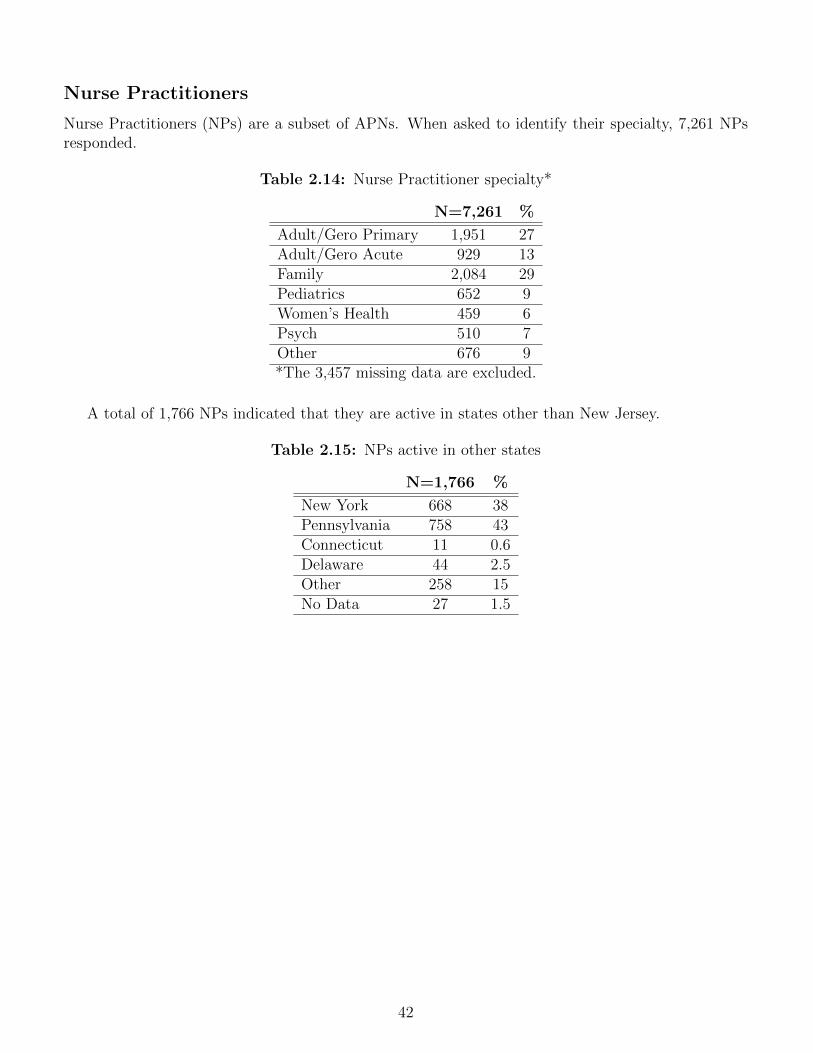
Nurse Practitioners
Nurse Practitioners (NPs) are a subset of APNs. When asked to identify their specialty, 7,261 NPsresponded.
Table 2.14: Nurse Practitioner specialty*
N=7,261 %
Adult/Gero Primary 1,951 27Adult/Gero Acute 929 13Family 2,084 29Pediatrics 652 9Women’s Health 459 6Psych 510 7Other 676 9*The 3,457 missing data are excluded.
A total of 1,766 NPs indicated that they are active in states other than New Jersey.
Table 2.15: NPs active in other states
N=1,766 %
New York 668 38Pennsylvania 758 43Connecticut 11 0.6Delaware 44 2.5Other 258 15No Data 27 1.5
42
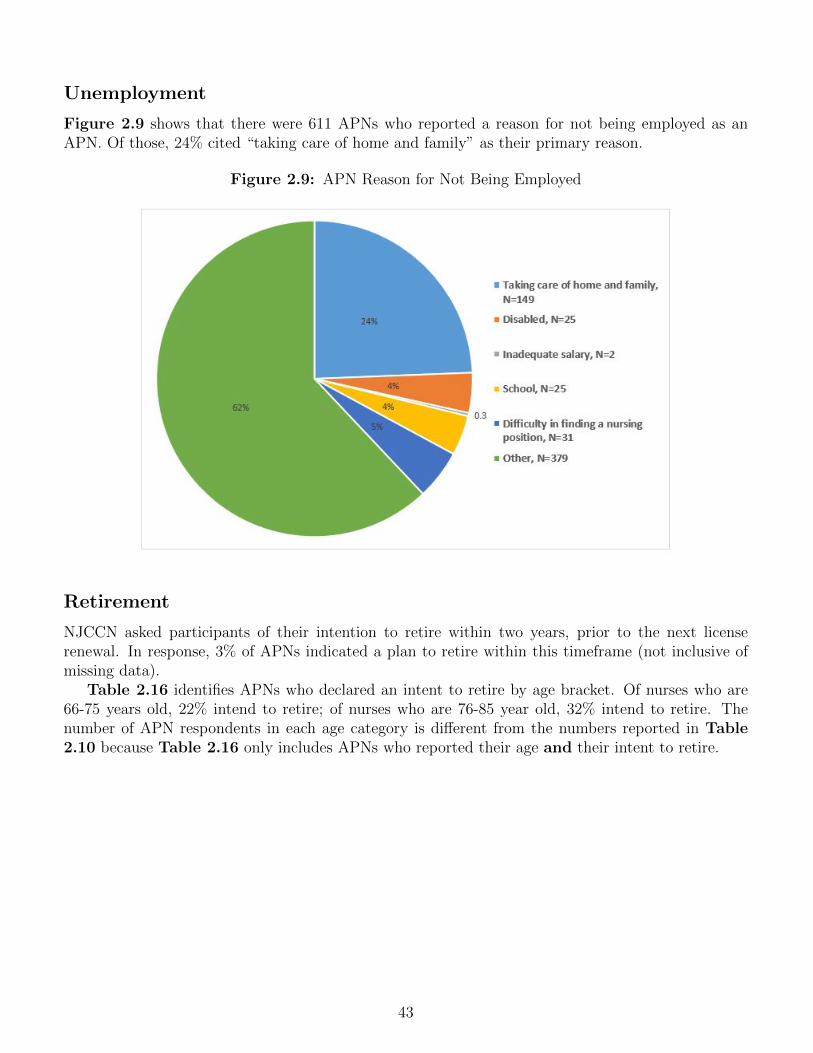
Unemployment
Figure 2.9 shows that there were 611 APNs who reported a reason for not being employed as anAPN. Of those, 24% cited “taking care of home and family” as their primary reason.
Figure 2.9: APN Reason for Not Being Employed
Retirement
NJCCN asked participants of their intention to retire within two years, prior to the next licenserenewal. In response, 3% of APNs indicated a plan to retire within this timeframe (not inclusive ofmissing data).
Table 2.16 identifies APNs who declared an intent to retire by age bracket. Of nurses who are66-75 years old, 22% intend to retire; of nurses who are 76-85 year old, 32% intend to retire. Thenumber of APN respondents in each age category is different from the numbers reported in Table2.10 because Table 2.16 only includes APNs who reported their age and their intent to retire.
43
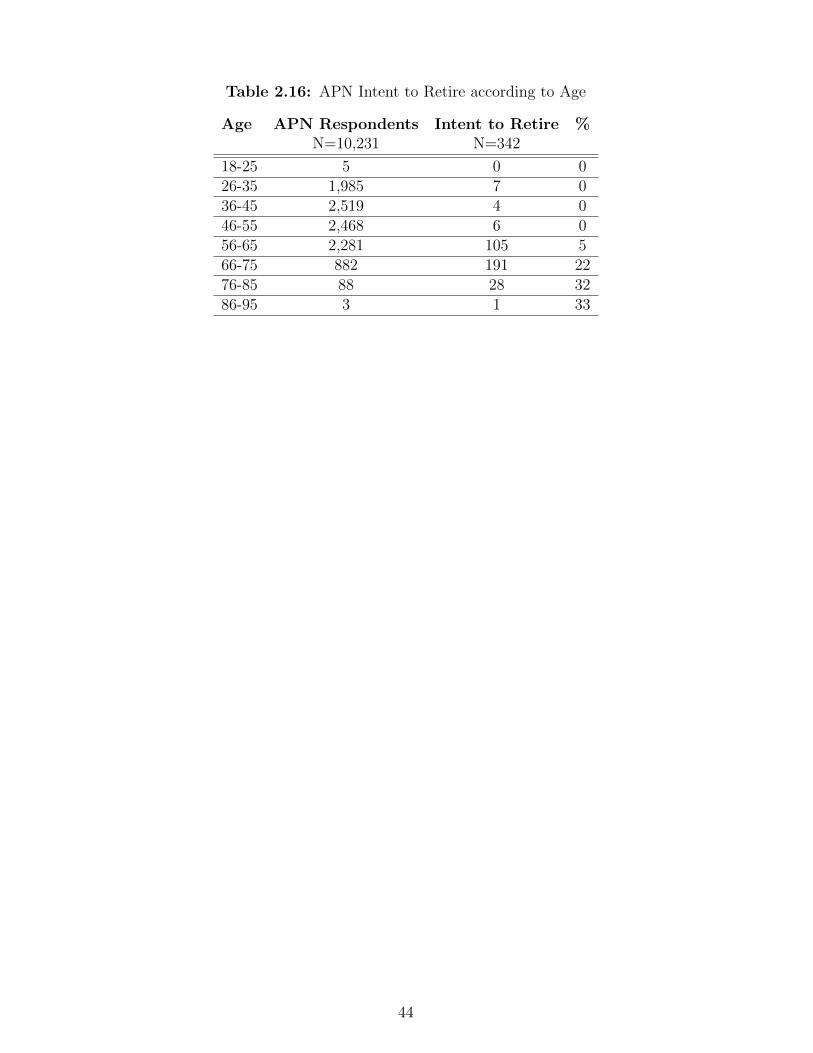
Table 2.16: APN Intent to Retire according to Age
Age APN Respondents Intent to Retire %N=10,231 N=342
18-25 5 0 026-35 1,985 7 036-45 2,519 4 046-55 2,468 6 056-65 2,281 105 566-75 882 191 2276-85 88 28 3286-95 3 1 33
44
Licensed Practical Nurse (LPN) Profile
In the 2019-2020 survey period, 21,523 respondents of New Jerseys 29,348 active (23,638) and inactive(5,710) LPNs responded to the survey, which accounts for 73.3% of the LPN workforce. Respondentsmay have skipped questions, causing data in some tables and figures to add up to less than 21,532.
License Status
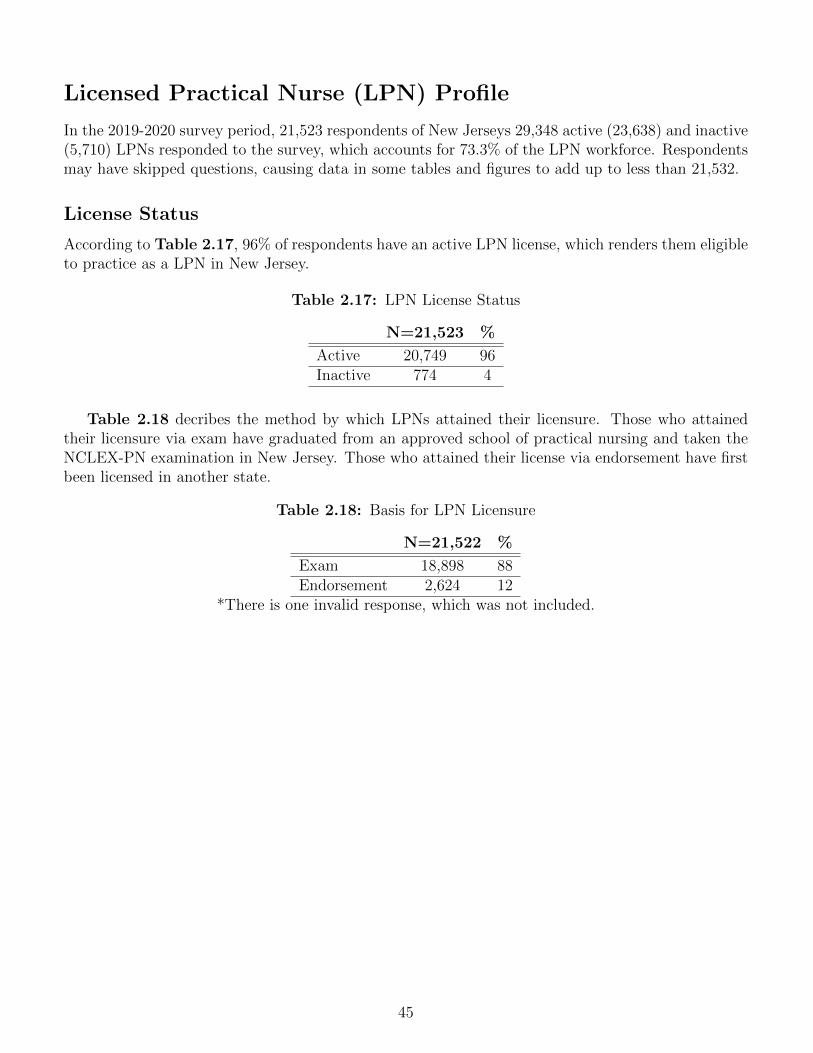
According to Table 2.17, 96% of respondents have an active LPN license, which renders them eligibleto practice as a LPN in New Jersey.
Table 2.17: LPN License Status
N=21,523 %
Active 20,749 96Inactive 774 4
Table 2.18 decribes the method by which LPNs attained their licensure. Those who attainedtheir licensure via exam have graduated from an approved school of practical nursing and taken theNCLEX-PN examination in New Jersey. Those who attained their license via endorsement have firstbeen licensed in another state.
Table 2.18: Basis for LPN Licensure
N=21,522 %
Exam 18,898 88Endorsement 2,624 12
*There is one invalid response, which was not included.
45
Demographics
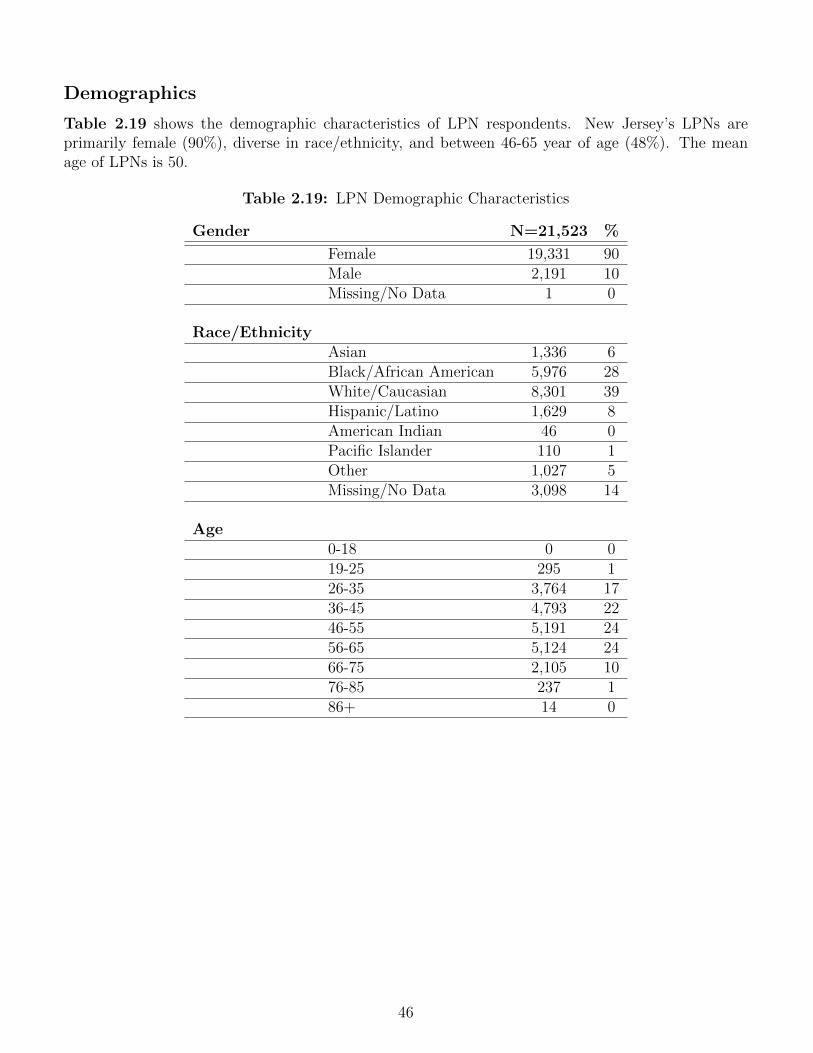
Table 2.19 shows the demographic characteristics of LPN respondents. New Jersey’s LPNs areprimarily female (90%), diverse in race/ethnicity, and between 46-65 year of age (48%). The meanage of LPNs is 50.
Table 2.19: LPN Demographic Characteristics
Gender N=21,523 %
Female 19,331 90Male 2,191 10Missing/No Data 1 0
Race/EthnicityAsian 1,336 6Black/African American 5,976 28White/Caucasian 8,301 39Hispanic/Latino 1,629 8American Indian 46 0Pacific Islander 110 1Other 1,027 5Missing/No Data 3,098 14
Age0-18 0 019-25 295 126-35 3,764 1736-45 4,793 2246-55 5,191 2456-65 5,124 2466-75 2,105 1076-85 237 186+ 14 0
46
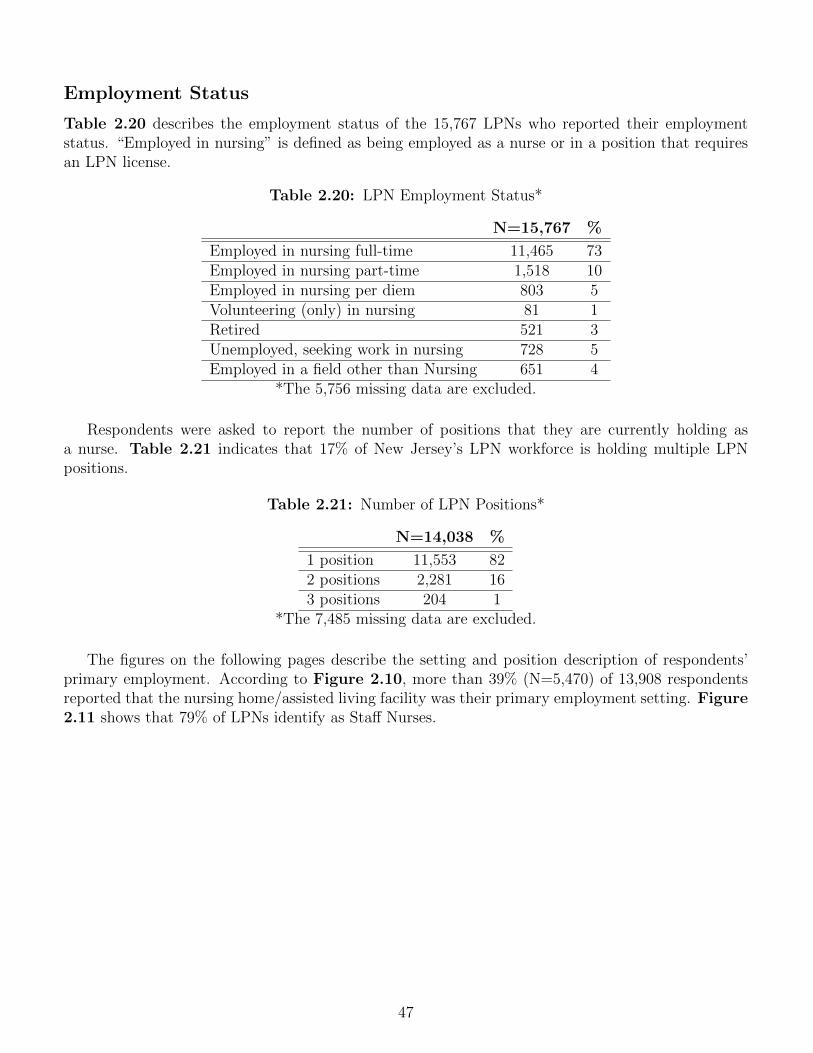
Employment Status
Table 2.20 describes the employment status of the 15,767 LPNs who reported their employmentstatus. “Employed in nursing” is defined as being employed as a nurse or in a position that requiresan LPN license.
Table 2.20: LPN Employment Status*
N=15,767 %
Employed in nursing full-time 11,465 73Employed in nursing part-time 1,518 10Employed in nursing per diem 803 5Volunteering (only) in nursing 81 1Retired 521 3Unemployed, seeking work in nursing 728 5Employed in a field other than Nursing 651 4
*The 5,756 missing data are excluded.
Respondents were asked to report the number of positions that they are currently holding asa nurse. Table 2.21 indicates that 17% of New Jersey’s LPN workforce is holding multiple LPNpositions.
Table 2.21: Number of LPN Positions*
N=14,038 %
1 position 11,553 822 positions 2,281 163 positions 204 1
*The 7,485 missing data are excluded.
The figures on the following pages describe the setting and position description of respondents’primary employment. According to Figure 2.10, more than 39% (N=5,470) of 13,908 respondentsreported that the nursing home/assisted living facility was their primary employment setting. Figure2.11 shows that 79% of LPNs identify as Staff Nurses.
47
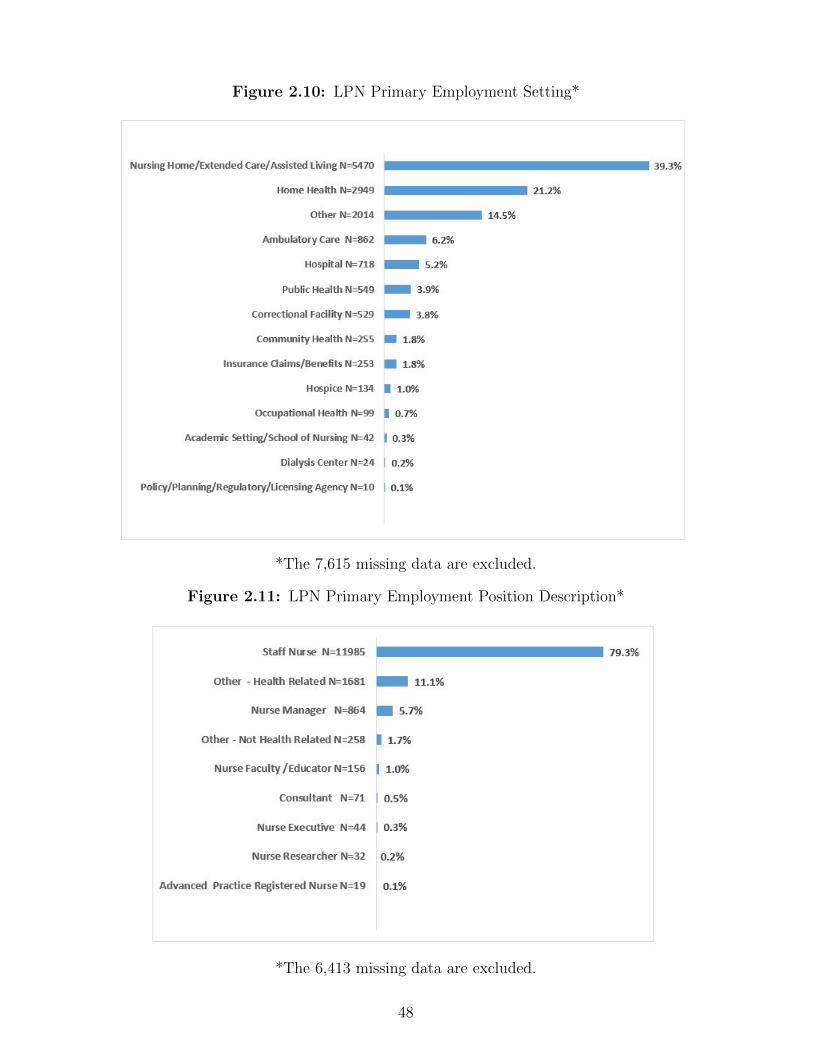
Figure 2.10: LPN Primary Employment Setting*
*The 7,615 missing data are excluded.
Figure 2.11: LPN Primary Employment Position Description*
*The 6,413 missing data are excluded.
48
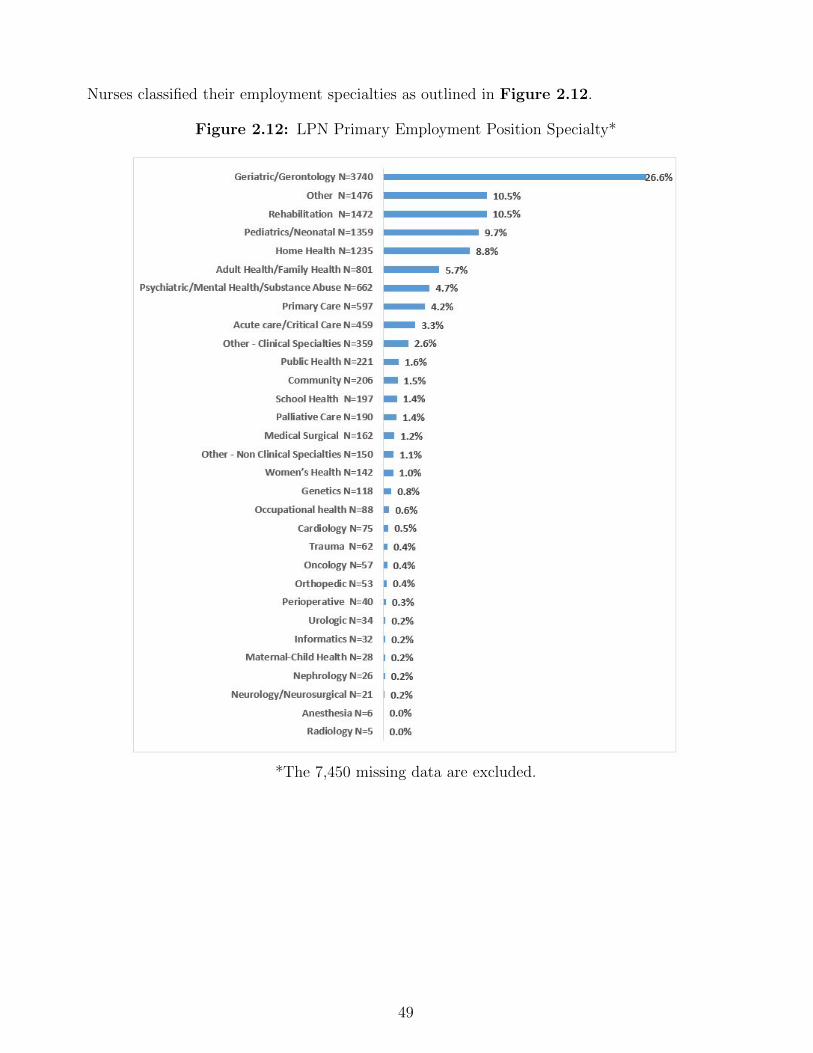
Nurses classified their employment specialties as outlined in Figure 2.12.
Figure 2.12: LPN Primary Employment Position Specialty*
*The 7,450 missing data are excluded.
49
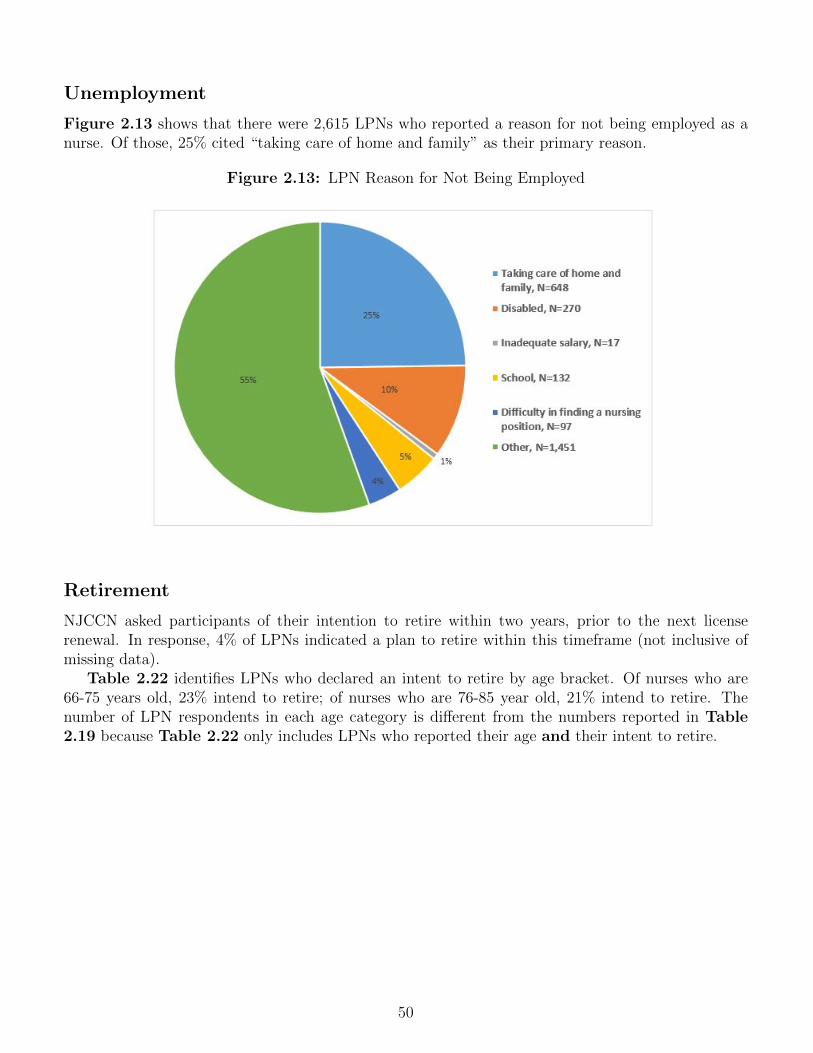
Unemployment
Figure 2.13 shows that there were 2,615 LPNs who reported a reason for not being employed as anurse. Of those, 25% cited “taking care of home and family” as their primary reason.
Figure 2.13: LPN Reason for Not Being Employed
Retirement
NJCCN asked participants of their intention to retire within two years, prior to the next licenserenewal. In response, 4% of LPNs indicated a plan to retire within this timeframe (not inclusive ofmissing data).
Table 2.22 identifies LPNs who declared an intent to retire by age bracket. Of nurses who are66-75 years old, 23% intend to retire; of nurses who are 76-85 year old, 21% intend to retire. Thenumber of LPN respondents in each age category is different from the numbers reported in Table2.19 because Table 2.22 only includes LPNs who reported their age and their intent to retire.
50
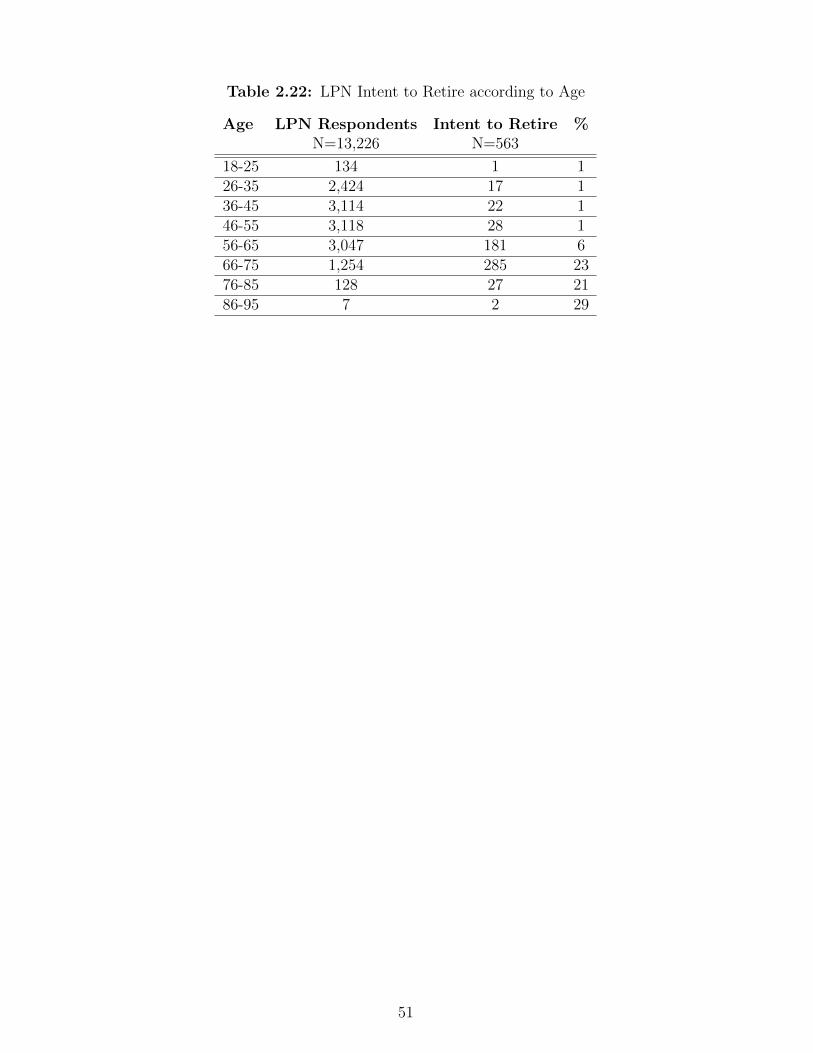
Table 2.22: LPN Intent to Retire according to Age
Age LPN Respondents Intent to Retire %N=13,226 N=563
18-25 134 1 126-35 2,424 17 136-45 3,114 22 146-55 3,118 28 156-65 3,047 181 666-75 1,254 285 2376-85 128 27 2186-95 7 2 29
51
Update to Nurse Retirement Projections
In our previous report titled New Jersey Annual Nursing Data report 2017, we published an addedsection titled Chapter 4: Projection of Nurse Retirement. (NJCCN, 2017). This section projected theexpected retirement amongst RNs, APNs and LPNs after a thorough analysis of historical retirementrates across age categories and employment settings. The projection of future workforce levels alongwith confidence intervals were established from average historical retirement rates for 2020 and 2025.
In this report, we are verifying the extent to which the projections align with actual numbersfrom our most recent data this year. This will not include re-estimating the historical retirementrates or altering our expectations of the future demand for 2025. In the event sufficient evidence ofdeviation from any of our assumptions or expectations occur from the previous report, re-estimationand corrected projections will be conducted for the next report.
Nurse Retirement Projections for 2020 and 2025: A Review
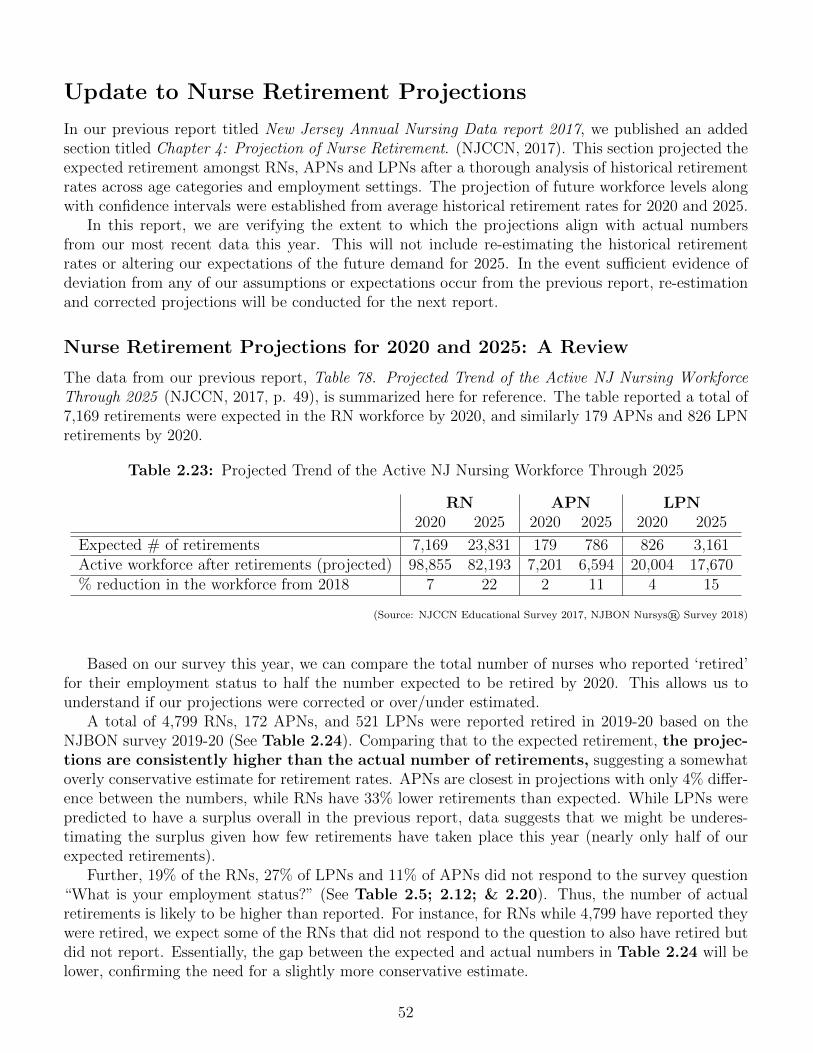
The data from our previous report, Table 78. Projected Trend of the Active NJ Nursing WorkforceThrough 2025 (NJCCN, 2017, p. 49), is summarized here for reference. The table reported a total of7,169 retirements were expected in the RN workforce by 2020, and similarly 179 APNs and 826 LPNretirements by 2020.
Table 2.23: Projected Trend of the Active NJ Nursing Workforce Through 2025
RN APN LPN2020 2025 2020 2025 2020 2025
Expected # of retirements 7,169 23,831 179 786 826 3,161Active workforce after retirements (projected) 98,855 82,193 7,201 6,594 20,004 17,670% reduction in the workforce from 2018 7 22 2 11 4 15
(Source: NJCCN Educational Survey 2017, NJBON Nursys® Survey 2018)
Based on our survey this year, we can compare the total number of nurses who reported ‘retired’for their employment status to half the number expected to be retired by 2020. This allows us tounderstand if our projections were corrected or over/under estimated.
A total of 4,799 RNs, 172 APNs, and 521 LPNs were reported retired in 2019-20 based on theNJBON survey 2019-20 (See Table 2.24). Comparing that to the expected retirement, the projec-tions are consistently higher than the actual number of retirements, suggesting a somewhatoverly conservative estimate for retirement rates. APNs are closest in projections with only 4% differ-ence between the numbers, while RNs have 33% lower retirements than expected. While LPNs werepredicted to have a surplus overall in the previous report, data suggests that we might be underes-timating the surplus given how few retirements have taken place this year (nearly only half of ourexpected retirements).
Further, 19% of the RNs, 27% of LPNs and 11% of APNs did not respond to the survey question“What is your employment status?” (See Table 2.5; 2.12; & 2.20). Thus, the number of actualretirements is likely to be higher than reported. For instance, for RNs while 4,799 have reported theywere retired, we expect some of the RNs that did not respond to the question to also have retired butdid not report. Essentially, the gap between the expected and actual numbers in Table 2.24 will belower, confirming the need for a slightly more conservative estimate.
52
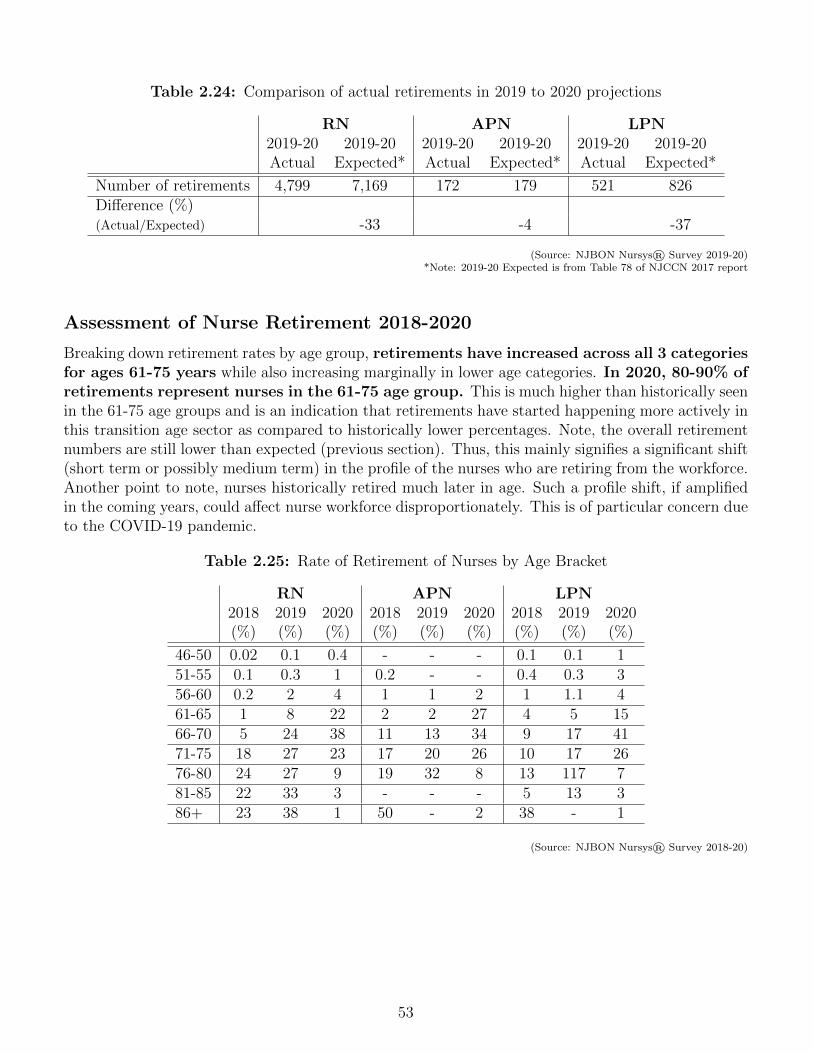
Table 2.24: Comparison of actual retirements in 2019 to 2020 projections
RN APN LPN2019-20 2019-20 2019-20 2019-20 2019-20 2019-20Actual Expected* Actual Expected* Actual Expected*
Number of retirements 4,799 7,169 172 179 521 826Difference (%)(Actual/Expected) -33 -4 -37
(Source: NJBON Nursys® Survey 2019-20)*Note: 2019-20 Expected is from Table 78 of NJCCN 2017 report
Assessment of Nurse Retirement 2018-2020
Breaking down retirement rates by age group, retirements have increased across all 3 categoriesfor ages 61-75 years while also increasing marginally in lower age categories. In 2020, 80-90% ofretirements represent nurses in the 61-75 age group. This is much higher than historically seenin the 61-75 age groups and is an indication that retirements have started happening more actively inthis transition age sector as compared to historically lower percentages. Note, the overall retirementnumbers are still lower than expected (previous section). Thus, this mainly signifies a significant shift(short term or possibly medium term) in the profile of the nurses who are retiring from the workforce.Another point to note, nurses historically retired much later in age. Such a profile shift, if amplifiedin the coming years, could affect nurse workforce disproportionately. This is of particular concern dueto the COVID-19 pandemic.
Table 2.25: Rate of Retirement of Nurses by Age Bracket
RN APN LPN2018 2019 2020 2018 2019 2020 2018 2019 2020(%) (%) (%) (%) (%) (%) (%) (%) (%)
46-50 0.02 0.1 0.4 - - - 0.1 0.1 151-55 0.1 0.3 1 0.2 - - 0.4 0.3 356-60 0.2 2 4 1 1 2 1 1.1 461-65 1 8 22 2 2 27 4 5 1566-70 5 24 38 11 13 34 9 17 4171-75 18 27 23 17 20 26 10 17 2676-80 24 27 9 19 32 8 13 117 781-85 22 33 3 - - - 5 13 386+ 23 38 1 50 - 2 38 - 1
(Source: NJBON Nursys® Survey 2018-20)
53
Age Distribution in New Jersey’s Nursing Workforce
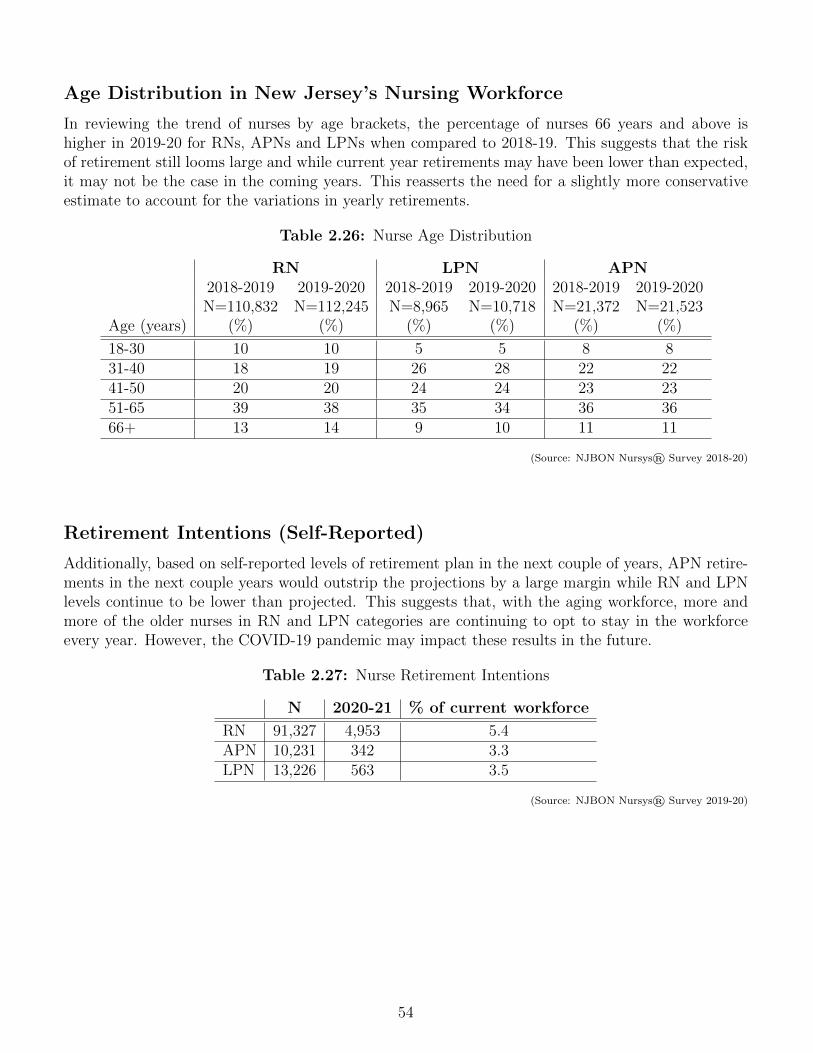
In reviewing the trend of nurses by age brackets, the percentage of nurses 66 years and above ishigher in 2019-20 for RNs, APNs and LPNs when compared to 2018-19. This suggests that the riskof retirement still looms large and while current year retirements may have been lower than expected,it may not be the case in the coming years. This reasserts the need for a slightly more conservativeestimate to account for the variations in yearly retirements.
Table 2.26: Nurse Age Distribution
RN LPN APN2018-2019 2019-2020 2018-2019 2019-2020 2018-2019 2019-2020N=110,832 N=112,245 N=8,965 N=10,718 N=21,372 N=21,523
Age (years) (%) (%) (%) (%) (%) (%)
18-30 10 10 5 5 8 831-40 18 19 26 28 22 2241-50 20 20 24 24 23 2351-65 39 38 35 34 36 3666+ 13 14 9 10 11 11
(Source: NJBON Nursys® Survey 2018-20)
Retirement Intentions (Self-Reported)
Additionally, based on self-reported levels of retirement plan in the next couple of years, APN retire-ments in the next couple years would outstrip the projections by a large margin while RN and LPNlevels continue to be lower than projected. This suggests that, with the aging workforce, more andmore of the older nurses in RN and LPN categories are continuing to opt to stay in the workforceevery year. However, the COVID-19 pandemic may impact these results in the future.
Table 2.27: Nurse Retirement Intentions
N 2020-21 % of current workforce
RN 91,327 4,953 5.4APN 10,231 342 3.3LPN 13,226 563 3.5
(Source: NJBON Nursys® Survey 2019-20)
54
Graduation Trend Rates
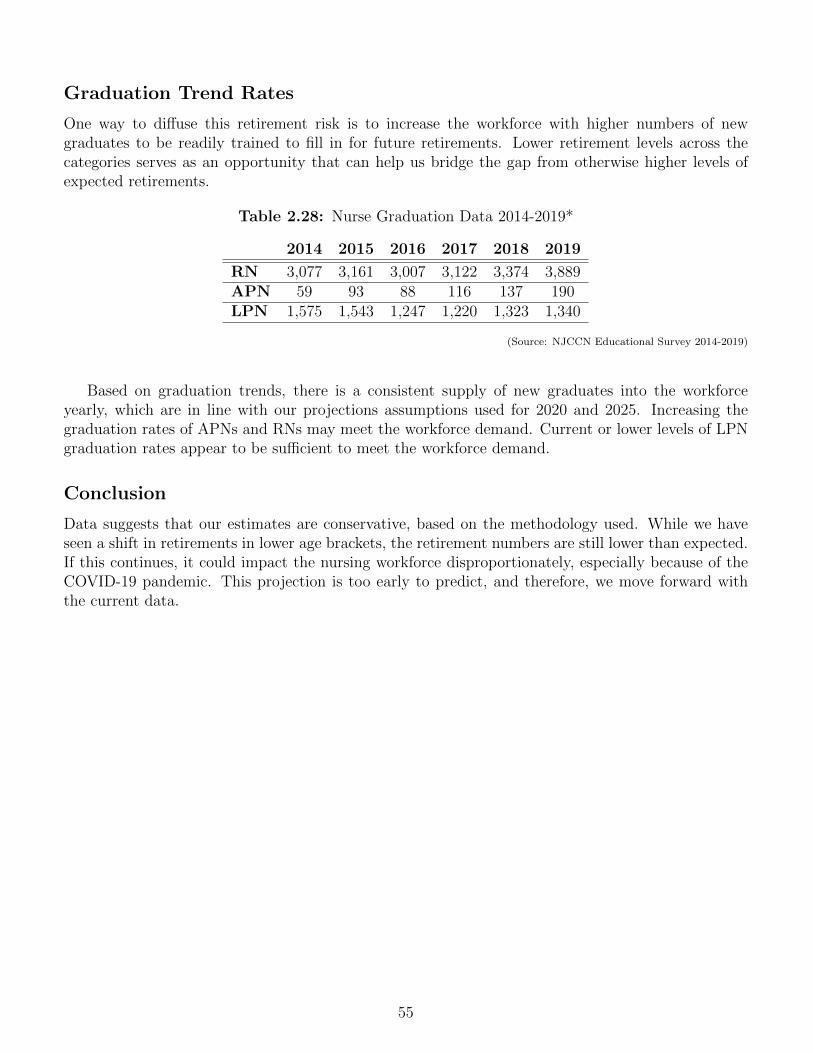
One way to diffuse this retirement risk is to increase the workforce with higher numbers of newgraduates to be readily trained to fill in for future retirements. Lower retirement levels across thecategories serves as an opportunity that can help us bridge the gap from otherwise higher levels ofexpected retirements.
Table 2.28: Nurse Graduation Data 2014-2019*
2014 2015 2016 2017 2018 2019
RN 3,077 3,161 3,007 3,122 3,374 3,889APN 59 93 88 116 137 190LPN 1,575 1,543 1,247 1,220 1,323 1,340
(Source: NJCCN Educational Survey 2014-2019)
Based on graduation trends, there is a consistent supply of new graduates into the workforceyearly, which are in line with our projections assumptions used for 2020 and 2025. Increasing thegraduation rates of APNs and RNs may meet the workforce demand. Current or lower levels of LPNgraduation rates appear to be sufficient to meet the workforce demand.
Conclusion
Data suggests that our estimates are conservative, based on the methodology used. While we haveseen a shift in retirements in lower age brackets, the retirement numbers are still lower than expected.If this continues, it could impact the nursing workforce disproportionately, especially because of theCOVID-19 pandemic. This projection is too early to predict, and therefore, we move forward withthe current data.
55

56
Chapter 3
Workforce Demand Data
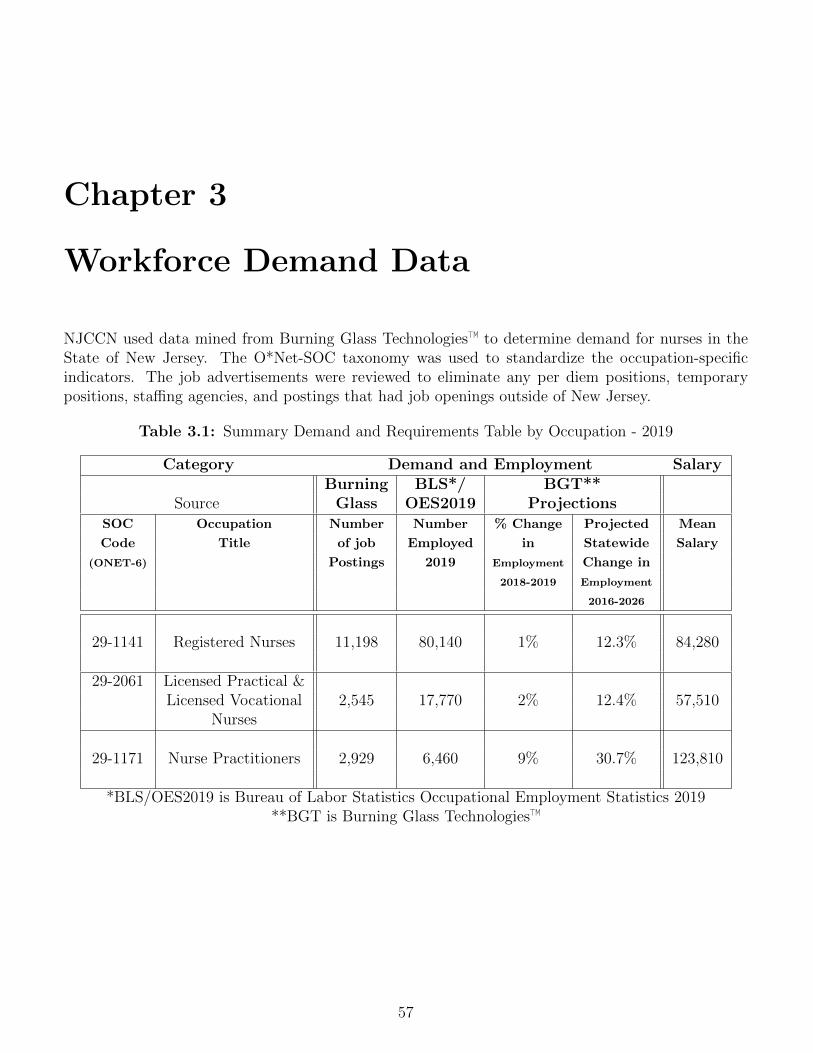
NJCCN used data mined from Burning Glass Technologies™ to determine demand for nurses in theState of New Jersey. The O*Net-SOC taxonomy was used to standardize the occupation-specificindicators. The job advertisements were reviewed to eliminate any per diem positions, temporarypositions, staffing agencies, and postings that had job openings outside of New Jersey.
Table 3.1: Summary Demand and Requirements Table by Occupation - 2019
Category Demand and Employment SalaryBurning BLS*/ BGT**
Source Glass OES2019 ProjectionsSOC Occupation Number Number % Change Projected Mean
Code Title of job Employed in Statewide Salary
(ONET-6) Postings 2019 Employment Change in
2018-2019 Employment
2016-2026
29-1141 Registered Nurses 11,198 80,140 1% 12.3% 84,280
29-2061 Licensed Practical &Licensed Vocational 2,545 17,770 2% 12.4% 57,510
Nurses
29-1171 Nurse Practitioners 2,929 6,460 9% 30.7% 123,810
*BLS/OES2019 is Bureau of Labor Statistics Occupational Employment Statistics 2019**BGT is Burning Glass Technologies™
57
Registered Nurse (RN) Demand Profile
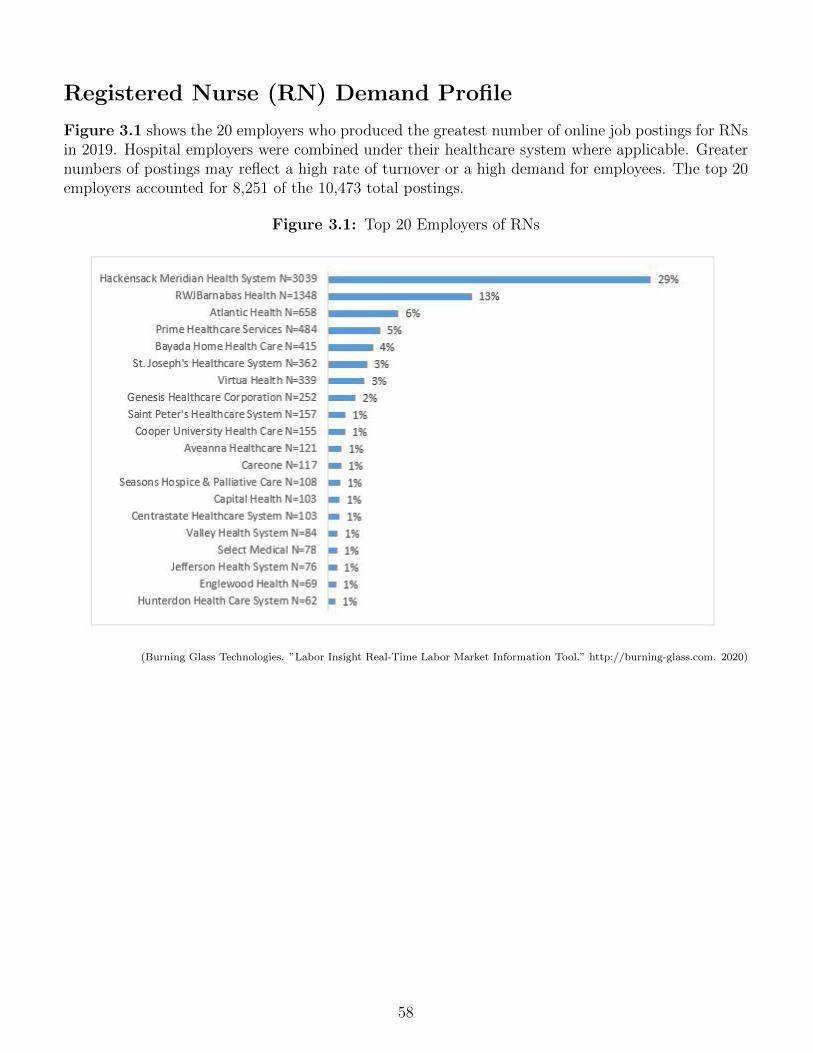
Figure 3.1 shows the 20 employers who produced the greatest number of online job postings for RNsin 2019. Hospital employers were combined under their healthcare system where applicable. Greaternumbers of postings may reflect a high rate of turnover or a high demand for employees. The top 20employers accounted for 8,251 of the 10,473 total postings.
Figure 3.1: Top 20 Employers of RNs
(Burning Glass Technologies. ”Labor Insight Real-Time Labor Market Information Tool.” http://burning-glass.com. 2020)
58
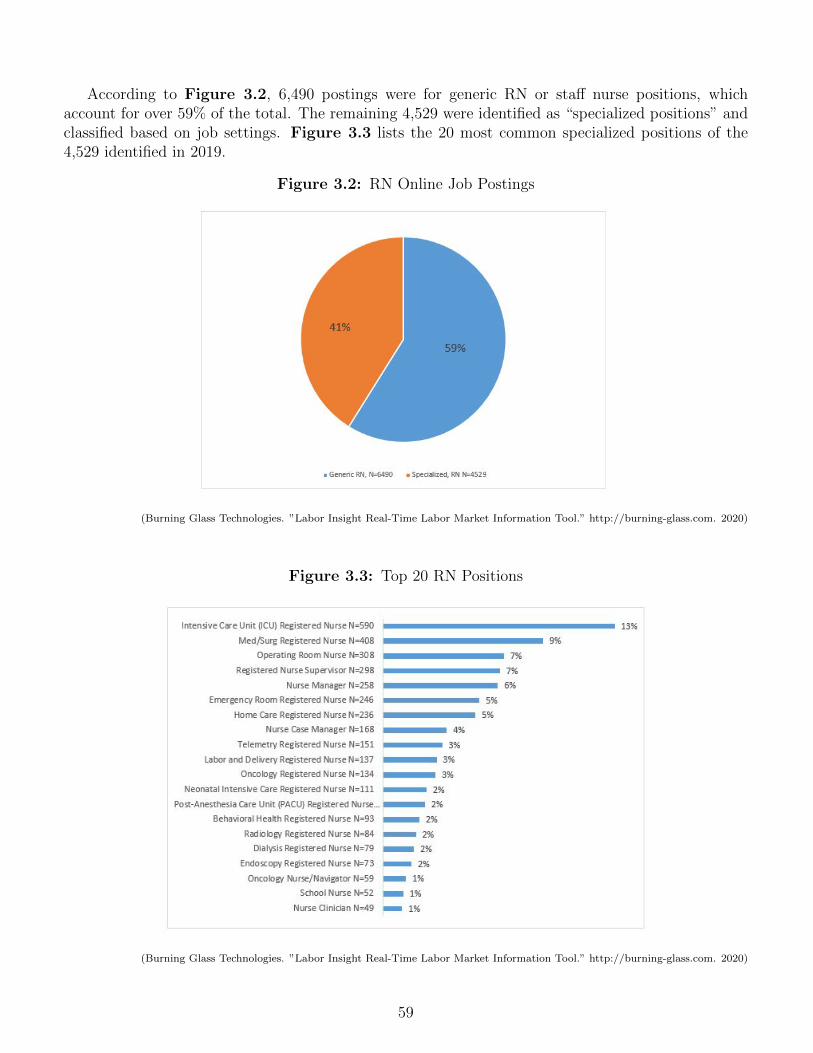
According to Figure 3.2, 6,490 postings were for generic RN or staff nurse positions, whichaccount for over 59% of the total. The remaining 4,529 were identified as “specialized positions” andclassified based on job settings. Figure 3.3 lists the 20 most common specialized positions of the4,529 identified in 2019.
Figure 3.2: RN Online Job Postings
(Burning Glass Technologies. ”Labor Insight Real-Time Labor Market Information Tool.” http://burning-glass.com. 2020)
Figure 3.3: Top 20 RN Positions
(Burning Glass Technologies. ”Labor Insight Real-Time Labor Market Information Tool.” http://burning-glass.com. 2020)
59
National Demand Comparison
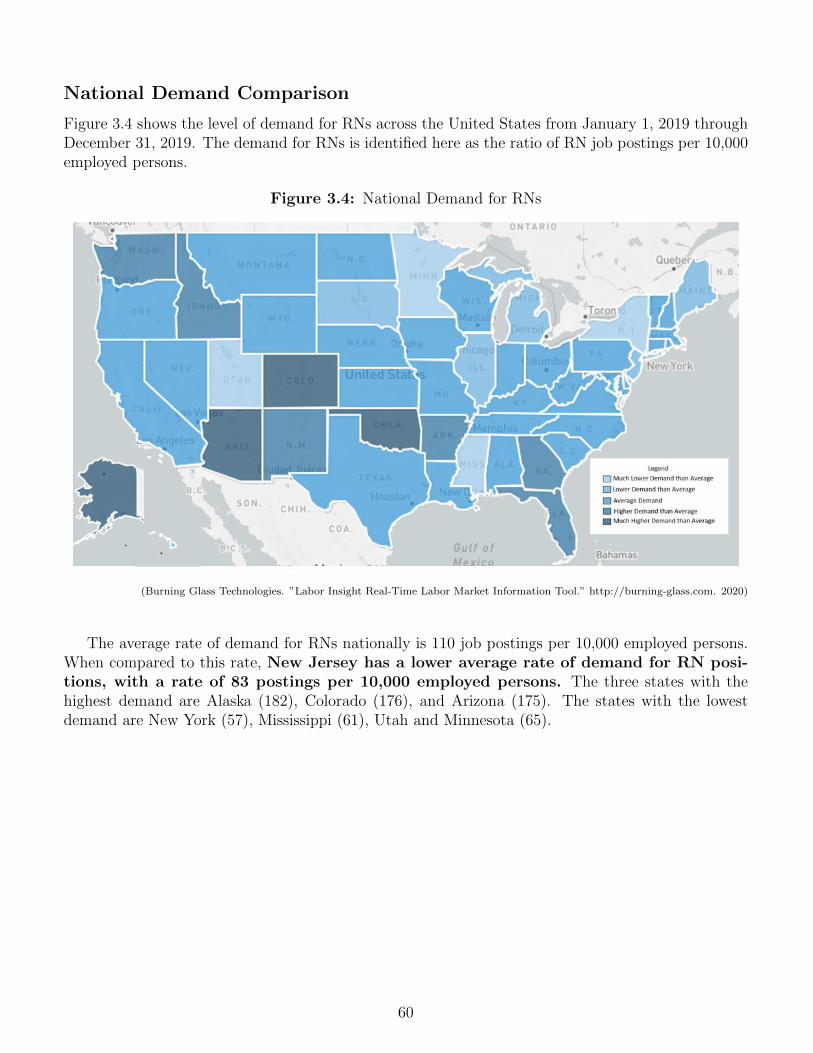
Figure 3.4 shows the level of demand for RNs across the United States from January 1, 2019 throughDecember 31, 2019. The demand for RNs is identified here as the ratio of RN job postings per 10,000employed persons.
Figure 3.4: National Demand for RNs
(Burning Glass Technologies. ”Labor Insight Real-Time Labor Market Information Tool.” http://burning-glass.com. 2020)
The average rate of demand for RNs nationally is 110 job postings per 10,000 employed persons.When compared to this rate, New Jersey has a lower average rate of demand for RN posi-tions, with a rate of 83 postings per 10,000 employed persons. The three states with thehighest demand are Alaska (182), Colorado (176), and Arizona (175). The states with the lowestdemand are New York (57), Mississippi (61), Utah and Minnesota (65).
60
Job Postings by County
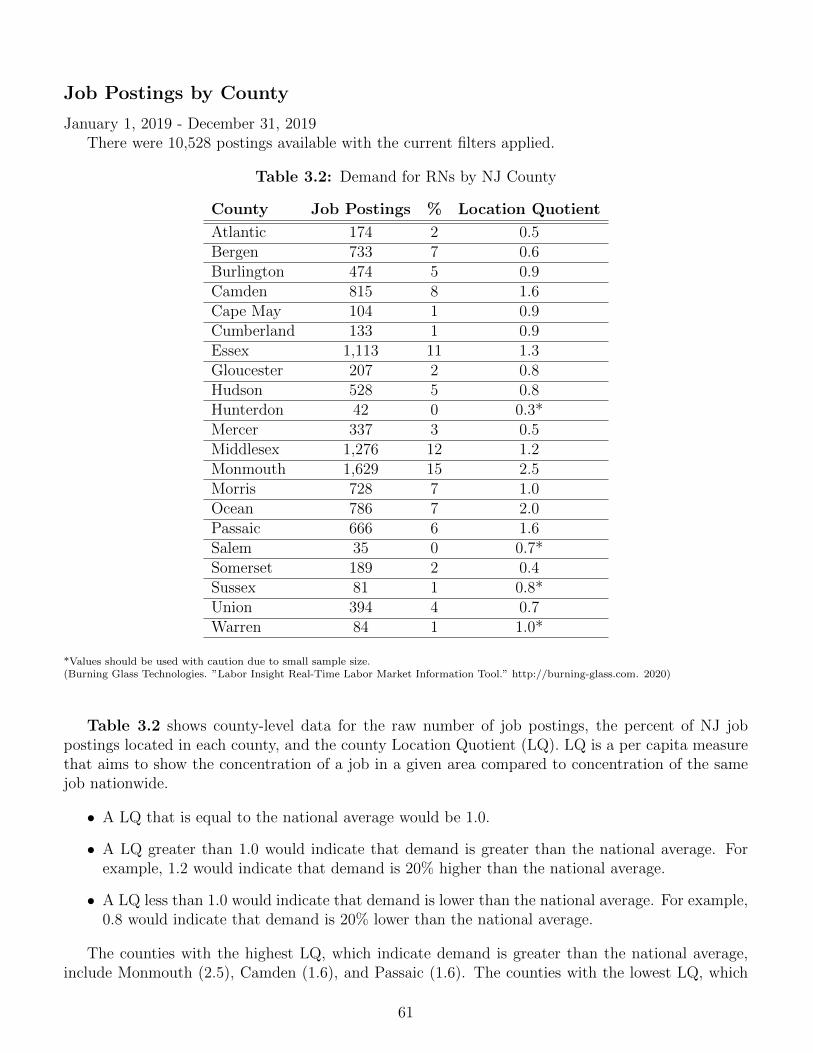
January 1, 2019 - December 31, 2019There were 10,528 postings available with the current filters applied.
Table 3.2: Demand for RNs by NJ County
County Job Postings % Location Quotient
Atlantic 174 2 0.5Bergen 733 7 0.6Burlington 474 5 0.9Camden 815 8 1.6Cape May 104 1 0.9Cumberland 133 1 0.9Essex 1,113 11 1.3Gloucester 207 2 0.8Hudson 528 5 0.8Hunterdon 42 0 0.3*Mercer 337 3 0.5Middlesex 1,276 12 1.2Monmouth 1,629 15 2.5Morris 728 7 1.0Ocean 786 7 2.0Passaic 666 6 1.6Salem 35 0 0.7*Somerset 189 2 0.4Sussex 81 1 0.8*Union 394 4 0.7Warren 84 1 1.0*
*Values should be used with caution due to small sample size.(Burning Glass Technologies. ”Labor Insight Real-Time Labor Market Information Tool.” http://burning-glass.com. 2020)
Table 3.2 shows county-level data for the raw number of job postings, the percent of NJ jobpostings located in each county, and the county Location Quotient (LQ). LQ is a per capita measurethat aims to show the concentration of a job in a given area compared to concentration of the samejob nationwide.
• A LQ that is equal to the national average would be 1.0.
• A LQ greater than 1.0 would indicate that demand is greater than the national average. Forexample, 1.2 would indicate that demand is 20% higher than the national average.
• A LQ less than 1.0 would indicate that demand is lower than the national average. For example,0.8 would indicate that demand is 20% lower than the national average.
The counties with the highest LQ, which indicate demand is greater than the national average,include Monmouth (2.5), Camden (1.6), and Passaic (1.6). The counties with the lowest LQ, which
61

indication demand is lower than the national average, include Hunterdon (0.3), and Somerset (0.4),Atlantic (0.5).
The counties with the most job postings include Monmouth (1,629), Middlesex (1,276), and Essex(1,113).
62
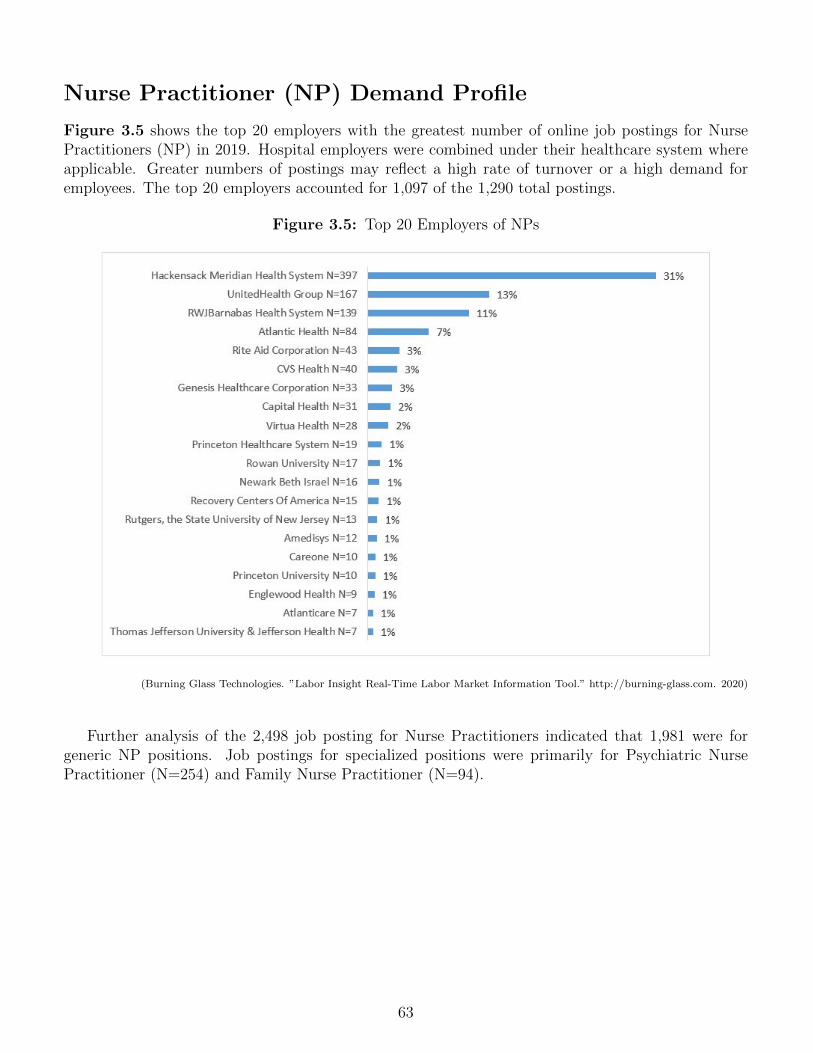
Nurse Practitioner (NP) Demand Profile
Figure 3.5 shows the top 20 employers with the greatest number of online job postings for NursePractitioners (NP) in 2019. Hospital employers were combined under their healthcare system whereapplicable. Greater numbers of postings may reflect a high rate of turnover or a high demand foremployees. The top 20 employers accounted for 1,097 of the 1,290 total postings.
Figure 3.5: Top 20 Employers of NPs
(Burning Glass Technologies. ”Labor Insight Real-Time Labor Market Information Tool.” http://burning-glass.com. 2020)
Further analysis of the 2,498 job posting for Nurse Practitioners indicated that 1,981 were forgeneric NP positions. Job postings for specialized positions were primarily for Psychiatric NursePractitioner (N=254) and Family Nurse Practitioner (N=94).
63
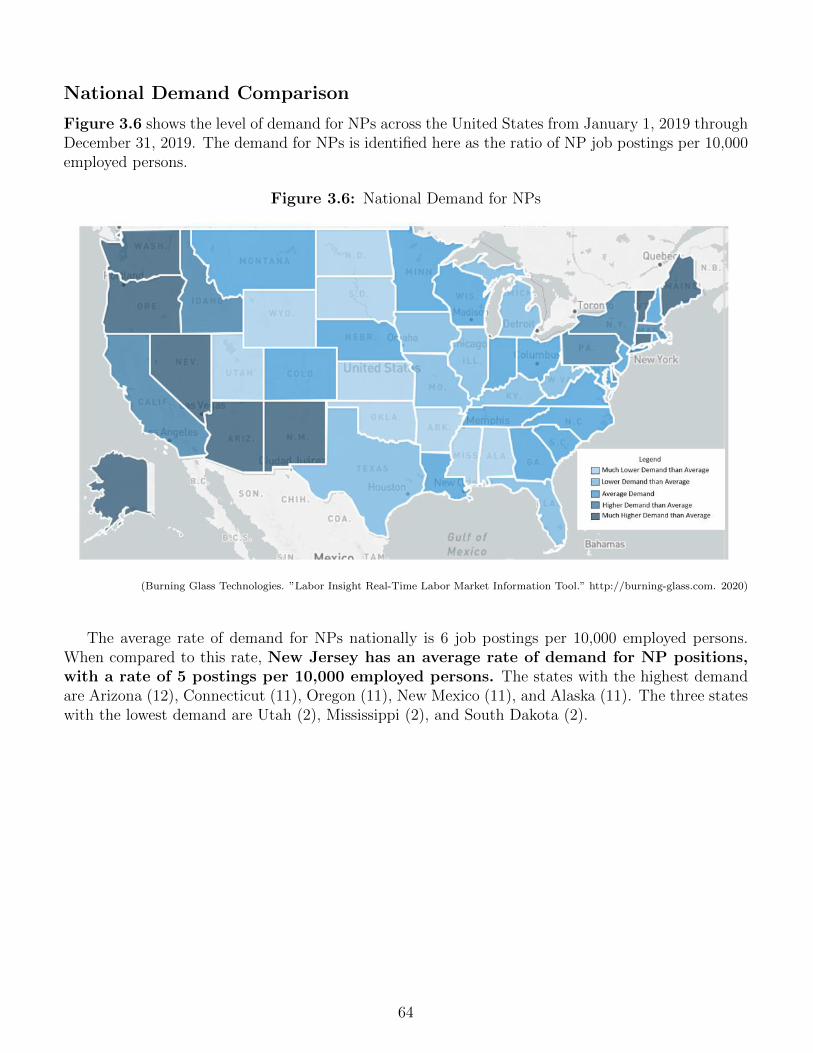
National Demand Comparison
Figure 3.6 shows the level of demand for NPs across the United States from January 1, 2019 throughDecember 31, 2019. The demand for NPs is identified here as the ratio of NP job postings per 10,000employed persons.
Figure 3.6: National Demand for NPs
(Burning Glass Technologies. ”Labor Insight Real-Time Labor Market Information Tool.” http://burning-glass.com. 2020)
The average rate of demand for NPs nationally is 6 job postings per 10,000 employed persons.When compared to this rate, New Jersey has an average rate of demand for NP positions,with a rate of 5 postings per 10,000 employed persons. The states with the highest demandare Arizona (12), Connecticut (11), Oregon (11), New Mexico (11), and Alaska (11). The three stateswith the lowest demand are Utah (2), Mississippi (2), and South Dakota (2).
64
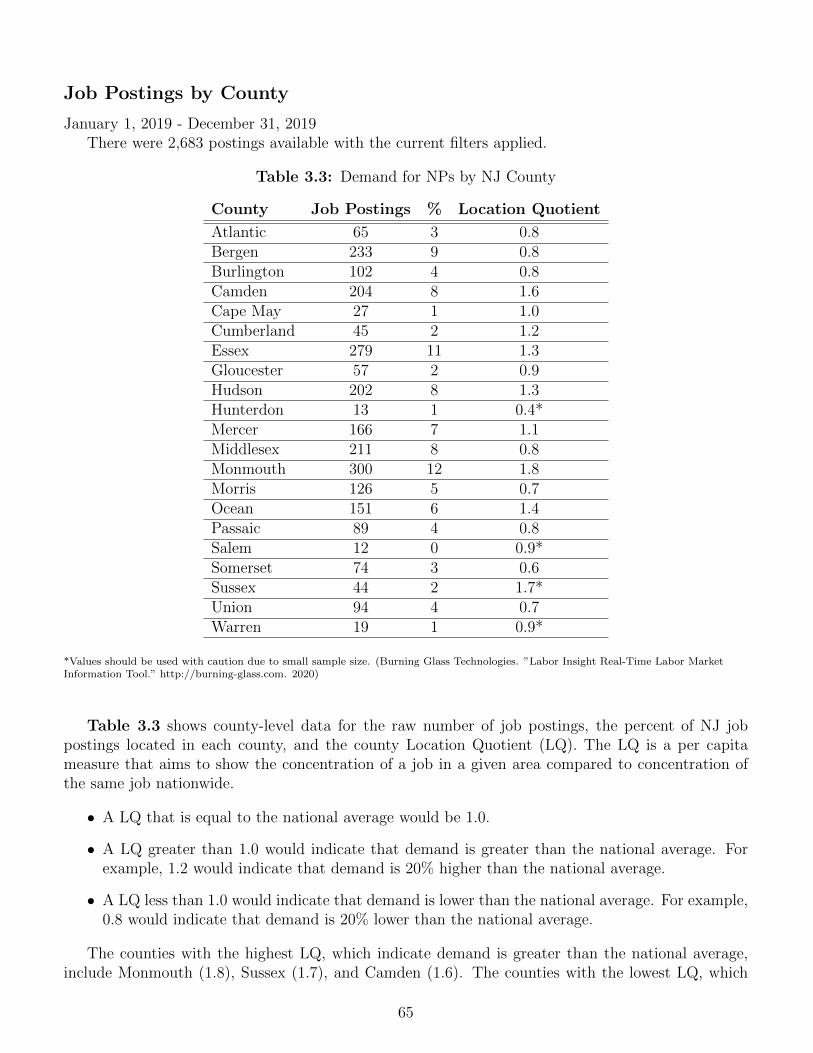
Job Postings by County
January 1, 2019 - December 31, 2019There were 2,683 postings available with the current filters applied.
Table 3.3: Demand for NPs by NJ County
County Job Postings % Location Quotient
Atlantic 65 3 0.8Bergen 233 9 0.8Burlington 102 4 0.8Camden 204 8 1.6Cape May 27 1 1.0Cumberland 45 2 1.2Essex 279 11 1.3Gloucester 57 2 0.9Hudson 202 8 1.3Hunterdon 13 1 0.4*Mercer 166 7 1.1Middlesex 211 8 0.8Monmouth 300 12 1.8Morris 126 5 0.7Ocean 151 6 1.4Passaic 89 4 0.8Salem 12 0 0.9*Somerset 74 3 0.6Sussex 44 2 1.7*Union 94 4 0.7Warren 19 1 0.9*
*Values should be used with caution due to small sample size. (Burning Glass Technologies. ”Labor Insight Real-Time Labor MarketInformation Tool.” http://burning-glass.com. 2020)
Table 3.3 shows county-level data for the raw number of job postings, the percent of NJ jobpostings located in each county, and the county Location Quotient (LQ). The LQ is a per capitameasure that aims to show the concentration of a job in a given area compared to concentration ofthe same job nationwide.
• A LQ that is equal to the national average would be 1.0.
• A LQ greater than 1.0 would indicate that demand is greater than the national average. Forexample, 1.2 would indicate that demand is 20% higher than the national average.
• A LQ less than 1.0 would indicate that demand is lower than the national average. For example,0.8 would indicate that demand is 20% lower than the national average.
The counties with the highest LQ, which indicate demand is greater than the national average,include Monmouth (1.8), Sussex (1.7), and Camden (1.6). The counties with the lowest LQ, which
65

indication demand is lower than the national average, include Hunterdon (0.4), and Somerset (0.6),Morris (0.7), and Union (0.7).
The counties with the most job postings include Monmouth (300), Essex (279), and Bergen (233).
66
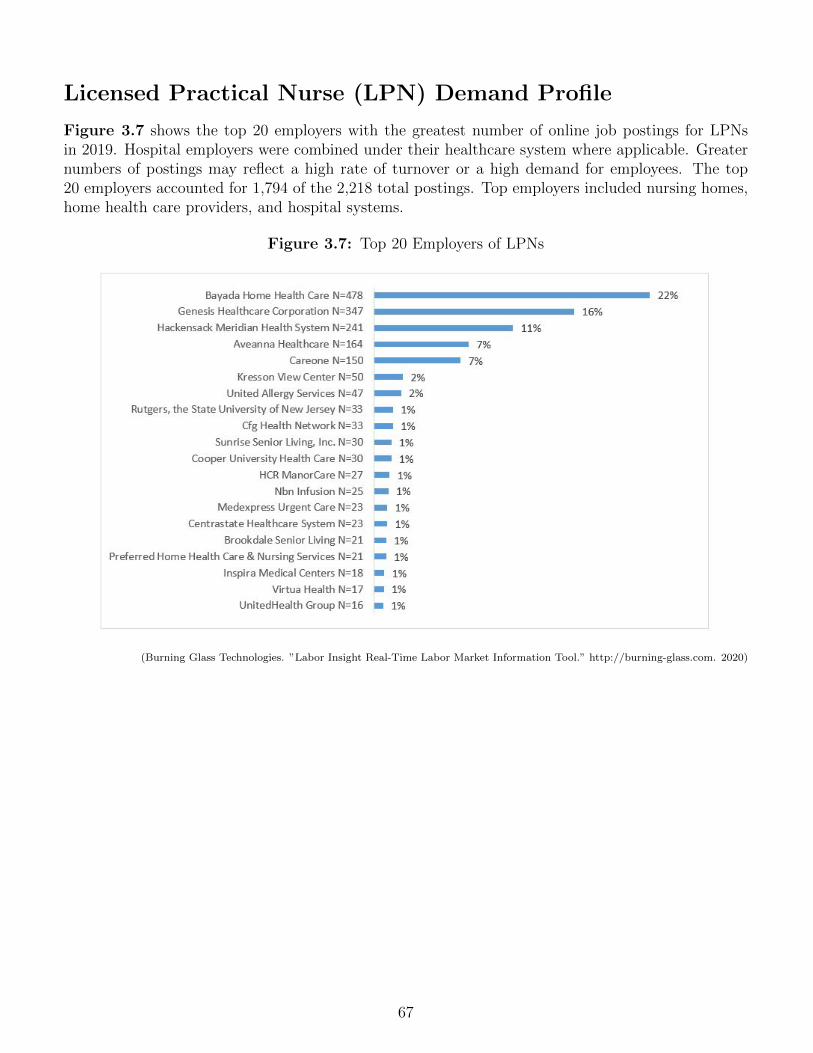
Licensed Practical Nurse (LPN) Demand Profile
Figure 3.7 shows the top 20 employers with the greatest number of online job postings for LPNsin 2019. Hospital employers were combined under their healthcare system where applicable. Greaternumbers of postings may reflect a high rate of turnover or a high demand for employees. The top20 employers accounted for 1,794 of the 2,218 total postings. Top employers included nursing homes,home health care providers, and hospital systems.
Figure 3.7: Top 20 Employers of LPNs
(Burning Glass Technologies. ”Labor Insight Real-Time Labor Market Information Tool.” http://burning-glass.com. 2020)
67
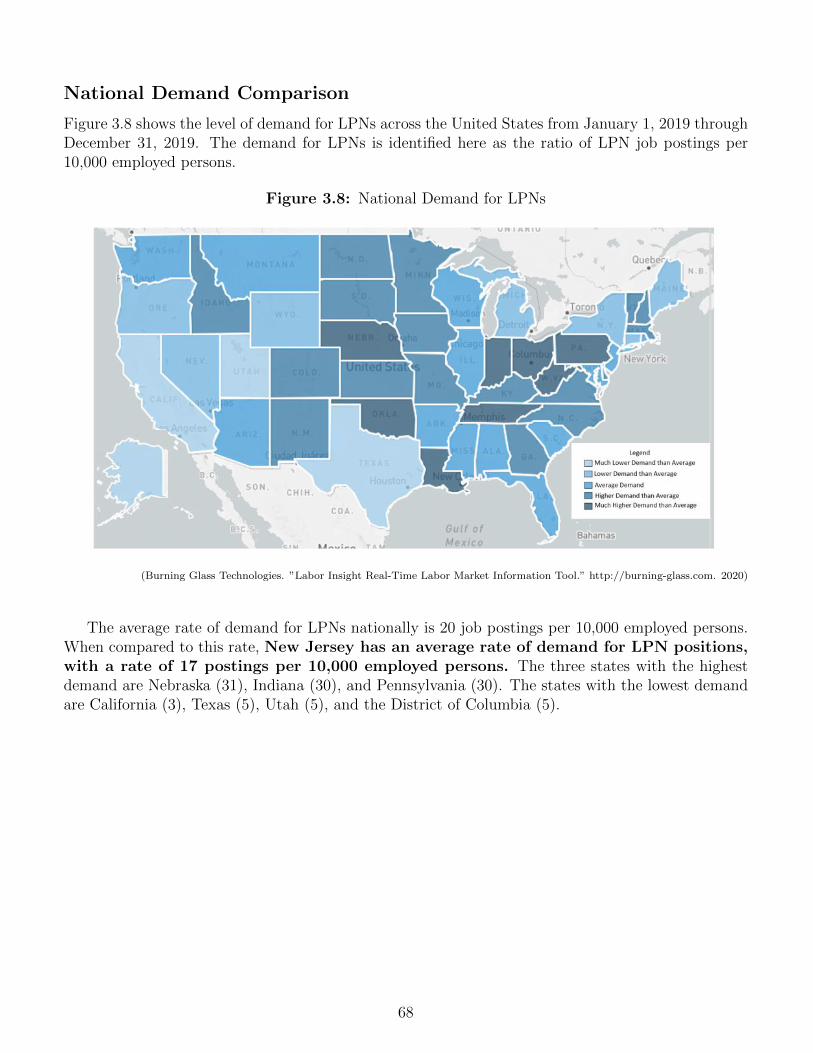
National Demand Comparison
Figure 3.8 shows the level of demand for LPNs across the United States from January 1, 2019 throughDecember 31, 2019. The demand for LPNs is identified here as the ratio of LPN job postings per10,000 employed persons.
Figure 3.8: National Demand for LPNs
(Burning Glass Technologies. ”Labor Insight Real-Time Labor Market Information Tool.” http://burning-glass.com. 2020)
The average rate of demand for LPNs nationally is 20 job postings per 10,000 employed persons.When compared to this rate, New Jersey has an average rate of demand for LPN positions,with a rate of 17 postings per 10,000 employed persons. The three states with the highestdemand are Nebraska (31), Indiana (30), and Pennsylvania (30). The states with the lowest demandare California (3), Texas (5), Utah (5), and the District of Columbia (5).
68
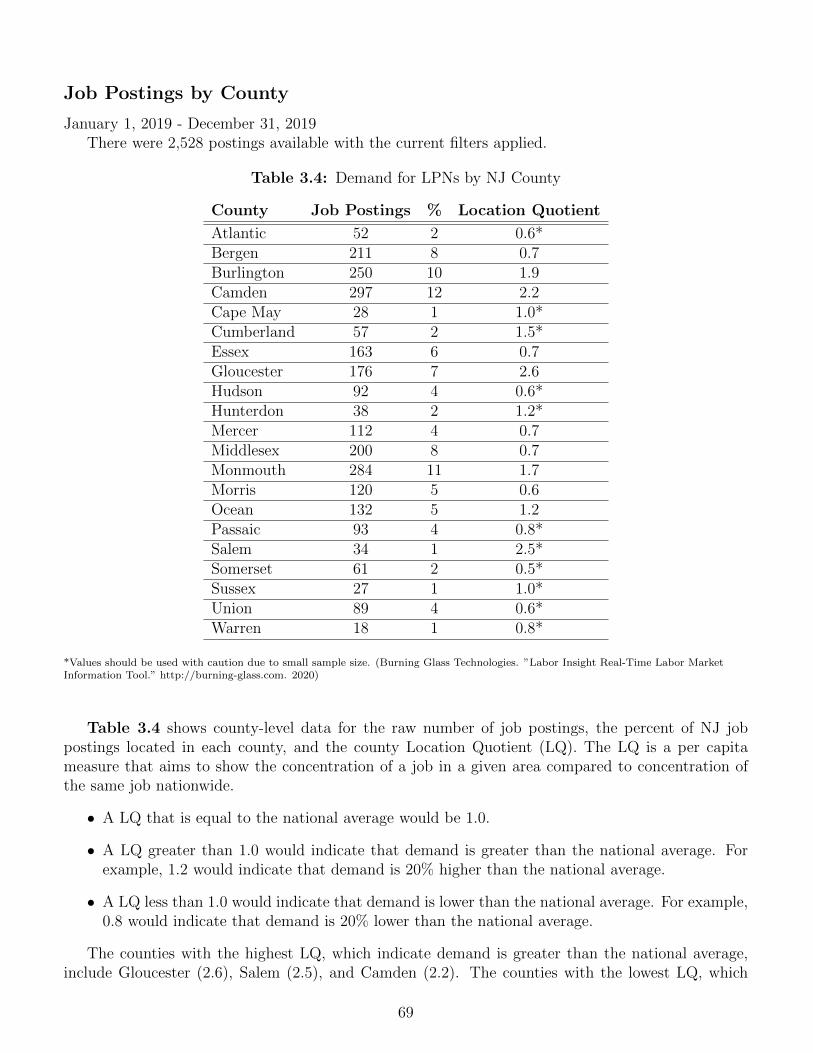
Job Postings by County
January 1, 2019 - December 31, 2019There were 2,528 postings available with the current filters applied.
Table 3.4: Demand for LPNs by NJ County
County Job Postings % Location Quotient
Atlantic 52 2 0.6*Bergen 211 8 0.7Burlington 250 10 1.9Camden 297 12 2.2Cape May 28 1 1.0*Cumberland 57 2 1.5*Essex 163 6 0.7Gloucester 176 7 2.6Hudson 92 4 0.6*Hunterdon 38 2 1.2*Mercer 112 4 0.7Middlesex 200 8 0.7Monmouth 284 11 1.7Morris 120 5 0.6Ocean 132 5 1.2Passaic 93 4 0.8*Salem 34 1 2.5*Somerset 61 2 0.5*Sussex 27 1 1.0*Union 89 4 0.6*Warren 18 1 0.8*
*Values should be used with caution due to small sample size. (Burning Glass Technologies. ”Labor Insight Real-Time Labor MarketInformation Tool.” http://burning-glass.com. 2020)
Table 3.4 shows county-level data for the raw number of job postings, the percent of NJ jobpostings located in each county, and the county Location Quotient (LQ). The LQ is a per capitameasure that aims to show the concentration of a job in a given area compared to concentration ofthe same job nationwide.
• A LQ that is equal to the national average would be 1.0.
• A LQ greater than 1.0 would indicate that demand is greater than the national average. Forexample, 1.2 would indicate that demand is 20% higher than the national average.
• A LQ less than 1.0 would indicate that demand is lower than the national average. For example,0.8 would indicate that demand is 20% lower than the national average.
The counties with the highest LQ, which indicate demand is greater than the national average,include Gloucester (2.6), Salem (2.5), and Camden (2.2). The counties with the lowest LQ, which
69

indication demand is lower than the national average, include Somerset (0.5), Atlantic (0.6), Hudson(0.6), Morris (0.6), and Union (0.6).
The counties with the most job postings include Camden (291), Monmouth (284), and Burlington(250).
70
Chapter 4
Home Health Aide Profile
Home Health Aide Workforce
A home health aide (HHA) is defined by the New Jersey Board of Nursing (NJBON) as a person“who is employed by a home care services agency and is performing nursing regimens or nursing tasksdelegated through the authority of a duly licensed registered professional nurse” (NJ Statutes Anno-tated, 45:11-23(b)). For older adults and individuals with disabilities, chronic illnesses, or cognitiveimpairment, HHAs provide hands-on patient care related to activities of daily living.
With the aging U.S. population, the need for HHAs and personal care aides is projected to grow34 percent from 2019 to 2029, much faster than the average for all occupations (Bureau of LaborStatistics, 2019). This is of special concern in New Jersey because of the reported low salary, fewfull-time positions and irregular work schedule of HHAs (Bureau of Labor Statistics, 2019; Hewko etal., 2015; Weng & Landes, 2017). The New Jersey Collaborating Center for Nursing (NJCCN) is justbeginning to obtain information about New Jersey’s HHAs. Table 4.1 lists the current number ofhome health aides who have HHA certification and the change in this workforce from 2017. HomeHealth Aides renew their certification every two years in November.
Table 4.1: Home Health Aides
2017/2018 2019/2020 % ChangeHome Health Aides 60,343 56,862 -5.7%
In 2020, NJCCN sent a survey to the 30,971 HHAs who had an email address listed with theNJ Board of Nursing. The data reported in this section are from the 958 HHAs who responded tothe survey. Some of the HHA survey questions were created from the Iowa CareGivers’ 2019 DirectCare Worker Wage and Benefit survey for which they contracted with Iowa Workforce Developmentto conduct. (Iowa CareGivers, 2019).
71
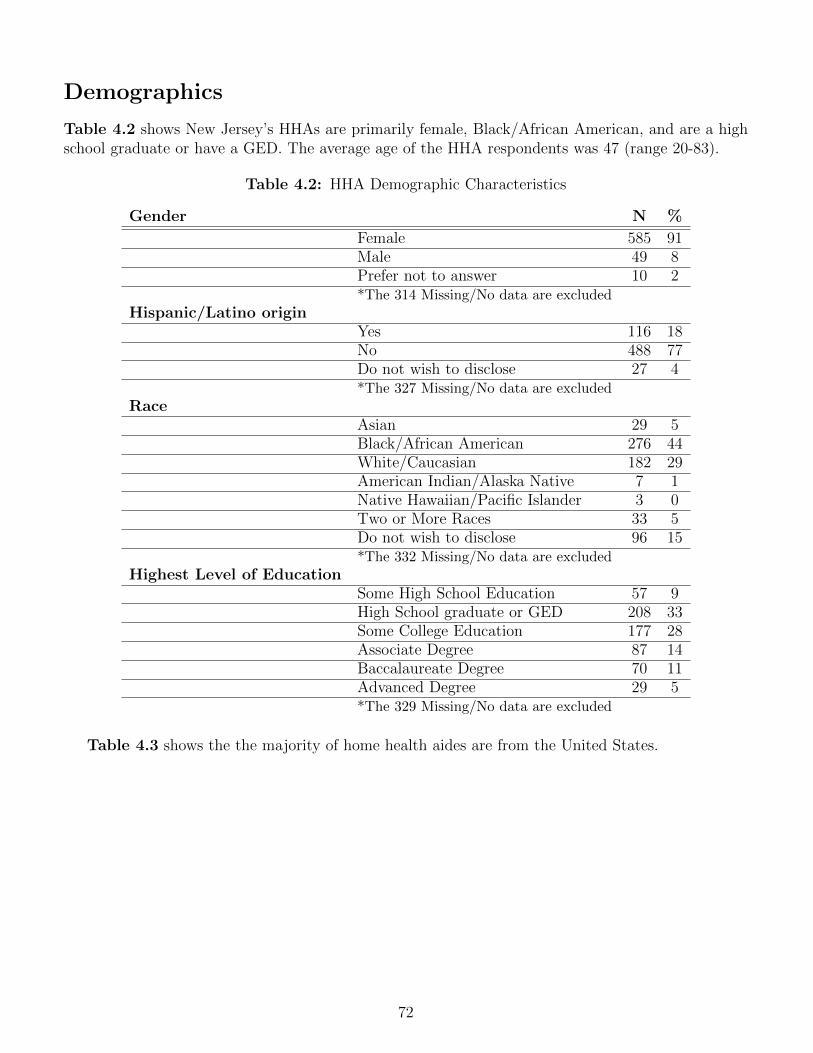
Demographics
Table 4.2 shows New Jersey’s HHAs are primarily female, Black/African American, and are a highschool graduate or have a GED. The average age of the HHA respondents was 47 (range 20-83).
Table 4.2: HHA Demographic Characteristics
Gender N %
Female 585 91Male 49 8Prefer not to answer 10 2*The 314 Missing/No data are excluded
Hispanic/Latino originYes 116 18No 488 77Do not wish to disclose 27 4*The 327 Missing/No data are excluded
RaceAsian 29 5Black/African American 276 44White/Caucasian 182 29American Indian/Alaska Native 7 1Native Hawaiian/Pacific Islander 3 0Two or More Races 33 5Do not wish to disclose 96 15*The 332 Missing/No data are excluded
Highest Level of EducationSome High School Education 57 9High School graduate or GED 208 33Some College Education 177 28Associate Degree 87 14Baccalaureate Degree 70 11Advanced Degree 29 5*The 329 Missing/No data are excluded
Table 4.3 shows the the majority of home health aides are from the United States.
72
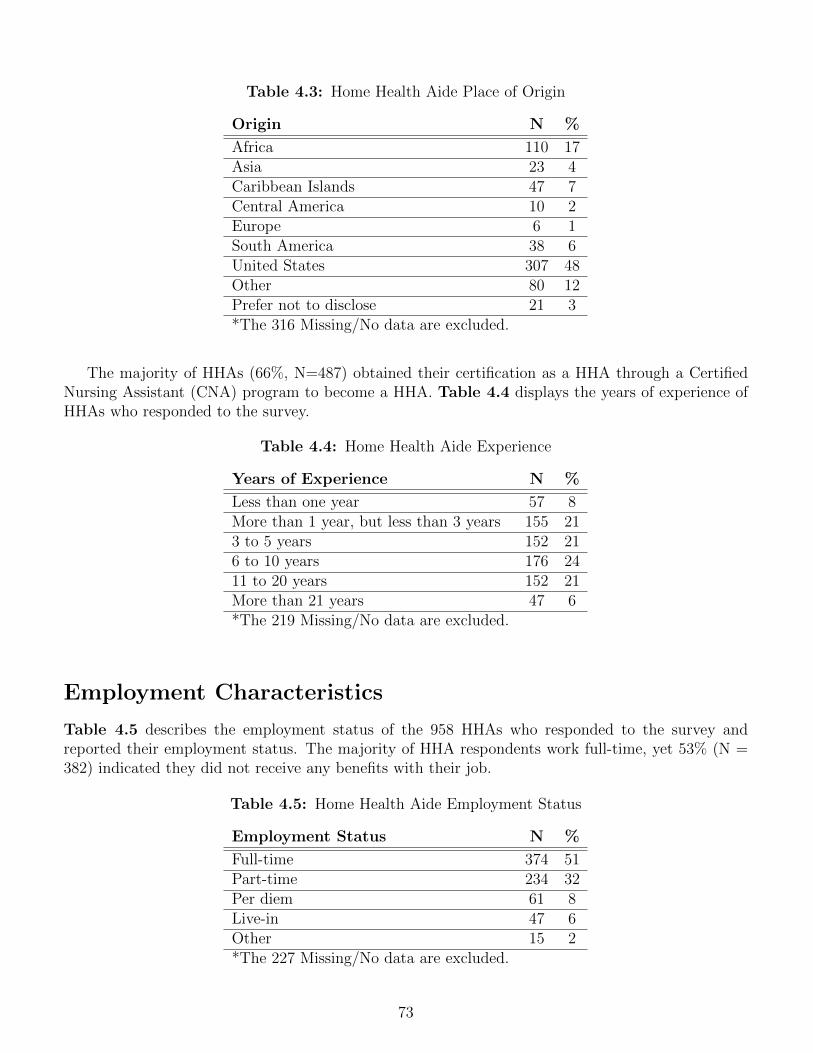
Table 4.3: Home Health Aide Place of Origin
Origin N %
Africa 110 17Asia 23 4Caribbean Islands 47 7Central America 10 2Europe 6 1South America 38 6United States 307 48Other 80 12Prefer not to disclose 21 3*The 316 Missing/No data are excluded.
The majority of HHAs (66%, N=487) obtained their certification as a HHA through a CertifiedNursing Assistant (CNA) program to become a HHA. Table 4.4 displays the years of experience ofHHAs who responded to the survey.
Table 4.4: Home Health Aide Experience
Years of Experience N %
Less than one year 57 8More than 1 year, but less than 3 years 155 213 to 5 years 152 216 to 10 years 176 2411 to 20 years 152 21More than 21 years 47 6*The 219 Missing/No data are excluded.
Employment Characteristics
Table 4.5 describes the employment status of the 958 HHAs who responded to the survey andreported their employment status. The majority of HHA respondents work full-time, yet 53% (N =382) indicated they did not receive any benefits with their job.
Table 4.5: Home Health Aide Employment Status
Employment Status N %
Full-time 374 51Part-time 234 32Per diem 61 8Live-in 47 6Other 15 2*The 227 Missing/No data are excluded.
73
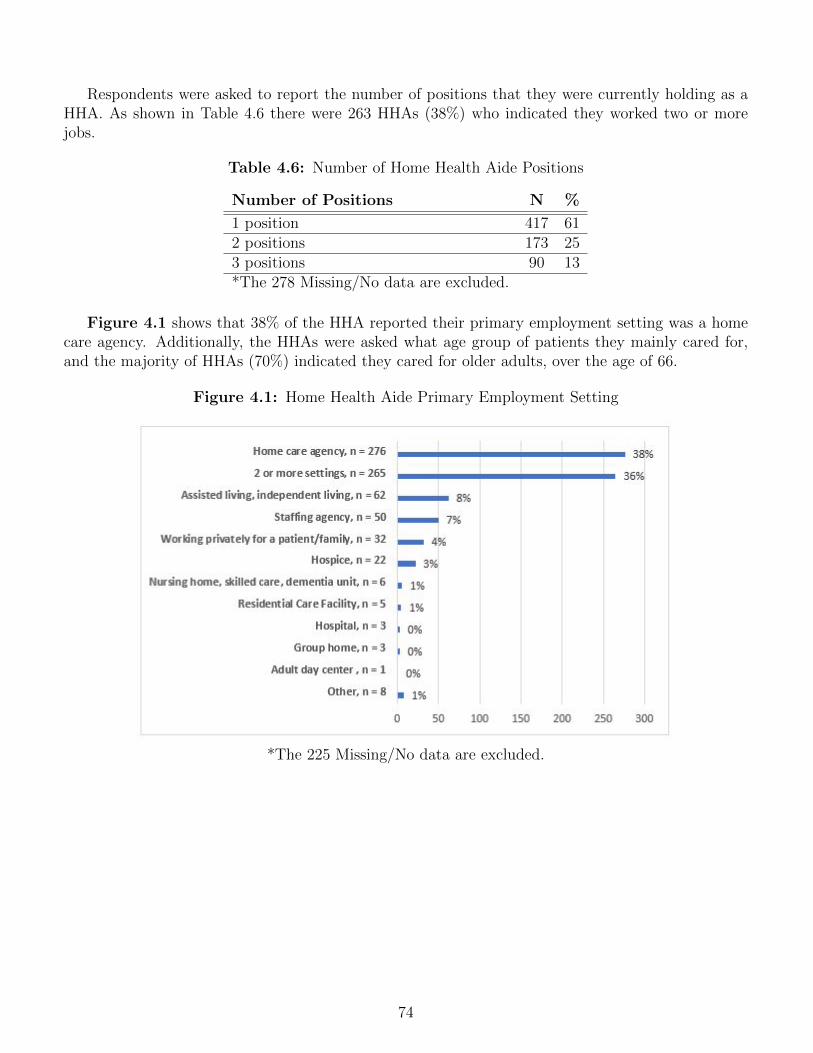
Respondents were asked to report the number of positions that they were currently holding as aHHA. As shown in Table 4.6 there were 263 HHAs (38%) who indicated they worked two or morejobs.
Table 4.6: Number of Home Health Aide Positions
Number of Positions N %
1 position 417 612 positions 173 253 positions 90 13*The 278 Missing/No data are excluded.
Figure 4.1 shows that 38% of the HHA reported their primary employment setting was a homecare agency. Additionally, the HHAs were asked what age group of patients they mainly cared for,and the majority of HHAs (70%) indicated they cared for older adults, over the age of 66.
Figure 4.1: Home Health Aide Primary Employment Setting
*The 225 Missing/No data are excluded.
74
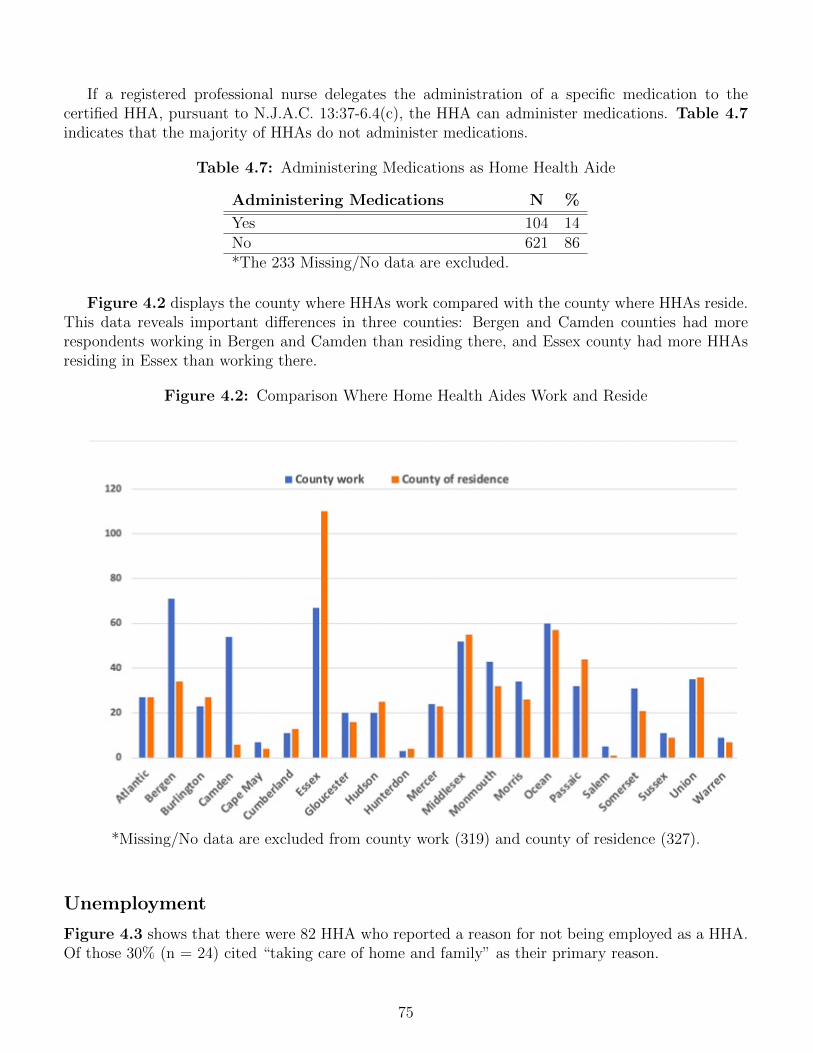
If a registered professional nurse delegates the administration of a specific medication to thecertified HHA, pursuant to N.J.A.C. 13:37-6.4(c), the HHA can administer medications. Table 4.7indicates that the majority of HHAs do not administer medications.
Table 4.7: Administering Medications as Home Health Aide
Administering Medications N %
Yes 104 14No 621 86*The 233 Missing/No data are excluded.
Figure 4.2 displays the county where HHAs work compared with the county where HHAs reside.This data reveals important differences in three counties: Bergen and Camden counties had morerespondents working in Bergen and Camden than residing there, and Essex county had more HHAsresiding in Essex than working there.
Figure 4.2: Comparison Where Home Health Aides Work and Reside
*Missing/No data are excluded from county work (319) and county of residence (327).
Unemployment
Figure 4.3 shows that there were 82 HHA who reported a reason for not being employed as a HHA.Of those 30% (n = 24) cited “taking care of home and family” as their primary reason.
75
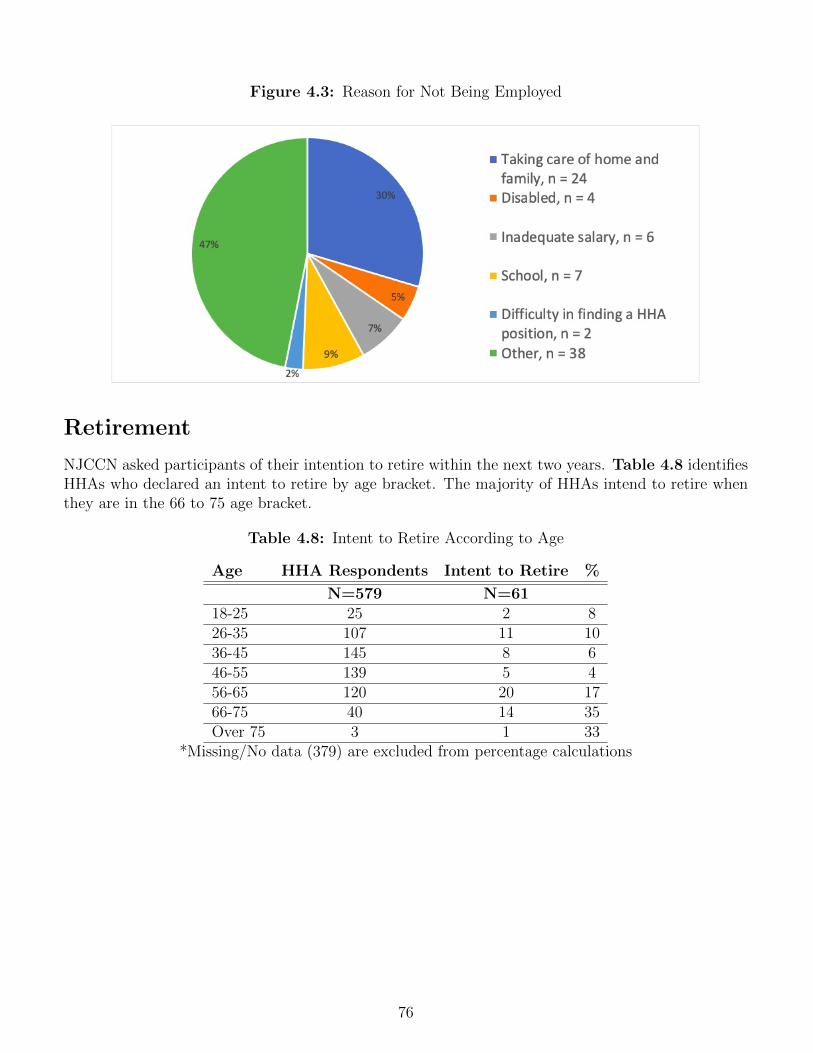
Figure 4.3: Reason for Not Being Employed
Retirement
NJCCN asked participants of their intention to retire within the next two years. Table 4.8 identifiesHHAs who declared an intent to retire by age bracket. The majority of HHAs intend to retire whenthey are in the 66 to 75 age bracket.
Table 4.8: Intent to Retire According to Age
Age HHA Respondents Intent to Retire %
N=579 N=6118-25 25 2 826-35 107 11 1036-45 145 8 646-55 139 5 456-65 120 20 1766-75 40 14 35Over 75 3 1 33
*Missing/No data (379) are excluded from percentage calculations
76
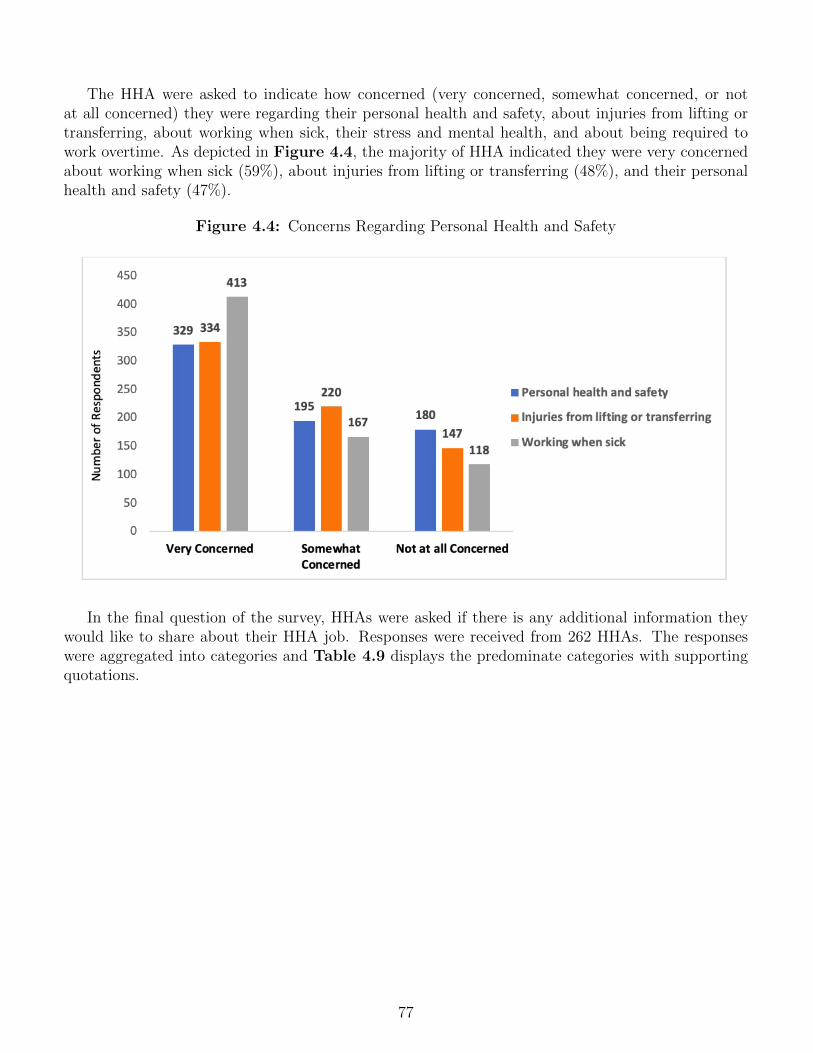
The HHA were asked to indicate how concerned (very concerned, somewhat concerned, or notat all concerned) they were regarding their personal health and safety, about injuries from lifting ortransferring, about working when sick, their stress and mental health, and about being required towork overtime. As depicted in Figure 4.4, the majority of HHA indicated they were very concernedabout working when sick (59%), about injuries from lifting or transferring (48%), and their personalhealth and safety (47%).
Figure 4.4: Concerns Regarding Personal Health and Safety
In the final question of the survey, HHAs were asked if there is any additional information theywould like to share about their HHA job. Responses were received from 262 HHAs. The responseswere aggregated into categories and Table 4.9 displays the predominate categories with supportingquotations.
77
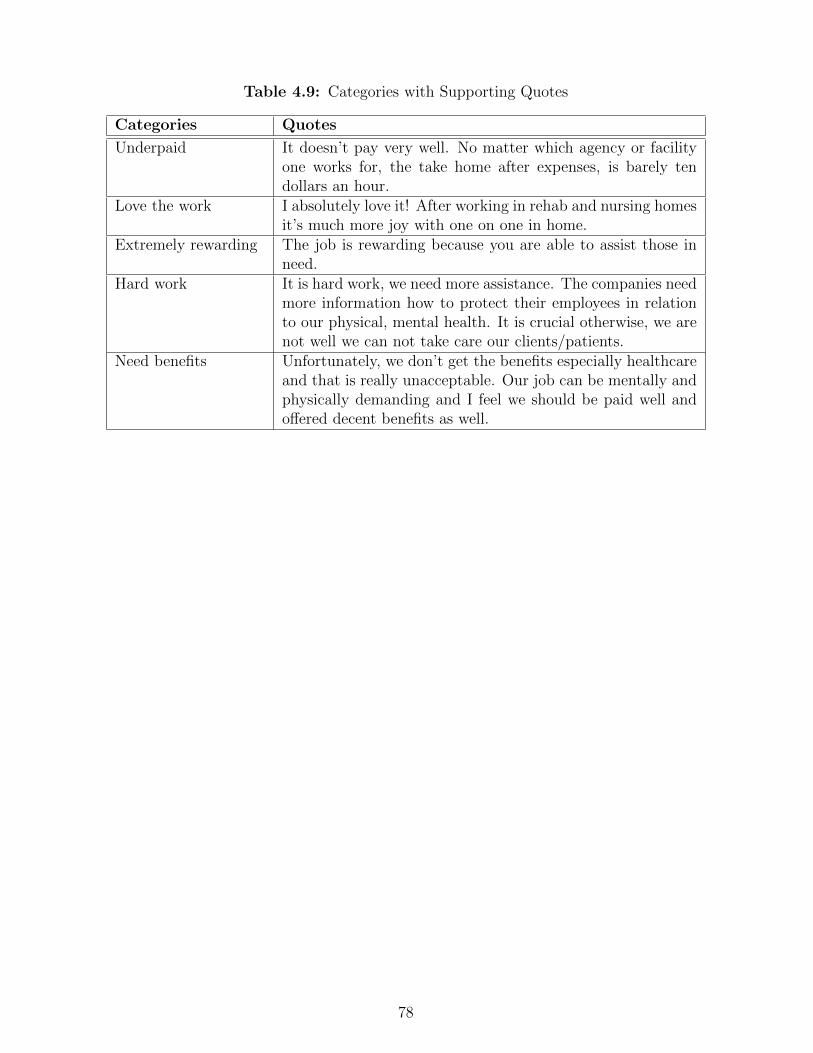
Table 4.9: Categories with Supporting Quotes
Categories Quotes
Underpaid It doesn’t pay very well. No matter which agency or facilityone works for, the take home after expenses, is barely tendollars an hour.
Love the work I absolutely love it! After working in rehab and nursing homesit’s much more joy with one on one in home.
Extremely rewarding The job is rewarding because you are able to assist those inneed.
Hard work It is hard work, we need more assistance. The companies needmore information how to protect their employees in relationto our physical, mental health. It is crucial otherwise, we arenot well we can not take care our clients/patients.
Need benefits Unfortunately, we don’t get the benefits especially healthcareand that is really unacceptable. Our job can be mentally andphysically demanding and I feel we should be paid well andoffered decent benefits as well.
78
Appendices
Glossary
• Accelerated BSN Nursing Program (2nd Degree): A program of instruction to prepareregistered nurses that admits students with baccalaureate degrees in other disciplines and noprevious nursing education and, at completion, awards a baccalaureate degree in nursing andeligibility to apply for licensure as an RN. The curriculum is designed to be completed inless time than the generic (entry-level) baccalaureate program usually through a combinationof ”bridge”/transition courses (American Association of Colleges of Nursing). (InteragencyCollaborative on Nursing Statistics, 2016)
• Accelerated BSN Nursing Program (2nd Degree): A program of instruction to prepareregistered nurses that admits students with baccalaureate degrees in other disciplines and noprevious nursing education and, at completion, awards a baccalaureate degree in nursing andeligibility to apply for licensure as an RN. The curriculum is designed to be completed inless time than the generic (entry-level) baccalaureate program usually through a combinationof ”bridge”/transition courses (American Association of Colleges of Nursing). (InteragencyCollaborative on Nursing Statistics, 2016)
• Admitted Applicants: A count of the individuals who received official notice from the pro-gram that they were invited to begin the nursing program during the Reporting Period.
• ADN Program, Generic: A program of instruction that requires at least two years of FTEcollege academic work generally within a junior or community college, the completion of whichresults in an associate degree (e.g., AS, AA, AAS, ADN, etc.) with a major in nursing andeligibility to apply for licensure as an RN. (Interagency Collaborative on Nursing Statistics,2016)
• ADN/ASN Program, Bridge (LPN/VN to Associate Degree in Nursing Program):A program of instruction to prepare registered nurses that is specifically designed to admit in-dividuals licensed as practical/vocational nurses and, at completion, awards an associate degreein nursing and eligibility to apply for licensure as an RN. (Interagency Collaborative on NursingStatistics, 2016)
• Available Seats: A count of the total number of seats available for newly admitted students.
• Diploma Nursing Program: A program of instruction that requires two to three years offull-time coursework, usually within a hospital-based structural unit, the completion of whichresults in a diploma or certificate of completion and eligibility to apply for licensure as an RN.(Interagency Collaborative on Nursing Statistics, 2016)
79
• DNP Program: A program of instruction that prepares graduates for the highest level ofnursing practice beyond the initial preparation in the discipline. The doctor of nursing practicedegree is the terminal practice degree. (American Association of Colleges of Nursing) (Intera-gency Collaborative on Nursing Statistics, 2016)
• Enrollees: A count of the Admitted Applicants who subsequently enrolled for the first time inthe nursing program during the Reporting Period. This count should include only individualswho were still enrolled in a nursing course after the first two weeks of class.
• Enrollees (%): The percentage of Admitted Applicants who subsequently enrolled for thefirst time in the nursing program during the Reporting Period, relative to the total number ofAdmitted Applicants. This count should include only individuals who were still enrolled in anursing course after the first two weeks of class.
• Faculty Vacancy: A vacant position for a faculty member that is being actively recruited asof the fall semester census date.
• Full-Time Faculty: Those members of the instructional, administrative, or research staff of thenursing academic unit who are employed full-time as defined by the institution, hold academicrank, carry the full scope of faculty responsibility (e.g., teaching, advisement, committee work),and receive the rights and privileges associated with full time employment. These faculty may betenured, tenure-track, or non-tenure track (given that there is a tenure system in the institution).
• Graduates: A count of the number of students who successfully completed the program re-quirements and were formally awarded the degree during the Reporting Period.
• License by Exam: An RN or LPN who has graduated from an approved school of nursing andhas taken the NCLEX examination (either the NCLEX-RN or the NCLEX-PN respectively).
• LPN Program: A program of instruction that requires at least one year of full-time equiva-lent coursework generally within a high school, vocational/technical school or community/juniorcollege setting, the completion of which results in a diploma or certificate of completion and eli-gibility to apply for licensure as an LPN/VN. Please combine all curriculum options or tracks foryour pre-licensure LPN program. For example, if your state collects separate data on advancedplacement CNA-to-LPN program tracks, please combine it with data on generic or traditionalLPN program tracks.
• MSN Program, Clinical Track: A post-licensure master’s program with emphasis on ad-vanced clinical practice, including Nurse Practitioner, Nurse Anesthetist, Nurse Midwifery, andClinical Nurse Specialist tracks. If your state collects separate data on different clinical tracks,please combine them.
• MSN Program, Non-Clinical Track: A post-licensure master’s program with non-clinicalemphasis, such as Nurse Educator and Management/Leadership tracks. If your state collectsseparate data on different non-clinical tracks, please combine them.
• Part-Time Faculty: Those members of the instructional, administrative, or research staff ofthe nursing academic unit who are employed part-time as defined by the institution. Thesefaculty members are typically not eligible for tenure.
80
• PhD Program: Doctoral (Research-Focused) Program. A program of instruction that admitsRNs with master’s degrees in nursing and awards a doctoral degree. This program preparesstudents to pursue intellectual inquiry and conduct independent research for the purpose ofextending knowledge. In the academic community, the PhD, or Doctor of Philosophy degree,is the most commonly offered research focused doctoral degree. However, some schools for avariety of reasons may award a Doctor of Nursing Science (DNS or DNSc) as the research-focused doctoral degree. (American Association of Colleges of Nursing). (American Associationof Colleges of Nursing) (Interagency Collaborative on Nursing Statistics, 2019)
• Post-licensure BSN Program (RN-BSN Program): Admits RNs with associate degreesor diplomas in nursing and awards a baccalaureate nursing degree. (Interagency Collaborativeon Nursing Statistics, 2016)
• Pre-licensure BSN Program, Generic: A program of instruction to prepare registerednurses that admits students with no previous nursing education, the completion of which resultsin a baccalaureate degree (e.g., BA, BS, BSN, etc.) with a major in nursing and eligibilityto apply for licensure as an RN. The program requires at least four years but not more thanfive years of full time equivalent college academic work within an educational institution oruniversity. (Interagency Collaborative on Nursing Statistics, 2016)
• Pre-licensure MSN Program (Entry MSN): A program of instruction that admits studentswith baccalaureate degrees in other disciplines and no previous nursing education. The programprepares graduates for entry into the profession, eligibility to apply for licensure as an RN, andupon completion awards a master’s degree (e.g., MSN, MS, MA, etc.) in nursing. (AmericanAssociation of Colleges of Nursing) (Interagency Collaborative on Nursing Statistics, 2016)
• Qualified Applicants: A count of the individuals who submitted complete applications ontime and who met all institutional requirements for formal admission to the nursing programduring the Reporting Period.
• Total student enrollment: A count of the number of students enrolled on the fall semestercensus date. Include students at all points of the program’s curriculum sequence, includingnewly enrolled, continuing, and students in their final semester or year.
81
Methodology
Supply
Supply data are derived both from the entrance of new nurses (educational capacity) into the systemas well as the data on the current workforce.
Educational Capacity
An email letter describing the purpose of the New Jersey Educational Capacity Survey was sent to thedean of each nursing program in New Jersey with a portable document file (pdf) of the questionnaireand a glossary of terms. The questionnaire included all items from the nurse minimum dataset(N-MDS) as outlined by the National Forum of Nursing Workforce Centers. Additional questionswere added to provide additional context. Data were reviewed for completeness and consistency andadjusted as appropriate. When discrepancies in the data were found, the school was contacted forclarification. This is self-reported data which can have errors in how the school interprets or completesthe survey. In 2020, data were obtained for BSN and higher degree graduates using AACN as a source,and then merged with NJCCN data surveys. This was process was offered to baccalaureate and higherdegrees as an option to reduce survey burden.
Current Workforce Data
Licensure is renewed for all nursing categories every two years. Thus, every year, half of the APN,RN, and LPN licensure data are collected through the BON licensure data. At the end of the two-yearperiod, the data are merged and analyzed collectively. These data are voluntarily self-reported bythe nurses in the state. The data are provided to a third-party vendor and used by the BON priorto being sent to the Center for analysis. Because it is self-reported, these data can have errors. In2018, the BON changes its survey questions to the Nursys® Licensure and Workforce tool. Data for2018-2019 were collected using the Nursys® tool.
Demand
Demand data that determines workforce trends in real-time is important for predicting the job mar-ket. As such, the Center is using Labor Insight™ designed by Burning Glass Technologies (BGT).Labor Insight™ draws on a comprehensive database of real-time demand on a national, state, and re-gional level. This database can track and analyze employer hiring activities by industry, occupation,education, and skills to help provide direction. Labor Insight™ obtains data on online job postingsfrom up to 40,000 sources, which is mined and coded from each posting to describe skills, education,and experience. O*Net is the nation’s primary source of occupational information and is developedunder the sponsorship of the US Department of Labor/Employment and Training Administration.The O*Net Standard Occupational Classification (O*Net –SOC) is used to standardize the approachto postings for the data report.
The NJCCN used data mined from BGT to determine the demand for nurses in the state ofNew Jersey. The O*Net –SOC taxonomy was used to standardize the occupation-specific indicators.The job ads were reviewed to eliminate any per diem positions, out-of-state commuters, temporarypositions, and postings that had job openings outside of New Jersey.
82
There are several limitations of BGT data. A major limitation is that online job advertisementsare only partially representative of the labor market and the demand for labor. Current approachesto advertising also include newspapers, career fairs, and social networking (American PsychologicalAssociation APA, 2015). Another limitation is that one job posting may advertise the need for multiplenurses, but will only register as a single post in the database. Duplicate postings are common andmay be missed even though BGT uses an algorithm to remove duplications in each 60-day timeframe.If a job is not filled and is reposted within this 60-day timeframe, it will be a duplicate that cannot bescreened out. The use of O*Net-SOC also creates a limitation because it classifies most RNs under asingle code (291141.00) and provides special codes only for Acute Care Nurses (291141.01) and CriticalCare Nurses (291141.03), which creates challenges for breaking the codes down into more pinpointedspecialties and subfields. Lastly, because new web sources of online job ads are continuously addedby BGT, samples of job advertisements from different time periods are incomparable (APA, 2015).Thus, BGT data cannot be used to study longitudinal changes in the online labor market (APA,2015).
Projection of Nurse Retirement
The 2017 report had a complete analysis of projected nurse retirements, which can be found athttp://www.njccn.org/wp-content/uploads/2019/08/11-Chapter-4-Projection.pdf. This year’s publi-cation builds on that report by providing an update based on 2019-20 data.
83
References
American Association of Colleges of Nursing. (2019). Fact sheet: the doctor of nursing practice.https://www.aacnnursing.org/portals/42/news/facsheets/DNP-Factsheet.pdf.
Burning Glass Technologies. (2020). “Labor Insight Real-Time Labor Market InformationTool.” Retrieved from http://burning-glass.com.
Hewko, S., Cooper, S., Huynh, H., Spiwek, T., Carleton, H., Reid, S., & Cummings, G. (2015).Invisible no more: a scoping review of the health care aide workforce literature. BMC Nursing,14(38), 3-17. doi:10.1186/s12912-015-0090-x
Iowa CareGivers. (2019). 2019 Direct Care Worker Wage and Benefit Survey.https://iowacaregivers.org/uploads/pdf/2019%20Wage%20&%20Benefit%20Survey%20Final.pdf
National Council of State Boards of Nursing. (2020). NCSBN’s Environment scan: A portraitof nursing and healthcare in 2020 and beyond. Journal of Nurs. Regulation. 10(4), S1-35.
NCSBN. (June 2020). 2019 NCLEX Examination Statistics. https://www.ncsbn.org/2019NCLEXExamStats.pdf
NJ Administrative Code (N.J.A.C.), Title 13, Law and public safety, Chapter 37-6.4(c). (2020).Retrieved from https://www.njconsumeraffairs.gov/regulations/Chapter-37-New-Jersey-Board-of-Nursing.pdf
NJ Statutes Annotated, Title 45, Chapter 11, New Jersey Board of Nursing Statutes, 45:11-27Retrieved on May 3, 2018 http://caring4you.net/laws1.html
Nurses, Nursing Education, and Nursing Workforce: Definitions. (2016).http://www.iconsdata.org/definitions.html
U.S. Bureau of Labor Statistics. (2019). Occupational Employment Statistics. OccupationalEmployment and Wages, May 2019, 31-1120 Home Health Aides.https://www.bls.gov/oes/current/oes311120.htm#st
U.S. Bureau of Labor Statistics. (2020). Occupational Outlook Handbook, Home HealthAides and Personal Care Aides. https://www.bls.gov/ooh/healthcare/home-health-aides-and-personal-care-aides.htm
U.S. Department of Health and Human Services, Health Resources and Services Administration,National Center for Health Workforce Analysis. (2017). Long-Term Services and Supports:Nursing Workforce Demand Projections, 2015-2030. Rockville, Maryland.
84

U.S. Department of Health and Human Services, Health Resources and Services Administration,National Center for Health Workforce Analysis. (2017). National and Regional Supply andDemand Projections of the Nursing Workforce: 2014-2030. Rockville, Maryland.
Weng, S., & Landes, S. (2017). Culture and Language Discordance in the Workplace: Ev-idence from the National Home Health Aide Survey. The Gerontologist, 57(5), 900–909.doi:10.1093/geront/gnw110
85
Acknowledgements
NJCCN Board
Teri Wurmser, PhD, MPH, RN, NEA-BC, Chairperson
Representing the NJ State Nurses Association
Laura Mularz, DNP, MSN, APN, ACNS-BC, NE-BC, CRRN, Secretary
Representing the Organization of Nurse Leaders of NJ
Kathryn Burns Collins, RN, MPA, FACHE
Representing the NJ Hospital Association
Margaret A. Farrell Daingerfield, EdD, RN, CNE
Representing the NJ State Nurses Association
Victoria Hasser, MSW, LCSW
Representing Consumers of Health
Barbara George Johnson, MPH, JD
Representing Consumers of Health
Dawn Jacobson, MSN, RN
Representing the Home Care & Hospice Association of NJ
Michele McLaughlin, MSN, RN, CPAN
Representing Practitioners of Direct Care
Teresa Merola, MSN, RN, PNP-BC, CCRN, CPN
Representing the Association of Diploma Schools
Donna Murray, MSN, RN, APN,C, WHNP-BC
Representing the NJ League for Nursing
Donna Stankiewicz, EdD, MSN, RN
Representing the Council of Associate Degree Programs
86
NJCCN Advisory Council
Wendy Britt, LPN, CMCN
Representing the LPN Association of New Jersey
Sandy Cayo, DNP, FNP-BC
Representing the New Jersey Hospital Association
Darlene Cox, MS, RN, FACHE
Representing the New Jersey Council of Teaching Hospitals
Matthew D’Oria, MBA
Representing Consumers of Health
Nancy Friedrich, MSN, RN
Representing the Practical Nurse Educators Council of New Jersey
Shanda Johnson, PhD, APN-C, FNP
Representing the New Jersey State Nurses Association
John Lanier, MS, RN, NE-BC
Representing the New Jersey League for Nursing
Christine Mihal, EdD, RN
Representing the Organization of Colleges of Nursing, New Jersey
Elizabeth Mizerek, MSN, RN, FN-CSA, CEN, CPEN, CNE, FAEN
Representing the New Jersey Council of Associate Degree Programs
Christine Newman, LSW
Representing Consumers of Health
Afrika Parks, MSN, RN, LNHA
Representing the Health Care Association of New JerseyFlorine Pearson Jones, MSN, BSN, RN, IBCLC
Representing Practitioner of Direct CareDonna Penn, MSN, RN, CNE, NEA-BC
Representing the Association of Diploma SchoolsFaith Scott, MPH, MBA
Representing the Home Care and Hospice Association of New JerseyAnn Tritak-Elmiger, EdD, RN
Representing the New Jersey State Nurses Association
Tracy Vitale DNP, RNC-OB, C-EFM, NE-BC
Representing the Organization of Nurse Leaders of New Jersey
Nicole Wesley, LPN
Representing the LPN Association of New Jersey
Special thanks to the New Jersey Board of Nursing
124 Halsey Street, 6th Floor, Newark, NJ 07101
87