Embed Size (px)
Citation preview
Seediscussions,stats,andauthorprofilesforthispublicationat:https://www.researchgate.net/publication/257214264
NutrientimbalanceandyieldlimitingfactorsoflowinputEastAfricanhighlandbanana(Musaspp.AAA-EA)croppingsystems
ARTICLEinFIELDCROPSRESEARCH·JUNE2013
ImpactFactor:2.98·DOI:10.1016/j.fcr.2013.04.001
CITATIONS
3
READS
76
7AUTHORS,INCLUDING:
T.Ndabamenye
UniversityofPretoria
4PUBLICATIONS9CITATIONS
SEEPROFILE
PietJ.A.vanAsten
ConsultativeGrouponInternationalA…
104PUBLICATIONS597CITATIONS
SEEPROFILE
GuyBlomme
BioversityInternational
108PUBLICATIONS250CITATIONS
SEEPROFILE
BernardVanlauwe
ConsultativeGrouponInternationalA…
221PUBLICATIONS4,396CITATIONS
SEEPROFILE
Allin-textreferencesunderlinedinbluearelinkedtopublicationsonResearchGate,
lettingyouaccessandreadthemimmediately.
Availablefrom:T.Ndabamenye
Retrievedon:10February2016

ORIGINAL ARTICLE
Influence of plant density on variability of soil fertilityand nutrient budgets in low input East African highlandbanana (Musa spp. AAA-EA) cropping systems
T. Ndabamenye • B. Vanlauwe •
P. J. A. Van Asten • G. Blomme • R. Swennen •
B. Uzayisenga • J. G. Annandale • R. O. Barnard
Received: 28 December 2012 / Accepted: 21 March 2013
� Springer Science+Business Media Dordrecht 2013
Abstract The productivity of East African highland
(EAH) banana cropping systems is declining, partic-
ularly in areas with low inherent soil fertility. Soil
fertility management requires knowledge of nutrient
flows at the interface between the soil surface and the
soil system. The magnitude of soil fertility dynamics
and nutrient depletion was studied for a short-term
banana plant density trial in three contrasting agro-
ecological sites of Rwanda (Kibungo low rainfall with
medium soil fertility, Rubona high rainfall with low
soil fertility and Ruhengeri high rainfall with high soil
fertility) using nutrient stock and partial nutrient
balance calculations. Plant density did not influence
significantly nutrient mass fractions in plant parts
(fruit, leaves and pseudostems) but nutrients contained
through shredded leaves and pseudostems and those
removed through bunch dry matter increased with
plant density. Plant density responses to variation in
soil fertility and partial nutrient balances seemed to
depend on diversity in climate and soil type. Partial N
and K balances (kg ha-1 year-1) were estimated to be
strongly negative at Rubona and Ruhengeri while Ca
and Mg were positive at Kibungo and Ruhengeri but
negative at Rubona. This study showed that partial
nutrient balances associated with soil nutrient stocks
T. Ndabamenye (&) � J. G. Annandale � R. O. Barnard
Department of Plant Production and Soil Science,
University of Pretoria, Private Bag X 20, Hatfield,
Pretoria 0028, South Africa
e-mail: [email protected]
T. Ndabamenye
Directorate of Infrastructure and Mechanization, Rwanda
Agriculture Board, P.O Box 5016, Kigali, Rwanda
B. Vanlauwe
Tropical Soil Biology and Fertility Institute of CIAT,
P.O. Box 30677-00100, Nairobi, Kenya
P. J. A. Van Asten
International Institute of Tropical Agriculture,
P.O Box 7878, Kampala, Uganda
G. Blomme � R. Swennen
Bioversity International, P.O Box 24384,
Kampala, Uganda
R. Swennen
Division of Crop Biotechnics and Laboratory of Tropical
Crop Improvement KU Leuven, Willem De Croylaan 42,
lokaal 04.06, Bus 2455, 3001 Leuven, Belgium
R. Swennen
International Institute of Tropical Agriculture, c/o
AVRDC - The World Vegetable Center, P.O Box 10,
Duluti, Arusha, Tanzania
R. Swennen
Bioversity International, W. De Croylaan 42, 3001
Heverlee, Belgium
R. Swennen
Bioversity International, Via dei Tre Denari, 472/a, 00057
Maccarese (Fiumicino), Rome, Italy
B. Uzayisenga
Directorate of Agricultural Extension, Rwanda
Agriculture Board, P.O Box 5016, Kigali, Rwanda
123
Nutr Cycl Agroecosyst
DOI 10.1007/s10705-013-9557-x

can provide the first order of magnitude of nutrient
depletion in low input EAH banana cropping systems.
This brings attention from agricultural researchers and
farmers to develop options that can improve the
productivity of these systems, where resource avail-
ability for improved nutrient management is scarce.
Keywords Agro-ecological sites � Nutrient
depletion � Rwanda
Introduction
East African highland (EAH) banana (Musa spp.) is a
key staple and cash crop for smallholder farmers in
Rwanda, Uganda, parts of DR Congo, Tanzania, and
Kenya. However, yields have been low and often
reported to be declining, with soil fertility problems
often cited as a primary cause (van Asten et al. 2005;
Wairegi et al. 2010; Okumu et al. 2011). Soil fertility
management strategies require knowledge of the soil
fertility dynamics of the cultivation systems. To
replenish nutrients in banana farms while conserving
soil moisture, most banana growers and farmers use
banana self-mulch, household wastes, compost and
farmyard manure and residues of annual crops (Bek-
unda and Woomer 1996; Baijukya and De Steenhuij-
sen Piters 1998; Briggs and Twomlow 2002; Bekunda
et al. 2004).
However, rates of nutrient returns and external
input application are generally insufficient to meet the
nutrient requirements to maintain or improve yields.
Numerous studies have reported nutrient deficiencies
(e.g. N, P and K; Gaidashova et al. 2010, K and Mg;
Smithson et al. 2001; Smithson et al. 2004). This is
associated with insufficient manure quantities avail-
able to farmers and the perceived high cost or
unavailability of mineral fertilizers (Wortmann et al.
1994; Wairegi and van Asten 2010). Nutrient recy-
cling in banana cropping systems is highly dynamic
(Baijukya and De Steenhuijsen Piters 1998; van
Astern et al. 2004), due to the large biomass turnover
and relatively low harvest-index of the crop (Hauser
and van Asten 2010). However, relatively little
quantitative insights exist in terms of nutrient fluxes
and balances of these systems (Nyombi et al. 2010;
Delstanche 2011).
Bananas are a perennial crop. The stools are succes-
sively regenerated by suckers every 6–18 months. Bio-
mass production is highly dynamic over time (Birabwa
et al. 2010) as a consequence of variation in rainfall, but
fruits can be harvested all year round (Dorel et al. 2008).
Bananas require a continuous and relatively large supply
of nutrients, particularly K; total K nutrient uptake by the
aboveground biomass can easily exceed 500 kg ha-1
annually (Nyombi et al. 2009). While predicting nutrient
depletion under EAH banana cropping systems, there is a
need to put much attention on existing knowledge and
practices of farmers when it comes to their ability to
replenish soil nutrient stocks to maintain or even improve
yields. Large regional variations exist in terms of EAH
banana yields, agro-ecological characteristics such as soil
and rainfall, and crop management practices such as plant
density, mulching, and weeding (Gaidashova et al. 2009;
Delstanche 2011; Ndabamenye et al. 2012). However,
these variations have tremendous impact on the nutrient
balances and sustainability of these important food
production systems. Smallholder producers require site-
specific crop and soil management agrotechniques to
improve productivity and sustainability. This requires
understanding of the current nutrient balances and the
underlying determining factors in terms of crop manage-
ment and agro-ecological conditions in major banana
production zones.
The approach of computing nutrient flows and
balances (Stoorvogel and Smaling 1990; Smaling et al.
1993) in a farming system can increase the under-
standing of nutrient management and environmental
policy (Oenema et al. 2003). The method has also been
found to be a valuable tool to assess the sustainabil-
ity of agro-ecosystems and to provide information
to account for changes in productivity over time
(Haileslassie et al. 2007). Nutrient balance studies
involve computation of differences between nutrient
inflows and outflows in a farming system, whereby a
negative balance indicates nutrient mining and a positive
value indicates nutrient accumulation (Nandwa and
Bekunda 1998; Bekunda et al. 2004; Cobo et al. 2010).
In East Africa, numerous studies reported assessments
of N balances but not much attention has been given to
P and K and few have considered Ca and Mg (Cobo
et al. 2010). Reviewing nutrient balances in African
land use systems, Cobo et al. (2010) reported an over-
all negative trend. In the smallholder banana systems,
the bulk of the annual nutrient supply originates either
from recycling of crop residues or external organic
Nutr Cycl Agroecosyst
123

nutrient inputs (very limited amounts of manure and
mulch) and mineral fertilizers or mineral weathering
(only a very small percentage) (Delstanche 2011).
The objectives of this study were to assess the
magnitude and variability of nutrient depletion in the
smallholder banana systems that are characterized by
low external input use, but large variability in agro-
ecological conditions and crop density management.
We studied plant nutrient uptake and recycling under
contrasting agro-ecological sites but with similar crop
management conditions across Rwanda in a series of
researcher-managed banana density trials.
Materials and methods
Trial sites
Plant density trials were established in three agro-
ecological sites of Rwanda (Kibungo, Rubona and
Ruhengeri) that differed distinctly in terms of altitude,
temperature, annual rainfall and soil type (Table 1).
Kibungo, which is located in the eastern part of the
lowlands of Rwanda, is characterized by weathered
soils [i.e. Nitisols (FAO 1987)] derived from schistose
materials. Rubona is located in the mid-altitude agro-
ecological zone of Rwanda and characterized by poor
soils [i.e. Acrisols (FAO 1987)] derived from granitic
parent material. Ruhengeri, which is located in the
north west of Rwanda, is characterized by young,
volcanic ash soils [i.e. Andosols (FAO 1987)]. All
three sites have a bimodal rainfall pattern, Kibungo
being the driest (931 mm year-1), Ruhengeri the
wettest (1,366 mm year-1) and Rubona in between
(1,037 mm year-1).
Trial set up and management
Three East African highland banana cultivars, includ-
ing two cooking cultivars (‘‘Ingaju’’ and ‘‘Injagi’’) and
one beer cultivar (‘‘Intuntu’’), were used in this study.
Banana plants were established from young (\1.0 m
height) and healthy-looking sword suckers. Corms of
suckers were pared and subjected to hot water
treatment to reduce nematode infestation in the plant
and favour sucker establishment and a high survival
rate (Speijer et al. 2000; Elsen et al. 2004). The
experiment had a randomized complete block design
with five densities (plants ha-1): 1,428 at a spacing of
3.5 m 9 2.0 m, 2,500 at 2.0 m 9 2.0 m, 3,333 at
Table 1 General characteristics of the Kibungo, Rubona and Ruhengeri trial sites
Characteristics Kibungo Rubona Ruhengeri
Latitude S02�12082500 S02�29032700 S01�29020400
Longitude E30�35031100 E029�46047500 E029�39034800
Altitude (m) above sea level 1,572 1,727 1,875
Rainfall distribution (bimodal)
First rains March–May March–May March–May
Second rains October–December October–December October–December
Mean annual rainfall (mm year-1)
2007 929 1,196 1,432
2008 895 1,213 1,392
2009 970 707 1,275
Mean annual temperature (�C)
2007 19.4 19.1 16.2
2008 19.1 18.9 16.0
2009 19.7 19.1 16.6
Dry period (days): mean and (range)a 86 (31–123) 59 (0–123) 15 (0–62)
Topography (% slope) Gentle (2) Gentle (3) Gentle (1)
Soil types/parent materiala Nitisol/shale Acrisol/granitic rocks Andosol/volcanic ash
Fertility rating (agricultural value)b Moderate–good Poor–moderate Good–Excellent
a Soil type classification by FAO (1987), b Data adapted from Verdoodt and Van Ranst (2003)
Nutr Cycl Agroecosyst
123

1.5 m 9 2.0 m, 4,444 at 1.5 m 9 1.5 m and 5,000 at
1.0 m 9 2.0 m. There were three replicates per site
and treatment with a plot size of 14 m 9 12 m and
planting pits of 45 9 45 9 45 cm. A basal dressing of
6 kg of cattle manure was applied to each planting pit.
Thereafter, neither external mulch nor inorganic
inputs were applied. Throughout the trial period,
desuckering as needed was used to maintain a
maximum of three plants per mat, i.e. one mother,
one follower as first ratoon and one sucker as second
ratoon. Residues of weeds and harvested plants in the
plots were retained and left as self-mulch in the plots.
Soil and plant analyses
Prior to trial establishment, five soil subsamples were
collected per plot at 0-30 cm depth and mixed to make
single composite samples per plot. For each plant
density plot, a quadrant of 4 m2 (2 m 9 2 m) was
marked in the centre using labelled sticks that
remained throughout the period of the experiment.
At flowering and the first harvest (i.e. 21.5 months),
soil subsamples were also collected at 0–30 cm in the
above mentioned quadrant and mixed to make single
composite samples. Subsequent subsamples were also
collected at the end of the trial (i.e. 3.5 years) and
mixed as previously. Soil samples were oven dried at
105 �C for 48 h, ground and passed through a 2.0 mm
sieve and analyzed for soil pH (1:2.5 sediment: water
suspension), particle size distribution (hydrometer
method), soil organic carbon (Walkley–Black proce-
dure), total N (micro-Kjeldhal digestion), available P
(Mehlich-3 solution), exchangeable Ca, Mg and K
(ammonium acetate solution) (Okalebo et al. 2003).
At the harvest of the plant crop, plant subsamples
were collected from the pseudostem, leaves, peduncle
and fingers to determine the total nutrient mass
fractions in the different plant parts. Pseudostem
subsamples (a pie of a 5 cm wide pseudostem disk)
were taken at upper, middle and lower parts of
harvested pseudostems, so as to get an appropriate
composite sample representing the entire pseudostem.
Leaf subsamples of 10 by 10 cm were collected from
the entire upper third leaf of three randomly selected
harvested plants and composited for each density
treatment. Peduncle subsamples (a piece of 10 cm
length) were chopped and a composite sample was
made. Banana finger subsamples were obtained from
upper, middle and lower hands. The skin and pulp of
the fingers were not separated. Finger subsamples of
each part were bulked, weighed, chopped and dried in
an oven at 105 �C for 48 h. All dried plant samples
were ground and sieved to \ 2 mm particle size. The
analytical methods used were as described by Okalebo
et al. (2003). Total nutrient content in plant parts was
calculated from N, P, K, Ca and Mg mass fractions
(g kg-1) in the pseudostem, finger, peduncle and leaf
biomass and the dry weights of the plant parts. Total
above ground biomass (t ha-1 year-1) was consisted of
leaves ? pseudostems and bunch yield (t ha-1 year-1)
was consisted of peduncle ? fingers.
Calculation of nutrient stocks and partial nutrient
balances
The nutrients N, P, K, Ca and Mg were considered in
the input–output model because they are the most
limiting in the East African highland region (Wairegi
et al. 2010). Soil nutrient stocks were the nutrients
present in the top 30 cm of soil and considered as the
total amount of nutrients present in the organic matter
fraction, the adsorbed phase and in the soil solution
(van den Bosch et al. 1998). Partial nutrient balances
were calculated using input and output calculation
model which is adapted from Smaling et al. (1993)
(Table 2). In this study, no mineral fertilizer was
applied. The nutrient inputs were cattle manure (IN1)
added at planting time. Those inputs were calculated
from the nutrient content in the manure and the
quantity applied per hectare for a 30 cm soil depth
(Table 3). The outputs in the harvested bunches
(OUT1) were calculated by multiplying the quantities
of dry matter with the nutrient mass fractions for N, P,
K, Ca and Mg. The partial nutrient balances (kg ha-1 -
year-1) were calculated from IN1-OUT1.
Table 2 Nutrient flows for the calculation of partial nutrient
balances at plant density plot level (adapted from Smaling et al.
1993)
Flows Calculations
Inputs
IN1: organic input (cattle
manure)
Nutrient content of
manure 9 quantity applied
Outputs
OUT1: harvested
product (bunches)
Nutrient content in harvested
bunches 9 yield
Nutr Cycl Agroecosyst
123

Statistical analyses
Data sets on nutrient mass fractions and nutrient
balances were subjected to analysis of variance using
JMP statistical discovery software version 10.0 (SAS
Institute Inc., NC, USA). All data were firstly analyzed
for three way interaction (site 9 cultivar 9 density).
We have chosen this statistical model because densi-
ties are nested within sites, and included site in the
same statistical analysis to be able to know whether the
differences between sites are significant statistically.
Significant effects for most observations (i.e. site,
density and site 9 density interaction) were discussed
and Student’s test at p = 0.05 was used to separate the
means of significantly different parameters. Using
SPSS 16.0 (Statistical Package for Social Sciences) for
Windows, data on nutrient stocks over a trial period
were subjected to repeated measures with time as the
repeated factor to look at significances between times.
Results
Initial soil nutrient contents and stocks
All soils had an optimum pH for banana cultivation,
ranging from 5.7 to 6.2 (Table 4).
Average soil organic matter and total N values were
higher at Kibungo (6.1 and 0.3 %) than Rubona (2.7
and 0.2 %) and Ruhengeri (2.9 and 0.2 %). Ca, Mg
and K were higher at Kibungo compared with other
sites. The high N content (at 0-30 cm soil depth) at
Kibungo sites can partially be explained by the fact
that site was under natural fallow (for over 6 years)
with species with perennial grass and shrubs such as
Tithonia diversifolia and Lantana camara which
might have a high content of C and N, resulting in
soil organic matter accumulation from aboveground
organic inputs, root residues and exudates (Puttaso
et al. 2011). Furthermore, the difference in soil organic
matter (SOM) content between sites might due to
differences in environmental conditions (e.g., rainfall
and temperature), soil characteristics, chemical com-
position of the residues and presence of decomposer
organisms. High and low of SOM contents at Kibungo
and Rubona, respectively, can also be associated with
high percentage of clay particles with SOM encapsu-
lated in micro- and meso-aggregates, and high sand
fraction with non-protected organic material (Puttaso
et al. 2011) due to low cation exchange capacity
(CEC). The Ruhengeri site was cultivated with maize
and Irish potatoes prior to the trial installation. The
ratio of exchangeable K to Mg at Ruhengeri is 0.4:1
and higher than the optimal of 0.3:1 (Delvaux 1995),
but lower at Rubona (0.1:1) and equals to the optimum
at Kibungo (0.3:1). Nitrogen stocks are higher at
Kibungo, followed by Rubona and lastly Ruhengeri
while the reverse occurred for phosphorus. Potassium,
Ca and Mg stocks are higher in Kibungo compared to
other sites.
Internal flow through above ground biomass
Site 9 density interactions differed significantly
(p \ 0.05) in terms of nutrients (kg ha-1 year-1)
contained in above ground biomass (ABG = Pseu-
dostems ? leaves). Nutrients contained in ABG dif-
fered significantly between sites, amounts being
Table 3 Cattle manure analysis and its nutrient inputs (IN1) at the Kibungo, Rubona and Ruhengeri trials sites
Plant density plot Applied manure (kg ha-1) Mean values of cattle manure nutrient content (%)
N P K Ca Mg
0.49 0.31 1.65 0.85 0.51
Nutrient inputs (IN1) (kg ha-1 year-1) for 0–30 cm soil depth
N P K Ca Mg
1,428 8,568 28.0 17.7 94.2 48.6 29.1
2,500 15,000 49.0 31.0 165.0 85.0 51.0
3,333 19,998 65.3 41.3 220.0 113.3 68.0
4,444 26,664 87.1 55.1 293.3 151.1 90.7
5,000 30,000 98.0 62.0 330.0 170.0 102.0
Nutr Cycl Agroecosyst
123

significantly greater at the Ruhengeri high rainfall site
(Fig. 1), where ABG is higher compared to the other
sites (data not shown). At all sites, an increase in plant
density was associated with a significant increase in
nutrients contained in ABG, whereby high plant
densities (4,444–5,000 plants ha-1) recorded nutrients
roughly double those of lower densities (1,428–2,500
plants ha-1) (Fig. 1). As plant densities did not differ
significantly for the nutrient mass fractions of N, P, K,
Ca and Mg (Table 5), the significant differences
between plant densities probably result from larger
amounts of ABG caused by the increase in plant
density. This is supported by significant positive
correlations between biomass yields and the amounts
of nutrients contained in those biomasses (data not
shown).
Nutrient contained in bunch yield
Plant densities did not differ significantly for the nutrient
mass fractions of N, P, K, Ca and Mg in the fruit
(Table 5). However, nutrient contained in bunch yield
(fingers ? peduncle) differed significantly (p \ 0.05)
and the amounts of nutrients increased with plant
density at Rubona and Ruhengeri whilst nutrient content
decreases at Kibungo (Fig. 2). In general, the higher
densities of 4,444 and 5,000 plants ha-1 registered
larger nutrient exports than the lower densities. Potas-
sium was exported in large amounts, followed by N, Ca,
Mg and lastly P at all sites. Bunch yield also correlated
positively with nutrient exports with the strongest
correlation at Rubona (r = 0.76–0.92), followed by
Kibungo (r = 0.64–0.90) and lastly Ruhengeri
(r = 0.49–0.80) (data not shown). High correlations
between bunch yield and nutrient exports at Rubona
suggest the latter can rapidly be depleted than others if
nutrient exports are not offset by recycled nutrient-rich
biomass or by other means of replenishing soil fertility.
Nutrient stocks over a trial period
Figure 3 shows that over a trial period (i.e. at the end
of the trial), nutrient stocks differed significantly
between sites but were not influenced by plant density
(Table 6) despite larger amount of nutrients contained
in leaves and pseudostems. Nitrogen stocks were
considerably higher on soils that have high clay
content (e.g. Kibungo), probably due encapsulated
Table 4 Mean values of soil properties in the 0–30 cm layer, prior to trial establishment at the Kibungo, Rubona and Ruhengeri sites
Parameters Kibungo Rubona Ruhengeri
Soil pH (1:2.5 sediment–water) 5.7 (0.2) b 5.8 (0.1) b 6.2 (0.0) a
OM (%) 6.1 (1.8) a 2.7 (0.1) b 2.9 (0.0) b
N (%) 0.3 (0.1) a 0.2 (0.0) b 0.2 (0.0) b
P (mg kg-1) 4.4 (0.5) c 9.9 (2.0) b 37.8 (3.1) a
Ca (cmol kg-1) 3.3 (0.3) a 2.4 (0.5) c 3.0 (0.1) b
Mg (cmol kg-1) 1.2 (0.1) a 0.7 (0.2) b 0.6 (0.0) c
K (cmol kg-1) 0.3 (0.1) a 0.1 (0.1) c 0.2 (0.0) b
K/Mg (-) 0.3 (0.1) b 0.1 (0.1) c 0.4 (0.1) a
Sand (%) 11.4 (0.0) c 64.4 (0.0) a 50.4 (0.0) b
Clay (%) 71.3 (0.0) a 22.3 (0.0) c 23.3 (0.0) b
Silt (%) 17.3 (0.0) b 13.3 (0.0) c 26.3 (0.0) a
Soil textural classification Clay loam Sandy clay Sandy clay loam
Soil bulk density (kg m-3) 1,418 1,256 1,207
Soil nutrient stocks (kg ha-1)
N 12,686.4 (2,992.2) a 6,665.8 (181.2) b 5,712.0 (8.3) c
P 18.8 (2.2) c 44.0 (9.1) b 136.9 (11.2) a
K 560.0 (124.6) a 176.3 (113.5) c 332.6 (30.2) b
Ca 5,631.4 (479.4) a 4,310.7 (931.5) b 4,419.7 (175.9) b
Mg 1,194.4 (145.5) a 718.2 (261.4) b 488.3 (13.8) c
Mean values with the same letter within the row are not significantly different at p = 0.05. Standard deviations are in parentheses
Nutr Cycl Agroecosyst
123

SOM in micro- and meso-aggregates, followed by
soils with sandy soils with less clay content (e.g.
Ruhengeri and Rubona). Calcium, Mg and K were
strongly lower in sandy soils of Rubona compared
with the other sites. In general, N stocks were
considerably higher, followed by Ca, Mg and K.
Phosphorus stocks were dramatically lower at Kib-
ungo compared with the other sites, implying that
significant P deficiency.
Partial nutrient balances
Results in Table 7 show that partial nutrient balances
differed significantly between sites. In general, N and
K partial balances were negative and considerably
higher at the Ruhengeri high rainfall site, with its good
soil and high yields, followed by the Rubona moderate
rainfall site which is characterized by lower inherent
soil fertility. This implies differences in the magnitude
of nutrient depletion between sites. Table 7 also shows
that an increase in plant density was associated with
increasing negative N and K partial balances (i.e.
outflows were much higher than inflows), which
highlights the detrimental effect of high plant density
system in nutrient mining, whilst P, Ca and Mg partial
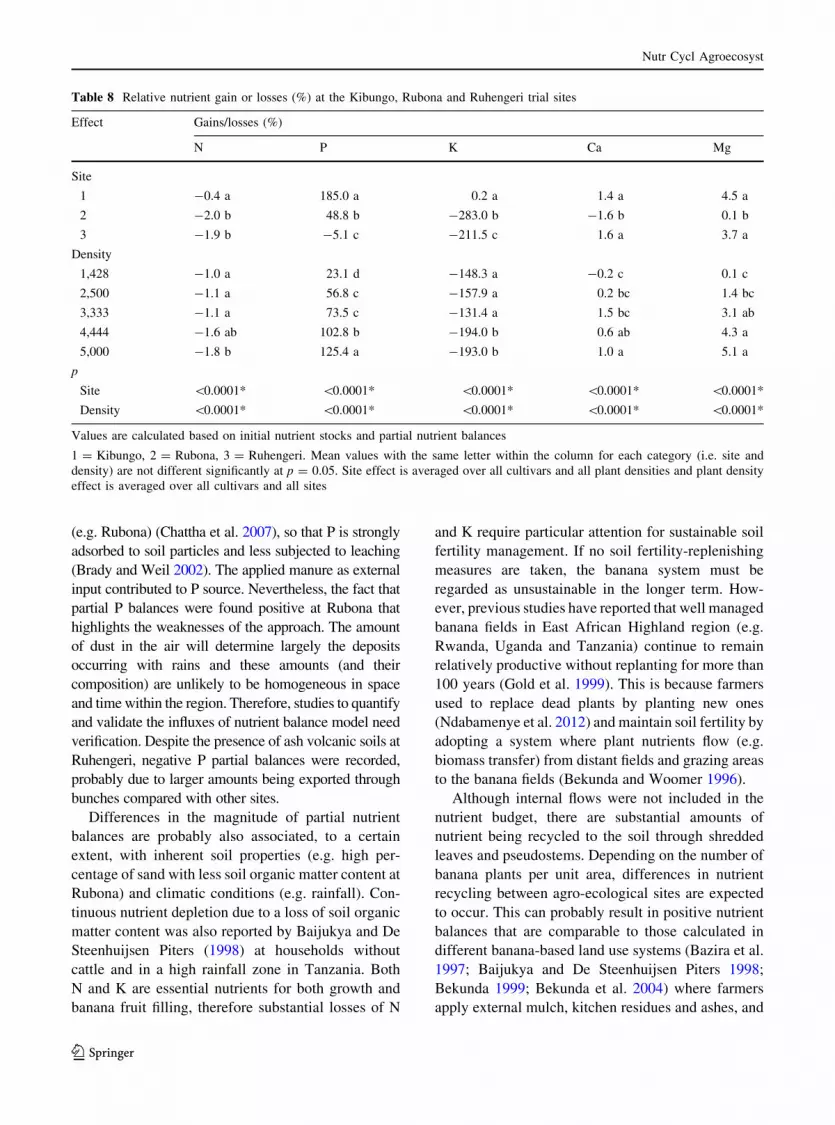
balances were positive. Table 8 shows nutrient mining
at three sites and under plant densities based on partial
nutrient balances. In general, N and K were strongly
mined for up to 2 % for N and more than 200 % at
Rubona and Ruhengeri whilst high P accumulation
0
500
1000
1500
2000
2500
0 1000 2000 3000 4000 5000 6000
N
Kibungo
Rubona
Ruhengeri
0
100
200
300
400
500
0 1000 2000 3000 4000 5000 6000
P
KibungoRubonaRuhengeri
0
500
1000
1500
2000
2500
3000
3500
4000
0 1000 2000 3000 4000 5000 6000
K
KibungoRubonaRuhengeri
0
200
400
600
800
1000
1200
1400
0 1000 2000 3000 4000 5000 6000
Ca
KibungoRubonaRuhengeri
0
100
200
300
400
500
600
700
0 1000 2000 3000 4000 5000 6000
Nut
rien
t con
tain
ed in
AB
G(k
g ha
-1yr
- 1)
Nut
rien
t con
tain
ed in
AB
G(k
g ha
-1yr
- 1)
Nut
rien
t con
tain
ed in
AB
G(k
g ha
-1yr
- 1)
Nut
rien
t con
tain
ed in
AB
G(k
g ha
-1yr
- 1)
Nut
rien
t con
tain
ed in
AB
G(k
g ha
-1yr
- 1)
Plant density (Plants ha-1)
Mg
Kibungo
Rubona
Ruhengeri
Fig. 1 Nutrients
(kg ha-1 year-1) contained
in above ground biomass
(pseudostems ? leaves)
(ABG) for site 9 density
interaction level at the
Kibungo, Rubona and
Ruhengeri sites
Nutr Cycl Agroecosyst
123

was found first at Kibungo, followed by Rubona.
Calcium and Mg were generally accumulated.
Discussion
Above ground biomass as internal flow
Results on nutrients contained in ABG suggest their largest
contribution as sinks of nutrients so that a high plant
density places a considerable nutrient recycling effect. The
quantities of nutrients contained in shredded leaves and
pseudostems are similar to those reported in the region
under traditional banana farming systems but considerably
lower than those reported under fertilizer conditions
(Nyombi et al., 2010). Stover and Simonds (1987) reported
1.0 % of N and 7.7 % of K in pseudostems and 2.8 % of N
and 4.9 % of K in leaves for an estimated average of
9.2 t ha-1 year-1of pseudostems and 6.1 t ha-1 year-1
of leaves. Delstanche (2011) reported the foliar total
nutrient contents for N, P, K, Ca and Mg between 1.49 and
3.11 % N, 0.06–0.47 % P, 1.95–4.74 % K, 0.27–1.41 %
Ca and 0.18–0.79 % Mg. Obviously, decomposing
shredded leaves and pseudostems may represent a large
(2.1–3.0 % of N in total biomass) N recycling for the
subsequent ratoon crops under high plant density.
Nutrient removal through bunches
Effect of site 9 density on nutrient removal through
harvested bunches highlights the detrimental effect of
high plant density on soil fertility. The exported nutrient
amounts (mainly for N and K) are also consistently
higher than those reported in the East Africa region and
worldwide literature. The largest amounts of N
(400 kg N ha-1 year-1) and K (1,000 kg K ha-1 -
year-1) were found to be incorporated in the banana
fruit (Turner et al. 1989). The current study showed that
a proportion of 13.8–22.5 % of the N is exported in
bunches at harvest. Teixeira et al. (2008) and Raphael
(2006) reported a figure of 30 %. Bazira et al. (1997)
reported net removal of 52.6, 9.3 and 58.0 kg ha-1 -
year-1 of N, P and K, respectively in banana farms in
Central Uganda. Lopez (1999) estimated from pub-
lished data that a highly productive plantation
(70 t ha-1 year-1) exports 126 kg N ha-1, 15 P and
399 K annually. The values of 256 N, 12.3 P and
960 kg K ha-1 are reported in 15 t of banana (Lekasi
et al. 2001). Based on average literature values for
AAA-genomic group bananas worldwide, the calcu-
lated quantity of nutrient removed by the fruit (in
kg ha-1) was 104 kg N, 10 kg P, 285 kg K and
13 kg Mg (van Asten et al. 2004). In fact, banana is a
Table 5 Mean values for the effect of site and plant density on nutrient mass fraction in plant parts
Effect Nutrient content in ABG (g kg-1)a Nutrient content in fruit (g kg-1)b
N P K Ca Mg N P K Ca Mg
Site
1 21.1 b 1.9 c 17.6 10.5 10.3 a 18.3 b 1.8 c 52.3 c 8.8 b 3.8 b
2 21.1 b 2.8 b 38.4 15.1 7.4 b 26.3 a 2.7 b 73.3 b 23.4 a 8.9 a
3 30.0 a 3.8 a 64.7 13.0 6.3 c 17.3 b 4.6 a 84.6 a 4.1 c 4.8 b
Density
1,428 26.7 a 2.9 a 38.9 a 12.7 8.2 a 22.8 a 3.1 a 68.7 a 10.7 a 6.0 a
2,500 24.1 a 2.7 a 37.2 a 12.4 7.9 a 21.3 a 2.8 a 70.1 a 12.9 a 6.0 a
3,333 21.2 a 2.7 a 45.2 a 12.8 7.6 a 18.7 a 3.4 a 73.7 a 12.1 a 5.8 a
4,444 23.0 a 2.7 a 40.5 a 12.9 8.5 a 19.7 a 3.0 a 68.6 a 12.1 a 5.6 a
5,000 25.2 a 3.1 a 39.5 a 13.4 7.7 a 20.7 a 3.0 a 69.1 a 12.8 a 6.0 a
p
Site 0.0011* \0.0001* \0.0001* \0.0001* \0.0001* \0.0001* \0.0001* \0.0001* \0.0001* \0.0001*
Density 0.5783 0.5828 0.6384 0.9450 0.3206 0.1045 0.4474 0.7360 0.0850 0.8633
S 9 D 0.6450 0.0948 0.5298 0.9815 0.5167 0.5232 0.2111 0.7662 0.7714 0.7276
a Leaves ? pseudostems, b Peduncle ? fingers. AGB above ground biomass dry matter. S 9 D = site 9 density interaction.
1 = Kibungo, 2 = Rubona, 3 = Ruhengeri. * Significant effect (Pr [ F, p B 0.05). Mean values with the same letter within the
column for each category (i.e. site and density) are not different significantly at p = 0.05. Site effect is averaged over all cultivars and
all plant densities and plant density effect is averaged over all cultivars and sites
Nutr Cycl Agroecosyst
123

perennial crop which assimilates large amounts of
nutrients that are recycled into the soils; our results
imply that increasing plant density may cause contin-
uous nutrient depletion due to those larger nutrient
exports through bunches. Under high banana planting
density system, bunch yields consistently increased
with an increase in plant density (Ndabamenye et al.
2013).
Partial nutrient balances and the sustainability
of the system
The strong negative partial nutrient balances suggest
that there are less nutrient inputs to offset nutrient
removal in bunches and uncounted nutrient losses
0
50
100
150
200
250
300
350
0 1000 2000 3000 4000 5000 6000
N
KibungoRubonaRuhengeri
0
10
20
30
40
50
60
70
80
0 1000 2000 3000 4000 5000 6000
PKibungoRubonaRuhengeri
0
200
400
600
800
1000
1200
1400
1600
0 1000 2000 3000 4000 5000
K
KibungoRubonaRuhengeri
0
50
100
150
200
250
300
0 1000 2000 3000 4000 5000 6000
Ca
KibungoRubonaRuhengeri
0
20
40
60
80
100
120
0 1000 2000 3000 4000 5000 6000
Nut
rien
t con
tain
ed in
bun
ch y
ield
(kg
ha-1
yr-1
)
Nut
rien
t con
tain
ed in
bun
ch y
ield
(kg
ha-1
yr-1
)N
utri
ent c
onta
ined
in b
unch
yie
ld(k
g ha
-1yr
-1)
Nut
rien
t con
tain
ed in
bun
ch y
ield
(kg
ha-1
yr-1
)N
utri
ent c
onta
ined
in b
unch
yie
ld(k
g ha
-1yr
-1)
Plant density (Plants ha -1)
Mg
KibungoRubonaRuhengeri
Fig. 2 Nutrients
(kg ha-1 year-1) contained
in bunch yield
(fingers ? peduncle) for
site 9 density interaction
level at the Kibungo,
Rubona and Ruhengeri sites
a
c ab
b
a
c
b c
c
c
b
a a
a
b
0
1000
2000
3000
4000
5000
6000
7000
8000
9000
10000
11000
12000
13000
14000
N P K Ca Mg
Nut
rien
t sto
cks
(kg
ha-1
)
Kibungo
Rubona
Ruhengeri
Fig. 3 Nutrient stocks (kg ha-1) over a trial period (i.e. at the
end of the trial) at the Kibungo, Rubona and Ruhengeri sites.
Values are averages over all plant densities and all cultivars
Nutr Cycl Agroecosyst
123

Ta
ble
6E
ffec
to
fp
lan
td
ensi
tyo
nso
iln
utr
ien
tst
ock
s(k
gh
a-1)
atfl
ow
erin
g,
har
ves
to
fth
ep
lan
tcr
op
and
end
of
the
tria
l
Sit
eD
ensi
tyF
low
erin
gH
arv
est
En
do
ftr
ial
NP
KC
aM
gN
PK
Ca
Mg
NP
KC
aM
g
Kib
un
go
1,4
28
11
,86
93
25
53
,92
18
51
11
,26
05
15
01
0,3
84
1,6
00
10
,95
21
37
46
,74
32
,27
6
2,5
00
11
,55
95
31
33
,94
28
59
10
,70
34
17
11
1,5
49
1,6
30
13
,26
21
27
25
,96
81
,88
9
3,3
33
11
,13
37
35
43
,99
79
05
10
,71
34
19
01
0,1
88
1,4
90
12
,74
41
39
85
,82
51
,86
4
4,4
44
11
,32
84
27
24
,17
79
87
11
,72
25
12
31
0,8
02
1,5
87
12
,21
52
21
75
,93
62
,19
5
5,0
00
11
,19
14
31
53
,77
78
09
12
,41
34
13
71
0,6
14
1,5
79
13
,03
53
29
45
,98
22
,02
2
p=
0.0
5N
SN
SN
SN
SN
SN
SN
SN
SN
SN
SN
SN
SN
SN
SN
S
Ru
bo
na
1,4
28
7,7
21
50
B1
82
2,8
02
48
96
,10
73
6B
11
83
,57
9C
57
4B
7,5
14
10
23
07
2,5
20
56
6
2,5
00
8,0
73
57
B1
99
2,8
21
50
26
,97
06
8A
B1
74
4,2
65
AB
70
2A
B8
,10
16
64
74
3,0
22
72
0
3,3
33
7,8
50
67
B2
02
2,9
99
52
06
,05
64
5B
13
03
,79
8B
C6
04
AB
8,9
33
10
76
14
3,2
20
67
3
4,4
44
7,3
74
12
7B
25
82
,99
25
57
6,7
97
92
B2
16
4,3
90
A7
43
A9
,02
41
32
85
23
,09
77
10
5,0
00
8,2
46
84
AB
18
93
,02
35
51
6,8
58
69
AB
15
64
,36
2A
B6
72
AB
9,0
71
77
54
93
,51
78
52
p=
0.0
5N
S0
.04
8*
NS
NS
NS
NS
0.0
5*
NS
0.0
20
*0
.00
7*
NS
NS
NS
NS
NS
Ru
hen
ger
i1
,42
81
2,6
64
16
23
25
9,7
12
1,0
31
10
,97
33
56
10
81
2,8
64
2,3
02
11
,83
51
79
1,0
48
4,9
58
86
1
2,5
00
11
,75
81
10
25
51
0,0
56
1,0
38
9,9
26
28
67
91
0,9
32
1,8
75
10
,87
11
45
71
24
,84
99
35
3,3
33
12
,05
72
13
19
47
,11
97
42
10
,38
73
75
11
11
2,3
70
2,2
24
11
,47
61
50
80
74
,39
17
94
4,4
44
12
,73
41
49
22
88
,81
48
53
11
,15
03
15
98
11
,08
91
,98
51
1,6
66
17
41
,05
14
,95
89
19
5,0
00
13
,14
49
81
94
9,1
00
87
21
1,5
43
24
77
59
,26
21
,51
41
1,7
62
13
59
45
4,8
54
88
7
p=
0.0
5N
SN
SN
SN
SN
SN
SN
SN
SN
SN
SN
SN
SN
SN
SN
S
*S
ign
ifica
nt
effe
ct(P
r[
F,
p\
0.0
5)
of
pla
nt
den
sity
;N
Sn
ot
sig
nifi
can
t(p
[0
.05
).M
ean
val
ues
wit
hth
esa
me
lett
erw
ith
inth
eco
lum
nfo
rar
en
ot
dif
fere
nt
sig
nifi
can
tly
at
p=
0.0
5
Nutr Cycl Agroecosyst
123

through natural processes. These differences in mag-
nitude of partial nutrient balances are consistently
higher, suggesting that soil fertility replenishment
measures should be taken for a significant manage-
ment strategy that reduces nutrient mining. In Uganda
(e.g. the Lake Victoria region), Bekunda (1999)
reported 82 % of the farmers sell banana fruits, which
results in net resource outflows. Calculated negative N
and K partial balances at Rubona and Ruhengeri are
alarming compared with the estimated nutrient depletion
rate for all African countries, which ranges from
-14 kg NPK ha-1 year-1 to -136 kg NPK ha-1 year-1
(Stoorvogel and Smaling 1990; Smaling et al. 1993).
Haileslassie et al. (2005) reported the values of 122 kg
N ha-1 year-1, 13 kg P and 82 kg K as national
depletion rates in Ethiopian mixed farming systems.
The partial P balances were positive and significantly
higher at Kibungo than Rubona. This difference might be
attributed to the fact that soils with high clay content
(e.g. Kibungo) tend to fix more P than sandy soils
Table 7 Mean values for the effect of site, plant density and the interaction site 9 plant density on partial nutrient balances
Effect Partial nutrient balance (kg ha-1 year-1) IN1-OUT1
N P K Ca Mg
Site
1 -2.6 a 34.4 a 1.0 a 79.0 a 53.6 a
2 -135.2 b 20.6 b -344.1 b -69.0 b -1.0 c
3 -113.0 b -6.9 c -697.9 c 69.7 a 18.0 b
Density
1,428 -70.0 a 3.6 d -230.4 a -2.7 c 1.0 d
2,500 -71.4 a 13.1 c -292.8 ab 12.8 bc 14.3 cd
3,333 -70.2 a 12.7 c -364.7 ab 33.7 ab 25.2 bc
4,444 -100.5 a 22.1 b -447.6 b 34.1 ab 34.5 ab
5,000 -106.0 a 28.5 a -399.5 b 55.0 a 42.6 a
Site 9 density
1 9 1,428 -26.3 abc 12.5 de -67.9 ab 25.2 cd 17.9 cdef
1 9 2,500 -3.5 ab 25.5 b -20.2 ab 58.4 bc 39.5 bc
1 9 3,333 -10.3 ab 32.8 b -82.2 ab 69.4 bc 50.0 b
1 9 4,444 -8.2 ab 46.1 a 37.8 a 105.9 ab 74.2 a
1 9 5,000 -35.4 abc 55.1 a 117.3 a 135.9 a 86.6 a
2 9 1,428 -124.3 def 2.0 ef -332.0 bcd -63.9 e -21.3 g
2 9 2,500 -119.4 def 14.2 cd -322.1 bcd -69.8 e -5.3 fg
2 9 3,333 -85.7 cd 24.8 bc -309.7 bcd -38.2 de 15.7 def
2 9 4,444 -176.0 ef 27.5 b -484.7 cde -100.4 e -4.3 fg
2 9 5,000 -170.7 ef 34.2 b -272.0 bc -72.4 e 10.1 ef
3 9 1,428 -59.5 bcd -3.6 f -291.3 bcd 30.6 c 6.5 f
3 9 2,500 -91.3 cd -0.5 f -556.5 de 49.9 bc 8.7 ef
3 9 3,333 -114.5 de -19.6 g -702.0 ef 69.8 bc 10.0 ef
3 9 4,444 -117.2 def -7.2 f -895.7 fg 96.8 b 33.8 bcd
3 9 5,000 -182.5 f -3.6 f -1,043.7 g 101.5 b 30.9 bcde
p for the effect of
site \0.0001* \0.0001* \0.0001* \0.0001* \0.0001*
Density 0.154NS \0.0001* 0.0460* 0.0240* \0.0001*
Site 9 density 0.0117* \0.0001* 0.0003* 0.0468* 0.0203*
1 = Kibungo, 2 = Rubona, 3 = Ruhengeri. * Significant effect (Pr [ F, p B 0.05); NS not significant. Mean values with the same
letter within the column for each category (i.e. site, density and site 9 density) are not different significantly at p = 0.05. Site effect
is averaged over all cultivars and all plant densities and plant density effect is averaged over all cultivars and sites
Nutr Cycl Agroecosyst
123
(e.g. Rubona) (Chattha et al. 2007), so that P is strongly
adsorbed to soil particles and less subjected to leaching
(Brady and Weil 2002). The applied manure as external
input contributed to P source. Nevertheless, the fact that
partial P balances were found positive at Rubona that
highlights the weaknesses of the approach. The amount
of dust in the air will determine largely the deposits
occurring with rains and these amounts (and their
composition) are unlikely to be homogeneous in space
and time within the region. Therefore, studies to quantify
and validate the influxes of nutrient balance model need
verification. Despite the presence of ash volcanic soils at
Ruhengeri, negative P partial balances were recorded,
probably due to larger amounts being exported through
bunches compared with other sites.
Differences in the magnitude of partial nutrient
balances are probably also associated, to a certain
extent, with inherent soil properties (e.g. high per-
centage of sand with less soil organic matter content at
Rubona) and climatic conditions (e.g. rainfall). Con-
tinuous nutrient depletion due to a loss of soil organic
matter content was also reported by Baijukya and De
Steenhuijsen Piters (1998) at households without
cattle and in a high rainfall zone in Tanzania. Both
N and K are essential nutrients for both growth and
banana fruit filling, therefore substantial losses of N
and K require particular attention for sustainable soil
fertility management. If no soil fertility-replenishing
measures are taken, the banana system must be
regarded as unsustainable in the longer term. How-
ever, previous studies have reported that well managed
banana fields in East African Highland region (e.g.
Rwanda, Uganda and Tanzania) continue to remain
relatively productive without replanting for more than
100 years (Gold et al. 1999). This is because farmers
used to replace dead plants by planting new ones
(Ndabamenye et al. 2012) and maintain soil fertility by
adopting a system where plant nutrients flow (e.g.
biomass transfer) from distant fields and grazing areas
to the banana fields (Bekunda and Woomer 1996).
Although internal flows were not included in the
nutrient budget, there are substantial amounts of
nutrient being recycled to the soil through shredded
leaves and pseudostems. Depending on the number of
banana plants per unit area, differences in nutrient
recycling between agro-ecological sites are expected
to occur. This can probably result in positive nutrient
balances that are comparable to those calculated in
different banana-based land use systems (Bazira et al.
1997; Baijukya and De Steenhuijsen Piters 1998;
Bekunda 1999; Bekunda et al. 2004) where farmers
apply external mulch, kitchen residues and ashes, and
Table 8 Relative nutrient gain or losses (%) at the Kibungo, Rubona and Ruhengeri trial sites
Effect Gains/losses (%)
N P K Ca Mg
Site
1 -0.4 a 185.0 a 0.2 a 1.4 a 4.5 a
2 -2.0 b 48.8 b -283.0 b -1.6 b 0.1 b
3 -1.9 b -5.1 c -211.5 c 1.6 a 3.7 a
Density
1,428 -1.0 a 23.1 d -148.3 a -0.2 c 0.1 c
2,500 -1.1 a 56.8 c -157.9 a 0.2 bc 1.4 bc
3,333 -1.1 a 73.5 c -131.4 a 1.5 bc 3.1 ab
4,444 -1.6 ab 102.8 b -194.0 b 0.6 ab 4.3 a
5,000 -1.8 b 125.4 a -193.0 b 1.0 a 5.1 a
p
Site \0.0001* \0.0001* \0.0001* \0.0001* \0.0001*
Density \0.0001* \0.0001* \0.0001* \0.0001* \0.0001*
Values are calculated based on initial nutrient stocks and partial nutrient balances
1 = Kibungo, 2 = Rubona, 3 = Ruhengeri. Mean values with the same letter within the column for each category (i.e. site and
density) are not different significantly at p = 0.05. Site effect is averaged over all cultivars and all plant densities and plant density
effect is averaged over all cultivars and all sites
Nutr Cycl Agroecosyst
123

livestock manure on their fields with an assumption
that atmospheric deposition may occur to certain
extent. There is evidence that nutrient mining is a
major threat in many African farming systems (Smal-
ing et al. 1993) and organic amendments are no longer
available to supply all nutrient needs (Probert et al.
1992) due to land intensification. Therefore, the
negative nutrient balances are expected to be more
detrimental on highly weathered soils due to the fact
that the percentage release of nutrients from mineral
weathering is really very small (i.e. 5 %) (Delstanche
2011). Caution should be taken for maximizing the use
of external organic inputs at large scale for not
depleting crop fields. Previous studies reported that
farmers can still maintain the nutrient levels by
recycling dead leaves and pseudostems, which are
continuously present on-farm, as well as banana peels
(Yamaguchi and Araki 2004). It is envisaged that large
scale investigation/management should tell more
about diversity of soil management strategies at farm
level to support farmer decision-making in prioritizing
options of nutrient recycling. As nutrient inputs
through biomass dry matter are considerably higher,
farmers who practice high banana plant density can
still use banana residues as extra-source of nutrients
for their home gardens and outfields that are generally
characterized by low inherent soil fertility. However,
there is a need to better understand the usefulness of
banana residues as a mean to offset fertilizer applica-
tion for smallholder farmers.
Although increasing plant density showed that
bunch yields per unit area were consistently higher
compared with plant low densities (data not shown),
our findings suggest that increasing plant density
accelerates soil nutrient depletion with more acute
losses in areas with moderate to relatively high
inherent soil fertility. Results on negative nutrient
balances and relative nutrient gain or losses for N and
K at Rubona and Ruhengeri support this. Furthermore,
an ‘order of magnitude’ estimate on the depletion rate
by quantifying available K, P and N in the 30 cm top
soil (by assuming that all these nutrients are easily
accessible) and their depletion rate (by considering
nutrient export in bunches) illustrates that K is a major
issue for the sustainability and nutrient recycling (e.g.
K soil stocks will be depleted at 5 years at Kibungo, at
three at Rubona and at four at Ruhengeri) (data not
shown). Therefore, as banana requires large amount of
potassium (Lahav 1995), recycling banana mulch is
not just considered as a promising practice for soil and
water conservation, but absolutely vital to maintain K
levels. Ulrich and Ohki (1973) reported that fertility of
soils with less than 100 kg ha-1 of exchangeable
potassium in the root zone should be improved by
potassium fertilizer.
Regarding the high amounts of nutrients contained
in decomposing shredded leaves and pseudostems,
there is an assumption that they get released while
being subsequently available to the root systems and
assimilated by ratoon crops. Wortmann et al. (1994)
reported that 6–9 weeks after harvest were needed to
account for 50–70 % of the initial N, K and Mg
released from harvested banana leaves and pseudos-
tems. There is evidence that some immediate nutrient
losses may occur, especially through leaching, which
will therefore deplete soil nutrient stocks.
Soil nutrient stocks did not vary significantly over a
trial period. This implies that nutrients contained in
decomposing shredded leaves and pseudostems
release and mineralize slowly, while being subse-
quently available to the root systems and assimilated
by ratoon crops. Wortmann et al. (1994) reported that
six to 9 weeks after harvest were needed to account for
50–70 % of the initial N, K and Mg released from
harvested banana leaves and pseudostems. Further-
more, there is an assumption that, after nutrients are
released from shredded leaves and pseudostems, some
immediate nutrient losses can occur, especially
through leaching, which will therefore deplete soil
nutrient stocks. This suggests that efficient soil fertility
management requires a critical understanding of
nutrient recycling of post-harvest residues. Conduct-
ing studies on how to maximize responses of applied
banana residues for the productivity of low input EAH
banana cropping systems is of importance. Therefore,
more research on quality and quantity of banana
residues should be a priority.
Implications of findings and research outlook
Previous studies have reported on soil fertility man-
agement under banana systems (e.g. Bekunda and
Woomer 1996; Baijukya et al. 2005) but little attention
was placed on plant density management. This study
attempted to show the first order of magnitude of
nutrient balance (i.e. partial nutrient balances) by
exploring the magnitude of potential effects of plant
density on nutrient mining. Numerous studies have
Nutr Cycl Agroecosyst
123

also reported on partial nutrient balances using
primary data collected at plot or farm level (e.g.
mineral fertilizer, organic manure and crop removal).
So often, those studies include inputs and outputs
through natural processes (Smaling et al. 1996).
However, due to uncertainties of the transfer functions
that are used (Faerge and Magid 2004), this study did
not evaluate full nutrient balances which are supposed
to provide potential effects of resource management
on soil nutrient stocks (van den Bosch et al. 1998) and
showing trends in nutrient depletion or enrichment.
We explored the magnitude of potential effect of plant
density in nutrient mining where the optimal planting
density that optimizes bunch and biomass production
should be taken into consideration. In the current
study, Ca and Mg, the macronutrients that are often
forgotten or rarely reported in few studies, were also
considered.
Results from this study are of importance towards
the sustainable management of resources such as
organic inputs in banana-based systems in the East
African highland region. It is important to consider
that the decomposition of shredded banana leaves and
pseudostems may be affected by ecological charac-
teristics that can result in nutrient losses from the agro-
ecosystem. Therefore, increasing of losses through
leaching in high rainfall area should bring more
attentions to researchers as banana residues are
subjected to fast decomposition under wet conditions
(e.g. Ruhengeri site). These residues conserve soil
moisture (Bananuka et al. 2000) and accelerate
biological activity (Zake et al. 2000; Bananuka et al.
2000). Furthermore, East African highland bananas
are often intercropped with annual crops (Baijukya
and De Steenhuijsen Piters 1998), mostly established
on lower slopes, valleys and in between-hill depres-
sions where soil water is higher during dry periods
(Rockstrom 2000) and different plant density scenar-
ios adapted. Shifting from small scale plot to large
scale, studies on large differences in nutrient depletion
or enrichment are of importance to streamline options
that can improve the productivity of EAH banana
cropping systems. Agricultural researchers, farmers
and policy makers should streamline options that
minimize nutrient losses with improved organic
matter management (e.g. use of inorganic and organic
nutrient resources). At high yields, the depletion rates
are so fast that it will be difficult to compensate these
through organic inputs, since these are quite limited as
well and so some degree of mineral fertilizer adoption
to counterbalance nutrient mining will be inevitable.
Lastly, considering the high amount of AGB that are
produced under high banana planting density, possi-
bilities of using pseudostems to feed animals can also
be looked out at regional scale.
Conclusions
This study showed that the nutrient depletion in
banana production systems is very high, due to the
large amount of nutrients exported through bunches.
This will result in an unsustainable system if the
amounts removed are not offset by soil fertility
replenishing means. Large negative balances for N
and K should attract attention from agricultural
researchers, farmers and policy makers in seeking
better ways to redress soil fertility, particularly for
Rubona and Ruhengeri soils. We conclude that partial
nutrient balances provide basic data for further soil
fertility replenishing measures that could be under-
taken for the long-tem productivity of EAH banana
cropping systems. Studies on how farmers should
improve banana yield through external organic and/or
in combination with inorganic inputs (i.e. manure and
mineral fertilizers) and ways to prioritize the invest-
ments to increase the profitability are needed.
Acknowledgments This study was carried out by the Rwanda
Agricultural Research Institute and the Consortium for
Improved Agriculture-based Livelihoods in Central Africa
research project, led by Bioversity International and funded by
the Directorate General for Development, Belgium. We would
like to thank staff at International Institute for Tropical Institute
Uganda for their assistance in plant and soil analysis. We thank
farmers at Ruhengeri who provided their land for the density
trials. Thanks to the CIALCA administrative team for providing
logistic support.
References
Baijukya FB, De Steenhuijsen Piters B (1998) Nutrient balances
and their consequences in the banana-based land use sys-
tems of Bukoba district, northwest Tanzania. Agric Ecosyst
Environ 71:147–158
Baijukya FP, Ridder NDE, Masuki KF, Giller KE (2005)
Dynamics of banana-based farming systems in Bukoba
District, Tanzania: changes in land use, cropping and cattle
keeping. Agric Ecosyst Environ 106:395–406
Bananuka JA, Rubaihayo PR, Zake JYK (2000) Effect of
organic mulches on growth, yield components and yield of
Nutr Cycl Agroecosyst
123

East African Highland bananas. Acta Hort (ISHS)
540:293–300
Bazira H, Bekunda MA, Tenywa JS (1997) Decomposition
characteristics of mixed grass and banana residues and
their effects on banana plant performance. In: Adipala E,
Tenywa JS, Ogenga-Latigo MW (eds) African Crop Sci-
ence Conference Proceedings, vol 3, 13–17 January, 1997.
Pretoria, pp 421–428
Bekunda MA (1999) Farmers’ responses to soil fertility decline
in banana-based cropping systems of Uganda. Managing
Africa’s soils No 4. IIED-London, p 17
Bekunda MA, Woomer PL (1996) Organic resource manage-
ment in banana-based cropping systems of the Lake Vic-
toria Basin, Uganda. Agric Ecosyst Environ 59:171–180
Bekunda MA, Ebanyat P, Nkonya E, Mugendi D, Msaky JJ
(2004) Soil fertility status, management, and research in
East Africa. East Afr J Rural Dev 20:94–112
Birabwa R, van Asten PJA, Alou IN, Taulya G (2010) Got
matooke (Musa spp.) for Christmas? Acta Hort
879:113–122
Brady NC, Weil RR (2002) The nature and properties of soils.
Prentice-Hall, New Jersey
Briggs L, Twomlow SJ (2002) Organic material flows within a
smallholder highland farming system of South West
Uganda. Agric Ecosyst Environ 89:191–212
Chattha TH, Yousaf M, Javeed S (2007) Phosphorus adsorption
as described by Freundlich adsorption isotherms under
rainfed conditions of Pakistan. Pak J Agri Sci 4:44
Cobo GJ, Dercon G, Cadisch G (2010) Nutrient balances in
African land use systems across different spatial scales: a
review of approaches, challenges and progress. Agric
Ecosyst Environ 136:1–15
Delstanche S (2011) Drivers of soil fertility in smallholder
banana systems in the African Great Lakes Region. Ph.D.
Dissertation. Catholic University of Leuven
Delvaux B (1995) Soils. In: Gowen S (ed) Bananas and plan-
tains. Chapman and Hall, London, pp 230–257
Dorel M, Achard R, Tixer P (2008) SIMBA-N: modelling
nitrogen dynamics in banana populations in wet tropical
climate. Application to fertilization management in the
Caribbean. Europ J Agron 29:38–45
Elsen A, Goossens B, Belpaire B, Neyens A, Speijer PR, De
Waele D (2004) Recolonisation by nematodes of hot water
treated cooking banana planting material in Uganda.
Nematol 6:215–221
Faerge J, Magid J (2004) Evaluating NUTMON nutrient bal-
ances in Sub-Saharan Africa. Nutr Cycl Agroecostyst
69:101–110
FAO (1987) ‘‘Soils of the World,’’ Food and Agriculture
Organization and United Nations Educational, Scientific
and Cultural Organization. Elsevier Science Publishing Co.
Inc., New York
Gaidashova SV, van Asten PJA, De Waele D, Delvaux B (2009)
Relationship between soil properties, crop management,
plant growth and vigour, nematode occurrence and root
damage in East African highland banana-cropping sys-
tems: a case study in Rwanda. Nematol 11:883–894
Gaidashova SV, van Asten PJA, Delvaux B, De Waele D (2010)
The influence of the topographic position within highlands
of Western Rwanda on the interactions between banana
(Musa spp. AAA-EA), parasitic nematodes and soil factors.
Sci Hort 125:316–322
Gold CS, Karamura EB, Kiggundu A, Bagamba F, Abera AMK
(1999) Monograph on geographic shifts in highland
cooking banana (Musa, group AAA-EA) production in
Uganda. Afr Crop Sci J 7:223–298
Haileslassie A, Priess J, Veldkamp E, Teketay D, Lesschen JP
(2005) Assessment of soil nutrient depletion and its spatial
variability on smallholders’ mixed farming systems in
Ethiopia using partial versus full nutrient balances. Agric
Ecosyst Environ 108:1–16
Haileslassie A, Priess JA, Veldkamp ED, Lesschen JP (2007)
Nutrient flows and balances at the field and farm scale:
exploring effects of land-use strategies and access to
resources. Agric Syst 94:459–470
Hauser S, van Asten PJA (2010) Methodological consideration
on banana (Musa spp.) yield determinations. In: Dubois T
et al. (eds) Proceedings of IC on banana and plantain in
Africa, vol 879, Acta Hort, pp 433–444
Lahav E (1995) Banana nutrition. In: Gowen S (ed) Bananas and
plantains. Chapman and Hall, London, pp 258–316
Lekasi JK, Woomer PL, Tenywa JS, Bekunda MA (2001) Effect
of mulching cabbage with banana residues on cabbage
yield, soil nutrient and moisture supply, soil biota and weed
biomass. Afr Crop Sci 9:499–506
Lopez A (1999) Conventional fertilization of Costa Rican
bananas and its relationship to sustainable production. In:
Rosales FE, Tripon SC, Cerna J (eds) Organic and/or
environmentally friendly banana production. International
Plant Genetic Resources Institute, Montpellier, pp 61–78
Nandwa SM, Bekunda MA (1998) Research on nutrient flows
and balances in East and South Africa: state of the art.
Agric Ecosyst Environ 71:5–18
Ndabamenye T, Van Asten PJA, Vanhoudt N, Blomme G,
Swennen R, Annandale JG, Barnard RO (2012) Ecological
characteristics influence farmer selection of on-farm plant
density and bunch mass of low input East African highland
banana (Musa spp.) cropping systems. Field Crops Res
135:126–136
Ndabamenye T, Van Asten PJA, Blomme G, Vanlauwe B,
Swennen R, Annandale JG, Barnard RO (2013) Ecological
characteristics and cultivar influence optimal plant density
of East African highland bananas (Musa spp. AAA-EA) in
low input cropping systems. Sci Hort 150:299–311
Nyombi K, Van Asten PJA, Leffelaar PA, Corbeels M, Kaizzi
CK, Giller KE (2009) Allometric growth relationships of
East Africa highland bananas (Musa AAA-EAHB) cv.
Kisansa and Mbwazirume. Ann Appl Biol 155:403–418
Nyombi K, van Asten PJA, Corbeels M, Taulya G, Leffelaar PA,
Giller KE (2010) Mineral fertilizer response and nutrient
use efficiencies of East African highland banana (Musaspp., AAA-EAHB, cv. Kisansa). Field Crops Res 117:
38–50
Oenema O, Kros H, de Vries W (2003) Approaches and
uncertainties in nutrient budgets: implications for nutrient
management and environmental policies. Eur J Agron
20:3–16
Okalebo JR, Gathua KW, Woomer PL (2003) Laboratory
methods of soil and plant analysis: a working manual, 2nd
edn. TSBF-CIAT and SACRED, Nairobi
Nutr Cycl Agroecosyst
123

Okumu MO, van Asten PJA, Kahangi E, Okech SH, Jefwa J,
Vanlauwe B (2011) Production gradients in smallholder
banana (cv. Cavendish) farms in Central Kenya. Sci Hortic
127:475–481
Probert ME, Okalebo JR, Simpson JR, Jones RK (1992) The role
of boma manure for improving soil fertility. In: Probert ME
(ed) A search for strategies for sustainable dryland crop-
ping in semi-arid eastern Kenya, vol 41. ACIAR Pro-
ceedings, pp 63–70
Puttaso A, Vityakon P, Saenjan P, Trelo-ges V, Cadisch G
(2011) Relationship between residue quality, decomposi-
tion patterns, and soil organic matter accumulation in a
tropical sandy soil after 13 years. Nutr Cycl Agroecosyst
89:159–174
Raphael L (2006) Biodisponibilite de l’azote en cultures
bananieres sur nitisol. Ph.D. Thesis. Universite des Antilles
et de la Guyane, Guadeloupe
Rockstrom J (2000) Water resources management in small-
holder farms in Eastern and Southern Africa: an overview.
Phys Chem Earth 25:275–283
Smaling EMA, Stoorvogel JJ, Windmeijer PN (1993) Calcu-
lating soil nutrient balances in Africa at different scales. II.
District scale. Fert Res 35:237–250
Smaling EMA, Fresco LO, de Jager A (1996) Classifying,
monitoring and improving soil nutrient stocks and flows in
Africa agriculture. Ambio 25:492–496
Smithson PC, McIntyre BD, Gold CS, Ssali H, Kashayij IN
(2001) Nitrogen and potassium fertilizers vs. nematode and
weevil effects on yield and foliar nutrient status of banana
in Uganda. Nutr Cycl Agroecosyst 59:239–250
Smithson PC, McIntyre BD, Gold CS, Ssali H, Night G, Okech S
(2004) Potassium and magnesium fertilizers on banana in
Uganda: yields, weevil damage, foliar nutrient status and
DRIS analysis. Nutr CyclAgroecosyst 69:43–49
Speijer PR, Gold CS, Goossens B, Karamura EB, Elsen A, De
Waele D (2000) Rate of nematode infestation of clean
banana planting material (Musa spp. AAA) in Uganda. In:
Craenen K, Ortiz R, Karamura EB, Vuylsteke DR (eds),
Proceedings of the first international conference on banana
and plantain for Africa, Kampala, Uganda, vol 549. Acta
Hort, pp 461–467
Stoorvogel JJ, Smaling EMA (1990) Assessment of soil nutrient
depletion in sub-Saharan Africa 1983–2000, vol I. Main
report. The Winand Staring Centre for Integrated Land,
Soil and Water Research (SC-DLO), Wageningen
Stover RH, Simonds NW (1987) Bananas, 3rd edn. Longman,
London, p 468
Teixeira LAJ, Van Raid B, Neto JEB (2008) Estimate nutrition
of Cavendish banana trees subgroup grown in the state of
Sao Paulo, Brazil. Rev Bras Frutic 30:540–545
Turner DW, Korawis C, Robson AD (1989) Soil analysis and its
relationship with leaf analysis and banana yield with spe-
cial reference to a study at Carnarvon, Western Australia.
Fruits 44:193–203
Ulrich A, Ohki K (1973) Potassium. In: Chapman HD (ed)
Diagnostic criteria for plants and soils. Quality Printing
Company, Riverside, pp 362–393
Van Asten PJA, Gold CS, Wendt J, De Waele D, Okech SHO,
Ssali H, Tushemereirwe WK (2004) The contribution of
soil quality to yield and its relation with other banana yield
loss factors in Uganda. In: Blomme G, Gold CS, Karamura
E (eds), Proceedings of a workshop held on farmer par-
ticipatory testing of IPM options for sustainable banana
production in Eastern Africa, Seeta, Uganda, December
8–9, 2003
Van Asten PJA, Gold CS, Wendt J, De Waele D, Okech SHO,
Ssali H, Tushemereirwe WK (2005) The contribution of
soil quality to yield and its relation with other banana yield
loss factors in Uganda. In: Blomme G, Gold CS, Karamura
E (eds) Proceedings of a Workshop Held on Farmer Par-
ticipatory Testing of IPM Options for Sustainable Banana
Production in Eastern Africa, Seeta, Uganda, December
8–9, 2003. International Plant Genetic Resources Institute,
Montpellier, pp 100–115
Van den Bosch H, Gitari JN, Ogaro VN, Maobe SA, Vlaming J
(1998) Monitoring nutrient flows and economic perfor-
mance in African farming system (NUTMON). Monitoring
nutrient flows and balances in three districts in Kenya.
Agric Ecosyst Environ 71:63–80
Verdoodt A, Van Ranst E (2003) A large-scale land suitability
classification for Rwanda. Ghent University, Laboratory of
Soil Science, Belgium
Wairegi LWI, van Asten PJA (2010) The agronomic and eco-
nomic benefits of fertilizer and mulch use in highland
banana systems in Uganda. Agric Syst 103:543–550
Wairegi LWI, van Asten PJA, Tenywa MM, Bekunda MA
(2010) Abiotic constraints override biotic constraints in
East African highland banana systems. Field Crops Res
117:146–153
Wortmann CS, Karamura EB, Gold CS (1994) Nutrient flows
from harvested banana pseudostems. Afr Crop Sci J
2:179–182
Yamaguchi Y, Araki S (2004) Biomass production of banana
plants in the indigenous farming system of the East African
Highland. A case study on the Kamachumu plateau in
northwest Tanzania. Agric Ecosyst Environ 102:93–111
Zake YK, Bwamiki DP, Nkwiine C (2000) Soil management
requirement for banana production on the heavy soils
around Lake Victoria in Uganda. Acta Hort 540:285–292
Nutr Cycl Agroecosyst
123


