Embed Size (px)
Citation preview

107
Ecological Monographs, 73(1), 2003, pp. 107–129q 2003 by the Ecological Society of America
NUTRIENT STATUS OF TROPICAL RAIN FORESTS INFLUENCES SOIL NDYNAMICS AFTER N ADDITIONS
SHARON J. HALL,1,3 AND PAMELA A. MATSON2
1Environmental Science Program, The Colorado College, Colorado Springs, Colorado 80903 USA2Department of Geological and Environmental Sciences, Stanford University, Stanford, California 94305 USA
Abstract. Soil nitrogen (N) transformations and N-oxide emissions were measuredfollowing N additions in three tropical montane rain forests in the Hawaiian Islands thatdiffered in substrate age and nutrient status. Nitrous oxide (N2O) and nitric oxide (NO)emissions were negligible following first-time N additions in a forest where N limits primaryproduction, and they increased significantly following 11 yr of N fertilization. Furthermore,N-oxide fluxes in the N-limited forest were relatively low in response to a range of Nadditions, and all doses of N except the two highest (125 and 175 kg N/ha) resulted in netnegative rates of mineralization and nitrification (i.e., soils showed significant N con-sumption). Short-term laboratory 15N experiments supported these trends by showing thatboth 15NH4
1 and 15NO32 were strongly consumed in soil from both the control and long-
term fertilized plots in the N-limited site. Long-term N fertilization in the N-limited forestsignificantly increased N availability and turnover, but it did not appreciably alter the smallpopulation size of nitrifying microorganisms found in soils of this site.
In contrast, N-oxide emissions were equally large after both first-time and long-term Nfertilization in forests where production is limited by N and P in combination and by Palone. Furthermore, N-oxide fluxes and net rates of N mineralization and nitrification wereequally large in response to both small and large doses of N. Net N transformation and15N assays suggested that N consumption processes in both the control and long-term Nfertilized plots in the P-limited site were relatively weak (compared to the N-limited site)and not significantly different from one another. Long-term N fertilization did not signif-icantly alter N availability or turnover in the NP-limited and P-limited forests (where poolsizes of NH4
1, NO32, and gross and net mineralization in control plots are high), but it
increased rates of nitrification through an apparent increase in the number and/or activityof nitrifying microorganisms. In all forests, fluxes of N-oxides measured immediately fol-lowing N additions were highly correlated with changes in the activity of nitrifying ratherthan denitrifying microorganisms. On average, N-oxide fluxes were predictable based onthe N status of the ecosystem as estimated by pools of inorganic N and potential rates ofnitrification.
Combined, these results suggest that anthropogenic N inputs are processed in N-limitedand P-limited tropical systems differently, such that the fate of added N in these tropicalforest systems is determined in part by the relative strengths of the pathways of N retention(uptake and immobilization in plants and soil organic matter) vs. N loss (nitrification anddenitrification). This work suggests that P-limited forests growing on highly weatheredsoils (where N cycles quickly) may respond differently to N additions than N-limited forests,with large and immediate losses of N-oxides.
Key words: denitrification; gross mineralization; Hawaiian Islands, USA; nitrification potential;nitrogen oxide emissions; nitrogen saturation; NO; N2O; phosphorus limitation; tropical montaneforest.
INTRODUCTION
Deposition of atmospheric nitrogen (N) compoundsto terrestrial systems has increased considerably overthe last several decades due to fossil fuel use and ag-ricultural practices associated with human activity. Forexample, areas in the northeastern United States andsouthern California receive up 30 kg N/yr from the
Manuscript received 5 December 2001; accepted 26 February2002; final version received 22 April 2002. Corresponding Edi-tor: J. B. Yavitt.
3 E-mail: [email protected]
atmosphere, while .100 kg N/yr are deposited to someareas of northern Europe (Grennfelt and Hultberg 1986,Lovett and Kinsman 1990, Fenn et al. 1998). Comparedto a preindustrial rate of ;2 kg N/yr, current rates ofatmospheric N deposition are in some cases largeenough to saturate the biological demand for N withinmany ecosystems over time (Aber et al. 1995, Dise andWright 1995). Until recently, N deposition has beenlargely a concern in the industrialized world, primarilyassociated with N-oxide (i.e., NOx) and ammonia (NH3)emissions from combustion processes and agriculturalactivity. However, intensification of fossil fuel use and

108 SHARON J. HALL AND PAMELA A. MATSON Ecological MonographsVol. 73, No. 1
agricultural practices in the less industrialized areas ofthe world, many of which are tropical, is expected toincrease rates of N deposition there by as much severalhundred percent by 2025 (Galloway et al. 1994, Matsonet al. 1999).
The consequences of chronic N deposition have beenstudied extensively in predominately N-limited tem-perate forest systems in the northern hemisphere, be-cause this is where the problem has been most severe.Years of both experimental and atmospheric N inputshave been shown to dramatically alter ecosystem pro-cesses and properties, including forest productivity,soil fertility, species composition, decomposition, andN loss from soils to groundwater and the atmosphere(Schulze 1989, Berendse et al. 1993, Aber et al. 1995,Dise and Wright 1995, Magill and Aber 1999). Thetiming and magnitude of these effects depends pri-marily on the N status of the ecosystem, including howclose it is to ‘‘N saturation,’’ the point at which Navailability exceeds biological demand (Agren andBosatta 1988, Aber et al. 1989).
Despite projections of increasing N emissions andtransport in the developing world, the responses oftropical ecosystems to anthropogenic N inputs are notwell understood. Many tropical forests are differentthan temperate forests in their stocks and flows of bi-ologically important elements. In particular, humidtropical ecosystems on highly weathered soils are rel-atively rich in biologically available N (Vitousek andSanford 1986, Matson and Vitousek 1987, Vitousekand Matson 1988) and productivity is likely to be lim-ited by phosphorus (P) or other rock-derived nutrients(Vitousek and Farrington 1997, Tanner et al. 1998).Because N availability may exceed biological demandin these forests, it is possible that increased atmospher-ic N deposition from human activity will result in largerand more immediate losses of N as soil gases (nitrousoxide [N2O], nitric oxide [NO], or dinitrogen [N2]), oras NO3
2 in solution than is expected based on resultsfrom N-limited forests of the northern hemisphere.
N2O is an effective greenhouse gas, and its concen-tration in the atmosphere is increasing by 0.25%/yr dueto human activity (IPCC 1996). NO is a reactive gasthat is important in tropospheric ozone formation andregional air chemistry, and it is one of the primarycomponents of atmospheric N deposition and acid rain(Galloway 1995). Although fossil fuel combustion isa major source of NOx (NO 1 NO2), both N2O and NOare produced in soils during the microbial processes ofnitrification and denitrification. Several studies haveshown that humid tropical forests have higher rates ofnitrification and greater losses of soil N-oxide gasesper unit of nitrogen cycled than many temperate eco-systems (Keller et al. 1986, Vitousek and Sanford 1986,Matson and Vitousek 1987, 1990, Keller 1988, Mar-tinelli et al. 1999). If primary production in humidtropical systems is predominately limited by P or otherrock-derived nutrients rather than N, additions of N
may not be stored in biomass or soil organic matterbut may be preferentially lost to groundwater or to theatmosphere. The extent to which anthropogenic N de-position will alter N2O and NO emissions in tropicalsystems is unclear but has potentially serious impli-cations for regional and global atmospheric processes(Hall and Matson 1999).
To explore this question, we measured soil N dy-namics and soil N-oxide emissions following first-timeand long-term fertilizer N additions in three humidtropical montane forests located along a well-studiedsubstrate-age gradient in the Hawaiian Islands (Crewset al. 1995, Vitousek and Farrington 1997). Our sitesincluded forests growing on a young substrate (300 yr)where primary production is limited by N, an inter-mediate-aged substrate (20 000 yr) where production islimited by N and P in combination, and an old substrate(4100 kyr), where production is limited by P (Crewset al. 1995, Vitousek and Farrington 1997). We inves-tigated whether microbial N transformations and as-sociated N-oxide emissions following anthropogenic Ninputs are related to the status of forest nutrient limi-tation.
MATERIALS AND METHODS
Study sites
The three sites used in this study are a part of a well-described substrate-age gradient in the Hawaiian Is-lands that represent a sequence of N to P-limitation ofprimary production. A detailed description of the gra-dient and NPP-limitation (net primary production)studies can be found in Crews et al. (1995) and Vi-tousek and Farrington (1997); selected site character-istics are presented in Table 1. The Hawaiian Islandsarchipelago represents a sequence of young soils onthe Big Island of Hawai‘i to old soils on the island ofKaua‘i that are all derived from basaltic volcanic tephrawith relatively similar chemical compositions. The N-limited site is on the active volcano of Kilauea on theisland of Hawai‘i and has been developing for ;300yr. The intermediate-age site, where production is lim-ited by N and P together (hereafter referred to as theNP-limited site for simplicity), is on a 20 000-yr sub-strate on the slope of Mauna Kea, also on the islandof Hawai‘i. The P-limited site is on a 4100-kyr sub-strate on the island of Kaua‘i. All sites are at an ele-vation of ;1100 m, receive 2500 mm/yr of precipi-tation, and have slopes of ,6%. Mean annual temper-ature is 168C at all sites. Seasonality in the Hawaiianrain forests is slight, with the majority of rain fallingbetween November and April (Juvick and Juvick 1998).Flora on the Hawaiian Islands reflects high endemismand low diversity typical of island ecosystems. Me-trosideros polymorpha (Ohi‘a) is the dominant tree spe-cies in all sites, representing 80–90% of the basal areaof species within plots in each site. Coprosma spp.,Myrsine spp., and Cheirodendron spp. represent the

February 2003 109SOIL N DYNAMICS IN TROPICAL RAIN FORESTS
TABLE 1. Characteristics of three fertilized substrate-age gradient sites in the Hawaiian Islands.
Site, islandAge of parentmaterial (yr)
Nutrient(s)that limitANPP†
Elevation(m)
Mean annualtemperature
(8C)
Mean annualprecipitation
(mm)Dominantvegetation Soil order
Hawai‘i VolcanoesNational Park,Hawai‘i 300 N 1176 16 2500 Metrosideros
polymorphaInceptisol
LaupahoehoeForest Reserve,Hawai‘i 20 000 N and P
in combination1170 16 2500 Metrosideros
polymorphaAndisol
Koke‘e State Park,Kaua‘i 4 100 000 P 1134 16 2500 Metrosideros
polymorphaOxisol
† Aboveground net primary production.
most common flora of the understory. All sites are dom-inated by native vegetation and have never beencleared.
Responses to first-time and long-term N additions
Soil N-oxide emissions.—In our first experiment, weexplored how soil N-oxide emissions from tropical eco-systems of differing nutrient status respond when N isadded for the first time as well as how they respond tolong-term, repeated N additions. Trace gases emissionsfrom this experiment in the N-limited and P-limitedsites are reported in Hall and Matson (1999); here, weexpand the discussion to include results from the NP-limited site and add new information on soil propertiesand microbial N dynamics.
Our experimental design included three treatmentsin all sites, including long-term N-fertilized (LT), first-time N-fertilized (FT), and unfertilized controls (C). Inthe LT treatment in the N-limited and P-limited sites,N was applied by hand to four randomly selected 153 15 m plots at the rate of 100 kg N·ha21·yr21 (50%urea and 50% ammonium nitrate), split between twosemi-annual applications of 50 kg N/ha. Applicationsbegan in 1985 and 1991 in the N-limited and P-limitedsites, respectively. In the intermediate-aged NP-limitedsite, where forest stature is the largest, three circularplots of 10 m diameter were identified around individ-ual, randomly selected M. polymorpha trees and werefertilized at the same rate and timing as the LT plotsdescribed above beginning in 1993. Control plots ofsimilar dimensions and number were randomly selectedand established in each site at the same time as the LTplots. In the FT treatment, N was applied for the firsttime in 1996 to four randomly selected 7.5 3 7.5 mplots at all sites (three plots in the NP-limited site) ofpreviously unfertilized soil at the same rate (100 kgN·ha21·yr21), form (50% NH4NO3, 50% urea), and tim-ing (semi-annual applications of 50 kg N·ha21·yr21) asthe LT treatments described above. These treatmentswere not designed to simulate anthropogenic N depo-sition but instead allowed us to evaluate the responseof systems to substantial changes in N availability.
N2O and NO emissions were measured in the LT, FT,and C plots in each site immediately before N additionsin 1996 and 1997 and from four to seven times withinthe 6-mo period following each fertilizer application.All treatments and plots within a site were measuredon each sampling day. In each LT and C plot, three25.5 cm diameter, beveled, PVC rings were randomlyinserted several centimeters into the soil at least 15 minbefore gases were measured and were always .0.5 mapart from one another. Two rings were randomlyplaced in each of the smaller FT plots. For measure-ments during a fertilizer event, rings were inserted priorto fertilization and were not moved over the entire sam-pling period. These PVC rings served as bases on whichchamber tops were sealed during gas flux measure-ments. Flux measurements from each of three ringswere averaged per plot, and 3–4 plots within a treat-ment were used as replicates. Methods of gas collectionand analyses are described next.
Gas collection and analysis.—N2O and NO emis-sions were measured using techniques described in de-tail in Matson et al. 1996. Molded PVC chambers wereplaced over each ring in the soil, and air was sampledfrom the chamber four times over a 30-min period.Chamber air samples and certified N2O standards werecollected in nylon syringes and held up to 48 h beforeanalysis. N2O was analyzed using a gas chromatograph(SRI Instruments, Torrance, California, USA) fittedwith an electron capture detector and calibrated usingcertified N2O standards in the laboratory. N2O flux wascalculated as the increase in concentration within thechamber over 30 min. Nitric oxide was measured usinga portable chemiluminescent detector (Unisearch As-sociates, Concord, Ontario, Canada) fitted with a CrO3
filter that converts all NO to NO2. NO2 concentrationswere estimated photochemically after its reaction withluminol solution. Soil NO2 fluxes were measured oc-casionally and were always undetectable; hence, allchemiluminescent NO2 measurements were assumed tobe equivalent to measurement of NO. Standard curveswere performed in the field several times a day before,during, and after gas sampling using a known concen-

110 SHARON J. HALL AND PAMELA A. MATSON Ecological MonographsVol. 73, No. 1
tration of NO. NO fluxes were calculated as the slopeof the NO concentration in the chamber over a 4-minperiod.
Responses to a range of N additions andN 1 P additions
N-fertilization dose-response experiment.—In orderto assess the responsiveness, or sensitivity, of soil pro-cesses and gas fluxes to small as well as large N inputs,we added NH4NO3 to previously unfertilized soils overa range of doses in both the N-limited and P-limitedforests and measured soil N-oxide emissions and soilprocesses in the 1-wk period following fertilization.We expected fluxes to be linearly related to N inputsin the P-limited site, where available N is relativelyabundant. In contrast, we expected fluxes to be smallat low N additions and to show substantial responseonly at the highest N additions in the N-limited site,where available N is scarce. Experimental details andresults of N-oxide emissions from this experiment arereported in Hall and Matson (1999). Here, we presentthese data together with results from soil N transfor-mation assays that were performed on cores collectedat the same time as gas flux measurements.
Four groups of eight rings were installed at 5-m in-tervals along a transect in unfertilized forest in boththe N-limited and P-limited sites. In each group (blockreplicate), rings were placed .0.5 m apart from oneanother. N treatments were applied in 500 mL of de-ionized water and were sprinkled within and around a5-cm buffer outside of each ring. Within each blockreplicate, N was added to rings at the rates of 0, 5, 15,25, 50, 75, 125, and 175 kg N/ha. We measured N2Oand NO emissions from all rings 24 h and 7 d afterfertilization. On day 7, three soil cores (0–10 cm depth)were taken from the inside of each ring to examine soilN pools and transformations (see Materials and meth-ods: Soil inorganic N).
Effect of combined N and P fertilization in the P-limited forest.—Prior studies at the P-limited site haveshown that growth of M. polymorpha is responsive toboth P and N 1 P additions but not to N alone (Herbertand Fownes 1995, Vitousek and Farrington 1997). Inthe fall of 1997, we evaluated the relationship betweensoil N-oxide emissions and biological N demand bymeasuring soil N-oxides and soil N transformations inplots that had been fertilized for five years with bothN and P (N 1 P plots) and comparing emissions withthe N-fertilized (N) and control (C) plots at this site.Because P-limitation was relieved in the N 1 P fertil-ized plots and added N presumably was being used byplants, we expected that soil N-oxide emissions wouldbe lower, soil N pools would be smaller, and transfor-mation processes would be slower in N 1 P plots thanin plots fertilized with N alone. The N 1 P plots wereof the same dimensions and were fertilized at the sametime as the long-term N-fertilized plots described pre-viously; in these, P was added to the plots with N as
triple super-phosphate at the rate of 100 kg P·ha·yr tofully overcome P-limitation to plant growth (Vitouseket al. 1993, Herbert and Fownes 1995, Vitousek andFarrington 1997). N-oxide gases, inorganic N concen-trations, and net rates of N mineralization and nitrifi-cation were measured from all plots immediately priorto and 6 d following fertilization. Denitrification andnitrification potentials were measured once immedi-ately prior to fertilization.
Mechanisms: soil N dynamics in response toN additions
We measured soil properties and pools of N as wellas microbial N transformations to examine whether Nretention in microbial biomass and soil organic matter(SOM) and N turnover in these tropical systems areaffected by N additions and whether these processesare related to N-oxide emissions. Because nitrifyingand denitrifying microorganisms are responsible forproducing N2O and NO in soil, we expected patternsof N-oxide emissions to be related to their activity anddynamics.
Soil temperature, moisture, and WFPS percent-age.—Gravimetric soil water (subsamples dried 24 hat 1058C) and soil temperature (3 mm depth) were mea-sured in all plots on all sampling dates. Water-filledpore space (WFPS) is thought to be an important factorcontrolling N-oxide emissions from soil (Firestone andDavidson 1989, Davidson 1993). We calculated WFPSusing the equation
gravimetric moisture 3 soil bulk densityWFPS 5
1 2 (soil bulk density/particle density)
weighted for differences in particle density of organicmatter and mineral soil in the top 10 cm of soil in eachtreatment in all sites. Percentage organic matter (OM)was determined in this study in the N-limited and P-limited sites (see Materials and methods: Total soil C).Particle densities were 1.3 for organic matter, 2.4 forsoils in the N-limited site, 2.6 for soils in the NP-limited site, and 2.9 for Fe/Al oxide-rich soils in theP-limited site (Riley and Vitousek 1995; O. Chadwick,personal communication). Bulk densities were 0.32 g/cm3 and 0.34 g/cm3 for the top 10 cm of soil at the N-limited and NP-limited sites, respectively, and 0.25 g/cm3 for organic horizons and 0.43 g/cm3 for mineralhorizons within the top 10 cm of soil at the P-limitedsite (Crews et al. 1995).
Total soil C and N, SOM, and microbial biomassN.—Immediately prior to N additions in 1996, threesoil cores (0–10 cm depth) were randomly collectedfrom within each of the C and LT plots in the N-limitedand P-limited sites, combined in the field, and storedat 48C for up to 48 h until processing. In the laboratory,soils were hand homogenized and hand sieved (to 4mm) for measurement of SOM content, total soil C andN, and concentrations of N in microbial biomass(MBN). Soils collected at this time were also used in

February 2003 111SOIL N DYNAMICS IN TROPICAL RAIN FORESTS
15N assays (see Materials and methods: 15N assays).Microbial biomass N was determined using the directextraction technique (Davidson et al. 1989). One 10-gsubsample of hand-sieved soil from each plot was shak-en for 1 min in 75 mL 0.5 mol/L K2SO4, set aside for18–24 h, filtered through pre-leached Whatman no. 1filters, then immediately frozen for later analysis. An-other 10-g subsample was placed in a glass beaker,fumigated with CH4Cl for 5–6 d, and then extracted in0.5 mol/L K2SO4 as described. All K2SO4 extracts weredigested in H2SO4 for total Kjeldahl N and analyzedcolorimetrically at the University of California, Berke-ley (UCB) on a Lachat autoanalysis system (LachatInstruments, Milwaukee, Wisconsin, USA). Concen-trations of N in the nonfumigated K2SO4 extracts weresubtracted from the fumigated extracts to estimateMBN. Total soil C and N were determined after soildrying (708C for 24 h) and grinding using a CHN el-emental analyzer (Carlo Erba Elantech, Lakewood,New Jersey, USA). Percentage organic matter was de-termined by mass loss-on-ignition at 5508C (Nelsonand Sommers 1982). Concentrations of OM, MBN, N,and C in soil were converted to area units (grams persquare meter) according to the bulk densities listedpreviously.
Soil pH.—Soil pH is known to influence the growthand activity of microorganisms (Richards 1987). Soilshave also been shown to become more acidic in eco-systems receiving chronic N deposition (Grennfelt andHultberg 1986, Schulze 1989). In 1997, we measuredthe pH of soil (0–10 cm depth) in the long-term Nfertilized and first-time fertilized plots immediately be-fore semi-annual N additions and again 1 wk and 3 moafter fertilization. Twenty-five milliliters of 0.01 mol/L CaCl2 were added to 25 g soil, slurries were shaken,and pH was determined between 0.25 and 1 h afterCaCl2 addition using a portable pH meter (Thermo Ori-on, Beverly, Massachusetts, USA) calibrated with cer-tified buffers.
Soil inorganic N and net N transformations.—Wemeasured exchangeable inorganic N concentrations andnet rates of N mineralization and nitrification after eachsoil collection in both the long-term and first-time Naddition experiment as well as in the dose-response, N1 P addition, and carbon 1 N addition experiments(see Materials and methods: nutrient limitations) using2 mol/L KCl extraction and aerobic incubation methodsdescribed in Matson et al. (1996). On each day of gassampling, three soil cores (0–10 cm depth) were ran-domly collected within each plot, combined in the field,and stored at 48C up to 48 h until processing. In thelaboratory, soils were hand homogenized and handsieved. One 10-g subsample from each plot was im-mediately shaken for 1 min in 50 mL 2 mol/L KCl, setaside for 18–24 h, filtered through pre-leached What-man no. 1 filters, and then frozen immediately for lateranalysis. Another 10-g subsample was placed in asmall, capped cup and then placed in the dark for 7–
10 d. After the incubation, soils were extracted as de-scribed previously. A third 25-g subsample was driedat 1058C for 24 h to determine gravimetric moisturecontent. All KCl extracts were analyzed colorimetri-cally for NH4
1-N and NO32-N at UCB using a Lachat
autoanalyzer as described earlier. Net N mineralizationwas calculated as the difference between the sum ofNH4
1 and NO32 concentrations before and after each
incubation. Net nitrification was calculated as the dif-ference between NO3
2 concentrations before and aftereach incubation. Masses of NH4
1 and NO32 produced
per day were converted to area units (grams per squaremeter) according to the bulk densities for each sitelisted previously.
15N assays.—We measured gross N mineralization,gross nitrification, and net 15N immobilization in mixedsoils of the LT and C plots in the N-limited and P-limited sites during the period before N fertilization in1996 using 15N pool dilution and tracer techniques(Kirkham and Bartholomew 1954, Davidson et al.1991, Matson et al. 1992, Hart et al. 1994, Stark andHart 1996). Results from the gross mineralization and8-d net 15NH4
1 immobilization assays were reported inHall and Matson (1999). Here we discuss those datawith results from the gross nitrification, 15NO3
2 im-mobilization, and 24-h 15NH4
1 immobilization assays.Soils used for background SOM, total C, N, and
MBN (see Materials and methods: Total soil C) de-termination were also used in these 15N assays. Ap-proximately 300 g of hand-sieved soil from each plotwere placed in two polyethylene bags. Two 10-g sub-samples were taken from each bag for background 2mol/L KCl-extractable NH4
1 and NO32 concentrations
and net N transformations (described previously). Athird 10-g subsample was dried at 708C for gravimetricwater content. Approximately 1.6 mg 15N/g as(15NH4)2SO4 or K15NO3 in 3 mL water were added toeach bag using a squirt bottle. Bags were inverted sev-eral times to mix the label and soil, sealed, and placedin the dark for incubation in the laboratory at 228C.Less than 30% of the average standing pool size ofNH4
1 was added to the soil as (15NH4)2SO4. In the N-limited site, where concentrations of NO3
2 are barelydetectable, 15NO3
2 additions clearly increased the back-ground pool size of NO3
2.Fifteen minutes after the 15N label was added, one
subsample (15 g soil from the N-limited site, 10 g soilfrom the P-limited site) was taken from each bag andextracted in 75 mL 2 mol/L KCl to determine T15min
inorganic 15N concentrations where T is time. Twenty-four hours after the 15N label was added, two additionalsubsamples were removed from each bag. One sub-sample was extracted in 75 mL 2 mol/L KCl (T24), andanother was dried at 708C for water content and totalsoil 15N analysis. Eight days after 15N label was added,four subsamples were removed from each bag. Onesubsample was extracted in 75 mL 2 mol/L KCl (T8d),two were used to estimate MB15N by CH4Cl fumigation

112 SHARON J. HALL AND PAMELA A. MATSON Ecological MonographsVol. 73, No. 1
and extraction with K2SO4 (as before), and a fourthsubsample was dried at 708C for water content and totalsoil 15N. All KCl and K2SO4 extractions were shakenvigorously for 1 min and filtered 18–24 h after extrac-tion using pre-leached Whatman no. 1 filters. Extractswere frozen immediately until Kjeldahl or colorimetricanalyses were performed at UCB. Total soil 15N wasdetermined after soil drying (708C for 24 h) and grind-ing using a mass spectrometer (PDZ Europa, Cheshire,UK). Estimates of MB15N, KCl extractable 15N, andtotal soil 15N were used to calculate gross minerali-zation, nitrification and net 15N immobilization and re-covery over the 24-h and 8-d laboratory incubations.
15N diffusion and analysis.—All K2SO4 extracts weredigested in H2SO4 for total Kjeldahl N and analyzedcolorimetrically at UCB. 15NH4
1 or 15NO32 in solution
was diffused onto acidified disks wrapped in PFTE (te-flon) tape and blank corrected using the difference be-tween diffused and nondiffused standards as describedin Stark and Hart (1996) and Hart et al. (1994). Acid-ified disks were analyzed for 15N atom % enrichmenton a mass spectrometer. Gross N mineralization andnitrification were calculated from the dilution of the15NH4
1 or 15NO32 pools between the T15min and T24h time
points using equations described in Davidson et al.(1991). Amount of 15N in various soil pools was de-termined at 24 h and 8 d and expressed as a fractionof total soil 15N measured at each time point. At the24-h time point, the amount of 15N in the pool labeled‘‘soil organic N’’ was calculated by subtracting the 24-h pool of inorganic 15N (KCl-extractable) from totalsoil 15N at that time point (includes microbial biomassN). At 8 d, the fraction of total 15N found in the poollabeled ‘‘soil organic N’’ was calculated by subtractingboth the inorganic 15N and MB15N pools from the totalsoil 15N fraction (does not include microbial biomassN).
Nitrification and denitrification potential assays.—We used methods described in Hart et al (1994) andTiedje (1982) to assess rates of potential nitrificationand denitrification in soils from all sites during theperiod before N additions (6 mo after the last N ad-dition). Potential rates estimated with these assays havebeen used as an index of microbial population size(Hart et al. 1994). Three soil cores (0–10 cm depth)were randomly collected in each plot, combined in thefield and processed in the laboratory as described pre-viously. In the nitrification potential assay, 10–25 g ofsoil were added to flasks along with 100 mL of a so-lution containing 50 m mol/L (NH4)2SO4, 0.2 mol/LK2PO4, 0.2 mol/L KH2PO4, and adjusted to pH 7.2 (Hartet al. 1994). Blanks of solution without soil were alsoprocessed at this time. Soil slurries were shaken vig-orously on a mixer to maintain aerobicity for 24 h. Atfour times within this 24-h period, 5 mL aliquots ofsoil slurry were removed from the flasks, centrifuged,flocculated with a 0.6 mol/L solution of MgCl2 1 CaCl2
to aid in filtration, filtered through pre-leached What-
man no. 43 filters, and frozen until analysis. Extractswere analyzed colorimetrically for NO3
2 at UCB. Ratesof potential nitrification were determined by using thepositive slope of NO3
2 concentrations in soil extractsover the 24-h period.
In the denitrification potential assay, 25-g subsam-ples of soil from each site and treatment were placedin flasks along with 100 mL of a solution containing1 m mol/L carbon as sodium succinate and 1 m mol/L N as potassium nitrate (Tiedje 1982) Soil slurrieswere capped with rubber septa, bubbled with N2 gas tomake the solution and flask headspace anaerobic,amended with 10 kPa C2H2, and immediately placedon a rotary shaker for 1 h. Four headspace sampleswere taken from each flask within the 1-h incubationand temporarily stored in nylon syringes (,24 h). N2Oconcentrations in headspace samples were determinedusing a gas chromatograph fitted with an electron cap-ture detector and calibrated using certified N2O stan-dards in the laboratory. Rates of potential denitrifica-tion were estimated as the increase in N2O concentra-tions in the anaerobic, C2H2-amended headspace of soilslurries over a 1-h period corrected for the Bunsenabsorption coefficient of dissolved N2O in water at lab-oratory temperature (228C; Tiedje 1982). Potential ni-trification was determined prior to the first 1997 fer-tilization event in all plots (control, long-term, andfirst-time). The FT plots had received N once, 6 moearlier, at 50 kg N/ha. Denitrification potentials weredetermined two times in all sites (prior to the second1997 fertilization event and 1 wk following the carbon1 N addition experiment). Nitrification and denitrifi-cation potentials were also determined before fertil-ization of the NP plots at the P-limited site in 1997.
Nutrient limitations to denitrification: carbon 1 ni-trogen addition experiment.—Denitrification is knownto be the primary source of N2O in wet to saturatedsoils worldwide and a source of N2O emissions in un-fertilized soils across the long substrate age gradientin Hawai‘i (L. O. Hedin, P. M. Vitousek, P. A. Matson,unpublished manuscript). We investigated the extent ofnutrient limitation to denitrification by measuring soilN-oxide emissions, potential denitrification, soil inor-ganic N concentrations, and rates of net N minerali-zation and nitrification following factorial carbon andN additions in the N-limited forest, the NP-limited for-est, and the P-limited forest.
In both the N-limited and P-limited sites, four PVCrings were inserted into the soil in four blocks arrangedalong a transect (n 5 4). In each block replicate, 500mL of deionized water, carbon, N, or carbon and N incombination were sprinkled within and across a 5-cmbuffer outside of the rings in two, separate applications,1 wk apart. Over two applications, carbon was addedat 138 g C/m2 to approximately double the microbialbiomass pool of carbon found at all sites in the top 10cm of soil (assuming a carbon:nitrogen ratio of 10:1in microbial biomass; see also Torn et al. 1997). In

February 2003 113SOIL N DYNAMICS IN TROPICAL RAIN FORESTS
order to maximize carbon availability over the 2-wkperiod, we added carbon as a suite of simple and com-plex carbohydrates dissolved in deionized water, in-cluding glucose, Na-acetate, starch, a-cellulose, andpectin in equal proportions of carbon added. Over twoapplications, N was added at 10 g N/m2 as NH4NO3 indeionized water. Carbon:nitrogen ratio of the carbon 1N combination treatment was 13.8/1. The pH of thecarbon and N solutions was 6.0 and 6.5, respectively.
One week after the last application, we measuredN2O and NO emissions and randomly collected twosoil cores (0–10 cm) from within each ring for potentialdenitrification, inorganic N analysis, and rates of netN mineralization and nitrification.
Statistical analyses
ANOVA analyses with post hoc Tukey tests wereperformed for each sampling date using Systat 5.2(SPSS 1992) to identify differences between treatmentsand sites. All residuals were visually checked for ho-mogeneity following model fitting. Log-normally dis-tributed data were log-transformed before analyses.Data that did not fit parametric assumptions were an-alyzed using Kruskal-Wallis rank analyses with posthoc nonparametric Tukey tests (Zar 1984). Analyseswith P values ,0.05 were considered significant. Re-gression analyses were performed between various soilproperties and processes and log-transformed N-oxideemissions (to satisfy linear model assumptions).
We calculated gas losses per sampling period firstby summing daily N2O and NO fluxes within each ploton each sampling date, and then summing the combinedN2O 1 NO flux across all sampling dates, assuming aconstant rate of emissions over 24 h and a linear changein emissions between sampling days (given that soilmoisture and temperature were relatively constant overthe sampling period). In the N-limited and NP-limitedsites, mean control fluxes were subtracted from fertil-ized fluxes in each plot on each sampling date. In theP-limited site where plots were blocked, control fluxeswere subtracted from fertilized fluxes within eachblock. All gas fluxes were log-transformed prior to AN-OVA and Tukey analyses.
RESULTS
Response to first-time and long-term N additions
Soil N-oxide emissions.—In the N-limited site, plotsthat received chronic, long-term N additions had sig-nificantly higher emissions of N2O and NO than controlplots in the period prior to fertilization (i.e., 6 mo afterthe last fertilization event; Figs. 1 and 2) but overallmagnitudes were small. Application of N for the firsttime in this site produced negligible fluxes in the twoweeks following fertilization, but the long-term N fer-tilized plots showed significantly higher fluxes thancontrols after N additions (Fig. 1). In contrast, back-ground emissions (i.e., measured 6 mo after the last
fertilization event) of N2O and NO from fertilized plotsin the NP-limited and P-limited site were large relativeto the N-limited site but not significantly different thancontrols during the period prior to fertilization. Fol-lowing fertilization, fluxes increased dramatically to anequal extent in both first-time and long-term N fertil-ized plots. Trends were similar in 1997 in all sites (Fig.2), except that N2O fluxes from the first-time plots inthe N-limited site were significantly greater than con-trols for up to 18 d. Fluxes from all fertilized plots inall sites returned to background levels within 3 mo.
Total losses of N as N2O plus NO over each fertil-ization event varied significantly among sites and treat-ments (Table 2). In the N-limited site, N losses werenegligible after first-time N fertilization and were smallbut significantly higher than controls after long-termN fertilization. In contrast, losses from the NP-limitedand P-limited site were equally large from plots fer-tilized for the first time and plots repeatedly fertilizedwith N for up to 6 yr. Soil N-oxide losses from plotsfertilized for the first time in the P-limited forest werelarger than losses from long-term N fertilized plots inthe N-limited forest. Patterns of soil N-oxide lossesover 24 d in 1997 showed similar patterns by site andtreatment.
Soil properties.—Throughout the study, precipita-tion and soil temperatures remained relatively constantand did not differ between sites over the fertilizationevents (Fig. 3b; only 1997 data shown although trendsin 1996 were the same). Percent WFPS of soil was notaffected by N-fertilization in any of the sites duringthe 1996 or 1997 fertilization events, but it was sig-nificantly higher across all treatments in the N-limitedsite compared to the P-limited site on five of the sevensampling dates in 1997 (Fig. 3a) and on both of thesampling dates following fertilization in 1996. In 1996,soil WFPS was on average 85.8 6 2.0% in the N-limited site, 90.9 6 2.7% in the NP-limited site, and46.7 6 2.0% (61 SE) in the P-limited site across alltreatments.
Long-term N fertilization did not significantly alterthe large standing pools of total soil C, N, MBN, orSOM in either the N-limited or the P-limited sites (asmeasured 6 mo after fertilizer application), althoughmeans were consistently higher in the LT plots than inthe C plots in both sites (Table 3). In general, total soilcarbon, N, and SOM were higher in the P-limited sitethan in the N-limited site. Despite the difference inSOM content between sites, the carbon:nitrogen ratioand MBN values were similar in the N-limited and P-limited sites.
Neither first-time nor long-term N-additions signif-icantly altered pH in any of the sites when measured3 and 6 mo after fertilization, although there was aclear trend of decreasing values in fertilized soils ofthe N-limited site (Table 4). Soil pH measured in con-trol plots decreased significantly with increasing sub-strate age, from 4.2 in the N-limited site to 3.2 in the

114 SHARON J. HALL AND PAMELA A. MATSON Ecological MonographsVol. 73, No. 1
FIG. 1. Gas emissions in 1996 from all treatments before and immediately following N additions of 50 kg N/ha to theFT plots in the N-limited, NP-limited, and P-limited sites: (a) N2O and (b) NO emissions from soils. Arrows representfertilization events. Key to symbols: solid triangle, long-term fertilized (LT); open square, first-time fertilized (FT); opencircle, control (C). Lowercase letters above symbols indicate significant differences: a, LT . C (P , 0.05); b, LT and FT. C (P , 0.05; n 5 4 in N-limited and P-limited sites; n 5 3 in the NP-limited site). Error bars show 61 SE. All fluxeswere log-transformed prior to ANOVA and post hoc Tukey analyses.
P-limited site. In addition, when measured 3 and 6 moafter fertilization, all treatments in the P-limited sitewere significantly more acidic than all treatments inthe N-limited site. The pH in the NP-limited site fellconsistently intermediate between the N-limited andthe P-limited sites. Within one week following fertil-ization, N-additions increased the pH of soils in theNP-limited site but had no effect in soils of the N-limited and P-limited sites.
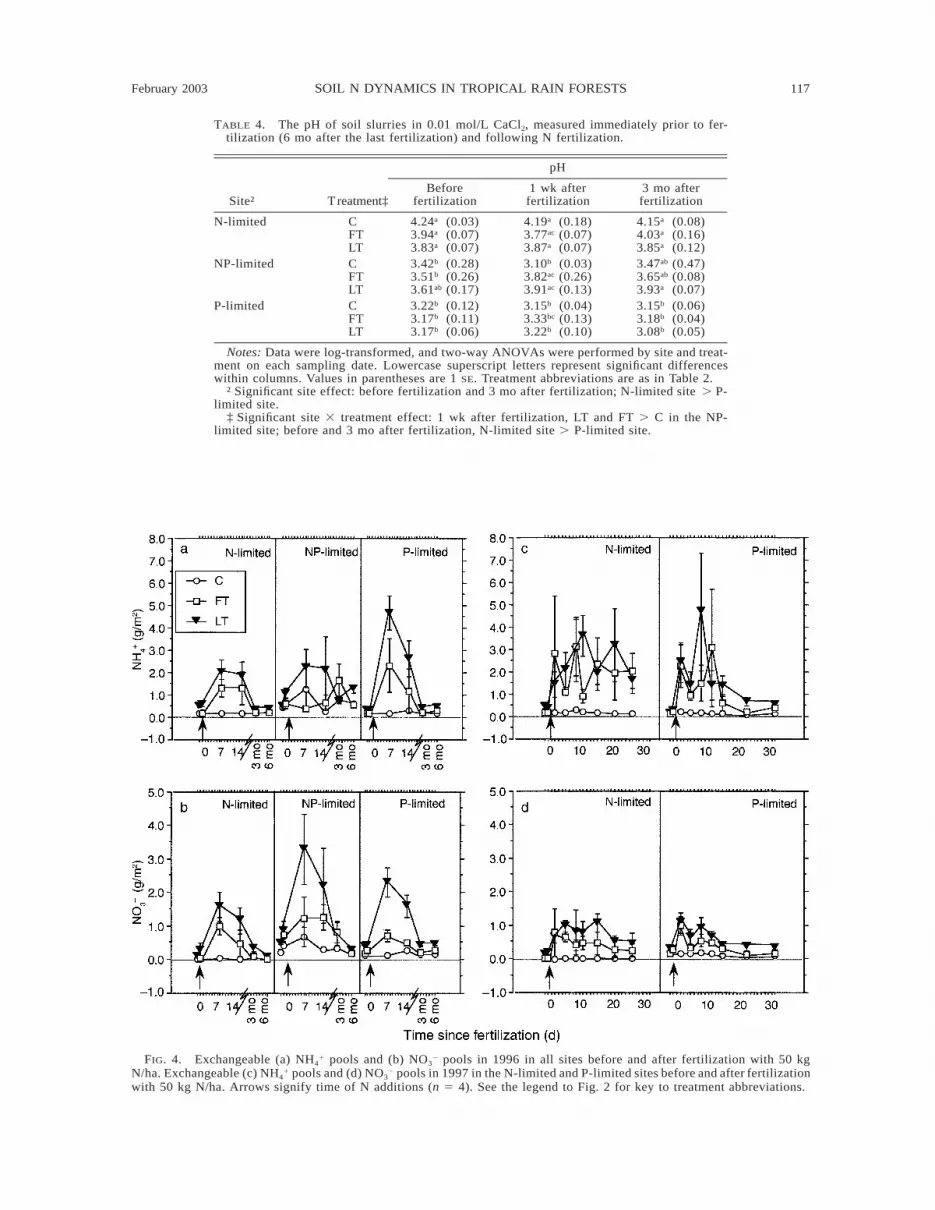
Exchangeable N pools and Net N transformations.—In contrast to the dramatic differences in total soil N-oxide losses among sites, concentrations of inorganicN in fertilized plots were large and highly variable atall sites in the weeks following N additions and showedno consistently significant differences among fertilizedtreatments or sites (Fig. 4). In contrast, net N trans-formation rates followed clearly defined patterns by siteand treatment (Fig. 5) and showed no evidence of sea-

February 2003 115SOIL N DYNAMICS IN TROPICAL RAIN FORESTS
FIG. 2. Gas emissions in 1997: (a) N2O and (b) NO emissions from soils in the N-limited and P-limited sites before andimmediately following N additions of 50 kg N/ha. Arrows represent fertilization events. Key to symbols: solid triangle, long-term fertilized (LT); open square, first-time fertilized (FT); open circle, control (C). Lowercase letters above symbols indicatesignificant differences: a, LT . C (P , 0.05); b, LT and FT . C (P , 0.05; n 5 4). Error bars show 61 SE. All fluxes werelog-transformed prior to ANOVA and post hoc Tukey analyses. FT plots have been fertilized for 1 yr, and the LT plots havebeen fertilized for 12 and 6 yr in the N-limited and P-limited sites, respectively. This figure appeared previously in Hall andMatson (1999) and is reprinted here with permission from Nature (copyright q 1999, Macmillan Magazine Limited).
TABLE 2. Fertilizer N lost as N2O-N 1 NO-N (kg N/ha)within 1 mo following N additions.
Site Treatment1996
(over 14 d)1997
(over 24 d)
N-limited CFTLT
00.02a (0.004)0.15b (0.05)
00.06a (0.01)0.15a (0.06)
NP-limited CFTLT
00.27bc (0.04)0.60bc (0.17)
·········
P-limited CFTLT
00.86c (0.19)1.37c (0.38)
01.30b (0.48)1.19b (0.21)
Notes: Treatment abbreviations are: C, control; LT, long-term fertilized; FT, first-time fertilized in 1996. In 1997, FTplots had been fertilized twice in the prior year with 50 kgN/ha per application. Values in parentheses are 1 SE. Low-ercase superscript letters represent significant differenceswithin columns (ANOVA, P , 0.05).
sonality over the year (data not shown). In the N-lim-ited site, net N mineralization and net nitrification wereconsistently zero or negative after first-time N additionsin 1996 and 1-yr additions in 1997 (FT treatment),suggesting the predominance of NH4
1 and NO32 con-
sumption processes in these soils. In the N-limited site,long-term N fertilization generally increased net Nmineralization and nitrification rates to positive valuesthat were significantly larger than rates in the FT treat-ment or control. In the NP-limited and P-limited sites,rates of net N mineralization and nitrification were var-iable but always positive, indicating net release of Nto exchange sites and the soil solution. Furthermore,unlike in the N-limited site, rates of net mineralizationand nitrification did not differ between first-time andlong-term N fertilization treatments in the NP-limitedand P-limited sites.

116 SHARON J. HALL AND PAMELA A. MATSON Ecological MonographsVol. 73, No. 1
FIG. 3. (a) Water-filled pore space (%; open circles), (b) soil temperature (8C; 3-cm depth; right-hand axis scale; solidcircles), and precipitation (mm; open bars; B. Huebert, unpublished data), measured at the N-limited and P-limited sites onall sampling days in 1997 (n 5 4).
TABLE 3. Soil organic matter (SOM) content, total soil carbon and nitrogen, N in microbial biomass (MBN), andcarbon:nitrogen ratio in the control (C) and long-term fertilized (LT) plots in the N-limited and P-limited forests.
Site Treatment SOM† (%)Carbon†(kg/m2) Carbon (%)
Nitrogen†(kg/m2) Nitrogen (%) MBN (g/m2)
Carbon:nitrogen
N-limited
P-limited
CLTCLT
30.07 (1.33)36.87 (3.12)58.21 (9.87)63.80 (10.83)
7.23 (0.20)7.95 (0.51)9.33 (0.50)9.94 (0.6)
22.59 (0.61)24.86 (1.58)33.51 (4.58)35.87 (5.25)
0.30 (0.02)0.35 (0.03)0.40 (0.04)0.43 (0.02)
0.92 (0.06)1.08 (0.09)1.45 (0.25)1.56 (0.22)
6.49 (0.32)7.00 (0.95)7.40 (0.59)8.26 (0.31)
24.64 (1.25)23.33 (1.81)23.79 (1.24)23.18 (0.58)
Note: Values in parentheses are 1 SE (n 5 4).† Significant site effect: SOM, total carbon, total N (P , 0.05). SOM data were log-transformed prior to ANOVA analyses.
Ratios of net nitrification to net N mineralization(measured 6 mo after the last fertilization event) sug-gest that the majority of the N that is mineralized isalso nitrified in both unfertilized and long-term N fer-tilized soil in the NP-limited and P-limited sites (Table5). In contrast, in the N-limited site, net nitrificationand net N mineralization were either undetectable ornegative in the control plots, and ratios of nitrificationto mineralization were often much smaller than 1 inthe long-term N fertilized plots.
Response to a range of N additions andN 1 P fertilization
N-fertilization dose-response experiment.—In the N-limited site, fluxes of N2O and NO measured one dayafter treatment were small and significantly differentthan the water-only treatment only at doses .15 kg
N/ha (Fig. 6). As expected, the relationship betweenflux and dosage was nonlinear. Fluxes measured 7 dafter treatment were not significantly different than oneanother below 25 kg N/ha and above 50 kg N/ha. Incontrast, in the P-limited site, N additions .5 kg N/haled to large N2O and NO emissions within the first weekafter fertilization. However, the relationship betweendose and gas flux at this site was also nonlinear. Atboth the 1-d and 7-d sampling points, fluxes peaked atdoses of 75 kg N/ha but were not significantly differentthan one another after 15 kg N/ha.
Despite the striking difference in gas emissionsfound between sites in the dose-response experiment,soil concentrations of exchangeable inorganic N in theN-limited and P-limited sites were remarkably similarand increased with increasing dose of N added (Fig.7a,b). However, measurement of net N mineralization
February 2003 117SOIL N DYNAMICS IN TROPICAL RAIN FORESTS
TABLE 4. The pH of soil slurries in 0.01 mol/L CaCl2, measured immediately prior to fer-tilization (6 mo after the last fertilization) and following N fertilization.
Site† Treatment‡
pH
Beforefertilization
1 wk afterfertilization
3 mo afterfertilization
N-limited CFTLT
4.24a (0.03)3.94a (0.07)3.83a (0.07)
4.19a (0.18)3.77ac (0.07)3.87a (0.07)
4.15a (0.08)4.03a (0.16)3.85a (0.12)
NP-limited CFTLT
3.42b (0.28)3.51b (0.26)3.61ab (0.17)
3.10b (0.03)3.82ac (0.26)3.91ac (0.13)
3.47ab (0.47)3.65ab (0.08)3.93a (0.07)
P-limited CFTLT
3.22b (0.12)3.17b (0.11)3.17b (0.06)
3.15b (0.04)3.33bc (0.13)3.22b (0.10)
3.15b (0.06)3.18b (0.04)3.08b (0.05)
Notes: Data were log-transformed, and two-way ANOVAs were performed by site and treat-ment on each sampling date. Lowercase superscript letters represent significant differenceswithin columns. Values in parentheses are 1 SE. Treatment abbreviations are as in Table 2.
† Significant site effect: before fertilization and 3 mo after fertilization; N-limited site . P-limited site.
‡ Significant site 3 treatment effect: 1 wk after fertilization, LT and FT . C in the NP-limited site; before and 3 mo after fertilization, N-limited site . P-limited site.
FIG. 4. Exchangeable (a) NH41 pools and (b) NO3
2 pools in 1996 in all sites before and after fertilization with 50 kgN/ha. Exchangeable (c) NH4
1 pools and (d) NO32 pools in 1997 in the N-limited and P-limited sites before and after fertilization
with 50 kg N/ha. Arrows signify time of N additions (n 5 4). See the legend to Fig. 2 for key to treatment abbreviations.

118 SHARON J. HALL AND PAMELA A. MATSON Ecological MonographsVol. 73, No. 1
FIG. 5. Net N transformations before and after fertilization: (a) net N mineralization and (b) net nitrification in 1996 inall sites; (c) net N mineralization and (d) net nitrification in 1997 in the N-limited and P-limited sites. Arrows signify timeof N additions. See the legend to Fig. 2 for key to treatment abbreviations.
TABLE 5. Fraction of mineralized N that was nitrified (ratioof net nitrification to net N mineralization) 6 mo after fer-tilization in 1995–1997 (see also Fig. 5a–d).
Year Trt N-limited NP-limited P-limited
1995 CLT
NA0.40 (0.17)
1.05 (0.04)1.19 (0.23)
······
1996 CLT
NA0.26 (0.10)
1.10 (0.10)1.13 (0.06)
0.80 (0.18)1.09 (0.06)
1997 CLT
NA0.32 (1.26)
······
0.83 (0.11)0.94 (0.08)
Notes: Values in parentheses are 1 SE. The abbreviationNA indicates that net rates were often zero or negative (netconsumption) in the control plots of the N-limited site. Treat-ment abbreviations are as in Table 2.
and nitrification revealed clear differences betweensites in the processing of N (Fig. 7c,d). In the N-limitedsite, rates of net N mineralization and nitrification werenegative for all doses under 125 kg N/ha and weresignificantly smaller than rates in the P-limited siteexcept at the two highest doses (125 and 175 kg N/ha). In contrast, in the P-limited site, all doses showedlarge, positive rates of net N mineralization and nitri-fication.
Effect of combined N and P fertilization in the P-lim-ited forest.—We expected rates of soil N-oxide emis-sions and N availability in the P-limited site to be largerin the N-fertilized plots, where plant growth shows noresponse to fertilization, than in the N 1 P-fertilizedplots, where primary production increases with N andP additions. Although variability was high, nitrifica-tion, denitrification and N availability were smaller inthe N 1 P plots compared to plots fertilized with Nalone (Fig. 8). Six days after fertilization, N additionsincreased N2O and NO emissions, net N mineralization,and soil exchangeable NH4
1 and NO32 concentrations,
while N 1 P additions increased only NO emissionsand soil exchangeable NH4
1 and NO32. Rates of net
nitrification in the N-alone plots were larger than therates in the NP or control plots both before (P # 0.1)and after (P # 0.1) fertilization (Fig. 8f). Nitrificationand denitrification potentials followed the same pat-terns: when measured 6 mo after the last N addition,the N alone plots showed higher potential nitrification(Tukey, P , 0.05) and larger potential denitrification(Tukey, P , 0.08) than the NP plots (Fig. 8g,h).

February 2003 119SOIL N DYNAMICS IN TROPICAL RAIN FORESTS
FIG. 6. Soil N-oxide emissions (N2O 1 NO)(a) 1 d and (b) 7 d following additions ofNH4NO3 in the N-limited (open circles) and P-limited (solid circles) sites. Lowercase lettersabove plotted points represent significant dif-ferences between treatments and sites (two-wayANOVA, P , 0.05, n 5 4). This figure appearedpreviously in Hall and Matson (1999) and isreprinted here with permission from Nature(copyright q 1999, Macmillan Magazine Lim-ited).
FIG. 7. Soil inorganic N pools (g/m2) and net N transformations (mg·m22·d21) in the N-fertilization dose-response ex-periment: (a) NH4
1, (b) NO32, (c) net N mineralization, and (d) net nitrification. Soils were sampled 7 d after N addition.
Asterisks (*) indicate significant difference between sites within a treatment (P , 0.05), based on ANOVA (soil N pools)or Mann-Whitney tests (net rates). For N pools, data were log-transformed when variances between sites were unequal.

120 SHARON J. HALL AND PAMELA A. MATSON Ecological MonographsVol. 73, No. 1
FIG. 8. N-oxide emissions and soil N transformations in the control (C), N fertilized (N), and N1P fertilized (NP) plotsat the P-limited site: (a) N2O fluxes, (b) NO fluxes, (c) NH4
1 pools, (d) NO32 pools, (e) net N mineralization, (f) net nitrification,
(g) nitrification potential, and (h) denitrification potential. Error bars show 11 SE. ‘‘Before’’ and ‘‘after’’ fertilization mea-surements were taken 5 d prior to and 6 d after fertilization, respectively. Asterisks (*) indicate that the treatment measureis significantly greater than controls (ANOVA, P , 0.05, n 5 4). Daggers (†) indicate that the treatment measure is marginallysignificantly greater than controls (ANOVA, P , 0.1).
Mechanisms: soil N dynamics
Gross N transformations and 15N immobilization.—15N assays of microbial N transformations revealedclear differences between sites and treatments. In theN-limited site, gross rates of N mineralization were lowin unfertilized soil (from Hall and Matson 1999; Table6), and pools of NO3
2 were so small (absent to neg-ligible) following the 24-h incubation that estimates ofgross nitrification could not be made. Long-term N ad-ditions in the N-limited site doubled rates of gross min-eralization and significantly increased N availabilitysuch that pool sizes of NO3
2 (and thus, rates of grossnitrification) became quantifiable. In contrast, in the P-limited site, rates of gross N mineralization were highin unfertilized soil and did not significantly change withlong-term N fertilization. Similarly, rates of gross ni-trification in unfertilized soil of the P-limited site wererelatively large, and three times as fast as rates in thelong-term N-fertilized plots of the N-limited site. How-
ever, long-term N additions in the P-limited site sig-nificantly increased rates of gross nitrification by 67%.
Calculation of the amount of 15N found in varioussoil pools relative to total soil 15N emphasizes the dif-ferences in N demand between sites and treatments(Table 7). In unfertilized control soil of the N-limitedsite, ,8% of either the added 15NH4
1 and 15NO32 labels
remained in inorganic form 24 h after 15N additions,with .90% found in the soil organic matter pool, as-sumed to be composed of MB15N, nonextractable soilorganic 15N, and abiotically fixed 15N (calculated bysubtracting the amount of 15N in the inorganic poolfrom the amount of 15N in the total soil N pool). Long-term N fertilization in the N-limited site dramaticallyreduced the fraction of 15N found in organic and non-extractable forms, with nearly half of the 15NH4
1 labeland all of 15NO3
2 label remaining as inorganic 15N after24 h. In the P-limited site, unfertilized soil consumedonly 50% of the 15NH4
1 label and only 27% of the
February 2003 121SOIL N DYNAMICS IN TROPICAL RAIN FORESTS
TABLE 6. Gross microbial 15N transformations (g N·m2·d21)measured 6 mo after the last fertilization event in 1996.
Site TreatmentGross N
mineralizationGross
nitrification
N-limited C†LT
0.33a (0.08)0.58b (0.04)
···0.06a (0.01)
P-limited CLT
1.32c (0.13)1.50c (0.10)
0.18b (0.01)0.30b (0.05)‡
Notes: Gross mineralization values were previously re-ported in Hall and Matson (1999). Gross nitrification was notmeasurable in the control plots of the N-limited site by 24-h pool dilution methods. Values in parentheses are 1 SE (n 54, except as noted). Lowercase superscript letters representsignificant differences within columns (ANOVA, P , 0.05).Treatment abbreviations are as in Table 2.
† For this site–treatment, n 5 3.‡ At the P-limited site, LT . C (ANOVA, P 5 0.09).
15NO32 label into organic and nonextractable forms af-
ter 24 h, similar to the fraction consumed in long-termN-fertilized soil at the N-limited site. Long-term N fer-tilization at the P-limited site had no significant effecton the fraction of either the 15NH4
1 or 15NO32 label
remaining as inorganic 15N after 24 h.Eight days after 15N labeling, we were able to clearly
differentiate the fraction of total soil 15N found in theinorganic, microbial biomass, and soil organic N pools(Table 7). In unfertilized soil of the N-limited site, ,5%of either the 15NH4
1 or 15NO32 labels remained in in-
organic form (4.5%), .25% of the 15NH41 label was
in the microbial biomass (27.6%), and the remainderof the total soil 15N (67.8%), was in soil organic matter.In long-term N fertilized soil, the fraction of total 15Nfound in the inorganic pool increased over threefold inthe 15NH4
1-labeled treatment, but 70.9% was still foundin soil organic matter. In the 15NO3
2-labeled treatmentin the N-limited site, long-term N fertilization in-creased the inorganic 15N fraction by 20-fold, from3.9% to 81.2% atom excess, and clearly decreased theamount of 15NO3
2 found in SOM (96.1% to 18.8% atomexcess). In contrast, in the P-limited site, long-term Nfertilization did not significantly change N consump-tion by the soil: 38.9% of the 15NH4
1 label remainedin inorganic form in the control plots and 57.9% re-mained there in long-term N fertilized plots. As well,only 20% of the 15NO3
2 label in long-term fertilizedsoil moved into the microbial biomass or SOM poolsafter 8 d.
In unfertilized soil at the N-limited site, the samefraction of 15NH4
1 as 15NO32 was immobilized into the
soil organic matter fraction at 24 h. In contrast, 15NH41
consumption was always greater than 15NO32 con-
sumption in long-term fertilized soil at the N-limitedsite and in either long-term N fertilized or unfertilizedsoil at the P-limited site.
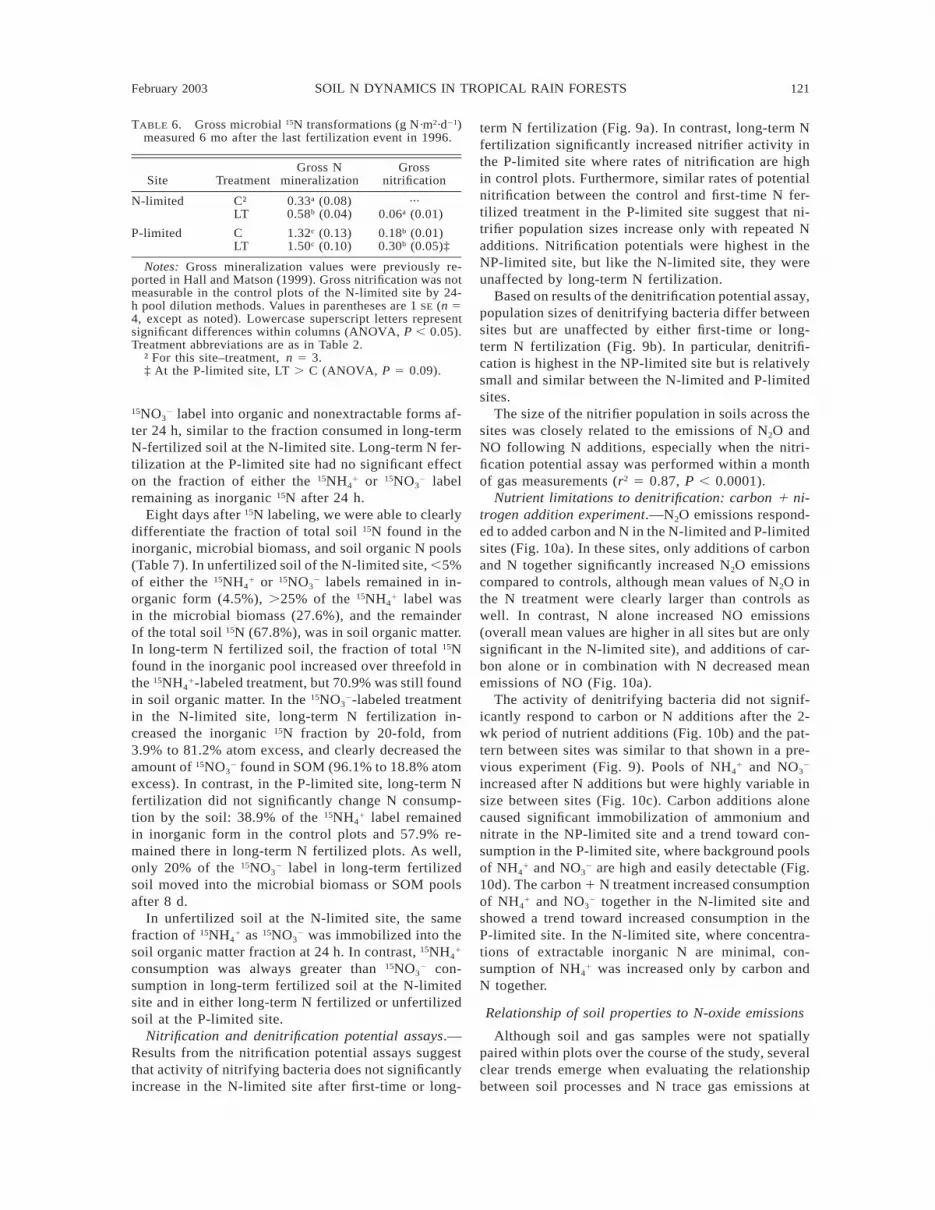
Nitrification and denitrification potential assays.—Results from the nitrification potential assays suggestthat activity of nitrifying bacteria does not significantlyincrease in the N-limited site after first-time or long-
term N fertilization (Fig. 9a). In contrast, long-term Nfertilization significantly increased nitrifier activity inthe P-limited site where rates of nitrification are highin control plots. Furthermore, similar rates of potentialnitrification between the control and first-time N fer-tilized treatment in the P-limited site suggest that ni-trifier population sizes increase only with repeated Nadditions. Nitrification potentials were highest in theNP-limited site, but like the N-limited site, they wereunaffected by long-term N fertilization.
Based on results of the denitrification potential assay,population sizes of denitrifying bacteria differ betweensites but are unaffected by either first-time or long-term N fertilization (Fig. 9b). In particular, denitrifi-cation is highest in the NP-limited site but is relativelysmall and similar between the N-limited and P-limitedsites.
The size of the nitrifier population in soils across thesites was closely related to the emissions of N2O andNO following N additions, especially when the nitri-fication potential assay was performed within a monthof gas measurements (r2 5 0.87, P , 0.0001).
Nutrient limitations to denitrification: carbon 1 ni-trogen addition experiment.—N2O emissions respond-ed to added carbon and N in the N-limited and P-limitedsites (Fig. 10a). In these sites, only additions of carbonand N together significantly increased N2O emissionscompared to controls, although mean values of N2O inthe N treatment were clearly larger than controls aswell. In contrast, N alone increased NO emissions(overall mean values are higher in all sites but are onlysignificant in the N-limited site), and additions of car-bon alone or in combination with N decreased meanemissions of NO (Fig. 10a).
The activity of denitrifying bacteria did not signif-icantly respond to carbon or N additions after the 2-wk period of nutrient additions (Fig. 10b) and the pat-tern between sites was similar to that shown in a pre-vious experiment (Fig. 9). Pools of NH4
1 and NO32
increased after N additions but were highly variable insize between sites (Fig. 10c). Carbon additions alonecaused significant immobilization of ammonium andnitrate in the NP-limited site and a trend toward con-sumption in the P-limited site, where background poolsof NH4
1 and NO32 are high and easily detectable (Fig.
10d). The carbon 1 N treatment increased consumptionof NH4
1 and NO32 together in the N-limited site and
showed a trend toward increased consumption in theP-limited site. In the N-limited site, where concentra-tions of extractable inorganic N are minimal, con-sumption of NH4
1 was increased only by carbon andN together.
Relationship of soil properties to N-oxide emissions
Although soil and gas samples were not spatiallypaired within plots over the course of the study, severalclear trends emerge when evaluating the relationshipbetween soil processes and N trace gas emissions at

122 SHARON J. HALL AND PAMELA A. MATSON Ecological MonographsVol. 73, No. 1
TABLE 7. Fraction of total soil 15N found in different soil pools after 24-h and 8-d laboratory incubations.
Site Treatment
Inorganic N
InitialNH4
1-N(mg/g)
InitialNO3
2-N(mg/g)
InitialAPE†
Fraction of totalsoil 15N excess (%)
24 h 8 d15NH4
1 additionN-limited
P-limited
C§LTCLT
6.7 (1.0)17.8 (2.9)10.1 (2.1)13.5 (3.5)
0.3 (0.1)8.9 (6.9)7.5 (0.8)
12.6 (3.4)
9.0 (1.4)9.0 (2.5)
13.6 (1.5)11.8 (1.0)
7.5a (2.7)45.4b (10.5)45.0b (6.1)49.7b (12.5)
4.5a (0.01)15.1b (2.6)38.9c (6.2)57.9c (10.6)
15NO32 addition
N-limited
P-limited
C§\LTCLT
6.7 (1.0)17.8 (2.9)10.1 (2.1)13.5 (3.5)
0.3 (0.1)8.9 (6.9)7.5 (0.8)
12.6 (3.4)
84.7 (7.7)43.8 (18.1)10.9 (0.78)11.4 (2.3)
7.1a (3.6)113.6b (11.4)
72.5c (7.4)91.1bc (7.7)
3.9a (1.4)81.2b (4.0)58.1b (6.2)79.9b (7.5)
Notes: Treatment abbreviations are: C, control; LT, long-term N fertilized. Values in parentheses are 1 SE (n 5 4, exceptas noted). Results from the 15NH4
1 addition were previously reported in Hall and Matson (1999). Soil organic 15N 5 total15N 2 KCl extractable 15N unless otherwise noted (e.g., 8-d soil organic N). Lowercase superscript letters represent significantdifferences within columns (ANOVA, P , 0.05).
† Atom% 15N excess as inorganic N measured 15 min after labeling with either 15NH41 or 15NO3
2. ‘‘Initial’’ pools weremeasured immediately prior to 15N additions.
‡ Microbial biomass subtracted.§ For this site–treatment combination, n 5 3.\ Pool sizes of NO3
2 were so small in the control plots at the N-limited site that the calculated fraction of 15NO32 excess
at 24 h was much greater than 100% after subtracting the 14N spike, natural abundance 15N, and blank (Stark and Hart, 1996).Since 99% atom excess of 15NO3
2 was added at the beginning of the experiment, 99% was used as the corrected value of15NO3
2 atom excess at the 24-h time point.
the ecosystem scale. Percentage water-filled pore spaceof the soil was a significant but weak predictor of theratio of background (prefertilization) N2O to NO emis-sions (N2O / NO) in the 4 wk prior to fertilization (r2
5 0.12, P 5 0.002; Fig. 11a). Similarly, backgroundpools of nitrate (r2 5 0.12, P 5 0.0002), and net ratesof mineralization (r2 5 0.06, P 5 0.03), nitrification(r2 5 0.14, P 5 0.0003) and the ratio of NO3
2/NH41
(r2 5 0.22, P , 0.0001), were significant but poorpredictors of total N-oxide (N2O 1 NO) flux withinplots before N additions. In contrast, several soil poolsand processes measured before fertilization were strongpredictors of N2O 1 NO fluxes after N additions (post-fertilization), including nitrate (r2 5 0.51, P , 0.0001;Fig. 11b), the ratio of NO3
2 to NH41 (NO3
2/NH41; r2
5 0.63, P , 0.0001; Fig. 11c), net nitrification (r2 50.56, P , 0.0001), and net mineralization (r2 5 0.68,P , 0.0001), Primarily due to the high spatial vari-ability of soil inorganic N pools following N additions,postfertilization rates of net nitrification (r2 5 0.434,P , 0.0001) and N mineralization (r2 5 0.555, P ,0.0001) were weaker predictors of total N-oxide emis-sions than prefertilization rates. Similarly, backgroundrates of potential nitrification were significantly relatedto total N-oxide fluxes after N additions across sites(r2 5 0.489, P , 0.0001; Fig. 11d), although the re-lationship is less clear within only the NP-limited andP-limited sites. However, when measured within 1 wkof gas fluxes, background rates of potential nitrificationwere strong predictors of total N-oxide emissions afterN additions (N-limited and P-limited sites only; r2 50.746, P , 0.001).
DISCUSSION
Response of N-oxide emissions to N additions inHawaiian tropical forests
The shift from N to P-limitation of primary productionover long-term soil development across the HawaiianIslands provides a natural gradient of N fertility withinwhich we can evaluate tropical ecosystem responses toN inputs. In the forest where primary production is lim-ited by N, N2O and NO emissions following N inputswere not significantly different than controls after first-time N inputs, whereas they were small but significantlygreater than controls after 11 yr of N fertilization. Re-sults from a combination of soil N transformation assayssuggest that mechanisms of N consumption in micro-organisms and SOM are strong in the N-limited forestand are likely to be responsible in part for the low lossesof N as soil N-oxides following N-fertilization in thissystem. Relative population sizes or activity of nitrifyingbacteria, and gross and net rates of N mineralization andnitrification in unfertilized soil are smallest in this N-limited tropical system compared to the other sites acrossthe substrate-age gradient. Furthermore, despite largeexchangeable pools of inorganic N after N additions, netN consumption was high after fertilization rates of upto 75 kg N/ha. Less than 0.6% of the applied N at anydosage was lost as N-oxides over a 7-d period. Resultsfrom our 15N experiments further support this trend:.70% of the 15NH4
1 label and .90% of the 15NO32 label
were taken out of solution by unfertilized soils over an8-d laboratory incubation.
February 2003 123SOIL N DYNAMICS IN TROPICAL RAIN FORESTS
TABLE 7. Extended.
Microbial biomass N
Initial(mg N/g)
Fraction of totalsoil 15N excess (%)
8 d
Soil organic N
Total N (%)
Fraction of totalsoil 15N excess (%)
24 h 8 d‡
193.4 (4.7)218.6 (29.6)265.1 (39.3)292.7 (28.8)
27.6a (3.5)14.0b (2.8)16.6b (2.2)17.8b (1.8)
0.9 (0.1)1.1 (0.1)1.5 (0.3)1.6 (0.2)
92.5 (2.7)54.6 (10.5)55.0 (6.1)50.3 (12.5)
67.8 (4.3)70.9 (3.2)44.5 (6.3)24.3 (10.1)
193.4 (4.7)218.6 (29.6)265.1 (39.3)292.7 (28.8)
NANANANA
0.9 (0.1)1.1 (0.1)1.5 (0.3)1.6 (0.2)
92.9 (3.6)0 (11.4)
27.5 (7.4)8.9 (7.7)
96.1 (0.8)18.8 (6.7)41.9 (6.4)20.1 (10.5)
FIG. 9. (a) Nitrification potentials in soils of all sites (mgNO3
2-N produced·m22·d21). Treatment abbreviations are as inFig. 2. FT plots were fertilized once with 50 kg N/ha. (b)Denitrification potentials (mg N2O-N·m22·min21) at all sites.FT plots had received N two times within the prior year at50 kg N/ha per application. All soils were collected 6 moafter N additions. The asterisk (*) indicates LT . C and LT. FT (P , 0.05, n 5 4).
Chronic, long-term anthropogenic N inputs are ac-tively incorporated into biomass in this N-limited sys-tem and significantly increase N availability over time.Current and prior studies at this site have found thatboth aboveground net primary production and concen-trations of N in living and senesced foliage of M. po-lymorpha increase with long-term N additions (Vitou-sek et al. 1993; Harrington et al. 2001). In this study,we found that long-term N additions doubled rates ofgross N mineralization in the soil while decreasing netmicrobial N immobilization by 50%. Likewise, long-term N fertilization significantly increased rates of netN mineralization and net nitrification to small but pos-itive levels and increased soil inorganic N availabilityby nearly eliminating microbial consumption of NO3
2.Nonetheless, total pool sizes of N remain low in thisforest, despite .1000 kg N/ha applied over an 11-yrperiod. While these soils are clearly strong consumersof N (ratios of net nitrification to N mineralization K1,and .70% of added NH4
1 in solution became incor-porated into SOM in laboratory studies), significantloss pathways other than gas emissions are necessaryto explain N stocks in these forests. Recent work byK. A. Lohse and P. A. Matson (personal communica-tion) suggest that solution leaching in the young, poorlydeveloped soils may account for considerable N losses.
The response of this tropical N-limited forest to an-thropogenic N inputs is consistent with responses ofother experimentally fertilized N-limited forests andforests experiencing high levels of atmospheric N de-position in the temperate zone. Similar to our findingsin the N-limited forest, chronic N additions signifi-cantly increased soil acidity (Grennfelt and Hultberg1986), gross N mineralization and nitrification (Tie-tema 1998), N availability (McNulty and Aber 1993,Magill et al. 1997, Gundersen et al. 1998), and de-creased immobilization of NO3
2 (Durka et al. 1994).N losses as trace gases also increase after systems havereceived chronic N inputs for long time periods, butthe extent and importance of these losses vary consid-erably between systems and, except for a few cases
(Schmidt et al. 1988, Brumme and Beese 1992, Papenet al. 1993, Fenn et al. 1996) remain relatively small.
N additions to tropical forests where N does not limitprimary production resulted in very different responsesthan those observed in the N-limited tropical forest.Both first-time and long-term N additions in the P-limited site led to large fluxes of N2O and NO in theweeks following fertilization, on the order of emissionsmeasured from recently fertilized agricultural soils in

124 SHARON J. HALL AND PAMELA A. MATSON Ecological MonographsVol. 73, No. 1
FIG. 10. Gas emissions and soil transformations two weeks following the beginning of carbon and N factorial additions:(a) N2O and NO emissions, (b) denitrification potential, (c) NH4
1 and NO32 pools, and (d) net N mineralization and net
nitrification. Within a site, different lowercase letters indicate significant differences (ANOVA, P # 0.05, n 5 4).
both temperate and tropical systems (Eichner 1990,Hall et al. 1996, Weitz et al. 2001). In contrast to N-limited forests, losses of N as N-oxides following Nadditions are large and immediate, suggesting that thelag period of N accumulation predicted for N-limitedsystems is not applicable in systems where P limitsplant growth. Our experiments in plots that were fer-tilized with both N and P in the P-limited site showthat N availability and N-oxide losses are consistentlylower when plant demand for added N (N 1 P plots)is greater compared to when N availability is in excessof plant demand (N alone plots). In unfertilized soil inthis P-limited tropical forest, total SOM, soil N andcarbon, and rates of net and gross N mineralization arelarge in control plots despite extreme soil acidity, andthey do not change with long-term N additions. Fur-thermore, microbial demand for N is small relative tothat in the N-limited site: nearly half of the added15NH4
1 label and almost all of the 15NO32 label re-
mained as inorganic N in both unfertilized and long-term N fertilized soil, and 40% or less was removedinto the nonextractable soil organic fraction after an 8-d incubation. Moreover, ratios of net nitrification to N
mineralization suggest that the majority of N that ismineralized is also nitrified.
N additions to the intermediate-aged, NP-limited for-est resulted in similar responses to those observed inthe P-limited forest, but variability obscured clear dif-ferences between treatments. Soils in the NP-limitedsite supported the largest statured and most productiveforest as well as the highest activity of nitrifying anddenitrifying microorganisms of all sites. Likewise, inthe NP-limited site we measured the greatest hetero-geneity in soil properties, processes, and soil N-oxideemissions. Because primary production here is respon-sive to N only in combination with P, we expected thata larger fraction of N inputs would be available to beprocessed by nitrifying and denitrifying microorgan-isms than in the N-limited site and would lead to greaterlosses of N as N2O and NO after fertilization. Althoughvariability was high, N-oxide emissions after first-timeN fertilization were significantly larger than controlsand continued to increase in magnitude with long-termN fertilization as expected. Similar to the P-limitedforest, N availability in the NP-limited forest is high:net rates of N mineralization and nitrification were con-

February 2003 125SOIL N DYNAMICS IN TROPICAL RAIN FORESTS
FIG. 11. Correlations between soil properties and N-oxide emissions. (a) Percentage WFPS (water-filled pore space) vs.the log ratio of background emissions of N2O and NO. All measurements were taken within 4 wk prior to N fertilization(prefert.). (b) Background soil pools of available nitrate measured within 4 wk prior to N-additions vs. log N-oxide emissionsmeasured 1 wk following N additions in the FT and LT plots (postfert.) (FT 5 first-time N-fertilized; LT 5 long-term N-fertilized). One outlier in the FT plots of the NP-limited site was excluded. (c) Background ratio of soil nitrate to soilammonium measured within 1 mo prior to N additions vs. log N-oxide emissions measured 1 wk following N additions inthe FT and LT plots. Nitrate and ammonium pools were transformed equally to nonzero values. One outlier in the FT plotsof the NP-limited site was excluded. (d) Background nitrification potentials measured within 6 mo prior to N additions vs.log N-oxide emissions measured 1 wk following N additions in the FT and LT plots. All N2O and NO were transformedequally to nonzero values prior to log-transformation.
sistently large and positive, and their ratio (nitrifica-tion/N mineralization) was always .1.
Relationship of N-oxide emissions to soil propertiesand processes
Soil N-oxides are produced by both nitrifying anddenitrifying microorganisms, and the relative impor-tance of each group depends on soil characteristics suchas diffusional pathways and carbon, nitrogen, and ox-ygen availability (Firestone and Davidson 1989). Long-term N fertilization did not alter the size of the deni-trifying community at any of our sites along the sub-strate-age gradient. Denitrifiers are a subset of the largepool of heterotrophic soil microorganisms that use ni-trate as an alternative electron acceptor in the absenceof oxygen. It is possible that the growth of denitrifyingpopulations is not limited by N in these systems, orsufficient oxygen was available to denitrifiers such thatincreased nitrate availability did not confer a significantgrowth advantage to the denitrifying community that
could be detectable by this assay. Indeed, it is not un-common that estimates of denitrifying enzyme activityare unresponsive to N additions or availability and failto adequately predict N gas emissions in laboratoryand field studies (Myrold and Tiedje 1985, Parsons etal. 1991, Veldkamp et al. 1999).
In contrast, our data show that increased N avail-ability has favored the activity of nitrifiers (and thuspossibly their competitive advantage) and they likelyplay an important role in regulating the small but con-sistent losses of N2O and NO observed in long-term Nfertilized plots in the N-limited site. Likewise, wefound that nitrifier populations were extremely sensi-tive to N additions in our P-limited site, and their pop-ulation size was highly correlated with N-oxide emis-sions immediately following N additions. It is likelythat increased soil N-oxides following N additions re-flects the increased activity and growth of nitrifyingrather than denitrifying microorganisms. In support ofthis hypothesis, it has recently been demonstrated that

126 SHARON J. HALL AND PAMELA A. MATSON Ecological MonographsVol. 73, No. 1
FIG. 12. N cycles in N-limited (left side of figure, gray arrows) and P-limited (right side of figure, black arrows) tropicalforests. Only processes and pools related to soil N-oxide emissions in this study are shown. The size of arrows representsthe relative rate of each process; the size of boxes represents the relative size of each pool.
nitrification is the primary source of N2O in unfertilizedareas in the majority of sites across the Hawaiian sub-strate-age gradient (L. O. Hedin, P. M. Vitousek, andP. A. Matson, unpublished manuscript).
Johnson (1992) has suggested that N losses follow-ing N additions are proportional to the size of the ni-trifying population in a system, and that small, frequentN inputs will stimulate a gradual population increaseover time (Johnson 1992). Emissions of N2O and NOwere equally large in magnitude from both small andlarge doses of N in our P-limited site, resulting in a4% loss of N as N2O 1 NO from the smallest dosageover 7 d (Hall and Matson, 1999). Based on these re-sults, fluxes of N-oxides are not linearly related to doseof N in either the N-limited or P-limited sites, but in-stead they increase up to a threshold that was reachedat 15 kg N/ha in the P-limited forest and 50 kg N/hain the N-limited forest. Given that the population sizeof nitrifying microorganisms is substantially differentbetween sites, it is possible that nitrifiers become ‘‘sat-urated’’ with N at different levels in each forest andgas emissions following N additions are reflective ofthe respective sizes of the active nitrifier communities.An alternative possibility is that the organisms them-selves or the community structure of nitrifiers may besubstantially different between sites.
Correlations between soil properties and N-oxideemissions were weak prior to fertilization in part dueto the spatial differences between gas and soil collec-
tion on each sampling day. However, when viewedacross sites and after N additions, several generaliza-tions can be made. As expected based on the ‘‘hole-in-the-pipe’’ model of N trace gas emissions from soils(Firestone and Davidson 1989, Crill et al. 2000, Da-vidson et al. 2000, Erickson et al. 2001, Weitz et al.2001) as water-filled pore space decreased, so did theratio of N2O to NO: NO fluxes were often far greaterthan N2O fluxes at our P-limited site. Similarly, themagnitude of N-oxide emissions following fertilizationwas largely controlled by N availability. The strongcorrelations that we found between different indicatorsof nitrifier activity (potential nitrification, soil nitrateconcentrations, ratio of nitrate to ammonium) and gasfluxes support the hypothesis that the activity, size, orstructure of the nitrifier population controls the mag-nitude of N-oxide emissions after fertilization.
Abiotic adsorption by the mineral and organic mattercolloid fraction of soil is a process known to efficientlyremove inorganic N from the labile pool, but typicallyit accounts for only 20–40% of N loss in soils incubatedwith 15N (Schimel and Firestone 1989, Davidson et al.1991). In these Hawaiian soils, a plausible explanationfor the different patterns of N consumption betweensites and treatments is that N is rapidly immobilizedinto the microbial biomass in our N-limited site, andover time, N becomes sequestered into the recalcitrant,humic soil pool after turnover of the microbial popu-lation (Fig. 12). However, because total pool sizes of

February 2003 127SOIL N DYNAMICS IN TROPICAL RAIN FORESTS
soil N did not significantly increase after long-term Ninputs, it is also likely that loss pathways other thantrace gas emissions are important in this N-limited sys-tem. In contrast, relatively low microbial N immobi-lization in our P-limited system may explain why onlya small fraction of added N is moved to the SOM poolover time.
Hawaiian rain forests are different than other rainforests in the tropics, in part because they are locatedon an extremely isolated island chain and support acharacteristically low diversity of species. However,similar to this P-limited Hawaiian soil, other highlyweathered soils in the tropics are known to cycle Nquickly, support strong nitrate economies (Vitousekand Matson 1988, Neill et al. 1997, Weitz et al. 1998,Matson et al. 1999, Erickson et al. 2001), and maysupport vegetation that is more limited by P or otherrock-derived nutrients relative to N (Vitousek and San-ford 1986, Matson and Vitousek 1987, Martinelli et al.1999). Soil and climatic maps can be used to identifyareas of tropical forests growing on highly weatheredsoils such as Oxisols and Ultisols; however, their usein extrapolation may be limited because traditional soilclassifications do not explicitly characterize nutrientstatus of soils or biota, including N cycling and therelationship of available nitrogen to phosphorus or oth-er rock-derived nutrients, which may be important con-trolling factors of N-oxide response to N additions.Currently, experimental evidence from other long-termN-fertilized tropical forests is very limited (Ericksonet al. 2001); however our data suggest that humid, trop-ical P-limited yet N-rich forests may respond very dif-ferently to N additions than N-limited forests, with po-tentially large and immediate losses of N as soil N-oxides that can be predicted by multiple measures ofsoil N availability.
CONCLUSIONS
Emissions of soil N-oxide gases following N addi-tions in tropical montane rain forests clearly variedwith substrate age and nutrient status. Multiple exper-imental methods show that microbial processes in soilsfrom N-limited forests are strong consumers of N, evenafter 11 yr of N additions. In contrast, soils from foreststhat are limited by P alone or P and N together maybe relatively ‘‘N saturated’’ in that N is consumed lessstrongly and more is thus available to nitrifying anddenitrifying microorganisms that are responsible forlosses of soil N-oxides. The abundance of nitrifyingmicroorganisms and the nitrate pool were strong pre-dictors of the magnitude and extent of N-oxide emis-sions following N additions in all sites. It is likely thatthe large emissions of N-oxides we observe followingN fertilization in this P-limited forest are a combinedresult of high inorganic N availability and large pop-ulations of nitrifying microorganisms. Whether theabundance and activity of nitrifying microorganismscan predict the magnitude of N-oxide losses following
N additions in other temperate and tropical systems isa topic that should be explored in future studies.
Given that land use change, fertilizer use, and in-dustrialization are rapidly growing in developing areasof the tropics, chronic deposition of N to tropical for-ests will likely increase and persist into the future.While this study was not intended to simulate atmo-spheric deposition in rates or form of N input, ourresults suggest that temperate zone models that predictecosystem-level responses to N deposition may needto be modified to incorporate tropical systems that ex-perience P-limitation.
ACKNOWLEDGMENTS
This work was supported by fellowships from the NationalScience Foundation and the NASA Earth Systems ScienceProgram to S. Hall, and by grants from the USDA TerrestrialEcosystem and Global Change Program and the Mellon Foun-dation to P. Matson. We thank P. Vitousek for providing accessto sites and facilities for this research, C. D’Antonio, G. P.Asner, M. K. Firestone, F. C. Thornton, and P. Vitousek forhelpful comments on the manuscript, and T. Billow, D. Turner,D. Herman, P. Brooks, T. Sprunk, M. Mack, T. Schuur, S.Hobbie, B. Ostertag, H. Pearson, J. Funk, J. Wagner, C.Young, and others for assistance in the field and laboratory.We especially thank J. Moen and H. Farrington for adviceand assistance throughout the study.
LITERATURE CITED
Aber, J. D., A. Magill, S. G. McNulty, R. D. Boone, K. J.Nadelhoffer, M. Downs, and R. Hallett. 1995. Forest bio-geochemistry and primary production altered by nitrogensaturation. Water, Air, and Soil Pollution 85:1665–1670.
Aber, J. D., K. J. Nadelhoffer, P. Steudler, and J. M. Melillo.1989. Nitrogen saturation in northern forest ecosystems.BioScience 39:378–386.
Agren, G. I., and E. Bosatta. 1988. Nitrogen saturation ofterrestrial ecosystems. Environmental Pollution 54:185–197.
Berendse, F., R. Aerts, and R. Bobbink. 1993. Atmosphericnitrogen deposition and its impact on terrestrial ecosys-tems. Pages 105–121 in C. C. Vos and P. Opdam, editors.Landscape ecology of a stressed environment. Chapmanand Hall, London, UK.
Brumme, R., and F. Beese. 1992. Effects of liming and ni-trogen fertilization on emissions of CO2 and N2O from atemperate forest. Journal of Geophysical Research 97:12 851–12 858.
Crews, T. E., K. Kitayama, J. H. Fownes, R. H. Riley, D. A.Herbert, D. Mueller-Dombois, and P. M. Vitousek. 1995.Changes in soil phosphorus fractions and ecosystem dy-namics across a long chronosequence in Hawaii. Ecology76:1407–1424.
Crill, P. M., M. Keller, A. Weitz, B. Grauel, and E. Veldkamp.2000. Intensive field measurements of nitrous oxide emis-sions from a tropical agricultural soil. Global Biogeochem-ical Cycles 14:85–95.
Davidson, E. A. 1993. Soil water content and the ratio ofnitrous oxide to nitric oxide emitted from soil. Pages 369–386 in R. S. Oremland, editor. Biogeochemistry of globalchange: radiatively active trace gases. Chapman and Hall,London, UK.
Davidson, E. A., R. W. Eckert, S. C. Hart, and M. K. Fire-stone. 1989. Direct extraction of microbial biomass nitro-gen from forest and grassland soils of California. Soil Bi-ology and Biochemistry 21:773–778.
Davidson, E. A., S. C. Hart, C. A. Shanks, and M. K. Fire-stone. 1991. Measuring gross nitrogen mineralization, im-

128 SHARON J. HALL AND PAMELA A. MATSON Ecological MonographsVol. 73, No. 1
mobilization, and nitrification by 15N isotopic pool dilutionin intact soil cores. Journal of Soil Science 42:335–349.
Davidson, E. A., M. Keller, H. E. Erickson, L. V. Verchot,and E. Veldkamp. 2000. Testing a conceptual model of soilemissions of nitrous and nitric oxides. BioScience 50:667–680.
Dise, N. B., and R. F. Wright. 1995. Nitrogen leaching fromEuropean forests in relation to nitrogen deposition. ForestEcology and Management 71:153–161.
Durka, W., E. D. Schulze, G. Gebauer, and S. Voerkelius.1994. Effects of forest decline on uptake and leaching ofdeposited nitrate determined from 15N and 18O measure-ments. Nature 372:765–767.
Eichner, M. J. 1990. Nitrous oxide emissions from fertilizedsoils: summary of available data. Journal of EnvironmentalQuality 19:272–280.
Erickson, H., M. Keller, and E. A. Davidson. 2001. Nitrogenoxide fluxes and nitrogen cycling during postagriculturalsuccession and forest fertilization in the humid tropics.Ecosystems 4:67–84.
Fenn, M. E., M. A. Poth, J. D. Aber, J. S. Baron, B. T. Bor-mann, D. W. Johnson, A. D. Lemly, S. G. McNulty, D. F.Ryan, and R. Stottlemyer. 1998. Nitrogen excess in NorthAmerican ecosystems: predisposing factors, ecosystem re-sponses, and management strategies. Ecological Applica-tions 8:706–733.
Fenn, M. E., M. A. Poth, and D. W. Johnson. 1996. Evidencefor nitrogen saturation in the San Bernardino Mountains inSouthern California. Forest Ecology and Management 82:211–230.
Firestone, M. K., and E. A. Davidson. 1989. Microbiologicalbasis of NO and N2O production and consumption in soil.Pages 7–21 in M. O. Andreae and D. S. Schimel, editors.Exchange of trace gases between terrestrial ecosystems andthe atmosphere. John Wiley and Sons, New York, NewYork, USA.
Galloway, J. N. 1995. Acid deposition: perspectives in timeand space. Water, Air, and Soil Pollution 85:15–24.
Galloway, J. N., H. Levy, II, and P. S. Kasibhatla. 1994. Year2020: consequences of population growth and developmenton the deposition of oxidized nitrogen. Ambio 23:120–123.
Grennfelt, P., and H. Hultberg. 1986. Effects of nitrogen de-position on the acidification of terrestrial and aquatic eco-systems. Water, Air, and Soil Pollution 30:945–963.
Gundersen, P., B. A. Emmett, O. J. Kjønaas, C. J. Koopmans,and A. Tietema. 1998. Impact of nitrogen deposition onnitrogen cycling in forests: a synthesis of NITREX data.Forest Ecology and Management 101:37–55.
Hall, S. J., and P. A. Matson. 1999. Nitrogen oxide emissionsafter nitrogen additions in tropical forests. Nature 400:152–155.
Hall, S. J., P. A. Matson, and P. M. Roth. 1996. NOx emissionsfrom soil: implications for air quality modeling in agri-cultural regions. Annual Review of Energy and the Envi-ronment 21:311–346.
Harrington, R. A., J. H. Fownes, and P. M. Vitousek. 2001.Production and resource use efficiencies in N- and P-limitedtropical forests: a comparison of responses to long-termfertilization. Ecosystems 4:646–657.
Hart, S. C., J. M. Stark, E. A. Davidson, and M. K. Firestone.1994. Nitrogen mineralization, immobilization, and nitri-fication. Pages 985–1018 in Methods of soil analysis, part2, microbiological and biochemical properties. Soil ScienceSociety of America, Madison, Wisconsin, USA.
Herbert, D. A., and J. H. Fownes. 1995. Phosphorus limi-tation of forest leaf area and net primary production on ahighly weathered soil. Biogeochemistry 29:223–235.
IPCC (Intergovernmental Panel on Climate Change). 1996.Climate change 1995: the science of climate change. Cam-bridge University Press, Cambridge, UK.
Johnson, D. 1992. Nitrogen retention in forest soils. Journalof Environmental Quality 21:1–12.
Juvick, S. P., and J. O. Juvick, editors. 1998. Atlas of Hawaii.Third edition. University of Hawaii Press, Honolulu, Ha-waii, USA.
Keller, M. 1988. Emissions of N2O from tropical forest soils:response to fertilization with NH4
1, NO32, and PO4
2. Jour-nal of Geophysical Research 93:1600–1604.
Keller, M., W. A. Kaplan, and S. C. Wofsy. 1986. Emissionsof N2O, CH4, and CO2 from tropical soils. Journal of Geo-physical Research 91:11 791–11 801.
Kirkham, D., and W. V. Bartholomew. 1954. Equations forfollowing nutrient transformations in soil utilizing tracerdata. Soil Science Society of America Proceedings 18:33–34.
Lovett, G. M., and J. D. Kinsman. 1990. Atmospheric pol-lutant deposition to high elevation ecosystems. Atmospher-ic Environment 24A:2767–2786.
Magill, A. H., and J. D. Aber. 1999. Long-term effects ofexperimental nitrogen additions on foliar litter decay andhumus formation in forest ecosystems. Plant and Soil 203:301–311.
Magill, A. H., J. D. Aber, J. J. Hendricks, R. D. Bowden, J.M. Melillo, and P. A. Steudler. 1997. Biogeochemical re-sponse of forest ecosystems to simulated chronic nitrogendeposition. Ecological Applications 7:402–415.
Martinelli, L. A., M. C. Piccolo, A. R. Townsend, P. M. Vi-tousek, E. Cuevas, W. McDowell, G. P. Robertson, O. C.Santos, and K. Treseder. 1999. Nitrogen stable isotopecomposition in leaves and soils: tropical versus temperateforests. Biogeochemistry 46:45–65.
Matson, P. A., C. Billow, S. Hall, and J. Zachariassen. 1996.Fertilization practices and soil variations control nitrogenoxide emissions from tropical sugar cane. Journal of Geo-physical Research 101:18 533–18 545.
Matson, P. A., S. T. Gower, C. Volkmann, C. Billow, and C.C. Grier. 1992. Soil nitrogen cycling and nitrous oxide fluxin a Rocky Mountain Douglas-fir forest: effects of fertil-ization, irrigation and carbon additions. Biogeochemistry18:101–117.
Matson, P. A., W. H. McDowell, A. R. Townsend, and P. M.Vitousek. 1999. The globalization of N deposition: eco-system consequences in tropical environments. Biogeo-chemistry 46:152–155.
Matson, P. A., and P. M. Vitousek. 1987. Cross-system com-parisons of soil nitrogen transformations and nitrous oxideflux in tropical forest ecosystems. Global BiogeochemicalCycles 1:163–170.
Matson, P. A., and P. M. Vitousek. 1990. Ecosystem approachto a global nitrous oxide budget. BioScience 40:667–672.
McNulty, S. G., and J. D. Aber. 1993. Effects of chronicnitrogen additions on nitrogen cycling in a high-elevationspruce–fir stand. Canadian Journal of Forest Research 23:1252–1263.
Myrold, D. D., and J. M. Tiedje. 1985. Establishment ofdenitrification capacity in soil: effects of carbon, nitrate,and moisture. Soil Biology and Biochemistry 17:819–822.
Neill, C., M. C. Piccolo, C. C. Cerri, P. A. Steudler, J. M.Melillo, and M. Brito. 1997. Net nitrogen mineralizationand net nitrification rates in soils following deforestationfor pasture across the southwestern Brazilian Amazon Ba-sin landscape. Oecologia 110:243–252.
Nelson, D. W., and L. E. Sommers. 1982. Total carbon, or-ganic carbon, and organic matter. Pages 539–579 in Meth-ods of soil analysis, part 2, chemical and microbiologicalproperties. Soil Science Society of America, Madison, Wis-consin, USA.
Papen, H., B. Hellmann, H. Papke, and H. Rennenberg. 1993.Emission of N-oxides from acid irrigated and limed soilsof a coniferous forest in Bavaria. Pages 245–259 in R. S.

February 2003 129SOIL N DYNAMICS IN TROPICAL RAIN FORESTS
Oremland, editor. Biogeochemistry of global change: ra-diatively active trace gases. Chapman and Hall, London,UK.
Parsons, L. L., R. E. Murray, and M. S. Smith. 1991. Soildenitrification dynamics: spatial and temporal variations ofenzyme activity, populations, and nitrogen gas loss. SoilScience Society of America Journal 55:90–95.
Richards, B. N. 1987. The microbiology of terrestrial eco-systems. John Wiley and Sons, New York, New York, USA.
Riley, R. H., and P. M. Vitousek. 1995. Nutrient dynamicsand nitrogen trace gas flux during ecosystem developmentin montane rain forest. Ecology 76:292–304.
Schimel, J. P., and M. K. Firestone. 1989. Inorganic N in-corporation by coniferous forest floor material. Soil Biol-ogy and Biochemistry 21:41–46.
Schmidt, J., W. Seiler, and R. Conrad. 1988. Emission ofnitrous oxide from temperate forest soils into the atmo-sphere. Journal of Atmospheric Chemistry 6:95–115.
Schulze, E. D. 1989. Air pollution and forest decline in aspruce (Picea abies) forest. Science 244:776–782.
SPSS. 1992. Systat for the Macintosh. SPSS, Chicago, Il-linois, USA.
Stark, J. M., and S. C. Hart. 1996. Diffusion technique forpreparing salt solutions, Kjeldahl digests, and persulfatedigests for nitrogen-15 analysis. Soil Science Society ofAmerica Journal 60:1846–1855.
Tanner, E. V. J., P. M. Vitousek, and E. Cuevas. 1998. Ex-perimental investigation of nutrient limitation of forestgrowth on wet tropical mountains. Ecology 79:10–22.
Tiedje, J. M. 1982. Denitrification. Pages 1011–1026 in A.L. Page, editor. Methods of soil analysis, part 2. AmericanSociety of Agronomy, Soil Science Society of America,Madison, Wisconsin, USA.
Tietema, A. 1998. Microbial carbon and nitrogen dynamicsin coniferous forest floor material along a European nitro-
gen deposition gradient. Forest Ecology and Management101:29–36.
Torn, M. S., S. E. Trumbore, O. A. Chadwick, P. M. Vitousek,and D. M. Hendricks. 1997. Mineral control of soil organiccarbon storage and turnover. Nature 389:170–173.
Veldkamp, E., E. Davidson, H. Erickson, M. Keller, and A.Weitz. 1999. Soil nitrogen cycling and nitrogen oxideemissions along a pasture chronosequence in the humidtropics of Costa Rica. Soil Biology and Biochemistry 31:387–394.
Vitousek, P. M., and H. Farrington. 1997. Nutrient limitationand soil development: experimental test of a biogeochem-ical theory. Biogeochemistry 37:63–75.
Vitousek, P. M., and P. A. Matson. 1988. Nitrogen transfor-mations in a range of tropical forest soils. Soil Biology andBiochemistry 20:361–367.
Vitousek, P. M., and R. L. Sanford. 1986. Nutrient cyclingin moist tropical forest. Annual Review of Ecology andSystematics 17:137–167.
Vitousek, P. M., L. R. Walker, L. Whiteaker, and P. Matson.1993. Nutrient limitations to plant growth during primarysuccession in Hawaii Volcanoes National Park. Biogeo-chemistry 23:197–215.
Weitz, A., E. Linder, S. Frolking, P. M. Crill, and M. Keller.2001. N2O emissions from humid tropical agriculturalsoils: effects of soil moisture, texture and nitrogen avail-ability. Soil Biology and Biochemistry 33:1077–1093.
Weitz, A. M., E. Veldkamp, M. Keller, J. Neff, and P. M.Crill. 1998. Nitrous oxide, nitric oxide, and methane fluxesfrom soils following clearing and burning of tropical sec-ondary forest. Journal of Geophysical Research 103:28,047–28,058.
Zar, J. H. 1984. Biostatistical analysis. Second edition. Pren-tice-Hall, Englewood Cliffs, New Jersey, USA.


