Embed Size (px)
Citation preview

SCHOOL OF SCIENCE AND TECHNOLOGY
NUTRITION AND DIETETICS
BSN 2308
BANGLADESH OPEN UNIVERSITY SCHOOL OF SCIENCE AND TECHNOLOGY

NUTRITION AND DIETETICS
BSN 2308
Course Development Team Writers________________
Professor Dr. Shah Mohammad Keramat Ali Institute of Nutrition And Food Science University of Dhaka
Dr. Nigar Sultana Institute of Public Health Nutrition Mohakhali, Dhaka Editors________________
Dr. A.K.M. Alamgir Associate Professor National Medical College and Hospital, Dhaka
Md. Abdul Mojid Mondol School of Sciecne and Technology Bangladesh Open University Style Editors___________
Dr. Farida Easmin Shelley School of Sciecne and Technology Bangladesh Open University
Syeda Ifteara Khanum School of Sciecne and Technology Bangladesh Open University
Anwar Sadat School of Sciecne and Technology Bangladesh Open University Program Co-ordinator__
Md. Abdul Mojid Mondol School of Science and Technology Bangladesh Open University Supervision___________
Professor Khawja Jakaria Ahmad Chisty Dean School of Science and Technology Bangladesh Open University
BANGLADESH OPEN UNIVERSITY
Published by: Publishing, Printing and Distribution Division Bangladesh Open University, Gazipur-1705 © School of Science and Technology Bangladesh Open University September 2006
Computer Composed and DTP Layout by: Md. Jakir Hossain Cover Designed by Md. Monirul Islam Printed by: Emerald Printing Works 23/1, Zuriatuly Lane Nawabpur, Dhaka-1100
ISBN 98-34-4010-02
All right reserved. No Part of this book may be reproduced by any means without prior permission of the copyright holder.
SCHOOL OF SCIENCE AND TECHNOLOGY BANGLADESH OPEN UNIVERSITY

Why and how to use this book As a member of the health team, a nurse coordinates the activities of doctors, dieticians and
patients including diet prescription, food service, meal serving and patient’s response. Doctors
decide whether special nutritional care will benefit the patient while a dietician is responsible for
the nutritional care of patients. Nurses, therefore, need to be very careful to ensure that a patient
receives adequate nutrition.
We have included all relavent topics in this book and will advice nurses to read carefully and use
it as often as possible for the welfare of their patients.
We acknowledge help and co-operation of many and record here with gratitude Dr. Rumana Ali
Anee. Who underwent much trouble in going through the manuscript.
We shall be pleased if this book becomes useful to the learner.
Professor Dr. Shah Mohammad Keramat Ali
Dr. Nigar Sultana

Nutrition and Dietetics Content Unit 1 : Basic Concepts of Nutrition and Dietetics 1 Lesson 1 : Basic Principles in Nutrition ..................................................................... 1 Lesson 2 : Function, Daily Requirement and Source of Food: Micronutrients .......... 6 Lesson 3 : Desirable Body Weight and Energy Requirement .................................... 21 Lesson 4 : Planning Diet ............................................................................................. 25 Unit 2 : Food Safety and Hygiene 31 Lesson 1 : Criteria for Safe Food ................................................................................ 31 Lesson 2 : Hazards of Unsafe Food ............................................................................ 35 Lesson 3 : Maintenance of Food Hygiene .................................................................. 37 Lesson 4 : Preservation of Food ................................................................................. 39 Unit 3 : Diet and Disease 41 Lesson 1 : Dietary Management for a Hospitalized Patient ....................................... 41 Lesson 2 : Dietary Management of Disease-I, Diet in Diabetes Mellitus .................. 49 Lesson 3 : Dietary Management of Disease-II, Diet in Diarrhoea ............................. 55 Lesson 4 : Dietary Management of Disease-III, Diet in Cardiovascular Disease ...... 59 Lesson 5 : Dietary Management of Disease-IV, Diet in Renal Disease .................... 64 Supplement : How to Prepare Diet Plan .......................................................................... 67

Nutrition and Dietetics
Unit 1: Basic Concepts of Nutrition and Dietetics
Lesson 1: Basic Principles in Nutrition 1.1. Learning Objectives
At the end of this lesson you will be able to- ♦ describe the importance of nutrition in health and disease, ♦ list the effective nutritional interventions during nursing care, and ♦ distribute the roles of nurses as members of the health care team in
nutritional care.
1.2. What is Food? All living things need food. What we eat and drink to help keep us alive and well, to help us grow, develop, work and play is called food. Foods may be defined as a composite mixture of various chemical elements, which when taken, satisfies taste, and hunger. Food is one of our basic needs. 1.3. Why do we Eat? We eat whenever we are hungry. Satisfying hunger is just one function of food. However, there are other important functions that we usually do not think about when we eat. Every time we move, even when we are at rest we use energy. Food is needed to provide energy for work and warmth for the body. Basically, foods have three important functions, namely- What we eat and
drink to help keep us alive and well, to help us grow,
develop, work and play is called food
a. to give energy for all types of activity,
b. to help the body to grow in size and repair when injured, and
c. to protect the body from diseases. Ingested foods are utilized in our body after digestion, absorption and the process of metabolism. Foods contain chemical substances known as nutrients. Nutrition is the science of food and nutrients pertain to an interrelationship to health and disease. The modern science of nutrition helps us to understand the nutritive values of the wide variety of available foods and how each nutrient in food, in combination with others, serve specific functions for the growth, development and maintenance of our tissues.
Bangladesh Open University 1

Basic Concepts of Nutrition and Dietetics
Food also supplies minerals and vitamins. The daily requirement for minerals and vitamins may be small in quantity but they play an important role in protecting organs and regulating their functions. The human body requires six major nutrients called proximate principles of food. These are-
1. Carbohydrates
2. Proteins
3. Fats
4. Vitamins
5. Minerals, and
6. Water. The first three substances can provide energy, which give us the capacity to work. Proteins form our body muscles, bones, blood, enzymes, some hormones, antibodies, organs, skins, hair and nervous system. Nutrients can be divided into three categories according to their functions-
1. Energy giving
2. Body building and
3. Protective. Most foods contain a mixture of the three categories of nutrients, but usually one type of food provides one of the categories of nutrients in a larger amount. The function of those nutrients becomes the main function of that food. For example, cereals such as rice and wheat have all three categories of nutrients but the energy giving nutrients are the most abundant therefore, we consider these foods as energy giving foods. Four kinds of foods are considered basic to meet the nutritional needs. These are also called basic foods-
Basic foods
1. Milk and milk products
2. Grains
3. Animal and vegetable protein and
4. Fruits and vegetables. Commonly eaten foods can be broadly divided into three groups according to their functions. These are-
School of Science and Technology 2

Nutrition and Dietetics
Energy giving foods Cereals- rice, wheat, corn, or millet.
Fats and oils.
Starchy vegetables- potatoes, sweet potato.
Noodles, Payes, firni sugar, molasses and honey.
Milk, eggs, fish and meat. Growth promoting foods Pulses, peas, beans and nuts.
Vegetables (green leafy)-like puishak, kalmishak, Patshak, etc.
Red-lalshak, etc.
Protective foods
Yellow and orange-coloured fruits like-carrots, pumpkin, papaya, jackfruit, mango, tomato, orange, lemon, guava, pineapple, amloki, black berry, jambura, amra, kamranga, etc.
1.4. What should we Eat? There is no such thing as an ideal diet. But to live a healthy life, we must eat a mixture of foods some of which give energy, some that promote growth and still others that protect us from disease. Thus, we should not be guided only by our taste but the quantity of each type of food. And the combinations can of course vary. The main part of our diet consists of cereals like rice and wheat, which are the cheapest parts of the diet. Foods including pulses, beans and peas in Bangladesh are always eaten with the cereals. They give variety to the diet and make the cereals more palatable and nutritionally sound. Similarly, vegetables are also eaten with cereals and pulses to increase nutrients, palatability and variety. Foods of animal origin such as fish and meat are generally expensive and are a part of the diet available only to those who can afford it. Fats and oils are mostly used for cooking foods and greatly improve the taste of food.
A daily diet should be a mixture of-
♦ Cereals
♦ Pulses
♦ Vegetables (green, red and yellow)
♦ Animal foods- fish and meat
Bangladesh Open University 3

Basic Concepts of Nutrition and Dietetics
A mixture of vegetable and cereal foods is almost as good as animal foods for promotion of growth. Animal foods are good for all but they are especially desirable for infants and young children.
Animal foods are good for all but
they are especially desirable for
infants and young children
1.5. How Much Food Should we Eat? How old we are, whether we are men or women and how physically active we are, makes a difference in the amount of food we need. Babies, young children and adolescents who are growing very fast need more food than other people. Women who are pregnant or breast-feeding also need plenty of nourishing food to help their bodies grow better. A person who has to do a lot of heavy work needs more food than someone who has to do little work. So, the amount of food served to each person should be proportionate to his requirements. The two basic relationships between nutrition and disease are (a) in therapy (special dietary and nutritional care) and (b) in the prevention of disease (knowledge of nutrition in dietary practice e.g., knowledge on avoidance of excess intake of salt may help to prevent high blood pressure). For an example, diet is an important part of diabetic management. Each person with diabetes needs to be provided with an individualized plan, appropriate counseling in the use of plan and follow up as necessary. Type I and Type II diabetes are managed differently. Young people are suffering from Type 1 diabetes and is managed by insulin and diet. In Type II, the adult onset diabetes can be managed by diet alone. If the diabetes is an obese person she is managed by reduction of weight (a low calorie diet and exercise). 1.6. The Role of Nurses in Nutritional Care
S/he should have special skills and knowledge so that the patient’s needs can be met more
efficiently regarding nutrition
Nurses play an extremely important role in nutritional care and clinical dietetics. The nurse must develop an understanding of this subject if his/she is to fulfill her function successfully. This aspect of science will increase his/her knowledge in this area and should be applied to increase his/her role in improving the nutritional care of patients. In health care, besides the physician, dietitians and patients, a nurse is an active and participating as core member. S/he should have special skills and knowledge so that the patient’s needs can be met more efficiently regarding nutrition. A nurse shares the responsibility with a physician for assisting patients and explaining with a positive attitude about food. In addition, the nurse observes patients directly and records the amounts of foods and fluids they consume reports new diets or diet changes promptly, assesses their status and monitors patient’s progress in physical condition and eating behaviour. Addition to those measuring the amount of urine
School of Science and Technology 4

Nutrition and Dietetics
voided and evaluating patient response to dietary regimen are duties of the nurse. Enteral and parenteral feedings are administered and monitored by nurses. In the case of intravenous fluids and electrolytes imbalance patients the nurse carries out the doctor’s prescription. The nurse is frequently asked the patient's only source of nutritional and dietary information and advice. In any case, the nurse has the best opportunity to teach the patients and the principles of nutrition in the course of the day-to-day care. The nurse is involved in the performance of the activities of daily living to assure the patient's comfort and to maintain optimal health care. S/he counsels with clients about their health status and the correct principles, procedures and techniques of health care. Because of the nurse's importance in the nutritional and dietary care of the patient, nurses may need a stronger background in nutrition and dietetics.
1.7. Exercise 1. What is food? What are the basic functions of food? 2. What is nutrient? What do nutrients do for our body? 3. Discuss the factors that determine our food intake. 4. What are the three categories of our commonly eaten foods? 5. What are the basic relationships between nutrition and disease?
Give an example. 6. What are the roles of nurses in the nutritional and dietary
management of the patient?
Bangladesh Open University 5

Basic Concepts of Nutrition and Dietetics
Lesson 2: Function, Daily Requirement and Source of Food: Micronutrients
2.1. Learning Objectives
At the end of this lesson you will be able to- ♦ describe the role of different micronutrients ♦ know daily requirement, source and ♦ know its deficiency related diseases.
2.2. Introduction By nutrient we understand about food or any substance that is needed to keep a living thing alive and to help it to grow by playing a vital role in metabolism. They are present in food in the form of chemical compounds. There are two types of nutrients- 1. Micronutrients and
2. Macronutrients. 2.3. Micronutrients Some nutrients are required in small amounts, usually in milligrams or micrograms for the reason they are called micronutrients. Although their needs are very small but they are very important. It is found that as many as 30% of the people of developing countries of the world suffer from deficiency diseases, which are related to these micronutrients. Micronutrients are also divided into two groups- a. Minerals and
b. Vitamins. 2.3.1. Minerals About 6.1% of our body is composed of minerals. Some of them are required in greater amounts, so they are called macrominerals (about 100 milligram or more) and some other required in smaller amounts (less than 100 milligram). The later are called microminerals or trace elements. List of both of these groups of minerals are given below-
School of Science and Technology 6

Nutrition and Dietetics
Macrominerals (⟩100 mlgm) Microminerals (⟨100 mlgm)
1. Calcium 1. Iron
2. Sodium 2. Copper
3. Potassium 3. Iodine
4. Magnesium 4. Zinc
5. Phosphorus 5. Cobalt
6. Sulphur 6. Manganese
7. Chlorine 7. Fluorine The deficiency diseases, which are common in our country, are due to calcium, iron and iodine. So, we will discuss about some of the important micro and macro minerals. 2.3.1.1. Calcium Among the important minerals, calcium is essential one and its presence is more than any other mineral in our body. Calcium is the main essential macromineral for the growth and development of bones and teeth. It is insoluble in water. Functions of Calcium 1. Along with phosphorus it helps in the development of the frame of
body, bones and teeth and gives it the structural strength.
2. It is necessary for the development of each cell of the body.
3. It is an important element of blood coagulation.
4. It helps in contraction and relaxation of heart muscle, and in maintenance of the heart rate.
Deficiency Diseases In calcium deficiency, children suffer from rickets. Besides this growth of the infant will be hampered and eruption of teeth will be delayed. In pregnant mothers, deficiency of calcium causes osteomalacia. As a result, bones become soft and undergo easy fracture.
Bangladesh Open University 7

Basic Concepts of Nutrition and Dietetics
Daily Requirement of Calcium
Adult male/female 450 mg
Children 500-600 mg
Teenage girls 650 mg
Pregnant women 1100 mg
Lactating mothers 1100 mg
Source Milk and milk products, curd, cheese and small fish bones, cartilage are the richest sources. Pulse, prawn, ladies finger (okra), green leafy vegetables such as kachu shak, palang shak also contains calcium. 2.3.1.2. Iron For human body iron is an essential mineral but its requirement is very small. About 4 (four) gm iron is present in an adult man among which about 70% are present in the hemoglobin of blood. Iron is stored in liver, kidney and in bone marrow. Functions of Iron 1. It is needed for the development of heam of blood haemoglobin.
2. It helps in carrying oxygen to the cells of our body.
3. It acts as a part of many enzymes used in oxidation and reduction.
4. It is an essential element for transfer of electrons in biochemical processes.
5. It takes part in the formation of the enzyme cytochrome required for each cell of our body.
Deficiency Disease 1. Production of blood will be hampered and anaemia will develop.
2. Deficiency of iron will cause loss of strength and life expectancy will decrease.
School of Science and Technology 8

Nutrition and Dietetics
Daily Requirement of Iron
Adult male 9 mg
Children 10 mg
Teenage boy (13-18y) 18 mg
Teenage girl (13-18y) 20 mg
Adult female 28 mg
Pregnant woman 33 mg Source Meat, liver, egg, pulse, gur, fishes like tangra, topshe, Rupa patia etc., dry fish, dried mango, green mango, black kachu shak, cauliflower, leaf of shalgam, data shak, other shak contains lot of iron. 2.3.1.3. Iodine Iodine is an important mineral for thyroid gland but its requirement is very little. About 15–20 mg of iodine is present in an adult man among which 70-80% is concentrated in the thyroid gland. Function of Iodine Iodine is an essential part of a specific human thyroid gland, which help in the production of thyroxine hormone. Thyroxine plays an important part in both the development of physical and mental health. Deficiency Disease 1. Due to deficiency of iodine there may be abortion and still-birth. An
infant may be born with mental retardation, deaf and a short stature. Such children are often diagnosed as cretins.
2. Development of child will be hampered, goiter may develop.
3. In adults it may cause different types of goiter, lack of physical strength.
Daily Requirement Daily requirement of iodine is 150 microgram (0.15 mg) in the adult.
Bangladesh Open University 9

Basic Concepts of Nutrition and Dietetics
Source Chief source is sea food (seaweed) or sea fish (fresh and dried fish). We can get iodine from salt, which are mixed (fortified) with iodine. This type of salt is produced by mixing of 4 parts of Potassium iodide with 1 lac parts of salt. 2.3.1.4. Phosphorus About one percent of our body weight is phosphorus. In the human body, 80% is present in the bones and teeth. Functions of Phosphorus 1. Both phosphorus and calcium help in development of bones and teeth.
2. It helps in the metabolism of carbohydrate and fats and thus helps in development of body strength and maintenance of temperature.
3. It is an essential element for nucleic acid. Deficiency Disease 1. It hampers the development of bones and teeth.
2. It may cause weakness and bone pain and eventually lead to a deficiency of calcium.
Daily Requirement Daily requirement is same as calcium. It is about 800 mg. Source Fish, Meat, Egg, Cheese, Milk, Nut, Pulse, Seed and seed containing foods. 2.3.1.5. Sulphur Protein is present in all animals and all proteins contain some amount of Sulphur. Functions of Sulphur 1. Most of the Sulphur is an essential part for two important amino acids-
methionine and cystine.
School of Science and Technology 10
Nutrition and Dietetics
2. It is important for different enzymes and takes part in many of their metabolic activities.
3. It is also important for the production of thiamine and carotene. Deficiency Disease Due to deficiency of sulphur containing amino acids, there could be a compromise in the quality of protein consumed. Source Fish, Meat, Egg etc. 2.3.1.6. Copper Copper is a natural elements that is an essential micronutrients to ensure the well being of all human. It plays a vital part in the development and performance of the human nervous and cardiovascular system, as well as the skin, bone immune and reproductive systems. Functions of Copper 1. For metabolism of iron and in the development of blood, copper is
necessary.
2. It is present in different enzymes, which is important for production of haemoglobin, metabolism of glucose and production of energy.
Daily requirement of copper for an adult man is 2 mg. Deficiency Disease Due to its deficiency, there is anaemia and defect in the framework of the body. Hair may turn into gray colour and there may be failure of reproductive capacity. Source Meat, Liver, Heart, Brain, Kidney, Shellfish, Nut, Pulse are good sources of copper. Breast milk also contains copper. 2.3.1.7. Zinc Zinc is one of the most important minerals consumed in the human diet. Our body contains 2.5 gms of zinc at any moment in our life. Functions of Zinc
Bangladesh Open University 11

Basic Concepts of Nutrition and Dietetics
1. Zinc is added with insulin hormone, which is secreted from the
pancreas and helps in the metabolism of carbohydrate.
2. The important female hormones, which are related with the reproductive cycle increases its activity in the presence of zinc.
3. Zinc is necessary for maintaining the balance between the carbon dioxide and carbonic acid present in the muscle of our body.
4. It increases the activity of other enzymes.
5. Zinc is useful for the normal development of genital organs, prevention of anaemia, for healing of wounds and physical development of the body.
Deficiency Disease Due to deficiency of zinc there may be defect in growth and lack of sexual functions. Daily Requirement of Zinc
Children (below 10 years) 10 mg
Adults 15 mg
Pregnant women 20 mg
Lactating mothers 25 mg Source Zinc is found in all animal and plant sources but fruits, vegetables and refined foods contain less amounts of zinc. 2.3.1.8. Sodium Greater part of the sodium of human body is present in the extra cellular fluid. Main function of sodium is to maintain the fluidity of the body and maintain the balances between acid and base. Due to deficiency of water there could be deficiency of sodium which may lead to decreased hunger, contraction of the muscle, mental excitement, and coma and may even lead to death. Sodium is present in all natural sources but main source is the table salt. 2.3.1.9. Potassium
School of Science and Technology 12

Nutrition and Dietetics
Amount of potassium in our body is same as sodium but it is present in the intracellular fluid. It is necessary for the development of fat free muscle. There could be a deficiency of potassium in conditions of deficiency of protein due to fasting or due to trauma. This could cause weakness of the muscle or paralysis, normal body movement would be restricted, abdomen becomes distended due to deposition of gas and at the last stage, activity of the heart would stop thus leading to death. Source and Requirement of Potassium For an adult man daily requirement is 2.5 mg. Potassium is present in almost all foods. But fat free muscle and milk are the good source of potassium. 2.3.2. Vitamins Second important micronutrients for our body are the vitamins. Lack of vitamin disturbs metabolism. So, there is lack of heat development and lack of resistance for the prevention of disease. Food contains different types of vitamins. According to solubility, vitamins are divided into two groups - 1. Fat soluble vitamins and
2. Water soluble vitamins A list of the two types of vitamins and their characteristics are given below- A. Fat Soluble Vitamins B. Water Soluble Vitamins
1. Vitamin A 1. Vitamin B complex
2. Vitamin D (Calciferol) i. Thiamine
3. Vitamin E ii. Riboflavin
4. Vitamin K iii. Niacin iv. Pantothenic acid v. Pyridoxine vi. Biotin vii. Folic acid viii. Choline ix. Cyanocobalamine
2. Vitamin C
Characteristics Fat Soluble Water Soluble
Bangladesh Open University 13

Basic Concepts of Nutrition and Dietetics
Heat and water do not destroy it, but sunlight does. It can be stored at airtight container.
These are destroyed by heat and during cooking. They are water-soluble.
It can be stored in the liver for long time. It is not water-soluble and is not excreted in the urine.
Destroyed by sunlight and air. Except Vit. C. The others are stored in the liver in small amounts/ excreted in the urine.
2.3.2. Fat Soluble Vitamins
i. Vitamin A
Vitamin A is a colour base, water insoluble but fat soluble and heat resistant vitamin. But by heating for a long time, all vegetable oils containing Vitamin A is oxidized and destroyed. About 90% of the Vitamin A present in the body is stored in the liver.
Functions of Vitamin A
1. Helps in maintaining the normal vision. 2. Maintains the smoothness of the skin. 3. Helps in growth and development. 4. Helps in development of bones and teeth. 5. Helps in maintaining the reproductive function. 6. Helps in preventing infectious diseases.
Deficiency Disease
1. Children suffer from night blindness finally leading to complete blindness.
2. Skin becomes dry and rough 3. Hampers development 4. Decreases the severity or helps in the prevention of diseases.
Daily Requirement
Adult males 5000 IU Pregnant women 6000 IU Lactating mothers 8000 IU Children (1-12 yrs) 2000-4500 IU
Source
School of Science and Technology 14

Nutrition and Dietetics
Among the animal sources, fish liver oil, fish oil, liver, butter, egg yolk, kidneys are rich sources. Animal fats are the richest source of vitamin A. Vegetables and fruits do not contain vitamin A but some contain carotene, which is converted into vitamin A in the small intestine. Yellow, green leafy vegetables and some fruits contain a lot of carotene. Some good examples are lalshak, kachu shak, palong shak, pui shak, pumpkin, carrot, ripe mango, papayas, jackfruit, yellow sweet potato and other vegetables. ii. Vitamin D (Calaferol) Another name of it is cholecalciferol. Functions of Vitamin D 1. Vitamin D is necessary for the metabolism of calcium and phosphorus.
2. It helps calcium and phosphorus in the development of bones and teeth.
Deficiency Disease 1. There is no proper utilization of calcium and phosphorus without
vitamin D. As such, children suffer from rickets. In this disease bones become soft and bend.
2. Elderly people suffer from osteomalacia.
3. Eruption of teeth is delayed and children take a longer time to start walking.
Daily Requirement Adult male = 2.5 µgm or 40 IU Sources Vitamin D is absent in plants. Only animal foods such as – fish oil, fish liver oil, butter, egg yolk, milk, milk product contain vitamin D. Ultraviolet rays of sunlight falling on the skin can form a good source of Vitamin D for the body. iv. Vitamin E Another name of it is tocopherol. Functions of Vitamin E
Bangladesh Open University 15

Basic Concepts of Nutrition and Dietetics
1. As an antioxidant, it protects Vitamin A, Carotene and unsaturated fatty acids from oxidation and
2. It increases the reproductive capacity and prevents impotency. Daily Requirement About 5-10 mg/day Source Cod liver oil, Nuts, Wheat, Sunflower oil, Soybean oil, Palm oil are all good sources of vitamin E. iii. Vitamin K Vitamin K is known as a blood-clotting vitamin. It helps in quick blood coagulation and stops bleeding. It helps in the production of the clotting factor in the liver, which helps in clotting of the blood when there is a wound. Usually there is no deficiency of Vitamin K because the intestinal flora produces it. It is easily produced from the food. If pregnant women suffer from its deficiency, there could be bleeding problems during delivery. Daily Requirement
Daily requirement for adult is 30 µgm.
Source
Green leafy vegetables, cauliflower, cabbage, palong shak, liver and egg yolk are good sources.
2.3.2. Water Soluble Vitamins Water soluble vitamins are vitamin B complex and vitamin C. List of vitamin B complex has been given previously, here is including important functions, deficiency of disease, source and reassures and of some vitamin one describe below. i. Thiamine 1. Thiamine acts as a co-enzyme especially as an active part of Thiamine
phosphate, which helps in the metabolism of carbohydrates.
2. It is needed for the metabolism of fat and protein.
3. It helps in the normal growth of the body.
School of Science and Technology 16

Nutrition and Dietetics
Deficiency Disease Small amounts of its deficiency disturb the carbohydrate metabolism, which may cause anorexia, nausea, weakness, mental anxiety. Although rarely seen now-a-days, long-term deficiency of Thiamine is known to cause beriberi. Daily Requirement For each 1000 kcal of energy consumed, 0.5 mg is the suggested daily requirement. Thus the following is the suggested requirement-
Males 1.9 mg
Females 1.0 mg
Pregnant women 1.1 mg
Lactating mothers 1.0 mg Source Unpolished boiled rice, wheat, fat free meat, liver, egg, yeast, fish, milk, and beans are the sources.
ii. Riboflavin
Vitamin B2 is yellowish orange in color, which is slowly soluble in water but quickly soluble in an alkali solution. It is not destroyed by heat but can be destroyed from air and sunlight.
Function 1. It is a part of many enzymes and co-enzymes. These enzymes and co-
enzymes take part in carbohydrate, protein and fat metabolism and thereby help in the production of energy.
2. Helps in normal development and for healthy life. It is considered as an essential nutrient throughout the whole life.
Deficiency Disease
There is no particular disease, which can be attributed to its deficiency. Usually it causes cheilosis, glossitis, and angular stomatitis. These signs are often attributed as ariboflavinosis. Daily Requirement
Bangladesh Open University 17

Basic Concepts of Nutrition and Dietetics
For each 1000 kcal of energy consumed, 0.6 mg is the suggested daily requirement. Thus the following is the suggested requirement-
Males 1.5 mg Females 1.1 mg Pregnant women 1.3 mg Lactating mothers 1.5 mg
Source Milk, Egg, Liver, Fish, Meat, unpolished boiled rice, Pulse, Nut and Green Leafy Vegetables and fruits are good sources. iii. Niacin Nicotinic acid (nicotinamides) is also called niacin. It is soluble in water. It is not destroyed by heat, air, light, and alkali and by oxidation. One of its important characteristics is that inside the body, niacin is converted into an important amino acid called Tryptophan. Functions of Niacin Niacin is an essential part of two co-enzymes, which are indirectly needed for production of energy from carbohydrate metabolism and takes part in the production of fat from carbohydrate.
Deficiency Disease
Deficiency of niacin causes pellagra, which is manifested by weakness, weight loss, and skin disease in the exposed areas of the body.
Source
It is found in both plants and animals. In addition to that Meat, Liver, Wheat, Pulse, Nut, Seed oil and vegetables contain lots of niacin. Peanuts are a very good source for niacin.
Daily Requirement
Male 18.2 mg Female 13.2 mg Pregnant women 15.1 mg Lactating mother 18.1 mg
iv. Folic Acid
School of Science and Technology 18

Nutrition and Dietetics
Folic acid also called Folicin. It acts as a co-enzyme and helps in protein metabolism. Its deficiency causes anaemia and may changes the shape of RBC and its quantity. Daily Requirement
Children 100 mg
Women 200 mg
Pregnant women 400 mg
Lactating women 300 mg Source Liver, Yeast, Ground nut, Pulse, Green leafy vegetables, Rice and Flour etc. v. Vitamin B12
Another name of it is Cyanocobalamine. It acts as a co-enzyme. Due to its deficiency there is change in the shape of RBC and there is a decrease in its amount leading to a condition known as pernicious anaemia. Daily Requirement
Children 1.0 µgm
Adult males 2.0 µgm
Pregnant women 3.0 µgm
Lactating mothers 2.3 µgm
Source
It is absent in plant source. Animal source such as – Liver, Brain, Heart, Kidney, Meat, Fish, Egg, Milk and Milk products contain lots of vitamin B12.
vi. Vitamin C
Another name of vitamin C is ascorbic acid. It has a sour taste. It is easily soluble in water and destroyed by oxidation in the presence of air. It is not stored in the liver, as such; we have to take vitamin C on a daily basis. Functions of Vitamin C
Bangladesh Open University 19

Basic Concepts of Nutrition and Dietetics
1. Vitamin C produces and maintains protein collagens. Collagens act as a binding substance between bones, cartilage and skin.
2. It helps in the metabolism of fat, protein and amino acids. 3. It uses iron and copper in the production of blood. 4. It makes the skin smooth and bright. 5. Keeps the teeth and gum healthy. 6. Helps in healing wounds. 7. Prevents from infectious diseases. Deficiency Disease Although frank cases are rarely seen now-a-days, long-term deficiency causes scurvy. Daily Requirement
Children 20 mg
Adult 20 mg
Pregnant and lactating mother 50 mg Source Fruits like lemons/limes which are sour, contain vitamin C such as Amlaki, Guava, Lemon, Orange, Amra, Pineapple, Mango, Blackberry, Tomato, Green Chilli, Sprouted seeds, Lettuce, Coriander Leaf, Pudina and other green leafy vegetables.
2.3. Exercise 1. Define macro and micronutrients. 2. Name deficiency diseases, which are most prevalent in Bangladesh
and suggest preventive measures. 3. What are antioxidant vitamins and minerals? 4. How much iron, iodine, Vit A, C and E do you need every day?
School of Science and Technology 20

Nutrition and Dietetics
Lesson 3: Desirable Body Weight and Energy Requirement
3.1. Learning Objective
At the end of this lesson you will be able to- ♦ calculate desirable body weight of individuals, ♦ calculate energy requirement of individuals.
3.2. Methods There are different methods to determine desirable body weight (DBW) and nutritional status- 1. Tannhauser’s Method-
a. Measure height in centimeters,
b. Deduct 100 from the factor,
c. Take off 10% from ‘b’ (b=above line) and result will be DBW in
Kg,
d. To obtain range of DBW, add and subtract 10% from ‘c’ (c=above line).
2. Adopted Method -
a. For 5 feet, use 105 lbs and then for every inch above or less than it, add or subtract 5 lbs.
b. Divide the result in ‘a’ by 2.2 to get the result in kg,
c. To obtain the range, do the same as mentioned in the Tannhauser’s Method.
3. References/Standard-
a. The Standard Tables for Weight for Age and Height for Age for Boys and Girls-
i. See from the tables one ideal weight and height according to age.
ii. Compare actual weight and height with standard to identify nutritional status.
b. Use the index-weight ‘Weight for Age’ to identify nutritional status by using Gomez classification.
Bangladesh Open University 21

Basic Concepts of Nutrition and Dietetics
< 60 = 3rd degree malnutrition <75 = 2nd degree malnutrition < 90 = 1st degree malnutrition 90-110 = Normal 111-120 = Over weight > 120 = Obese
Degree of malnutrition
AgeinWeigth
There are also different ways to estimate Total Energy Requirement (TER) per day. However, recent suggestions are to calculate the total energy (calorie) expenditure (TEE) as an indirect (and more accurate) measure to calculate the TER. So we find that the nutritional requirement is based on the output.
The supply of energy ensures the output that varies in different conditions. The various outputs include-
1. Provision for the basal body functions. These functions are often not appreciated (felt) and includes activities like the constant beating of the heart, respiratory movements, control of body temperature, etc.
2. Provision for the thermogenic action of food. This depends on the quality (type) of food consumed and in simple terms is the energy required for the digestion of the food itself. The term specific dynamic action (SDA) is also synonymously used.
3. Provision for the physical activities charts are available for almost all activities. A very short list is provided below. Thus the degree of activity and duration are important.
Factor for Nature of Activity Bed rest 1.2 Sedentary 1.3 Light 1.5 Moderate 1.7 Heavy 2.0
4. Provision for certain situations like pregnancy, pathological states (again charts are available and a short list is included below where).
Factor for pathological state Minor Surgery 1.2 Skeletal trauma 1.3 Major sepsis 1.6 Severe burn 2.1
School of Science and Technology 22

Nutrition and Dietetics
If we are to calculate the energy requirements of any particular individual, we need to know the following: 1. Body weight
2. Age
3. Physical/pathological state
4. Nature of activity
5. Composition of food consumed These are then transformed in terms of total energy expenditure. Allocations are then made from different macronutrients (which will supply energy) to meet the TEE. While calculating the energy requirements, it is desired that the ideal weight of the individual is met rather than the actual weight. This prevents over or under estimation of the requirements. Detailed ideal weights can be sought from standard tables found in nutrition textbooks. A short table from the National Research Council (USA), factors for nature of activity and factors for pathological states are provided in the following tables - Median Weight for Age and Recommended Energy Intake Category Age (Yrs) Wt in Kg Average Energy
Allowance/Kg
Infant 0.0 – 0.5 6 108
0.5 – 1.0 9 98
Children 1.0 – 3.0 13 102
4.0 – 6.0 20 90
7.0 – 10 28 70
Men 11 – 14 45 55
15 – 18 66 45
19 – 24 72 40
25 – 50 79 37
51+ 77 30
Women 11 –14 46 47
15 – 18 55 40
Bangladesh Open University 23

Basic Concepts of Nutrition and Dietetics
Category Age (Yrs) Wt in Kg Average Energy Allowance/Kg
19 – 24 58 38
25 – 50 63 36
51+ 65 30
Pregnant + 300 cal from 2nd trimester
Lactating + 500 Cal in 1st yr
To calculate the Total Energy Expenditure (TEE) one has to first calculate the Basal Energy Expenditure (BEE). The calculation can be done using the following equations-
BEE = Ideal Weight X Recommended calories per kg Ideal Weight.
TEE = (BEE X Factor from Activity + 0.1 X BEE + Allowance for pregnancy, lactation) X Factor for pathological state.
To determine the energy requirement, one needs to find out the protein and fat requirements too. This is essential because a portion of the calories will be coming from the protein and the fat. A rough estimate of the protein requirement is 0.8 gm/kg of the body weight and for fat it is said that 15 – 30% of the calories need to be supplied from this source.
3.3. Exercise
Take for example a woman aged 22 years who is in the 2nd trimester of pregnancy and whose actual weight is 45 kg. Determining her stature, her ideal body weight is determined to be 55 kg and being a light worker, her physical activity is determined to be 1.5. Her recommended calorie per kg ideal weight is also determined to be 26.
1. Determine the protein requirement and estimate the calories supplied there from.
2. Allocate the ration from fat keeping the quantity nearest to the minimum of 15–30% range. Estimate the calories supplied there from.
3. Subtract from TEE the sum of calories supplied from sources 1 and 2 and allocate the remaining calorie to carbohydrate.
4. Calculate your actual wt. by comparing with your DBW using different methods.
5. If you are underweight/overweight, recommend attaining DBW. If within desirable range, how can it be maintained?
School of Science and Technology 24

Nutrition and Dietetics
Lesson 4: Planning Diet 4.1. Learning Objectives
At the end of this lesson you will be able to- ♦ describe the standards used in planning normal diets; and ♦ list and give examples of the basic factors that must be considered in
planning a diet.
4.2. Principles of Diet Planning A normal diet should be adequate and balanced. The principles of a balanced diet are ways to plan meals by combining foods from different groups. These principles help families to make their meals more varied and nutritious. The use of the basic food groups facilitates diet planning and allows variations for individual preferences, cultural habits and budgets. Diet planning can be simplified by using the basic food groups. When planning a nutritionally balanced diet, several guidelines are important. A person should- ♦ include recommended amounts of each of the basic food groups.
♦ utilize accessory foods to increase calories (if needed), and
♦ take into account foods or meals eaten outside the home. Some other important guidelines include- i) food should be enjoyed,
ii) eaten at least three times a day,
iii) presented attractively and with varieties and
iv) within a budget. Attention should be paid not only to the supply of essential nutrients for the normal processes of the body, but also to the amount of each nutrient in relation to the others. Difficulties arise in the formulation of a normal diet because of the complex interactions existing between nutrients. For example, ascorbic acid is needed for the conversion of iron into an absorbable form and a deficiency of vitamin C may result in its association with a deficiency of vitamin A and so forth. Interrelationships exist not only among the minerals but also among the vitamins, between vitamins and proteins, between proteins and carbohydrates, and between
Bangladesh Open University 25

Basic Concepts of Nutrition and Dietetics
vitamins and fat. Other multiple relationships also exist; hence the need for a varied diet in order to ensure complete nutrition in the diet. Other factors like regional availability of foods, socioeconomic conditions, taste preference, food habits, and age of the family members, storage and preparation methods and facilities are also pre-requisites for planning a diet. Besides nutrients, foods contain fiber. Fiber is not a nutrient but it forms a very important aspect of good nutrition/health.
4.3. What Constitutes an Adequate Diet? The Recommended Dietary Allowances (RDA) per day for a specific nutritional status, the amount of energy and nutrients recommended for men and women of different age groups-pregnant women, lactating women; infants; children and adolescents of various weights will vary. Consumption of the amounts of each nutrient recommended in the table not only prevents deficiency diseases but also allows for a margin of safety to sustain a vigorous and healthy life style. The standards have been revised to confirm with current research on the nutritional needs of people.
Proper diet is the best general
measure in all infectious diseases
The recommended dietary allowances are useful in the planning and analysis of diets of individual groups and with proper understanding and use may be helpful in planning an adequate diet and evaluating the nutritional status of an individual. Proper diet is the best general measure in all-infectious diseases. Good nutrition means good defense against infection. 4.4. Daily Food Guide Body building foods such as meat, fish, poultry, eggs, cheese, milk, beans, and nuts supply the greatest amount of the important good quality proteins. They are also rich in B vitamins and iron especially if liver and other internal organs are included in the diet. For children, these foods are important for growth, and for adults, they maintain existing tissues. Milk if provided in the diet, is an excellent source of calcium, protein, and vitamin A and B. A Daily Food Guide
School of Science and Technology 26

Nutrition and Dietetics
A Daily Food Guide
Milk Group 1 Serving
Some milk for everyone
Fish or meat group 2 or more servings
Vegetable Fruit group
4 or more servings Cereal group
4 or more servings Examples of Serving Size Milk 1 serving = 1 glass = 240 gm = medium 2 cups
Meat/fish 1 serving = 30 gm
Vegetable 1 serving = ½ cup, ¼ cup, 1 cup
Fruits 1 serving = ½ cup, ¼ cup, 1 cup
Oil 1 serving = 1 t.s.f. = 5gm
Egg 1 serving = 50 gm
Dhal 1 serving = 30 gm. The daily food guide presents one way to select food. With this anyone can get the nutrients needed from everyday foods. In using the guide one selects the main part of his diet from the four broad food groups. To this one adds other foods as desired to make meals appealing and satisfying. The additional foods should add enough calories to meet energy needs, which will vary widely for different members of the family. Energy foods in the form of carbohydrates fats comprise the major portion of our diet. Carbohydrate foods are mainly starches in the form of cereals like rice, breads, cakes, noodles, and root crops. They also provide vitamins B complex and iron and part of the vegetable proteins. Sugars, which are the concentrated sources of energy, are found in a of forms in molasses, sugar, and honey and fruit juice. Fat-rich foods like visible fats in the form of butter, margarine, and coconut milk and the invisible fats of meat fish; eggs, milk and milk products become an important source of energy and add substantially to the taste of the food.
The additional foods should add enough calories to meet energy needs,
which will vary widely for
different members of the family
Green leafy and yellow vegetables are rich sources of vitamin A, riboflavin, and vitamin. Citrus fruits supply a generous amount of vitamin C. Other fruits and vegetables are also contributors of varying amounts of minerals and vitamins, fiber and calories but the best sources of pro-vitamin A (Beta-carotenes) are the green leafy and yellow vegetables.
Bangladesh Open University 27

Basic Concepts of Nutrition and Dietetics
Water is supplied directly through drinking water and from the water content of foods and other liquids. 4.5. Planning the Diet There are many ways to plan a diet that will be nutritious. Adequate foods should be selected from each category of the four basic food groups e.g. one part from milk and milk products, two parts from fish and meat, six parts from cereals and at least four parts from vegetables and fruits of which one part should be from vitamin C rich, one part from carotene rich and two to three parts from others fruits and vegetables.
A family should have at least-
a breakfast
a midday meal
an evening meal
and if possible two snacks in between.
Specifying amounts of foods in the daily diet such as the Recommended Dietary Allowances when followed is a safe procedure. The recommended daily amounts of nutrients are references to standards of nutritional intake. Expert committees recommend that healthy people should eat these amounts of nutrients on an average day. The recommendation will normally be more than what is required by healthy people, that is, most people's requirements are less than the recommended amount. Sick people have requirements not covered by the recommendations. For example, with bed rest, energy requirements are reduced; with fever they are increased. Losses of several nutrients are increased in different ways by illness, such as protein loss in nephrotic syndrome, potassium loss in diarrhoea, iron loss with bleeding. For total enteral and parenteral nutrition, the requirements are different; absorption is 100%, but minor vitamins and trace elements cannot be provided by infusion and have to be provided in the infusion solution. To plan a meal, a dietary pattern based on the guide is suggested below-
School of Science and Technology 28

Nutrition and Dietetics
i. Breakfast : Fruit or fruit juice
Egg or a protein rich substitute
Cereal/wheat
Butter or margarine
ii. Snacks : Juice or milk
Cereals or root crop
iii. Lunch : Cereal or root crop
Meat or fish or other protein-rich combinations
Green leafy or yellow vegetables, preferably in the form of salad (at least some should be raw)
Fat or oil
Fruit or dessert
iv. Supper : Cereal or root crop Meat or fish or pulse Vegetables Fruit or dessert
To facilitate acceptance of the diet, aesthetic factors such as texture, color, palatability and variety must also be considered.
Bangladesh Open University 29

Basic Concepts of Nutrition and Dietetics
4.6. Exercise 1. What are the factors to be considered in planning a normal diet? 2. Discuss about the basic foods: (This could be for a 1 year or
second year child- you need to be specific). 3. Give a guide to planning a meal for an adult. 4. You don't want them to recite what they read, rather, give them a
little scenario, and ask them to plan a week's meals e.g.
A 15-year-old girl has a broken leg and is having an infection. What meals would you offer her? What factors would you consider in your planning?
School of Science and Technology 30

Nutrition and Dietetics
Unit 2: Food Safety and Hygiene Lesson 1: Criteria for Safe Food 1.1. Learning Objective
At the end of this lesson you will be able to- ♦ describe safe preparation of storage, ♦ discuss ways that nurses can help to prevent food borne illnesses, and ♦ describe and give examples of safe food.
1.2. Food Spoilage Food is frequently subjected to chemical and biological contamination in a number of ways and this has a direct, significant and important bearing on public health. There is clear evidence now that a vast amount of human diseases and suffering is directly due to the consumption of infected and/or contaminated food. Bacteria grow in food very easily, and so contamination can occur rapidly. Sometimes organisms are already present and at others times these are introduced during the storage, preparation or serving of food. Moulds, fungi, bacteria and viruses causing diseases can alter the quality and contaminate food and water. Processing and preparation can make food safe to eat by destroying some microorganisms or natural toxins. Food is processed for- ♦ Storage and preservation,
♦ Prevention of disease, There is clear evidence now that a vast amount of
human disease and suffering is directly
due to the consumption of
infected and contaminated food
♦ Improvement of digestibility and nutritive value,
♦ Palatability,
♦ Destruction or reduction of toxic components,
♦ Change the physical properties of food, and
♦ Fortification.
All foods are made of chemicals. Some are necessary, some have no effect, and some are harmful. These chemicals may be natural constituents of food, or they may be added intentionally or unintentionally. Absolute safety does not exist; no food is totally harmless. Scientific research helps us to make wise decisions about safe versus unsafe food components. All
Bangladesh Open University 31

Food Safety and Hygiene
foods are of animal or vegetable or of a combined origin. They are made of cells, which contain numerous enzymes and biochemical compounds. Microorganisms also inhabit foods. These multiply after slaughter or harvesting and nearly all our basic foodstuff deteriorate rapidly because of autolytic decay (self-destruction) and microbial activity. Foods can become dangerous unless we treat them in some way. Cereal grains are the major exception. They have a low water content and normally will keep for years when dry and at ambient temperatures. 1.3. Prevention of Food Borne Illness Handling, storing and preparing foods properly will prevent them from spoiling and losing nourishment. Preventing food borne illness is usually a matter of sanitary food production and handling techniques. Foods are normally processed to destroy pathogenic organisms and to prevent the growth of harmful agents. The goal in food preservation is to preserve and maintain the optimum qualities of colour, flavour, texture and nutritive value. Food that is dirty or spoiled may cause diarrhoea and vomiting (food poisoning). Flies, dust and dirty hands can contaminate food. Food handlers' clothing and hands should always be clean. In case of refrigeration, foods should also be covered both inside and outside of the refrigerator. This prevents them from being contaminated by flies or other insects, drying out, absorbing odours, or having anything spilled on them. For preventing food-borne illnesses we need food to preserved through processes such as- 1. Heating
2. Freezing
In our hot climate, food spoils easily when not cleaned
and stored properly
3. Drying
4. Fermentation
5. Use of chemical preservatives
6. Irradiation, and
7. Safe food handling procedures. In our hot climate, food spoils easily when not cleaned and stored properly. In health care, safe food handling procedures are of paramount importance. Consumers not following rules for safe food handling cause most food borne illnesses. Following the rules of food hygiene should prevent food poisoning:
School of Science and Technology 32

Nutrition and Dietetics
♦ People known to be harboring infections should not be allowed to handle foodstuffs in the critical stages of preparation and distribution.
♦ Always wash hands before and after handling food.
♦ Handle food as little as possible. Never touch utensils in areas that will come into contact with the mouth.
♦ Be sure to cover the mouth and nose during coughing or sneezing when working with food.
♦ To prevent foods from being contaminated, keep them covered until served to the patient.
♦ Keep perishable foods frozen or refrigerated immediately after purchase, to prevent multiplication of bacteria already present. The refrigerator should be kept clean and foodstuffs must be placed in it in such a way that cold air can freely circulate around items. This is to make sure that the foodstuffs kept in the fridge are cooled rapidly and kept cold. No spoiled food should be placed in a refrigerator as it infects other foods too. Discard perishable items after 48 hours.
♦ Cook food for a sufficient length of time and at a high enough temperature to destroy bacteria. Meat should be cut into small pieces to ensure thorough penetration of heat. If required in large chunks, meat should be roasted or pressure-cooked.
♦ Do not keep food exposed, especially after cooking. If the food is to be consumed later, it should be promptly cooled and put in the refrigerator.
♦ If food has been refrigerated for a long time, it should be reheated before consumption.
♦ Hot food should be kept above 1400 F until served; cold food should be kept below 400 F until served. The bacteria count can double every 15 to 30 minutes in cooked foods that are allowed to cool to between 450
F and 1400 F. Do not leave cooked food longer than one hour at room temperature.
♦ If a food does not look or smell right, throw it out.
♦ Keep food storage, cooking and service areas clean and free from insects and rodents.
Bangladesh Open University 33

Food Safety and Hygiene
1.4. Some Criteria to Help Make Food Safe
Type of Food How to Handle and Store
Cereals Keep cereals dry in clean, covered containers. Store baked products in a cool, dry place to prevent mould.
Starchy fruits, roots and tubers
Reap carefully, do not bruise or cut skins. Do not wash until ready to use. Store in a cool place and do not allow sprouting. Keep tubers in a dark place to prevent sprouting.
Legumes and nuts Clean and dry very well before storing. Store in clean, dry pans with tight covers.
Vegetables (a) dark green leafy vegetables
Reap or buy leafy vegetables early morning or later afternoon when needed and try to avoid storing. Place in plastic (food grade) bags before refrigeration.
(b) Yellow vegetables
Store in a cool place or in plastic bags in refrigerator to prevent shriveling.
Fruits Use fresh fruits quickly the same day as you buy it, or freeze it.
Foods from animals Keep cool and covered until ready to use. Refrigerate if necessary.
Milk Carry and store fresh milk in dark bottle or covered pans to keep out light. Light destroys riboflavin, an important vitamin available in milk. Keep pasteurized milk chilled. Keep powdered milk in air-tight cans.
Eggs Clean eggs well. Store in a cool place.
Fats and substitutes Place butter/margarine in a dish containing water or place in refrigerator.
1.5. Exercise 1. Why do we process food? 2. How are nursing personnel responsible for preventing food
poisoning in patients? 3. What are the procedures that should be taken to get safe food? 4. Discuss some criteria to make food safe.
School of Science and Technology 34

Nutrition and Dietetics
Lesson 2: Hazards of Unsafe Food 2.1. Learning Objectives
At the end of this lesson you will be able to- ♦ describe hazards of various food substances, ♦ list the microorganisms responsible for most food related illnesses. 2.2. Hazards of Food Substances The main hazards of unsafe foods are concerned with health. Food poisoning, food allergies or food sensitivities, and food idiosyncrasy (food intolerance to non-allergic food) are the food hazards. Food-borne toxicants can cause a decrease in nutrient availability or utilization, or they may damage the gastrointestinal tract and thereby adversely affect absorption. Food-borne intoxications are usually associated with unusual dietary habits such as consumption of strange foods, foods prepared by abnormal methods, or excessive amounts of certain foods. Most of the nutrient-toxicant interactions are insignificant in terms of creating a health hazard. Food poisoning,
food allergies or food sensitivities,
and food idiosyncrasy (food intolerance to non-allergic food) are the food hazards
2.3. Microorganisms Two main types of organisms are of concern to those manufacturing or providing food: spoilage organisms and pathogenic organisms causing food-borne disease. Spoilage organisms are mainly yeast, moulds (fungi) and bacteria. The presence of these organisms in food is why we need food preservation techniques. 2.4. Natural Toxins in Food There are many biologically active substances in foods, many of which have not yet been identified. Although certain foods react adversely with some people, leading to headaches, nausea, indigestion or other symptoms, these are often individual responses, such as allergies, not shown by the population in general. Most foods we eat do not cause a toxic reaction because over the centuries humankind has learnt to avoid eating toxic substances by- ♦ selection of food crop varieties
♦ eating a mixed diet
♦ processing, especially heating.
Bangladesh Open University 35

Food Safety and Hygiene
2.5. Food Poisoning Food poisoning is a worldwide phenomenon. In industrialized countries bacteria is the main cause of food poisoning. Many foods are an excellent culture medium in which organisms thrive. 2.6. Microorganisms Require ♦ certain nutrients
♦ moisture
♦ a neutral or slightly acidic pH environment.
♦ foods naturally supply all these elements, and the microorganisms will thrive in them, warmth shortening the time to multiply.
Many organisms are naturally present in foods, while others are added unintentionally during food preparation and handling. While illness from microbial contamination is rarely fatal. Food contamination is of concern for many reasons. It can result in death, especially in immuno-suppressed patients who cannot form antibodies to the antigens present. There is no excuse for serving unsafe food to people. The four most common microorganisms are- ♦ Staphylococcus aureus
♦ Clostridium perfringens
♦ Salmonella species and
♦ Clostridium botulinum. These four microorganisms account for 94% of all food related illnesses. They produce toxins in the food, which are hazardous when eaten. Food processing
provides the means of reducing
microbiological and toxicological
hazard
Food processing provides the means of reducing microbiological and toxicological hazards. The use of fire, discovered later in human evolution, allowed for the introduction of a whole new range of foods into the diet, as the action of heat destroyed many toxic substances. Although there is a long list of substances known to be toxic in foods, many are only mildly so. Indeed, only a few of them pose a hazard to health.
2.7. Exercise 1. What are the hazards of unsafe food? 2. What are the organisms most often responsible for food poisoning? 3. What are the conditions required for microorganisms to thrive?
School of Science and Technology 36

Nutrition and Dietetics
Lesson 3: Maintenance of Food Hygiene 3.1. Learning Objectives
At the end of this lesson you will be able to- ♦ describe how food hygiene can be maintained, and ♦ list and describe the procedures for safe food handling. 3.2. Food Hygiene 'Food Hygiene' means all measures necessary for ensuring the safety, wholesomeness and soundness of food at all stages from its growth, production and manufacture until its final consumption. Knowledge of variety of toxicants that may occur in foods due to lack of sanitation and hygiene, poor transportation, storage, processing, distribution and cooking is therefore necessary for every consumer. Handling, storing and preparing foods properly will prevent them from spoiling and losing nourishment. Food handler's clothing and hands should always be clean. Do not handle food if you have an infected cut on the finger or if you have boils. Foods should also be covered both inside and outside of the refrigerator. This prevents them from being infected or infested by insects, drying out, absorbing odors, or having anything spilled on them. Most of all, covered foods keep their taste and nourishment. All surfaces, containers, knives and other equipments that are used in the preparation or storage of food must be kept very clean. Surfaces should be free from cracks or grooves that are difficult to clean or may trap particles of food, which attract pests and decay causing the growth of organisms and spread of disease.
Handling, storing and preparing
foods properly will prevent them from spoiling and losing
nourishment
Domestic animals should be kept well away from areas used to prepare or store food for the family to eat. Animal feeds should not come into contact with human food. Special care is needed once food has been cooked since warm food can spoil easily. Cooked food should not come into contact with uncooked or foods to be eaten raw. In general food should be kept very hot or cold. 3.3. Safe Food Handling Procedures The biggest controllable hazard in foods involves microorganisms that naturally thrive in foods. In health care agencies safe/proper food handling procedures are of great importance. Consumers and food service enterprises not following rules for safe food handling cause most food borne illnesses.
Bangladesh Open University 37
Food Safety and Hygiene
3.4. Exercise 1. What is food hygiene? 2. Give examples of violations of food hygiene you have seen in your
home or in your hospital. 3. What are the safe food handling procedures? 4. How are nursing personnel responsible for preventing food
poisoning in-patients?
School of Science and Technology 38
Nutrition and Dietetics
Lesson 4: Preservation of Food 4.1. Learning Objectives
At the end of this lesson you will be able to- ♦ list the reasons for food processing, ♦ describe and give examples of food preservation techniques, ♦ describe necessity of food preservation, and ♦ discuss about various methods of food preservation.
4.2. Food Spoiling Food spoilage is brought about by the action of enzymes present in foods due to the action of microorganisms or due to infestation with insects and worms. Creating all environments unfavorable to the action of enzymes or to the growth of microorganism is the main objective of food preservation. Natural and artificial methods are used to preserve foods. Chemical preservatives are also added to foods to preserve them.
As the principal spoilage agents are normally present in foods, destroying them or preventing their development is the chief problem of food preservation. Any condition opposed to the development of these organisms, whether by retarding their growth or by entirely destroying them, aids in the preservation of food.
Food spoilage is brought about by
the action of enzymes present in
foods due to the action of
microorganisms or due to infestation with insects and
worms
4.3. Ways of Preserving Food 4.3.1. Drying: Traditionally this was sun drying or steaming. Removal of moisture is of benefit in preserving food because dehydration of foods prevents growth of the microorganisms, since they cannot grow without water. Bacteria, which require water, cannot grow and autolytic enzymes are inhibited. Freeze drying is a process of removing water while the food is frozen. Drying may retard enzyme action also. Meat, fish, eggs, vegetables, and green leaves can all be dried to remove the water. 4.3.2. Heating: The process of heating commonly preserves food. Cooking kills most microorganisms depending on the length of time and temperatures used. Heating is used in several ways. Germs are usually killed at above 700 C or more heat. Blanching (1-8 min at 1000 C depending on the food) before freezing and canning inactivates some enzymes. Pasteurization of milk (720 C for 15 seconds) destroys almost all pathogenic organisms but spores. Cooking destroys all or nearly all organisms (except spores).
Bangladesh Open University 39

Food Safety and Hygiene
4.3.3. Refrigeration: It does not destroy microorganisms but those present cannot multiply or do so only slowly; it also slows autolysis by enzymes in the food. Meat, fish, vegetables, fruit, butter, and chocolate can all be kept in this way. 4.3.4. Freezing: Like cold storage, freezing does not destroy the microorganisms and enzymes present in the foods. Freezing prevents bacterial growth because bacterial enzyme activity slows down and then stops as temperature is lowered. In addition, water in the food is not in an available form for multiplication of bacteria. It inhibits the growth of microorganisms, thus freezing methods are not bactericidal but rather bacteriostatic. Freezing now preserves practically all-common fruits. Freezing may preserve most of the vegetables that are saved after cooking.
Water in the food is not in an
available form for multiplication of
bacteria
4.3.5. Adding Salt or Sugar: Adding salt or sugars are other ways of lowering the 'water activity' and thus preventing bacterial growth. They also cause exosmosis from the bacteria cells. 4.3.6. Fermentation: This is a method of utilizing microorganisms to preserve foods from pathogenic organisms. Microorganisms produce acid or ethanol, or both which inhibits pathogenic and spoilage organisms. This is the oldest form of preservation and is used in making cheese, bread and wine. The end products of bacterial growth are inhibitory to the growth of pathogenic organisms. 4.3.7. Chemical Preservation: Certain chemicals are helpful in preserving foods either by retarding or preventing the growth of microorganisms. Benzoic acid, propionic acid, and ascorbic acid are naturally present in certain foods. These are added to certain specified foods in controlled amounts to prevent bacterial growth. 4.3.8. Ionizing Radiation: Food irradiation is another food preservation technique to prevent food spoilage. Short-wave length gamma rays are used on foods to kill insects, bacteria, yeast and moulds that often contaminate foods and cause illnesses. The organisms are killed by very low dosages, so the food itself does not become radioactive.
4.4. Exercise 1. Why do we preserve food? Discuss the basic idea behind food
preservation. 2. What are the methods of food preservation? Describe them and
give some examples from your own experience.
School of Science and Technology 40

Nutrition and Dietetics
Unit 3: Diet and Disease Lesson 1: Dietary Management for a Hospitalized
Patient 1.1. Learning Objectives
At the end of this lesson you will be able to- ♦ describe the basic concepts of diet therapy, ♦ discuss how a patient’s nutrition is maintained, and ♦ compare and contrast the nutritional impact of oral, enteral and
parenteral feedings.
1.2. Dietetics In the treatment and prevention of human diseases, basic nutritional and dietary principles, often referred to as dietetics, is an important contributor. Dietetics is concerned with the science and art of human nutrition and is an essential component of the health sciences. Dietetics is the knowledge concerning foods, which will provide nutrients throughout the life cycle in health and disease. Diet therapy for a particular disorder may be described in terms of the disorder, as in diabetic diet, kidney diet and diet in hypertension. In terms of nutrient contents, diet therapy may be described as in low-calorie diet, low-protein diet, or high-protein diet. Dietetics is
concerned with the science and art of human nutrition
and is an essential component of the health sciences
There are six categories of hospital feedings- 1. Regular diet
2. Diets with texture and blandness modifications
3. Diets with nutritional modifications
4. Diets with miscellaneous modification
5. Artificial feeding methods and
6. Special test diets for diagnostic purposes. Each of these categories is presented in Table.
Bangladesh Open University 41

Diet and Disease
Table: Examples of different types of hospital diets.
Category of Diets Examples of Diets
1. Regular diets Regular foods with simple adjustments
2. Diets which texture and blandness modifications
Fluid-regulated diet, Liquid diet,
Soft diet, Fibre-regulated diet
3. Diets with nutritional modifications
Calorie-controlled diet
Protein-controlled diet
Fat-controlled diet
Carbohydrate-controlled diet
Mineral-controlled diet
(electrolyte-controlled diet)
4. Diet with miscellaneous modifications
Tyramine-controlled diet
Uric-acid-controlled diet
Purine-controlled diet
5. Artificial feeding methods
Parenteral feedings
Enteral feeding
6. Special test diet for clinical diagnosis, confirmation, and assessment of disorder
The diet may be a test for:
Fat excretion
Metabolic studies
X-ray studies
Stool, blood studies
Glucose tolerance
Ketogenic hypoglycaemia
Pheochromocytoma
Carcinoid tumors
Collagen degradation
Urinary creatinine excretion 1.3. Basic Concepts of Diet Therapy Diet and nutrition may be related to disease in two ways- a. Therapeutic special dietary and nutritional care may be required for
people with certain forms of illnesses. Therapeutic nutrition can affect
School of Science and Technology 42

Nutrition and Dietetics
the course of an illness. For example, diet therapy can reduce or control the symptoms of diabetes.
b. Preventive by using the knowledge that certain dietary practices or substances may produce or worsen specific clinical disorders. Diet can prevent some diseases. For example, eating too much salt may cause high blood pressure. On the other hand, avoiding excess intake of salt may help to prevent high blood pressure. Life long dietary habits can influence disease prevention.
1.4. The Role of Nurses Nurses can play an extremely important role in clinical dietetics. They coordinate the activities of doctors, dietitians, and patients, including diet prescription, food service, meal serving, and patient response. Arranging food trays, helping patients eat, and answering questions are among the nurse’s duties. In addition, nurses observe patients directly and record the amounts of fluids, foods, and nutrient supplements consumed. Measuring the amount of urine voided and evaluating a patient’s response to the dietary regimen are related duties of the nurse. Enteral and parenteral feeding practices are administered and monitored by nurses. In the case of intravenous fluids and electrolytes, only nurses who also check the patient's response, carry out the doctor's prescription. The dietitian or nutritionist is helped in planning other aspects of the patient's nutritional and dietary needs by the nurse's observations and the patient's health history. The nurses frequently ask the patient's only source of nutritional and dietary information and advice. In any case, the nurse has the best opportunity to teach the patients principles of nutrition in the course of the daily care. After the patient is discharged, the nurse may be the only health professional in contact with the patient. Therefore, the nurse plays an important part in the nutritional and dietary care of the patient. 1.5. Nutritional Maintenance Hospital malnutrition is a continuing problem. The reasons for inadequate nutritional care include- a. the patient's poor nutritional status
b. adverse effects from drug treatment
c. pain
d. nausea
Bangladesh Open University 43

Diet and Disease
e. vomiting
f. inadequate care resulting from poor communication between patient and care givers
g. lack of nutritional knowledge
h. patient's inability to follow the dietary prescriptions. 1.6. Knowing the Patient One of the most important ways for a hospital and health team to prevent malnourishment is to know the patient and monitor his or her progress, especially regarding nutrition. The following factors are of particular importance: 1.6.1. Personal History The health history and interviews of patients, family members, and health personnel may reveal relevant details such as health and special feeding problems. 1.6.2. Life long Eating Habits and Nutritional Status Information should include the number of meals eaten daily, time and location of each meal, sizes and servings, types and qualities of foods, foods habits and eating difficulties. 1.6.3. Body Weight History Specially important in disorders such as diabetes and renal diseases, are the degree of overweight or underweight, body weight history since childhood, family weight history, weight at hospital admission, and ideal body weight. 1.6.4. Drug Use History A thorough knowledge of the patient's drug use history is very important because of the relationship between drugs and nutritional status. 1.6.5. Ideal Body Weight and Caloric Intake Standard tables and sex/frame/height rules of thumb help to establish a patient's ideal body weight. Recommended Dietary Allowances (RDA) and other methods may be used to determine calorie intake.
School of Science and Technology 44

Nutrition and Dietetics
1.6.6.. Eating Pattern During the Hospital Stay For patients with fever, infections, and conditions of stress, overall monitoring is even more important. If protein and calorie consumption fall below certain levels, drastic measures such as enteral feeding (via the gastrointestinal tract) or parenteral feeding (via the veins) may be indicated. 1.6.7. Medical History The patient's records should include nutritional status, results of blood and urine analysis, medications administered, and a complete description of hospital feeding, such as diet ordered, nutrient intake, and use of enteral and parenteral feeding. 1.7. Communication with other Medical Personnel The best patient care results from close communication among the doctor, nurse and dietitian. Coordination with other professionals - pharmacists, oral surgeons, and physical therapists, for example - may also be required in certain disorders such as cancer, burns, and chronic illnesses. 1.8. Helping the Patient Comply A lack of nutritional support programs is not the only reason for malnutrition among hospital patients. Another problem is a patient's unwillingness or inability to eat the hospital diet. All sick people experience physical and psychological trauma to some extent. Hospitalization can increase anxiety and confusion. Other major considerations in patient compliance include- ♦ personal preferences
♦ condition on admission
♦ diet prescription
♦ patient's level of knowledge, and
♦ adjustments for specific problems. Basic eating pattern are largely determined by socioeconomic, ethnic, cultural, family, personal liking and disliking and religious factors. These eating patterns and the patient's condition on admission provide important clues to appropriate dietary care.
Bangladesh Open University 45
Diet and Disease
1.9. Regular Hospital Diet The regular hospital diet contains all the essential nutrients, such as calories, proteins, fats, carbohydrates, minerals, and vitamins, in adequate amounts to satisfy the Recommended Dietary Allowances. Such a diet is based on the basic four food groups. In planning any regular or therapeutic diet, the objective is nutritional adequacy. If the diet is modified to treat a patient with a disease, the nutrient contents must still comply with the RDAs. A regular diet sometimes requires only slight adjustment for a hospitalized patient. For example, a patient recovering from minor surgery needs foods high in protein and calories in addition to the regular diet. Such foods as cheese, meat, bread, fat, milk help to rebuild body muscle. 1.10. Enteral and Parenteral Feedings Though oral ingestion and digestion is the best way to assure the proper nutrient intake of a patient, a number of clinical conditions make the normal route of nourishment unsatisfactory or unadvisable. The two basic artificial methods of feeding in a hospitalized patient are- a) enteral and
b) parenteral nutrition. a. Enteral feedings are administered directly into the gastrointestinal
tract. Enteral feedings may combine oral feeding of regular foods with nutritional supplements.
b. Parenteral feedings enter the body by injection directly into blood veins. Parenteral feeding may include standard intravenous (IV) therapy and partial or total parenteral nutrition.
In circumstances where oral feeding is difficult, enteral feeding is indicated. Examples of enteral feedings are in such conditions as intestinal diseases, severe burns, and head and neck tumors. In some cases, a patient needs to be nourished directly through the blood stream, bypassing the gastrointestinal system. The nutritional adequacy of parenteral feeding varies from the very temporary standard intravenous therapy (IV) to total parenteral nutrition (TPN), which can be nutritionally complete. Standard IV therapy- a supportive system of fluids and electrolytes is used in standard intravenous therapy usually-sodium (saline), ammonium chloride, and dextrose (5% to 20%) solutions. Used for emergency situations such as the period following difficult childbirth or surgery, this method provides a minimal amount of nutrients. The
School of Science and Technology 46

Nutrition and Dietetics
patient is kept on this treatment only for one to two days to avoid semi-starvation. Total parenteral nutrition (TPN)- provides an adequate amount of calories, proteins, fats, carbohydrates, minerals and vitamins. These nutrients must be administered via the central venous system. TPN is used in various clinical conditions such as kidney failure and cancer. The use of TPN is increasing because of its many advantages. First, body organs are directly provided with concentrated calories, amino acids, and essential fatty acids, vitamins and minerals, which are completely absorbed without waste. Second, the gastrointestinal tract is permitted to rest and the body has a chance to replenish itself. Third, speedy repair of organs and tissues occurs because of the direct availability of nutrients. TPN can lead to weight gain, a positive nitrogen balance, wound healing, and synthesis of hormones and enzymes - in short, it hastens recovery.
Bangladesh Open University 47

Diet and Disease
1.11. Exercise A. Short and Broad Questions 1. What are the different types of hospital diets? Discuss with
example. 2. Discuss the two basic relationships between nutrition and disease.
School of Science and Technology 48

Nutrition and Dietetics
Lesson 2: Dietary Management of Disease-I, Diet in Diabetes Mellitus
2.1. Learning Objectives
At the end of this lesson you will be able to- ♦ discuss the role of diet in the treatment of diabetes, ♦ explain to patients the basic dietary principles of managing diabetes,
and ♦ discuss the clinical symptom of diabetes. 2.2. Definition Diabetes mellitus is a chronic state of hyperglycaemia, resulting from absolute or relative lack of insulin and is caused by heredity, environmental factors or both often acting together. Hyperglycaemia is a condition where blood glucose remains higher than normal. Glucose is a type of sugar, which is obtained from digested food. It increases in blood and urine because it is not processed correctly by the body due to the reduction in or absence of insulin.
Diabetes mellitus is a chronic state of
hyperglycaemia, resulting from
absolute or relative lack of insulin
2.3. How does this Happen? Some symptoms of diabetes: A person with diabetes may- 1. Urinate often. This happens because more urine is produced as water is
drawn from the cells to help excrete excess sugar in the blood.
2. Become very thirsty and drink a lot. The loss of excess water through the urine makes one very thirsty.
3. Eat often-as the food is not utilized so diabetics are always hungry.
4. Complain of a pricking, tingling or creeping sensation on the skin and may itch a lot.
5. Complain of blurred vision. Some people say their eyes are cloudy or dark.
6. Cuts, boils and burns are not healed quickly.
7. Become weak and tire easily, as the various parts of the body do not get enough energy and nourishment.
8. Lose weight in spite of normal or increased appetite. The body tries to get nourishment by using up its muscle and fat. This usually happens in Type I diabetes.
Bangladesh Open University 49

Diet and Disease
A person who has any of those symptoms, especially someone who has diabetes in his family and is overweight should be checked regularly for diabetes. If diabetes is found early and controlled, the person can live a long, happy, healthy and normal life. The objectives of dietary management in diabetes include the achievement of- 1. Optimum nutrition,
2. Desirable body weight,
3. Keeping blood sugar levels normal or near normal,
4. Keeping blood fat low to prevent heart disease. Heart disease is nearly three times more common in diabetics than in non-diabetics, and
5. Keeping low levels of sugar and ketones in the urine. In addition, the diet should aim to minimize chronic degenerative complications. Most diabetics will require a regulated food intake throughout life. Dietary instruction given to a diabetic must be simple. 2.4. Diet is an Important Part of Diabetes Management Each person with diabetes needs to be provided with an individualized plan and appropriate counseling for using the plan. Follow up counseling is usually essential. Diabetes is a chronic life long disease. The diabetic has essentially the same nutritional needs as a non-diabetic of similar age, weight and with the same activity level. Thus, the food intake of a diabetic should follow the pattern for a normal diet. In general, most persons with diabetes can have a normal diet based on the six food groups. All foodstuffs can be classified into exchange groups for the benefit of diabetic patients. With careful selection from this exchange group a diabetic can consume any item within the limits. A typical diet prescription provides 10 to 30 percent of the energy at breakfast, 25 to 35 percent in lunch and dinner, and sometimes zero to 25 percent for between meal and snakes. 2.4.1. Complex Carbohydrate Foods Should form the Bulk of the Diet It is the carbohydrate that provides calorie easily. So, it is recommended that 50-60% of the calories should come from complex carbohydrates. Foods such as unrefined staples, peas, beans, vegetables and fresh fruits are good sources of complex carbohydrates. They are better for the person with diabetes than highly refined foods such as flour, crackers, most dried and ready to eat cereals, sugar, honey and other sweets. Complex carbohydrates are better because they are digested more slowly. As such,
School of Science and Technology 50

Nutrition and Dietetics
the sugar from them is absorbed more slowly over a prolonged period of time. Complex carbohydrate foods also have lots of fibre. Fibre helps the body to absorb glucose slower so that the blood sugar levels do not shoot up very rapidly. Fibre also helps a person to have regular bowel movements and lowers the fat like substance, cholesterol in the blood. 2.4.2. The Amount and the Type of Protein Rich Foods The protein allowance for the adult diabetic is the same as for the normal person one gram for each kilogram of body weight (1g/kg body wt). Protein should provide about 15-20% of the calories. Protein rich foods, such as fish, chicken (without skin) lean meat, low fat cheese, skimmed milk and dried peas and beans, which are low in fat, are the best. 2.4.3. The Amount and Type of Fat After establishing the proteins and carbohydrates of the diet, fat is used to supply the remainder of the calories. This will vary from 25-30% of the calories that should be coming from fat. Diets low in cholesterol and saturated fats and relatively high in polyunsaturated fats have been proven to have a cholesterol lowering effect. Thus for diabetics, foods high in cholesterol and saturated fats should be restricted or, in certain circumstances be avoided. 2.5. Meals for Type II Diabetes (Diabetes not Dependent on Insulin) Persons with type II diabetes (whose weight is normal) should eat food to provide enough calories to maintain their weight. This will help to ensure that their blood sugar levels are neither too high nor too low. A person who is obese will need fewer calories until the ideal weight is achieved. A low calorie, high fibre diet and exercise will help the person to lose weight. A simple guide to menus for Type II diabetes- Total daily division of food into exchange- This will provide 1200 kcal (carbohydrate 125 gm, protein 70 gm, fat 45 gm) and this should be equally divided among three meals. Most foods cooked for the family is also good for the diabetic. Special diabetic foods are not necessary. Foods for persons with diabetes should
Bangladesh Open University 51

Diet and Disease
be measured. A measuring cup and a teaspoon are helpful. Most foods are measured after being cooked. 2.6. Meals for Type I Diabetes (Diabetes Dependent on Insulin) In planning meals for Type I (insulin dependent) diabetes, care must be taken to include the kinds, amounts of foods to get the right ratio of carbohydrates / fats / proteins. Food is usually divided into three meals and a bedtime snack. Sometimes there are mid-morning and mid-afternoon snacks. The meals are spaced so that the blood sugar level remains stable throughout the day. It is important for persons with type I diabetes to eat regularly to prevent the blood sugar from getting too low or too high. The morning, noon and evening meals should contain the bulk of the calories. Table showing menus for the diabetics: a. Number of Servings Per Day
Exchange Morning Snack Lunch Evening Supper Bedtime
Carbohydrate 3 2 6 2 6 1
Protein 1 0.5 2 0 2 0
Fat b. Daily Diet Chart i. Morning 1. Bread or Ruti 2 pieces = 2 carbohydrate exchange = 150 calorie
2. Vegetable = one exchange = 75 calorie
3. Meat/fish/egg = two exchange = 80 calorie
4. Tea/coffee (without sugar)
= one cup = 0 calorie
Total = 305 calorie ii. Snacks 1. Biscuit or Ruti 2 pieces = 2 carbohydrate exchange = 150 calorie
2. Meat/fish one piece of 15g
= 3.5g protein = 20 calorie
Total = 170 calorie
School of Science and Technology 52

Nutrition and Dietetics
iii. Lunch 1. Rice 4.5 cup or Ruti 6
pieces (30g each) = 4 carbohydrate exchange = 300 calorie
2. Vegetable = one exchange = 60 calorie
3. Meat/fish = two exchange = 100 calorie
4. Dal half cup = one exchange = 75 calorie
Total = 535 calorie iv. Snacks 1. Biscuit 30g/muri/chira = 2 exchange = 150 calorie
2. Black tea/coffee (without Sugar)
= one cup = 0 calorie
Total = 170 calorie v. Supper 1. Ruti/bread (30g
each) = two carbohydrate exchange = 150 calorie
2. Meat/fish = three exchange = 165 calorie
3. Vegetable = two exchange = 120 calorie
4. Dal = one exchange = 75 calorie
5. Milk (skimmed) = one exchange = 80 calorie
Total = 590 calorie vi. Bedtime 1. Ruti 1 piece/biscuit
15g = one carbohydrate exchange = 75 calorie
2. Fruit (1 small guava/ orange/apple)
= two exchange = 80 calorie
3. Oil 15g for cooking = 135 calorie
Total = 310 calorie
Grand Total = 2040 calorie
Bangladesh Open University 53

Diet and Disease
2.7. Exercise A. Short and Broad Questions 1. Describe the clinical symptoms of diabetes. 2. What dietary information is needed before planning a diabetic
diet? 3. What is the dietary treatment of type II (insulin independent)
diabetes? 4. What percentage of carbohydrates, proteins and fats are needed for
diabetics? 5. What form of carbohydrate is useful for them and why? 6. What is the advantage of fibre in diabetic diet?
School of Science and Technology 54

Nutrition and Dietetics
Lesson 3: Dietary Management of Disease-II, Diet in Diarrhoea
3.1. Learning Objectives
At the end of this lesson you will be able to- ♦ define diarrhoea, ♦ describe and give examples of the dangers of diarrhoea, and ♦ define and describe rehydration. 3.2. Definition It is a condition in which loose stools are passed more frequently, effortlessly and are mixed with mucous or blood or both. People vary in the type of stools they pass, and how often they pass them, but as a general guide, three or more loose or watery stools in a day can be considered as diarrhoea. Frequent passing of normal stools is not diarrheoa. Breastfed babies often have stools that are very soft, but that is not diarrheoa.
Three or more loose or watery
stools in a day can be considered as
diarrhoea Diarrhoea is most common between six months and three years of age. It is also common in babies who are drinking cow's milk or infant feeding formulae. Diarrhoea occurs in adults as a symptom of many diseases and may occur during epidemic. Diarrhoea is an illness that requires immediate care and should never be neglected. 3.3. Why Diarrhoea is Dangerous? The two main dangers of diarrhoea are a) malnutrition and b) death; because the food is not properly absorbed, the child becomes rapidly dehydrated and malnourished. When the child looses large amounts of water and salts from the body, in the frequent watery stools, it can result in death. The primary cause of this death is dehydration. Small children with severe diarrhoea lose water and salts rapidly and can die quickly, sometimes within a few hours. In many cases, children with diarrhoea recover by themselves, but they become weak. 3.4. What Causes Diarrhoea? Diarrhoea is caused by infection of the bowel by germs or organisms that cannot be seen by the naked eye. They enter through the mouth into the stomach. Germs grow in an unclean environment and enter our body because of our unhygienic practices. Some of these are-
1. Drinking dirty water.
Bangladesh Open University 55

Diet and Disease
2. Drinking dirty milk.
3. Touching food with dirty hands.
4. Taking dirty food.
5. Using dirty feeding bottles.
6. Using dirty cooking and eating utensils.
7. Allowing flies, dust and dirt to get on to food; and
8. Eating dirt and playing in dirty places. Diarrhoea also can be caused by malnutrition. When a child is malnourished he cannot digest his food normally. Malnutrition also weakens the walls of the stomach so that it cannot absorb food well. When the food is not digested and absorbed properly the child gets diarrhoea. 3.5. What Causes Dehydration? When there is diarrheoa, the intestines don’t work normally and the water and salts pass very slowly or not at all through the mucosal wall. As a result, the body does not take up as much salt and water that needs to be replaced and more than the normal amounts are passed in the stools. Thus, the body is drained of water, salts, and nutrients; this is called dehydration. Diarrhoea may sometimes be accompanied by vomiting. Vomiting increases the rate of dehydration. Dehydration occurs faster in hot climates and when there is fever.
♦ Dehydration is dangerous in diarrhoea.
♦ Dehydration is caused by loss of water and salts from the body.
♦ Save a child with diarrhoea by rehydration.
3.6. What is Rehydration? The easiest way to save the life of a child with diarrhoea and rehydration is to replace the lost water and salts. This can be achieved by adding clean water to a specially prepared mixture of salts available as a powder in sealed packets. Salt and the glucose are the two main ingredients of this mixture. This salt mixture is known as Oral Rehydration Salts (ORS). After mixing the contents of one standard packet of oral rehydration salts in one litre of boiled drinking water, it is commonly known as oral rehydration solution.
The easiest way to save the life of a
child with diarrhoea and
dehydration is to replace the lost water and salts
School of Science and Technology 56

Nutrition and Dietetics
3.7. Composition of ORS As a general rule, 40g of ordinary sugar and 4-5g of common salt should be mixed in 1 litre of clean drinking water. It is extremely important to mix the sugar, salt and water in the correct proportions. A commercially prepared packet available in the market will contain-
Ingredient Amount
Sodium Chloride 3.5 grams
Sodium Bicarbonate 2.5 grams
Potassium Chloride 1.5 grams
Glucose 20 grams
This needs to be added to 1 litre of potable water. 3.8. How to give the Solution to the Child? The prepared solution should be kept in a cool place and kept covered to protect it from flies and dust. Use the fluid on the day it is prepared. Throw away any fluid that was prepared the day before. Small amounts of fluid should be given to the child every few minutes. The best way is to give 2-3 small spoonfuls from a cup, wait 2-3 minutes, then give some more. In this way, the child is less likely to vomit. If the child does vomit, wait 5-10 minutes, then give some more. Vomiting is not a reason to stop giving the solution, unless it is severe and frequent. 3.9. Dietetic Management A child less than six months old should continue to get milk feeds. Breast milk is the best. A child above six months of age should get foods that are very nourishing but not bulky. These foods include breast milk, mashed fruit, juices and porridge. A child over six months of age should continue to be breastfed. In addition, the child should get mashed fruit, fruit juices, porridge and mixes of regular family food such as rice, bread, potato, fish, eggs, meat, peas, and soft vegetables. Oil, butter, margarine and gravy should be added to the foods to provide more energy. Never stop breast-feeding during diarrhoea.
Never stop breast-feeding during
diarrhoea
In some clinical conditions of diarrhoea, a very low residue diet is recommended. Residue is the bulk remaining in the intestine after food is assimilated. Milk is a high residue food. In acute diarrhoea, not responding
Bangladesh Open University 57

Diet and Disease
to the above suggestions, the alimentary canal must get complete rest. If excessive vomiting is present no food is allowed. Saline with 5% glucose can be given. Electrolytes like sodium and potassium with high fluids are recommended. Apples, tender coconut water (dab), fruit juices, rice gruel and thin porridge without milk is prescribed. Arrowroot and sago are excellent for diarrhoea. Strained fruit juices and soups are allowed. Jaggery and honey are also good. Leafy vegetables and green vegetables should be avoided. Over ripe or fibrous vegetables are excluded. Breast-feeding is
the best way to prevent diarrhoea
in infants
Biscuits, soft desserts without milk and soft cooked eggs are permitted. Fried items, fat, pulses, beans, vegetable salads, seedy fruits, sweets, dried fruits, nuts, condiments and spices are best avoided. Only double cooked mashed vegetables are allowed. Once normal food is tolerated, poached eggs, cereal, porridge, fruit juice, baked non-vegetarian items, mashed potatoes or soups, biscuits and arrowroot drinks can be given in the menu. Since the food intake is low at first minerals like iron, calcium and all vitamins have to be supplemented. A fluid diet is modified into a soft bland diet as the condition of the bowel improves. Feeding a child who is ill requires extra patience, time and care. After recovery from diarrhoea, extra food should be given. Try to give a little more than the child normally eats. Small feedings in between the main meals is also a good approach.
3.10. Exercise A. Short and Broad Questions 1. What are the causes of diarrhoea? 2. What are the consequences of diarrhoea? 3. How can dehydration be corrected?
School of Science and Technology 58

Nutrition and Dietetics
Lesson 4: Dietary Management of Disease-III, Diet in Cardiovascular Disease
4.1. Learning Objectives
At the end of this lesson you will be able to- ♦ describe the dietary management of hypertension, ♦ identify methods of reducing cholesterol in the body, and ♦ list the guidelines for managing hypertension without drugs. 4.2. Diseases of the Heart Diseases of the heart and the vascular system account for much of the illness in the adult population. Hypertension is one of the high risk factors for chronic heart disease (CHD). The main objectives in the dietary treatment of cardiac patients are - 1. to provide adequate nourishment and proper nutrition, with maximum
rest for the heart, and
2. bring the patient to a good nutritional status by appropriate diet. Diet therapy should be the first consideration for the hypertensive patient. An initial step in treating hypertension is to advise overweight people to lose weight by reducing their intake of calories and increasing their physical exercise. There have been several reports that people with hypertension tend to have increased sodium concentrations in cells and abnormal activities in blood cell membranes - one of the mechanisms for keeping sodium out of and potassium inside the cell. Depending on the degree of excessive weight at the time of diagnosis, moderate weight loss influences blood pressure more of less uniformly (about five or six percent of body weight). However, weight loss without sodium restriction may be discouraging. A lower blood pressure is observed when sodium intake is restricted in sodium sensitive hypertensive patients. On the other hand, heavier people consuming more food, consume more sodium. Hypertension, heart disease or complications of cardiovascular diseases may require a sodium-restricted diet as well as a diuretic. By losing weight, sodium intake is decreased and potassium intake increases. Some level of sodium restriction is usually appropriate. The condition and the patient's ability to follow a diet determine. Restriction of dietary sodium is indicated for two major pathological processes-
Bangladesh Open University 59

Diet and Disease
a) hypertension, and
b) oedema. About one third of mild hypertension can be controlled with mild salt restrictions. When sodium is restricted, all potential sources of sodium should be considered.
Patients should also be encouraged to increase their intake of fresh fruits and vegetables. These are not only low in calories and high in fibre but also high in potassium. By including more fresh foods and less processed food, fewer high fat, high sodium foods are consumed. Additionally, an adequate amount of dairy products should be included in the diet. If a patient cannot tolerate dairy products, calcium supplements of 1 gram per day may reduce blood pressure. A low cholesterol diet menu (cholesterol 160mg). i. Morning
Ruti - two pieces or bread two pieces
Vegetables - one cup
Oil - one tea-spoonful
Egg - one (every alternate day), yolk to be avoided
Tea - one cup
Fruit - one small orange or one guava or one apple ii. Snacks Biscuit - four pieces iii. Lunch Rice - two and half cup
Vegetable - half cup
Leafy vegetable - half cup
Salad - half cup
Meat/ fish - 60 g
Dal - half cup
Oil - three tea-spoonful
School of Science and Technology 60

Nutrition and Dietetics
iv. Supper Bread - four pieces or ruti two pieces
Vegetable - half cup
Salad - half cup
Meat/ fish - 60 g
Oil - two tea-spoonful v. Bedtime Milk - One cup with one teaspoonful sugar Diuretic drugs lower blood pressure by increasing urinary sodium excretion and reducing blood volume. Alternatively, a sufficient reduction of dietary sodium can produce negative sodium balance. This requires that there is- 1. No salt added at the table or in cooking,
2. Food is restricted or omitted in which salt has been incorporated during processing; and
3. Emphasis is placed on foods of low sodium content.
The physiological requirement for sodium is no more than 20ml per day, equivalent to about 1 g of common salt (NaCl). Sodium loss through the skin is very small unless there is much sweating. But people on low sodium intakes and those who have adapted to hot climates lose less sodium in sweat, about 30ml per litre.
1. Many individuals show a fall in blood pressure when salt intake is reduced.
2. Many individuals tend to show a small rise in blood pressure when
sodium intake is experimentally increased in foods. a. Low Sodium (1 mmol or less per usual serving) Rice, plain wheat, flour, coffee, tea. Fresh and dried fruit, fresh and frozen vegetables potatoes, fresh meat and poultry, fresh fish. b. Medium Sodium
Bread, cakes, milk, butter, margarine and low salt cheeses, some mineral water.
Bangladesh Open University 61

Diet and Disease
c. High Sodium (10 mmol or more per usual serving) Smoked fish, corned beef, sausage, and bacon. Most breakfast cereals, baking powder, pickles, tomato sauce, tomato juice. Most biscuits, most cheese, canned vegetables, soups, pizzas and potato crisps. The chief complaint about low sodium diets is that they are very bland and tasteless. People are accustomed to higher amounts of salt on foods. Nurses role are vital to a successful hypertensive diet programme. Since sodium restriction is so important in any anti-hypertensive therapy, it is widely felt that there are not enough dietitians for the desired consultation and monitoring. An informed nurse can honestly compliment patients on even a modest reduction in sodium intake. This feedback can be most encouraging and a prime motivating factor in a successful programme. 4.3. Control of Blood Cholesterol Today, one of the most effective treatments for the reduction of blood cholesterol is by correct food intake. The recommended diet is a moderate fat intake of 20-30 percent of the total calories, and replacement of saturated fats with polyunsaturated fats. The cholesterol content in the diet should be restricted to about 350mg. The diet will be high in complex carbohydrates and fibre, and relatively low in calories. In the diet where dietary cholesterol is reduced to 100mg/day to lower total plasma cholesterol and low-density lipoprotein (LDL) cholesterol, dietary fat should be lowered to 20 percent of the total calories. This has a beneficial effect on all forms of hyperlipidaemia (increased concentration of lipid in the blood). Most of the reduction is in saturated fat content to about five percent of total calories. The polyunsaturated fatty acid content is only increased slightly, to six to eight percent of total calories. Larger amounts of complex carbohydrate mean that the diet is high in fibre. Sugars are reduced to 10 percent of total calories. The protein content of the diet is adequate and vegetable proteins should replace animal proteins. People do not make abrupt dietary changes that can be lasting. As such, the dietary changes should be implemented in phases. In phase I, the foods high in cholesterol and saturated fats need to be reduced. In phase II, the amount of meat consumption is reduced to 6 to 8 ounce/day. In phase III, the cholesterol content of the diet is reduced to 100-mg/ day and the saturated fat is lowered to five to six percent of the total calories.
School of Science and Technology 62

Nutrition and Dietetics
4.4. Exercise A. Short and Broad Questions 1. What are the main objectives of dietary management of patients? 1. Why should sodium intake be restricted in cardiac patients? 2. How could be done for them? 3. What is the role of nurses in this therapy? 4. Discuss how blood cholesterol can be controlled.
Bangladesh Open University 63

Diet and Disease
Lesson 5: Dietary Management of Disease-IV: Diet in Renal Disease
5.1. Learning Objectives
At the end of this lesson you will be able to- ♦ describe the complications of renal dysfunction, ♦ list the reasons for modifying protein, sodium and potassium intake in
renal disease, and ♦ discuss nutrient supplements that are usually required with renal
disorders. 5.2. Diet in Renal Disease One of the important excretory organs of our body is the kidney. Dietetic management aims to minimize protein catabolism, to avoid dehydration and over-hydration, to control electrolyte and fluid loss through vomiting and diarrhoea, to arrest acidosis and to minimize complications. The blood carries the waste materials after catabolism to the kidney where they are filtered and the waste products are excreted in the urine. Normal urine contains about 5 percent solids, consisting of variety of electrolytes, both basic and acid, and the end products of protein metabolism. Among these the largest constituent is urea.
When the kidneys are no longer able
to maintain the normal
composition of the blood by excreting
all of the waste products, the
patient is said to have uraemia
In kidney disease, the filtering mechanism is usually affected. Substances not normally found in the urine, such as albumin, one of the proteins in the blood, may then be present. On the other hand, substances normally cleared from the blood by healthy kidneys may not be fully eliminated. Particularly, urea and potassium are found in increased quantities in the blood. When the kidneys are no longer able to maintain the normal composition of the blood by excreting all of the waste products, the patient is said to have uraemia (retention of urea in the blood) and there is kidney failure. There may be oliguria (diminished secretion of urine) or even anuria (complete suppression of urine). The diet order for a patient with kidney disease is determined by the state of the kidney function. However, the orders for most patients with include modification of fluid and electrolyte intake, water, and sodium and in renal failure, potassium and reduction of protein in the diet. Calorie intake is also important because without adequate calories, stored body proteins are metabolized for energy, thus, increasing the amount of urea to be excreted by the kidney. In diets for patients with kidney stones, calcium intake may be modified.
School of Science and Technology 64

Nutrition and Dietetics
5.3. Principles of Diet Modification i. Fluids and Electrolytes In planning fluid intake, water from oxidation (approximately 300 cc) must be taken into account including sensible and insensible loss equal to 500 cc per day. The basic allowances (daily loss of water) and the planned intake should balance each other. Total fluid intake may be increased or decreased from 2,000 to 2,500 ml formulates based on output. When the filtration ability of the kidneys is reduced, fluid intake is decreased. When the kidneys are unable to concentrate the urine, resulting excessive loss of water from the body, fluid intake should be increased to compensate for this loss. In acute renal failure or in ureamia, the total fluid intake is reduced to as low as 200 ml or equal to urine output.
Based on output, the total fluid intake may be increased or
decreased from 2,000 to 2,500 ml
formulates ii. Sodium Whether the fluid intake is increased or decreased, the sodium intake from food may be decreased. Patients with excessive water loss also lose sodium and other electrolytes required for maintenance of the normal acid-base balance. When there is decreased glomerular filtration rate, the fluid intake is restricted along with some restriction of sodium intake. In acute renal failure, with a very limited glomerular filtration rate, the intake of both sodium and potassium is restricted. These patients clearly do not need sodium supplements and the basic low sodium of 0.5 g/kg/day will provide approximately 20 meq of sodium daily with no salt added to the cooking or at the table. This low sodium intake may be sufficient to control both the oedema and the hypertension. iii. Protein When the kidney function is intact, the protein content of the diet should be 1 g/kg body weight for adults. When albumin is lost in the urine, the dietary protein intake should be increased. Usually the adult allowance is increased to 1.5 g to 2-g/kg body weights. In the conservative management of increasing renal failure, the aim of a low protein diet is to produce a reduction in the level of nitrogenous metabolites (urea) without producing a prolonged negative nitrogen balance. A protein intake of 0.5 g of protein/kg body weight per day or more is required to maintain nitrogen balance. Protein intake of 0.3 g/kg/day will, in most patients, produce a negative nitrogen balance. In uraemic patients, it is best to administer a low protein diet with high biological value. On this regimen, there is no rise in blood urea nitrogen and they achieve nitrogen balance. The initial negative nitrogen balance becomes positive without a rise in blood urea concentration on this diet.
Bangladesh Open University 65

Diet and Disease
iv. Calories All patients with renal disease require an adequate calorie intake. Obese patients with renal disease require moderately calorie-restricted diets. It is important to remember that the necessity of an adequate calorie intake to ensure maximum protein utilization. A calorie intake of 35 to 50 calories/kg/day is recommended and can be provided largely from carbohydrates. In acute renal failure when all protein is excluded form the diet, more calories from carbohydrate and / or fat are required. 5.4. Role of Nurses Careful communication between dietary and nursing services is required to carry out the fluid orders for any patient with renal disease. Other than water, which may or may not be a significant source of sodium and potassium, many fluids offered to hospitalized patients contain significant amounts of sodium and/or potassium. For example, orange juice and tea contain potassium while tomato juice (canned with salt) contains sodium and potassium. If a diet is severely restricted in electrolytes, a 4 to 8 ounce serving of any one of these beverages could contribute to serious error in therapy. Severe fluid restrictions present special problems. The nurse needs to give water with medications and the dietitian needs fluids to enhance the palatability of the diet. These patients are usually nauseated and vomited frequently. Hourly communication between nursing personnel and the dietitian is needed to help these patients.
5.5. Exercise A. Short and Broad Questions 1. What is the aim of dietetic treatment in renal disease? 2. Explain why protein, sodium, potassium and calorie intake is
modified in renal disease.
School of Science and Technology 66

Nutrition and Dietetics
Supplement
How to Prepare Diet Plan
Bangladesh Open University 67

How to Prepare Diet Plan
School of Science and Technology 68

Nutrition and Dietetics
How to Prepare Diet Plan Because calories do count, the first step for preparing a diet plan for a person is to determine the total number of calories he/she burn each day. You do this quite easily by turning to pages 72-83. A glance at these tables shows us that daily caloric output depends five different quantities: sex, age, height, weight, and amount of physical activity. Now, to ascertain daily caloric expenditure, thumb through the table until you locate the table and page that match his/her sex, age, and height. Then on that page run your finger down the left-hand column of figures under Weight until you find the weight, which is listed in pounds, that most nearly corresponds to his/her own. Now on that line move your finger across the page, stopping under the amount of daily physical activity that coincides with his/her, which will be one of four classifications: Light, Average, Moderately Heavy, or Heavy. The number your finger is pointing to is his/her daily caloric expenditure, the figure for which we’re searching. You might have trouble deciding which of the four categories of physical activity applies to him. It depends on how he/she occupy his/her day. If most of time is spent quietly sewing, or reading or watching television-in other words, moving around very little he/she would fall into the Light category. But if his/her daily routine requires a little more effort, and as working in an office, or driving a car, he/she comes under the Average activity column. Examples of people in this category are the average housewife and homemaker, the average businessman, taxi drivers, and most teachers and students. However, if he/she is on the go most of the day, or if he/she participate in some form of recreation almost every night, then his/her activity is covered by the Moderately Heavy category. Door-to-door salesmen, hospital nurses, housewives who keep large houses with out the benefit of modern appliances, and those who play a few sets of ten is every evening after work are in this classification. People who engage in really exhausting physical labor are found in the Heavy physical activity category. Examples include lumber-jacks, coal miners, certain types of farmers, and athletes-such as distance runners-who train long hours each day. But few persons in this class have weight problems. The great amount of physical exercise they perform allows the appestat, the appetite-control mechanism in the brain, to function properly; and, of course, they burn a considerable number of calories. There are two cautions will be considered during determining his/her calorie expenditure: First, the four categories of physical activity are in no
Bangladesh Open University 69

How to Prepare Diet Plan
way related to the emotional or mental difficulty of his/her job; they simply describe the amount of physical effort he/she expends during a day. For instance, the President of the United States, who has one of the most demanding jobs in the world, would fall into the Average or, at best, Moderately Heavy category. So choose accordingly. The second caution is this: Don’t exaggerate to yourself the amount of physical work he/she performs during the day. For the diet plan to operate successfully, you must select his/her correct daily calorie expenditure number. So, is he/she really employ his/her hours watching television, or sewing and reading, pick the Light category. Or if most of his/her time is spent cleaning house, supervising the kids, and going to market, choose the Average category. A point to remember: If he/she contemplating a weight-reduction program, chance are fall into the Light of Average categories, in any case. Let’s run through a quick example of how to use the calorie-expenditure tables. We’ll suppose that she is a housewife, thirty-two years old, 5 feet 4 inches tall, with a weight of 137 pounds. We want to find her caloric output, so we flip through the tables until we come to page 73. This is the table for women between the ages of eighteen and thirty-six who are 5′2′′ to 5′5′′ tall. Now we look down the left-hand column, Weight, till we see the figure 135, which is the number closest to her actual body weight. Next, since she is a housewife using modern appliances, we go across the page on that line to the Average category of physical activity. The figure in the column is 2127, her calorie-expenditure number. This means she burns approximately 2127 calories each day. If she burns 2127 calories a day and eats 2127 calories of food during the same period, maintaining a steady fluid level, her body weight will remain the same. Eat more than 2127 calories and her weight goes up. Eat less, her weight goes down. But how much less should a person eats to lose weight safely? He/she could eat one calorie less each day and lose at the rate of one pound every ten years, which is obviously unsatisfactory because of the time element. Or he/she could fast, ingesting nothing, losing weight at the swiftest possible pace. But he/she would soon develop nutritional deficiencies and the associated diseases; and he/she would weaken him/her-self thus becoming vulnerable to contagious disease and other medical liabilities. So it’s plain that fasting, too, is a poor method of dieting. The ideal calorie difference must lie somewhere between these two extremes. What, then, is the optimum calorie differential? To lose weight safely yet at a reasonable speed he/she should take in about 500 calories less each day than he/she burns. Why 500 calories particularly? An energy intake of about 500 calories less than he/she needs
School of Science and Technology 70

Nutrition and Dietetics
daily will cause he/she to lose about a pound of fat a week. This might seem a slow pace compared to the claims of some of the diet plans foisted on the public; but it’s a pound of fat he/she will discarding, not water; and over a year he/she will shed 52 pounds-52 pounds that will stay off permanently. And he/she will be comfortable. Yes, a greater calorie differential will cause he/she to lose weight faster; but studies have shown that he/she run the risk of ketosis, heart trouble, fatigue, and so forth, with a gap that’s larger than 500 calories. A higher difference also means she/he will develop a feeling of intense hunger. And hunger is a strong inducement to break a diet. So it’s best to keep his/her intake about 500 calories below his/her daily expenditure. Now he/she has his/her calorie-expenditure number and he/she understands about the 500-calorie deficit for sensible weight reduction. The next step in Diet Plan is to select his/her meals from the breakfast, lunch, and dinner menus that follow the calorie-expenditure tables in this supplement. Looking through them, he/she can see that Diet Plan is centered on a nucleus of thirty meals: ten breakfasts, ten lunches, and ten dinners, with the unique feature that any combination of any one breakfast, lunch, and dinner will give him at least the RDA for the essential nutrients. With that in mind, he/she chooses as a single day’s meals from the menus any one breakfast, any one lunch, and any one dinner-as longs as the total number of calories in the three meals is 500 or more calories less than his/her calorie-expenditure number. And generally this gap will be greater than 500 calories. So he/she has a bonus-he/she can eat any foods he/she desires in addition to the meals chosen from the diet plan to bring the difference to about 500 calories. For clarity, let’s return to the example of our housewife, whose calorie-expenditure number is 2127. She may choose for a day’s meals any breakfast to go with any lunch to go with any dinner. Scanning the menus, she decides she will eat Breakfast No. 2 in the morning, Lunch No. 7 at noon, and Dinner No. 4 in the evening. The total number of calories for these three meals is 425+465+410= 1300 calories. This is 827 calories short of her calorie-expenditure number of 2127 (2127-1300=827). Since she has to leave only about a 500-calorie gap, she has 327 calories to play with (827-500=327); so she is free to eat 327 calories’ worth of food beyond the three meals she has chosen from the diet plan. For instance, as an extra to her meals she might want to include three cups of black coffee, each with a teaspoon of sugar. Because coffee alone contains virtually no food energy. The three teaspoons of sugar, however, contain a total of 40 calories which we must tabulate. With her breakfast she might want to add two strips of bacon-90 calories. At dinner she might like a pat of butter on
Bangladesh Open University 71

How to Prepare Diet Plan
her baked potato-35 more calories for the butter. As a late-evening snack she may eat ten potato chips-115 calories. The total number of calories for this extra food is 40+90+35+115=280. This is within the 327-calorie limit with which she had to work. If she doesn’t eat anything more that day, her net calorie deficit will be close to the 500-calorie difference between energy output and input for which we’re shooting, calorie-expenditure number, of course, always being greater than calories consumed-by 500. Note again that our housewife doesn’t have to worry about the nutritional value of the extra food she eats beyond the three-meal core-just the number of calories. The RDA is always met by any combination of breakfast, lunch, and dinner she chooses. She will always get at least 55 mg of protein, 800 mg of calcium, 18 mg of iron, 4000 IU of vitamin A, 1.0 mg of thiamine, 1.5 mg of riboflavin, 13 mg of niacin, and 55 mg of vitamin C. And her consumption of the additional foods will only in-crease them. She would be wise, of course, to avoid sugar altogether and limit foods high in saturated fats. Fat calories should provide no more than 30 percent of daily food energy intake. The eating of favorite supplemental foods is not the only flexible aspect of the diet plan. He/she can have the meals in any order she/he likes: lunch in the morning, a dinner at noon, a breakfast at night. Or he/she can interchange any foods among the three meals chosen. As long as he/she eats all of the food in a breakfast-lunch-dinner combination, his/her nutritional health is assured. Many times he/she can fiddle with the meals themselves, as in the case of our housewife and Lunch No. 7-part of the meal calling for corned beef, lettuce, tomato, and a hamburger roll. She may eat each food separately, or she may make a sandwich of them, perhaps with a little mayonnaise. But she must remember to count the calories of any additions-one teaspoon of mayonnaise equals about 33 calories. This would bring her total calories consumption for that day-including the calories in the sugar in the coffee, the bacon, the pat of butter, and the ten potato chips-to within 14 calories of our 500 calorie off-limits domain, which is all right. Beside being flexible, Diet Plan has great inherent variety. With ten breakfasts, ten lunches, and ten dinners there are 10×10×10, or a thousand, different ways of arranging a day’s meals. He/she could eat a new combination every day for the next two and a half years. This variety and flexibility will help him to remain on he/her diet until she/he reach his/her weight-loss goal.
School of Science and Technology 72

Nutrition and Dietetics Table-1: Daily Caloric Expenditure-Women Age: 18 To 36 Height: 4′ 10′′ To 5′ 1′′ Physical Activity
Weight (LBS.)
Light Average Moderately Heavy
Heavy
90 1415 1576 1732 1887 100 1059 1688 1861 2033 105 1555 1743 1924 2105 110 1600 1797 1987 2177 115 1645 1851 2049 2248 120 1689 1904 2111 2318 125 1733 1956 2172 2388 130 1776 2008 2233 2457 135 1818 2060 2293 2526 140 1861 2111 2353 2595 145 1903 2162 2412 2663 150 1944 2213 2472 2730 160 2026 2312 2589 2865 170 2107 2411 2704 2998 180 2186 2508 2819 3130 190 2264 2604 2932 3260 200 2341 2700 3045 3390 210 2418 2794 3156 3519 220 2493 2887 3267 3647 230 2568 2980 3377 3774 240 2642 3071 3486 3900 250 2715 3162 3594 4025 260 2787 3253 3702 4150
Age: 37 To 56 Height: 4′ 10′′ To 5′ 1′′ Physical Activity
Weight (LBS.)
Light Average Moderately Heavy
Heavy
90 1334 1525 1690 1855 100 1422 1633 1816 2000 105 1464 1686 1879 2071 110 1506 1739 1941 2142 115 1548 1791 2002 2213 120 1589 1842 2063 2283 125 1629 1894 2123 2352 130 1669 1944 2183 2421 135 1709 1994 2242 2490 140 1748 2044 2301 2558 145 1787 2094 2360 2626 150 1826 2143 2418 2693 160 1902 2240 2533 2827 170 1976 2336 2648 2959 180 2050 2431 2761 3091 190 2123 2524 2873 3221 200 2194 2617 2984 3351 210 2265 2709 3094 3480 220 2335 2800 3204 3607 230 2405 2891 3313 3735 240 2473 2981 3421 3861 250 2541 3070 3528 3987 260 2608 3158 3635 4112
Bangladesh Open University 73

How to Prepare Diet Plan
Age: 57 To 76 Height: 4′ 10′′ To 5′ 1′′ Physical Activity
Weight (LBS.)
Light Average Moderately Heavy
Heavy
90 1249 1470 1646 1821 100 1330 1575 1770 1965 105 1369 1627 1831 2036 110 1407 1677 1892 2106 115 1446 1728 1952 2176 120 1483 1778 2012 2245 125 1521 1827 2071 2314 130 1557 1876 2130 2383 135 1594 1925 2188 2451 140 1630 1974 2246 2519 145 1666 2022 2304 2586 150 1701 2069 2361 2654 160 1771 2164 2475 2787 170 1839 2257 2588 2919 180 1907 2349 2700 3050 190 1974 2440 2810 3181 200 2040 2531 2920 3310 210 2105 2620 3029 3438 220 2169 2709 3138 3566 230 2233 2797 3245 3693 240 2296 2885 3352 3820 250 2358 2972 3459 3946 260 2420 3058 3565 4071
Age: 18 To 36 Height: 5′ 2′′ To 5′ 5′′ Physical Activity
Weight (LBS.)
Light Average Moderately Heavy
Heavy
90 1472 1633 1788 1943 100 1568 1747 1920 2092 105 1615 1803 1984 2166 110 1662 1858 2048 2238 115 1707 1913 2112 2310 120 1753 1967 2175 2382 125 1797 2027 2237 2453 130 1842 2074 2299 2523 135 1885 2127 2360 2593 140 1929 2179 2421 2663 145 1972 2231 2481 2732 150 2014 2283 2541 2800 160 2098 2384 2660 2937 170 2180 2485 2778 3072 180 2261 2584 2894 3205 190 2341 2682 3010 3338 200 2420 2778 3124 3469 210 2498 2874 3237 3599 220 2575 2969 3349 3729 230 2651 3063 3460 3857 240 2727 3156 3571 3985 250 2801 3249 3680 4112 260 2875 3341 3790 4238
School of Science and Technology 74

Nutrition and Dietetics
Age: 37 To 56 Height: 5′ 2′′ To 5′ 5′′ Physical Activity
Weight (LBS.)
Light Average Moderately Heavy
Heavy
90 1472 1633 1788 1943 100 1568 1747 1920 2092 105 1615 1803 1984 2166 110 1662 1858 2048 2238 115 1707 1913 2112 2310 120 1753 1967 2175 2382 125 1797 2027 2237 2453 130 1842 2074 2299 2523 135 1885 2127 2360 2593 140 1929 2179 2421 2663 145 1972 2231 2481 2732 150 2014 2283 2541 2800 160 2098 2384 2660 2937 170 2180 2485 2778 3072 180 2261 2584 2894 3205 190 2341 2682 3010 3338 200 2420 2778 3124 3469 210 2498 2874 3237 3599 220 2575 2969 3349 3729 230 2651 3063 3460 3857 240 2727 3156 3571 3985 250 2801 3249 3680 4112 260 2875 3341 3790 4228
Age: 57 To 76 Height: 5′ 2′′ To 5′ 5′′ Physical Activity
Weight (LBS.)
Light Average Moderately Heavy
Heavy
90 1306 1527 1702 1877 100 1389 1634 1829 2024 105 1429 1687 1891 2096 110 1469 1739 1953 2167 115 1508 1791 2015 2239 120 1547 1842 2075 2309 125 1585 1892 2136 2379 130 1623 1942 2196 2449 135 1661 1992 2255 2518 140 1698 2041 2314 2587 145 1734 2090 2373 2655 150 1771 2139 2431 2723 160 1843 2235 2547 2859 170 1913 2331 2662 2993 180 1983 2425 2775 3126 190 2051 2518 2888 3258 200 2119 2610 2999 3389 210 2185 2701 3110 3519 220 2251 2791 3220 3648 230 2316 2881 3329 3777 240 2381 2970 3438 3905 250 2445 3058 3545 4032 260 2508 3146 3653 4159
Bangladesh Open University 75

How to Prepare Diet Plan
Age: 18 To 36 Height: 5′ 6′′ To 5′ 9′′ Physical Activity
Weight (LBS.)
Light Average Moderately Heavy
Heavy
90 1528 1689 1845 2000 100 1627 1806 1979 2151 105 1675 1863 2045 2226 110 1723 1920 2110 2300 115 1770 1976 2174 2373 120 1816 2031 2238 2445 125 1862 2086 2302 2518 130 1907 2140 2365 2589 135 1952 2194 2427 2660 140 1997 2247 2489 2731 145 2040 2300 2550 2801 150 2084 2352 2611 2870 160 2170 2456 2732 3008 170 2254 2558 2852 3145 180 2337 2659 2970 3281 190 2419 2759 3087 3415 200 2499 2857 3202 3548 210 2579 2955 3317 3680 220 2657 3051 3431 3811 230 2735 3147 3544 3941 240 2812 3241 3656 4070 250 2888 3335 3767 4199 260 2963 3429 3877 4326
Age: 37 To 56 Height: 5′ 6′′ To 5′ 9′′ Physical Activity
Weight (LBS.)
Light Average Moderately Heavy
Heavy
90 1447 1638 1803 1968 100 1540 1751 1934 2118 105 1585 1807 1999 3192 110 1629 1862 2063 2265 115 1673 1916 2127 2338 120 1716 1970 2190 2410 125 1759 2023 2252 2482 130 1801 2076 2314 2553 135 1843 2128 2376 2623 140 1884 2180 2437 2694 145 1925 2232 2497 2763 150 1965 2283 2558 2833 160 2045 2384 2677 2971 170 2124 2483 2795 3107 180 2201 2582 2912 3242 190 2277 2679 3027 3376 200 2352 2775 3142 3509 210 2426 2870 3255 3641 220 2499 2965 3368 3772 230 2572 3058 3480 3902 240 2643 3151 3591 4031 250 2714 3243 3701 4160 260 2784 3334 3811 4288
School of Science and Technology 76

Nutrition and Dietetics
Age: 57 To 76 Height: 5′ 6′′ To 5′ 9′′ Physical Activity
Weight (LBS.)
Light Average Moderately Heavy
Heavy
90 1362 1583 1759 1934 100 1448 1693 1888 2083 105 1489 1747 1952 2156 110 1530 1800 2015 229 115 1571 1853 2077 2301 120 1611 1905 2139 2373 125 1650 1957 2200 2444 130 1689 2008 2261 2515 135 1728 2059 2322 2585 140 1766 2109 2382 2655 145 1803 2159 2442 2724 150 1841 2209 2501 2793 160 1914 2307 2619 2931 170 1987 2404 2735 3066 180 2058 2500 2851 3201 190 2128 2595 2965 3335 200 2197 2688 3078 3468 210 2266 2781 3190 3599 220 2333 2873 3302 3730 230 2400 2965 3413 3861 240 2466 3055 3523 3990 250 2531 3145 3632 4119 260 2596 3234 3741 4247
Age: 18 To 36 Height: 5′ 10′′ To 6′ 1′′ Physical Activity
Weight (LBS.)
Light Average Moderately Heavy
Heavy
90 1585 1746 1901 2056 100 1686 1865 2038 2210 105 1736 1924 2105 2286 110 1784 1981 2171 2661 115 1833 2038 2237 2435 120 1880 2095 2302 2509 125 1927 2151 2367 2582 130 1973 2206 2430 2655 135 2019 2261 2494 2727 140 2065 2315 2557 2799 145 2109 2369 2619 2870 150 2154 2422 2681 2940 160 2241 2528 2804 3080 170 2328 2632 2925 3219 180 2412 2735 3045 3356 190 2496 2836 3164 3492 200 2578 2936 3181 2627 210 2659 3035 3398 3760 220 2739 3133 3513 3893 230 2819 3230 3627 4024 240 2897 3327 3741 4155 250 2974 3422 3854 4285 260 3051 3517 3965 4414
Bangladesh Open University 77

How to Prepare Diet Plan
Age: 37 To 56 Height: 5′ 10′′ To 6′ 1′′ Physical Activity
Weight (LBS.)
Light Average Moderately Heavy
Heavy
90 1504 1694 1859 2024 100 1599 1810 1994 2177 105 1645 1867 2060 2252 110 1691 1923 2125 2327 115 1736 1979 2190 2401 120 1780 2034 2254 2474 125 1824 2088 2317 2546 130 1867 2142 2380 2619 135 1910 2195 2443 2690 140 1952 2248 2505 2762 145 1994 2300 2566 2832 150 2035 2353 2628 2903 160 2117 2455 2749 3042 170 2197 2557 2869 3180 180 2276 2657 2987 3317 190 2354 2756 3104 3453 200 2431 2854 3221 3588 210 2507 2951 3336 3721 220 2581 3047 3450 3854 230 2655 3142 3563 3985 240 2728 3236 3676 4116 250 2801 3329 3788 4246 260 2872 3422 3899 4376
Age: 57 To 76 Height: 5′ 10′′ To 6′ 1′′ Physical Activity
Weight (LBS.)
Light Average Moderately Heavy
Heavy
90 1419 1640 1815 1990 100 1507 1752 1947 2142 105 1550 1807 2012 2216 110 1592 1862 2076 2290 115 1633 1916 2140 2364 120 1674 1969 2203 2436 125 1715 2022 2265 2509 130 1755 2074 2327 2581 135 1795 2126 2389 2652 140 1834 2177 2450 2723 145 1872 2228 2511 2793 150 1911 2279 2571 2863 160 1986 2379 2691 3002 170 2060 2478 2809 3140 180 3134 2575 2926 3277 190 2205 2672 3042 3412 200 2276 2767 3157 3546 210 2346 2862 3271 3680 220 2415 2955 3384 3812 230 2483 3048 3496 3944 240 2551 3140 3608 4075 250 2618 3231 3718 4205 260 2684 3322 3829 4335
School of Science and Technology 78
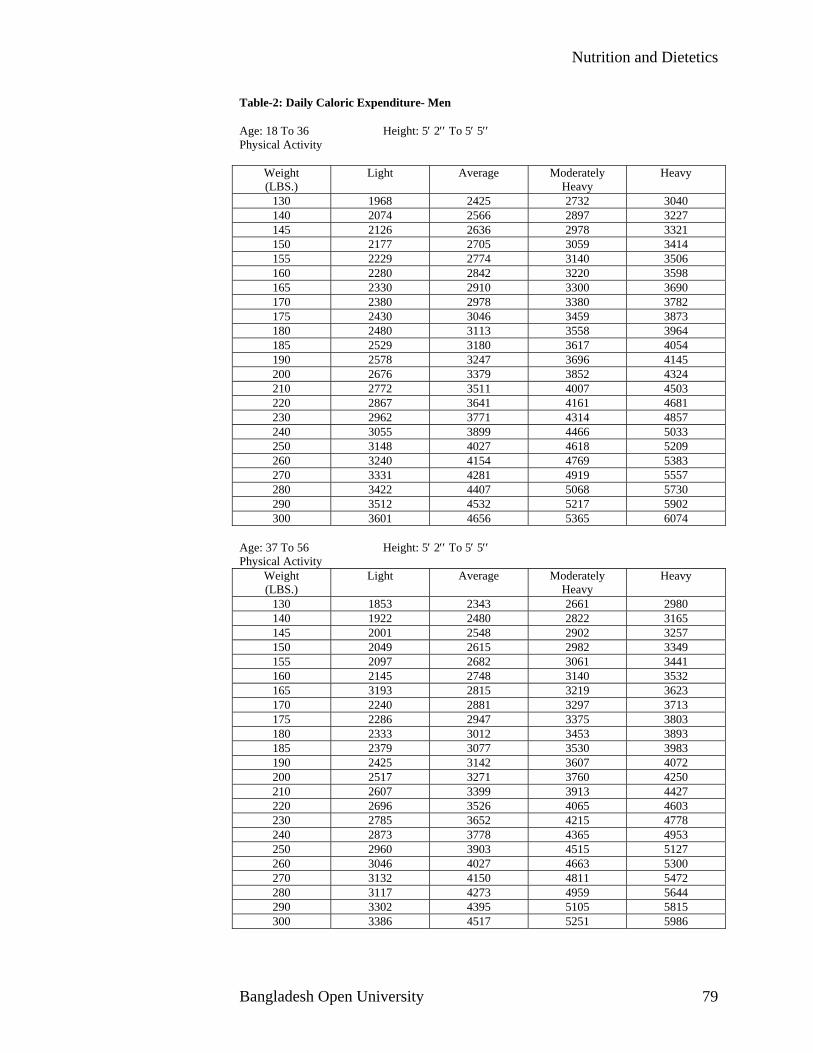
Nutrition and Dietetics Table-2: Daily Caloric Expenditure- Men Age: 18 To 36 Height: 5′ 2′′ To 5′ 5′′ Physical Activity
Weight (LBS.)
Light Average Moderately Heavy
Heavy
130 1968 2425 2732 3040 140 2074 2566 2897 3227 145 2126 2636 2978 3321 150 2177 2705 3059 3414 155 2229 2774 3140 3506 160 2280 2842 3220 3598 165 2330 2910 3300 3690 170 2380 2978 3380 3782 175 2430 3046 3459 3873 180 2480 3113 3558 3964 185 2529 3180 3617 4054 190 2578 3247 3696 4145 200 2676 3379 3852 4324 210 2772 3511 4007 4503 220 2867 3641 4161 4681 230 2962 3771 4314 4857 240 3055 3899 4466 5033 250 3148 4027 4618 5209 260 3240 4154 4769 5383 270 3331 4281 4919 5557 280 3422 4407 5068 5730 290 3512 4532 5217 5902 300 3601 4656 5365 6074
Age: 37 To 56 Height: 5′ 2′′ To 5′ 5′′ Physical Activity
Weight (LBS.)
Light Average Moderately Heavy
Heavy
130 1853 2343 2661 2980 140 1922 2480 2822 3165 145 2001 2548 2902 3257 150 2049 2615 2982 3349 155 2097 2682 3061 3441 160 2145 2748 3140 3532 165 3193 2815 3219 3623 170 2240 2881 3297 3713 175 2286 2947 3375 3803 180 2333 3012 3453 3893 185 2379 3077 3530 3983 190 2425 3142 3607 4072 200 2517 3271 3760 4250 210 2607 3399 3913 4427 220 2696 3526 4065 4603 230 2785 3652 4215 4778 240 2873 3778 4365 4953 250 2960 3903 4515 5127 260 3046 4027 4663 5300 270 3132 4150 4811 5472 280 3117 4273 4959 5644 290 3302 4395 5105 5815 300 3386 4517 5251 5986
Bangladesh Open University 79

How to Prepare Diet Plan
Age: 57 To 76 Height: 5′ 2′′ To 5′ 5′′ Physical Activity
Weight (LBS.)
Light Average Moderately Heavy
Heavy
130 1732 2257 2587 2916 140 1824 2389 2744 3100 145 1869 2455 2823 3191 150 1914 2520 2901 3281 155 1959 2585 2978 3372 160 2003 2650 3056 3462 165 2048 2714 3133 3551 170 2091 2778 3209 3641 175 2133 2842 3286 3730 180 2178 2905 3362 3819 185 2221 2969 3438 3907 190 2264 3032 3514 3996 200 2349 3157 3664 4172 210 2433 3282 3814 4347 220 2517 3405 3963 4522 230 2599 3528 4112 4695 240 2681 3650 4259 4868 250 2762 3772 4406 5040 260 2843 3893 4552 5212 270 2922 4013 4698 5383 280 3002 4133 4843 5553 290 3081 4252 4988 5723 300 3159 4371 5132 5893
Age: 18 To 36 Height: 5′ 6′′ To 5′ 9′′ Physical Activity
Weight (LBS.)
Light Average Moderately Heavy
Heavy
130 2008 2465 2772 3079 140 2114 2607 2938 3268 145 2167 2677 3020 3362 150 2219 2747 3101 3456 155 2271 2816 3183 3549 160 2323 2885 3264 3642 165 2374 2954 3344 3734 170 2425 3023 3424 3826 175 2475 3091 3504 3918 180 2525 3158 3584 4009 185 2575 3226 3663 4100 190 2625 3293 3742 4191 200 2723 3426 3899 4372 210 2820 3559 4055 4551 220 2917 3690 4210 7430 230 3012 3821 4364 4908 240 3106 3950 4518 5085 250 3200 4079 4670 5261 260 3293 4207 4822 5436 270 3385 4335 4973 5611 280 3476 4461 5123 5784 290 3567 4587 5272 5958 300 3657 4713 5721 6130
School of Science and Technology 80

Nutrition and Dietetics
Age: 37 To 56 Height: 5′ 6′′ To 5′ 9′′ Physical Activity
Weight (LBS.)
Light Average Moderately Heavy
Heavy
130 1892 2383 2701 3019 140 1993 2521 2863 3206 145 2042 2589 2944 3299 150 2091 2657 3024 3391 155 2140 2724 3104 3483 160 2188 2792 3183 3575 165 2236 2859 3262 3666 170 2284 2925 3341 3757 175 2331 2991 3420 3848 180 2378 2057 3498 3938 185 2425 3123 3576 4029 190 2472 3188 3653 4118 200 2564 3318 3808 4297 210 2655 3447 3961 4475 220 2746 3575 4114 4652 230 2835 3703 4266 4829 240 2924 3829 4417 5004 250 3012 3955 4567 5179 260 3099 4080 4716 5353 270 3186 4204 4865 5528 280 3272 4328 5013 5698 290 3357 4451 5161 5870 300 3442 4573 5308 6042
Age: 57 To 76 Height: 5′ 6′′ To 5′ 9′′ Physical Activity
Weight (LBS.)
Light Average Moderately Heavy
Heavy
130 1771 2296 2626 2956 140 1865 2430 2785 3140 145 1911 2496 2864 3232 150 1956 2562 2943 3323 155 2002 2328 3021 3414 160 2047 2693 3099 3505 165 2091 2758 3176 3595 170 2136 2822 3254 3685 175 2180 2887 3331 3775 180 2224 2951 3407 3864 185 2267 3015 3484 3953 190 2311 3078 3560 4042 200 2397 3204 3712 4219 210 2482 3330 3863 4395 220 2566 3455 4013 4571 230 2649 3578 4162 4745 240 2732 3701 4310 4919 250 2814 3824 4458 5092 260 2895 3946 4605 5265 270 2976 4067 4752 5437 280 3056 4187 4898 5608 290 3136 4307 5043 5779 300 3215 4427 5188 5949
Bangladesh Open University 81

How to Prepare Diet Plan
Age: 18 To 36 Height: 5′ 10′′ To 6′ 1′′ Physical Activity
Weight (LBS.)
Light Average Moderately Heavy
Heavy
130 2047 2504 2812 3119 140 2155 2648 2978 3309 145 2209 2718 3061 3404 150 2261 2789 3143 3498 155 2314 2859 3225 3591 160 2366 2929 3307 3685 165 2418 2998 3388 3778 170 2469 3067 3469 3870 175 2520 3136 3549 3963 180 2571 3204 3629 4054 185 2621 3272 3709 4146 190 2671 3339 3788 4237 200 2770 3474 3946 4419 210 2869 3607 4103 4600 220 2966 3740 4259 4779 230 6032 3871 4414 4958 240 3157 4002 4569 5136 250 3252 4131 7422 5313 260 3346 4260 4874 5489 270 3439 4388 5026 5664 280 3531 4516 5177 5839 290 3623 4643 5328 6013 300 3714 4769 5477 6186
Age: 37 To 56 Height: 5′ 10′′ To 6′ 1′′ Physical Activity
Weight (LBS.)
Light Average Moderately Heavy
Heavy
130 1932 2422 2741 3059 140 2033 2562 2904 3247 145 2048 2630 2985 3340 150 2133 2699 3066 3433 155 2182 2767 3146 3526 160 2231 2835 3226 3618 165 2280 2902 3306 3710 170 2328 2969 3385 3802 175 2376 3036 3464 3893 180 2424 3103 3543 3984 185 2471 3169 3622 4074 190 2518 3235 3700 4165 200 2611 3366 3855 4345 210 2704 3496 4010 4524 220 2795 3625 4163 4702 230 2885 3753 4316 4878 240 2975 3880 4468 5055 250 3064 4007 4619 5231 260 3152 4133 4769 5405 270 3240 4258 4919 5580 280 3326 4382 5068 5753 290 3412 4506 5216 5926 300 3498 4629 5364 6098
School of Science and Technology 82

Nutrition and Dietetics
Age: 57 To 76 Height: 5′ 10′′ To 6′ 1′′ Physical Activity
Weight (LBS.)
Light Average Moderately Heavy
Heavy
130 1811 2336 2666 2996 140 1905 2471 2826 3181 145 1952 2538 2906 3273 150 1998 2604 2985 3365 155 2044 2670 3064 3457 160 2090 2736 3142 3548 165 2135 2802 3220 3639 170 2180 2867 3298 3729 175 2225 2932 3376 3820 180 2269 2996 3453 3909 185 2313 3060 3530 3999 190 2357 3125 3607 4089 200 2444 3252 3759 4267 210 2530 3378 3911 4444 220 2615 3504 4062 4620 230 2700 3629 4212 4796 240 2783 3753 4361 4970 250 2866 3876 4510 5144 260 2948 3999 4658 5318 270 3030 4120 4805 5490 280 3111 4242 4952 5663 290 3191 4363 5098 5834 300 3271 4483 5244 6005
Age: 18 To 36 Height: 6′ 2′′ To 6′ 5′′ Physical Activity
Weight (LBS.)
Light Average Moderately Heavy
Heavy
130 2087 2544 2451 3158 140 2196 2688 3019 3350 145 2250 2760 3103 3445 150 2303 2831 3185 3540 155 2356 2902 3268 3634 160 2409 2972 3350 3728 165 2461 3042 3432 3821 170 2513 3111 3513 3915 175 2565 3180 3594 4007 180 2616 3249 3674 4100 185 2667 3318 3755 4192 190 2718 3386 3835 4284 200 2818 3521 3994 4466 210 2917 3656 4152 4648 220 3015 3789 4309 4829 230 3112 3921 4465 5008 240 3209 4053 4620 5187 250 3304 4183 4774 5365 260 3399 4313 4927 5542 270 3492 4442 5080 5718 280 3586 4570 5232 5893 290 3678 4698 5383 6068 300 3770 4825 5534 6242
Bangladesh Open University 83

How to Prepare Diet Plan
Age: 37 To 56 Height: 6′ 2′′ To 6′ 5′′ Physical Activity
Weight (LBS.)
Light Average Moderately Heavy
Heavy
130 1972 2462 2780 3098 140 2074 2602 2945 3288 145 2125 2672 3027 3382 150 2175 2741 3108 3475 155 2225 2810 3189 3568 160 2275 2878 3270 3661 165 2324 2949 3350 3754 170 2373 3014 3430 3846 175 2421 3081 3509 3938 180 2469 3148 3589 4029 185 2517 3215 3668 4120 190 2565 3281 3746 4211 200 2659 3413 3903 4392 210 2752 3544 4058 4572 220 2844 3674 4213 4751 230 2936 3803 4366 4929 240 3026 3931 4519 5106 250 3116 4059 4671 5283 260 3205 4186 4822 5458 270 3293 4312 4972 5633 280 3381 4437 5122 5808 290 3468 4561 5271 5981 300 3554 4686 5420 6154
Age: 57 To 76 Height: 6′ 2′′ To 6′ 5′′ Physical Activity
Weight (LBS.)
Light Average Moderately Heavy
Heavy
130 1851 2376 2705 3035 140 1946 2512 2867 3222 145 1993 2579 2947 3315 150 2040 2646 3027 3407 155 2087 2713 3106 3499 160 2133 2779 3185 3591 165 2179 2845 3264 3682 170 2224 2911 3342 3774 175 2270 2976 3420 3864 180 2314 3042 3498 3955 185 2359 3106 3576 4045 190 2403 3171 3653 4135 200 2491 3299 3807 4314 210 2578 3427 3959 4492 220 2665 3553 4111 4669 230 2750 3679 4262 4846 240 2834 3804 4413 5021 250 2918 3928 4562 5196 260 3001 4051 4711 5371 270 3084 4174 4859 5544 280 3165 4296 5007 5717 290 3247 4418 5154 5889 300 3327 4539 5300 6060
School of Science and Technology 84
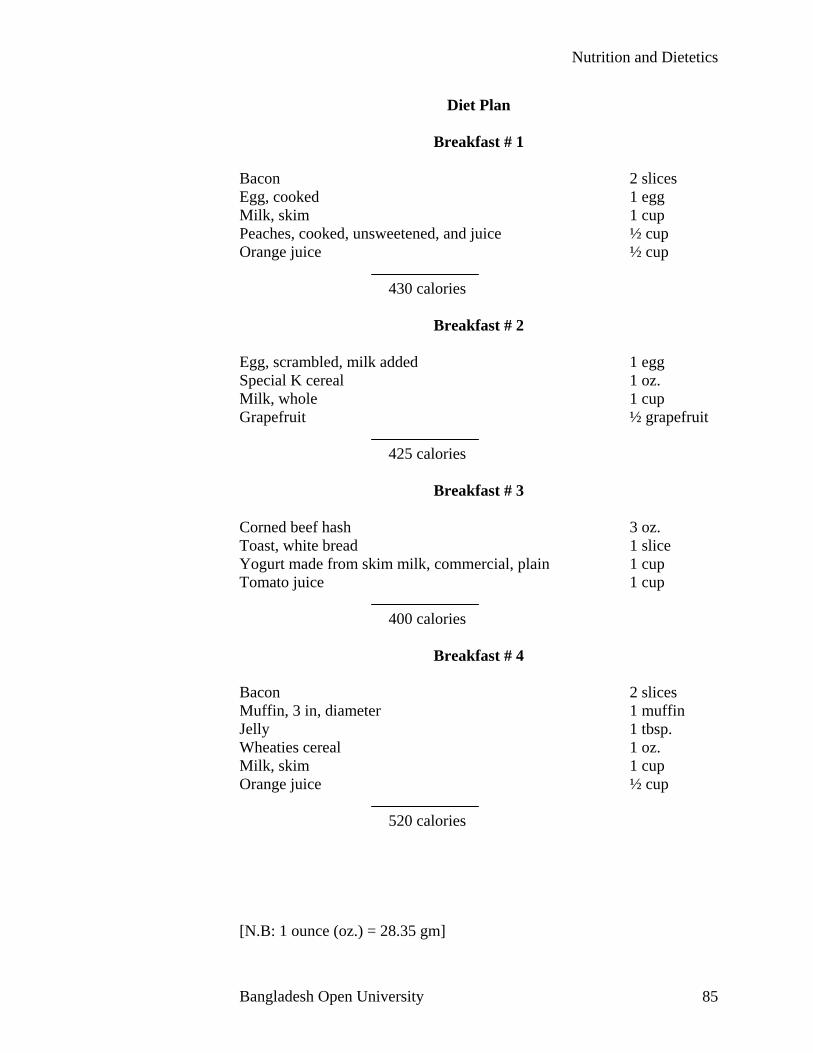
Nutrition and Dietetics
Diet Plan
Breakfast # 1
Bacon 2 slices Egg, cooked 1 egg Milk, skim 1 cup Peaches, cooked, unsweetened, and juice ½ cup Orange juice ½ cup
430 calories
Breakfast # 2
Egg, scrambled, milk added 1 egg Special K cereal 1 oz. Milk, whole 1 cup Grapefruit ½ grapefruit
425 calories
Breakfast # 3
Corned beef hash 3 oz. Toast, white bread 1 slice Yogurt made from skim milk, commercial, plain 1 cup Tomato juice 1 cup
400 calories
Breakfast # 4
Bacon 2 slices Muffin, 3 in, diameter 1 muffin Jelly 1 tbsp. Wheaties cereal 1 oz. Milk, skim 1 cup Orange juice ½ cup
520 calories [N.B: 1 ounce (oz.) = 28.35 gm]
Bangladesh Open University 85

How to Prepare Diet Plan
Breakfast # 5
Chipped beef 2 oz. Egg, cooked 1 egg Milk, skim 1 cup Cantaloupe ½ melon
345 calories
Breakfast # 6
Bacon 2 slices Toast, white bread 1 slice Margarine 1 pat Cheerios cereal 1 oz. Milk, whole 1 cup Orange juice 1 cup
590 calories
Breakfast # 7
Pork links 2 links Toast, whole wheat 1 slice Apricots, cooked ½ cup Milk, skim 1 cup Tangerine 1 tangerine
440 calories
Breakfast # 8
Pork links 2 links Yogurt made from skim milk, commercial, plain 1 cup Maypo 30-Second Oatmeal 1 oz. Apple 1 apple
430 calories
Breakfast # 9
Chipped beef 2 oz. Toast, whole wheat 1 slice Yogurt made from skim milk, commercial, plan 1 cup Orange juice ½ cup
365 calories
School of Science and Technology 86

Nutrition and Dietetics
Breakfast # 10
Pancake, 4 in. diameter 1 cake Syrup 1 tbsp. Post Raisin Bran cereal 1 oz. Milk, whole 1 cup Grapefruit ½ grapefruit
425 calories
Lunch # 1
Chicken, canned 3 oz. Asparagus, canned 1 cup Cheese 1 oz. Orange 1 orange
380 calories
Lunch # 2
Tuna 3 oz. Cheese 1 oz. Bread, white 1 slice Lettuce 4 leaves Tomato juice 1 cup
415 calories
Lunch # 3
Hamburger, lean 3 oz. Hamburger roll 1 roll Cheese 1 oz. Lettuce 2 leave Tomato ¼ tomato Pickle, dill 1 pickle Orange 1 orange
505 calories
Bangladesh Open University 87

How to Prepare Diet Plan
Lunch # 4
Stew, beef and vegetable 2 cup Milk, skim 1 cup Grapfruit ½ grapefruit
555 calories
Lunch # 5
Hamburger, lean 3 oz. Pickle, dill 1 pickle Milk, skim 1 cup Watermelon 1 wedge Carrot ½ carrot
410 calories
Lunch # 6
Salami 1 oz. Bread, white 2 slices Cheese 1 oz. Lettuce 2 leaves Pickle, dill 1 pickle Tomato juice 1 cup
450 calories
Lunch # 7
Corned beef 3 oz. Hamburger roll 1 roll Lettuce 2 leaves Tomato ¼ tomato Milk, skim 1 cup Plum 2 plums
465 calories
School of Science and Technology 88

Nutrition and Dietetics
Lunch # 8
Shrimp, canned 3 oz. Bread, white 2 slices Yogurt made from skim milk, commercial, plan 1 cup Tomato juice 1 cup
420 calories
Lunch # 9
Chipped beef 3 oz. Bread, whole wheat 1 slice Lettuce 2 leaves Milk, skim 1 cup Strawberries 1 cup
393 calories
Lunch # 10
Clams, canned 3 oz. French fries 10pieces Bread, whole wheat 1 slice Milk, skim 1 cup Strawberries 1 cup Carrot ½ carrot
390 calories
Dinner # 1
Chicken, flesh, light meat 3 oz. Potato, mashed, milk added 1 cup Spinach, cooked ½ cup Sauerkraut, canned 1 cup Lettuce 2 leaves Tomato juice 1 cup
360 calories
Bangladesh Open University 89

How to Prepare Diet Plan
Dinner # 2
Pork chop, lean meat only 1.7 oz. Yellow beans, canned 1 cup Cheese ½ cup Bread, whole wheat 2 slices Strawberries 1 cup Carrot 1 carrot
430 calories
Dinner # 3
Veal cutlet 3 oz. Potato, boiled 2 potatoes Dandelion greens 1 cup Peach 1 peach
490 calories
Dinner # 4
Steak, lean, broiled 2.4 oz. Potato, baked 1 potato Spinach, cooked 1 cup Milk, skim 1 cup Cantaloupe ½ melon
410 calories
Dinner # 5
Chipped beef 3 oz. Peas, cooked ½ cup Lettuce 2 leaves Carrot ½ carrot Milk, skim 1 cup Strawberries 1 cup
396 calories
School of Science and Technology 90

Nutrition and Dietetics
Dinner # 6
Ham, cured, roasted 3 oz. Asparagus, canned 1 cup Cheese 1 oz. Peaches, cooked ½ cup
515 calories
Dinner # 7
Hamburger, lean 3 oz. Potato, mashed, milk added 1 cup Spinach, cooked 1 cup Orange 1 cup
415 calories
Dinner # 8
Shrimp, canned 3 oz. Squash, summer ¾ cup Asparagus, canned ¾ cup Bread, whole wheat 2 slices Lettuce 3 leaves Peaches, sliced 1 cup
367 calories
Dinner # 9
Liver, beef, fried 2 oz. Potato, baked 1 potato Brussels Sprouts 1 cup Cheese 1 oz. Orange 1 orange
445 calories
Dinner # 10
Oysters, raw 1 cup Broccoli 1 cup Bread, white 1 slice
270 calories
Bangladesh Open University 91

Table
Table-3 Recommended Daily Dietary Allowances
Weight (kg) Height Energy Protein Vitamin
A
Ascor- bic
Acid
Nia- cin
Ribo- flavin
Thia- min
Cal- cium Iron
Age
(years) (kg) (Ibs) (cm) (in) kcal (g) (IU) (mg) (mg) (mg) (mg) (grams) (mg)
0.0-0.5 6 14 60 24 kg×117 kg×2.2 1,400 35 5 0.4 0.3 360 10Infants 0.5-0.5 9 20 71 28 kg×108 kg×2.0 2,000 35 8 0.6 0.5 540 15
1-3 13 28 86 34 1,300 23 2,000 40 9 0.8 0.7 800 154-6 20 44 110 44 1,800 30 2,500 40 12 1.1 0.9 800 10
Children
7-10 30 66 135 54 2,400 36 3,300 40 16 1.2 1.2 800 1011-14 44 97 158 63 2,800 44 5,000 45 18 1.5 1.4 1,200 1815-18 61 134 172 69 3,000 54 5,000 45 20 1.8 1.5 1,200 1819-22 67 147 172 69 3,000 54 5,000 45 20 1.8 1.5 800 1023-50 70 154 172 69 2,700 56 5,000 45 18 1.6 1.4 800 10
Males
51+ 70 154 172 69 2,400 56 5,000 45 16 1.5 1.2 800 1011-14 44 97 155 62 2,400 44 4,000 45 16 1.3 1.2 1,200 1815-18 54 119 162 65 2,100 48 4,000 45 14 1.4 1.1 1,200 1819-22 58 128 162 65 2,100 46 4,000 45 16 1.4 1.2 800 1823-50 58 128 162 65 2,000 46 4,000 45 13 1.2 1.0 800 18
Females
51+ 58 128 162 65 1,800 46 4,000 45 12 1.1 1.0 800 10Pregnant +300 +30 5,000 60 +2 +0.3 +0.3 1,200 18+Lactating +500 +20 6,000 80 +4 +0.5 +0.3 1,200 18 Special diet plan in disease conditions:
Table 4: Food table 1 for diabetic person
Food items
Weight gm.
Energy Kcal.
Protein gm.
Fat gm.
CHO gm.
Calcium mg.
Iron mg.
Carotene µg.
Fibre gm.
Vit. B1
mg. Vit. B2
mg. Vit. C mg.
Folic acid µg.
(Morning) Ruti Two Piece 60 139.20 4.80 0.60 28.20 19.80 4.80 12.00 0.60 0.18 0.12 0.00 14.40Egg 29 45.24 5.10 2.70 0.15 1.60 0.44 218.08 0.00 0.02 0.04 0.00 22.97Vegetable: Group A (Raw) 50 21.00 1.00 0.50 3.50 46.50 2.50 2078.50 1.00 0.00 0.00 19.50 7.50Fruit: Group A 30 29.10 0.33 0.09 6.75 8.19 0.54 27.42 0.45 0.06 0.03 26.67 0.00Morning 11 A.M Muri/Biscuit 15 53.10 1.13 0.02 12.09 3.45 0.99 0.00 0.05 0.03 0.02 0.00 0.00Fruit: Group B (Any One) 30 29.10 0.33 0.09 6.75 8.19 0.54 27.42 0.45 0.06 0.03 26.67 0.00Noon Bhat 1.5 Cup 180 219.60 3.78 0.18 47.34 5.40 2.34 0.00 0.18 0.18 0.00 0.00 0.00Fish/Meat I Piece (Small) 25 35.25 8.43 1.00 0.41 76.44 1.08 23.25 0.00 0.01 0.03 0.88 4.05Dhal (1 Cup Medium Ghono) 15 51.60 3.53 0.27 8.76 12.69 1.05 14.16 0.26 0.07 0.05 0.02 14.91Vegetable:Group A As Wish 50 21.00 1.00 0.50 3.50 46.50 2.50 2078.50 1.00 0.00 0.00 19.50 7.50Vegetable: Group B (Any One) 40 25.20 0.80 0.40 4.80 22.00 0.40 444.80 0.80 0.00 0.00 2.80 10.80Afternoon Milk 1 Cup 120 80.40 3.84 4.92 5.28 156.00 0.24 20.40 0.00 0.06 0.23 2.40 10.20Night Atar Ruti 1 Piece 30 69.60 2.40 0.30 14.10 9.90 2.40 6.00 0.30 0.09 0.06 0.00 7.20Dhal (1 Cup Medium Ghono) 15 51.60 3.53 0.27 8.76 12.69 1.05 14.16 0.26 0.07 0.05 0.02 14.91Vegetable: Group A (Raw) 50 21.00 1.00 0.50 3.50 46.50 2.50 2078.50 1.00 0.00 0.00 19.50 7.50Oil 12 108.00 0.00 12.00 0.00 0.00 0.00 0.00 0.00 0.00 0.00 0.00 0.00Total 751 999.99 40.98 24.33 153.89 475.84 23.36 7043.19 6.34 0.83 0.65 117.95 121.94
School of Science and Technology 92

Nutrition and Dietetics
Table 5: Food table 2 for diabetic person
Food items
Weight gm.
Energy Kcal.
Protein gm.
Fat gm.
CHO gm.
Calcium mg.
Iron mg.
Carotene µg.
Fibre gm.
Vit. B1 mg.
Vit. B2 mg.
Vit. C mg.
Folic acid µg.
(Morning) Ruti Two Piece 60 139.20 4.80 0.60 28.20 19.80 4.80 12.00 0.60 0.18 0.12 0.00 14.40Egg 30 46.80 5.28 2.79 0.15 1.65 0.45 225.60 0.00 0.02 0.04 0.00 23.76Vegetable: Group A (Raw) 50 21.00 1.00 0.50 3.50 46.50 2.50 2078.50 1.00 0.00 0.00 19.50 7.50Fruit: Group A 45 43.65 0.50 0.14 10.13 12.29 0.81 41.13 0.68 0.09 0.05 40.01 0.0011 Am Muri/Biscuit 25 88.50 1.88 0.03 20.15 5.75 1.65 0.00 0.08 0.05 0.03 0.00 0.00Fruit: Group B (Any One) 30 29.10 0.33 0.09 6.75 8.19 0.54 27.42 0.45 0.06 0.03 26.67 0.00Noon Bhat 2 Cup 180 219.60 3.78 0.18 47.34 5.40 2.34 0.00 0.18 0.18 0.00 0.00 0.00Fish/Meat I Piece (Small) 30 42.30 10.11 1.20 0.50 91.73 1.29 27.90 0.00 0.01 0.03 1.05 4.86Dhal (1 Cup Medium Ghono) 15 51.60 3.53 0.27 8.76 12.69 1.05 14.16 0.26 0.07 0.05 0.02 14.91Vegetable: Group A (Raw) As Wish 50 21.00 1.00 0.50 3.50 46.50 2.50 2078.50 1.00 0.00 0.00 19.50 7.50Vegetable:Group B (Any One) 40 25.20 0.80 0.40 4.80 22.00 0.40 444.80 0.80 0.00 0.00 2.80 10.80Afternoon Milk 1 Cup 120 80.40 3.84 4.92 5.28 156.00 0.24 20.40 0.00 0.06 0.23 2.40 10.20Night Atar Ruti 2 Piece 60 139.20 4.80 0.60 28.20 19.80 4.80 12.00 0.60 0.18 0.12 0.00 14.40Dhal (1 Cup Medium Ghono) 15 51.60 3.53 0.27 8.76 12.69 1.05 14.16 0.26 0.07 0.05 0.02 14.91Vegetable: Group A (Raw) As Wish 50 21.00 1.00 0.50 3.50 46.50 2.50 2078.50 1.00 0.00 0.00 19.50 7.50Oil 20 180.00 0.00 20.00 0.00 0.00 0.00 0.00 0.00 0.00 0.00 0.00 0.00Total 820 1200.15 46.16 32.98 179.51 507.48 26.92 7075.07 6.89 0.98 0.74 131.46 130.74
Table 6: Food table for heart disease
Food Items
Weight gm.
Energy Kcal.
Protein gm.
Fat gm.
CHO gm.
Calcium mg.
Iron mg.
Carotene µg.
Fibre gm.
Vit. B1 mg.
Vit. B2 mg.
Vit. C mg.
Folic acid µg.
Ruti/Bread 60 139.20 4.80 0.60 28.20 19.80 4.80 12.00 0.60 0.18 0.12 0.00 14.40Vegetable (Cooked) 120 76.80 3.48 0.84 12.60 273.24 5.16 3500.40 1.92 1.68 0.13 33.60 13.56Oil 5 45.00 0.00 5.00 0.00 0.00 0.00 0.00 0.00 0.00 0.00 0.00 0.00Dhal/White Part Of Egg 60 69.00 4.98 0.18 11.88 14.40 1.32 31.92 0.18 0.12 0.06 0.00 17.58Tea (Sugar,Milk) 10 44.70 1.29 1.34 6.87 3.10 0.03 0.00 0.00 0.02 0.07 0.20 0.00Fruit (Orange/Guava/Apple 50 25.00 1.00 0.00 5.50 11.50 1.50 783.50 0.50 0.00 0.00 5.00 0.00Before Noon (Biscuit) 10 28.90 0.47 1.66 3.04 11.50 0.35 288.00 1.15 0.00 0.00 0.25 0.00Noon (Bhat) 225 274.50 4.73 0.23 59.18 6.75 2.93 0.00 0.23 0.23 0.00 0.00 0.00Leafy Veg (Cooked) 60 28.20 1.80 0.00 4.80 16.20 0.60 390.00 0.00 0.00 0.00 3.00 9.00Salad 60 13.20 0.96 0.06 2.10 8.40 0.90 0.00 0.24 0.10 0.01 3.00 8.82Fish/Chicken 40 56.40 13.48 1.60 0.66 122.30 1.72 37.20 0.00 0.02 0.04 1.40 6.48Mug Dhal 60 69.00 4.98 0.18 11.88 14.40 1.32 31.92 0.18 0.12 0.06 0.00 17.58Oil 10 90.00 0.00 10.00 0.00 0.00 0.00 0.00 0.00 0.00 0.00 0.00 0.00Night (Bread/Ruti) 60 139.20 4.80 0.60 28.20 19.80 4.80 12.00 0.60 0.18 0.12 0.00 14.40Vegetable 60 38.40 1.74 0.42 6.30 136.62 2.58 1750.20 0.96 0.84 0.07 16.80 6.78Salad 60 13.20 0.96 0.06 2.10 8.40 0.90 0.00 0.24 0.10 0.01 3.00 8.82Fish/Chicken 40 56.40 13.48 1.60 0.66 122.30 1.72 37.20 0.00 0.02 0.04 1.40 6.48Oil 7 63.00 0.00 7.00 0.00 0.00 0.00 0.00 0.00 0.00 0.00 0.00 0.00Before Bed (Milk) 120 80.40 3.84 4.92 5.28 156.00 0.24 20.40 0.00 0.06 0.23 2.40 10.20Sugar With Milk 12 47.76 0.00 0.00 11.93 1.44 0.00 0.00 0.00 0.00 0.00 0.00 0.00Total 1129 1398.26 66.79 36.29 201.17 946.15 30.87 6894.74 6.80 3.65 0.96 70.05 134.10
Bangladesh Open University 93

Table Table-7: Values of common Bangladeshi food items (all values per 100 gms. of edible portion)
Name of foodstuff Protein Fat Minerals Carbohydrate Energy (gm) (gm) (gm) (gm) (Kcal) Cereal Grains and Products Rice, parboiled milled 6.4 0.4 0.7 79.0 346 Wheat flour (whole) 12.1 1.7 2.7 69.4 341 Pulses and Legumes Bengal gram (whole) 17.1 5.3 3.0 60.9 360 Lentil 25.1 0.7 2.1 56.0 343 Groundnut 25.3 40.1 2.4 26.1 567 Roots and Tubers Carrot 0.9 0.2 1.1 10.6 48 Potato 1.6 0.1 0.6 22.6 97 Sweet potato 1.2 0.3 1.0 28.2 120 Vegetables Impomoea leaves (Kalmi sak)
2.9 0.4 2.1 3.1 28
Spinach (Pui Sak) 2.0 0.7 1.7 2.9 26 Bitter gourd. small 2.1 1.0 1.4 10.6 60 Brinjal (Eggplant) 1.4 0.3 0.3 4.0 24 Cauliflower 2.6 0.4 1.0 4.0 30 Cabbage 1.8 0.1 0.6 4.6 27 Drumstick 2.5 0.1 2.0 3.7 26 Peas 7.2 0.1 0.8 15.9 93 Fruits Guava 0.9 0.3 0.7 11.2 51 Lichi 1.1 0.2 0.5 13.6 61 Mango. ripe 0.6 0.4 0.4 16.9 74 Papaya. ripe 0.6 0.1 0.5 7.2 32 Pineapple 0.4 0.1 0.4 10.8 46 Fish and Other Animal Food Boal 15.4 2.7 1.3 7.6 116 Hilsa 21.8 19.4 2.2 2.9 273 Kalabaus 14.7 1.0 1.3 2.0 76 Katla 19.5 2.4 1.5 2.9 111 Koi 14.8 8.8 2.0 4.4 156 Magur 15.0 1.0 1.3 4.2 86 Pangas 14.2 10.8 1.0 1.7 161 Prawn 19.1 1.0 1.7 0.8 89 Singhi 22.8 0.6 1.7 6.9 124 Tengra 19.2 6.4 2.1 2.3 144 Beef 22.6 2.6 1.0 - - 114 Egg (hen) 13.3 13.3 1.0 - - 173 Fowl 25.9 0.6 1.3 - - 109 Mutton 18.5 13.3 1.3 - - 194 Milk (cow) 3.2 4.1 0.8 4.4 67 Milk (human) 1.1 3.4 0.1 7,4 65 Fats and Edible Oils Butter - - 81.0 2.5 - - 729 Ghee (cow) - - 100.0 - - - - 900 Cooking oil - - 100.0 - - - - 900
School of Science and Technology 94
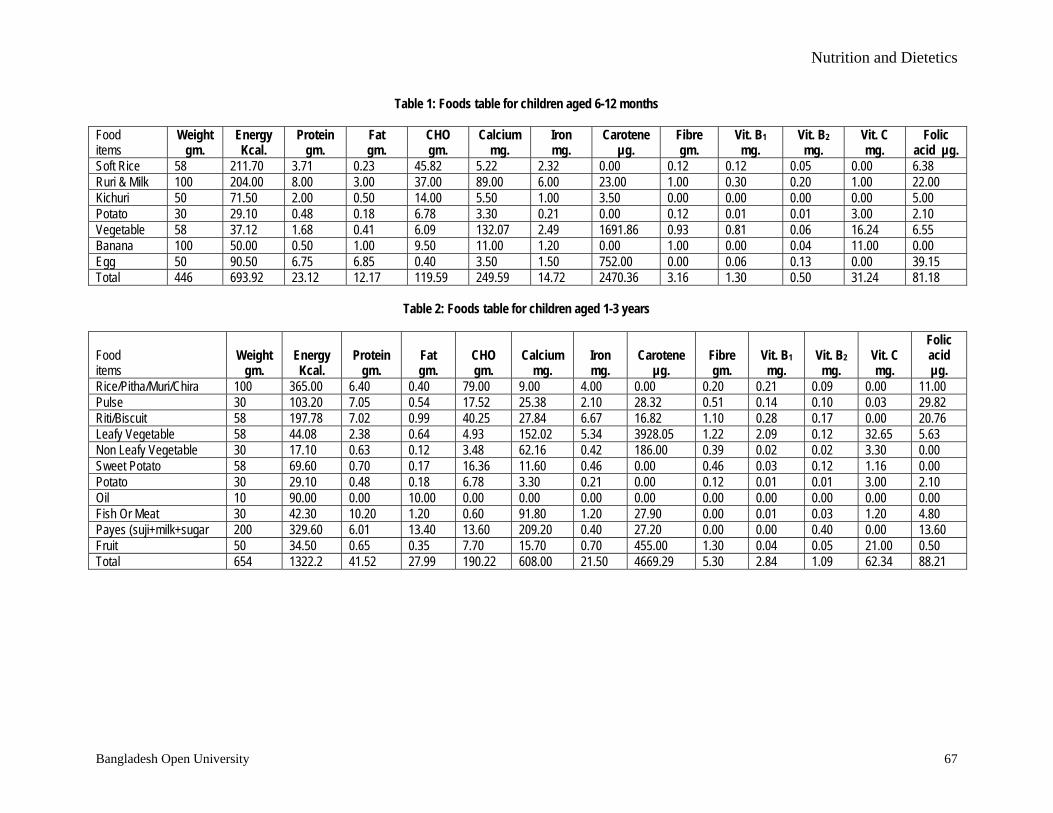
Nutrition and Dietetics
Table 1: Foods table for children aged 6-12 months Food items
Weight gm.
Energy Kcal.
Protein gm.
Fat gm.
CHO gm.
Calcium mg.
Iron mg.
Carotene µg.
Fibre gm.
Vit. B1 mg.
Vit. B2 mg.
Vit. C mg.
Folic acid µg.
Soft Rice 58 211.70 3.71 0.23 45.82 5.22 2.32 0.00 0.12 0.12 0.05 0.00 6.38 Ruri & Milk 100 204.00 8.00 3.00 37.00 89.00 6.00 23.00 1.00 0.30 0.20 1.00 22.00 Kichuri 50 71.50 2.00 0.50 14.00 5.50 1.00 3.50 0.00 0.00 0.00 0.00 5.00Potato 30 29.10 0.48 0.18 6.78 3.30 0.21 0.00 0.12 0.01 0.01 3.00 2.10Vegetable 58 37.12 1.68 0.41 6.09 132.07 2.49 1691.86 0.93 0.81 0.06 16.24 6.55Banana 100 50.00 0.50 1.00 9.50 11.00 1.20 0.00 1.00 0.00 0.04 11.00 0.00Egg 50 90.50 6.75 6.85 0.40 3.50 1.50 752.00 0.00 0.06 0.13 0.00 39.15Total 446 693.92 23.12 12.17 119.59 249.59 14.72 2470.36 3.16 1.30 0.50 31.24 81.18
Table 2: Foods table for children aged 1-3 years
Food items
Weight gm.
Energy Kcal.
Protein gm.
Fat gm.
CHO gm.
Calcium mg.
Iron mg.
Carotene µg.
Fibre gm.
Vit. B1 mg.
Vit. B2 mg.
Vit. C mg.
Folic acid µg.
Rice/Pitha/Muri/Chira 100 365.00 6.40 0.40 79.00 9.00 4.00 0.00 0.20 0.21 0.09 0.00 11.00Pulse 30 103.20 7.05 0.54 17.52 25.38 2.10 28.32 0.51 0.14 0.10 0.03 29.82Riti/Biscuit 58 197.78 7.02 0.99 40.25 27.84 6.67 16.82 1.10 0.28 0.17 0.00 20.76Leafy Vegetable 58 44.08 2.38 0.64 4.93 152.02 5.34 3928.05 1.22 2.09 0.12 32.65 5.63Non Leafy Vegetable 30 17.10 0.63 0.12 3.48 62.16 0.42 186.00 0.39 0.02 0.02 3.30 0.00 Sweet Potato 58 69.60 0.70 0.17 16.36 11.60 0.46 0.00 0.46 0.03 0.12 1.16 0.00Potato 30 29.10 0.48 0.18 6.78 3.30 0.21 0.00 0.12 0.01 0.01 3.00 2.10Oil 10 90.00 0.00 10.00 0.00 0.00 0.00 0.00 0.00 0.00 0.00 0.00 0.00Fish Or Meat 30 42.30 10.20 1.20 0.60 91.80 1.20 27.90 0.00 0.01 0.03 1.20 4.80 Payes (suji+milk+sugar 200 329.60 6.01 13.40 13.60 209.20 0.40 27.20 0.00 0.00 0.40 0.00 13.60Fruit 50 34.50 0.65 0.35 7.70 15.70 0.70 455.00 1.30 0.04 0.05 21.00 0.50Total 654 1322.2 41.52 27.99 190.22 608.00 21.50 4669.29 5.30 2.84 1.09 62.34 88.21
Bangladesh Open University 67

Table
Table 3: Foods table for children aged 4-6 years
Food items
Weight gm.
Energy Kcal.
Protein gm.
Fat gm.
CHO gm.
Calcium mg.
Iron mg.
Carotene µg.
Fibre gm.
Vit. B1 mg.
Vit. B2 mg.
Vit. C mg.
Folic acid µg.
Rice/Cake/Muri/Chira 145 529.25 9.28 0.58 114.55 13.05 5.80 0.00 0.29 0.30 0.13 0.00 15.95Ruti/Biscuit 58 199.52 13.63 1.04 33.87 49.07 4.06 54.75 0.99 0.28 0.19 0.06 57.65 Pulse 40 136.40 4.84 0.68 27.76 19.20 4.60 11.60 0.76 0.20 0.12 0.00 14.32Leafy Vegetable 58 44.08 2.38 0.64 4.93 152.02 5.34 3928.05 1.22 2.09 0.12 32.65 5.63 Non Leafy Vegetable 40 22.80 0.84 0.16 4.64 82.88 0.56 248.00 0.52 0.03 0.03 4.40 0.00 Sweet Potato 58 69.60 0.70 0.17 16.36 11.60 0.46 0.00 0.46 0.03 0.12 1.16 0.00 Oil 25 225.00 0.00 25.00 0.00 0.00 0.00 0.00 0.00 0.00 0.00 0.00 0.00Fish/Meat 30 42.30 10.20 1.20 0.60 91.80 1.20 27.90 0.00 0.01 0.03 1.20 4.80Potato 58 56.26 0.93 0.35 13.11 6.38 0.41 0.00 0.23 0.02 0.02 5.80 4.06Payes (Suji+Milk+Sugar) 200 329.60 6.01 13.40 13.60 209.20 0.40 27.20 0.00 0.00 0.40 0.00 13.60 Fruit 70 48.30 0.91 0.49 10.78 21.98 0.98 637.00 1.82 0.06 0.06 29.40 0.70 Total 782 1703.1 49.72 43.71 240.20 657.18 23.81 4934.50 6.29 3.02 1.21 74.67 116.71
Table 4: Foods table for children aged 7-9 years
Food Items 0
Energy Kcal.
Protein gm.
Fat gm.
CHO gm.
Calcium mg.
Iron mg.
Carotene µg.
Fibre gm.
Vit. B1 mg.
Vit. B2 mg.
Vit. C mg.
Folic acid µg.
Rice 290 1058.5 18.56 1.16 229.10 26.10 11.60 0.00 0.58 0.61 0.26 0.00 31.90Pulse 58 197.78 7.02 0.99 40.25 27.84 6.67 16.82 1.10 0.28 0.17 0.00 20.76Green Leafy 58 44.08 2.38 0.64 4.93 152.02 5.34 3928.05 1.22 2.09 0.12 32.65 5.63 Sweet Potato 70 84.00 0.84 0.21 19.74 14.00 0.56 0.00 0.56 0.04 0.14 1.40 0.00 Non Leafy Vegetable 30 17.10 0.63 0.12 3.48 62.16 0.42 186.00 0.39 0.02 0.02 3.30 3.39 Fish/Meat/Egg 58 82.94 22.33 2.26 1.45 266.22 2.73 49.59 0.01 0.01 0.03 2.90 4.99Oil 25 225.00 0.00 25.00 0.00 0.00 0.00 0.00 0.00 0.00 0.00 0.00 0.00Sugar/Gur 25 94.50 0.50 0.00 23.50 38.00 1.50 14.00 0.00 0.00 0.00 0.00 0.00Fruit 50 34.50 0.65 0.35 7.70 15.70 0.70 455.00 1.30 0.04 0.05 21.00 0.50Milk 225 150.75 7.20 9.23 9.90 292.50 0.45 38.25 0.00 0.11 0.43 4.50 19.13Total 889 1989.15 60.11 39.95 340.05 894.54 29.96 4687.71 5.16 3.21 1.21 65.75 86.29
School of Science and Technology 68

Nutrition and Dietetics
Table 5: Foods table for children aged 10-14 years
Food items
Weight gm.
Energy Kcal.
Protein gm.
Fat gm.
CHO gm.
Calcium mg.
Iron mg.
Carotene µg.
Fibre gm.
Vit. B1 mg.
Vit. B2 mg.
Vit. C mg.
Folic acid µg.
Rice 348 1270.20 22.27 1.39 274.92 31.32 13.92 0.00 0.70 0.73 0.31 0.00 38.28Pulse 58 197.78 7.02 0.99 40.25 27.84 6.67 16.82 1.10 0.28 0.17 0.00 20.76Green Leafy 58 44.08 2.38 0.64 4.93 152.02 5.34 3928.05 1.22 2.09 0.12 32.65 5.63 Sweet Potato 116 139.20 1.39 0.35 32.71 23.20 0.93 0.00 0.93 0.07 0.23 2.32 0.00 Others Vegetable 116 66.12 2.44 0.46 13.46 240.35 1.62 719.20 1.51 0.08 0.08 12.76 13.11 Fish/Meat/Egg 58 82.94 22.33 2.26 1.45 266.22 2.73 49.59 0.01 0.01 0.03 2.90 4.99Oil 30 270.00 0.00 30.00 0.00 0.00 0.00 0.00 0.00 0.00 0.00 0.00 0.00Sugar/Gur 58 219.24 1.16 0.00 54.52 88.16 3.48 32.48 0.00 0.00 0.00 0.00 0.00Fruit 50 34.50 0.65 0.35 7.70 15.70 0.70 455.00 1.30 0.04 0.05 21.00 0.50Milk 225 150.75 7.20 9.23 9.90 292.50 0.45 38.25 0.00 0.11 0.43 4.50 19.13Total 1117 2474.81 66.84 45.67 439.84 1137.31 35.83 5239.39 6.76 3.42 1.41 76.13 102.39
Table 6: Foods table for boys aged 15-18 years
Food items
Weight gm.
Energy Kcal.
Protein gm.
Fat gm.
CHO gm.
Calcium mg.
Iron mg.
Carotene µg.
Fibre gm.
Vit. B1 mg.
Vit. B2 mg.
Vit. C mg.
Folic acid µg.
Rice 440 1606.00 28.16 1.76 347.60 39.60 17.60 0.00 0.88 0.92 0.40 0.00 48.40Pulse 58 197.78 7.02 0.99 40.25 27.84 6.67 16.82 1.10 0.28 0.17 0.00 20.76Green Leafy 58 44.08 2.38 0.64 4.93 152.02 5.34 3928.05 1.22 2.09 0.12 32.65 5.63 Sweet Potato 116 139.20 1.39 0.35 32.71 23.20 0.93 0.00 0.93 0.07 0.23 2.32 0.00 Others Vegetable 88 50.16 1.85 0.35 10.21 182.34 1.23 545.60 1.14 0.06 0.06 9.68 9.94Fish/Meat/Egg 60 85.80 23.10 2.34 1.50 275.40 2.82 51.30 0.01 0.01 0.03 3.00 5.16Oil 35 315.00 0.00 35.00 0.00 0.00 0.00 0.00 0.00 0.00 0.00 0.00 0.00Sugar/Gur 58 219.24 1.16 0.00 54.52 88.16 3.48 32.48 0.00 0.00 0.00 0.00 0.00Fruit 50 34.50 0.65 0.35 7.70 15.70 0.70 455.00 1.30 0.04 0.05 21.00 0.50Milk 120 80.40 3.84 4.92 5.28 156.00 0.24 20.40 0.00 0.06 0.23 2.40 10.20Total 1083 2772.16 69.55 46.69 504.70 960.25 39.01 5049.65 6.58 3.54 1.28 71.05 100.59
Bangladesh Open University 69

Table
Table 7: Foods table for adult female
Food items
Weight gm.
Energy Kcal.
Protein gm.
Fat gm.
CHO gm.
Calcium mg.
Iron mg.
Carotene µg.
Fibre gm.
Vit. B1 mg.
Vit. B2 mg.
Vit. C mg.
Folic acid µg.
Rice 350 1277.50 22.40 1.40 276.50 31.50 14.00 0.00 0.70 0.74 0.32 0.00 38.50Pulse 44 150.04 5.32 0.75 30.54 21.12 5.06 12.76 0.84 0.22 0.13 0.00 15.75Leafy Veg 116 88.16 4.76 1.28 9.86 304.04 10.67 7856.10 2.44 4.18 0.23 65.31 11.25Others Vegetable 87 49.59 1.83 0.35 10.09 180.26 1.22 539.40 1.13 0.06 0.06 9.57 9.83Sweet Potato 58 69.60 0.70 0.17 16.36 11.60 0.46 0.00 0.46 0.03 0.12 1.16 0.00Fish/Meat/Egg 58 82.94 22.33 2.26 1.45 266.22 2.73 49.59 0.01 0.01 0.03 2.90 4.99Oil 40 360.00 0.00 40.00 0.00 0.00 0.00 0.00 0.00 0.00 0.00 0.00 0.00Fruit 100 69.00 1.30 0.70 15.40 31.40 1.40 910.00 2.60 0.08 0.09 42.00 1.00Total 853 2146.83 58.63 46.91 360.19 846.14 35.54 9367.85 8.18 5.31 0.97 120.94 81.32
School of Science and Technology 70

Nutrition and Dietetics
Table 8: Foods table for adolescent girl
Food
items Weight
gm. Energy Kcal.
Protein gm.
Fat gm.
CHO gm.
Calcium mg.
Iron mg.
Carotene µg.
Fibre gm.
Vit. B1 mg.
Vit. B2 mg.
Vit. C mg.
Folic acid µg.
(Morning) Ruti 3 piece 90 208.80 7.20 0.90 42.30 29.70 7.20 18.00 0.90 0.27 0.18 0.00 21.60Egg 50 78.00 8.80 4.65 0.25 2.75 0.75 376.00 0.00 0.03 0.07 0.00 39.60vegetable (raw) 50 32.00 1.45 0.35 5.25 113.85 2.15 1458.50 0.80 0.70 0.06 14.00 5.65fruit:(tok) 30 15.98 0.40 0.05 3.54 6.35 0.40 238.64 1.77 0.02 0.01 23.78 0.0011 am biscuit 2 piece 14 40.46 0.66 2.32 4.26 16.10 0.49 403.20 1.61 0.00 0.00 0.35 0.00fruit: any (sweet) 50 24.55 0.58 0.38 5.27 14.77 0.55 251.64 0.34 0.07 0.05 22.05 0.00noon bhat 3 cup 315 384.30 6.62 0.32 82.85 9.45 4.10 0.00 0.32 0.32 0.00 0.00 0.00fish/meat 2 piece (small) 60 84.60 20.22 2.40 0.99 183.45 2.58 55.80 0.00 0.02 0.06 2.10 9.72dhal (1.5 cup ghono) 30 103.20 7.05 0.54 17.52 25.38 2.10 28.32 0.51 0.14 0.10 0.03 29.82non leafy vegetable (raw) 60 34.20 1.26 0.24 6.96 124.32 0.84 372.00 0.78 0.04 0.04 6.60 7.20leafy vegetable (raw) 30 22.80 1.23 0.33 2.55 78.63 2.76 2031.75 0.63 1.08 0.06 16.89 2.91afternoon milk 1 cup 120 80.40 3.84 4.92 5.28 156.00 0.24 20.40 0.00 0.06 0.23 2.40 10.20biscuit/(lodus) 2 piece 14 40.46 0.66 2.32 4.26 16.10 0.49 403.20 1.61 0.00 0.00 0.35 0.00night bhat 2.5 cup 270 329.40 5.67 0.27 71.01 8.10 3.51 0.00 0.27 0.27 0.00 0.00 0.00dhal (2 cup medium ghono) 30 103.20 7.05 0.54 17.52 25.38 2.10 28.32 0.51 0.14 0.10 0.03 29.82non leafy vegetable (raw) 60 34.20 1.26 0.24 6.96 124.32 0.84 372.00 0.78 0.04 0.04 6.60 7.20chiken 30 51.90 3.99 3.99 0.00 18.00 0.63 502.20 0.00 0.03 0.12 0.00 2.04oil* 28 252.00 0.00 28.00 0.00 0.00 0.00 0.00 0.00 0.00 0.00 0.00 0.00before bed milk 1 cup 120 80.40 3.84 4.92 5.28 156.00 0.24 20.40 0.00 0.06 0.23 2.40 10.20Total 1451 2000.85 81.77 57.68 282.03 1108.66 31.96 6580.36 10.82 3.30 1.34 97.58 175.96
Bangladesh Open University 71

Table
Table 9: Foods table for adult female
Food items
Weight gm.
Energy Kcal.
Protein gm.
Fat gm.
CHO gm.
Calcium mg.
Iron mg.
Carotene µg.
Fibre gm.
Vit. B1 mg.
Vit. B2 mg.
Vit. C mg.
Folic acid µg.
Rice 350 1277.50 22.40 1.40 276.50 31.50 14.00 0.00 0.70 0.74 0.32 0.00 38.50pulse 44 150.04 5.32 0.75 30.54 21.12 5.06 12.76 0.84 0.22 0.13 0.00 15.75leafy veg 116 88.16 4.76 1.28 9.86 304.04 10.67 7856.10 2.44 4.18 0.23 65.31 11.25others vegetable 87 49.59 1.83 0.35 10.09 180.26 1.22 539.40 1.13 0.06 0.06 9.57 9.83sweet potato 58 69.60 0.70 0.17 16.36 11.60 0.46 0.00 0.46 0.03 0.12 1.16 0.00 fish/meat/egg 58 82.94 22.33 2.26 1.45 266.22 2.73 49.59 0.01 0.01 0.03 2.90 4.99oil 40 360.00 0.00 40.00 0.00 0.00 0.00 0.00 0.00 0.00 0.00 0.00 0.00fruit 100 69.00 1.30 0.70 15.40 31.40 1.40 910.00 2.60 0.08 0.09 42.00 1.00Total 853 2146.83 58.63 46.91 360.19 846.14 35.54 9367.85 8.18 5.31 0.97 120.94 81.32
School of Science and Technology 72

Nutrition and Dietetics
Table 10: Foods table for menstruations period
Food items
Weight gm.
Energy Kcal.
Protein gm.
Fat gm.
CHO gm.
Calcium mg.
Iron mg.
Carotene µg.
Fibre gm.
Vit. B1 mg.
Vit. B2 mg.
Vit. C mg.
Folic acid µg.
(Morning) Ruti 4 piece 120 278.4 9.60 1.20 56.40 39.60 9.60 24.00 1.20 0.36 0.24 0.00 28.80egg 35 54.60 6.16 3.26 0.18 1.93 0.53 263.20 0.00 0.02 0.05 0.00 27.72vegetable 1 cup (cooked) 120 76.80 3.48 0.84 12.60 273.24 5.16 3500.40 1.92 1.68 0.13 33.60 13.56fruit (tok) 40 21.31 0.53 0.07 4.72 8.47 0.53 318.18 2.36 0.03 0.02 31.71 0.0011 am biscuit 2 piece 14 40.46 0.66 2.32 4.26 16.10 0.49 403.20 1.61 0.00 0.00 0.35 0.00fruit (sweet) 50 24.55 0.58 0.38 5.27 14.77 0.55 251.64 0.34 0.07 0.05 22.05 0.00noon bhat 4 cup 360 439.20 7.56 0.36 94.68 10.80 4.68 0.00 0.36 0.36 0.00 0.00 0.00fish 2 piece 60 85.80 25.62 2.16 1.92 347.76 3.06 27.60 0.00 0.01 0.01 3.00 0.00 dhal (1 cup medium ghono) 15 51.60 3.53 0.27 8.76 12.69 1.05 14.16 0.26 0.07 0.05 0.02 14.91leafy vegetable 0.5 cup 60 38.40 1.74 0.42 6.30 136.62 2.58 1750.20 0.96 0.84 0.07 16.80 6.78cocumber 60 13.20 0.96 0.06 2.10 8.40 0.90 0.00 0.24 0.10 0.01 3.00 0.00afternoon biscuit 2 piece 14 40.46 0.66 2.32 4.26 16.10 0.49 403.20 1.61 0.00 0.00 0.35 0.00fruit 50 34.50 0.65 0.35 7.70 15.70 0.70 455.00 1.30 0.04 0.05 21.00 0.50night bhat 3 cup 270 626.40 21.60 2.70 126.90 89.10 21.60 54.00 2.70 0.81 0.54 0.00 64.80chicken 1 piece 30 51.90 3.99 3.99 0.00 18.00 0.63 502.20 0.00 0.03 0.12 0.00 2.04 dhal (1 cup medium ghono) 15 51.60 3.53 0.27 8.76 12.69 1.05 14.16 0.26 0.07 0.05 0.02 14.91vegetable 1 cup (cooked) 120 76.80 3.48 0.84 12.60 273.24 5.16 3500.40 1.92 1.68 0.13 33.60 13.56milk 1 cup 120 80.40 3.84 4.92 5.28 156.00 0.24 20.40 0.00 0.06 0.23 2.40 10.20 oil* 58 522.00 0.00 58.00 0.00 0.00 0.00 0.00 0.00 0.00 0.00 0.00 0.00Total 1611 2608.3 98.15 84.73 362.67 1451.2 58.99 11501.9 17.03 6.23 1.73 167.88 197.7
Bangladesh Open University 73

Table
Table 11: Foods table for pregnant women
Food Weight gm.
Energy Kcal.
Protein gm.
Fat gm.
CHO gm.
Calcium mg.
Iron mg.
Carotene items µg.
Fibre gm.
Vit. B1 mg.
Vit. B2 mg.
Vit. C mg.
Folic acid µg.
Rice 400 1460.00 25.60 1.60 316.00 36.00 16.00 0.00 0.80 0.84 0.36 0.00 44.00Pulse 58 197.78 7.02 0.99 40.25 27.84 6.67 16.82 1.10 0.28 0.17 0.00 20.76Leafy Veg 145 110.20 5.95 1.60 12.33 380.05 13.34 9820.13 3.05 5.22 0.29 81.64 14.07Others Vegetable 87 49.59 1.83 0.35 10.09 180.26 1.22 539.40 1.13 0.06 0.06 9.57 9.83Sweet Potato/Potato 58 69.60 0.70 0.17 16.36 11.60 0.46 0.00 0.46 0.03 0.12 1.16 0.00 Fish/Meat/Egg 58 82.94 22.33 2.26 1.45 266.22 2.73 49.59 0.01 0.01 0.03 2.90 4.99Oil 40 360.00 0.00 40.00 0.00 0.00 0.00 0.00 0.00 0.00 0.00 0.00 0.00Fruit 50 34.50 0.65 0.35 7.70 15.70 0.70 455.00 1.30 0.04 0.05 21.00 0.50Total 896 2364.61 64.07 47.32 404.18 917.67 41.12 10880.94 7.85 6.49 1.07 116.27 94.15
Table 12: Foods table for lactating mother
Food items
Weight gm.
Energy Kcal.
Protein gm.
Fat gm.
CHO Folic acid µg.
Calcium mg.
Iron mg.
Carotene µg.
Fibre gm.
Vit. B1 mg.
Vit. B2 mg.
Vit. C mg. gm.
Rice 430 1569.5 27.52 1.72 339.70 38.70 17.20 0.00 0.86 0.90 0.39 0.00 47.30Pulse 87 296.67 10.53 1.48 60.38 41.76 10.01 25.23 1.65 0.43 0.25 0.00 31.15Leafy Veg 145 110.20 5.95 1.60 12.33 380.05 13.34 9820.13 3.05 5.22 0.29 81.64 14.07 Others Vegetable 87 49.59 1.83 0.35 10.09 180.26 1.22 539.40 1.13 0.06 0.06 9.57 9.83 Sweet Potato/Potato 58 69.60 0.70 0.17 16.36 11.60 0.46 0.00 0.46 0.03 0.12 1.16 0.00 Fish/Meat/Egg 58 82.94 22.33 2.26 1.45 266.22 2.73 49.59 0.01 0.01 0.03 2.90 4.99Oil 40 360.00 0.00 40.00 0.00 0.00 0.00 0.00 0.00 0.00 0.00 0.00 0.00Fruit 50 34.50 0.65 0.35 7.70 15.70 0.70 455.00 1.30 0.04 0.05 21.00 0.50Total 10889.35 955 2573.0 69.50 47.93 448.00 934.29 45.65 8.46 6.70 1.18 116.27 107.83
School of Science and Technology 74

Nutrition and Dietetics
Table 13: Foods table for weight decrease
Food items
Weight gm.
Energy Kcal.
Protein gm.
Fat gm.
CHO gm.
Calcium mg.
Iron mg.
Carotene µg.
Fibre gm.
Vit. B1 mg.
Vit. B2 mg.
Vit. C mg.
Folic acid µg.
(Morning) Ruti Two Piece 60 139.20 4.80 0.60 28.20 19.80 4.80 12.00 0.60 0.18 0.12 0.00 14.40Egg 40 62.40 7.04 3.72 0.20 2.20 0.60 300.80 0.00 0.02 0.05 0.00 31.68Vegetable 0.5 Cup (Cooked) 60 38.40 1.74 0.42 6.30 136.62 2.58 1750.20 0.96 0.84 0.07 16.80 6.78Fruit (Tok) 40 21.31 0.53 0.07 4.72 8.47 0.53 318.18 2.36 0.03 0.02 31.71 0.00 11 Am Biscuit 1 Piece 7 24.78 0.53 0.01 5.64 1.61 0.46 0.00 0.02 0.01 0.01 0.00 0.00Apple 1 40 34.80 1.04 0.08 7.52 15.20 0.24 0.00 1.16 0.12 0.01 3.60 0.00 Noon Bhat 2 Cup 180 219.60 3.78 0.18 47.34 5.40 2.34 0.00 0.18 0.18 0.00 0.00 0.00Fish/Meat I Piece (Small) 30 42.30 10.11 1.20 0.50 91.73 1.29 27.90 0.00 0.01 0.03 1.05 4.86Leafy Vegetable 0.5 Cup 60 38.40 1.74 0.42 6.30 136.62 2.58 1750.20 0.96 0.84 0.07 16.80 6.78 Dhal (1 Cup Medium Ghono) 15 51.60 3.53 0.27 8.76 12.69 1.05 14.16 0.26 0.07 0.05 0.02 14.91 Vegetable:Group B (Any One) 40 25.20 0.80 0.40 4.80 22.00 0.40 444.80 0.80 0.00 0.00 2.80 10.80 Afternoon Milk 1 Cup 120 80.40 3.84 4.92 5.28 156.00 0.24 20.40 0.00 0.06 0.23 2.40 10.20Night Atar Ruti 2 Piece 60 139.20 4.80 0.60 28.20 19.80 4.80 12.00 0.60 0.18 0.12 0.00 14.40Chicken 1 Piece 30 51.90 3.99 3.99 0.00 18.00 0.63 502.20 0.00 0.03 0.12 0.00 2.04 Vegetable 1 Cup (Cooked) 120 76.80 3.48 0.84 12.60 273.24 5.16 3500.40 1.92 1.68 0.13 33.60 13.56Dhal (0.5 Cup Medium Ghono) 8 27.52 1.88 0.14 4.67 6.77 0.56 7.55 0.14 0.04 0.03 0.01 7.95Oil* 14 126.00 0.00 14.00 0.00 0.00 0.00 0.00 0.00 0.00 0.00 0.00 0.00Total 924 1199.8 53.62 31.86 171.03 926.15 28.26 8660.79 9.95 4.30 1.04 108.78 138.36
Bangladesh Open University 75

Table
Table 14: Foods table for weight increase
Food items
Weight gm.
Energy Kcal.
Protein gm.
Fat gm.
CHO gm.
Calcium mg.
Iron mg.
Carotene µg.
Fibre gm.
Vit. B1 mg.
Vit. B2 mg.
Vit. C mg.
Folic acid µg.
(Morning) Ruti 5 Piece 150 348.00 12.00 1.50 70.50 49.50 12.00 30.00 1.50 0.45 0.30 0.00 36.00 Vegetable 1.5 Cup (Cooked) 180 115.20 5.22 1.26 18.90 409.86 7.74 5250.60 2.88 2.52 0.20 50.40 20.34Fruit 50 34.50 0.65 0.35 7.70 15.70 0.70 455.00 1.30 0.04 0.05 21.00 0.50Egg 64 99.84 11.26 5.95 0.32 3.52 0.96 481.28 0.00 0.04 0.08 0.00 50.6911 Am Biscuit 3 Piece 21 74.34 1.58 0.02 16.93 4.83 1.39 0.00 0.06 0.04 0.03 0.00 0.00Fruit 50 34.50 0.65 0.35 7.70 15.70 0.70 455.00 1.30 0.04 0.05 21.00 0.50Noon Bhat 6 Cup 540 658.80 11.34 0.54 142.02 16.20 7.02 0.00 0.54 0.54 0.00 0.00 0.00Fish 2 Piece 60 85.80 25.62 2.16 1.92 347.76 3.06 27.60 0.00 0.01 0.01 3.00 0.00 Dhal (3 Cup Medium Ghono) 45 154.80 10.58 0.81 26.28 38.07 3.15 42.48 0.77 0.22 0.15 0.05 44.73 Leafy Vegetable 0.5 Cup (Cooked) 60 38.40 1.74 0.42 6.30 136.62 2.58 1750.20 0.96 0.84 0.07 16.80 6.78Vegetable 1.5 Cup (Cooked) 180 115.20 5.22 1.26 18.90 409.86 7.74 5250.60 2.88 2.52 0.20 50.40 20.34Afternoon Milk 1 Glass 240 160.80 7.68 9.84 10.56 312.00 0.48 40.80 0.00 0.12 0.46 4.80 20.40Night Bhat 2.5 Cup 225 274.50 4.73 0.23 59.18 6.75 2.93 0.00 0.23 0.23 0.00 0.00 0.00Chicken 1 Piece 60 103.80 7.98 7.98 0.00 36.00 1.26 1004.40 0.00 0.06 0.24 0.00 4.08 Dhal (2 Cup Medium Ghono) 30 103.20 7.05 0.54 17.52 25.38 2.10 28.32 0.51 0.14 0.10 0.03 29.82Vegetable 1 Cup (Cooked) 120 76.80 3.48 0.84 12.60 273.24 5.16 3500.40 1.92 1.68 0.13 33.60 13.56Oil 58 522.00 0.00 58.00 0.00 0.00 0.00 0.00 0.00 0.00 0.00 0.00 0.00Total 2133 3000.4 116.77 92.05 417.32 2100.99 58.96 18316.68 14.84 9.48 2.04 201.0 247.7
School of Science and Technology 76

Nutrition and Dietetics
Table 15: Food table for old age
Food Items
Weight gm.
Energy Kcal.
Protein gm.
Fat gm.
CHO gm.
Calcium mg.
Iron mg.
Carotene µg.
Fibre gm.
Vit. B1 mg.
Vit. B2 mg.
Vit. C mg.
Folic acid µg.
(Morning) Ruti Two Piece 60 139.20 4.80 0.60 28.20 19.80 4.80 12.00 0.60 0.18 0.12 0.00 0.00 Egg 40 62.40 3.727.04 0.20 2.20 300.800.60 0.00 0.02 0.05 0.00 0.00Vegetable 1 Cup (Cooked) 120 76.80 3.48 0.84 12.60 273.24 5.16 3500.40 1.92 1.68 0.13 33.60 0.00 Fruit (Tok) 40 21.31 0.53 0.07 4.72 8.47 0.53 318.18 2.36 0.03 0.02 31.71 0.00 11 Am Biscuit 2 Piece 14 49.56 1.05 0.01 11.28 3.22 0.92 0.00 0.04 0.03 0.02 0.00 0.00Milk 1 Glass Fatless 240 69.60 6.00 0.24 11.04 288.00 0.48 0.00 0.29 0.19 14.4 0.00 0.00 Noon Bhat 2 Cup 180 219.60 3.78 0.18 47.34 5.40 2.34 0.00 0.18 0.18 0.00 0.00 0.00Dhal (1 Cup Medium Ghono) 15 51.60 3.53 0.27 8.76 12.69 1.05 14.16 0.26 0.07 0.05 0.02 0.00 Fish/Meat I Piece (Small) 30 42.30 10.11 1.20 0.50 91.73 1.29 27.90 0.00 0.01 0.03 1.05 0.00 Vegetable 1 Cup (Cooked) 120 76.80 3.48 0.84 12.60 273.24 5.16 3500.40 1.92 1.68 0.13 33.60 0.00 Leafy Vegetable 0.5 Cup 60 38.40 1.74 0.42 6.30 136.62 2.58 1750.20 0.96 0.84 0.07 16.80 6.78 Afternoon Biscuit 2 Piece 14 49.56 1.05 0.01 11.28 3.22 0.92 0.00 0.04 0.03 0.02 0.00 0.00Fruit (Sweet) 50 24.55 0.58 0.38 5.27 14.77 0.55 251.64 0.34 0.07 0.05 22.05 0.00 Night Bhat 2 Cup 180 219.60 3.78 0.18 47.34 5.40 2.34 0.00 0.18 0.18 0.00 0.00 0.00Fish/Meat I Piece (Small) 30 42.30 10.11 1.20 0.50 91.73 1.29 27.90 0.00 0.01 0.03 1.05 0.00 Dhal (1 Cup Medium Ghono) 15 51.60 3.53 0.27 8.76 12.69 1.05 14.16 0.26 0.07 0.05 0.02 0.00 Vegetable 1 Cup (Cooked) 120 76.80 3.48 0.84 12.60 273.24 5.16 3500.40 1.92 1.68 0.13 33.60 0.00 Milk 1 Cup (Fatless) 120 34.80 3.00 0.12 5.52 144.00 0.24 0.00 0.14 0.10 7.20 0.00 0.00 Oil* 25 225.00 25.000.00 0.00 0.00 0.00 0.00 0.00 0.00 0.00 0.00 0.00Total 1473 1571.7 71.06 36.40 234.80 1659.6 36.46 13218.1 11.40 7.06 22.5 173.5 6.78
Bangladesh Open University 77

Table
Table 16: Costly food for adult
Food Items
Weight gm.
Energy Kcal.
Protein gm.
Fat gm.
CHO gm.
Calcium mg.
Iron mg.
Carotene µg.
Fibre gm.
Vit. B1 mg.
Vit. B2 mg.
Vit. C mg.
Folic acid µg.
Mihi Rice 232 846.80 14.85 0.93 183.28 20.88 9.28 0.00 0.46 0.49 0.21 0.00 25.52 Bread/Biscuit 116 522.00 7.42 17.63 83.40 0.00 0.00 0.00 0.00 0.00 0.00 0.00 0.00Meat 58 80.62 2.6714.33 0.06 18.50 81.202.03 0.040.00 0.12 1.16 18.79Big Fish 58 66.70 11.60 1.16 2.90 52.20 1.16 0.00 0.00 0.00 0.00 6.96 0.00 Egg 50 78.00 4.658.80 0.25 2.75 376.000.75 0.00 0.03 0.07 0.00 39.60Fruit (Banana,Orange,Apple,Mango) 100 66.00 1.00 1.00 14.00 26.00 3.00 77.00 1.00 0.00 0.00 5.00 0.00 Milk 250 167.50 10.258.00 11.00 325.00 0.50 42.50 0.00 0.13 0.48 5.00 21.25Butter 25 182.25 20.250.00 0.00 0.00 0.000.00 0.00 0.000.00 0.00 0.00Sugar 58 230.84 0.000.00 57.65 6.96 0.00 0.00 0.00 0.000.00 0.00 0.00Leafy Vegetable 58 44.08 2.38 0.64 4.93 152.02 5.34 3928.05 1.22 2.09 0.12 32.65 5.63 Vege.(Ladies Finger,Cowpea,Parwar,Peas) 116 134.56 8.73 0.67 23.37 72.50 4.50 718.62 3.60 0.28 0.12 3.48 69.60oil/ghee 40 360.00 40.000.00 0.00 0.00 0.00 0.00 0.00 0.000.00 0.00 0.00Total 1161 77.112779.4 99.84 380.85 676.81 26.55 5223.37 6.28 3.05 1.11 54.25 180.39
Table 17: Low costly food for adult
Food items
Weight gm.
Energy Kcal.
Protein gm.
Fat gm.
CHO gm.
Calcium mg.
Iron mg.
Carotene µg.
Fibre gm.
Vit. B1
mg.
Vit. B2
mg. Vit. C mg.
Folic acid µg.
Mota Chowl 232 846.80 14.85 0.93 183.28 20.88 9.28 0.00 0.46 0.49 0.21 0.00 25.52 Atta 232 791.12 3.9428.07 161.01 111.36 26.68 67.28 4.41 1.14 0.000.67 83.06Pulse,Bean's Seed,Peas 87 299.28 20.88 1.74 51.33 71.34 5.22 72.21 1.74 0.00 0.00 0.00 61.77 Small Fish 58 90.48 17.40 1.74 1.16 315.52 11.02 0.00 0.00 0.00 0.00 1.74 0.00Sweet Potato 116 139.20 1.39 0.35 32.71 23.20 0.93 0.00 0.93 0.07 0.23 2.32 0.00 Sag (Kochu,Sagna,Palang,Pui,Lal Sag) 87 47.85 0.874.35 6.09 246.21 11.31 8691.30 0.87 0.00 0.00 75.69 35.67 Non Vegetable (Sim,Bittergourd,Derosh,Patal,Law 87 39.40 1.98 0.39 7.01 58.29 1.35 416.61 1.39 0.07 0.11 27.47 30.96Fruit (Guava,Amloki,Bor,Mango 50 35.50 0.89 0.26 7.40 18.00 0.40 625.88 0.78 0.03 0.03 4.75 0.00Oil 42 378.00 0.00 42.00 0.00 0.00 0.00 0.00 0.00 0.00 0.00 0.00 0.00Sugar/Gur 30 113.4 0.60 28.200.00 45.60 1.80 16.80 0.000.00 0.00 0.00 0.00Total 1021 2781.03 90.41 52.22 478.19 910.40 67.99 9890.07 10.58 1.79 1.25 111.97 236.98
School of Science and Technology 78

Nutrition and Dietetics
Bangladesh Open University 79

Table
Table 18: Food table 1 for diabetic person
Food items
Weight gm.
Energy Kcal.
Protein gm.
Fat gm.
CHO gm.
Calcium mg.
Iron mg.
Carotene µg.
Fibre gm.
Vit. B1
mg.
Vit. B2
mg. Vit. C mg.
Folic acid µg.
(Morning) Ruti Two Piece 60 139.20 4.80 0.60 28.20 19.80 4.80 12.00 0.60 0.18 0.12 0.00 14.40 Egg 29 45.24 2.705.10 0.15 1.60 0.44 218.08 0.00 0.02 0.04 22.970.00Vegetable: Group A (Raw) 50 21.00 1.00 0.50 3.50 46.50 2.50 2078.50 1.00 0.00 0.00 19.50 7.50 Fruit: Group A 30 29.10 0.33 0.09 6.75 8.19 0.54 27.42 0.45 0.06 0.03 26.67 0.00 Morning 11 A.M Muri/Biscuit 15 53.10 1.13 0.02 12.09 3.45 0.99 0.00 0.05 0.03 0.02 0.00 0.00Fruit: Group B (Any One) 30 29.10 0.33 0.09 6.75 8.19 0.54 27.42 0.45 0.06 0.03 26.67 0.00 Noon Bhat 1.5 Cup 180 219.60 3.78 0.18 47.34 5.40 2.34 0.00 0.18 0.18 0.00 0.00 0.00Fish/Meat I Piece (Small) 25 35.25 8.43 1.00 0.41 76.44 1.08 23.25 0.00 0.01 0.03 0.88 4.05 Dhal (1 Cup Medium Ghono) 15 51.60 3.53 0.27 8.76 12.69 1.05 14.16 0.26 0.07 0.05 0.02 14.91 Vegetable:Group A As Wish 50 21.00 1.00 0.50 3.50 46.50 2.50 2078.50 1.00 0.00 0.00 19.50 7.50 Vegetable: Group B (Any One) 40 25.20 0.80 0.40 4.80 22.00 0.40 444.80 0.80 0.00 0.00 2.80 10.80 Afternoon Milk 1 Cup 120 80.40 3.84 4.92 5.28 156.00 0.24 20.40 0.00 0.06 0.23 2.40 10.20Night Atar Ruti 1 Piece 30 69.60 2.40 0.30 14.10 9.90 2.40 6.00 0.30 0.09 0.06 0.00 7.20Dhal (1 Cup Medium Ghono) 15 51.60 3.53 0.27 8.76 12.69 1.05 14.16 0.26 0.07 0.05 0.02 14.91 Vegetable: Group A (Raw) 50 21.00 1.00 0.50 3.50 46.50 2.50 2078.50 1.00 0.00 0.00 19.50 7.50 Oil 12 108.00 12.000.00 0.00 0.00 0.00 0.00 0.00 0.00 0.00 0.000.00Total 751 999.99 40.98 24.33 153.89 475.84 23.36 7043.19 6.34 0.83 0.65 117.95 121.94
School of Science and Technology 80

Nutrition and Dietetics
Table 19: Food table 2 for diabetic person
Food items
Weight gm.
Energy Kcal.
Protein gm.
Fat gm.
CHO gm.
Calcium mg.
Iron mg.
Carotene µg.
Fibre gm.
Vit. B1
mg.
Vit. B2
mg. Vit. C mg.
Folic acid µg.
(Morning) Ruti Two Piece 60 139.20 4.80 0.60 28.20 19.80 4.80 12.00 0.60 0.18 0.12 0.00 14.40 Egg 30 46.80 2.795.28 0.15 1.65 0.45 225.60 0.00 0.02 0.04 23.760.00Vegetable: Group A (Raw) 50 21.00 1.00 0.50 3.50 46.50 2.50 2078.50 1.00 0.00 0.00 19.50 7.50 Fruit: Group A 45 43.65 0.50 0.14 10.13 12.29 0.81 41.13 0.68 0.09 0.05 40.01 0.00 11 Am Muri/Biscuit 25 88.50 1.88 0.03 20.15 5.75 1.65 0.00 0.08 0.05 0.03 0.00 0.00Fruit: Group B (Any One) 30 29.10 0.33 0.09 6.75 8.19 0.54 27.42 0.45 0.06 0.03 26.67 0.00 Noon Bhat 2 Cup 180 219.60 3.78 0.18 47.34 5.40 2.34 0.00 0.18 0.18 0.00 0.00 0.00Fish/Meat I Piece (Small) 30 42.30 10.11 1.20 0.50 91.73 1.29 27.90 0.00 0.01 0.03 1.05 4.86 Dhal (1 Cup Medium Ghono) 15 51.60 3.53 0.27 8.76 12.69 1.05 14.16 0.26 0.07 0.05 0.02 14.91 Vegetable: Group A (Raw) As Wish 50 21.00 1.00 0.50 3.50 46.50 2.50 2078.50 1.00 0.00 0.00 19.50 7.50 Vegetable:Group B (Any One) 40 25.20 0.80 0.40 4.80 22.00 0.40 444.80 0.80 0.00 0.00 2.80 10.80 Afternoon Milk 1 Cup 120 80.40 3.84 4.92 5.28 156.00 0.24 20.40 0.00 0.06 0.23 2.40 10.20Night Atar Ruti 2 Piece 60 139.20 4.80 0.60 28.20 19.80 4.80 12.00 0.60 0.18 0.12 0.00 14.40Dhal (1 Cup Medium Ghono) 15 51.60 3.53 0.27 8.76 12.69 1.05 14.16 0.26 0.07 0.05 0.02 14.91 Vegetable: Group A (Raw) As Wish 50 21.00 1.00 0.50 3.50 46.50 2.50 2078.50 1.00 0.00 0.00 19.50 7.50 Oil 20 180.00 20.000.00 0.00 0.00 0.00 0.00 0.00 0.00 0.00 0.000.00Total 820 1200.15 46.16 32.98 179.51 507.48 26.92 7075.07 6.89 0.98 0.74 131.46 130.74
Bangladesh Open University 81
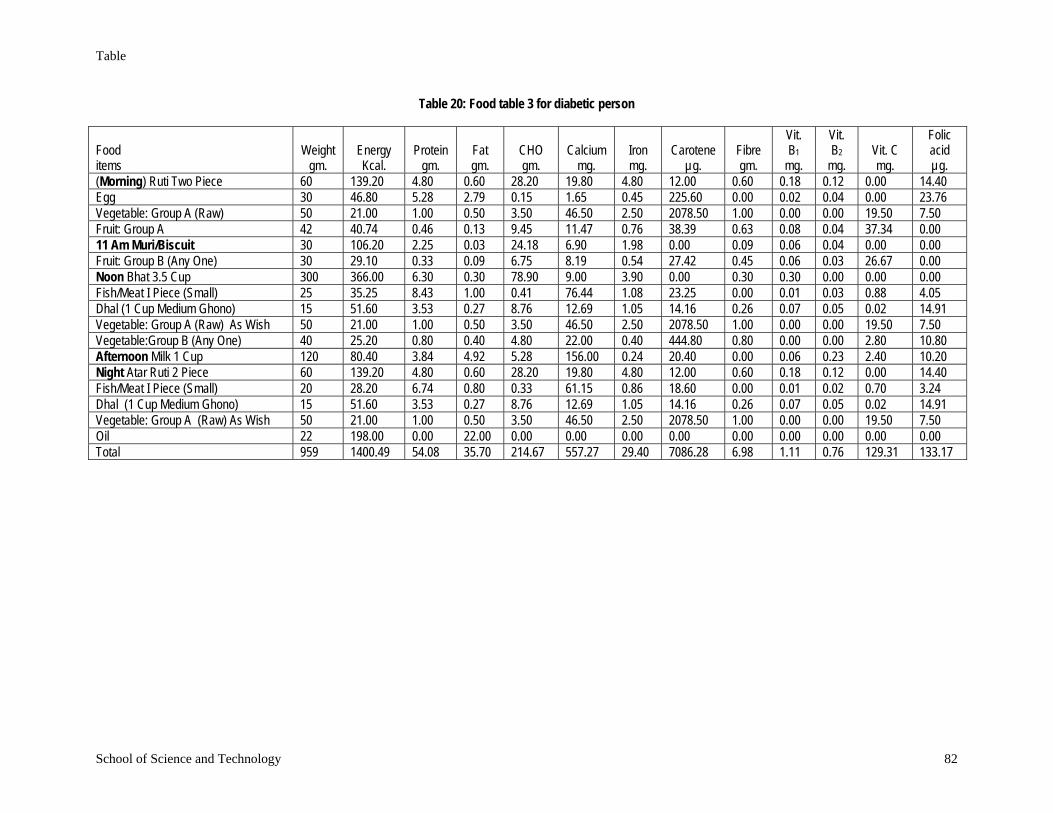
Table
Table 20: Food table 3 for diabetic person
Food items
Weight gm.
Energy Kcal.
Protein gm.
Fat gm.
CHO gm.
Calcium mg.
Iron mg.
Carotene µg.
Fibre gm.
Vit. B1
mg.
Vit. B2
mg. Vit. C mg.
Folic acid µg.
(Morning) Ruti Two Piece 60 139.20 4.80 0.60 28.20 19.80 4.80 12.00 0.60 0.18 0.12 0.00 14.40 Egg 30 46.80 2.795.28 0.15 1.65 0.45 225.60 0.00 0.02 0.04 23.760.00Vegetable: Group A (Raw) 50 21.00 1.00 0.50 3.50 46.50 2.50 2078.50 1.00 0.00 0.00 19.50 7.50 Fruit: Group A 42 40.74 0.46 0.13 9.45 11.47 0.76 38.39 0.63 0.08 0.04 37.34 0.00 11 Am Muri/Biscuit 30 106.20 2.25 0.03 24.18 6.90 1.98 0.00 0.09 0.06 0.04 0.00 0.00Fruit: Group B (Any One) 30 29.10 0.33 0.09 6.75 8.19 0.54 27.42 0.45 0.06 0.03 26.67 0.00 Noon Bhat 3.5 Cup 300 366.00 6.30 0.30 78.90 9.00 3.90 0.00 0.30 0.30 0.00 0.00 0.00Fish/Meat I Piece (Small) 25 35.25 8.43 1.00 0.41 76.44 1.08 23.25 0.00 0.01 0.03 0.88 4.05 Dhal (1 Cup Medium Ghono) 15 51.60 3.53 0.27 8.76 12.69 1.05 14.16 0.26 0.07 0.05 0.02 14.91 Vegetable: Group A (Raw) As Wish 50 21.00 1.00 0.50 3.50 46.50 2.50 2078.50 1.00 0.00 0.00 19.50 7.50 Vegetable:Group B (Any One) 40 25.20 0.80 0.40 4.80 22.00 0.40 444.80 0.80 0.00 0.00 2.80 10.80 Afternoon Milk 1 Cup 120 80.40 3.84 4.92 5.28 156.00 0.24 20.40 0.00 0.06 0.23 2.40 10.20Night Atar Ruti 2 Piece 60 139.20 4.80 0.60 28.20 19.80 4.80 12.00 0.60 0.18 0.12 0.00 14.40Fish/Meat I Piece (Small) 20 28.20 6.74 0.80 0.33 61.15 0.86 18.60 0.00 0.01 0.02 0.70 3.24 Dhal (1 Cup Medium Ghono) 15 51.60 3.53 0.27 8.76 12.69 1.05 14.16 0.26 0.07 0.05 0.02 14.91 Vegetable: Group A (Raw) As Wish 50 21.00 1.00 0.50 3.50 46.50 2.50 2078.50 1.00 0.00 0.00 19.50 7.50 Oil 22 198.00 22.000.00 0.00 0.00 0.00 0.00 0.00 0.00 0.00 0.000.00Total 959 54.081400.49 35.70 214.67 557.27 29.40 7086.28 6.98 1.11 0.76 129.31 133.17
School of Science and Technology 82

Nutrition and Dietetics
Table 21: Food table 4 for diabetic person
Vit. B2
Folic acid µg.
Vit. B1 Vit. C Food Weight Energy Protein Fat CHO Calcium Iron Carotene Fibre
mg. mg. mg. items gm. Kcal. gm. gm. gm. mg. mg. µg. gm. (Morning) Ruti 2 Piece 60 139.20 4.80 0.60 28.20 19.80 4.80 12.00 0.60 0.18 0.12 0.00 14.40 Egg 30 46.80 2.795.28 0.15 1.65 0.45 225.60 0.00 0.02 0.04 23.760.00Vegetable: Group A (Raw) 50 21.00 1.00 0.50 3.50 46.50 2.50 2078.50 1.00 0.00 0.00 19.50 7.50 Fruit: Group A 40 38.80 0.44 0.12 9.00 10.92 0.72 36.56 0.60 0.08 0.04 35.56 0.00 11 Am Muri/Biscuit 30 106.20 2.25 0.03 24.18 6.90 1.98 0.00 0.09 0.06 0.04 0.00 0.00Fruit: Group B (Any One) 30 29.10 0.33 0.09 6.75 8.19 0.54 27.42 0.45 0.06 0.03 26.67 0.00 Noon Bhat 3.5 Cup 300 366.00 6.30 0.30 78.90 9.00 3.90 0.00 0.30 0.30 0.00 0.00 0.00Fish/Meat 2 Piece (Small) 50 70.50 16.85 2.00 0.83 152.88 2.15 46.50 0.00 0.02 0.05 1.75 8.10 Dhal (2 Cup Medium Ghono) 30 103.20 7.05 0.54 17.52 25.38 2.10 28.32 0.51 0.14 0.10 0.03 29.82 Vegetable: Group A (Raw) As Wish 50 21.00 1.00 0.50 3.50 46.50 2.50 2078.50 1.00 0.00 0.00 19.50 7.50 Vegetable:Group B (Any One) 40 25.20 0.80 0.40 4.80 22.00 0.40 444.80 0.80 0.00 0.00 2.80 10.80 Afternoon Milk 1 Cup 120 80.40 3.84 4.92 5.28 156.00 0.24 20.40 0.00 0.06 0.23 2.40 10.20Night Atar Ruti 3 Piece 90 0.90 208.80 7.20 0.90 42.30 29.70 7.20 18.00 0.27 0.18 0.00 21.60Fish/Meat I Piece (Small) 20 28.20 6.74 0.80 0.33 61.15 0.86 18.60 0.00 0.01 0.02 0.70 3.24 Dhal (1 Cup Medium Ghono) 15 51.60 3.53 0.27 8.76 12.69 1.05 14.16 0.26 0.07 0.05 0.02 14.91 Vegetable: Group A (Raw) As Wish 50 21.00 1.00 0.50 3.50 46.50 2.50 2078.50 1.00 0.00 0.00 19.50 7.50 Oil 27 243.00 27.000.00 0.00 0.00 0.00 0.00 0.00 0.00 0.00 0.000.00Total 1032 1600.00 68.41 42.26 237.50 655.76 33.89 7127.86 7.51 1.28 0.89 128.43 159.33
Bangladesh Open University 83

Table
Table 22: Food table 5 for diabetic person
Food items
Weight gm.
Energy Kcal.
Protein gm.
Fat gm.
CHO gm.
Calcium mg.
Iron mg.
Carotene µg.
Fibre gm.
Vit. B1
mg.
Vit. B2
mg. Vit. C mg.
Folic acid µg.
(Morning) Ruti 4 Piece 120 278.40 9.60 1.20 56.40 39.60 9.60 24.00 1.20 0.36 0.24 0.00 28.80 Egg 34 53.04 3.165.98 0.17 1.87 0.51 255.68 0.00 0.02 0.04 26.930.00Vegetable: Group A (Raw) 50 21.00 1.00 0.50 3.50 46.50 2.50 2078.50 1.00 0.00 0.00 19.50 7.50 Fruit: Group A 40 38.80 0.44 0.12 9.00 10.92 0.72 36.56 0.60 0.08 0.04 35.56 0.00 11 Am Muri/Biscuit 30 106.20 2.25 0.03 24.18 6.90 1.98 0.00 0.09 0.06 0.04 0.00 0.00Fruit: Group B (Any One) 30 29.10 0.33 0.09 6.75 8.19 0.54 27.42 0.45 0.06 0.03 26.67 0.00 Noon Bhat 4 Cup 360 439.20 7.56 0.36 94.68 10.80 4.68 0.00 0.36 0.36 0.00 0.00 0.00Fish/Meat 1 Piece (Small) 30 42.30 10.11 1.20 0.50 91.73 1.29 27.90 0.00 0.01 0.03 1.05 4.86 Dhal (1.5 Cup Medium Ghono) 25 86.00 5.88 0.45 14.60 21.15 1.75 23.60 0.43 0.12 0.08 0.03 24.85 Vegetable: Group A (Raw) As Wish 50 21.00 1.00 0.50 3.50 46.50 2.50 2078.50 1.00 0.00 0.00 19.50 7.50 Vegetable:Group B (Any One) 40 25.20 0.80 0.40 4.80 22.00 0.40 444.80 0.80 0.00 0.00 2.80 10.80 Afternoon Milk 1 Cup 120 80.40 3.84 4.92 5.28 156.00 0.24 20.40 0.00 0.06 0.23 2.40 10.20Night Atar Ruti 3 Piece 90 208.80 7.20 0.90 42.30 29.70 7.20 18.00 0.90 0.27 0.18 0.00 21.60Fish/Meat I Piece (Small) 20 28.20 6.74 0.80 0.33 61.15 0.86 18.60 0.00 0.01 0.02 0.70 3.24 Dhal (1 Cup Medium Ghono) 15 51.60 3.53 0.27 8.76 12.69 1.05 14.16 0.26 0.07 0.05 0.02 14.91 Vegetable: Group A (Raw) As Wish 50 21.00 1.00 0.50 3.50 46.50 2.50 2078.50 1.00 0.00 0.00 19.50 7.50 Oil 30 270.00 30.000.00 0.00 0.00 0.00 0.00 0.00 0.00 0.00 0.000.00Total 1134 1800.24 67.25 45.40 278.25 612.20 38.32 7146.62 8.08 1.49 0.98 127.72 168.69
School of Science and Technology 84

Nutrition and Dietetics
Table 23: Food table 6 for diabetic person
Food items
Weight gm.
Energy Kcal.
Protein gm.
Fat gm.
CHO gm.
Calcium mg.
Iron mg.
Carotene µg.
Fibre gm.
Vit. B1
mg.
Vit. B2
mg. Vit. C mg.
Folic acid µg.
(Morning) Ruti 4 Piece 120 278.40 9.60 1.20 56.40 39.60 9.60 24.00 1.20 0.36 0.24 0.00 28.80 Egg 35 54.60 3.266.16 0.18 1.93 0.53 263.20 0.00 0.02 0.05 27.720.00Vegetable: Group A (Raw) 50 21.00 1.00 0.50 3.50 46.50 2.50 2078.50 1.00 0.00 0.00 19.50 7.50 Fruit: Group A 40 38.80 0.44 0.12 9.00 10.92 0.72 36.56 0.60 0.08 0.04 35.56 0.00 11 Am Muri/Biscuit 30 106.20 2.25 0.03 24.18 6.90 1.98 0.00 0.09 0.06 0.04 0.00 0.00Fruit: Group B (Any One) 30 29.10 0.33 0.09 6.75 8.19 0.54 27.42 0.45 0.06 0.03 26.67 0.00 Noon Bhat 4.1/3 Cup 400 488.00 8.40 0.40 105.20 12.00 5.20 0.00 0.40 0.40 0.00 0.00 0.00Fish/Meat 1 Piece (Small) 30 42.30 10.11 1.20 0.50 91.73 1.29 27.90 0.00 0.01 0.03 1.05 4.86 Dhal (1.5 Cup Medium Ghono) 25 86.00 5.88 0.45 14.60 21.15 1.75 23.60 0.43 0.12 0.08 0.03 24.85 Vegetable: Group A (Raw) As Wish 40 16.80 0.80 0.40 2.80 37.20 2.00 1662.80 0.80 0.00 0.00 15.60 6.00 Vegetable:Group B (Any One) 40 25.20 0.80 0.40 4.80 22.00 0.40 444.80 0.80 0.00 0.00 2.80 10.80 Afternoon Milk 1 Cup 120 80.40 3.84 4.92 5.28 156.00 0.24 20.40 0.00 0.06 0.23 2.40 10.20Night Atar Ruti 5 Piece 150 348.00 12.00 1.50 70.50 49.50 12.00 30.00 1.50 0.45 0.30 0.00 36.00Fish/Meat I Piece (Small) 30 42.30 10.11 1.20 0.50 91.73 1.29 27.90 0.00 0.01 0.03 1.05 4.86 Dhal (1 Cup Medium Ghono) 15 51.60 3.53 0.27 8.76 12.69 1.05 14.16 0.26 0.07 0.05 0.02 14.91 Vegetable: Group A (Raw) As Wish 50 21.00 1.00 0.50 3.50 46.50 2.50 2078.50 1.00 0.00 0.00 19.50 7.50 Oil 30 270.00 0.00 30.00 0.00 0.00 0.00 0.00 0.00 0.00 0.00 0.00 0.00 Total 1235 1999.70 76.24 46.44 316.44 654.53 43.59 6759.74 8.52 1.71 1.11 124.17 184.00
Bangladesh Open University 85

Table
Table 24: Food table 7 for diabetic person
Food items
Weight gm.
Energy Kcal.
Protein gm.
Fat gm.
CHO gm.
Calcium mg.
Iron mg.
Carotene µg.
Fibre gm.
Vit. B1
mg.
Vit. B2
mg. Vit. C mg.
Folic acid µg.
(Morning) Ruti 4 Piece 120 278.40 9.60 1.20 56.40 39.60 9.60 24.00 1.20 0.36 0.24 0.00 28.80 Egg 40 62.40 7.04 3.72 0.20 2.20 0.60 300.80 0.00 0.02 0.05 0.00 31.68 Vegetable: Group A (Raw) 50 21.00 1.00 0.50 3.50 46.50 2.50 2078.50 1.00 0.00 0.00 19.50 7.50 Fruit: Group A 40 38.80 0.44 0.12 9.00 10.92 0.72 36.56 0.60 0.08 0.04 35.56 0.00 11 Am Muri/Biscuit 30 106.20 2.25 0.03 24.18 6.90 1.98 0.00 0.09 0.06 0.04 0.00 0.00 Fruit: Group B (Any One) 30 29.10 0.33 0.09 6.75 8.19 0.54 27.42 0.45 0.06 0.03 26.67 0.00 Noon Bhat 5 Cup 450 549.00 9.45 0.45 118.35 13.50 5.85 0.00 0.45 0.45 0.00 0.00 0.00 Fish/Meat 1 Piece (Small) 30 42.30 10.11 1.20 0.50 91.73 1.29 27.90 0.00 0.01 0.03 1.05 4.86 Dhal (2 Cup Medium Ghono) 30 103.20 7.05 0.54 17.52 25.38 2.10 28.32 0.51 0.14 0.10 0.03 29.82 Vegetable: Group A (Raw) As Wish 40 16.80 0.80 0.40 2.80 37.20 2.00 1662.80 0.80 0.00 0.00 15.60 6.00 Vegetable:Group B (Any One) 40 25.20 0.80 0.40 4.80 22.00 0.40 444.80 0.80 0.00 0.00 2.80 10.80 Afternoon Milk 1 Cup 120 80.40 3.84 4.92 5.28 156.00 0.24 20.40 0.00 0.06 0.23 2.40 10.20 Night Atar Ruti 5 Piece 150 348.00 12.00 1.50 70.50 49.50 12.00 30.00 1.50 0.45 0.30 0.00 36.00 Fish/Meat I Piece (Small) 30 42.30 10.11 1.20 0.50 91.73 1.29 27.90 0.00 0.01 0.03 1.05 4.86 Dhal (2 Cup Medium Ghono) 30 103.20 7.05 0.54 17.52 25.38 2.10 28.32 0.51 0.14 0.10 0.03 29.82 Vegetable: Group A (Raw) As Wish 50 21.00 1.00 0.50 3.50 46.50 2.50 2078.50 1.00 0.00 0.00 19.50 7.50 Oil 37 333.00 0.00 37.00 0.00 0.00 0.00 0.00 0.00 0.00 0.00 0.00 0.00 Total 1317 2200.30 82.87 54.31 341.29 673.22 45.71 6816.22 8.91 1.86 1.18 124.19 207.84
School of Science and Technology 86

Nutrition and Dietetics
Table 25: Food table 8 for diabetic person
Food items
Weight gm.
Energy Kcal.
Protein gm.
Fat gm.
CHO gm.
Calcium mg.
Iron mg.
Carotene µg.
Fibre gm.
Vit. B1
mg.
Vit. B2
mg. Vit. C mg.
Folic acid µg.
(Morning) Ruti 5 Piece 150 348.00 12.00 1.50 70.50 49.50 12.00 30.00 1.50 0.45 0.30 0.00 36.00 Egg 40 62.40 7.04 3.72 0.20 2.20 0.60 300.80 0.00 0.02 0.05 0.00 31.68 Vegetable: Group A (Raw) 50 21.00 1.00 0.50 3.50 46.50 2.50 2078.50 1.00 0.00 0.00 19.50 7.50 Fruit: Group A 40 38.80 0.44 0.12 9.00 10.92 0.72 36.56 0.60 0.08 0.04 35.56 0.00 11 Am Muri/Biscuit 30 106.20 2.25 0.03 24.18 6.90 1.98 0.00 0.09 0.06 0.04 0.00 0.00 Fruit: Group B (Any One) 30 29.10 0.33 0.09 6.75 8.19 0.54 27.42 0.45 0.06 0.03 26.67 0.00 Noon Bhat 5.5 Cup 500 610.00 10.50 0.50 131.50 15.00 6.50 0.00 0.50 0.50 0.00 0.00 0.00 Fish/Meat 2 Piece (Small) 60 84.60 20.22 2.40 0.99 183.45 2.58 55.80 0.00 0.02 0.06 2.10 9.72 Dhal (2 Cup Medium Ghono) 30 103.20 7.05 0.54 17.52 25.38 2.10 28.32 0.51 0.14 0.10 0.03 29.82 Vegetable: Group A (Raw) As Wish 40 16.80 0.80 0.40 2.80 37.20 2.00 1662.80 0.80 0.00 0.00 15.60 6.00 Vegetable:Group B (Any One) 40 25.20 0.80 0.40 4.80 22.00 0.40 444.80 0.80 0.00 0.00 2.80 10.80 Afternoon Milk 1 Cup 120 80.40 3.84 4.92 5.28 156.00 0.24 20.40 0.00 0.06 0.23 2.40 10.20 Night Atar Ruti 5 Piece 150 348.00 12.00 1.50 70.50 49.50 12.00 30.00 1.50 0.45 0.30 0.00 36.00 Fish/Meat I Piece (Small) 30 42.30 10.11 1.20 0.50 91.73 1.29 27.90 0.00 0.01 0.03 1.05 4.86 Dhal (2 Cup Medium Ghono) 30 103.20 7.05 0.54 17.52 25.38 2.10 28.32 0.51 0.14 0.10 0.03 29.82 Vegetable: Group A (Raw) As Wish 50 21.00 1.00 0.50 3.50 46.50 2.50 2078.50 1.00 0.00 0.00 19.50 7.50 Oil 40 360.00 0.00 40.00 0.00 0.00 0.00 0.00 0.00 0.00 0.00 0.00 0.00 Total 1430 2400.20 96.43 58.86 369.04 776.35 50.05 6850.12 9.26 2.01 1.27 125.24 219.90
Bangladesh Open University 87

Table
Table 26: Food table 9 for diabetic person
Food items
Weight gm.
Energy Kcal.
Protein gm.
Fat gm.
CHO gm.
Calcium mg.
Iron mg.
Carotene µg.
Fibre gm.
Vit. B1
mg.
Vit. B2
mg. Vit. C mg.
Folic acid µg.
(Morning) Ruti 5 Piece 150 348.00 12.00 1.50 70.50 49.50 12.00 30.00 1.50 0.45 0.30 0.00 36.00 Egg 40 62.40 7.04 3.72 0.20 2.20 0.60 300.80 0.00 0.02 0.05 0.00 31.68 Vegetable: Group A (Raw) 50 21.00 1.00 0.50 3.50 46.50 2.50 2078.50 1.00 0.00 0.00 19.50 7.50 Fruit: Group A 40 38.80 0.44 0.12 9.00 10.92 0.72 36.56 0.60 0.08 0.04 35.56 0.00 11 Am Muri/Biscuit 30 106.20 2.25 0.03 24.18 6.90 1.98 0.00 0.09 0.06 0.04 0.00 0.00 Fruit: Group B (Any One) 30 29.10 0.33 0.09 6.75 8.19 0.54 27.42 0.45 0.06 0.03 26.67 0.00 Noon Bhat 6 Cup 540 658.80 11.34 0.54 142.02 16.20 7.02 0.00 0.54 0.54 0.00 0.00 0.00 Fish/Meat 2 Piece (Small) 60 84.60 20.22 2.40 0.99 183.45 2.58 55.80 0.00 0.02 0.06 2.10 9.72 Dhal (2.5 Cup Medium Ghono) 45 154.80 10.58 0.81 26.28 38.07 3.15 42.48 0.77 0.22 0.15 0.05 44.73 Vegetable: Group A (Raw) As Wish 50 21.00 1.00 0.50 3.50 46.50 2.50 2078.50 1.00 0.00 0.00 19.50 7.50 Vegetable:Group B (Any One) 40 25.20 0.80 0.40 4.80 22.00 0.40 444.80 0.80 0.00 0.00 2.80 10.80 Afternoon Milk 1 Cup 120 80.40 3.84 4.92 5.28 156.00 0.24 20.40 0.00 0.06 0.23 2.40 10.20 Night Atar Ruti 5 Piece 150 348.00 12.00 1.50 70.50 49.50 12.00 30.00 1.50 0.45 0.30 0.00 36.00 Fish/Meat I Piece (Mediuml) 34 47.94 11.46 1.36 0.56 103.96 1.46 31.62 0.00 0.01 0.03 1.19 5.51 Dhal (2 Cup Medium Ghono) 30 103.20 7.05 0.54 17.52 25.38 2.10 28.32 0.51 0.14 0.10 0.03 29.82 Vegetable: Group A (Raw) As Wish 50 21.00 1.00 0.50 3.50 46.50 2.50 2078.50 1.00 0.00 0.00 19.50 7.50 Oil 50 450.00 0.00 50.00 0.00 0.00 0.00 0.00 0.00 0.00 0.00 0.00 0.00 Total 2600.44 102.3 69.43 389.08 811.77 52.29 7283.70 9.76 2.12 1.33 129.30 236.96
School of Science and Technology 88

Nutrition and Dietetics
Table 27: Food table 10 for diabetic person
Food items
Weight gm.
Energy Kcal.
Protein gm.
Fat gm.
CHO gm.
Calcium mg.
Iron mg.
Carotene µg.
Fibre gm.
Vit. B1
mg.
Vit. B2
mg. Vit. C mg.
Folic acid µg.
(Morning) Ruti 5 Piece 150 348.00 12.00 1.50 70.50 49.50 12.00 30.00 1.50 0.45 0.30 0.00 36.00 Egg 40 62.40 7.04 3.72 0.20 2.20 0.60 300.80 0.00 0.02 0.05 0.00 31.68 Vegetable: Group A (Raw) 56 23.52 1.12 0.56 3.92 52.08 2.80 2327.92 1.12 0.00 0.00 21.84 8.40 Fruit: Group A 40 38.80 0.44 0.12 9.00 10.92 0.72 36.56 0.60 0.08 0.04 35.56 0.00 11 Am Muri/Biscuit 60 212.40 4.50 0.06 48.36 13.80 3.96 0.00 0.18 0.13 0.07 0.00 0.00 Fruit: Group B (Any One) 30 29.10 0.33 0.09 6.75 8.19 0.54 27.42 0.45 0.06 0.03 26.67 0.00 Noon Bhat 6 Cup 540 658.80 11.34 0.54 142.02 16.20 7.02 0.00 0.54 0.54 0.00 0.00 0.00 Fish/Meat 2 Piece (Small) 60 84.60 20.22 2.40 0.99 183.45 2.58 55.80 0.00 0.02 0.06 2.10 9.72 Dhal (2.5 Cup Medium Ghono) 45 154.80 10.58 0.81 26.28 38.07 3.15 42.48 0.77 0.22 0.15 0.05 44.73 Vegetable: Group A (Raw) As Wish 50 21.00 1.00 0.50 3.50 46.50 2.50 2078.50 1.00 0.00 0.00 19.50 7.50 Vegetable:Group B (Any One) 40 25.20 0.80 0.40 4.80 22.00 0.40 444.80 0.80 0.00 0.00 2.80 10.80 Afternoon Milk 1 Cup 150 100.50 4.80 6.15 6.60 195.00 0.30 25.50 0.00 0.08 0.29 3.00 12.75 Night Atar Ruti 5 Piece 180 417.60 14.40 1.80 84.60 59.40 14.40 36.00 1.80 0.54 0.36 0.00 43.20 Fish/Meat I Piece (Mediuml) 35 49.35 11.80 1.40 0.58 107.01 1.51 32.55 0.00 0.01 0.04 1.23 5.67 Dhal (2 Cup Medium Ghono) 30 103.20 7.05 0.54 17.52 25.38 2.10 28.32 0.51 0.14 0.10 0.03 29.82 Vegetable: Group A (Raw) As Wish 50 21.00 1.00 0.50 3.50 46.50 2.50 2078.50 1.00 0.00 0.00 19.50 7.50 Oil 50 450.00 0.00 50.00 0.00 0.00 0.00 0.00 0.00 0.00 0.00 0.00 0.00 Total 1606 2800.27 108.4 71.09 429.12 876.20 57.08 7545.15 10.27 2.29 1.48 132.27 247.77
Bangladesh Open University 89

Table
Table 28: Food table 10 for diabetic person
Food Items
Weight gm.
Energy Kcal.
Protein gm.
Fat gm.
CHO gm.
Calcium mg.
Iron mg.
Carotene µg.
Fibre gm.
Vit. B1
mg.
Vit. B2
mg. Vit. C mg.
Folic acid µg.
(Morning) Ruti 5 Piece 150 348.00 12.00 1.50 70.50 49.50 12.00 30.00 1.50 0.45 0.30 0.00 36.00 Egg 40 62.40 7.04 3.72 0.20 2.20 0.60 300.80 0.00 0.02 0.05 0.00 31.68 Vegetable: Group A (Raw) 56 23.52 1.12 0.56 3.92 52.08 2.80 2327.92 1.12 0.00 0.00 21.84 8.40 Fruit: Group A 40 38.80 0.44 0.12 9.00 10.92 0.72 36.56 0.60 0.08 0.04 35.56 0.00 11 Am Muri/Biscuit 60 212.40 4.50 0.06 48.36 13.80 3.96 0.00 0.18 0.13 0.07 0.00 0.00 Fruit: Group B (Any One) 30 29.10 0.33 0.09 6.75 8.19 0.54 27.42 0.45 0.06 0.03 26.67 0.00 Noon Bhat 6 Cup 540 658.80 11.34 0.54 142.02 16.20 7.02 0.00 0.54 0.54 0.00 0.00 0.00 Fish/Meat 2 Piece (Small) 60 84.60 20.22 2.40 0.99 183.45 2.58 55.80 0.00 0.02 0.06 2.10 9.72 Dhal (2.5 Cup Medium Ghono) 45 154.80 10.58 0.81 26.28 38.07 3.15 42.48 0.77 0.22 0.15 0.05 44.73 Vegetable: Group A (Raw) As Wish 50 21.00 1.00 0.50 3.50 46.50 2.50 2078.50 1.00 0.00 0.00 19.50 7.50 Vegetable:Group B (Any One) 40 25.20 0.80 0.40 4.80 22.00 0.40 444.80 0.80 0.00 0.00 2.80 10.80 Afternoon Milk 1 Cup 150 100.50 4.80 6.15 6.60 195.00 0.30 25.50 0.00 0.08 0.29 3.00 12.75 Night Atar Ruti 5 Piece 180 417.60 14.40 1.80 84.60 59.40 14.40 36.00 1.80 0.54 0.36 0.00 43.20 Fish/Meat I Piece (Mediuml) 35 49.35 11.80 1.40 0.58 107.01 1.51 32.55 0.00 0.01 0.04 1.23 5.67 Dhal (2 Cup Medium Ghono) 30 103.20 7.05 0.54 17.52 25.38 2.10 28.32 0.51 0.14 0.10 0.03 29.82 Vegetable: Group A (Raw) As Wish 50 21.00 1.00 0.50 3.50 46.50 2.50 2078.50 1.00 0.00 0.00 19.50 7.50 Oil 50 450.00 0.00 50.00 0.00 0.00 0.00 0.00 0.00 0.00 0.00 0.00 0.00 Total 1606 2800.27 108.4 71.09 429.12 876.20 57.08 7545.15 10.27 2.29 1.48 132.27 247.77
School of Science and Technology 90

Nutrition and Dietetics
Table 29: Food table for hart disease
Food Items
Weight gm.
Energy Kcal.
Protein gm.
Fat gm.
CHO gm.
Calcium mg.
Iron mg.
Carotene µg.
Fibre gm.
Vit. B1
mg.
Vit. B2
mg. Vit. C mg.
Folic acid µg.
Ruti/Bread 60 139.20 4.80 0.60 28.20 19.80 4.80 12.00 0.60 0.18 0.12 0.00 14.40 Vegetable (Cooked) 120 76.80 3.48 0.84 12.60 273.24 5.16 3500.40 1.92 1.68 0.13 33.60 13.56 Oil 5 45.00 0.00 5.00 0.00 0.00 0.00 0.00 0.00 0.00 0.00 0.00 0.00 Dhal/White Part Of Egg 60 69.00 4.98 0.18 11.88 14.40 1.32 31.92 0.18 0.12 0.06 0.00 17.58 Tea (Sugar,Milk) 10 44.70 1.29 1.34 6.87 3.10 0.03 0.00 0.00 0.02 0.07 0.20 0.00 Fruit (Orange/Guava/Apple 50 25.00 1.00 0.00 5.50 11.50 1.50 783.50 0.50 0.00 0.00 5.00 0.00 Before Noon (Biscuit) 10 28.90 0.47 1.66 3.04 11.50 0.35 288.00 1.15 0.00 0.00 0.25 0.00 Noon (Bhat) 225 274.50 4.73 0.23 59.18 6.75 2.93 0.00 0.23 0.23 0.00 0.00 0.00 Leafy Veg (Cooked) 60 28.20 1.80 0.00 4.80 16.20 0.60 390.00 0.00 0.00 0.00 3.00 9.00 Salad 60 13.20 0.96 0.06 2.10 8.40 0.90 0.00 0.24 0.10 0.01 3.00 8.82 Fish/Chicken 40 56.40 13.48 1.60 0.66 122.30 1.72 37.20 0.00 0.02 0.04 1.40 6.48 Mug Dhal 60 69.00 4.98 0.18 11.88 14.40 1.32 31.92 0.18 0.12 0.06 0.00 17.58 Oil 10 90.00 0.00 10.00 0.00 0.00 0.00 0.00 0.00 0.00 0.00 0.00 0.00 Night (Bread/Ruti) 60 139.20 4.80 0.60 28.20 19.80 4.80 12.00 0.60 0.18 0.12 0.00 14.40 Vegetable 60 38.40 1.74 0.42 6.30 136.62 2.58 1750.20 0.96 0.84 0.07 16.80 6.78 Salad 60 13.20 0.96 0.06 2.10 8.40 0.90 0.00 0.24 0.10 0.01 3.00 8.82 Fish/Chicken 40 56.40 13.48 1.60 0.66 122.30 1.72 37.20 0.00 0.02 0.04 1.40 6.48 Oil 7 63.00 0.00 7.00 0.00 0.00 0.00 0.00 0.00 0.00 0.00 0.00 0.00 Before Bed (Milk) 120 80.40 3.84 4.92 5.28 156.00 0.24 20.40 0.00 0.06 0.23 2.40 10.20 Sugar With Milk 12 47.76 0.00 0.00 11.93 1.44 0.00 0.00 0.00 0.00 0.00 0.00 0.00 Total 1129 1398.26 66.79 36.29 201.17 946.15 30.87 6894.74 6.80 3.65 0.96 70.05 134.10
Bangladesh Open University 91
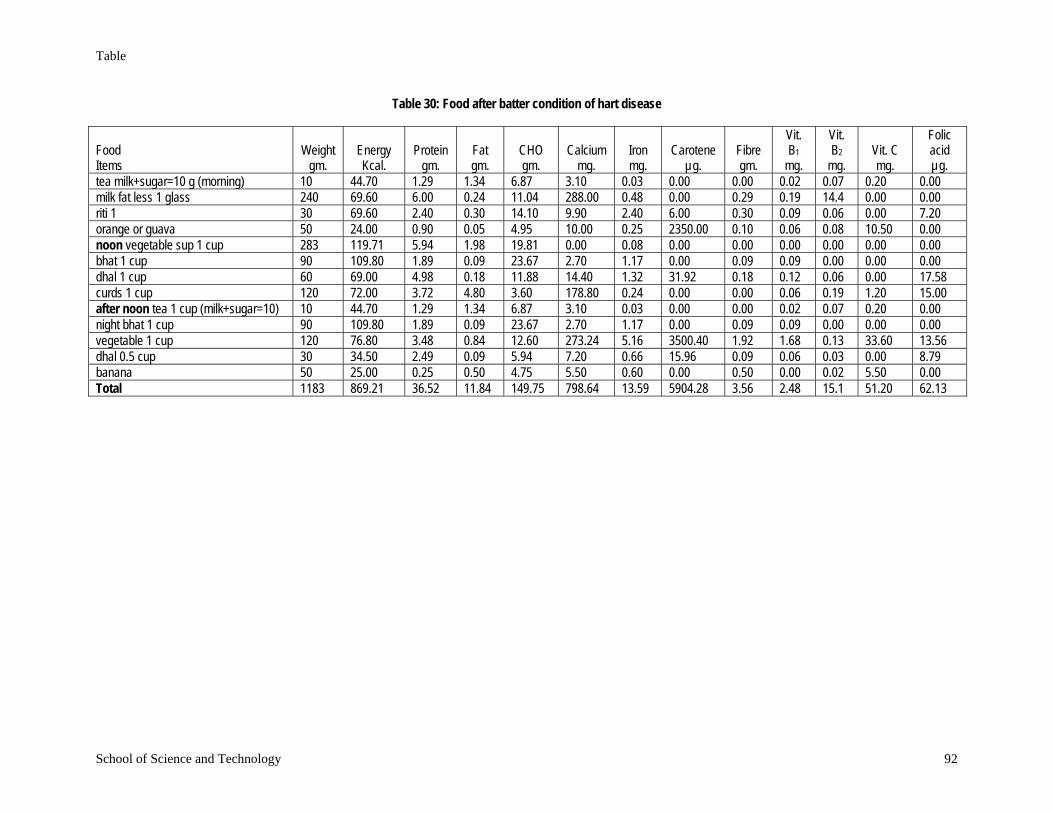
Table
Table 30: Food after batter condition of hart disease
Food Items
Weight gm.
Energy Kcal.
Protein gm.
Fat gm.
CHO gm.
Calcium mg.
Iron mg.
Carotene µg.
Fibre gm.
Vit. B1
mg.
Vit. B2
mg. Vit. C mg.
Folic acid µg.
tea milk+sugar=10 g (morning) 10 44.70 1.29 1.34 6.87 3.10 0.03 0.00 0.00 0.02 0.07 0.20 0.00 milk fat less 1 glass 240 69.60 6.00 0.24 11.04 288.00 0.48 0.00 0.29 0.19 14.4 0.00 0.00 riti 1 30 69.60 2.40 0.30 14.10 9.90 2.40 6.00 0.30 0.09 0.06 0.00 7.20 orange or guava 50 24.00 0.90 0.05 4.95 10.00 0.25 2350.00 0.10 0.06 0.08 10.50 0.00 noon vegetable sup 1 cup 283 119.71 5.94 1.98 19.81 0.00 0.08 0.00 0.00 0.00 0.00 0.00 0.00 bhat 1 cup 90 109.80 1.89 0.09 23.67 2.70 1.17 0.00 0.09 0.09 0.00 0.00 0.00 dhal 1 cup 60 69.00 4.98 0.18 11.88 14.40 1.32 31.92 0.18 0.12 0.06 0.00 17.58 curds 1 cup 120 72.00 3.72 4.80 3.60 178.80 0.24 0.00 0.00 0.06 0.19 1.20 15.00 after noon tea 1 cup (milk+sugar=10) 10 44.70 1.29 1.34 6.87 3.10 0.03 0.00 0.00 0.02 0.07 0.20 0.00 night bhat 1 cup 90 109.80 1.89 0.09 23.67 2.70 1.17 0.00 0.09 0.09 0.00 0.00 0.00 vegetable 1 cup 120 76.80 3.48 0.84 12.60 273.24 5.16 3500.40 1.92 1.68 0.13 33.60 13.56 dhal 0.5 cup 30 34.50 2.49 0.09 5.94 7.20 0.66 15.96 0.09 0.06 0.03 0.00 8.79 banana 50 25.00 0.25 0.50 4.75 5.50 0.60 0.00 0.50 0.00 0.02 5.50 0.00 Total 1183 869.21 36.52 11.84 149.75 798.64 13.59 5904.28 3.56 2.48 15.1 51.20 62.13
School of Science and Technology 92