Embed Size (px)
Citation preview
1
NWOYE M.N.
PG/M.ED/02/33742
EFFECT OF GRAPHICAL-SYMBOL APPROACH ON THE PUPILS ACHIEVEMENT AND
INTEREST IN THE TEACHING OF RATIO AT UPPER PRIMARY SCHOOL IN NSUKKA
CENTRAL LOCAL GOVERNMENT AREA
Science Education
A THESIS SUBMITTED TO THE DEPARTMENT OF SCIENCE EDUCATION, FACULTY
OF EDUCATION, UNIVERSITY OF NIGERIA, NSUKKA
Webmaster Digitally Signed by Webmaster‟s Name
DN : CN = Webmaster‟s name O= University of Nigeria, Nsukka
OU = Innovation Centre
2009
UNIVERSITY OF NIGERIA
2
EFFECT OF GRAPHICAL-SYMBOL APPROACH ON THE PUPILS
ACHIEVEMENT AND INTEREST IN THE TEACHING OF RATIO
AT UPPER PRIMARY SCHOOL IN NSUKKA CENTRAL LOCAL
GOVERNMENT AREA
BY
NWOYE M.N.
REG. NO. PG/M.ED/02/33742
DEPARTMENT OF SCIENCE EDUCATION
UNIVERSITY OF NIGERIA, NSUKKA
APRIL, 2009.
3
TITLE PAGE
EFFECT OF GRAPHICAL-SYMBOL APPROACH ON THE PUPILS
ACHIEVEMENT AND INTEREST IN THE TEACHING OF RATIO
AT UPPER PRIMARY SCHOOL IN NSUKKA CENTRAL LOCAL
GOVERNMENT AREA
BY
NWOYE M.N.
REG. NO. PG/M.ED/02/33742
A PROJECT REPORT SUBMITTED IN PARTIAL FULFILLMENT OF
THE REQUIREMENTS FOR THE AWARD OF MASTERS’ DEGREE IN
MATHEMATICS EDUCATION TO THE DEPARTMENT OF SCIENCE
EDUCATION
UNIVERSITY OF NIGERIA. NSUKKA
APRIL, 2009.
4
CERTIFICATION
NWOYE M.N., a post graduate student in the department of science Education
with registration number PG/M.ED/02/33742 has satisfactorily completed the
requirements for the course and research work for the degree of MASTER IN
MATHEMATICS EDUCATION. The work embodied in this thesis is original and
has not been submitted in part or full for any other Diploma or Degree of this or
any other university.
--------------------------- ------------------------------
NWOYE M.N. Dr. K.O.Usman
Student supervisor

5
DEDICATION
I dedicate this work to the Almighty God.
6
ACKNOWLEDGEMENTS
I acknowledge the perception from the Almighty God who gave me the
strength and sustained me throughout the period of this work of facts findings. My
special and unreserved appreciation goes to Dr. K.O. Usman, my Project
Supervisor, who guided and directed me in carrying out this project. I thank him
mostly for this inspiration, encouragement, professional comments and correction
which made this work to be successful. I also extend my greeting to Dr Mrs C.R.
Nwagbo and Dr. Z.C. Njoku who were my content and design readers, may
Almighty God bless you. My gratitude also goes to my husband and children for
moral, financial and spiritual support which helped me to complete this work.
A special thanks goes to my dear friend, Association Prof Nkadi, Onyegegbu
for her academic advice and guidance. I also extended the thanks to my course-
mates, Mrs, Ijeoma Eze, Mrs. Euginia Onyishi, Mr. Innocent Onyeabor, Mrs.
Foluke Eze, Mrs Angy Ogboinna and Mr Uloko for the encouragement they gave
me which helped me to finish this work. May the Almighty God bless all of you
for your immense contributions in the completion of this work.
Nwoye Mercy Ngozi (Mrs)
2006.
7
LIST OF TABLE
Table 1: An illustration of non-randomized control group. Pretest-posttest design --
------------------------------------------------------------------------- 39
Table 2: Table of Specification for content validation on ratio achievement
Test ------------------------------------------------------------------------- 42
Table 3: Mean and standard Deviation of pupils achievement score of subjects on
ration test. ----------------------------------------------------------------- 45
Table 4: Mean and standard deviation of pupils interest rating score of subjects in
ratio inventory. ----------------------------------------------------------- 47
Table 5: Mean achievement score and standard Deviation of male and female
pupils in ratio test. ---------------------------------------------------------- 48
Table 6: Mean and standard Devotion of male female pupils in ratio interest
inventory ----------------------------------------------------------------------- 50
Table 7: Analysis of covariance for Hypothesis 1 and 3 on pupils achievement
score in ratio test. --------------------------------------------------------------- 51
Table 8: Analysis or covariance for Hypothesis 2 and 4 on pupils gender interest
rating ----------------------------------------------------------------------------- 53
8
ABSTRACT
The aim of this study is to find out the effect of graphical symbol approach in ratio
learning in upper primary school in Nsukka Central Local Government Area. Two
instruments Achievement Test in Ratio and Ratio interest inventory were used for
data collection. The data were analyzed using mean and standard deviation. And
mean hypothesis was tested by using ANCOVA. The findings showed that pupils
learn ratio better with graphical symbol approach. Graphical-symbol approach
motivates the pupils‟ interest in ratio and mathematics learning in general. Pupils
more epically females learn mathematics better with manipulative materials. On
the basis of the findings of this study, the research made some recommendations
which include: The effect of graphical-symbol approach in base-system, and with
the use of computer in the society. It was discovered that children are now more
exposed than before. Some topics, in the junior secondary schools mathematics
curriculum such as Quadratic Equation, factorization can be introduced in the
primary school mathematics curriculum to find out how it will work out.
9
TABLE OF CONTENT
TITLE PAGE ----------------------------------------------------------------------------- I
APPROVAL PAGE -------------------------------------------------------------------- II
CERTIFICATION ----------------------------------------------------------------------III
ACKNOWLEDGMENTS -------------------------------------------------------------IV
TABLE OF CONTENTS -------------------------------------------------------------- V
LIST OF TABLES ---------------------------------------------------------------------VI
ABSTRACT ----------------------------------------------------------------------------VII
CHAPTER ONE
INTRODUCTION
Background of the Study --------------------------------------------------------------- 1
Statement of the Problem ---------------------------------------------------------------6
Purpose of the Study ---------------------------------------------------------------------7
Significance of the study --------------------------------------------------------------- 8
Scope of The Study ----------------------------------------------------------------------9
Research Question --------------------------------------------------------------------- 10
Hypothesis ------------------------------------------------------------------------------ 10
CHAPTER TWO
LITERATURE REVIEW
Theoretical/Conceptual Framework ------------------------------------------------- 12
Empirical Studies ---------------------------------------------------------------------- 12
Summary----------------------------------------------------------------------------------12
Models and Modeling in Primary School Mathematics Learning ----------------15
Graphical Representation in Mathematics Learning --------------------------------24
Approach to Mathematics teaching and Learning --------------------------------- 25
Empirical Studies------------------------------------------------------------------------27
Instructional Materials on Pupils Achievement in Mathematics Learning------ 27
Models and Modeling on Pupils Achievement in primary school
mathematics ---------------------------------------------------------------------------- 30
graphic representation in primary school Mathematics learning ---------------- 33
Summary and reviewed related literature ------------------------------------------- 35
CHAPTER THREE
RESEARCH METHOD
Design of this study -------------------------------------------------------------------- 38
Area of study ----------------------------------------------------------------------------39
Population of the study -----------------------------------------------------------------40
Sample and sampling techniques -----------------------------------------------------40
Instrument for data collection ---------------------------------------------------------40
10
Validation of the instrument -----------------------------------------------------------41
Reliability of instrument ---------------------------------------------------------------42
Experimental procedure --------------------------------------------------------------- 43
Lesson note ----------------------------------------------------------------------------- 43
Method of analysis -------------------------------------------------------------------- 44
CHAPTER FOUR
RESULTS
Summary--------------------------------------------------------------------------------- 54
CHAPTER FIVE
DISCUSSION, CONCLUSIONS IMPLICATION, LIMITATION,
RECOMMENDATION SUGGESTIONS FOR FURTHER RESEARCH
AND SUMMARY OF THE STUDY.
Discussion ------------------------------------------------------------------------------ 56
Conclusion ------------------------------------------------------------------------------ 57
Implication ------------------------------------------------------------------------------ 58
Limitation of the study ---------------------------------------------------------------- 59
Recommendation ----------------------------------------------------------------------- 60
Suggestions for further research ----------------------------------------------------- 61
Summary of the study. ---------------------------------------------------------------- 61
REFERENCES ----------------------------------------------------------------------- 64
APPENDICES

11
12
CHAPTER ONE
INTRODUCTION
Background of the Study
Primary school is the `critical starting point for formal structured instruction.
The general and relevant objectives of the primary education had been setout in the
Natural Policy on education (Federal Republic of Nigeria (FRN, 2004). The
content of the primary education mathematics curriculum had been drawn to reflect
these policies on education. According to Betiku (2002), the committee that
worked on the primary mathematics curriculum had taken cognizance of the
limitation of time, lack of teaching aids, the influence of the environment on the
village child, levels of teachers involved and teaching methods for effective
teaching and learning of mathematics in the primary school.
Primary school is the foundation on which further learning in the discipline
of mathematics is based. Therefore, a weak mathematics learning foundation at
primary school level may lead to poor attitude, low interest, low participation and
poor achievement in mathematics at higher level of education. Therefore, effective
teaching of primary school mathematics should not be compromised. Mathematics
which is the key to all sciences has some problems in teaching and learning. Some
studies have been carried out on the causes of these problems by some earlier
researchers.
The problem of mathematics teaching and learning, according to Usman
(2002) can be classified into two. The first is called Micro-problems or problem
13
which are internal to mathematics education. These problems are related to
curriculum, teacher training, text books, use of calculator, problem solving and the
like. The second classification is called macro-problem. These are problems
associated with pressure from other sections of the society and they include
economical, political, cultural and language problems. Other researched in
mathematics education had earlier identified some other problems on related
teaching and learning of mathematics to include: those related to students, teachers,
nature of the subject (mathematics), text books, instructional materials, classroom
environment, society, the school and finally gender.
Gender has a serious effect on mathematics teaching and learning, both on
the side of the pupils and the teachers. Normally, boys performed better than girls
in mathematics learning. Some of the previous studies have proved that. Harbor
Peters (2001) in her study on influence of gender in mathematics teaching and
learning, found out that boys performed better than girls in mathematics learning
mostly before the age of eleven which is primary school age. With that gender
problem, primary school teachers who are more of females cannot teach some
difficult concepts very well because of their poor perception of mathematics.
Therefore, mathematics teaching and learning have already started having
problems from primary school.
As Science Technology and Mathematics (STM) are the bedrock of any
technological development in any economy, Nigeria is no exception to this belief.
14
Therefore, STM education have been planned to commence from the primary
school level, which is the foundation of education. According to Betiku (2002) the
relevant skill acquisition ought to have been solidly laid from the primary school,
since the rest of the system is built on the primary foundation. Besides, primary
level is the key to the success or failure of the whole educational system. This
calls for concerned effort for improving teaching and learning of mathematics if
success is to be achieved.
However, a lot of efforts have been made to improve the teaching and
learning of mathematics at all levels, especially the primary and secondary schools.
Despite all these effort, mathematics has a reputation of being difficult to teach and
learn. In an attempt to reduce all these doubtful situations, bold steps had been
taken to upgrade the teaching of primary school mathematics. The main features
of those bold steps included curriculum, material production in form of syllabuses,
course outline, pupil textbooks, pupils workbooks, teachers guide and training
manual. Despite all these bold attempts and others, pupils‟ performance and
interest in mathematics have been discouraging. One of the factors responsible for
the poor performance and lack of interest is poor teaching strategies adopted by
mathematics teachers, especially at primary school level, who are mainly female
teachers. Normally, females are always poor in mathematics learning, so their
perceptions in the teaching of mathematics will also be poor. For that, primary
school mathematics teaching should be enriched with manipulative materials.
15
Moreover, based on Piaget theory of learning age and its attendant
characteristics hold that children in primary schools are concrete operators
requiring real model or illustrative objects to learn better at this level. Besides,
children between the ages of 5 to 12 years (the period of primary education for
normal children) respond positively when motivated to learn. This is possible
when source of motivation is also the object or concept being studied. The
corollary is that the provision of concrete object for teaching of primary school
mathematics had dual roles in facilitating learning by making abstract concepts real
and meaningful in the learners, and by serving as a good source of motivation.
Unfortunately, not in all concepts, can primary school mathematics teachers
be able to bring real or concrete objects to class for use as teaching aids. Again,
the difficulty is more pronounced with abstract concepts hanging which teachers
cannot handle conveniently. Notable examples of these concepts are symmetry,
place value, addition, subtraction, number system, geometry, probability and ratio.
According to Obodo (2002), the abstractness of these concepts requires so much
resources such as concrete materials in teaching the concepts.
The use of instructional materials in the teaching and learning of
mathematics cannot be overemphasized. This is because mathematics by its very
nature is abstract and extra efforts are required to bring students to understanding
concepts, principles and applications (Usman, 2002). Furthermore, many
principles and concepts in mathematics are not easily explained with common
16
sense deduction or reasoning. This fact obviously adds to the difficulty pupils
encountered in the comprehension of mathematics generally.
Ratio is one of the concepts in mathematics that is very difficult to
understand. According to Betiku (2001), ratio has a wide range of application and
it cuts across so many aspects of life. The concept (ratio) is included in the
primary school curriculum for the attainment of one of the primary school
mathematics objectives. Besides, ratio is introduced only at the upper part of
primary education so as to give room for full development of a child and quick
understanding of the concept.
However, despite the pupil‟s psychological developmental considerations in
the introduction of ratio, the pupils‟ performance in the concept (ratio) still remain
very poor. According to Ale, S. O and Salau (2001), pupils‟ in primary schools
find it difficult to comprehend the concept of ratio and do perform poorly in the
concept. Factors responsible for the poor performance according to Ale et al. have
been traced to lack of appropriate instructional materials for teaching the concept.
Such instructional materials include graph, and so many others.
The use of graph has provided a great deal of opportunity to teach some
difficult concepts in mathematics at primary school level in particular. According
to Ohuche (1990), the use of graph has been very successful for the teaching of
some concepts in mathematics that are very difficult. These concepts, Ohuche
continued, include-area, fraction and proportion. This is because, graph tend to be
17
quicker in conveying the required information. The nature of graph makes it very
easy to use for the illustration of information. For instance, a graph page is made
of several square units along several rows and columns. These features made the
use of graph for teaching concepts like area, and population very easy and
interesting (Ohuche, 1990).
Based on the above attributes, the researcher intends to use graph for the
teaching of ratio, to see if it could enhance the teaching and learning of the
concept, as well as promote pupils‟ interest in the concept. Similarly, the use of
the graph is also expected to have some effect of the pupils‟ interests in learning of
ratio.
Statement of the Problem
Primary school has been described as the foundation on which further
learning in life is built. The teaching and learning of mathematics in primary
school, marks the beginning of the subject that its usefulness cuts across all facts of
life. As primary mathematics is the bedrock for further mathematics learning. The
mathematics curriculum is arranged hierarchically so that the mathematics concept
will have links from primary school to tertiary level respectively. Besides, the
hierarchical nature of mathematics curriculum, there is a need for good
understanding of the foundation level of mathematics in primary school level
which will enable further mathematics learning to be effective. To achieve that,
the teaching of mathematics requires the use of instructional materials not only
18
because of the developmental stages of the pupils, but also for better understanding
of various concepts to be taught. However, there are some topics that some
teachers find difficult to teach without instructional materials. These topics
include area, proportion and ratio. Some researcher has successfully used graphs
to teach some concepts such as area and proportion. The use of graph on those
concepts has been reported to have a positive effect on the students.
However, there is no available study to the knowledge of the researcher on
the use of graphs in teaching ratio. Therefore, this study is designed to determined
the effect of graphical symbol approach on the pupils‟ achievement and interest in
the teaching of ratio at upper primary school.
Purpose of the Study
The main purpose of this study is to determine the effect of graphical symbol
approach on primary school pupils achievement and interest in ratio learning.
Specially, the study intends to determine.
The effect of the graphical-symbol approach on the mean achievement
scores of the primary school pupils‟ in ratio.
The effect of the graphical-symbol approach on the mean interest rating of
the primary school pupils‟ in ratio.
The influence of gender on the achievement of pupils taught using
graphical-symbol instruction.
19
The influence of gender on the interest of the pupils‟ taught, using graphical
symbol instruction.
Significance of the Study
The fact that primary school mathematics is the foundation for other levels
in mathematics, emphasis are to be laid on effective teaching of mathematics from
the primary schools. Besides, the hierarchical nature of mathematics curriculum
there is a need also for calls for good understanding of the foundation nature of
mathematics at the primary school level. Therefore, this study will make a
significant contribution to the teaching and learning of mathematics at primary
school level.
It is expected that the following group of people would benefit from the
result of this study; the primary school pupils, the primary school teachers, and the
curriculum planners. The benefit for the pupils may result from the better
understanding of the concept (ratio) when it is taught by graphical-symbol
approach and discovered that there will be a positive effect on the achievement and
interest of the primary school pupils, more especially girls who do not naturally
perform well in mathematics and science related subjects. This is because there
may be no better achievement without better understanding of a concept. It has
also been revealed by various researchers that interest is directly related to
achievement in various life endeavours.
20
Similarly, teachers may also benefit from the study, if the use of graphical
symbol is of positive effect on pupils achievement and interest. This is because it
would serve as an additional approach to the teaching of mathematical concepts.
The curriculum planner may also find the study very beneficial in the sense
that the planning of primary school curriculum would be made to include the
approach that would promote better understanding of such concept like ratio. In
other words, the curriculum planners may recommend the graphical-symbol
approach for the teaching of ratio at primary school level.
Scope of the Study
The study will be limited to upper primary school pupils in Nsukka Central
Local Government Area of Enugu State. Besides, the topics to be covered would
include:
Division of ratio
Equivalent ratio
Missing addends in ratio relationship
Research Questions
The following research questions were based to guide the study:-
(1) What is the mean achievement score of the pupils taught ratio with
graphical-symbol instruction and those taught with conventional method?
(2) What is the mean interest rating of pupils taught ratio with graphical
symbol instruction and those taught with conventional method?

21
(3) To what extent does gender influence the mean achievement of the pupils
taught ratio using graphical-symbol approach?
(4) To what extent does gender influence the interest rating of pupils taught
ratio using graphical symbol approach?
Hypothesis
HO1: There is no significant difference in the mean achievement score of the
pupils taught ratio with graphical-symbol approach and those taught with
conventional method.
HO2: There is no significant difference in the mean interest rating of the pupils
taught ratio with graphical-symbol approach and those taught with
conventional method.
HO3: There is no significant difference in the mean achievement score of the
male and female pupils taught ratio with graphical-symbol instruction.
HO4: There is no significant difference in the mean interest rating of the male and
female pupils.
22
CHAPTER TWO
LITERATURE REVIEW
In reviewing of the related literature, the researcher organized the work
under these sub-headings:-
Theoretical/Conceptual Framework
Learning Theories on Instructional material
Models and modeling in school mathematics learning
Graphical representation and school mathematics learning
Approaches to mathematics teaching/learning
Empirical Studies
Instructional materials and pupils achievement in primary mathematics
Models and modeling on pupil‟s achievement in primary school
mathematics
Graphical representation and pupils achievement in primary school
mathematics.
23
Summary
Theoretical/Conceptional Framework
Learning Theories on Instructional Materials
Mathematics Instructional materials are animated or inanimate objects that
assist the teacher in making mathematical concept skill more meaningful and
understandable to the learner (Ashforth, 1997).
Piaget (1971) as an educational psychologists and child development in
learning, in his own theory of learning stated that, “subjectivity of representation in
child development is encouraging the use of concrete models in teaching and
learning of mathematics from primary school level”. Piaget further said that
learning goes well from concrete to abstract. According to Jean proper use of
concrete model could promote the broad goals alluded in mathematics learning.
He made coherent rational for the use of concrete models in the learning of
mathematics. Primary school pupils who ware mainly at age of concrete
operational stage according Piagets need to learn more with instructional materials.
Brunner (1976) in his constructivist theory, stated that learning is an active
process in which learner construct new ideas or concepts based on their current or
past knowledge. Bruner as cited (Kearsely, 1994b), who said that, “instructional
materials are used to provide the meaning and organization to experiences and
allow the individual to go beyond the information given”. According to Bruner,
the teacher should try and encourage pupils to construct hypotheses, make
24
decisions and discover principles by themselves. Bruner (1976, as cited in Kearly
1994b) stated that, a theory of instruction should address the following aspects.
The most effective sequences in which to present materials
The ways in which a body of knowledge can be instructed so that is can be
most readily grasped by the learner, i.e. through instructional materials.
Gagne (2004) in his theory on instructional material was particularly
influenced in the training and the design of instructional materials in teaching and
learning. According to Gagne (1999), “a variety of learning activities should
enforce effective learning”. Gagne further said that instructional designer should
anticipate and accommodate alternate learning styles by systematically varying
teaching and assessment methods to reach every pupil to achieve Gagne‟s theory
instructional materials are to be used in mathematics teaching and learning.
A review of literature indicates that many people emphasize the importance
of instructional materials in promoting meaningful mathematics instruction. The
use of instructional materials is not new (Grossman, 2000). Grossman further
points out that because of the importance of instructional materials in teaching and
learning, educationists have been advised in 1885 to employ manipulative
materials in teaching concepts in mathematics.
Damisa (1987) stated that for a mathematics teacher to achieve his objective
in the classroom, he must find other devices for the students to see, touch, hear and
make use of these devices, but the time allocated to mathematics, may at times,
25
obstruct the seeing and using of these devices provided. Balogun (1997), observed
that failure by teachers to use appropriate instructional materials, poor teaching
methods, such as lecture and direct information dissemination method, make pupils
loose interest and thus perform poorly in mathematics.
Some psychologists have studied the effects of the manipulative materials on
achievement, retention, attitude and transfer of mathematical concepts. Their
findings led scholars, such as Jean Piaget, Jerome, Brunner, Gagne, to draw
conclusions on the effect of instructional materials on pupils achievement in
learning.
Models and Modeling in Primary School Mathematics Learning
Harbor-Peters (2001), conceptualized models for mathematics teaching and
learning as enriched devices which may be concrete or semi-concrete or abstract
for use by teachers to make mathematics concepts clearer to learners. Harbor
further stated that a model must posses a one-to-one correspondence relationship to
the mathematical concept being illustrated, using the model. It must be simple and
easy to use so that one does not use the teaching time for explaining the models.
With that, graphical illustration would also serve as model in mathematical
learning. In general, good models for teaching mathematical concepts are capable
of providing concrete and realistic experiences, which will help a learner to
discover facts or patterns. It creates curiosity and motivates the learners to explore
mathematics in a relaxed mood.
26
With regard to Harbor Peters view on models as instructional materials in
mathematics learning, primary school pupils would be motivated to develop
interest in ratio learning when it is properly taught with graph sheet as a model.
Obodo (1997), viewed models as, “two or three-dimensional representatives
of objects which students learn about in the class”. The use of models according to
the Obodo, provides a mental of relating past experiences to a new situation. They
employed and provide concrete and realistic experiences from which learners can
discover facts. The minds of the students will readily accept ideas that are
illustrated by concrete example. The means that models give meaning to different
concepts and relations in mathematic by associating them directly with physical
objects. It was further explained that concept of the model is restricted to mean
only those concrete devices used by mathematics teachers and students to
demonstrate mathematical concepts. Models therefore, should represent the
natural objects, they are meant to represent. Which graphical approach can do in
ratio learning.
According to Bal, (2004), mathematics models can be considered as a
simplification or abstraction of a (complex) real world problem or situation into
mathematical problem. It was further explained that mathematics problem can be
solved using whatever known techniques to obtain a mathematical solution. This
solution is then interpreted and translated into real term.
27
Gagne and Berliner, (1992), viewed a model as a visual or picture, which
highlight the main idea of a variable in a process or system. Gagne further stated
that the use of model as learning aids have two primary benefits. Firstly, models
provide accurate and useful representations of knowledge that is needed when
solving problems in some particular domain. Secondly, a model makes their
process of understanding a domain of knowledge easier because it is visual
expression of topic. It was found out that pupils who study with models may recall
as much as 57% or more on questions concerning conceptual information than
pupils who receive instruction without advantage of seeing and discussing models.
With the view of Gagne and Berliner, graphical-symbol communication will
be a useful model in ratio learning, which will help primary school pupils to
understand ratio-relationship visually, Alesandrini, (2002), came with his own idea
similar in conclusion, when he studied different pictorial-verbal strategies in
learning from his research on the effectiveness of pictorial-verbal representation.
From his own study, the learner draw their own conclusion that the act of building
the model and running the simulation gives them a deeper understanding of the
sensitivity of the cycle outside disturbances and reinforces the concepts underlying
the model.
Richard, (2002), view model as being a representation. Richard further said
that motivation might be found by providing tools for designing interactive
stimulation. Simple interaction with model provides a far more interesting
28
exercise than observation. With his definition, Graphical-symbol model will serve
as a tool in ratio learning and bring interaction stimulation on the pupils and create
more interesting exercise than through observation and passivity.
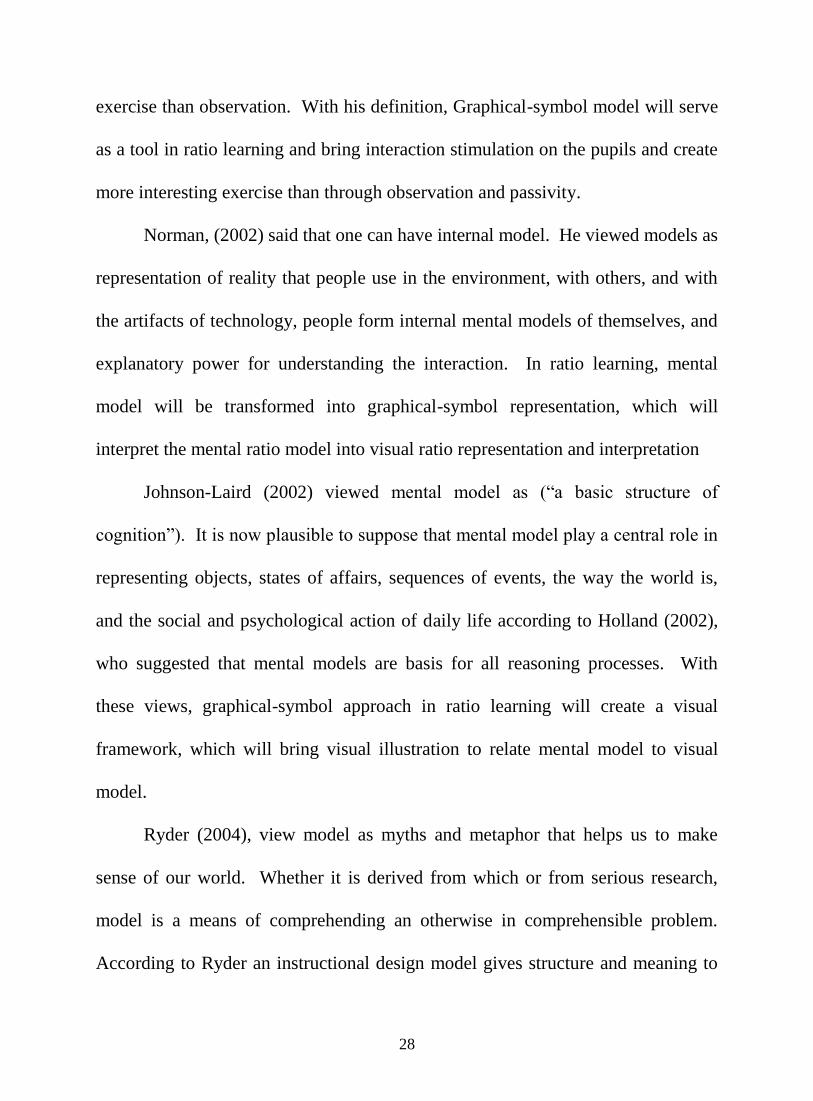
Norman, (2002) said that one can have internal model. He viewed models as
representation of reality that people use in the environment, with others, and with
the artifacts of technology, people form internal mental models of themselves, and
explanatory power for understanding the interaction. In ratio learning, mental
model will be transformed into graphical-symbol representation, which will
interpret the mental ratio model into visual ratio representation and interpretation
Johnson-Laird (2002) viewed mental model as (“a basic structure of
cognition”). It is now plausible to suppose that mental model play a central role in
representing objects, states of affairs, sequences of events, the way the world is,
and the social and psychological action of daily life according to Holland (2002),
who suggested that mental models are basis for all reasoning processes. With
these views, graphical-symbol approach in ratio learning will create a visual
framework, which will bring visual illustration to relate mental model to visual
model.
Ryder (2004), view model as myths and metaphor that helps us to make
sense of our world. Whether it is derived from which or from serious research,
model is a means of comprehending an otherwise in comprehensible problem.
According to Ryder an instructional design model gives structure and meaning to
29
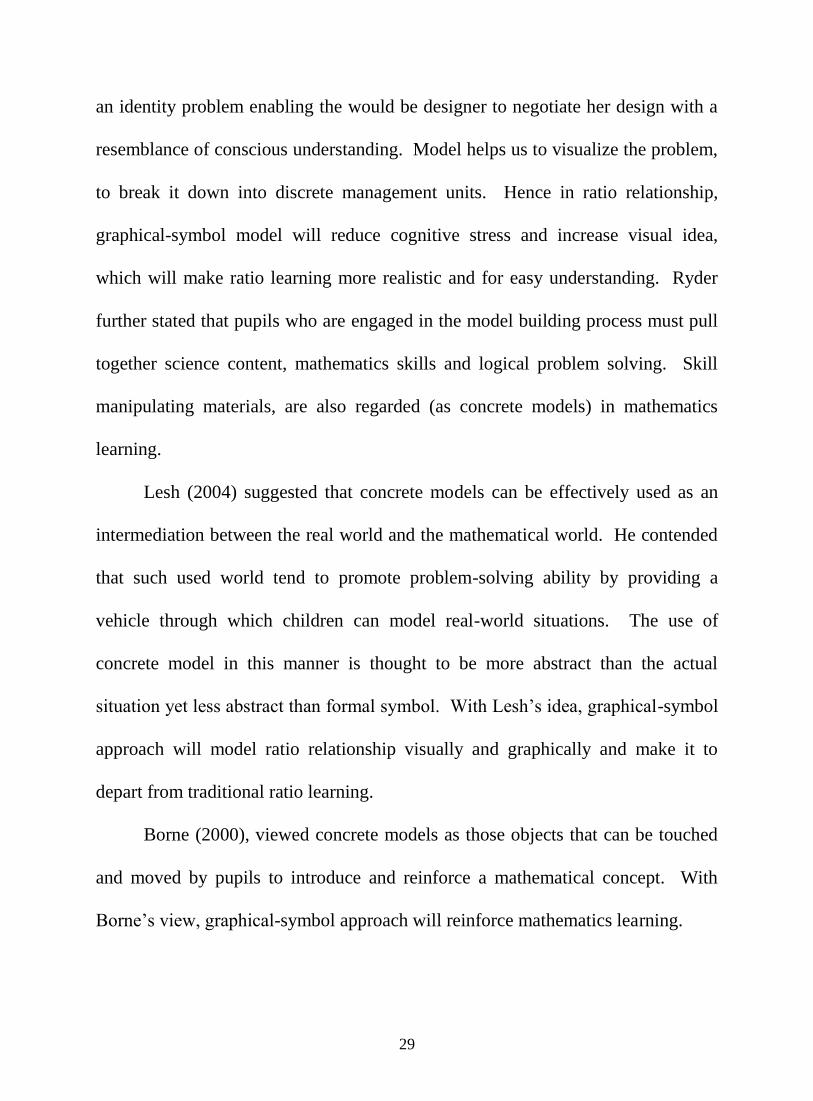
an identity problem enabling the would be designer to negotiate her design with a
resemblance of conscious understanding. Model helps us to visualize the problem,
to break it down into discrete management units. Hence in ratio relationship,
graphical-symbol model will reduce cognitive stress and increase visual idea,
which will make ratio learning more realistic and for easy understanding. Ryder
further stated that pupils who are engaged in the model building process must pull
together science content, mathematics skills and logical problem solving. Skill
manipulating materials, are also regarded (as concrete models) in mathematics
learning.
Lesh (2004) suggested that concrete models can be effectively used as an
intermediation between the real world and the mathematical world. He contended
that such used world tend to promote problem-solving ability by providing a
vehicle through which children can model real-world situations. The use of
concrete model in this manner is thought to be more abstract than the actual
situation yet less abstract than formal symbol. With Lesh‟s idea, graphical-symbol
approach will model ratio relationship visually and graphically and make it to
depart from traditional ratio learning.
Borne (2000), viewed concrete models as those objects that can be touched
and moved by pupils to introduce and reinforce a mathematical concept. With
Borne‟s view, graphical-symbol approach will reinforce mathematics learning.
30
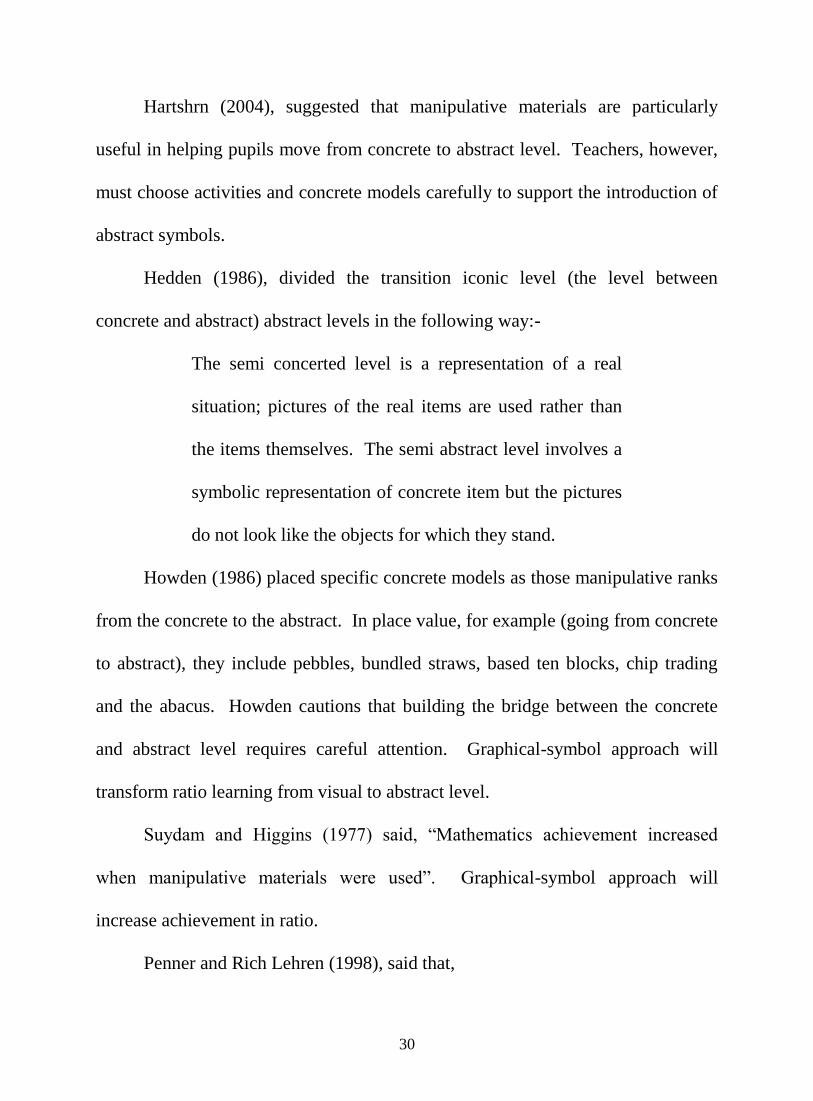
Hartshrn (2004), suggested that manipulative materials are particularly
useful in helping pupils move from concrete to abstract level. Teachers, however,
must choose activities and concrete models carefully to support the introduction of
abstract symbols.
Hedden (1986), divided the transition iconic level (the level between
concrete and abstract) abstract levels in the following way:-
The semi concerted level is a representation of a real
situation; pictures of the real items are used rather than
the items themselves. The semi abstract level involves a
symbolic representation of concrete item but the pictures
do not look like the objects for which they stand.
Howden (1986) placed specific concrete models as those manipulative ranks
from the concrete to the abstract. In place value, for example (going from concrete
to abstract), they include pebbles, bundled straws, based ten blocks, chip trading
and the abacus. Howden cautions that building the bridge between the concrete
and abstract level requires careful attention. Graphical-symbol approach will
transform ratio learning from visual to abstract level.
Suydam and Higgins (1977) said, “Mathematics achievement increased
when manipulative materials were used”. Graphical-symbol approach will
increase achievement in ratio.
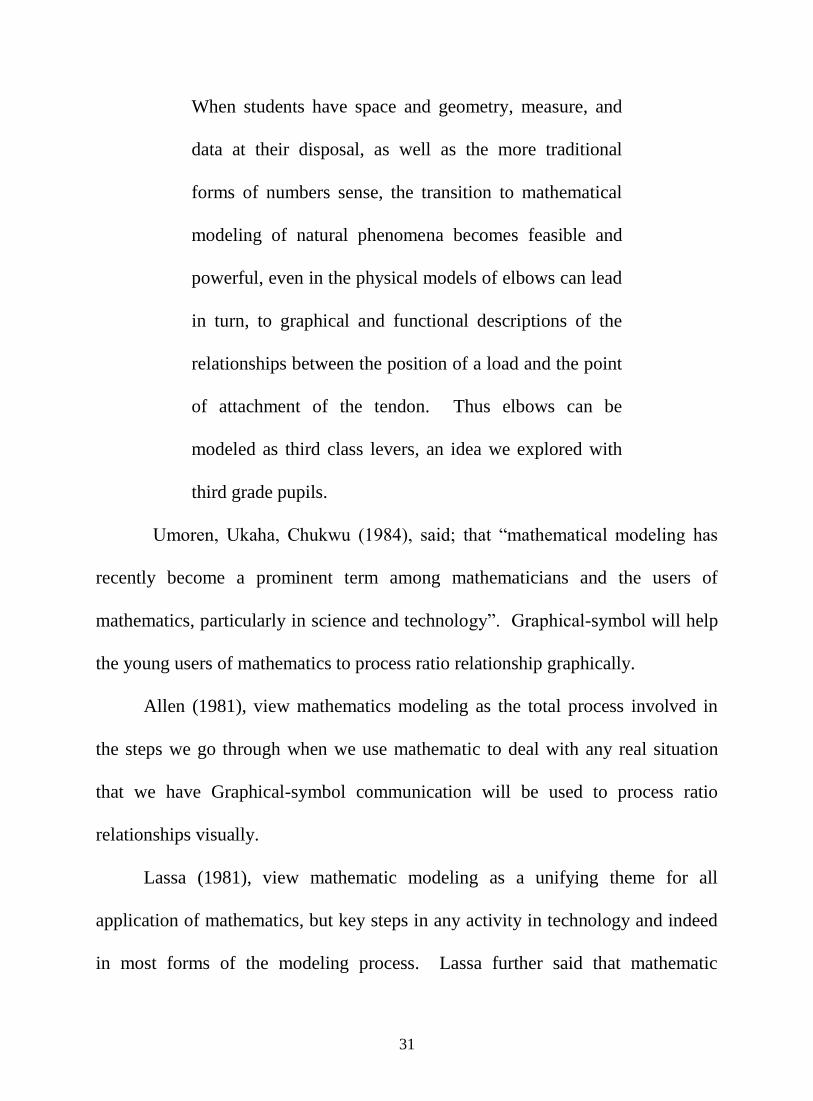
Penner and Rich Lehren (1998), said that,
31
When students have space and geometry, measure, and
data at their disposal, as well as the more traditional
forms of numbers sense, the transition to mathematical
modeling of natural phenomena becomes feasible and
powerful, even in the physical models of elbows can lead
in turn, to graphical and functional descriptions of the
relationships between the position of a load and the point
of attachment of the tendon. Thus elbows can be
modeled as third class levers, an idea we explored with
third grade pupils.
Umoren, Ukaha, Chukwu (1984), said; that “mathematical modeling has
recently become a prominent term among mathematicians and the users of
mathematics, particularly in science and technology”. Graphical-symbol will help
the young users of mathematics to process ratio relationship graphically.
Allen (1981), view mathematics modeling as the total process involved in
the steps we go through when we use mathematic to deal with any real situation
that we have Graphical-symbol communication will be used to process ratio
relationships visually.
Lassa (1981), view mathematic modeling as a unifying theme for all
application of mathematics, but key steps in any activity in technology and indeed
in most forms of the modeling process. Lassa further said that mathematic
32
modeling is one particularly powerful way of representing reality. It is usually
better in technology to have some mathematical model to be accurate. He said that
the teaching of mathematics modeling is one new approach to the teaching of
mathematics because of the need to make mathematics more relevant to everybody
life. Graphical-symbols approach will serve as a new approach in ratio learning in
primary school level.
Ang. Keng Cheng (2001), viewed mathematical modeling as a process of
representing real world problems in mathematical term in an attempt to find
solutions to the problems. Graphical-symbol communication will serve as
modeling in ratio learning, it will be a process of real world problem in ratio
relation and help the solution to graphical problem.
Mathematics Modeling Our World is founded on the principles that
mathematics is a necessary tool for understanding the physical and social worlds in
which we live. Mathematics Modeling Our World is a grade 9 – 12 curriculum,
which included the primary six mathematics curriculum, in which pupils not only
learn mathematics, they also learn to use mathematics, in solving their problems.
MMOW support that pupils are taught to use a variety of resources to solve
problems, and they learn to choose resources that meet the need of a particular
solution.
33
With the view of Mathematic Modeling Our World, graphical-symbol
communication will serve a variety resource to solve ratio problem that will meet
the need of ratio solution.
(1) English and Halford (1995), said that, modeling involves the
establishment of links among representations of a mathematical concept and its
relationship to other concepts. More importantly a model needs to externalize the
links to the learner in ways that would help him or her to visualize them.
Graphical symbol model will externalize the ratio relationship to the ways that
would help them to visualize the relationship. Furthermore, English and Halford
explained that modeling involves the deputation of the relations that are embedded
in a scheme both graphical or concretely. The modeling process could also
contribute to expansion of Networks of schemes that are associated with
mathematical concepts resulting in deeper understanding. Modeling activities
must also have an inbuilt flexibility to help children externalize constituents of a
model. These activities need to be grounded within the experiences of children,
including observation of concerts in real life contexts. Explanation would also
reveal conjecture about other situations and solved problems.
California (1989) symposium, pargarmon, view modeling as the use of a
formal language (symbolic or grammatic) to present some knowledge short.
34
Graphical-symbol communication will be used as a language to communicate ratio
relationship ideas graphically and visually.
Graphical Representation in Mathematics Learning
Mega mathematics (2004), said that when mathematics talk about graphs
they are mostly likely to be thinking of collection of dots and lines that you see in
the illustration of this section. Sometimes, graphs are called networks, and a
glance at pictures of them will show you why. Mega mathematics further added
that graph could be seen as one of the mathematical objects, which make
mathematics learning more transparent. Graphical-symbol will make ratio learning
transparent.
Graph game, (2004), show that a number is also a mathematical object that
is probably the most familiar to everyone. Some other mathematical objects are
knots maps and infinite state machine, linear graph and picture representation will
make ratio learning more transparent. The idea of graphical-symbol approach will
help pupils to make ratio relationship more transparent.
National Council of Teachers of Mathematics of American (NCTM) gave a
recommendation which includes in their goals that pupils in grades 3 – 6 should be
able to represent data using tables and graphs such as lines and pots bars graphs
and line graphs, pie chat stem graphs (standard 5, p. 178), graphical-symbol
approach will serve positively in ratio learning and the idea of linear graph should
be introduced to make a very important point about this goal of (NTCM).
35
Van de Walle (2004), suggested that teachers should not “get overly anxious
about the tedious details of graph construction”. According to Walle, teachers
should take one or two approaches to graph construction. Pupils should either be
encouraged to do their best when creating their own graphs or that student should
use technology and computer to generate exact graphs. Some types of graphs that
should be taught include bar, stem and leaf plots and continuous data graphs. Van
de Wall has been encouraging the use of graph in primary school mathematics
learning. As he had been mentioned the other types of graphs used in primary
school. Graphical-symbol approach in ratio learning will bring about the idea of
line graph in primary school mathematics learning.
Approach to Mathematics Teaching and Learning
Burner in Obodo (2004) said that after some years at least 10 years of
experience, teacher will find it difficult in helping their students to discover
mathematical ideas for themselves without involving them in activity-method.
Obodo (2002) said that approaches in mathematics teaching and learning
enable the pupils acquire mathematics skills. Some of the approaches are:
Area Title Approach: It is the type of approach whereby Tiles are used in
teaching of area to the pupils. The tiles represent the square units. Collins (1998),
„Encourage the Area Tile Models‟ Approach in teaching of area in primary school.
It will bring area learning home and realistic to children because tiles are what they
36
can see in homes and schools. It makes a mathematics learning begins from known
to unknown-from real to abstract. Which graphical-symbol method will also do in
ratio learning.
Discovery Approach: It is the type of approach whereby a pupils are guided to
build mathematics ideas, to think more to discover things by themselves. Ale in
Imoke (2005) said that discovery approach as a pupils-dominated and activity-
oriented method of teaching and learning of mathematics. With graphical-symbol
approach, discovery will be more encouraged because the pupils will be allowed
the view the graphical-representation and discover the given ratio relationship
vividly.
Laboratory Approach: This is the type of approach whereby the pupils are led to
find the importance of the mathematics tools and instructional material, which they
have in learning mathematics. Usman (2002) emphasized that the pupils are made
to carry out some measurements often using simples equipment such as rulers and
compass, collect data by experimentation or discovery, making drawing and
models, make computational devices, and perform experiments with materials. The
graphical-symbol approach will also encourage this approach more because some
of the materials such as graph sheets, ruler, and pencils are to be used in plotting of
the graphic in ratio relationship.
37
Target-task Approach: In this approach the pupils will first of all give some
hander topic to solve which they may or may not be able to solve. After that an
easier problem will be solved with help of the teacher‟s guidance.
With graphical-symbol approach, some difficult ratio problems which have
been given to the pupils to solve can now be solved graphically and easier with a
simpler understanding.
Small-group Approach: This approach is the type of approach whereby a
mathematics teacher group pupils in smaller groups during mathematics learning.
For graphical symbol approach, small group approach will be more effective
because the teacher will group the pupils and give them some ratio problems to
plot graphically.
Empirical Studies
Instructional Materials on Pupils Achievement in Mathematics Learning
Okorie, Onuoha, Anayanwu and Ugochukwu (1989) researched on, “the
extent of use of visual aids in the teaching of mathematics in Okigwe and Owerri
Educational Zone in Imo State. The research was a descriptive survey research.
The research was carried out in all the secondary schools in the two above-
mentioned educational zones. 55 mathematics teachers were chosen in the schools
and were used. 850 students were randomly selected from the secondary schools.
The main instrument used for the data collection was questionnaire, seven research
questions were tested, 5 hypotheses were made.
38
Two sets of questionnaire were administered to the two groups of
respondents by the researchers themselves. Pearson‟s moment correlation
technique was used to compare the response. A correlation co-efficient of 0.81
was obtained. This was considered high enough. Chi-square was employed in
data analysis. From the findings, it was concluded that visional aids are of
immense important in teaching and learning of mathematics.
They spaced the lessons and spread interest hence reducing boredom that is
often necessitated due to the abstract nature of mathematics. Instructional material
help to reduce verbalism and give a concrete touch to the teaching of mathematics.
It is often said that seeing is believing. With instructional materials students are
convincingly taught mathematical facts without necessarily imposing facts on them
and hence forcing them to cram these facts. Learning thus becomes natural and
active participation of every member of the class is ensured. A combined effect of
hearing seeing and doing will be enabling and ensuring retention.
Emmanuel C. (1977), in worked on the, “Impact of the audio-visual aids in
the teaching of mathematics”. The research was deceptive survey. It was carried
out in the secondary schools in Otukpo in Benue state. 6 schools were used out of
10 schools in the area. Interview was used to collect data from mathematics
teachers and students from the six schools.
One hypothesis was tested, which stated, schools which employ more audio-
visual aids in mathematics get better results in mathematics than those which
39
employ fewer”. Tables of percentages were used respectively for the presentation
and analysis of the data obtained during the study. From findings, it implies that
mean calculated was approximately 0.9. This implies that there is a strong positive
linear relationship between dependent variable (x) and the independent variable (y)
tested. This means that x increases, and also y increases. This means that when
more audio visual aids are employed, in teaching and learning of mathematics,
more students will pass therefore the hypothesis which employ more instructional
materials in mathematics teaching, get better results holds.
Piaget, and Diene (1976), stated that, in order to create a meaningful mode.
After validating their model through, they used their model to test the effectiveness
of model on pupils achievement in learning. This hands-on approach to
constructing knowledge about a system results in laboratory type setting and has
been attributed to the words. According to them, proper and use of concrete models
could be used to promote the broad goals alluded, in mathematics learning. Each
of these men has made coherent rational for the use of concrete models in the
learning of mathematics concepts. Bruner et al (1967) wrote “seeing is a decision
making process”.
Post on his studies on the effect of concrete model and operation in pupils‟
achievement in a mathematics. His theoretical study was base on the works of
Piaget, Brunner and Diene. The learning theories were based on the effect of
concrete model and operation in pupils‟ achievement in mathematics. The men
40
discussed based on their intellectual views on pupils‟ achievement mainly on
concrete operations effect in mathematics learning. Based on that, concrete models
were encouraged for pupils achievement.
On the research of the role of concrete models in the learning of
mathematical concepts. Given share number of studies Post (2004), cited some
undertaken, it is perplexing to note that more is not known about the precise way in
which concrete model effect the development mathematical concepts. Perhaps that
largest contribution factor to this has been the lack of coordinated research efforts
that have mapped out a priori and have designed individual investigation that
would have provided coordinated answers to sets of related question rather, the
past pattern of research has been that of large numbers individually conducted
investigations and then postersion attempts to relate them in some fashion. This
has not been particularly fruitful and has left many unanswered questions and
hungers gaps in our knowledge.
Models and Modeling on Pupils Achievement in Primary School Mathematics
One obvious fact is that the study of models is a crucial need in the area of
primary mathematics learning. Due to some positive effects of these models on
primary school mathematics learning some researchers has worked on its uses and
effects. The most recent and comprehensive review of research on the use of
concrete models was complied at the mathematics and science information
references center at Ohio State university (ERIC) by Suydam and Higgins (1976).
41
The result generally concluded that concrete models are effective in promoting
pupils achievement but emphasizes the need for additional research.
Lowrie (2001), did a study in presentation and mathematics learning. The
research was carried out to identify the effect of representation of mathematics
concept by using models. Again Lowrie (2001) identified three categories of
problem solving approaches to include visualizes, verbalizes, and both user and we
as the role of imagery in problem solving. Lowrie (2001) found out that 42% of
the participants solving the mathematical participants solved the mathematical
problems using the visual technique.
Umeron Ukaha, Chukwu (1984), in his study on mathematics modeling
approaching to the task in teaching algebra among students. The research was
carried out with quasi-experimental design to investigate the effectiveness of using
geometric models in teaching algebraic expansions and factorization to junior
secondary. A total number of sixty – (60) students were selected randomly and
grouped into mathematics modeling approach (MMA) group and traditional
method (TM) group for the study. TM was used as control over MMA, which the
researcher set out test.
Each group containing 30 students with equal males and females. The study
was carried out in a mix school. The instrument used for the data collection was
test. The test was organized in form of pre-test and post-test. The data were
42
analyzed by use of (ANCOVA). Four research questions were tested and analyzed.
Their scores were organized under MMA and TM and analyzed.
The analysis of the pre-test revealed that there was equivalence in the
mathematical abilities of the experimental and control groups at the beginning of
the experimental.
It was also found that there were significant differences between their
performances
The mean performance of students taught using MMA and that of those
taught using TM.
The mean performance of boys taught using MMA and girls taught using
MMA.
The mean performers of girls taught using MMA and that of those taught using
TM.
From the analysis the mean score of the students in the experimental
group was 23.43 while that of those in the control group was 15.93. And since the
mean score of those in experimental group was 15 – 93 and the mean score of
those in experimental group was higher, the claim was that the Mathematics
Modeling Approach (MMA) was better methods of teaching algebraic expansion
and factorization than traditional or control method (TM or CM).
43
Graphic Representation in Primary School Mathematics Learning:
Researchers on graphical representation of bivariate and multivariate data by
grades 4, 5 and 6 students revealed the level of pupils-generated graphical-
representation of bivariate, and multivariate association (Moritz, 2000). Regarding
the tools of Moritz‟s study, it was reported that a survey item was prepared
including two parts, namely part (B) items related to bivariate association and part
(M), items related to multivariate association. During the data collection
procedure, one item was asked from the related area and the other three items were
asked from unrelated ones. The levels of response were categorized as level 1
unsuccessful bivariate association, level 2; partial bivariate association, level 3,
complete bivariate solution and the case of multivariate representation. The
numerical (symbol) analysis revealed that there was an association of the response
level to part (M) according to the response level of part (B).
Outhred and Sardonic (1997) a research on representation of numerical
(symbolic) situation through problem-solving at Kindergarten (kg) level.
Moreover, it had been concluded that students understood that a cube
represents unit for representing a number. Similarly, it was reported that students
developed the ability to writing equation in the end of five-month problem-solving
sessions. The research was a result of those data revealed through a regular KG
classroom. A problem sheet was prepared comprising of “addition” (combine),
44
“subtraction” (combine and separated), “Multiplication” (equal groups), “division”
(portative) and “fraction” (one half) related problems.
The data collection procedure was during the problem-solving session
focusing on student-generate problem-solving strategies, for example, “crossing
out and petitioning sets for subtraction”, separation for subtraction and addition”,
“drawing” ( Outhred & Sardelich, 1997, p. 380). The pupils-generated drawings,
produced during the problem-solving session, were kept as a basis for analysis.
Outhred & Sardelich‟s research was an extension of the previous research
carried out by Carpenter et al (1993) as they concluded that Kindergarten pupils
had solved a variety of difficult problems in the end of eight months.
Diezmann (1999) reported that in order to develop the pupil‟s ability of
using diagram as cognitive tools, teachers need to assess the quality of diagrams
and provide them with the necessary support. The theoretical framework of
Diesmans, (1999) research on “Assessing the research on representation of
mathematical problems by using diagrams. Furthermore, matrices networks and
hierarchies and range of that represent part-whole characteristics. Diezmann,
Francis, Horley & Novice, (1999) were taken into account of this study the aim of
Diezmann‟s study was to explore how the quality of diagrams can be assessed
using theoretical prototype, and specifically, how prototypes can be used to
identify the different levels of performance.
45
Diezmann‟s (1999) research was a case study of 12-year-old five pupils who
were both from high and low achievers in mathematics as well as high and low
performers in visual methods of solution.
The instruction of twelve half-hour lesson addressed the four general
purpose of diagrams generation and its use in novel problem-solving tens.
Interviews were conducted before and after the instruction and along with the task
related to the five “isomorphic problem”. The levels of study-generated diagrams
were criteria; level 0 was assigned when the diagram, level 1 was categorized for
the plausible diagram but lacking on assigning the appropriate component of the
structure, level 2 was assigned for the diagram which represented at least one but
not one components of the structure, and level 3 was labeled for such diagram that
represented all the components of the structure appropriately.
Summary of Reviewed Related Literature
The review of the related literatures in mathematics learning was carried out
in three areas. Namely:-
(1) Instructional materials and learning theories in mathematics learning;
(2) Model and modeling approach in mathematics learning and;
(3) Graphical representation in mathematics learning.
(4) Approaches to Mathematics teaching and learning
From the review, it was observed that instructional materials enhanced
the teaching and learning of mathematics more especially in the primary school
46
level. In other hands, the educational psychologists in their learning theories
encouraged the use of concrete objects in teaching and learning of mathematics
mostly at early stage of learning. When the children are at concrete operational
stage, they learn more by seeing, doing and hearing.
On the other hands, the review shows that models are more valuable and
effective in mathematics teaching and learning. It makes mathematics learning to
be real instead of abstract. It gives mathematics learning visual understanding.
Literatures also revealed that modeling process in mathematics teaching, enhances
children to learn mathematics, easier and faster. It makes mathematics learning
clearer.
Literatures showed that graphical representation has also been used in some
areas like pie chart, histogram, and bar chart, to represent mathematics
information. It was observed that the graphical approach gives mathematics
learning visual understanding. Instructional materials had been found to arouse the
pupil‟s interest, motivation and curiosity in some areas of mathematics learning.
Literature revealed that most of problems of poor performance of pupils in
mathematics could be solved by proper use of adequate instructional materials in
teaching and learning of some areas in mathematics from primary school level.
In the empirical studies, it was reviewed that pupils who were taught
mathematics with manipulative materials, performs better than those taught
without manipulative materials. It has been observed also that some studies
47
were conducted in other areas such as fraction, percentage, algebra and geometry.
Therefore there is a need to carry such study on ratio, which is one of the abstract
concepts in primary school mathematics contents, to verify if the result will remain
the same with the other areas. However, from the review of few studies carried out
by some researchers Suydam and Higgins (1977), Post (2004) and Umeron Ukaha,
Chukwu (1984), it appears that models as manipulative materials enhance pupils
achievement in mathematics. Literatures did not show studies on ratio. This then
created a gap that needs to be filled. Therefore, there is a need to see how effect
the graphical-symbol approach will have in pupils‟ achievement in ratio. The
present study is therefore a step in the right direction with the hope that graphical-
symbol approach will motivate primary school pupils in mathematics learning.
48
CHAPTER THREE
RESEARCH METHOD
This chapter is organized to cover the following areas: design of the study,
area of the study, population of the study, sample and sampling techniques,
instrument for data collection, validity and reliability of instruments,
administration, experimental procedures and method of data analysis.
Design of the study:
The design of this study is the Quasi-experimental research design.
Specifically, it is the pretest, posttest nonequivalent control group design. The non-
randomized control group was chosen because according to Ali (1999) “Non-
randomized control group is used when the researcher cannot randomly sample and
assign his subjects”. It controls the internal validity threats of the initial group
equivalence and researcher‟s selection bias, since there were no randomizations of
subjects into groups. The classes were already in existence, so intact classes were
used in order not to disrupt the normal class setting, in terms of seating
arrangement and classroom schedules.
49
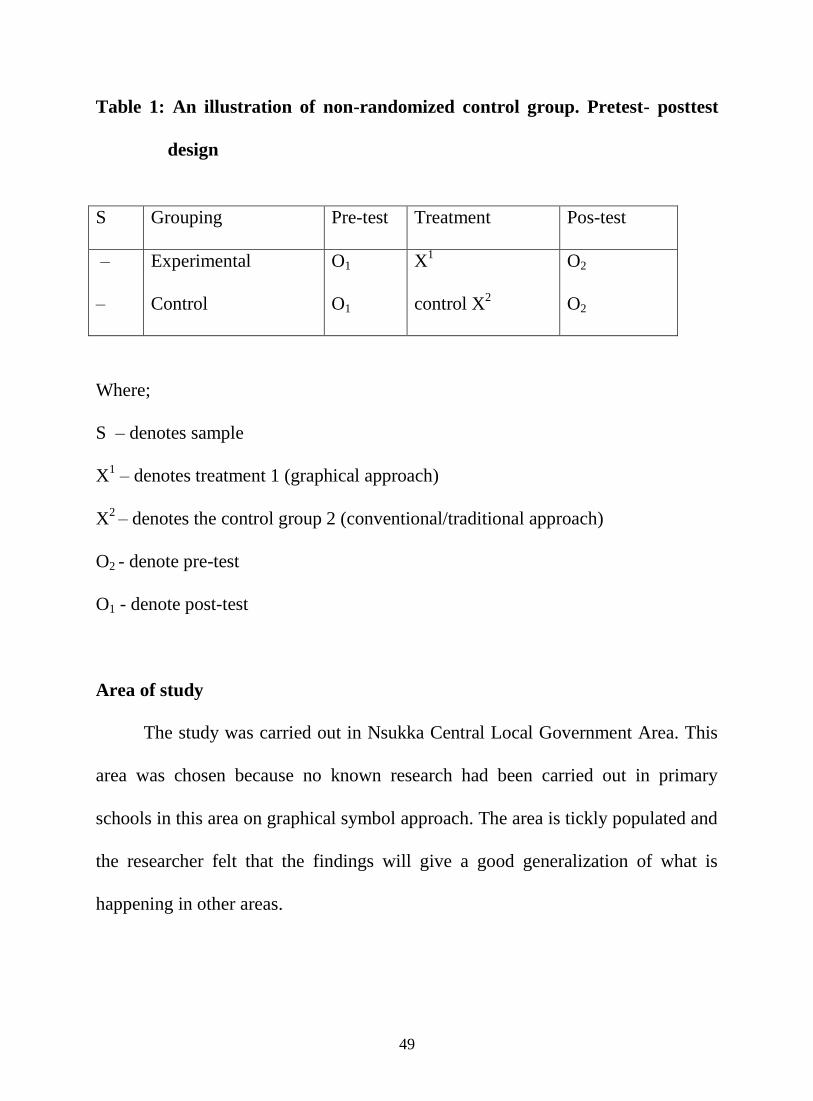
Table 1: An illustration of non-randomized control group. Pretest- posttest
design
S Grouping Pre-test Treatment Pos-test
–
–
Experimental
Control
O1
O1
X1
control X2
O2
O2
Where;
S – denotes sample
X1 – denotes treatment 1 (graphical approach)
X2 – denotes the control group 2 (conventional/traditional approach)
O2 - denote pre-test
O1 - denote post-test
Area of study
The study was carried out in Nsukka Central Local Government Area. This
area was chosen because no known research had been carried out in primary
schools in this area on graphical symbol approach. The area is tickly populated and
the researcher felt that the findings will give a good generalization of what is
happening in other areas.
50
Nsukka Central Local Government Area is made up of four towns which
are: Nsukka town, Lejja, Obukpa and Obimo with a total of 46 primary schools.
(Appendix A).
Population of the study:
The population of the study consists of 1,067 primary six pupils in the 46
primary schools in Nsukka Central Local Government Area.
Sample and sampling techniques:
The sample for this study was 120 primary six pupils. The schools were
randomly drawn from each town, making a total of four school with 120 primary
six pupils. In the schools selected, one was used as control group, where one
school serves as the experimental group. Simple balloting (with replacement) was
used to assign those schools to both experimental and control groups. Only primary
six pupils were used for the study because that is the class that are mature enough
to handle graphs.
Instrument for data collection
Two instruments were used for data collection. They are: The Achievement
Test Ratio (ATR) and Ratio Interest Inventory (RII). These instruments were
developed by the researcher. The curriculum and table of specification served as a
guide 24 questions were developed considering the three concepts of ratio outlined
51
in the curriculum: Division of ratio, Equivalent ratio, Missing addends. The
Achievement Test Ratio (ATR) is on appendix B, C & D while the Ratio Interest
Inventory (RII) is on appendix E.I
In developing the Ratio Interest Inventory (RII), the items were based on 4
point scale rated as Strongly Agree (SA), Agree (A), Disagree (D) and Strongly
Disagree (SD). These were put in figures as SA = 1, A = 2, D = 3 and D = 4. See
appendix E.
Validation of the instrument:
The instrument were subjected to face and content validation. Two experts
from mathematics education and one from measurement and evaluation unit
validated the instruments. The validation were required to assess the
appropriateness of the test items, sequencing and coverage of ratio concepts. The
experts certified that the instruments are valid for the purpose of the present
investigation. For the Ratio Interest Inventory, the comments of the validators
helped intriming down the checklist to 12 items as shown in appendix B, C and D
for the content validity, see the table of specification below. And the letter for
request for face validation of achievement test see Appendix L. Application for
permission to carry out experiment see Appendix M.
Table 2: Table of Specification for Content Validation on Ratio Achievement
Test
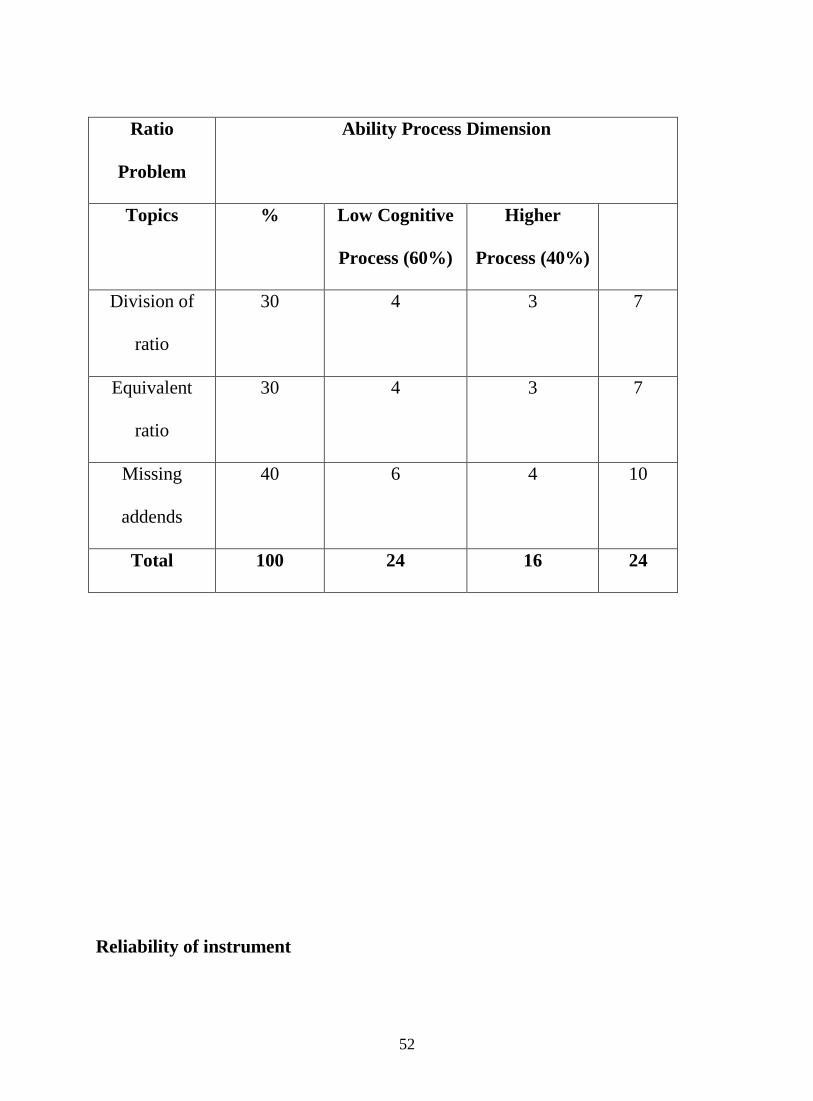
52
Ratio
Problem
Ability Process Dimension
Topics % Low Cognitive
Process (60%)
Higher
Process (40%)
Division of
ratio
30 4 3 7
Equivalent
ratio
30 4 3 7
Missing
addends
40 6 4 10
Total 100 24 16 24
Reliability of instrument
53
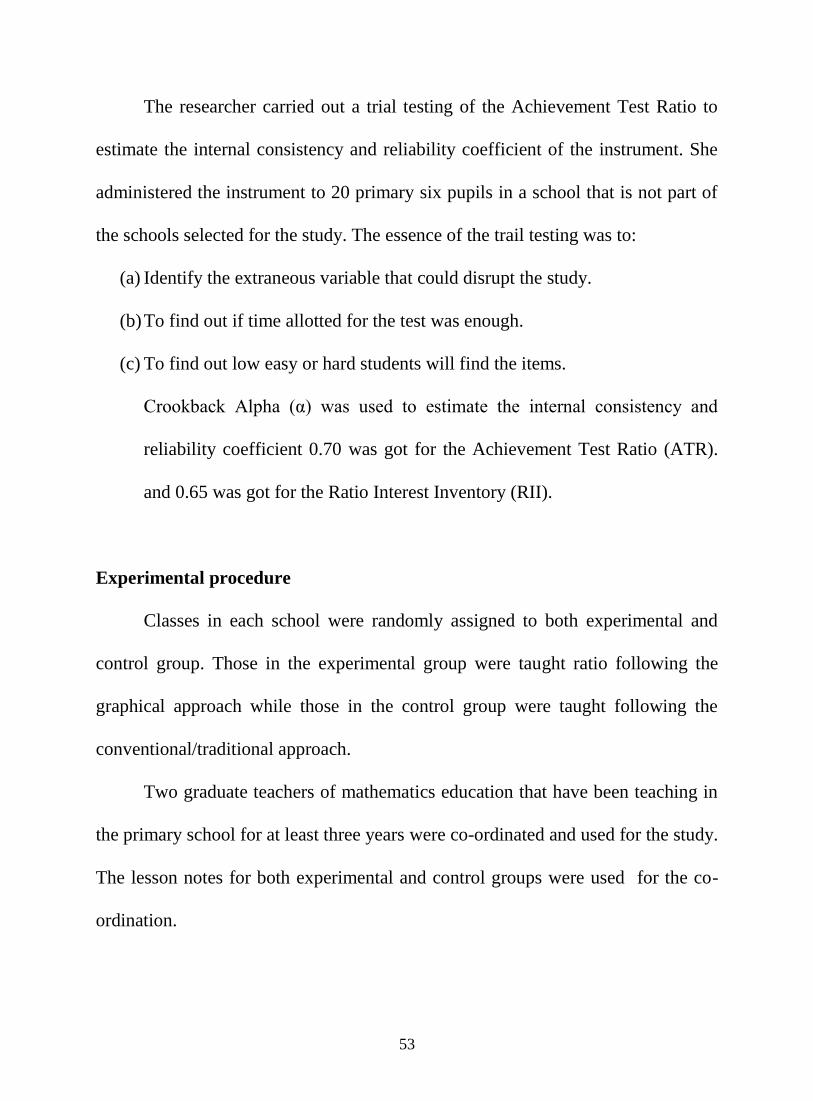
The researcher carried out a trial testing of the Achievement Test Ratio to
estimate the internal consistency and reliability coefficient of the instrument. She
administered the instrument to 20 primary six pupils in a school that is not part of
the schools selected for the study. The essence of the trail testing was to:
(a) Identify the extraneous variable that could disrupt the study.
(b) To find out if time allotted for the test was enough.
(c) To find out low easy or hard students will find the items.
Crookback Alpha (α) was used to estimate the internal consistency and
reliability coefficient 0.70 was got for the Achievement Test Ratio (ATR).
and 0.65 was got for the Ratio Interest Inventory (RII).
Experimental procedure
Classes in each school were randomly assigned to both experimental and
control group. Those in the experimental group were taught ratio following the
graphical approach while those in the control group were taught following the
conventional/traditional approach.
Two graduate teachers of mathematics education that have been teaching in
the primary school for at least three years were co-ordinated and used for the study.
The lesson notes for both experimental and control groups were used for the co-
ordination.
54
The researchers with the help of the research assistants visited the schools
and administered the tests to the pupils. The time allocated for the test was 1 hour.
The test were scored following the marking scheme on Appendix I.1, I.2, I.3, I.4,
J.1, J.2, J.3, J.4, K.1, K.2, K.3, K.4.
Lesson Notes
Six lesson notes were prepared and used for the study. Three lesson notes are for
the control group following the traditional approach, while the other three are for
the experimental group following the graphing symbol approach. See appendix F1,
F2, F3, G1, G2, G3, H1, H2, H3.
Method of data analysis
Means score and standard deviation was used in answering the research
questions. Research hypothesis were tested using the analysis of covariate
(ANCOVA) at P<.05. The pretest scores were used as covariate to the post test
scores.
55
CHAPTER FOUR
RESULTS
This chapter presents the results of the study. This is presented according to
research questions and hypothesis.
Research Question 1
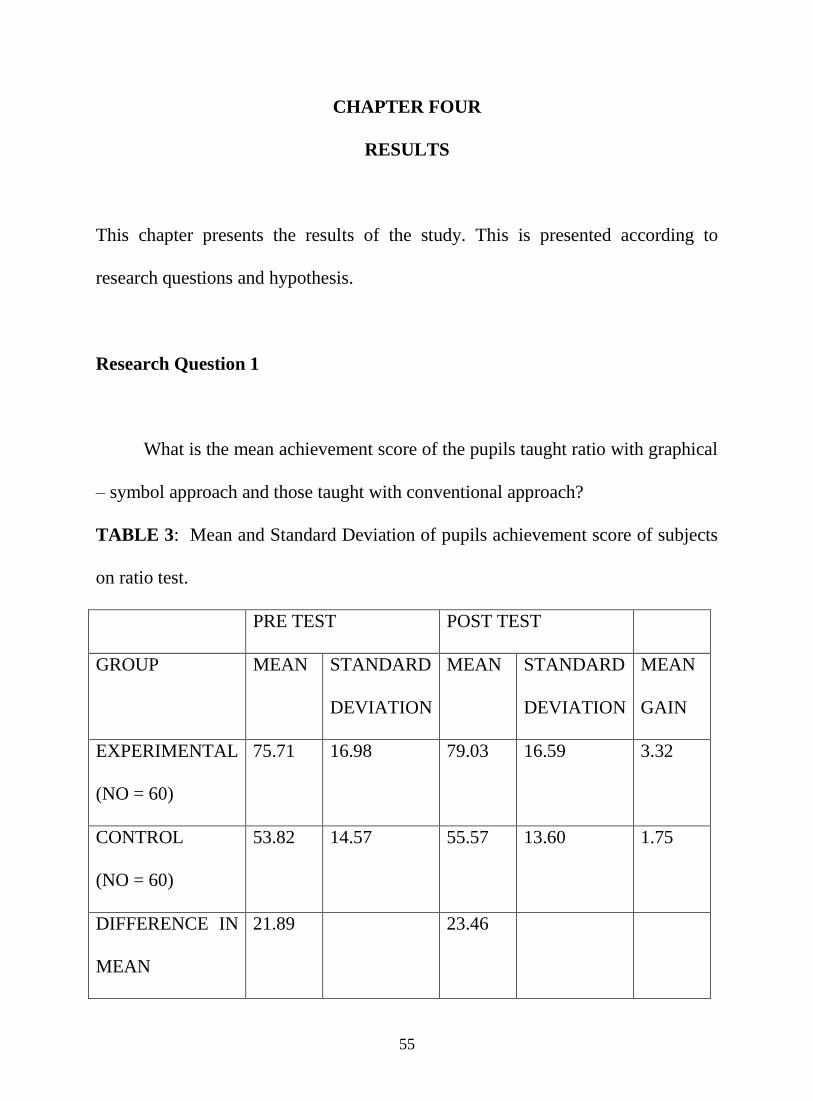
What is the mean achievement score of the pupils taught ratio with graphical
– symbol approach and those taught with conventional approach?
TABLE 3: Mean and Standard Deviation of pupils achievement score of subjects
on ratio test.
PRE TEST POST TEST
GROUP MEAN STANDARD
DEVIATION
MEAN STANDARD
DEVIATION
MEAN
GAIN
EXPERIMENTAL
(NO = 60)
75.71 16.98
79.03 16.59 3.32
CONTROL
(NO = 60)
53.82 14.57
55.57 13.60 1.75
DIFFERENCE IN
MEAN
21.89 23.46
56
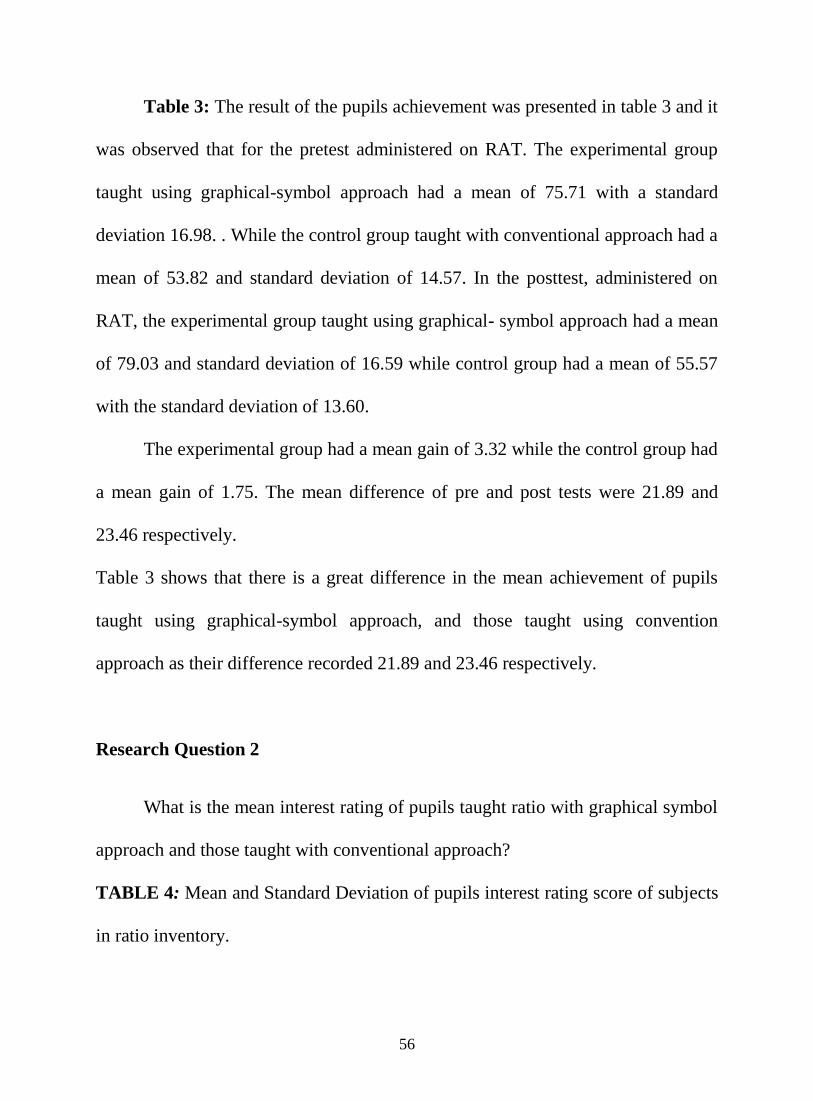
Table 3: The result of the pupils achievement was presented in table 3 and it
was observed that for the pretest administered on RAT. The experimental group
taught using graphical-symbol approach had a mean of 75.71 with a standard
deviation 16.98. . While the control group taught with conventional approach had a
mean of 53.82 and standard deviation of 14.57. In the posttest, administered on
RAT, the experimental group taught using graphical- symbol approach had a mean
of 79.03 and standard deviation of 16.59 while control group had a mean of 55.57
with the standard deviation of 13.60.
The experimental group had a mean gain of 3.32 while the control group had
a mean gain of 1.75. The mean difference of pre and post tests were 21.89 and
23.46 respectively.
Table 3 shows that there is a great difference in the mean achievement of pupils
taught using graphical-symbol approach, and those taught using convention
approach as their difference recorded 21.89 and 23.46 respectively.
Research Question 2
What is the mean interest rating of pupils taught ratio with graphical symbol
approach and those taught with conventional approach?
TABLE 4: Mean and Standard Deviation of pupils interest rating score of subjects
in ratio inventory.
57
PRE TEST POST TEST
GROUP MEAN STANDARD
DEVIATION
MEAN STANDARD
DEVIATION
MEAN
GAIN
EXPERIMENTAL
(NO = 60)
17.77 4.48 42.38 3.17 24.61
CONTROL
(NO = 60)
17.23 4.41 30.73 7.48 13.50
DIFFERENCE IN
MEAN
00.54 11.65
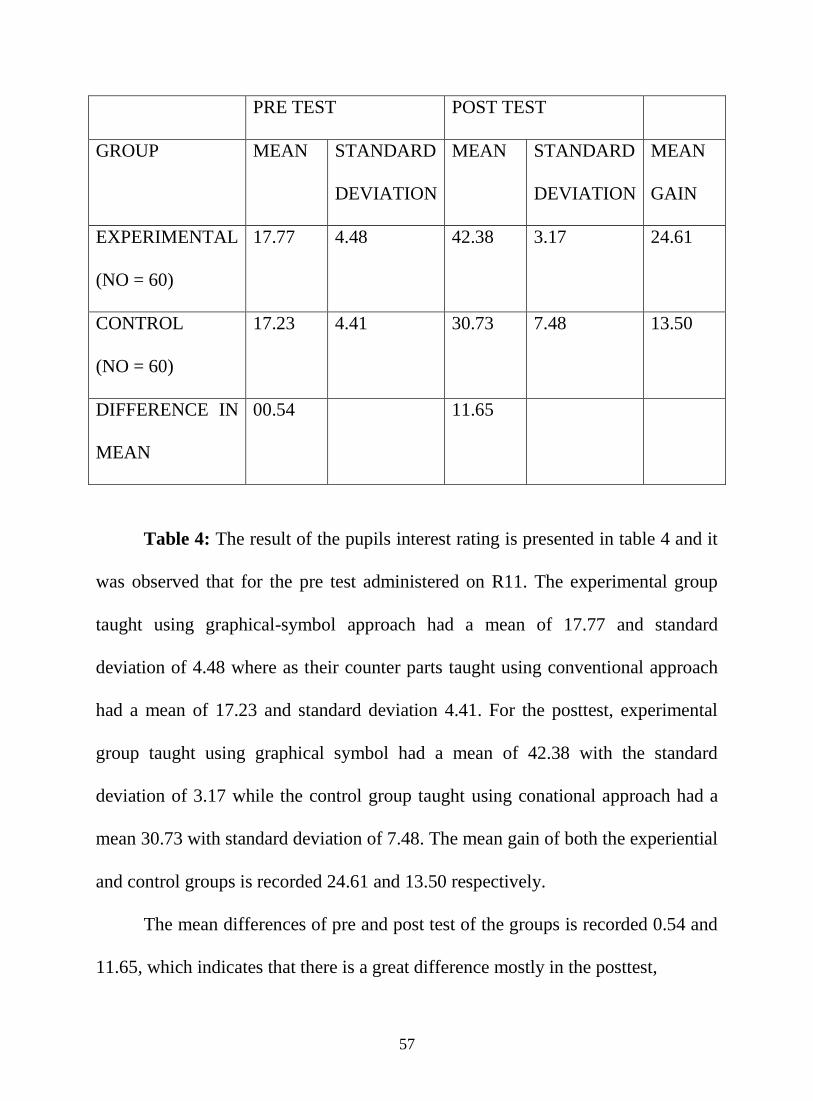
Table 4: The result of the pupils interest rating is presented in table 4 and it
was observed that for the pre test administered on R11. The experimental group
taught using graphical-symbol approach had a mean of 17.77 and standard
deviation of 4.48 where as their counter parts taught using conventional approach
had a mean of 17.23 and standard deviation 4.41. For the posttest, experimental
group taught using graphical symbol had a mean of 42.38 with the standard
deviation of 3.17 while the control group taught using conational approach had a
mean 30.73 with standard deviation of 7.48. The mean gain of both the experiential
and control groups is recorded 24.61 and 13.50 respectively.
The mean differences of pre and post test of the groups is recorded 0.54 and
11.65, which indicates that there is a great difference mostly in the posttest,
58
In the mean interest rating of pupils taught ratio with graphical-symbol approach
and those taught with commotional method
Research Question 3
To what extent does gender influence the mean achievement score of the
pupils taught ratio using graphical – symbol approach?
TABLE 5: Mean achievement score and Standard Deviation of males and
females in ratio test.
PRE TEST POST TEST
SEX MEAN STANDARD
DEVIATION
MEAN STANDARD
DEVIATION
MEAN
GAIN
MALE =
( NO 60)
67.96 15.91 70.36 15.74 2.40
FEMALE =
(NO 60)
61.57 21.69 64.23 21.76 2.66
DIFFERENCE
IN MEAN
6.39 6.13
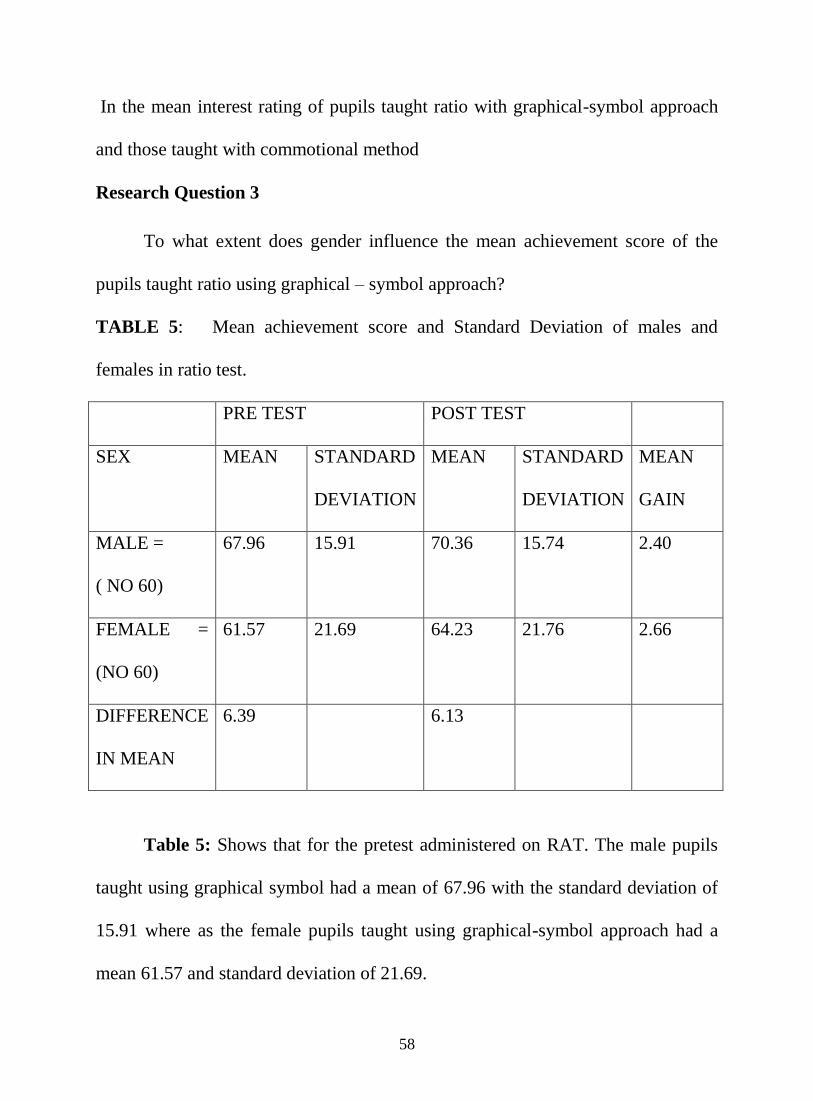
Table 5: Shows that for the pretest administered on RAT. The male pupils
taught using graphical symbol had a mean of 67.96 with the standard deviation of
15.91 where as the female pupils taught using graphical-symbol approach had a
mean 61.57 and standard deviation of 21.69.
59
For posttest, the male pupils had a mean of 70.36 with the standard devotion
of 15.74 while their female counterparts had a mean of 64.23 and standard
deviation of 21.76. The mean gain of the pre and post tests were 2.40 and 2.66
respectively.
Table 5 indicates that there is a little difference in the mean achievement
score of male and female pupils taught ratio with graphical-symbol approach as
their difference is recorded as 6.39 and 6.13 respectively
Research Question 4:
To what extent does gender influence the interest rating of pupils taught
ratio using graphical symbol approach?
TABLE 6: Mean and Standard Deviation of male and female pupils in ratio
interest inventory.
PRE TEST POST TEST
SEX MEAN STANDARD
DEVIATION
MEAN STANDARD
DEVIATION
MEAN
GAIN
MALES
(NO 60)
18.03 5.28 37.58 7.40 19.55
FEMALES
( NO 60)
16.97 3.36 35.53 8.83 18.56
DIFFERENCE
IN MEAN
1.06 2.05
60
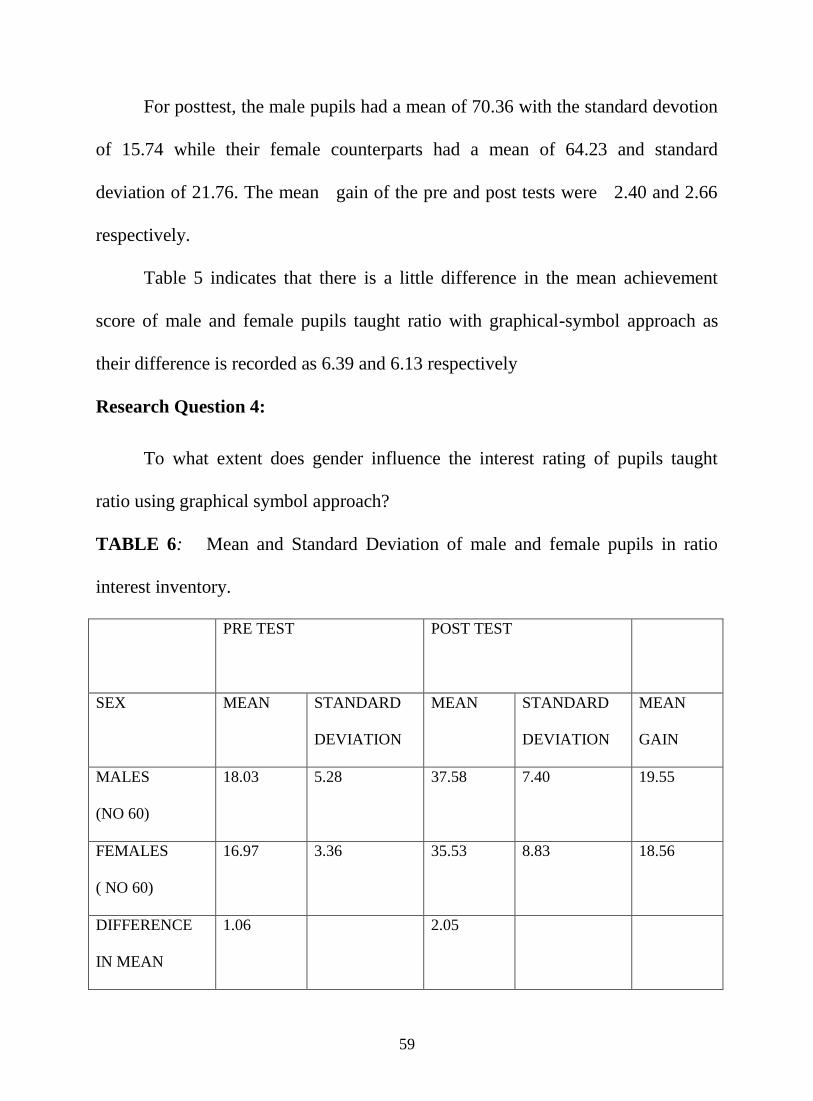
Table 6: The result presented on pretest administered on R11. The male and
female pupils taught using graphical-symbol approach had the means 18.03 and
16.97 respectively with the standard deviation 5.28 and 3.36 respectively.
In posttest, male pupils had a mean of 37.58 with the standard deviation of
7.40 and female pupils had a mean of 35.53 and standard deviation of 18.56. Their
mean gains were 19.55 and 18.56 where as their mean difference of pre and post
test were 1.06 and 2.05.
Table 6: indicates that there is a little differences between the mean interest rating
of male and female pupils taught using graphical-symbol approach as their
difference is observed as 1.06 and 2.05 respectively.
Hypothesis 1
There is no significant difference between the mean achievement score of
pupils taught ratio with graphical – symbol approach and those taught with
conventional method.
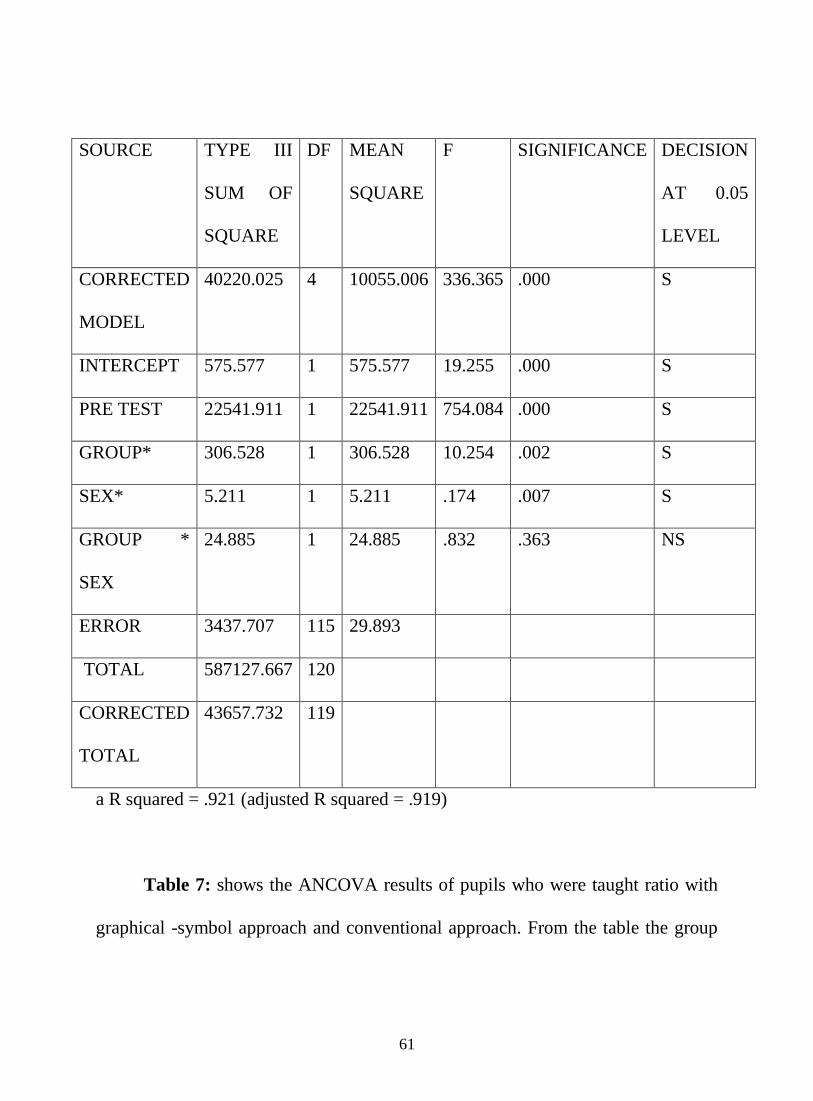
TABLE 7: Analysis of Covariance for Hypothesis 1 and 3 on pupils achievement
score in ratio
61
SOURCE TYPE III
SUM OF
SQUARE
DF MEAN
SQUARE
F SIGNIFICANCE DECISION
AT 0.05
LEVEL
CORRECTED
MODEL
40220.025 4 10055.006 336.365 .000 S
INTERCEPT 575.577 1 575.577 19.255 .000 S
PRE TEST 22541.911 1 22541.911 754.084 .000 S
GROUP* 306.528 1 306.528 10.254 .002 S
SEX* 5.211 1 5.211 .174 .007 S
GROUP *
SEX
24.885 1 24.885 .832 .363 NS
ERROR 3437.707 115 29.893
TOTAL 587127.667 120
CORRECTED
TOTAL
43657.732 119
a R squared = .921 (adjusted R squared = .919)
Table 7: shows the ANCOVA results of pupils who were taught ratio with
graphical -symbol approach and conventional approach. From the table the group
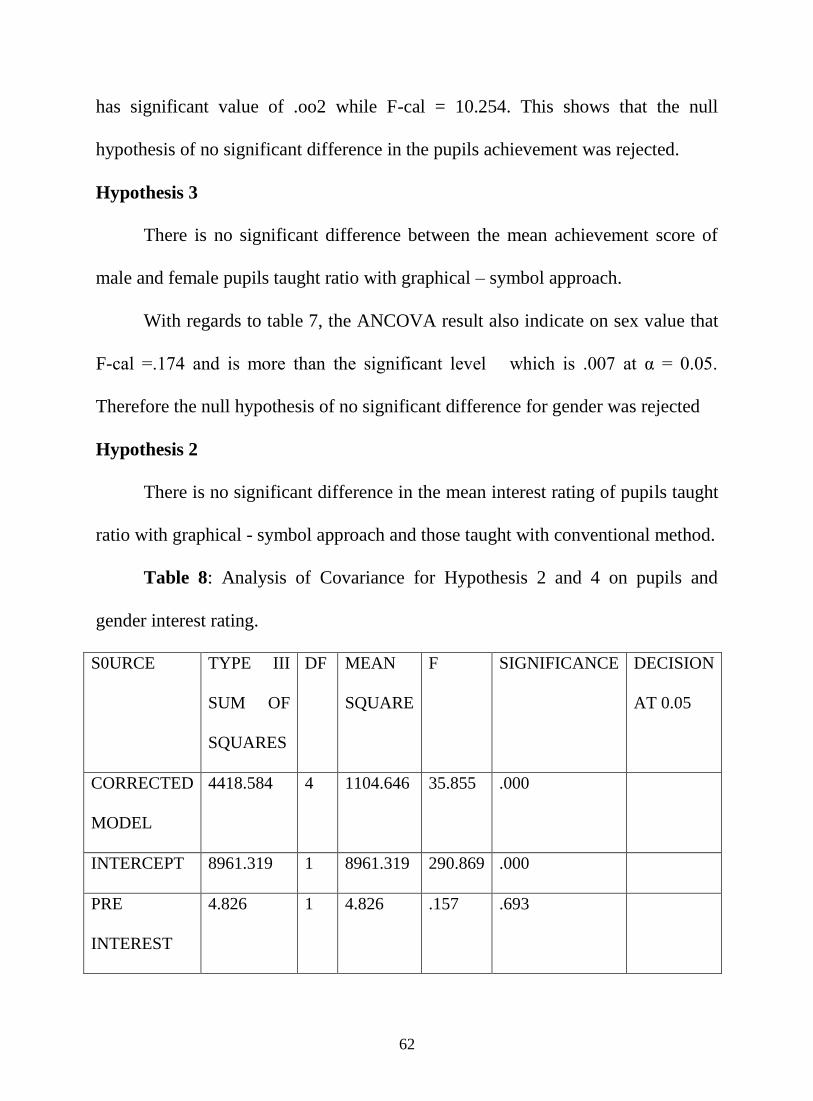
62
has significant value of .oo2 while F-cal = 10.254. This shows that the null
hypothesis of no significant difference in the pupils achievement was rejected.
Hypothesis 3
There is no significant difference between the mean achievement score of
male and female pupils taught ratio with graphical – symbol approach.
With regards to table 7, the ANCOVA result also indicate on sex value that
F-cal =.174 and is more than the significant level which is .007 at α = 0.05.
Therefore the null hypothesis of no significant difference for gender was rejected
Hypothesis 2
There is no significant difference in the mean interest rating of pupils taught
ratio with graphical - symbol approach and those taught with conventional method.
Table 8: Analysis of Covariance for Hypothesis 2 and 4 on pupils and
gender interest rating.
S0URCE TYPE III
SUM OF
SQUARES
DF MEAN
SQUARE
F SIGNIFICANCE DECISION
AT 0.05
CORRECTED
MODEL
4418.584 4 1104.646 35.855 .000
INTERCEPT 8961.319 1 8961.319 290.869 .000
PRE
INTEREST
4.826 1 4.826 .157 .693
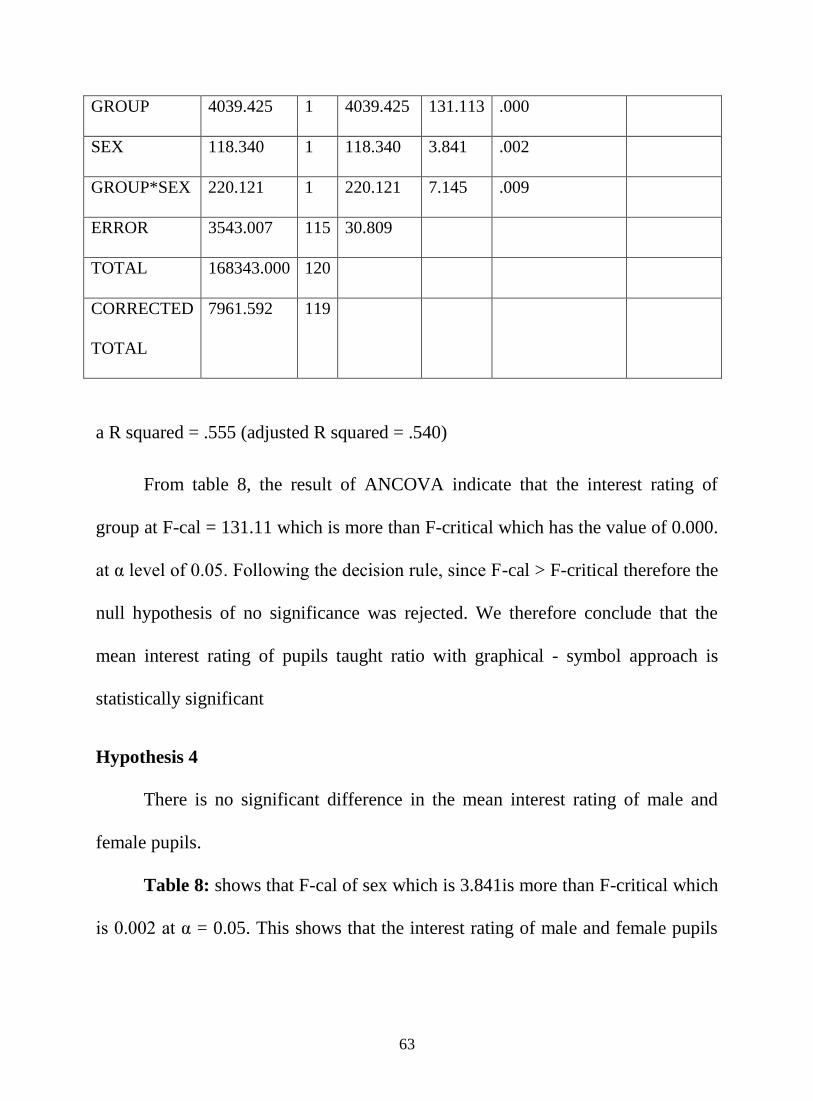
63
GROUP 4039.425 1 4039.425 131.113 .000
SEX 118.340 1 118.340 3.841 .002
GROUP*SEX 220.121 1 220.121 7.145 .009
ERROR 3543.007 115 30.809
TOTAL 168343.000 120
CORRECTED
TOTAL
7961.592 119
a R squared = .555 (adjusted R squared = .540)
From table 8, the result of ANCOVA indicate that the interest rating of
group at F-cal = 131.11 which is more than F-critical which has the value of 0.000.
at α level of 0.05. Following the decision rule, since F-cal > F-critical therefore the
null hypothesis of no significance was rejected. We therefore conclude that the
mean interest rating of pupils taught ratio with graphical - symbol approach is
statistically significant
Hypothesis 4
There is no significant difference in the mean interest rating of male and
female pupils.
Table 8: shows that F-cal of sex which is 3.841is more than F-critical which
is 0.002 at α = 0.05. This shows that the interest rating of male and female pupils
64
taught ratio with graphical – symbol approach is statistically significant. Therefore,
the null hypothesis of no significant difference of gender was rejected.
SUMMARY
In summary, the following observations were made from the findings:
1) There is a significant difference between the achievement score of pupils
taught ratio with graphical – symbol approach and those taught with
conventional method.
2) The pupils interest was highly aroused in ratio learning with the use of
graphical – symbol approach.
3) Achievement was greatly improved by the use of graphical – symbol
approach on both male and female pupils in ratio learning.
4) Both male and female pupils developed more interest in ratio learning with
the use of graphical – symbol approach, than the conventional approach.
65
CHAPTER FIVE
DISCUSSION, CONCLUSIONS, RECOMMENDATION AND SUMMARY
OF THE STUDY
In this chapter the discussion, conclusion, recommendation and summary of
the study from the study.
Discussion:
The findings of this study showed that there was a significance difference
between the mean achievement score of pupils taught ratio with graphical-symbol
approach and those taught with conventional method.
The pupils taught ratio with graphical-symbol approach performed better
than those taught with conventional method. It has also proved that manipulative
materials enhance mathematics learning. This study is similar to the early research
of Ohuche (1990), who investigated on the use of graph in teaching of some
concept in mathematics. The concepts included area, fraction and proportion. The
study showed that the use of graph enhanced the learning of some mathematics
concepts.
The study is similar to the study of Ogwuche (2002) who investigated age
and sex as correlates of logical reasoning and mathematics achievement in ratio
and proportion tasks. The finding indicated that male students perform better than
females.
66
Also in this study, the Piagetian theory on learning and instructional
materials was also proved. Based on the theory, primary school pupils who are at
concrete operational age learn more by doing and seeing than by listening only.
This study showed and supported the initial ideas which emphasized that
mathematics teaching and learning mostly at primary school needs to be taught
with relevant instructional materials in order to help the pupils develop interest in
mathematics learning.
Conclusion:
From the result of this study, the following conclusions were made:
1. Pupils learn mathematics more by the use of manipulative materials.
Because the performance of the pupils who were taught ratio with graphical-
symbol approach was significantly better than their counterparts who were
taught with conventional method, when the ratio achievement tests were
administered.
2. There was also a significant difference in the mean interest score and rating
between those pupils taught ratio with graphical-symbol approach and those
taught with conventional method.
3. It was observed that males performed better than females when graphical-
symbol approach was used in teaching of ratio despite that males do better
than females, it was observed that females taught ratio with graphical
67
symbol approach performed better than their counterparts who where taught
with conventional method.
Therefore, graphical symbol approach has a positive affects on the
interest of females in ratio learning.
4. It was also observed that graphical-symbol approach motivated the interest
of pupils in ratio and mathematics learning as a whole. Females also were
motivated more through graphical-symbol approach in mathematics
learning.
Implications:
From the findings of this study, it was very clear that those pupils who were
taught ratio with graphical-symbol approach performed better than those who were
taught with conventional method. That showed that manipulative materials are
very important in teaching and learning of mathematics mostly at primary level.
The implication of this is that primary school teachers who are more of
female teachers should use adequate approaches in teaching any mathematics
concept to enable the pupils learn and develop interest in mathematics learning and
also to help females who are not lovers of mathematics to develop interest in
mathematics and mathematics related subjects.
Educational planners should develop mathematics curriculum that will
emphasized more in the use of different approaches such as graph-symbol
approach in teaching of any mathematics concept. They should also visit and
68
supervise teachers when they are teaching mathematics in classrooms. They should
provide suitable instructional materials for schools mostly the primary schools.
It was observed that pupils dislike mathematics because of poor method of
teaching and lack of adequate approaches in teaching of some abstract concept
such as ratio. For the teachers to make their mathematics teaching enjoyable,
models should be used in teaching of mathematics to make the pupils active
learners not passive learners. Some abstract concepts like ratio and others should
be taught with manipulative materials.
Limitation of the study:
This study experienced some limitation
(1) Because of the introduction of private schools in Nigeria today, public
schools are mainly for poor people and maids who are not mainly
financially up-to-date. Such pupils find it difficult to provide graph-sheets
and other school material for their study.
(2) The study faced some problems based on poor environmental factors.
Government neglect public school, so, because of that there were no good
blackboard, tables, chairs, desks for the children to have a comfortable
seating arrangement. That also affected the study.
69
Recommendation:
The following recommendations have been made in this study,
(1) From the findings of this study, the mathematics educators (N.C.E.
teachers) should teach mathematics in the primary school, as specialist
teachers. This is because the primary school teachers who are mainly
female teachers do not have good mathematics background, because of
that, some of them cannot use some adequate approaches correctly and
some do not know how to use some material such as graph, in teaching of
mathematics.
(2) The government should provide instructional materials, mathematics
textbooks, graph sheets, workbooks for the pupils, and teachers manual for
primary schools for effective teaching and learning of mathematics.
(3) Mathematics work-shops, seminars and conferences should be organized
frequently for primary school teachers by the professional bodies like
Mathematics Association of Nigeria (MAN), Science Teacher‟s
Association of Nigeria (STAN). To enable them learn some new
approaches in teaching of mathematics.
(4) To enable them learn some new approaches in the mathematics teaching
system. In-service training should be encouraged for mathematics teachers
from N.C.E. level to Ph.D. level to enable mathematics teachers to up-date
70
themselves. So that the teachers will be exposed to the new innovational
approaches in teaching of mathematics.
(5) Government should provide Audio-visual aids such as power point,
computer, video to schools for mathematics teaching and learning.
Suggestions for further research:
The following suggestions have been made for further studies.
(1) The effect of graphical-symbol approach in base-system.
(2) With the use of computer in the society. It was discovered that children are
now more exposed than before. Some topics, in the junior secondary
schools mathematics curriculum such as Quadratic Equation, factorization
can be introduced in the primary school mathematics curriculum to find out
how it will work out.
Summary of the study:
(1) The study was on effect of graphical-symbol approach in achievement of
ratio in upper primary school, some schools were randomly selected in
Nsukka Central Local Government Area of Enugu State.
Basically, it was carried out to find out the effect of models and
manipulative materials with special reference to graph in teaching and
learning of mathematics in primary schools, specifically on primary six
pupils. It was undertaken to find out in particular the effect of graphical-
71
symbol approach in ratio concepts in upper school. Gender was also taken
into consideration.
The study was also used to find out the extent on pupils performance
in the test of ratio achievement test and interest rating on pupils attitude
toward‟s mathematics learning. Four research questions and four research
hypothesis were used to carry out the study.
(2) The literature review for the study was carried out on relevant areas under
two headings – Theoretical and Emperical studies on model, modeling and
graphical representation in primary school mathematics learning. From the
review of the related literatures it was discovered that manipulative
materials enhance the teaching and learning of mathematics in primary
schools.
(3) The population of the study consists of 1067 primary six pupils in the 46
primary schools in Nsukka Central Local Government Area of Enugu State.
The total number of schools randomly selected were 2. Intact class of 60
primary school pupils from each school were used. In the schools selected,
one intact class was used where one school serves as experimental group
and the other as control group.
The design of the study was Quasi – experimental research design.
Twenty-four tests were set from three types of ratio concepts and
administered.
72
(1) Division of ratio
(2) Equivalent ratio
(3) Missing addends in ratio relationship.
Twelve checklists were used to find out the attitude of the pupils towards
mathematics and learning in primary schools.
The data were collected and analyzed using mean score and standard
deviation in answering the research questions. Research hypothesis were tested
using analysis of covariate (ANCOVA) at p <.05. The pretest used as covariate to
the posttest scores. And posttest mean and standard deviation were used to draw
conclusion of the findings. And finally it was discovered that graphical-symbol
approach has a positive effect on pupils performance in ratio achievement tests.
73
REFERENCES
Adewole, I.O. (1975). Implementation and use of instructional aids in teaching of
Science in primary school. Unpublished undergraduate project, University of
Nigeria, Nsukka. African Journal of Research in Education. 1(1) 94-102.
Agwagah, V.N.V. (1993). Instruction in Mathematics Reading as a Factor in
Students Achievement and Interest in word problem Solving. Unpublished
Ph.D Thesis. University of Nigeria, Nsukka.
Ale, S.O.& Salau M.O. (2001). Analysis of Students enrolment and performance in
Mathematics
http/www academic Journal org/ERR/.PdR htlm.
Alesandrini, K. (2002). The new objects spatial-verbal cognitive style model.
Httpwww.doi.wihey.com htlm.
Allen, B. (1981). Mathematics Modelling: Visual perception in relation to level or
meaning for children.
http://www.digital.Cibrary.Cent.education/Permallink/meta.dc-3896:Lhtlm.
Ang-Keng-Chena (2001). Teaching Mathematics Modelling in Singapore Schools.
English Journal of Edith. Ed 6(1) 63-75.
Ashford, E. (1997). Effect of active learning on Students Achievement in
Measuration.
http.www Scribed. Com/doc/9666207/book of abstract htlm.
Bal C.I. (2004). Multiple representation or Addition and subtraction related
problem third, forth and fifth grades. HttpwwwA/Bail2htlm.
Balogu (1997). Communication Competency in Mathematics Education in Africa.
Lagos: Ever lead Primary and Publication Company.
Betiku, O.F (2001). Effect of using Mathematic Laboratory in Teaching of
Mathematics. Http.www.academic Journal.Org/pdERR/PD% 202008 html.
Betiku, O. F. (2002). Factors responsible for poor performance of students in
school mathematics suggested remedies proceeding of the 43rd Annual
Conference and Inaugural Conference of (ASTME), Africa Heinemann
Education Book Nigeria PLC.
74
Betiku, O.F. (1999). Resources for effective implementation of the 2 and 3
dimensional Mathematics topics at the Junior and Senior Secondary Level in
the Federal. Journal of Curriculum Study 6(1) 49-52.
Borne.S (2000). Developing model based reasoning Mathematics and Science.
http.www.inkinghub.elsevir.com/retrieve/phi/80/9339739900490.
Bruner J.S. (1967). Concrete model in the learning of Mathematics. httpwww.Cehd
Umn Edu/rational number project /8/.4 html.
Bruner J.S. (1976). The role of manipulative materials in the learning of
Mathematics.
California (1989). Symposium Pargarmon.
httpwwwCrd.Ibl. Gov/Ng/Professional hltm.
Carpenter, T.P. (1992). Learning and Teaching with understanding. A Handbook
of Research on Mathematics Teaching and Learning (pp. 65-100). New York
Macmillium.
Chukwu, G.N. (1999). How to make Secondary school Mathematics Functional
Nigerian Journal on curriculum studies 6(1) 64.
Damisa, O.A, (1987). A modeling of optimal pressure and fraction in gas
condensated reservoir httpwww.Unlag.edu.html.
Diene Z. P. (2004). The role of Manipulative materials in the learning of
mathematics. httpwwwcehd.Umn.edu/rational-numberproject181-4htlm.
Diene Z.P (1967). Theory of Mathematics learning Mathematics Journal on the
World of Mathematics 1(1).
Diezmann, C.M. (1999). Making a difference to representation in Kindergarten. M.
Truvan – Journal of (Education) Making the difference, 185-191. Adelaid
MERGA.
Dike I.E. (1988). An experimental model for teaching a Mathematics proof.
Unpublished undergraduate project University of Nigeria, Nsukka.
Emmanuel C (1977). Impact of Audio-Visual aids in teaching of mathematics.
Unpublished undergraduate project University of Nigeria, Nsukka.
75
English L.D. & Halford G.S, (1995). Handbook of instructional mathematics.
Research education books.
httpwwwboooks.google-16Za/books.htlm.
Fajemidagba, M.O. (1986). Fidgeting Cognitive demand and levels of difficulty of
ratio and proportion items.
Federal Government of Nigeria (2004). National Policy on Education (forth
Edition, Abuja Federal Ministry of Education.
Francis, Horley & Novich (1996). Multiple representations of addition &
subtraction in Mathematics learning www.au.geoxutes.com/bcluite/bcproject
1pdf.hltm.
Gage A. and Berlire D. (1992). A review of models of the teaching learning. http
ww.papers modeltch htlm.
Gagne, R. (1999). Apply learning theories to online instructional design.
Soakmyung Women University press Seoul.
Gagne R. (2004). Instructional design theory. Holt Rinehart and Whistone – New
York.
Graph-game (2004). Generalization metarationalities in the graph model for
conflict. http.www.port.acm.org/citation-CFM.hltm.
Grossman, P.I. (2000). Early Maths Strategy, the report on the expert panel on
Early Maths. www.edu.gov.onCa/eng/document/reports/math/math.pdfhtlm.
Habour Peter, V.F.O. (2001). Noteworthy Points on Measurement and Evaluation.
Snap Press, Enugu.
Harbour Peters V.F.A. (2001). Inaugural Lecture of School Mathematics and
Strategies for Averting them. Snaap Press, Enugu.
Hartshrn,R.(2004). How learning theory support the use of manipulatives.
httpwwwetacuisenair.Com/pdf/benefit of manipulatives.pdf.htlm.
Hedden, H. (1986). Information management:
http www. Gilbaneboston.Com/08/speakers.htlm.
76
Holland, D. (2002). Modeling in Mathematics learning approaching for classroom
of future. httpwwwmath.a.c.Ugljk.php.htlm.
Howden W. (1986). Experimental learning of Mathematics using manipulatives.
http www. Eric digests. Org/pre. 9217/Math.htlm.
Ifamujinwa S.A (1999). Problem facing Mathematics teaching and learning.
Nigeria Journal of curriculum studies 6(1) 31-55.
Johnson-Laird (2002). Mental Model towards a cognitive Science of language. http
www jime.open.ac.uk.com.htlm.
Lassa, P.N. (1981). Teaching and learning of Mathematics in Primary Education in
Nigeria. Nigeria Journal of Education Forum 10(1) 47-50.
Lesh, R.A. (2004). Beyond Constructivism Models and Modelling perspectives.
http wwwgooglebooks.co zal books htlm.
Lowrie, T. (2001). The influence of Visual representation on Mathematical
problem solving and innumeracy performance. B. Perry Journal of Education
on innumeracy and beyond (Vol 2) Syden MERGA.
Mathematics Modelling Our World (MMOW).
http.www.edu. Org/MCC/PDF/perspmma.pdf.htlm.
Mega Mathematics (2004). Mathematics Tools Discussion: All topics in discrete
mathematics. httpwww.Org/mathtools/discussion.htlm.
Moritz, J.B. (2000). Graphical representation of statistical learning.
httpwww board of studies. Nsw Ed/au/Manuals/pdf doc/maths.com htlm.
National Council of Teachers of Mathematics: of America (NCTM): Multi-sensory
Aids in teaching of Mathematics.
http.www.eric.ed.gov.ERIC Web portal/rcorddetail.hltm.
Norman, H.A.(2002).Teaching children Mathematics.
http.www.questia.com/Library.book.htlm.
Nwogu, C.N. (1985). The extent of use of instructional materials in teaching
French in secondary school in Nsukka Educational Zone. Unpublished
Undergraduate project, University of Nigeria, Nsukka.
77
Obodo, G.O. (1997). Principal and practice of Mathematics education in Nigeria.
Computer International Business System, Enugu.
Odili, G. O. (1992). The training of N.C.E Mathematics Teachers. A focus on
Instructional Materials. ABACUS: Journal of Mathematics Association of
Nigeria 22(1) 98-105.
Odili, G. O. (2000). The effect of instructional material in Mathematics learning.
ABACUS: Journal of Mathematics Association of Nigeria 26(2)82.
Ogwuche, J. (2002). Age and sex as correlates of Logical Reasoning and
Mathematics Achievement in Ratio and Proportion Tasks Unpublished
Masters project. University of Nigeria, Nsukka.
Ohuche, R.O. (1990). Explore Mathematics with year children Onitsha Summer
educational Publisher Onitsha.
Okorie, K.E.et al (1989), the extent of use of visual aids in the teaching of
mathematics in Okigwe and Owerri educational Zone. Unpublished
Undergraduate project, U.N.N.
Osoemene, U.M. (1985). Model for effective teaching in Nsukka Urban.
Unpublished Undergraduate project University of Nigeria, Nsukka.
Outhred, L.N. and Sandelich S. (1997). Learning and teaching measurement
conference of international group the psychology of Mathematics education
people in Mathematics.
http.www. Zentralb/att.Math org/Math.Ed htlm.
Penner, E. & Richard L. (1998). Externally modeling mental model.
http www Springerlink.Com/index/r040n/12386506146.pdf.htlm.
Piaget, J. (1971). Learning theory on instructional materials. Effect of instructional
material in learning. Basic Books, New York.
Piaget J. & Diene Z. P. (1976). Teaching Implications of Piaget Research. The
Journal of Mathematic Behaviour: An Analysis of Young. New York.
Post, R.T. (2004). The effect of instruction with concrete models on eight grade.
http.www.etd.Lib.Math.ed htlm.
78
Post, R.T. (2004). The effect of physical materials on kindergatin mathematics
learning. httpwwwLeaonline.Com/doi/abs/Com.htlm.
Richard, C. (2002). Mathematics learning. Complex problem solving and geometry
learning.
http.www.Education Stateuniversity.Com/page of Mathematics learning htlm.
Ryder, L.H. (2004). An alternative language learning model httpwww.Math.rice-
edu/dfield.com.htlm.
Sardonic D.C. (1997). A multiple precision computer representation for very large
integers.
http.www.Cath.Org/jargon/oldversions/jarg.htlm.
Suydam M.N. and Higgins J.L. (1977). Concrete models in the study of
mathematics and science in primary school. Research Paper of Information
Conference Center. Ohio State University (ERIC).
Umoren S.N. (1984). Mathematics modeling approaching to task present. Among
Junior Secondary Mathematics Studies. Unpublished Masters Project.
University of Nigeria, Nsukka.
Usman, K.O. (2002). The need to retain in-service Mathematics teachers for the
attainment of the objectives of universal Basic Ed. (UBE). The Journal of the
Mathematics Association of Nigeria. ABACUS 27(1) 37-44.
Van de Walle (2004). Using manipulatives in mathematics problem solving.
http.www.Math.unit.edu/tmme/vol3no2/TMMEVOL3no2Colorado-PP 184-
193.pdf.htlm.
Wilson, F. (2003). Using manipulation in mathematics problem solving
http.www.Math.Unit.ed.MME/Vol3 no 2 /TMME Vol3No2-Colorado PP 184-
193 pdf. Htlm.
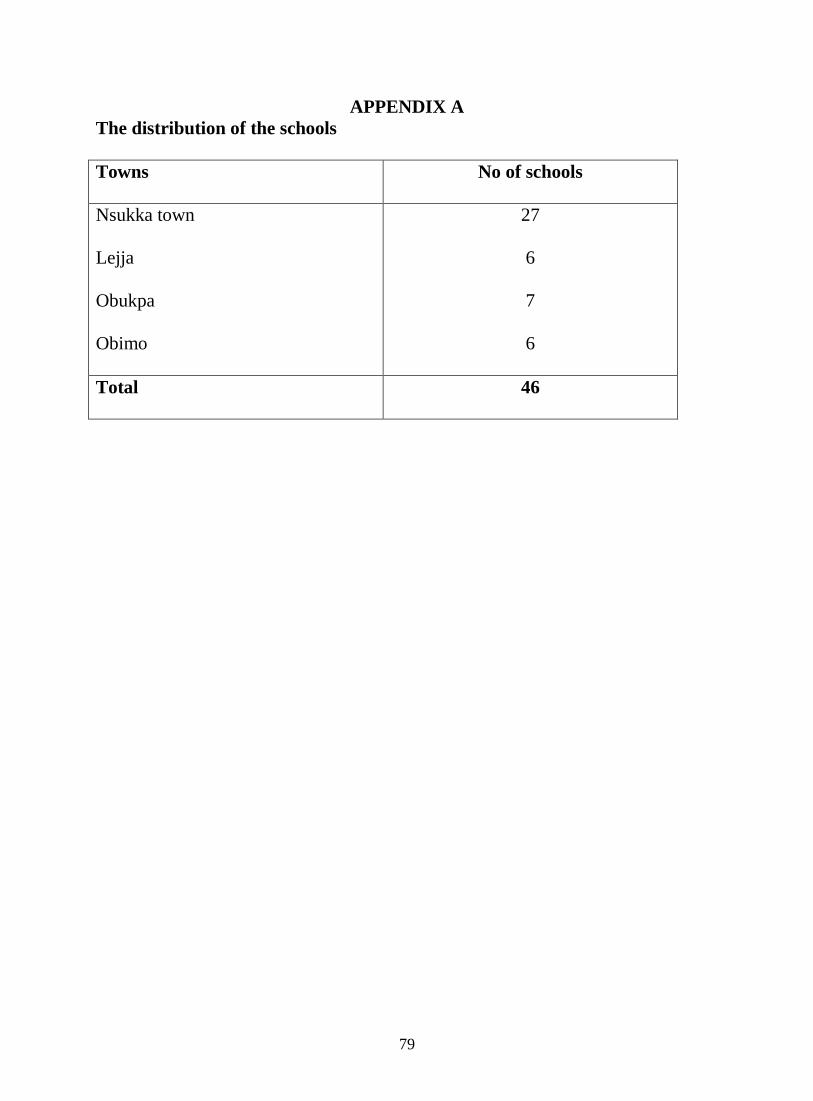
79
APPENDIX A
The distribution of the schools
Towns No of schools
Nsukka town
Lejja
Obukpa
Obimo
27
6
7
6
Total 46
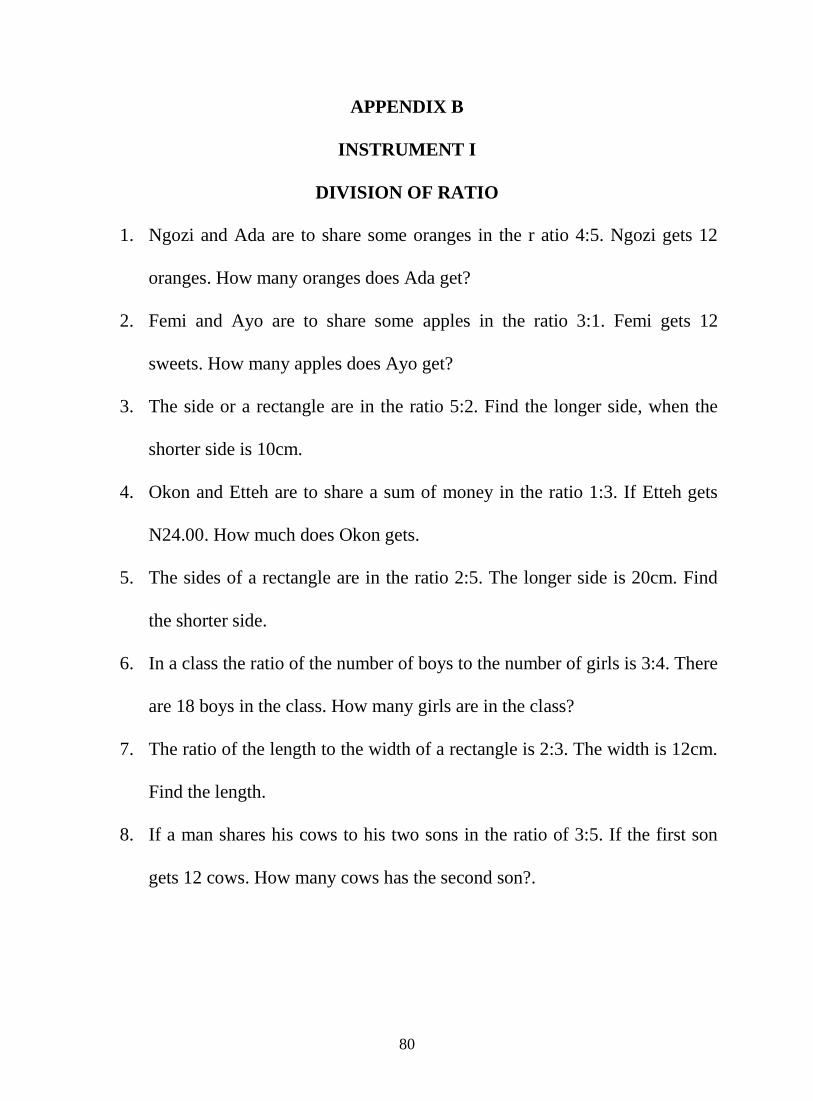
80
APPENDIX B
INSTRUMENT I
DIVISION OF RATIO
1. Ngozi and Ada are to share some oranges in the r atio 4:5. Ngozi gets 12
oranges. How many oranges does Ada get?
2. Femi and Ayo are to share some apples in the ratio 3:1. Femi gets 12
sweets. How many apples does Ayo get?
3. The side or a rectangle are in the ratio 5:2. Find the longer side, when the
shorter side is 10cm.
4. Okon and Etteh are to share a sum of money in the ratio 1:3. If Etteh gets
N24.00. How much does Okon gets.
5. The sides of a rectangle are in the ratio 2:5. The longer side is 20cm. Find
the shorter side.
6. In a class the ratio of the number of boys to the number of girls is 3:4. There
are 18 boys in the class. How many girls are in the class?
7. The ratio of the length to the width of a rectangle is 2:3. The width is 12cm.
Find the length.
8. If a man shares his cows to his two sons in the ratio of 3:5. If the first son
gets 12 cows. How many cows has the second son?.
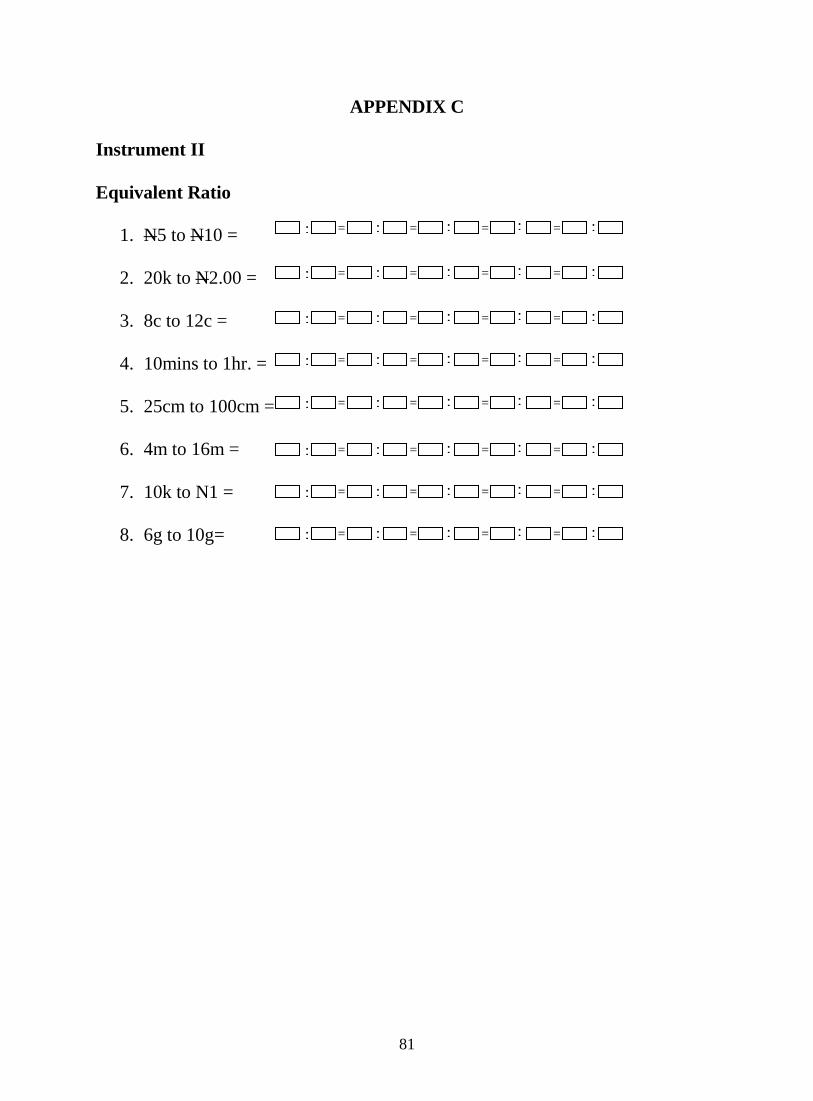
81
APPENDIX C
Instrument II
Equivalent Ratio
1. N5 to N10 =
2. 20k to N2.00 =
3. 8c to 12c =
4. 10mins to 1hr. =
5. 25cm to 100cm =
6. 4m to 16m =
7. 10k to N1 =
8. 6g to 10g=
: = : : : : = = =
: = : : : : = = =
: = : : : : = = =
: = : : : : = = =
: = : : : : = = =
: = : : : : = = =
: = : : : : = = =
: = : : : : = = =
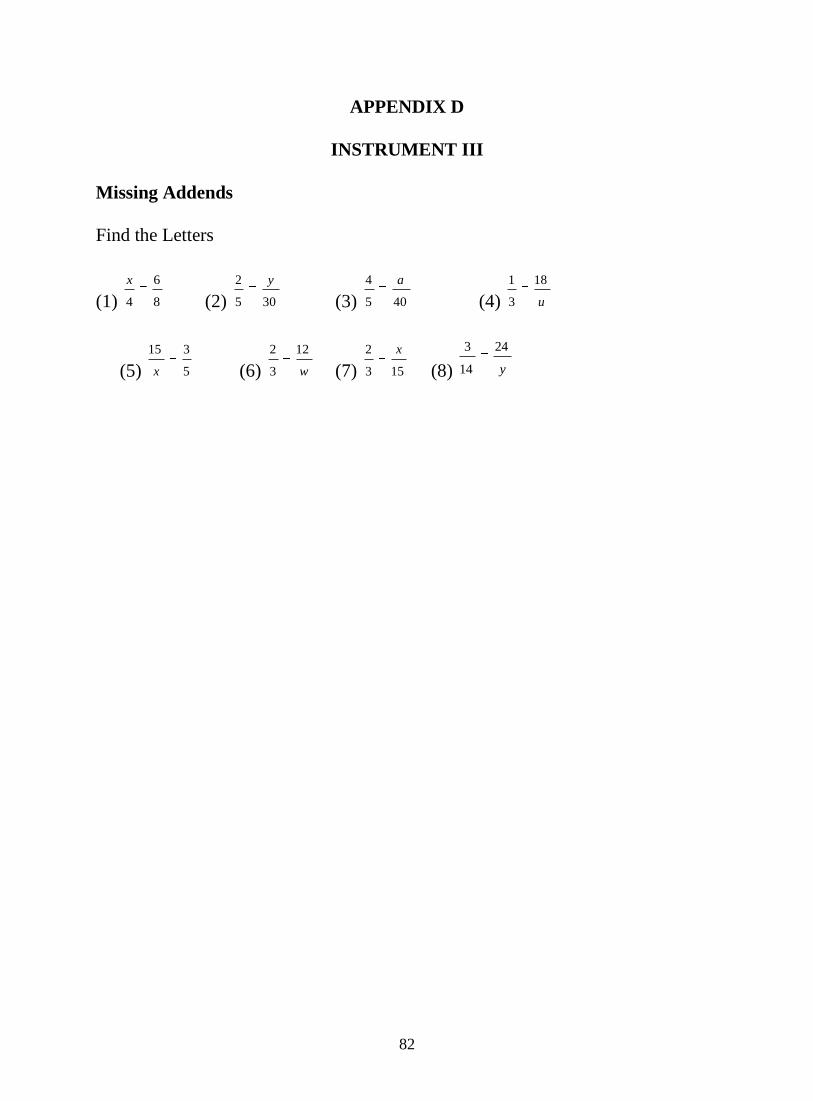
82
APPENDIX D
INSTRUMENT III
Missing Addends
Find the Letters
(1) 8
6
4
x
(2) 305
2 y
(3) 405
4 a
(4) u
18
3
1
(5) 5
315
x (6) w
12
3
2
(7) 153
2 x
(8) y
24
14
3
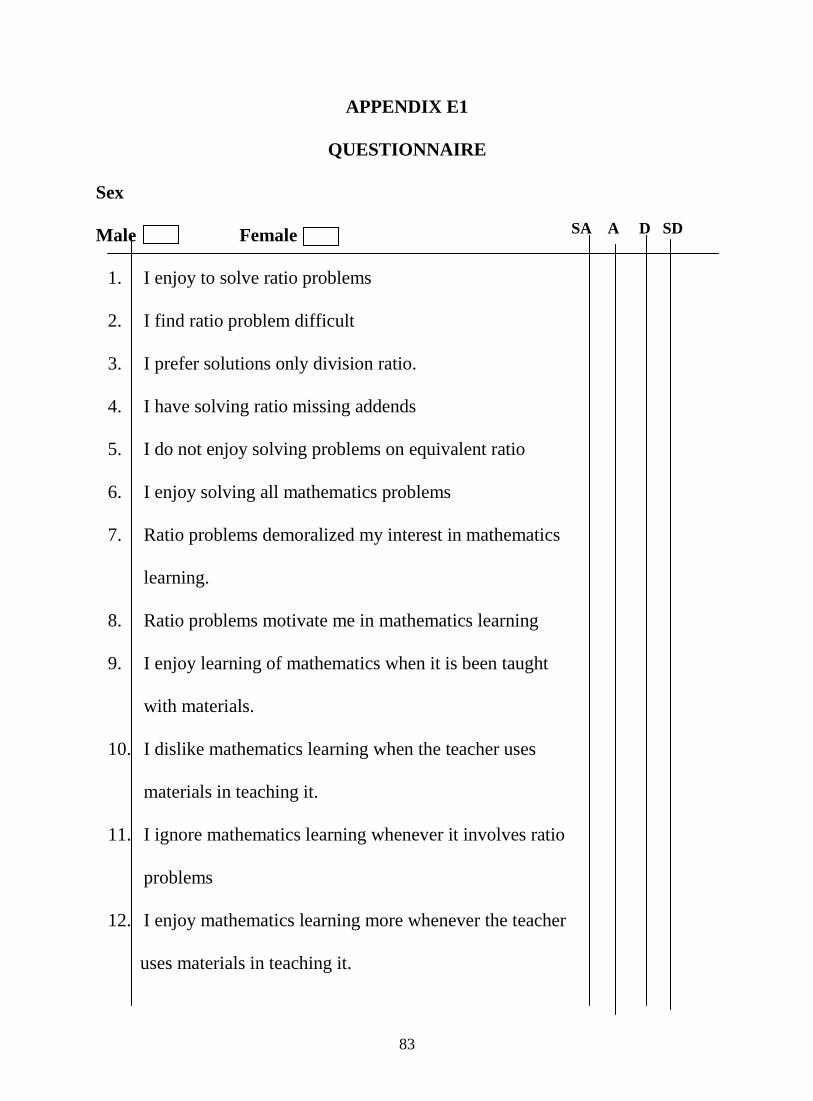
83
APPENDIX E1
QUESTIONNAIRE
Sex
Male Female
1. I enjoy to solve ratio problems
2. I find ratio problem difficult
3. I prefer solutions only division ratio.
4. I have solving ratio missing addends
5. I do not enjoy solving problems on equivalent ratio
6. I enjoy solving all mathematics problems
7. Ratio problems demoralized my interest in mathematics
learning.
8. Ratio problems motivate me in mathematics learning
9. I enjoy learning of mathematics when it is been taught
with materials.
10. I dislike mathematics learning when the teacher uses
materials in teaching it.
11. I ignore mathematics learning whenever it involves ratio
problems
12. I enjoy mathematics learning more whenever the teacher
uses materials in teaching it.
SA A D SD
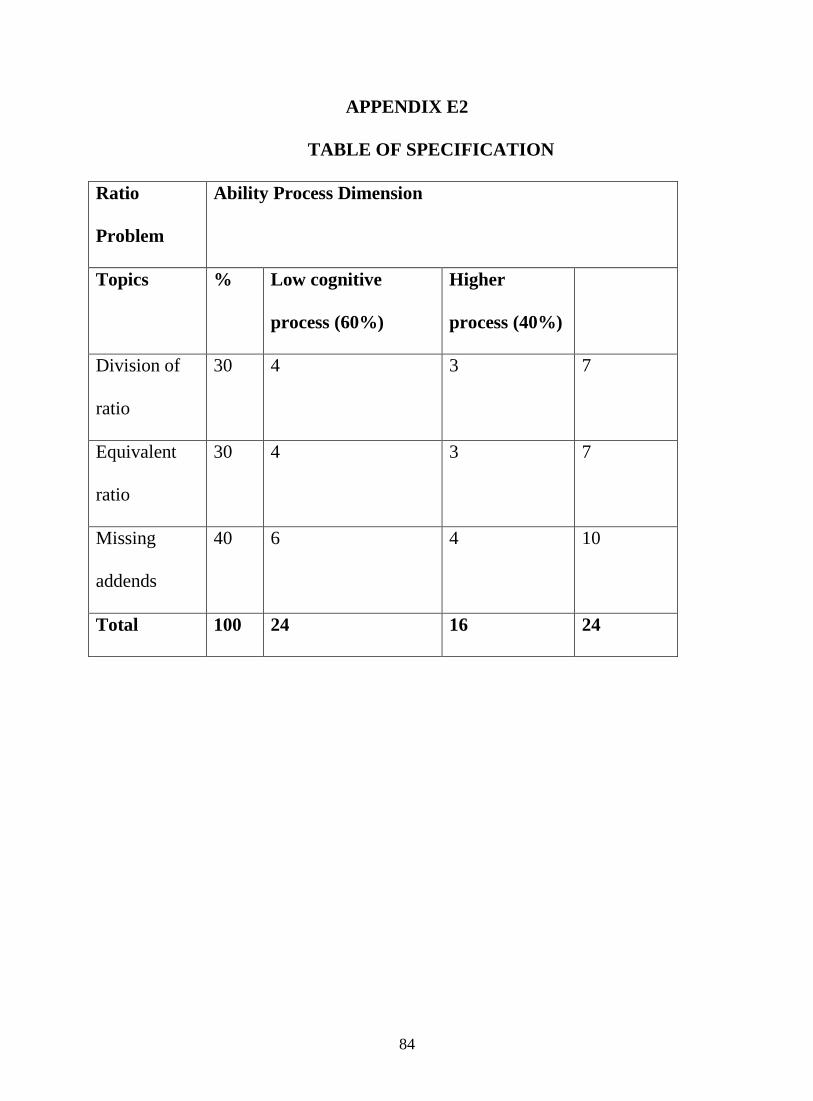
84
APPENDIX E2
TABLE OF SPECIFICATION
Ratio
Problem
Ability Process Dimension
Topics % Low cognitive
process (60%)
Higher
process (40%)
Division of
ratio
30 4 3 7
Equivalent
ratio
30 4 3 7
Missing
addends
40 6 4 10
Total 100 24 16 24
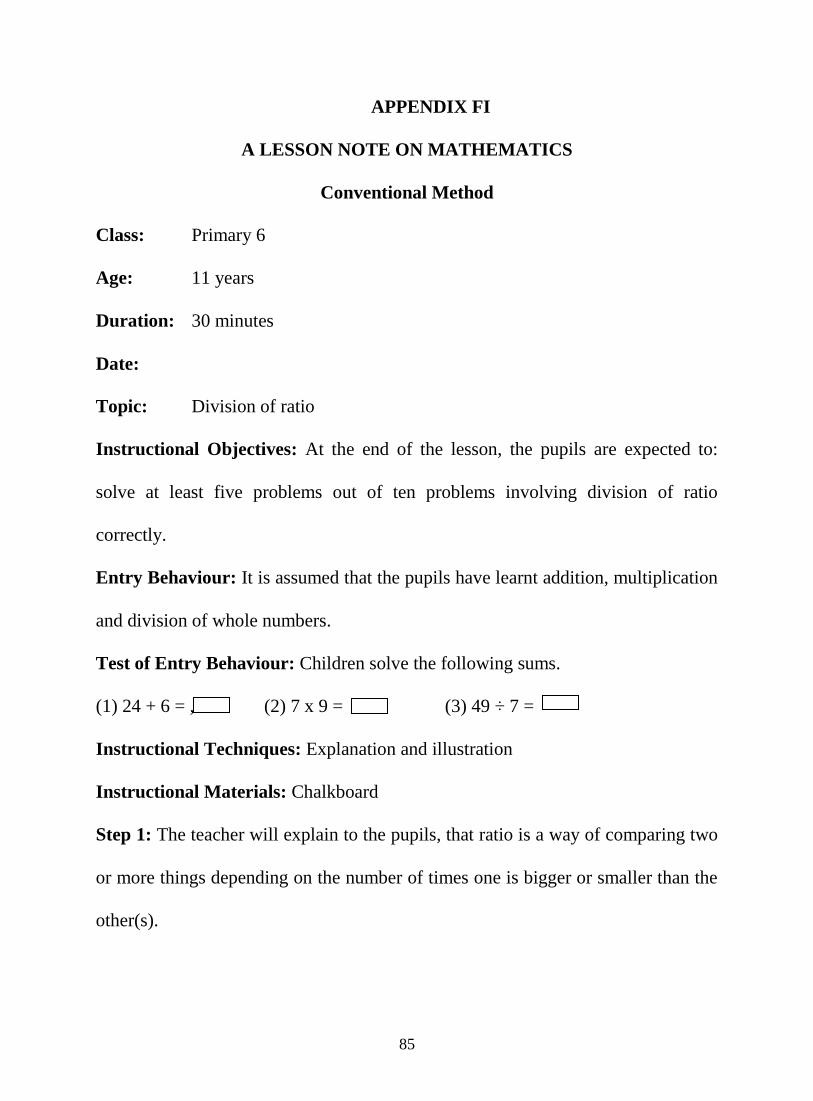
85
APPENDIX FI
A LESSON NOTE ON MATHEMATICS
Conventional Method
Class: Primary 6
Age: 11 years
Duration: 30 minutes
Date:
Topic: Division of ratio
Instructional Objectives: At the end of the lesson, the pupils are expected to:
solve at least five problems out of ten problems involving division of ratio
correctly.
Entry Behaviour: It is assumed that the pupils have learnt addition, multiplication
and division of whole numbers.
Test of Entry Behaviour: Children solve the following sums.
(1) 24 + 6 = , (2) 7 x 9 = (3) 49 ÷ 7 =
Instructional Techniques: Explanation and illustration
Instructional Materials: Chalkboard
Step 1: The teacher will explain to the pupils, that ratio is a way of comparing two
or more things depending on the number of times one is bigger or smaller than the
other(s).
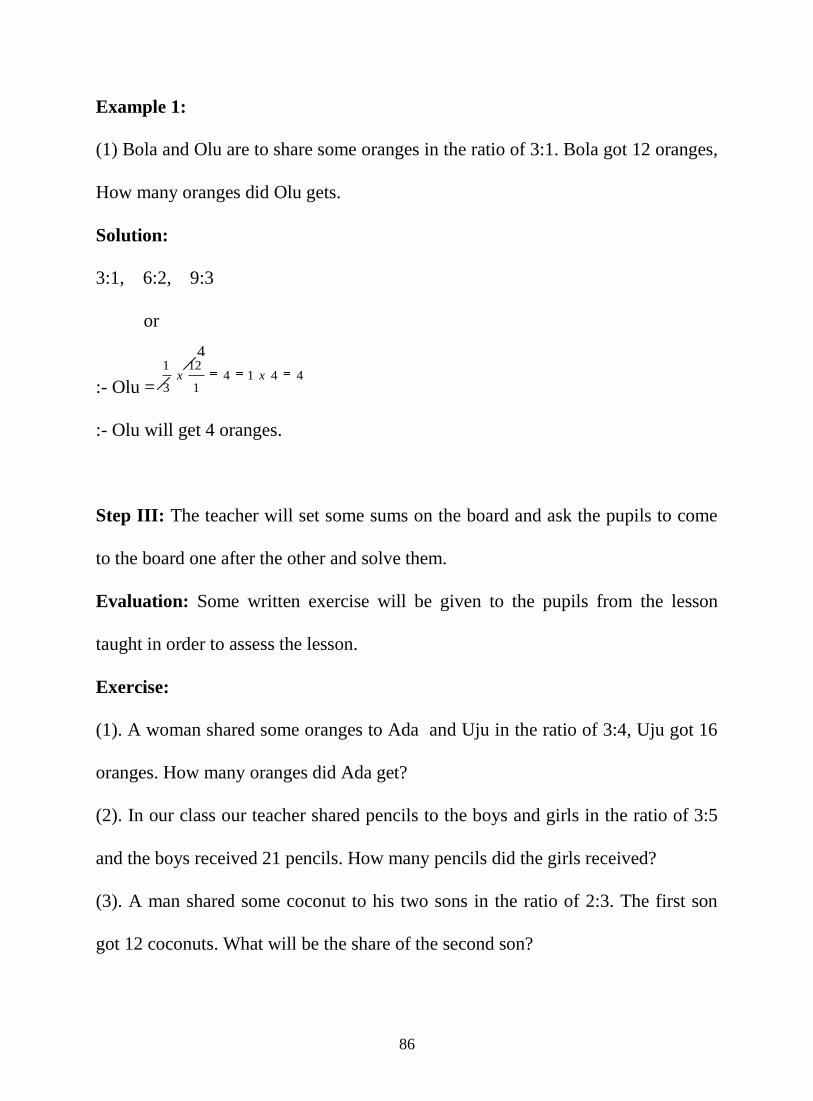
86
Example 1:
(1) Bola and Olu are to share some oranges in the ratio of 3:1. Bola got 12 oranges,
How many oranges did Olu gets.
Solution:
3:1, 6:2, 9:3
or
:- Olu = 4414
1
12
3
1xx
:- Olu will get 4 oranges.
Step III: The teacher will set some sums on the board and ask the pupils to come
to the board one after the other and solve them.
Evaluation: Some written exercise will be given to the pupils from the lesson
taught in order to assess the lesson.
Exercise:
(1). A woman shared some oranges to Ada and Uju in the ratio of 3:4, Uju got 16
oranges. How many oranges did Ada get?
(2). In our class our teacher shared pencils to the boys and girls in the ratio of 3:5
and the boys received 21 pencils. How many pencils did the girls received?
(3). A man shared some coconut to his two sons in the ratio of 2:3. The first son
got 12 coconuts. What will be the share of the second son?
4
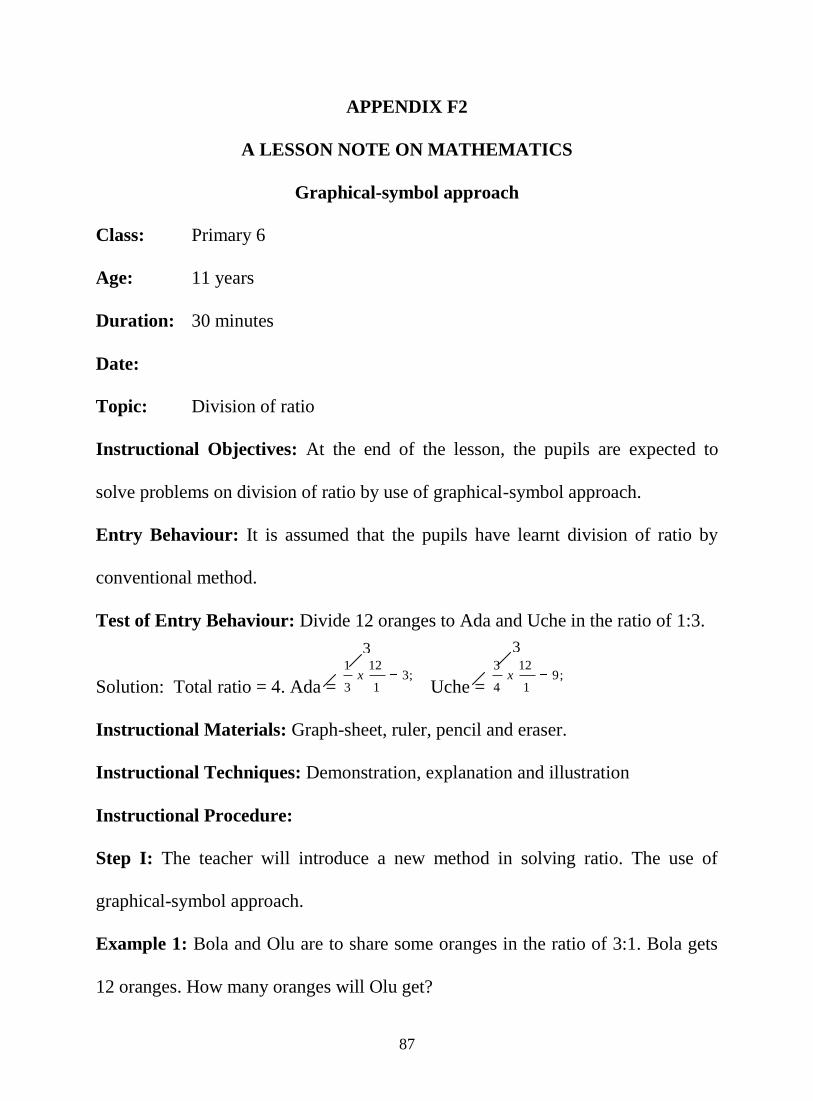
87
APPENDIX F2
A LESSON NOTE ON MATHEMATICS
Graphical-symbol approach
Class: Primary 6
Age: 11 years
Duration: 30 minutes
Date:
Topic: Division of ratio
Instructional Objectives: At the end of the lesson, the pupils are expected to
solve problems on division of ratio by use of graphical-symbol approach.
Entry Behaviour: It is assumed that the pupils have learnt division of ratio by
conventional method.
Test of Entry Behaviour: Divide 12 oranges to Ada and Uche in the ratio of 1:3.
Solution: Total ratio = 4. Ada = ;3
1
12
3
1x
Uche = ;9
1
12
4
3x
Instructional Materials: Graph-sheet, ruler, pencil and eraser.
Instructional Techniques: Demonstration, explanation and illustration
Instructional Procedure:
Step I: The teacher will introduce a new method in solving ratio. The use of
graphical-symbol approach.
Example 1: Bola and Olu are to share some oranges in the ratio of 3:1. Bola gets
12 oranges. How many oranges will Olu get?
3 3
88
Solution:
Let y – axis = Bola, and x – axis = Olu.
See the Graph-sheet I.
Step II: Some exercises will be given to the students to solve on the board. They
will be solving the problems one after the other on the board while the teacher will
be guiding them where necessary.
Example II: John and Ann share some oranges in the ratio of 3:1, John gets 12
oranges. Find the number of oranges Ann will get.
Example III: A farmer shares some cows between his two sons, Aliyu and Madaki
in the ratio of 6.5. Aliyu gets 30 cows. How many cows Madaki gets.
Step III: The teacher will guide the children on how to plot the graph.
Evaluation: Some written exercises would be given to the pupils in order to assess
the lesson taught. Graphical-symbol approach is to be used to solve the problem.
Exercise:
(1). A woman shared some oranges to Ada and Uju in the ratio of 3:4, Uju got 16
oranges. How many oranges did Ada get?
(2). In our class our teacher shared pencils to the boys and girls in the ratio of 3:5
and the boys received 21 pencils. How many pencils did the girls received?
(3). A man shared some coconut to his two sons in the ratio of 2:3. The first son
got 12 coconuts. What will be the share of the second son?
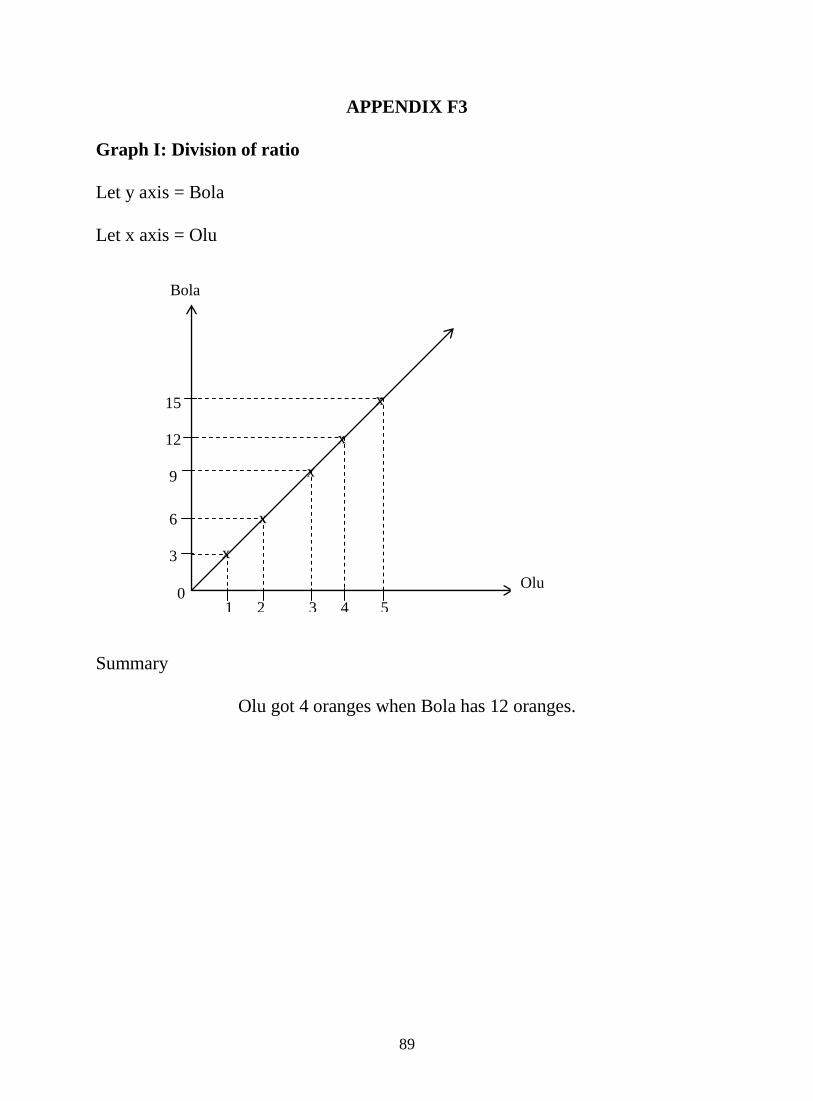
89
Bola
x
x
x
x
x
APPENDIX F3
Graph I: Division of ratio
Let y axis = Bola
Let x axis = Olu
Summary
Olu got 4 oranges when Bola has 12 oranges.
15
12
9
6
3
0 1 2 3 4 5
Olu
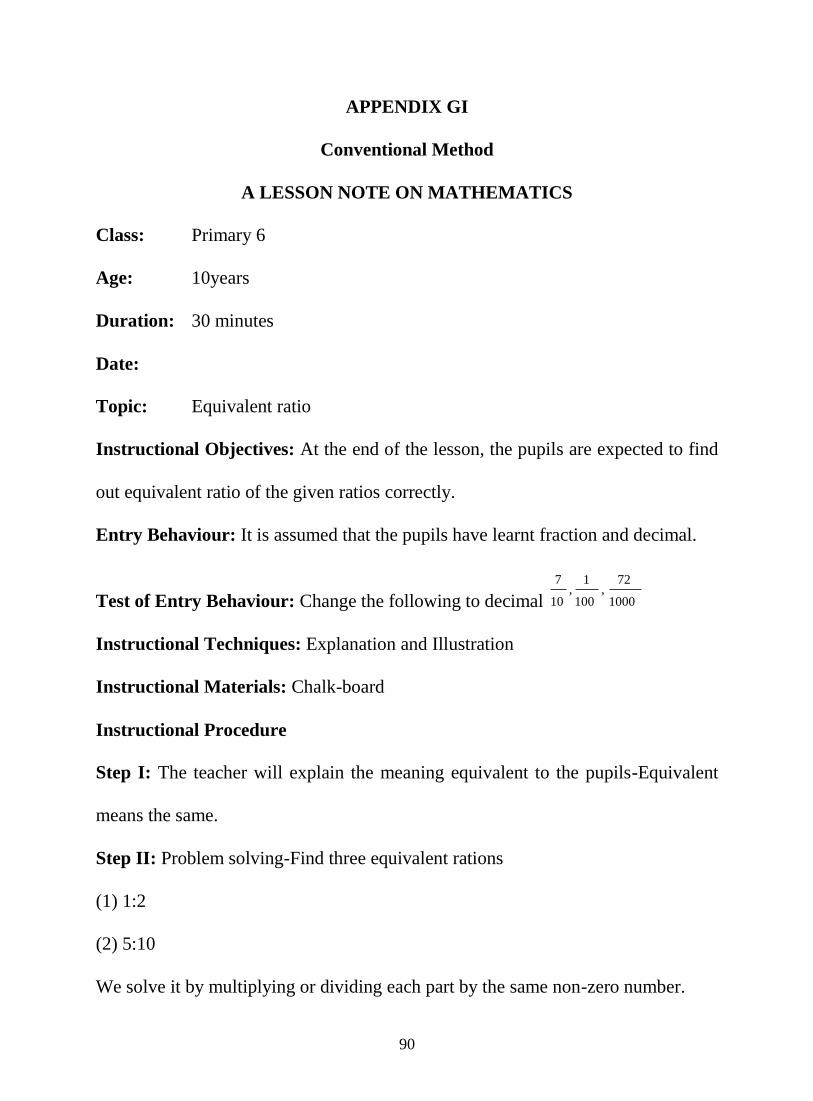
90
APPENDIX GI
Conventional Method
A LESSON NOTE ON MATHEMATICS
Class: Primary 6
Age: 10years
Duration: 30 minutes
Date:
Topic: Equivalent ratio
Instructional Objectives: At the end of the lesson, the pupils are expected to find
out equivalent ratio of the given ratios correctly.
Entry Behaviour: It is assumed that the pupils have learnt fraction and decimal.
Test of Entry Behaviour: Change the following to decimal 1000
72,
100
1,
10
7
Instructional Techniques: Explanation and Illustration
Instructional Materials: Chalk-board
Instructional Procedure
Step I: The teacher will explain the meaning equivalent to the pupils-Equivalent
means the same.
Step II: Problem solving-Find three equivalent rations
(1) 1:2
(2) 5:10
We solve it by multiplying or dividing each part by the same non-zero number.
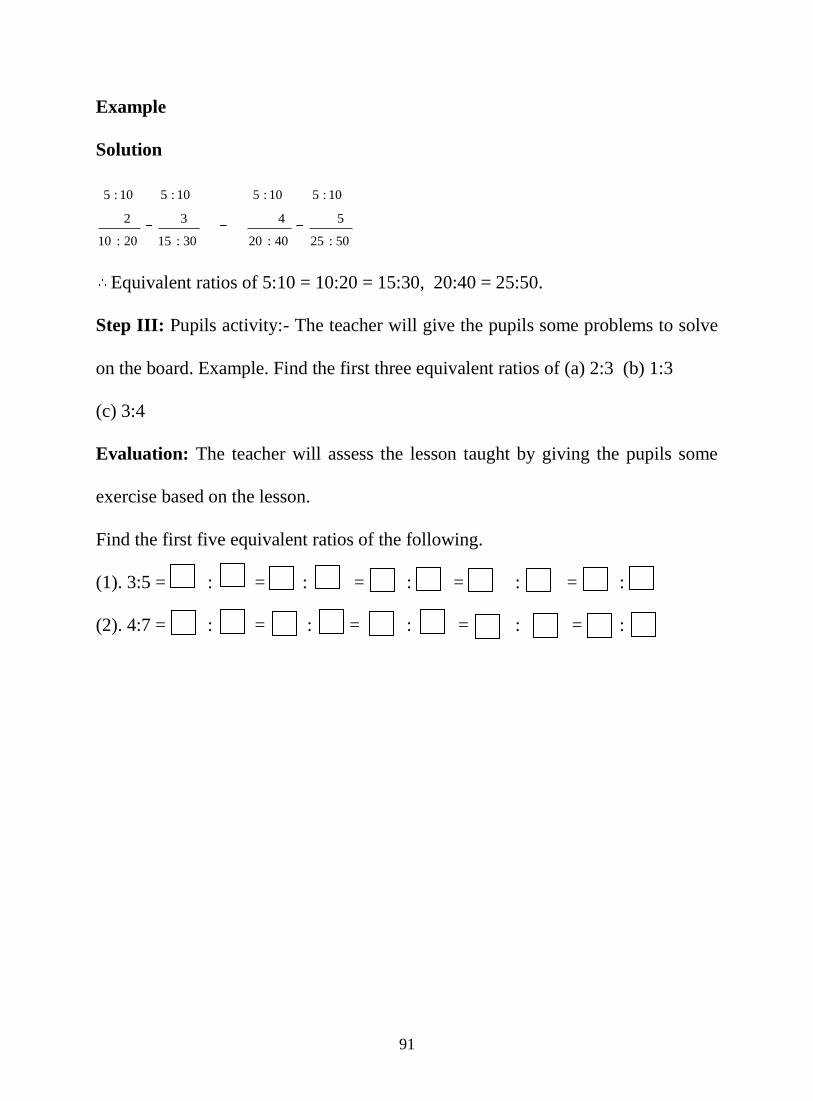
91
Example
Solution
50:25
5
10:5
40:20
4
10:5
30:15
3
10:5
20:10
2
10:5
Equivalent ratios of 5:10 = 10:20 = 15:30, 20:40 = 25:50.
Step III: Pupils activity:- The teacher will give the pupils some problems to solve
on the board. Example. Find the first three equivalent ratios of (a) 2:3 (b) 1:3
(c) 3:4
Evaluation: The teacher will assess the lesson taught by giving the pupils some
exercise based on the lesson.
Find the first five equivalent ratios of the following.
(1). 3:5 = : = : = : = : = :
(2). 4:7 = : = : = : = : = :
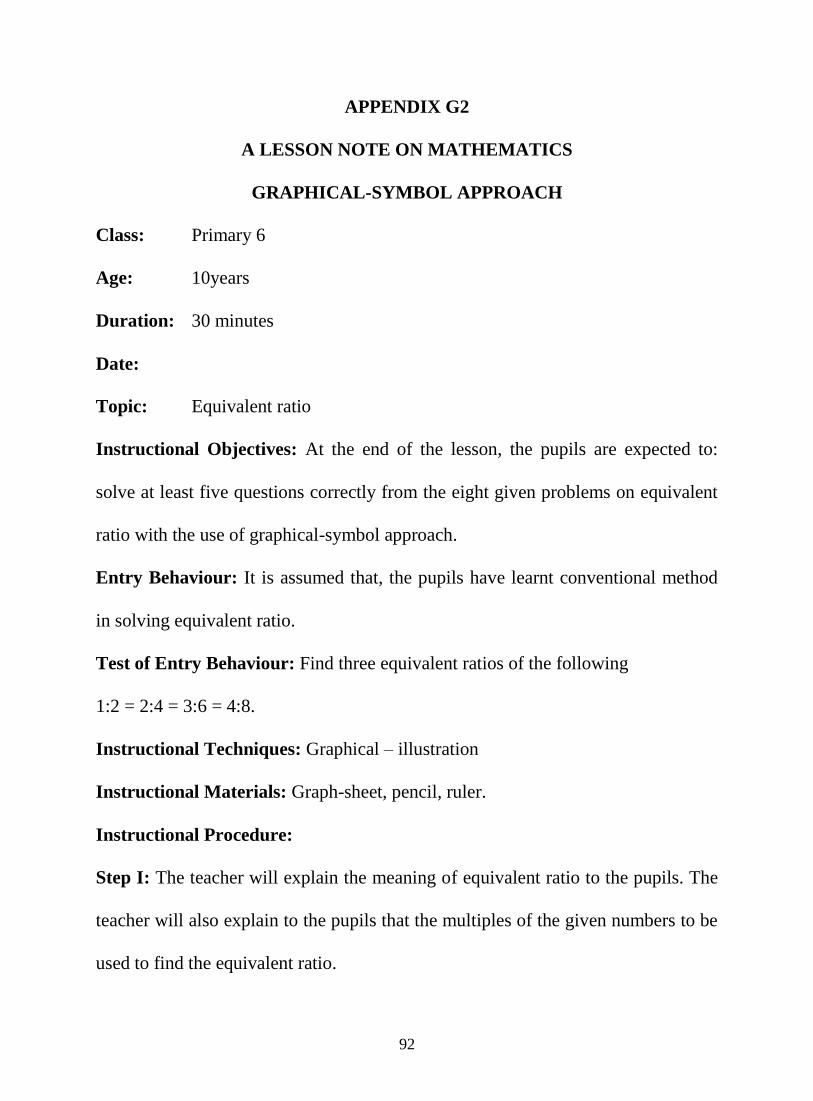
92
APPENDIX G2
A LESSON NOTE ON MATHEMATICS
GRAPHICAL-SYMBOL APPROACH
Class: Primary 6
Age: 10years
Duration: 30 minutes
Date:
Topic: Equivalent ratio
Instructional Objectives: At the end of the lesson, the pupils are expected to:
solve at least five questions correctly from the eight given problems on equivalent
ratio with the use of graphical-symbol approach.
Entry Behaviour: It is assumed that, the pupils have learnt conventional method
in solving equivalent ratio.
Test of Entry Behaviour: Find three equivalent ratios of the following
1:2 = 2:4 = 3:6 = 4:8.
Instructional Techniques: Graphical – illustration
Instructional Materials: Graph-sheet, pencil, ruler.
Instructional Procedure:
Step I: The teacher will explain the meaning of equivalent ratio to the pupils. The
teacher will also explain to the pupils that the multiples of the given numbers to be
used to find the equivalent ratio.
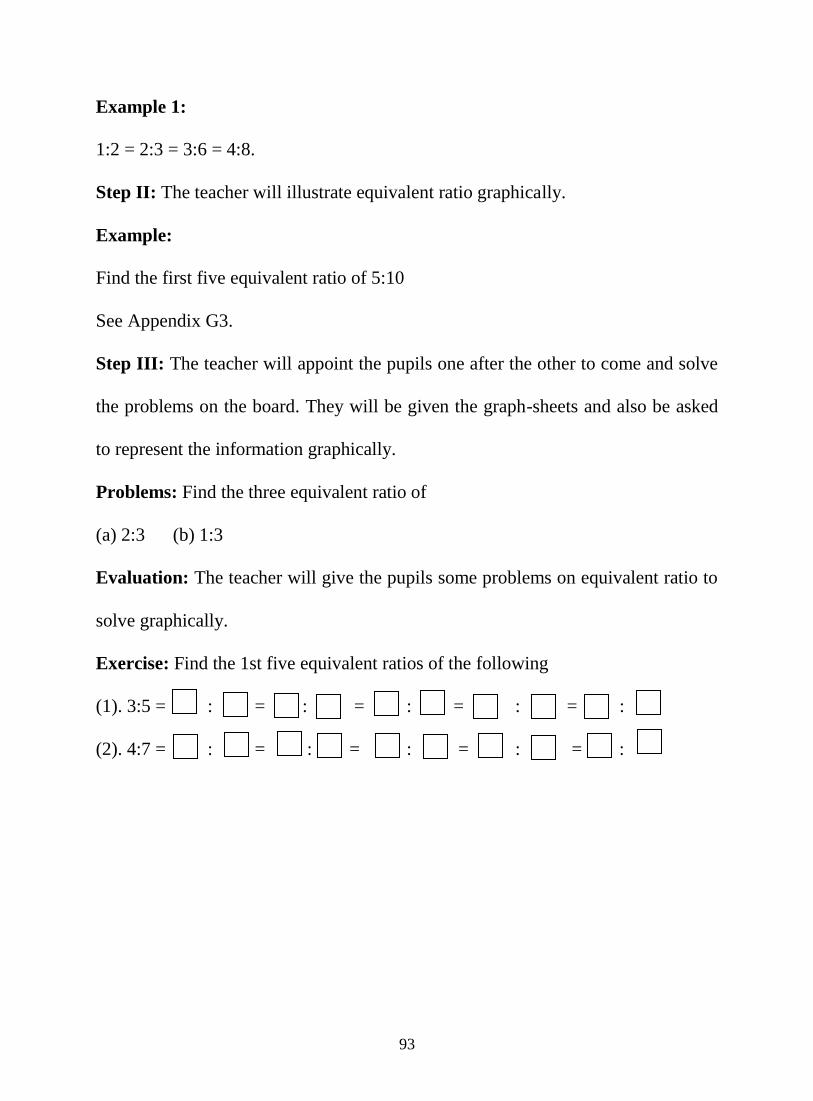
93
Example 1:
1:2 = 2:3 = 3:6 = 4:8.
Step II: The teacher will illustrate equivalent ratio graphically.
Example:
Find the first five equivalent ratio of 5:10
See Appendix G3.
Step III: The teacher will appoint the pupils one after the other to come and solve
the problems on the board. They will be given the graph-sheets and also be asked
to represent the information graphically.
Problems: Find the three equivalent ratio of
(a) 2:3 (b) 1:3
Evaluation: The teacher will give the pupils some problems on equivalent ratio to
solve graphically.
Exercise: Find the 1st five equivalent ratios of the following
(1). 3:5 = : = : = : = : = :
(2). 4:7 = : = : = : = : = :
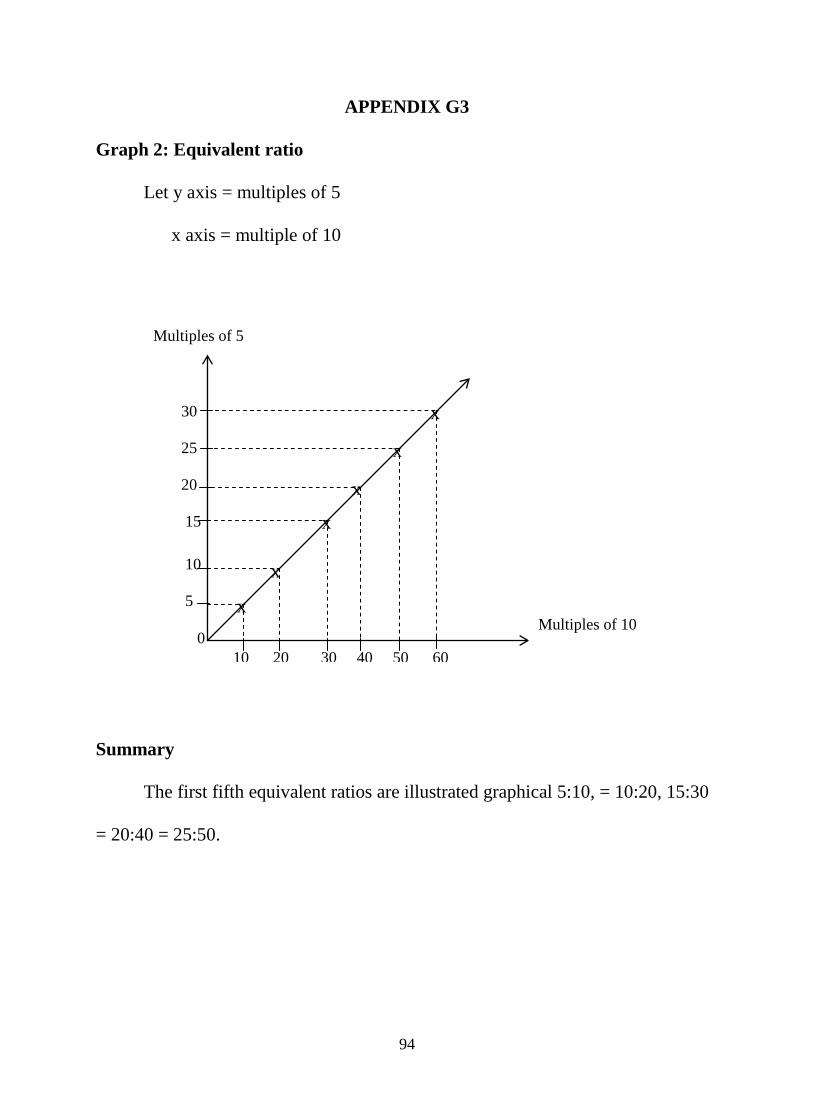
94
Multiples of 5
x
x
x
x
x
x
APPENDIX G3
Graph 2: Equivalent ratio
Let y axis = multiples of 5
x axis = multiple of 10
Summary
The first fifth equivalent ratios are illustrated graphical 5:10, = 10:20, 15:30
= 20:40 = 25:50.
30
25
20
15
10
5
0
10 20 30 40 50 60
Multiples of 10
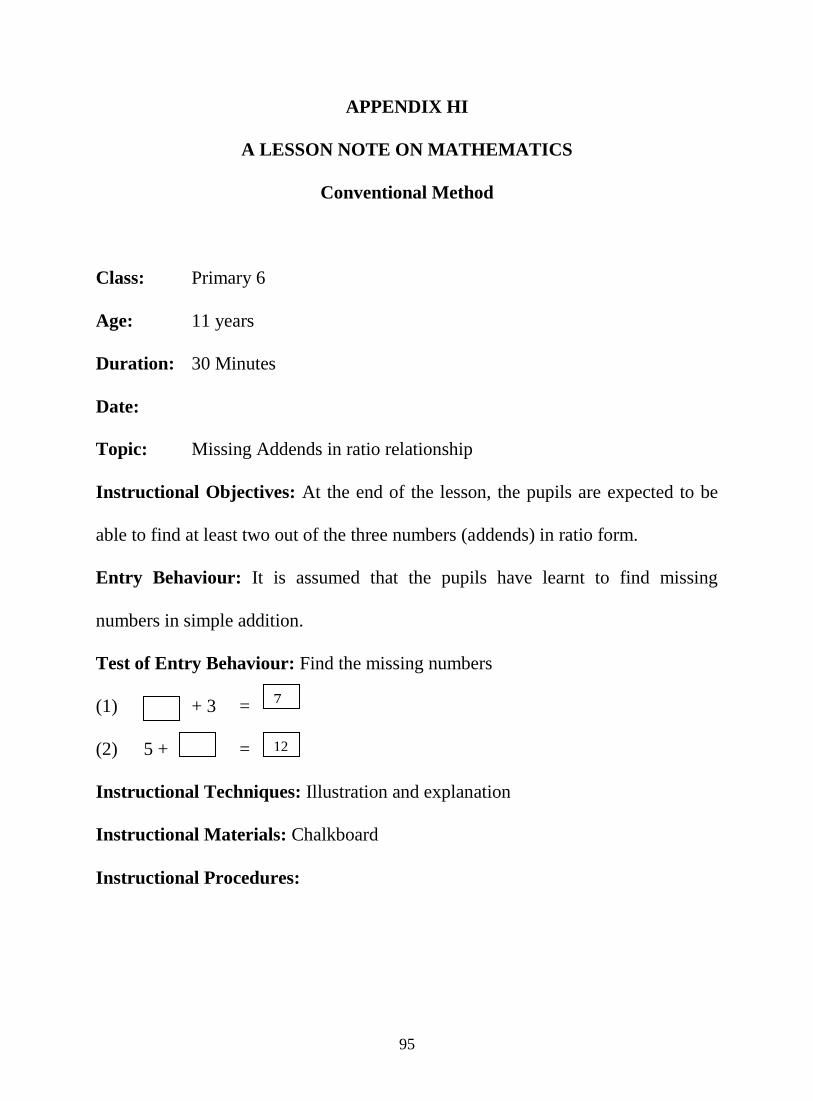
95
APPENDIX HI
A LESSON NOTE ON MATHEMATICS
Conventional Method
Class: Primary 6
Age: 11 years
Duration: 30 Minutes
Date:
Topic: Missing Addends in ratio relationship
Instructional Objectives: At the end of the lesson, the pupils are expected to be
able to find at least two out of the three numbers (addends) in ratio form.
Entry Behaviour: It is assumed that the pupils have learnt to find missing
numbers in simple addition.
Test of Entry Behaviour: Find the missing numbers
(1) + 3 =
(2) 5 + =
Instructional Techniques: Illustration and explanation
Instructional Materials: Chalkboard
Instructional Procedures:
7
12
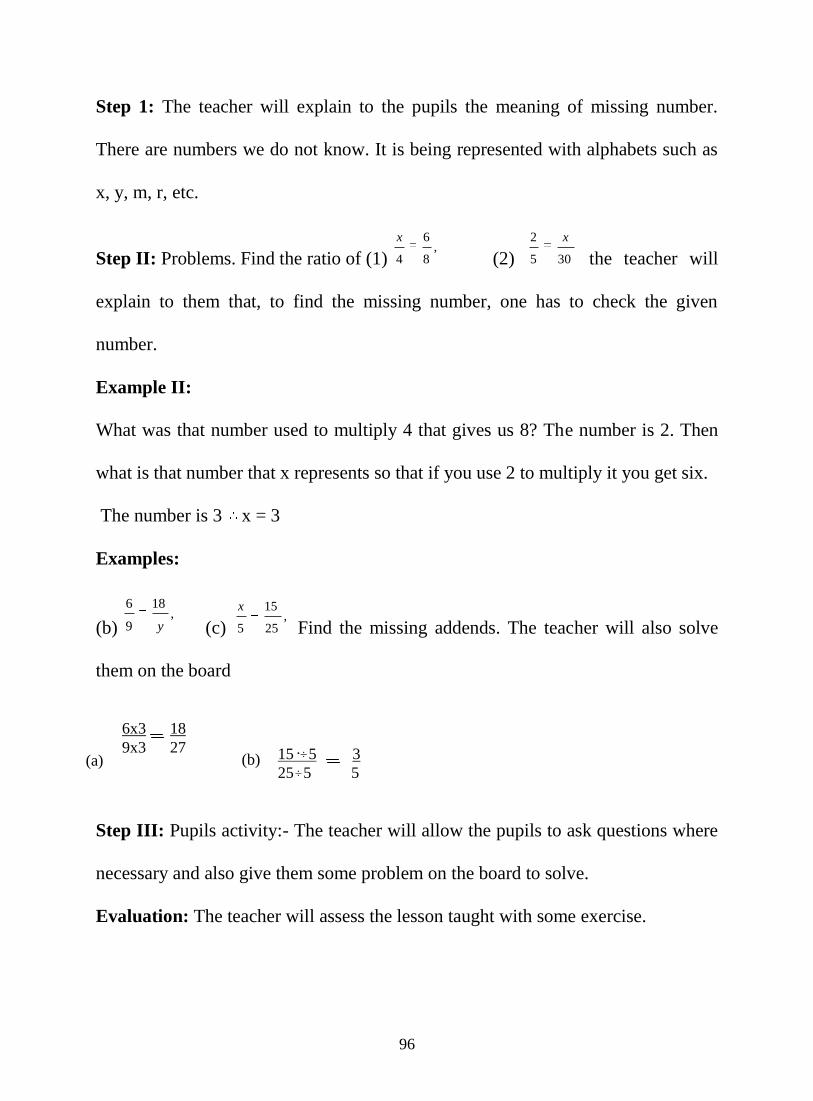
96
Step 1: The teacher will explain to the pupils the meaning of missing number.
There are numbers we do not know. It is being represented with alphabets such as
x, y, m, r, etc.
Step II: Problems. Find the ratio of (1) ,
8
6
4
x
(2) 305
2 x
the teacher will
explain to them that, to find the missing number, one has to check the given
number.
Example II:
What was that number used to multiply 4 that gives us 8? The number is 2. Then
what is that number that x represents so that if you use 2 to multiply it you get six.
The number is 3 x = 3
Examples:
(b) ,
18
9
6
y (c) ,
25
15
5
x
Find the missing addends. The teacher will also solve
them on the board
Step III: Pupils activity:- The teacher will allow the pupils to ask questions where
necessary and also give them some problem on the board to solve.
Evaluation: The teacher will assess the lesson taught with some exercise.
15·5 3
255 5 (b)
6x3 18
9x3 27 (a)
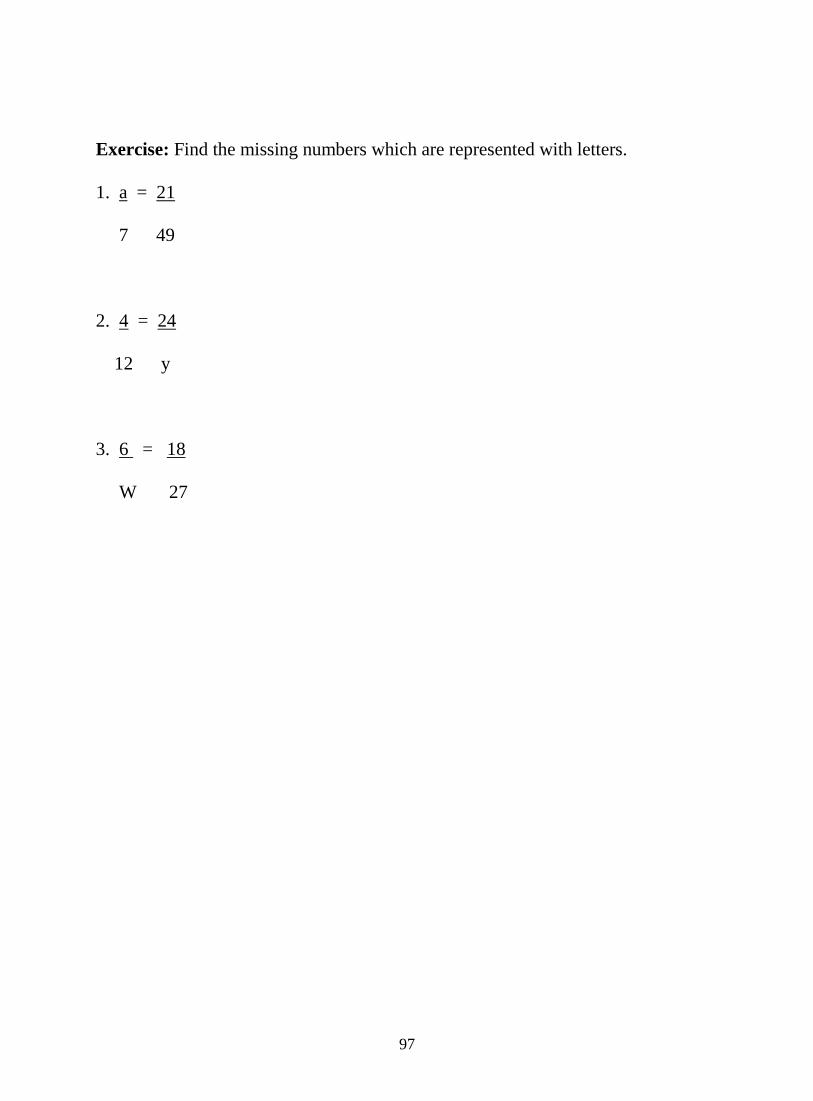
97
Exercise: Find the missing numbers which are represented with letters.
1. a = 21
7 49
2. 4 = 24
12 y
3. 6 = 18
W 27
98
APPENDIX H2
A LESSON NOTE ON MATHEMATICS
GRAPHICAL-SYMBOL APPROACH
Class: Primary 6
Age: 11 years
Duration: 30 minutes
Date:
Topic: Missing Addends in ratio relationship
Instructional Objectives: The end of the lesson, the pupils are expected to:
(1) Find the missing numbers in ratio relationship with the use of graphical-symbol
approach.
Entry Behaviour: It is assumed that the pupils have learnt missing addends in
ratio relationship by conventional method. And will also have the idea of factors
and multiples.
Test of Entry Behaviour: Find the missing numbers
(a) ,
8
6
4
x
(b) y
18
9
6
Solution: (a) ,
8
6
4
3
(b) 27
18
9
6
Instructional Techniques: Graphical illustration
Instructional Materials: Graph-sheet, ruler, pencil, eraser.
Instructional Procedures:
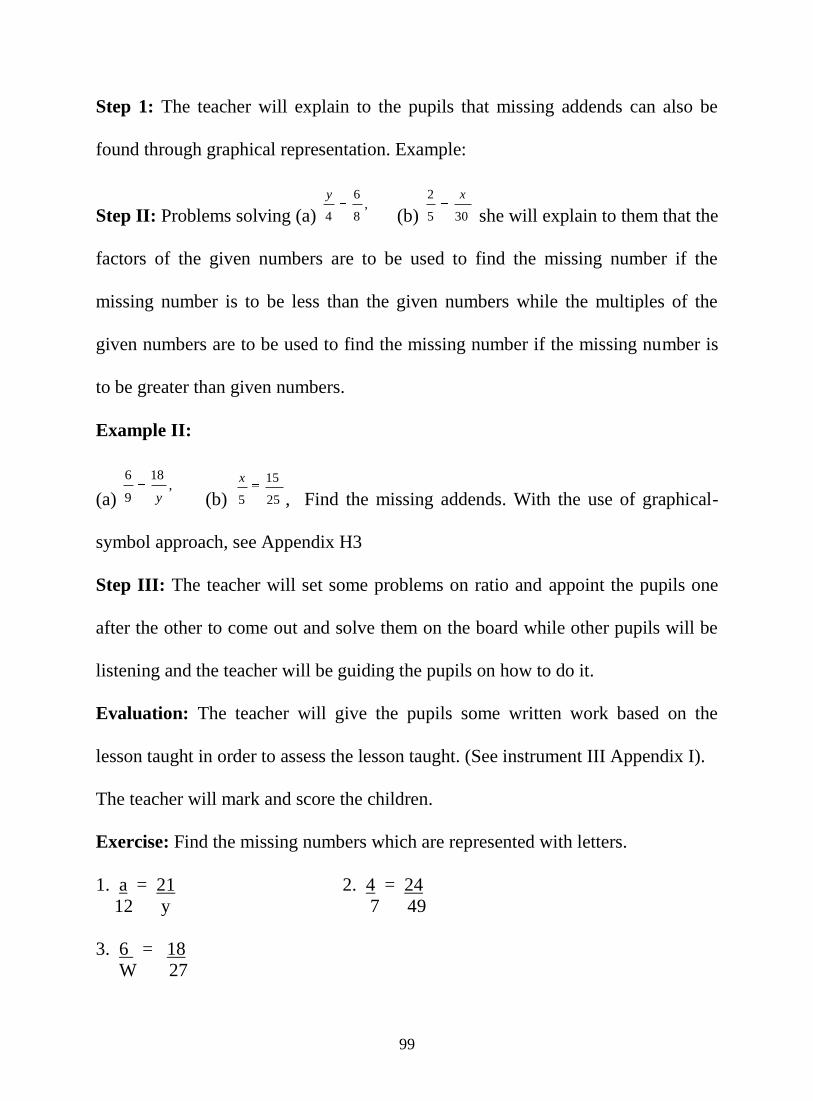
99
Step 1: The teacher will explain to the pupils that missing addends can also be
found through graphical representation. Example:
Step II: Problems solving (a) ,
8
6
4
y
(b) 305
2 x
she will explain to them that the
factors of the given numbers are to be used to find the missing number if the
missing number is to be less than the given numbers while the multiples of the
given numbers are to be used to find the missing number if the missing number is
to be greater than given numbers.
Example II:
(a) ,
18
9
6
y (b) 25
15
5
x
, Find the missing addends. With the use of graphical-
symbol approach, see Appendix H3
Step III: The teacher will set some problems on ratio and appoint the pupils one
after the other to come out and solve them on the board while other pupils will be
listening and the teacher will be guiding the pupils on how to do it.
Evaluation: The teacher will give the pupils some written work based on the
lesson taught in order to assess the lesson taught. (See instrument III Appendix I).
The teacher will mark and score the children.
Exercise: Find the missing numbers which are represented with letters.
1. a = 21 2. 4 = 24
12 y 7 49
3. 6 = 18
W 27
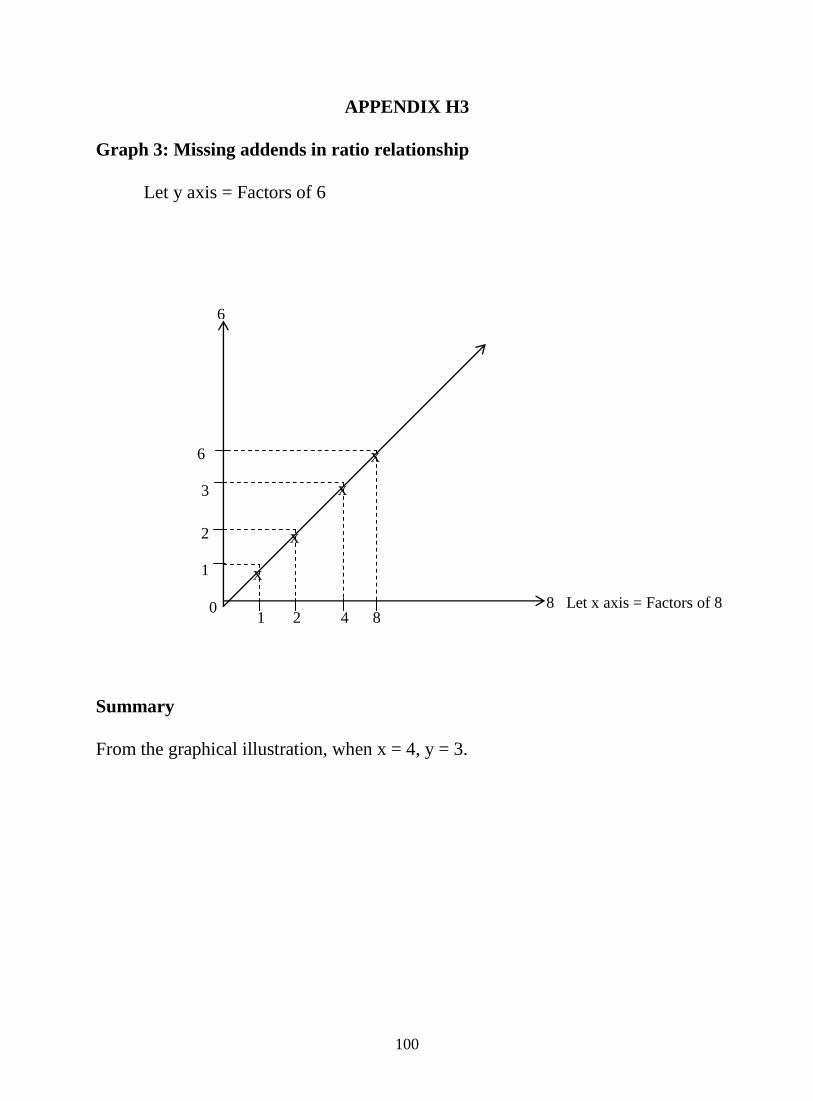
100
x
x
x
x
APPENDIX H3
Graph 3: Missing addends in ratio relationship
Let y axis = Factors of 6
Summary
From the graphical illustration, when x = 4, y = 3.
6
3
2
1
0 1 2 4 8
8 Let x axis = Factors of 8
6
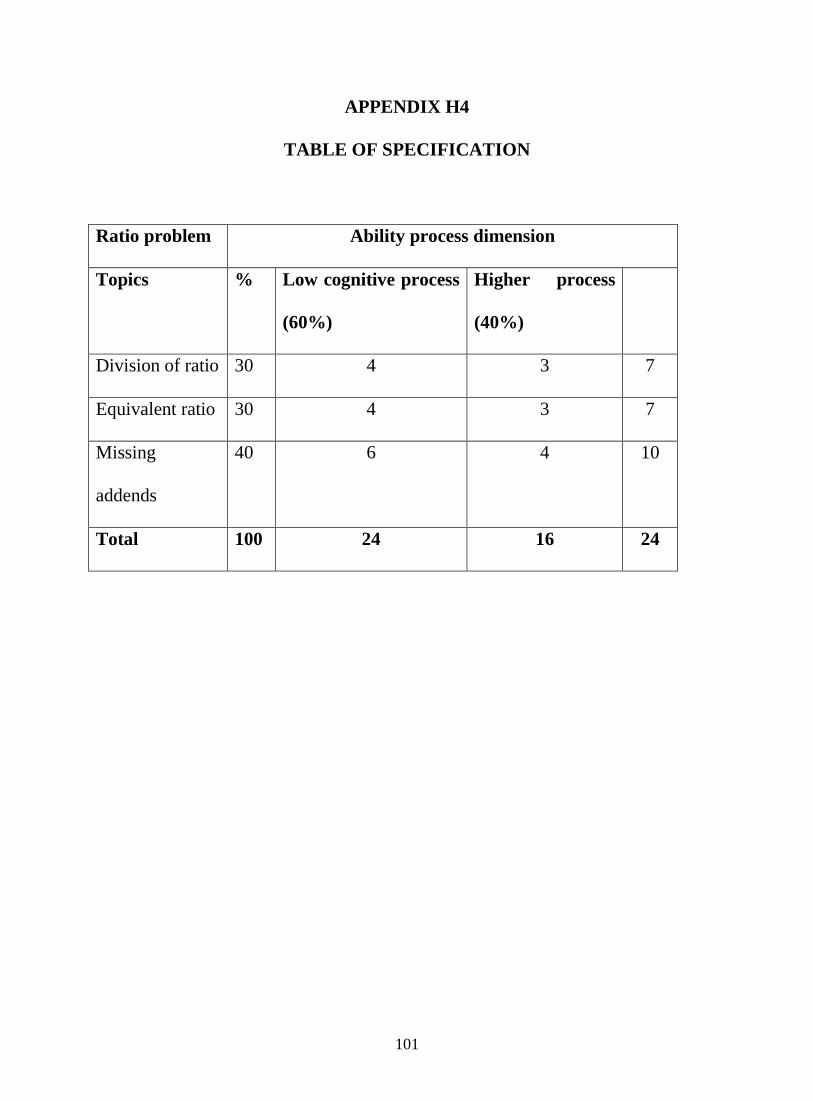
101
APPENDIX H4
TABLE OF SPECIFICATION
Ratio problem Ability process dimension
Topics % Low cognitive process
(60%)
Higher process
(40%)
Division of ratio 30 4 3 7
Equivalent ratio 30 4 3 7
Missing
addends
40 6 4 10
Total 100 24 16 24
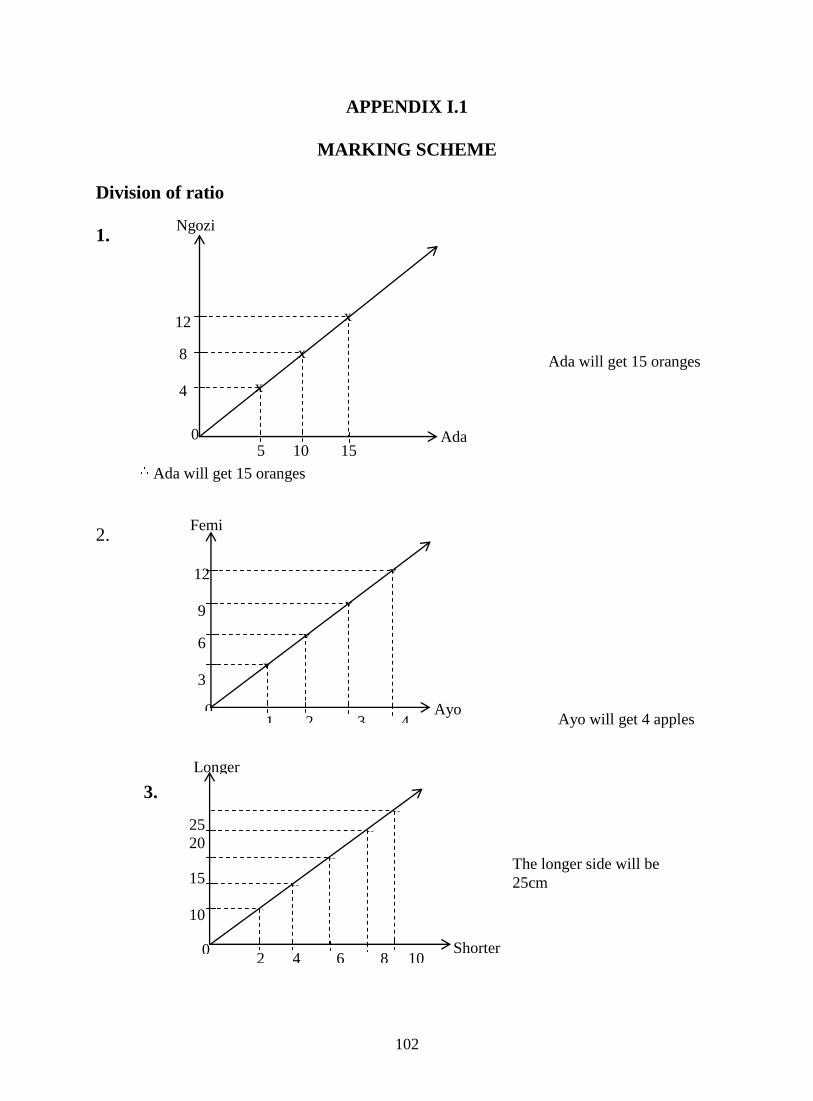
102
APPENDIX I.1
MARKING SCHEME
Division of ratio
1.
2.
3.
12
8
4
0
5 10 15
x
x
x
Ngozi
Ada
12
9
6
3
1 2 3 4
x
x
x
Femi
Ayo
x
0
25
20
15
10
5
2 4 6 8 10
x
x
x
Longer
side
Shorter
side
x
0
x
Ayo will get 4 apples
Ada will get 15 oranges
The longer side will be
25cm
Ada will get 15 oranges
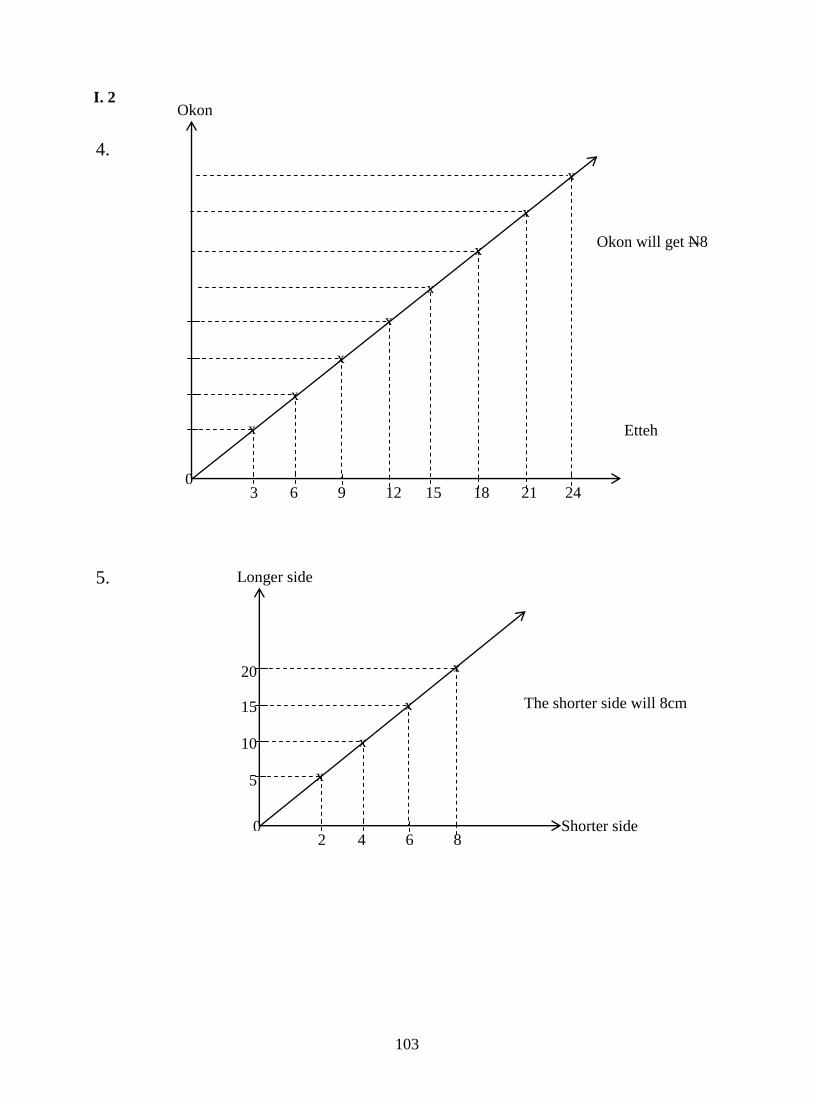
103
Okon will get N8
4.
5.
20
15
10
5
2 4 6 8
x
x
x
Longer side
Shorter side
x
0
The shorter side will 8cm
I. 2
Etteh
Okon
3 6 9 12 15 18 21 24
x
x
x
x
0
x
x
x
x
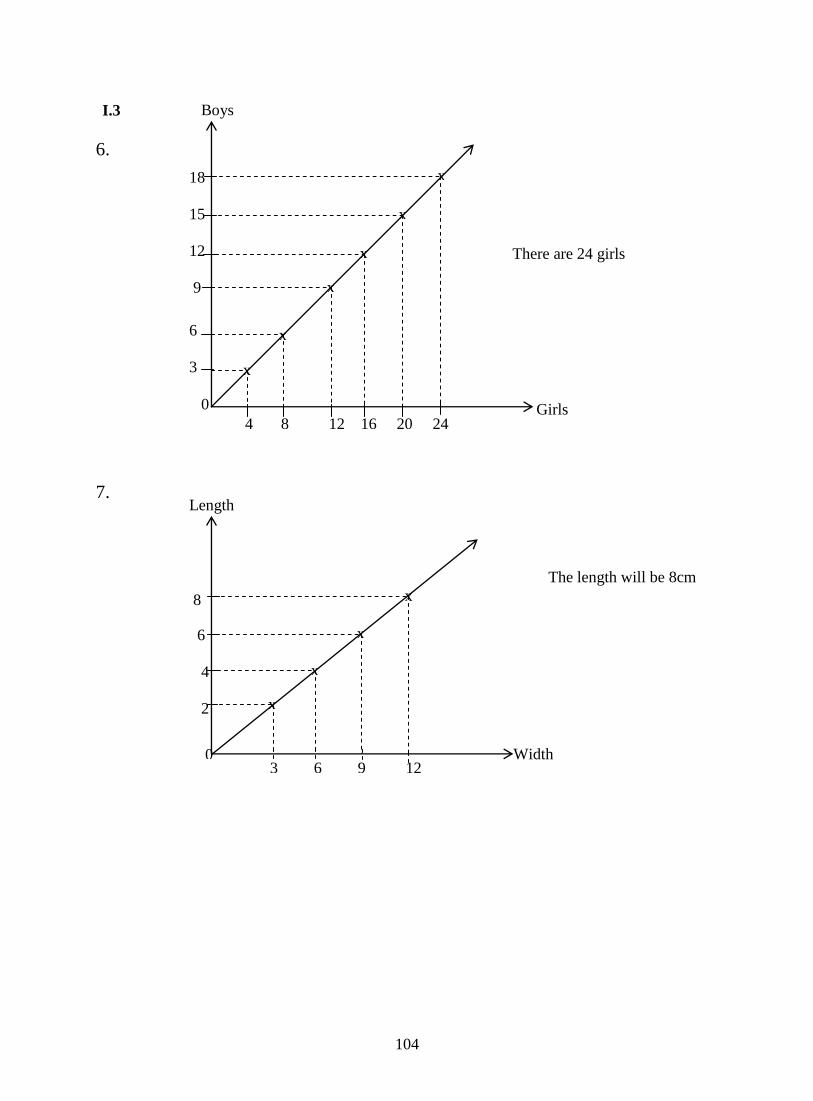
104
6.
7.
8
6
4
2
3 6 9 12
x
x
x
Length
Width
x
0
18
15
12
9
6
3
0
4 8 12 16 20 24
Boys
Girls
x
x
x
x
x
x
There are 24 girls
The length will be 8cm
I.3
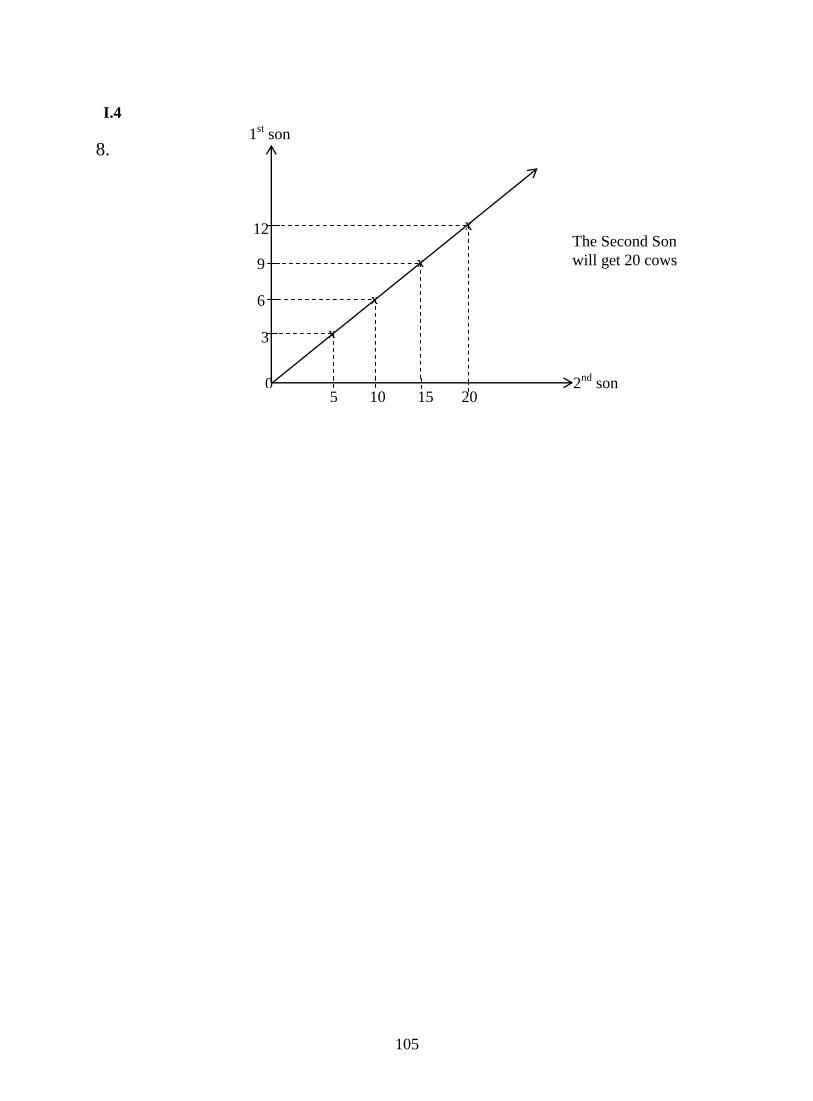
105
8.
12
9
6
3
5 10 15 20
x
x
x
1st son
2nd
son
x
0
I.4
The Second Son
will get 20 cows
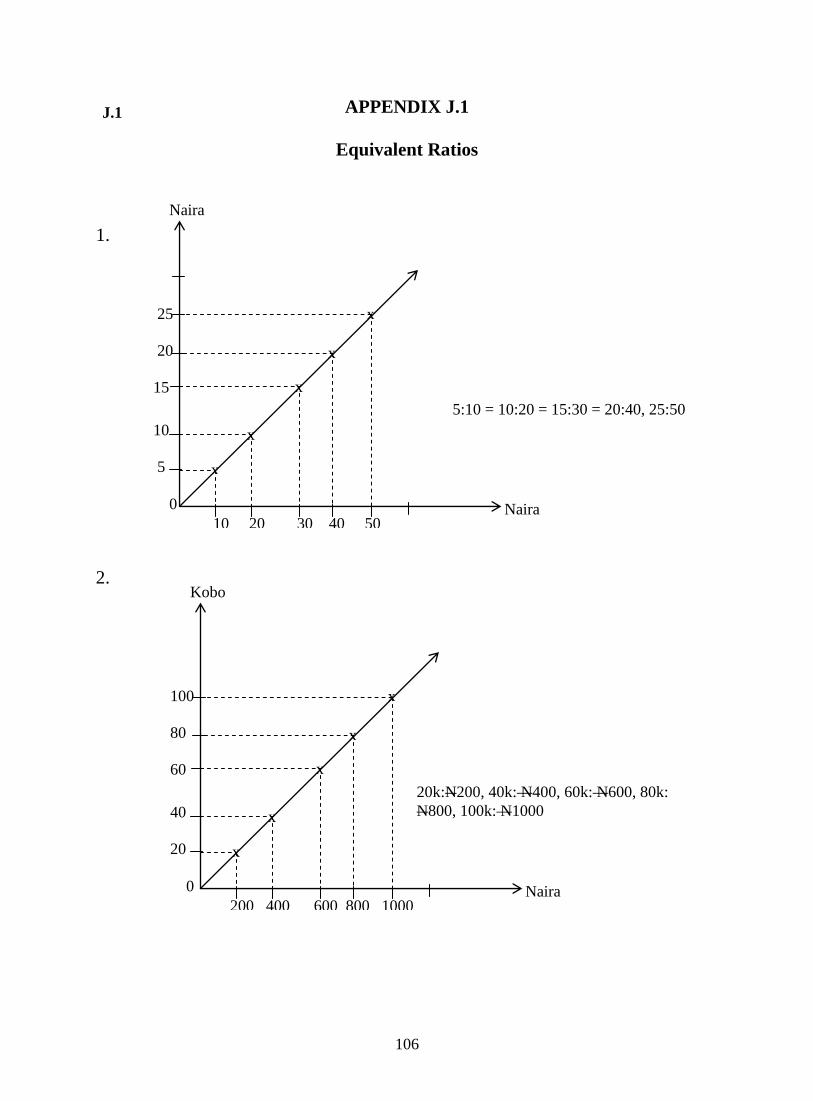
106
APPENDIX J.1
Equivalent Ratios
1.
2.
25
20
15
10
5
0
10 20 30 40 50
Naira
Naira
x
x
x
x
x
100
80
60
40
20
0
200 400 600 800 1000
Kobo
Naira
x
x
x
x
x
5:10 = 10:20 = 15:30 = 20:40, 25:50
20k:N200, 40k: N400, 60k: N600, 80k:
N800, 100k: N1000
J.1
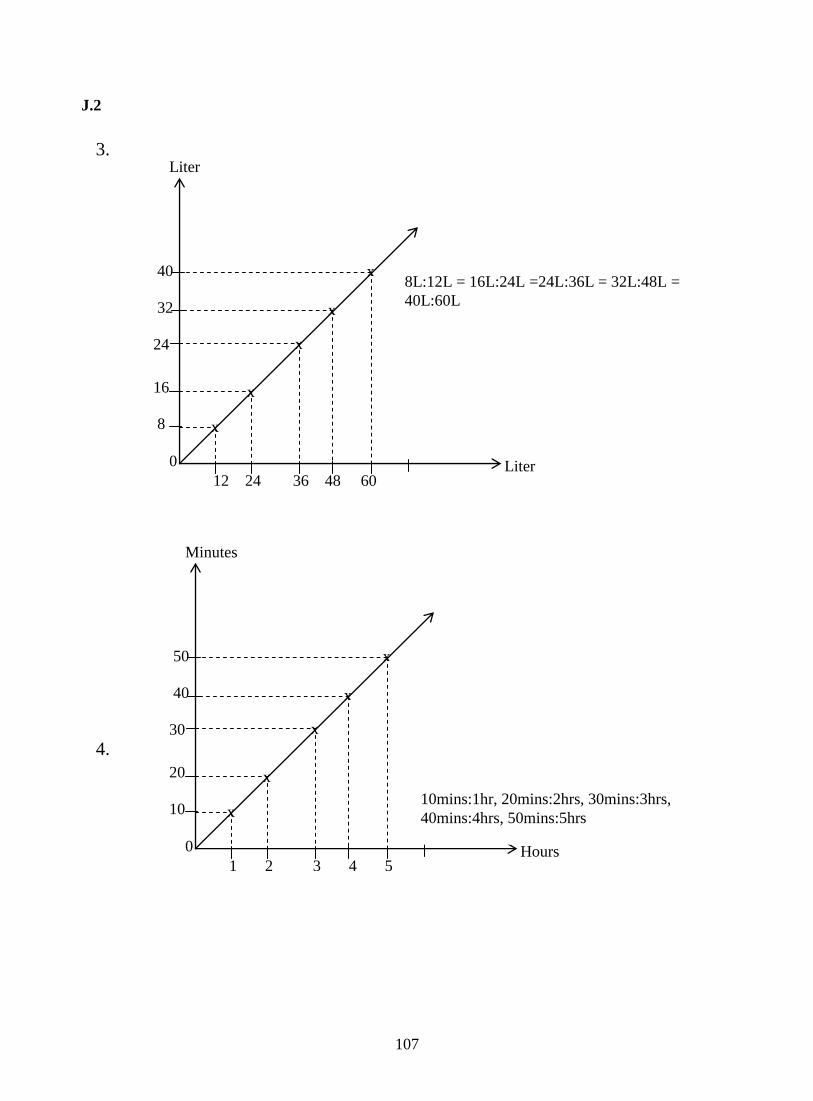
107
3.
4.
40
32
24
16
8
0
12 24 36 48 60
Liter
Liter
x
x
x
x
x
50
40
30
20
10
0
1 2 3 4 5
Minutes
Hours
x
x
x
x
x
J.2
8L:12L = 16L:24L =24L:36L = 32L:48L =
40L:60L
10mins:1hr, 20mins:2hrs, 30mins:3hrs,
40mins:4hrs, 50mins:5hrs
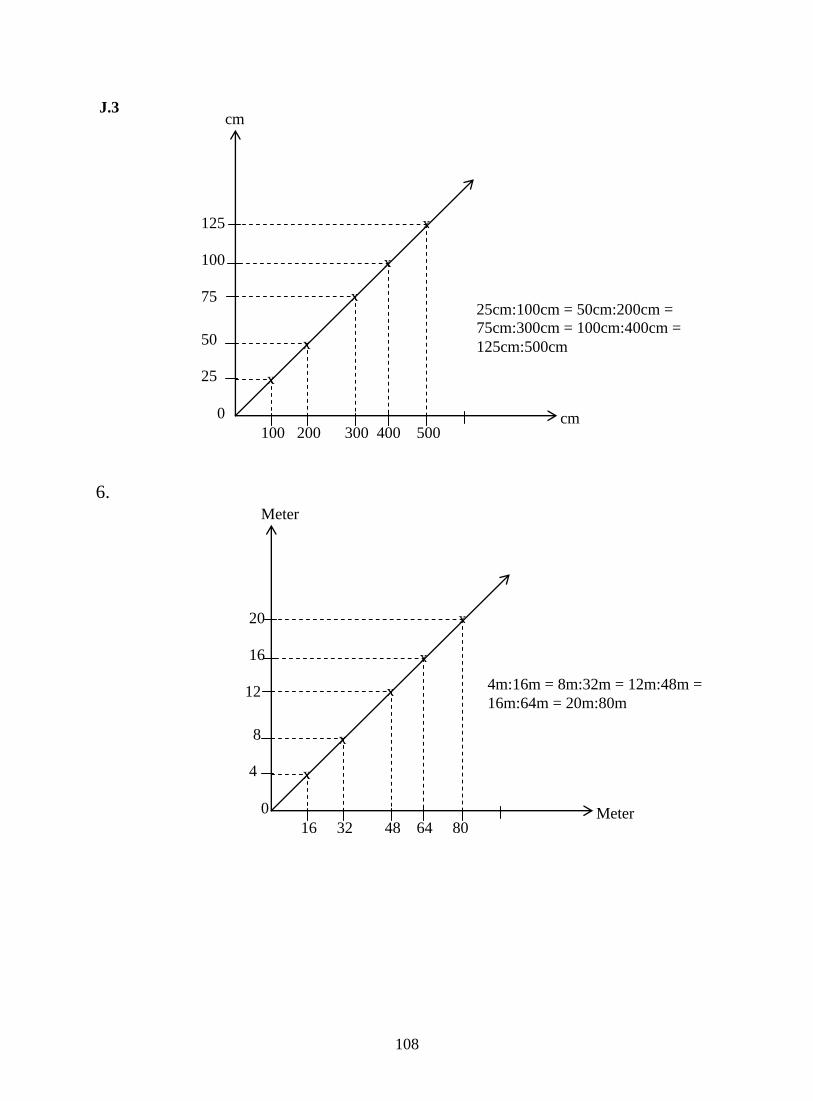
108
6.
125
100
75
50
25
0
100 200 300 400 500
cm
cm
x
x
x
x
x
20
16
12
8
4
0
16 32 48 64 80
Meter
Meter
x
x
x
x
x
J.3
25cm:100cm = 50cm:200cm =
75cm:300cm = 100cm:400cm =
125cm:500cm
4m:16m = 8m:32m = 12m:48m =
16m:64m = 20m:80m
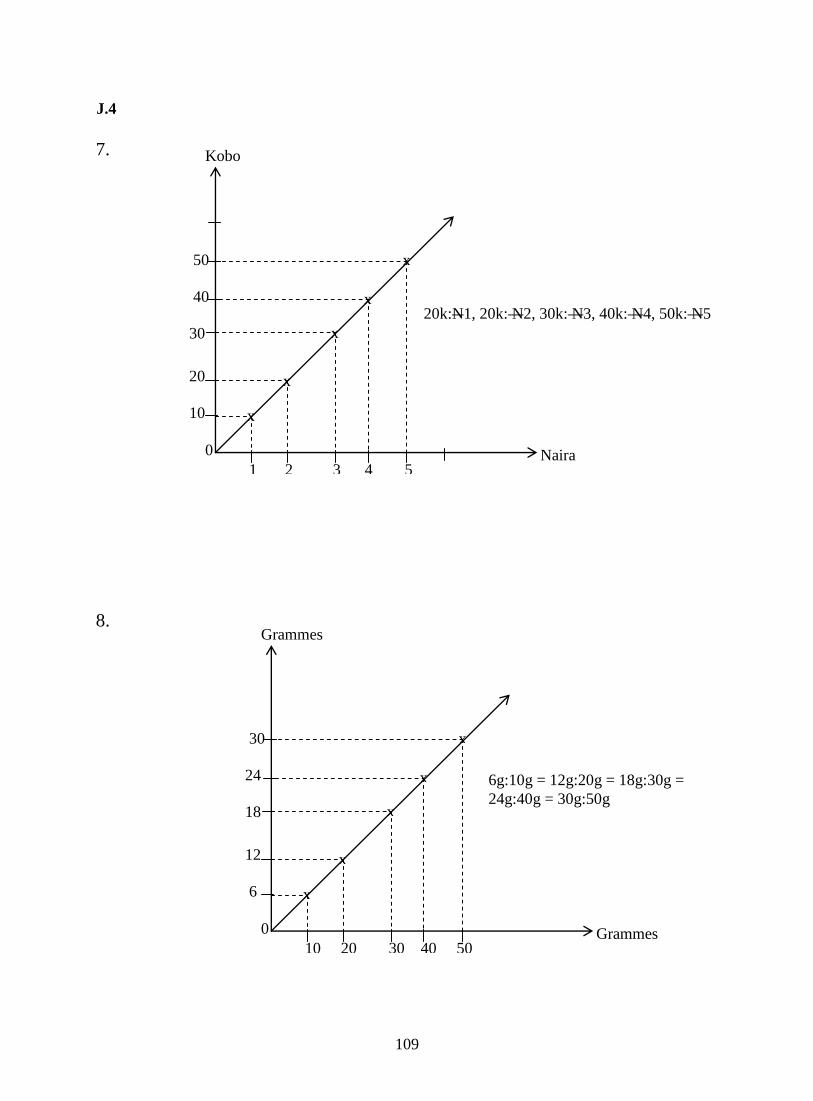
109
7.
8.
50
40
30
20
10
0
1 2 3 4 5
Kobo
Naira
x
x
x
x
x
30
24
18
12
6
0
10 20 30 40 50
Grammes
Grammes
x
x
x
x
x
J.4
20k:N1, 20k: N2, 30k: N3, 40k: N4, 50k: N5
6g:10g = 12g:20g = 18g:30g =
24g:40g = 30g:50g
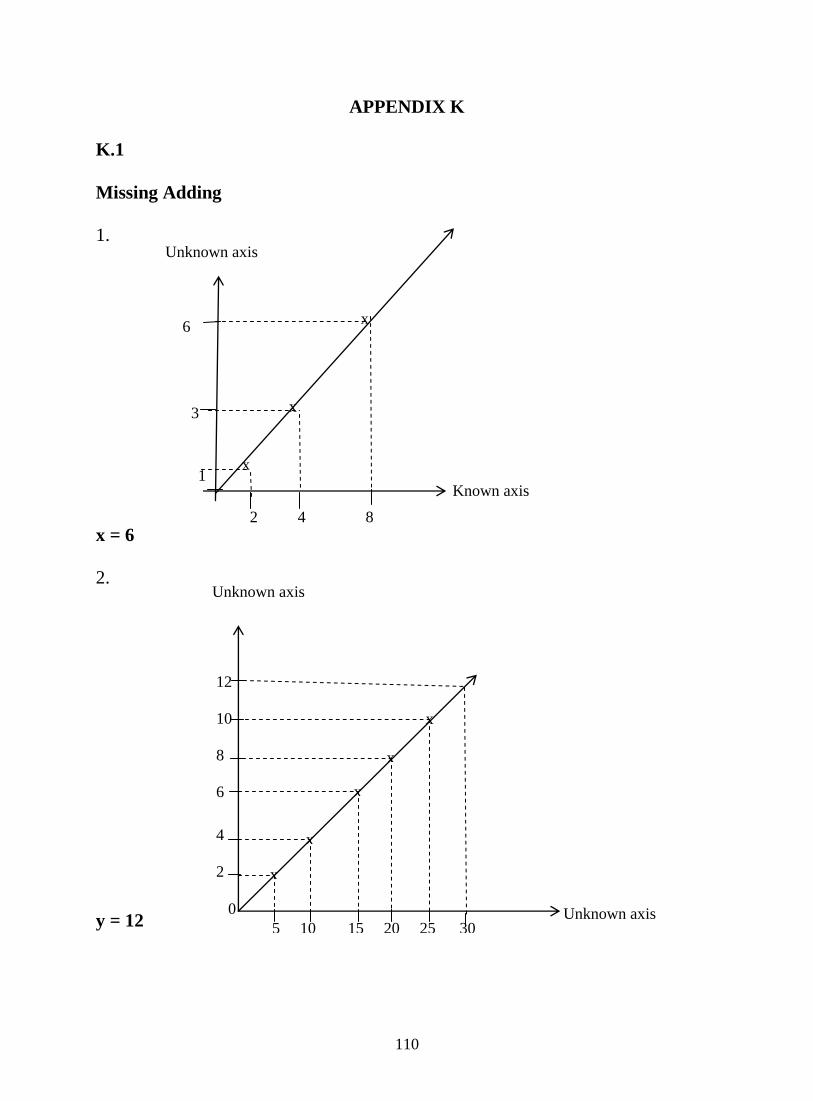
110
3
1
APPENDIX K
K.1
Missing Adding
1.
x = 6
2.
y = 12
6
2 4 8
Unknown axis
Known axis
x
x
x
12
10
8
6
4
2
0
5 10 15 20 25 30
Unknown axis
Unknown axis
x
x
x
x
x
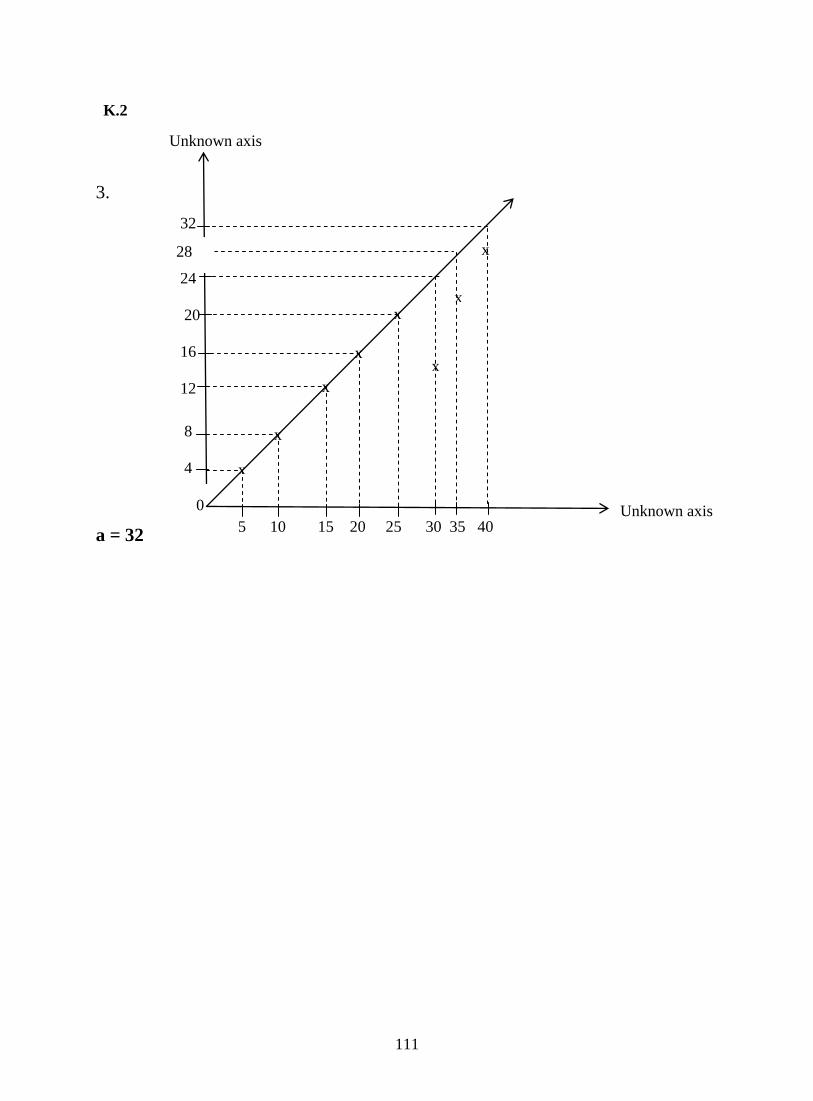
111
K.2
3.
a = 32
32
24
20
16
12
8
4
0
5 10 15 20 25 30 35 40
Unknown axis
Unknown axis
x
x
x
x
x
28
x
x
x
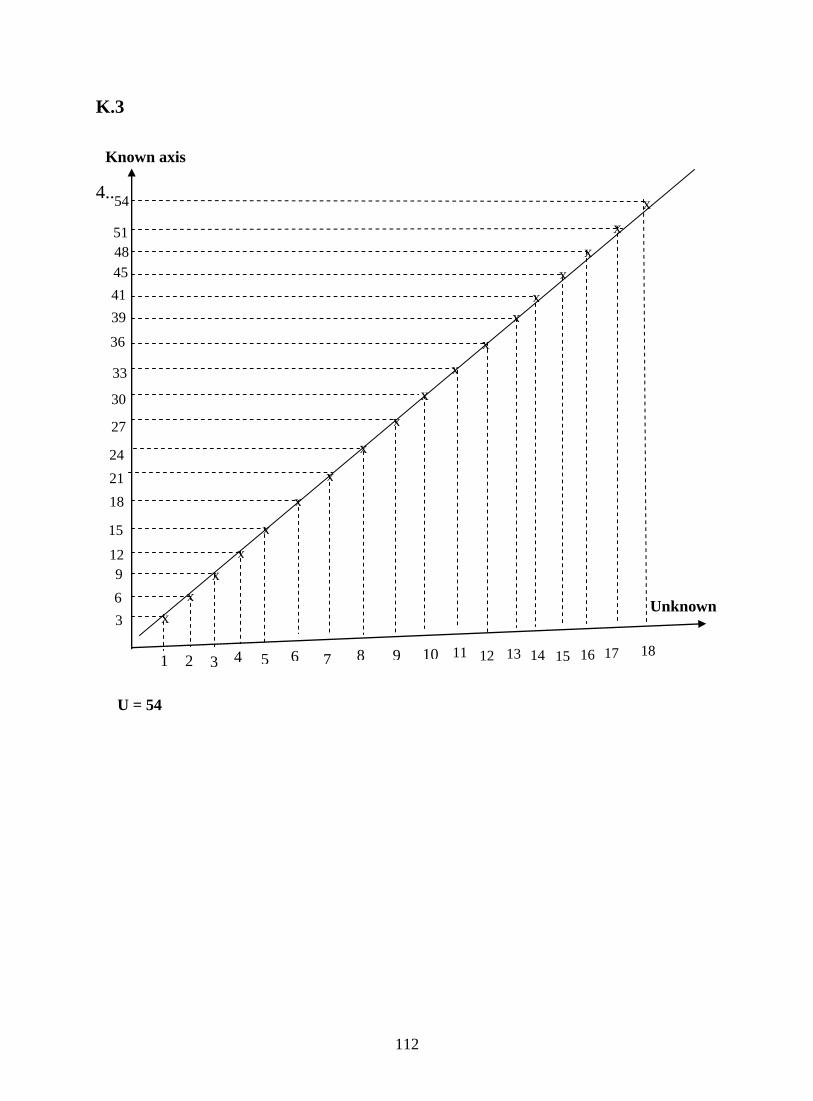
112
Unknown
1 2 3 4 5 6 7 8 9 10 11 12 13 14 15 16 17 18
3
6
9
12
15
18
21
24
27
30
33
36
39
41
45
48
51
54
K.3
4..
U = 54
Known axis
x
x
x
x
x
x
x
x
x
x
x
x
x
x
x
x
x
x
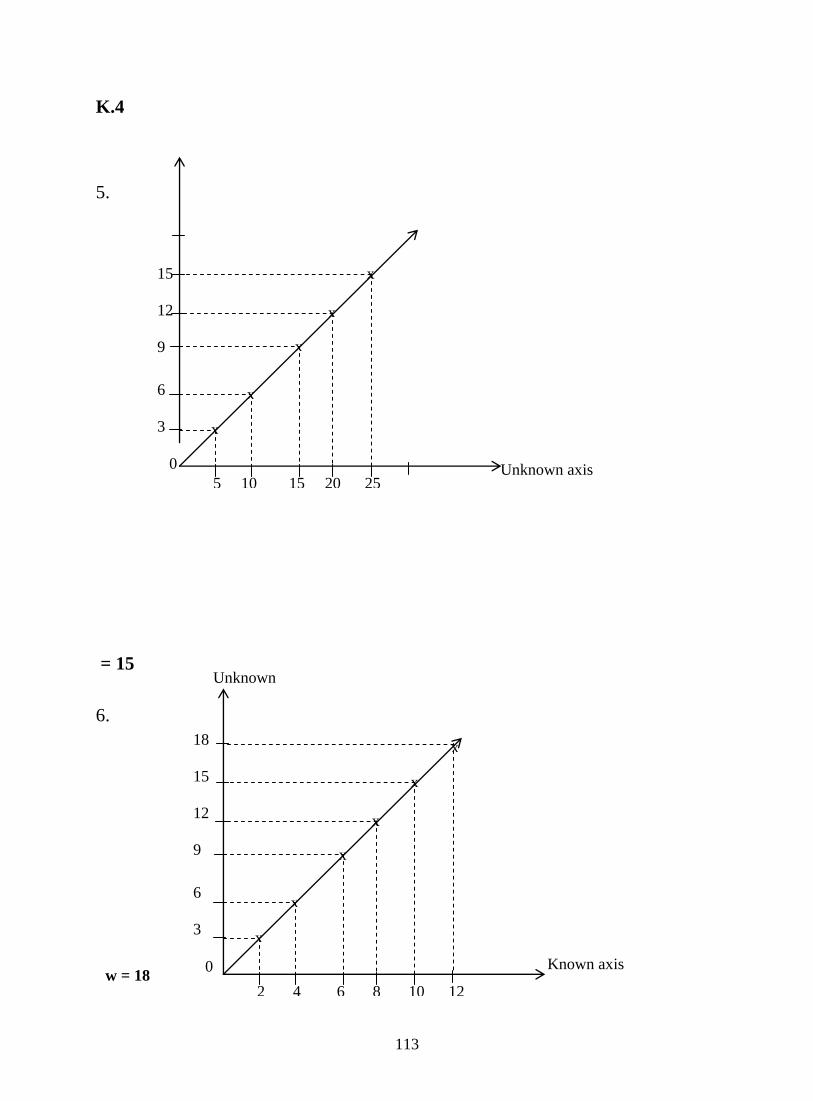
113
K.4
5.
= 15
6.
15
12
9
6
3
0
5 10 15 20 25
x
x
x
x
x
Unknown axis
18
15
12
9
6
3
0
2 4 6 8 10 12
Unknown
x
x
x
x
x
x
Known axis w = 18
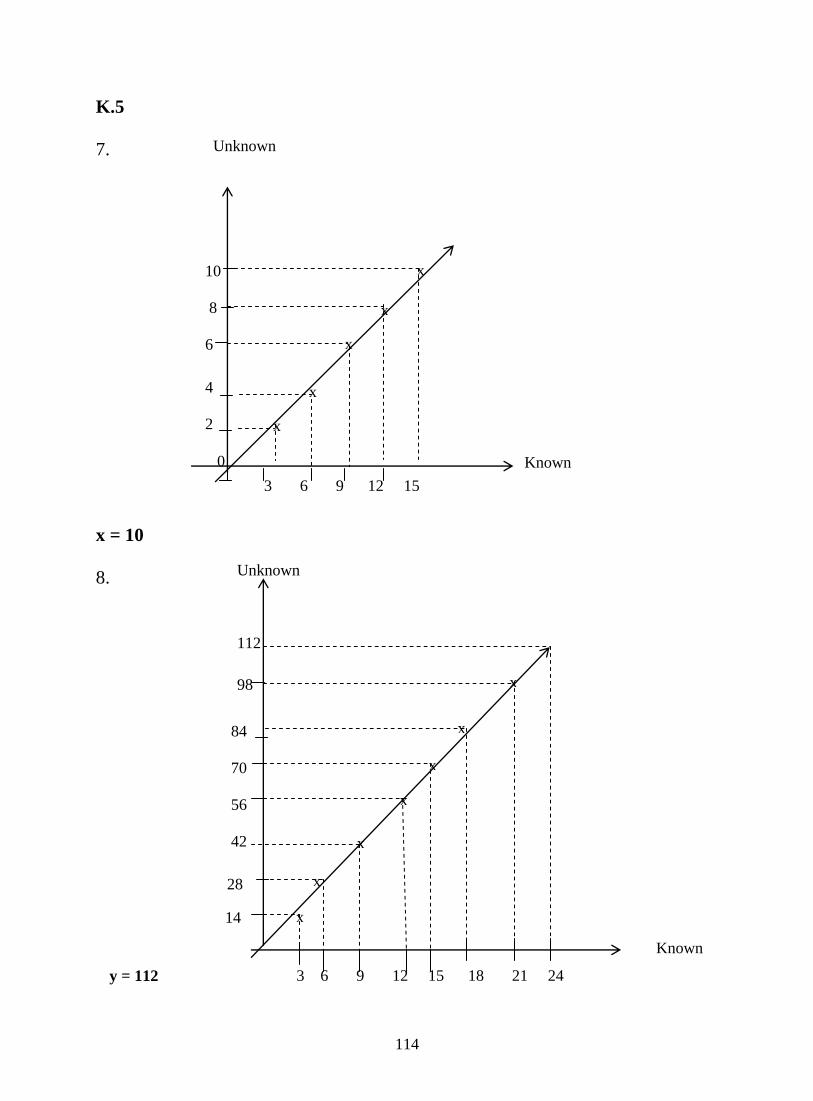
114
Known
Known
98
112
K.5
7.
x = 10
8.
Unknown
84
70
56
42
28
14
0
y = 112
10
8
6
4
2
0
3 6 9 12 15
x
x
x
x
x
14
Unknown
x
x
x
3 6 9 12 15 18 21 24
x
x
x
x
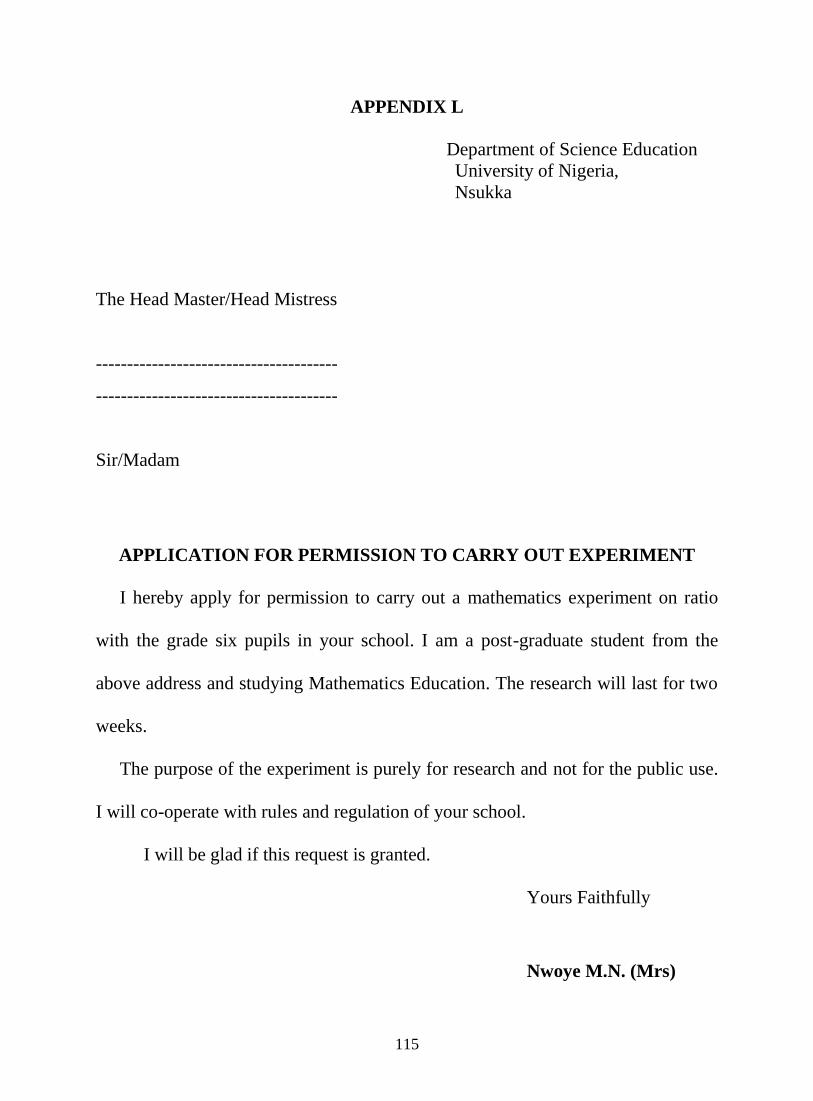
115
APPENDIX L
Department of Science Education
University of Nigeria,
Nsukka
The Head Master/Head Mistress
---------------------------------------
---------------------------------------
Sir/Madam
APPLICATION FOR PERMISSION TO CARRY OUT EXPERIMENT
I hereby apply for permission to carry out a mathematics experiment on ratio
with the grade six pupils in your school. I am a post-graduate student from the
above address and studying Mathematics Education. The research will last for two
weeks.
The purpose of the experiment is purely for research and not for the public use.
I will co-operate with rules and regulation of your school.
I will be glad if this request is granted.
Yours Faithfully
Nwoye M.N. (Mrs)
116
APPENDIX M
Department of Science Education
University of Nigeria,
Nsukka
24/4/2009.
Dear Prof/Dr./Mr/Mrs.
VETTING AND FACE VALIDATION OF ACHIEVEMENT TEST IN
MATHEMATICS
Kindly assist in the Validation of the following instruments for my research.
The instruments are:
(1) Ratio Achievement Test (RAT)
(2) Ratio Interest Inventory (RII)
(3) Making Guide
Content validation of RAT using test blue point. Criteria for face validation is
based on
(1) The appropriateness of the test items.
(2) Sequencing and coverage of ratio concepts and to certify that the instruments
are valid for the purpose of the present investigation.
I will be glad if you grant the request.
Yours Faithfully
Nwoye M.N. (Mrs)


