Embed Size (px)
Citation preview
NZ Institute of Surveyors
Unbound Granular Pavement Unbound Granular Pavement DesignDesign
Tonkin & Taylor Ltd, Pavements GroupPavements Group
Coverage:g
Scope
ConceptsR h bili i Rehabilitation New pavementsAUSTROADSConventional/Mechanistic
Transit Research
Otago IssuesCase Histories
Notes and references available on www
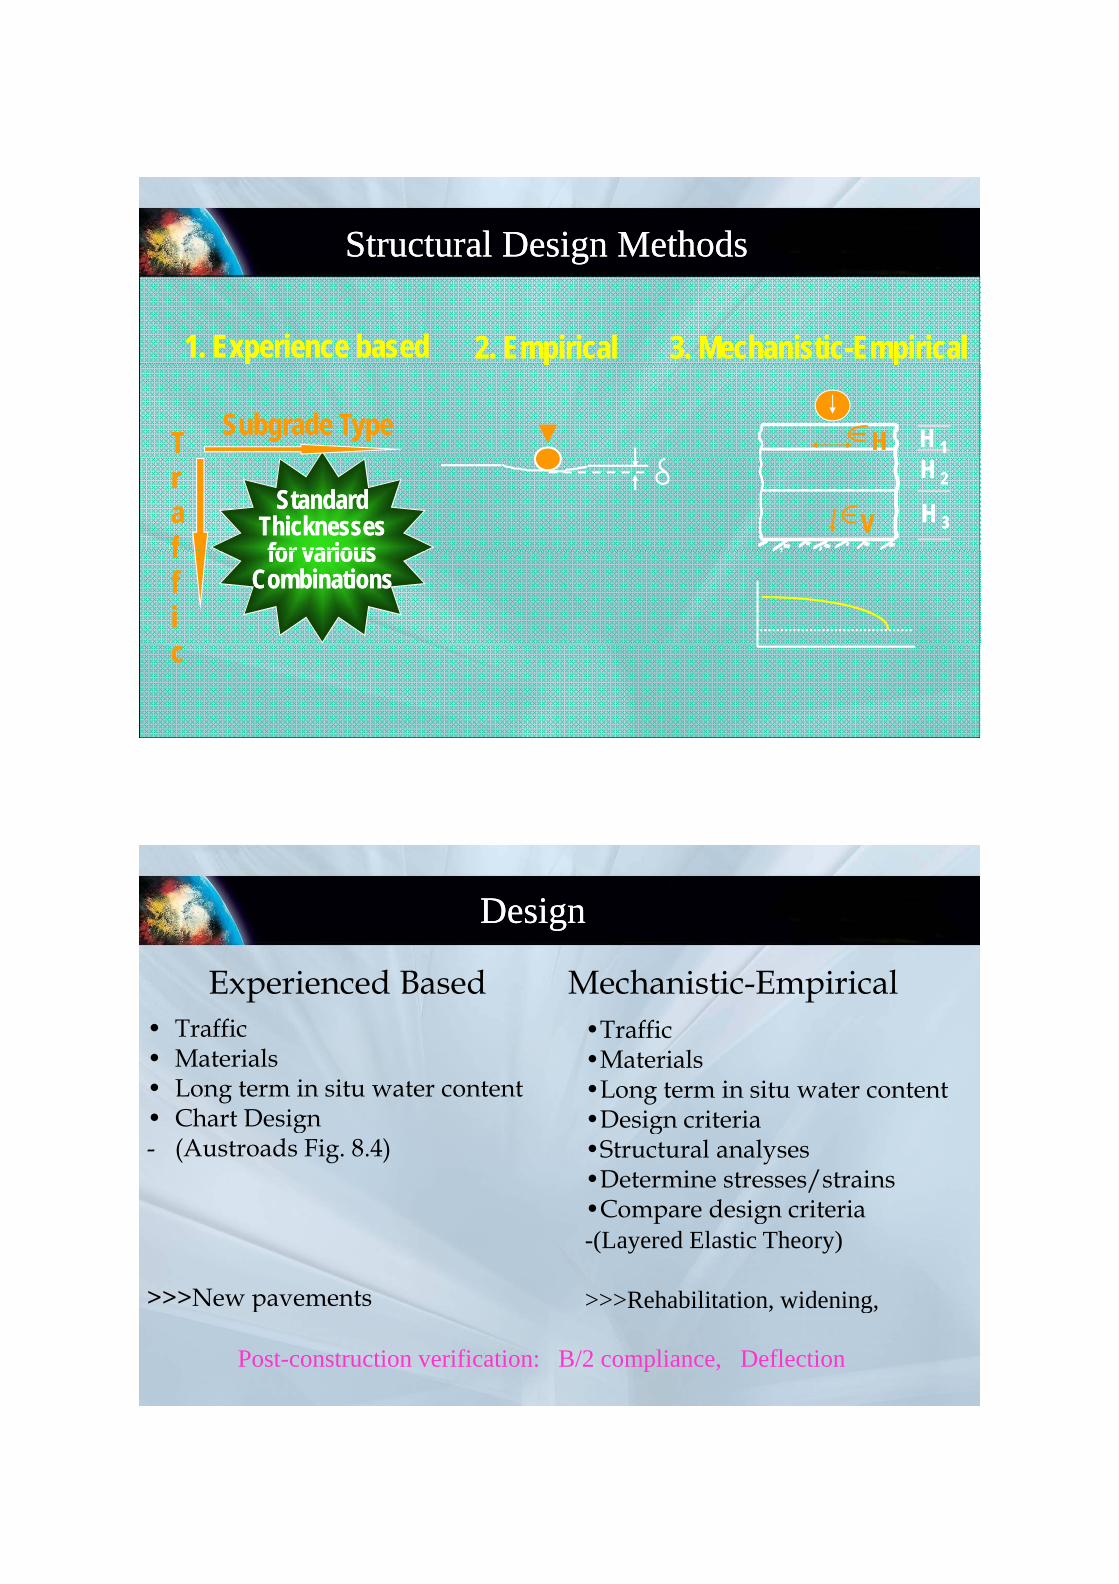
Structural Design MethodsStructural Design Methods
1. Experience based1. Experience based 2. Empirical2. Empirical 3. Mechanistic3. Mechanistic--EmpiricalEmpiricalpp
H H 11
pp
HHSubgrade TypeSubgrade TypeTTH H 22H H 33VV
rraaff
StandardStandardThicknessesThicknessesfor variousfor variousff
ffii
for variousfor variousCombinationsCombinations
cc
DesignDesign
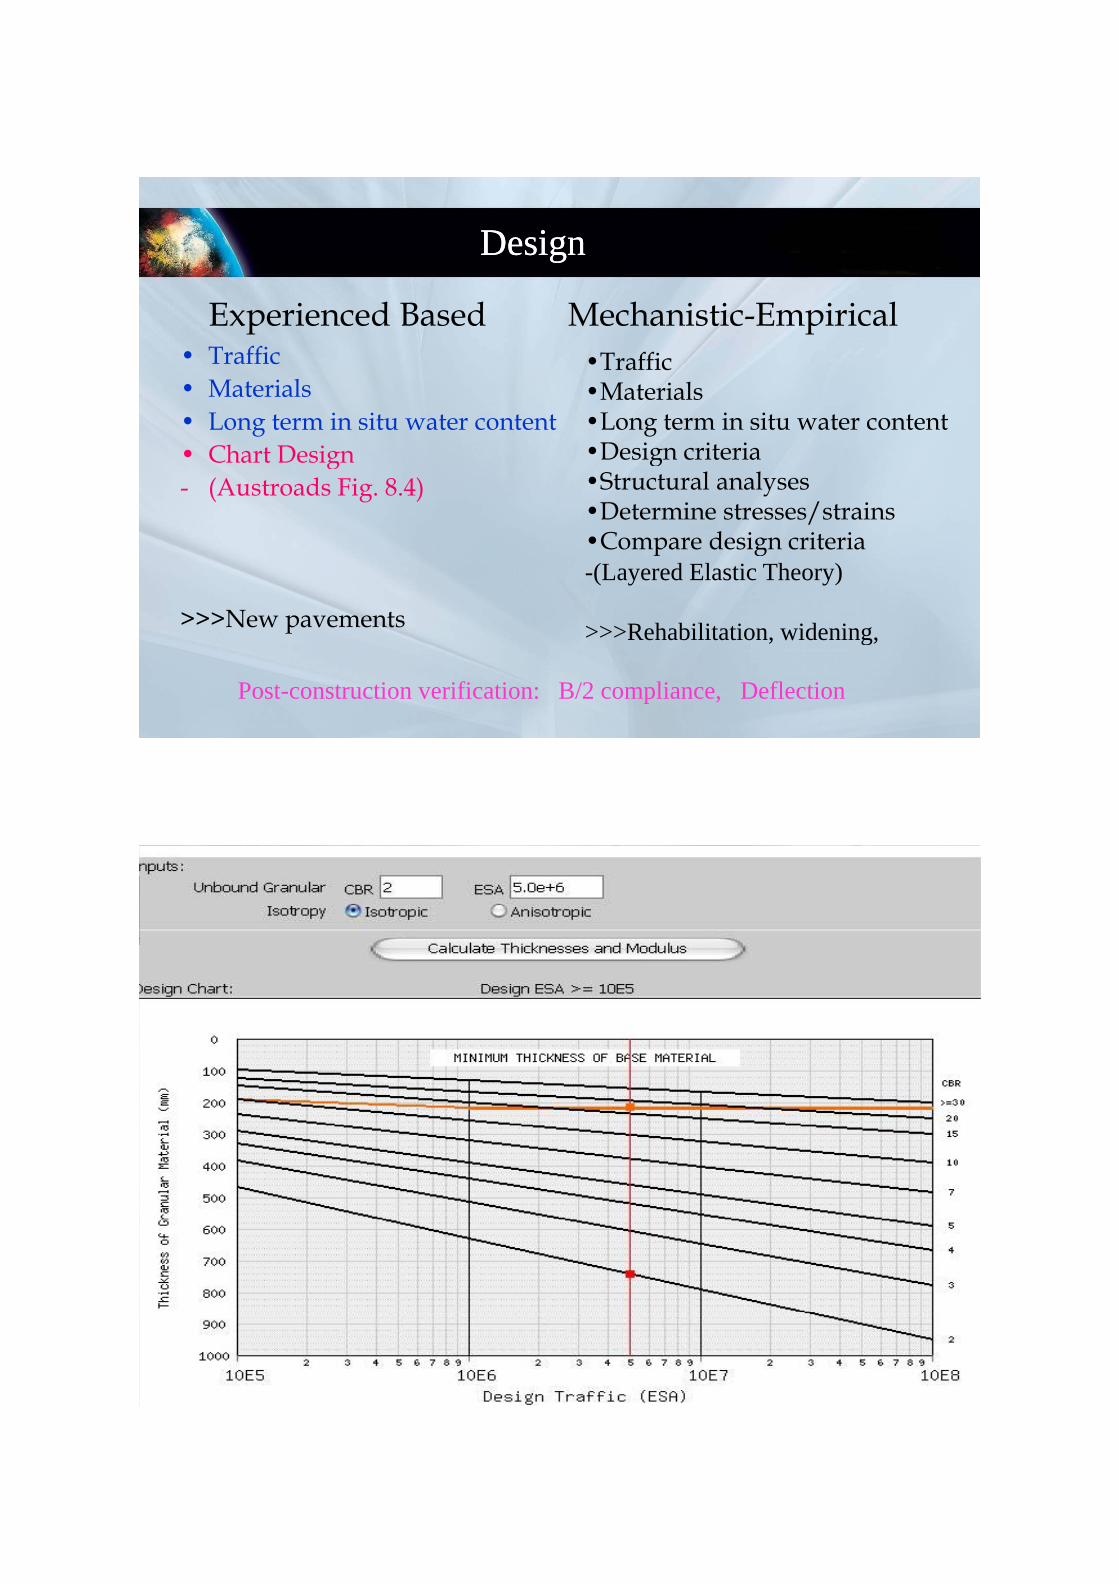
• Traffic
Experienced Based Mechanistic-Empirical•TrafficTraffic
• Materials• Long term in situ water content• Chart Design
•Traffic•Materials•Long term in situ water content•Design criteriaChart Design
- (Austroads Fig. 8.4)Design criteria
•Structural analyses•Determine stresses/strains•Compare design criteria
>>>New pavements
p g-(Layered Elastic Theory)
>>>Rehabilitation, widening, g
Post-construction verification: B/2 compliance, Deflection
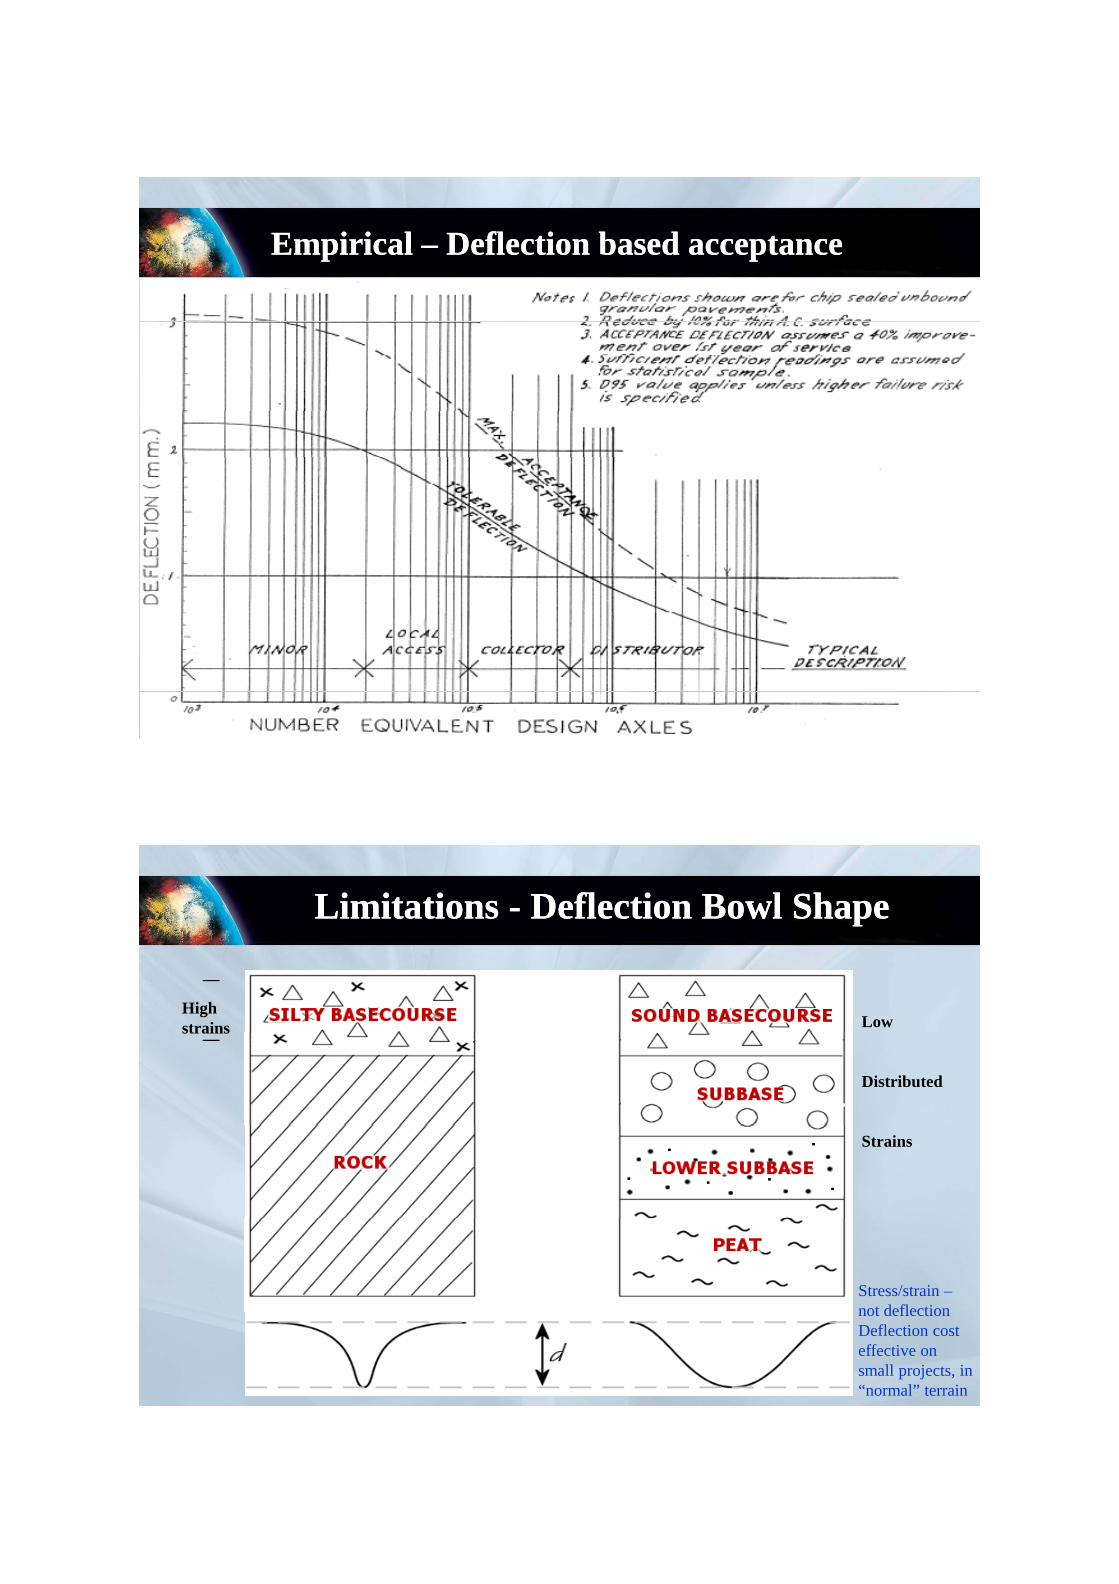
Empirical Empirical –– Deflection based acceptanceDeflection based acceptance
Limitations Limitations -- Deflection Bowl ShapeDeflection Bowl Shape__
Highstrains Low
__strains
Distributed
Strains
Stress/strain –not deflectionnot deflectionDeflection cost effective on small projects, in “normal” terrain
Layered Elastic DesignLayered Elastic Design
Falling Weight Deflectometer
Layered Elastic DesignLayered Elastic Design
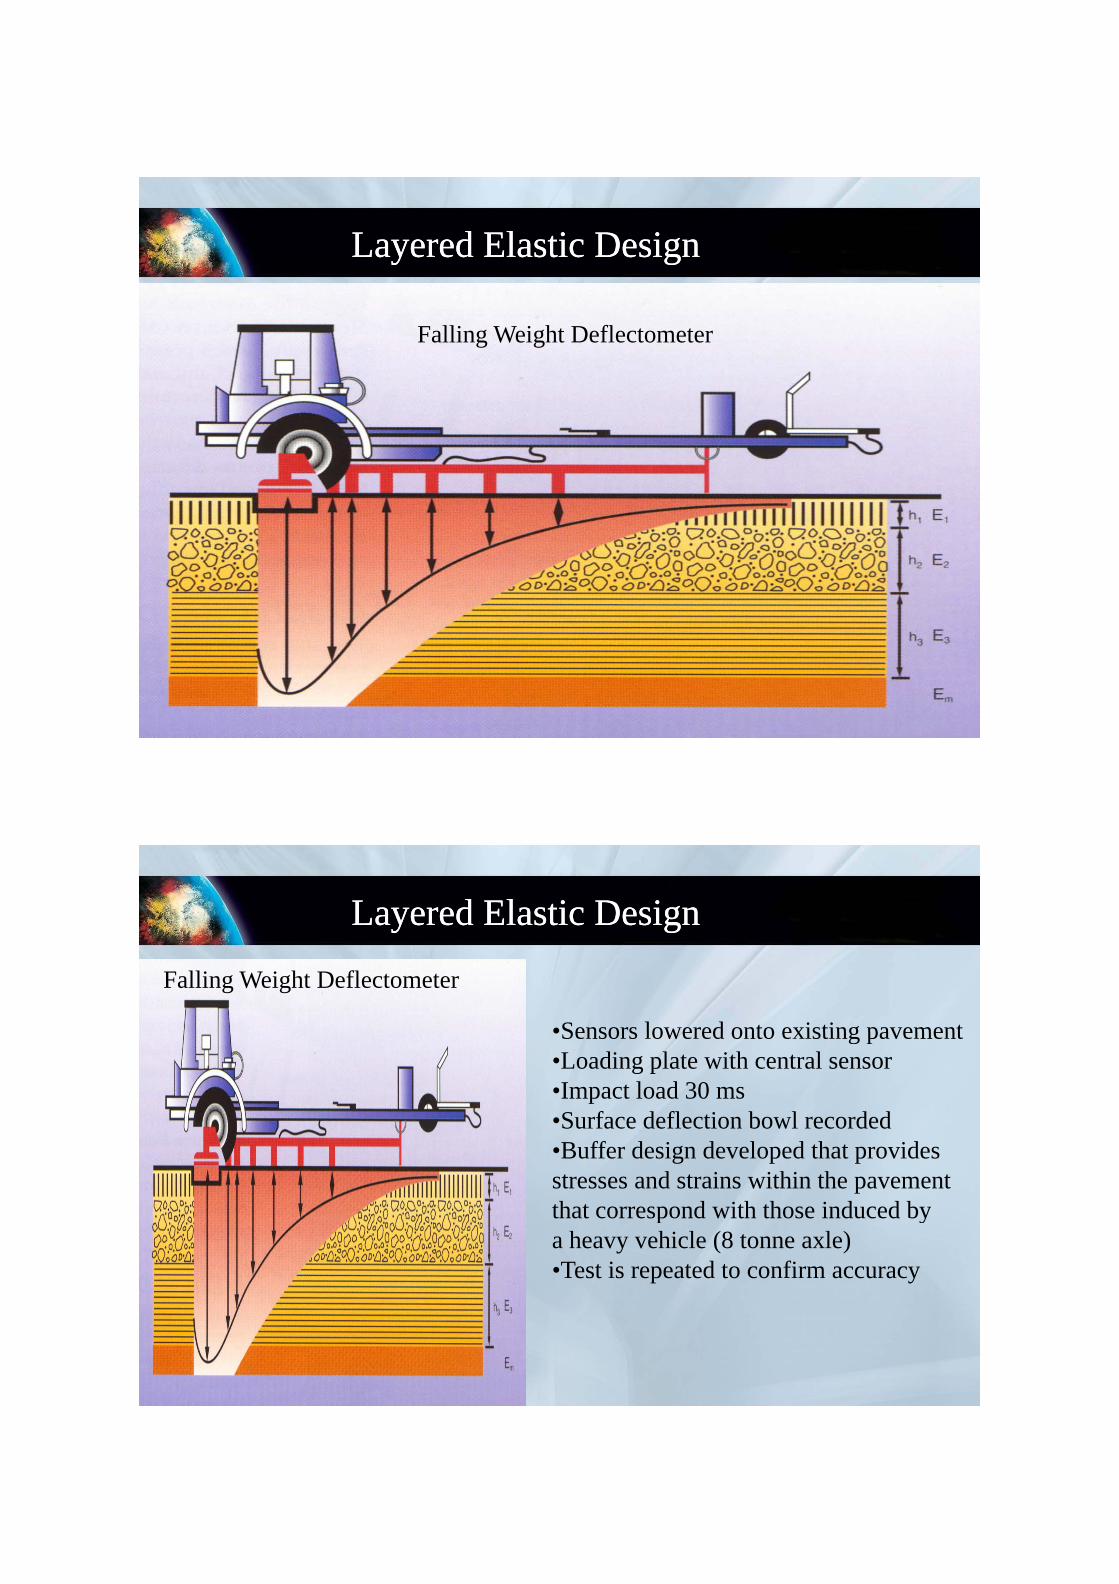
Falling Weight Deflectometer
•Sensors lowered onto existing pavement•Sensors lowered onto existing pavement•Loading plate with central sensor•Impact load 30 ms•Surface deflection bowl recordedSurface deflection bowl recorded•Buffer design developed that providesstresses and strains within the pavementthat correspond with those induced byp ya heavy vehicle (8 tonne axle)•Test is repeated to confirm accuracy
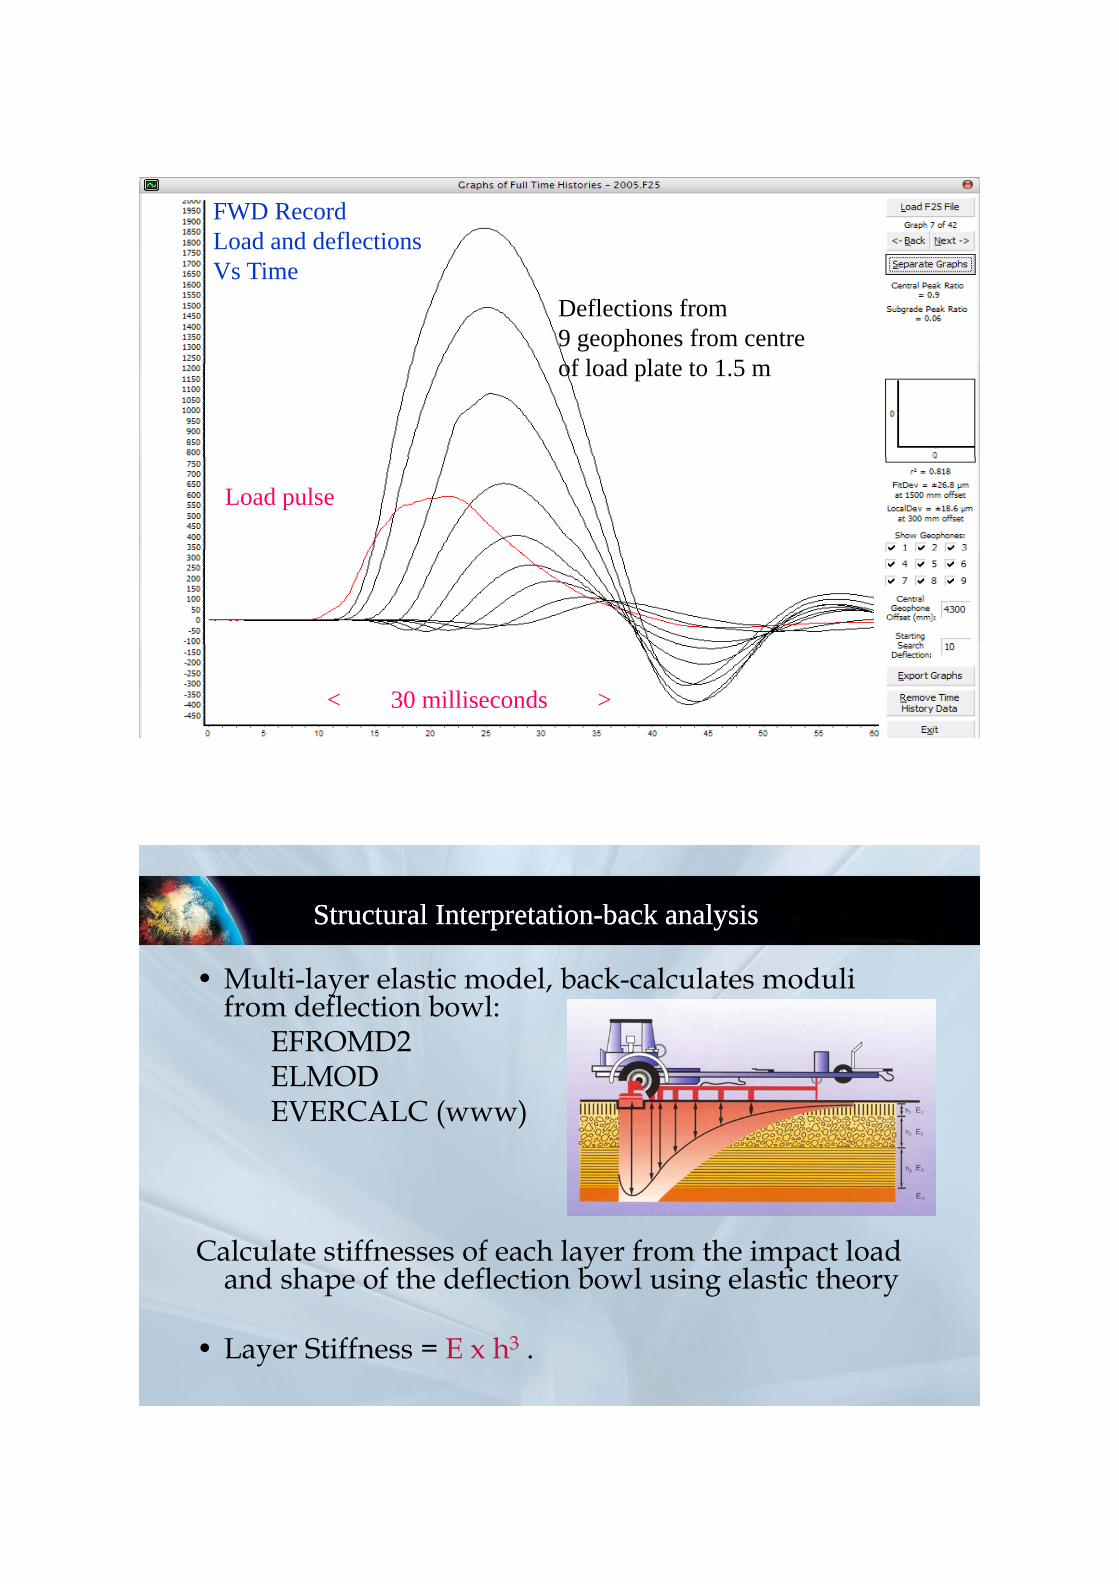
Layered Elastic DesignLayered Elastic DesignFWD RecordLoad and deflectionsVs TimeVs Time
Deflections from9 geophones from centref l d l t t 1 5of load plate to 1.5 m
Load pulse
< 30 milliseconds >
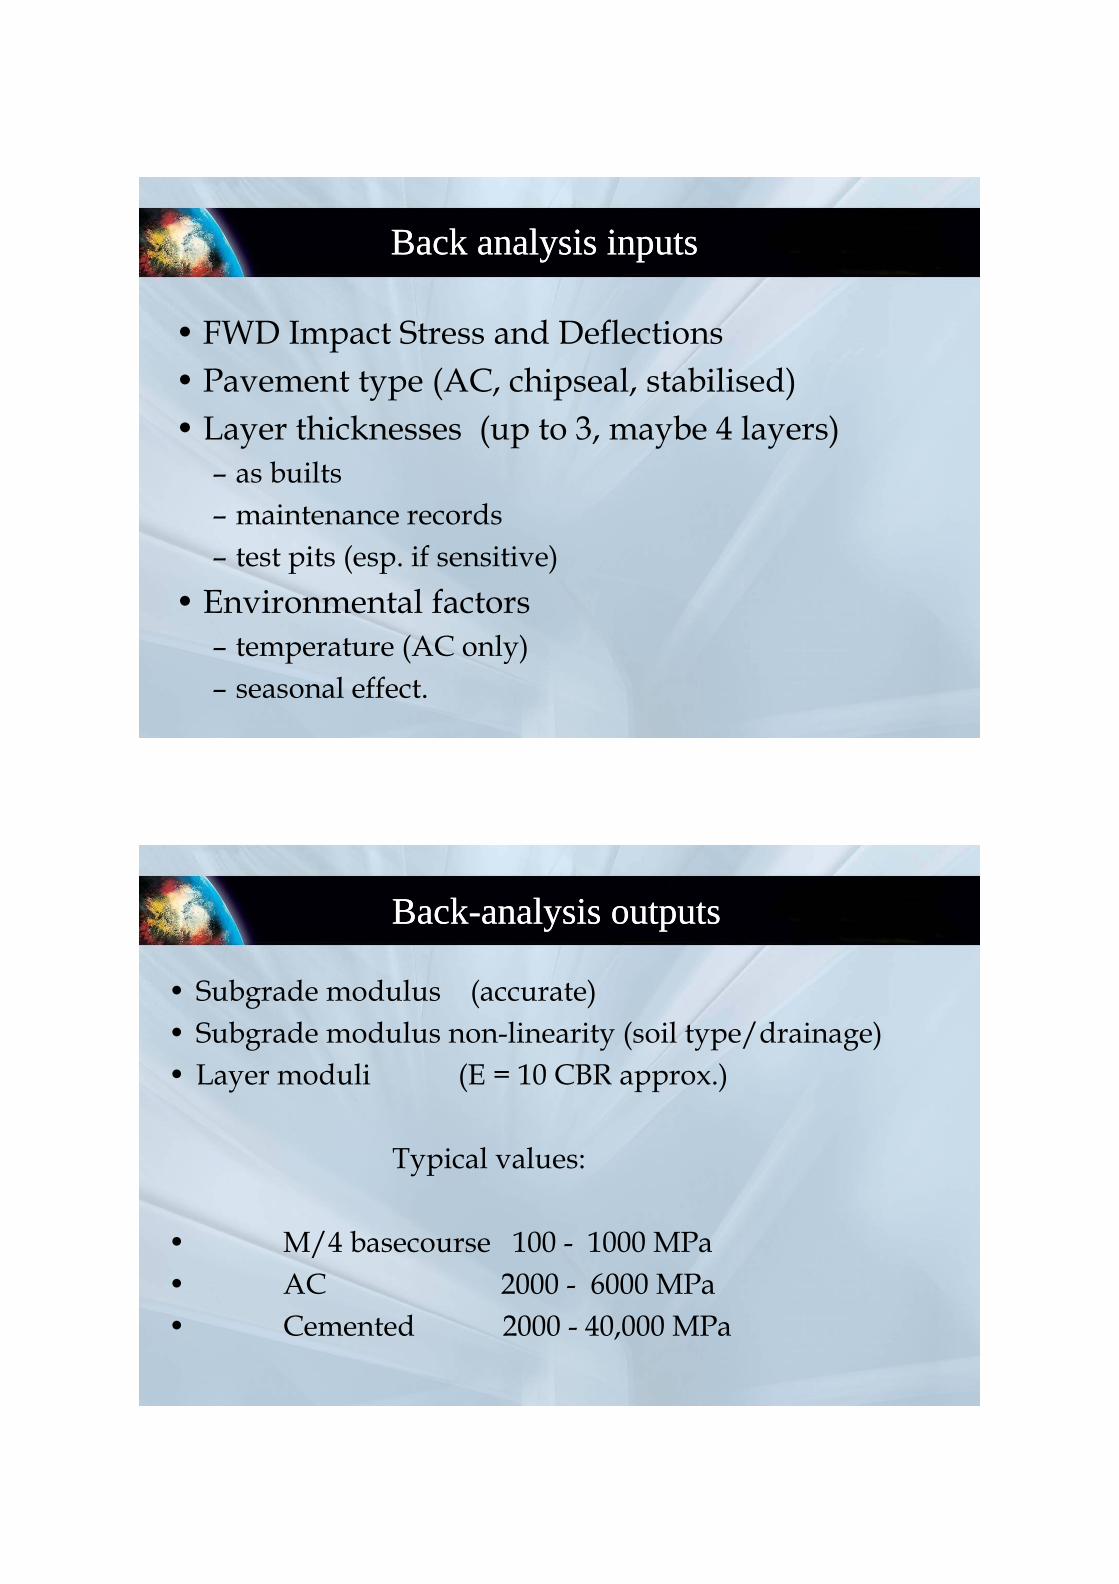
Structural InterpretationStructural Interpretation--back analysisback analysis
• Multi-layer elastic model, back-calculates moduli from deflection bowl:
EFROMD2EFROMD2ELMODEVERCALC (www)( )
Calculate stiffnesses of each layer from the impact load and shape of the deflection bowl using elastic theory
• Layer Stiffness = E x h3 .
Back analysis inputsBack analysis inputs
• FWD Impact Stress and Deflections• Pavement type (AC, chipseal, stabilised)• Layer thicknesses (up to 3, maybe 4 layers)
– as builts– maintenance records
t t it ( if iti ) – test pits (esp. if sensitive) • Environmental factors
temperature (AC only)– temperature (AC only)– seasonal effect.
BackBack--analysis outputsanalysis outputs
• Subgrade modulus (accurate)• Subgrade modulus non linearity (soil type/drainage)• Subgrade modulus non-linearity (soil type/drainage)• Layer moduli (E = 10 CBR approx.)
Typical values:
• M/4 basecourse 100 - 1000 MPa• AC 2000 - 6000 MPa• Cemented 2000 - 40,000 MPa
Structural Interpretation Structural Interpretation -- Forward AnalysisForward Analysisyy
CIRCLY, ODEMARK, ELMOD, EVERSTRESS etchttp://www.wsdot.wa.gov/TA/Software/p g
• Inputs– Pavement layer thicknesses y
Layer moduli (from back analysis)
• Deterioration models• Deterioration models– Established Strain Criteria .– AUSTROADS 92, AASHO Road Test– ARRB TR Model– ARRB TR Model– HDM
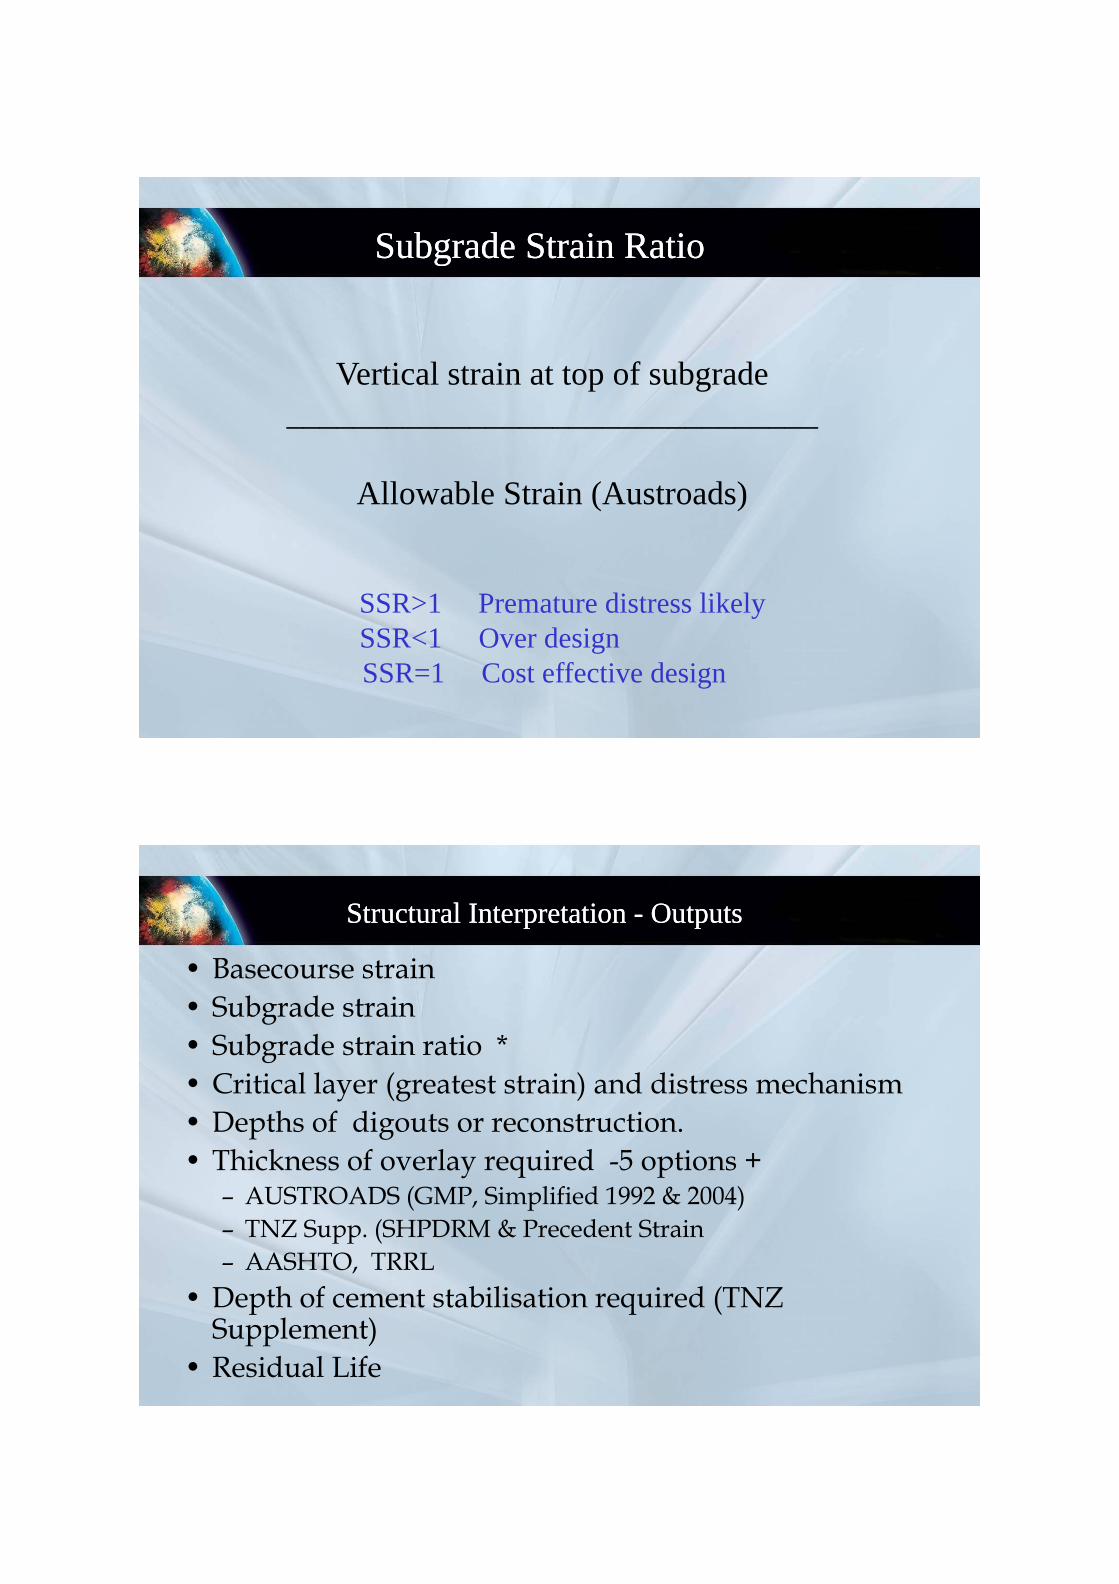
Mechanistic Analysis Strain CriteriaMechanistic Analysis Strain Criteria
10,000TRRLNottinghamA h lt I tit t
eg AUSTROADS:
ostr
ain
Asphalt InstituteNaasraAustroads 98TNZ PremiumBritish PortsShellAustroads Isotropic - Subgrade
Load Repetitions = [9300/microstrain]^7ESA - Equivalent Single Axles
1,000
ssib
le m
icro
p gAustroads Isotropic - Non subgradeLEDFAA 1.3
Per
mis
SAR: Standard Axle Repetitions calculated using damage exponent of
1001,000 10,000 100,000 1,000,000 10,000,000 100,000,000
Number of load repetitions
calculated using damage exponent of 4 (slope above) Chart Design
Subgrade Strain RatioSubgrade Strain Ratio
V i l i f b dVertical strain at top of subgrade________________________________
Allowable Strain (Austroads)
SSR>1 Premature distress likelySSR<1 Over designSSR<1 Over design SSR=1 Cost effective design
Structural Interpretation Structural Interpretation -- OutputsOutputs
• Basecourse strain• Subgrade strain • Subgrade strain ratio *• Critical layer (greatest strain) and distress mechanism• Depths of digouts or reconstruction• Depths of digouts or reconstruction.• Thickness of overlay required -5 options +
– AUSTROADS (GMP, Simplified 1992 & 2004)– TNZ Supp. (SHPDRM & Precedent Strain– AASHTO, TRRL
• Depth of cement stabilisation required (TNZ p q (Supplement)
• Residual Life
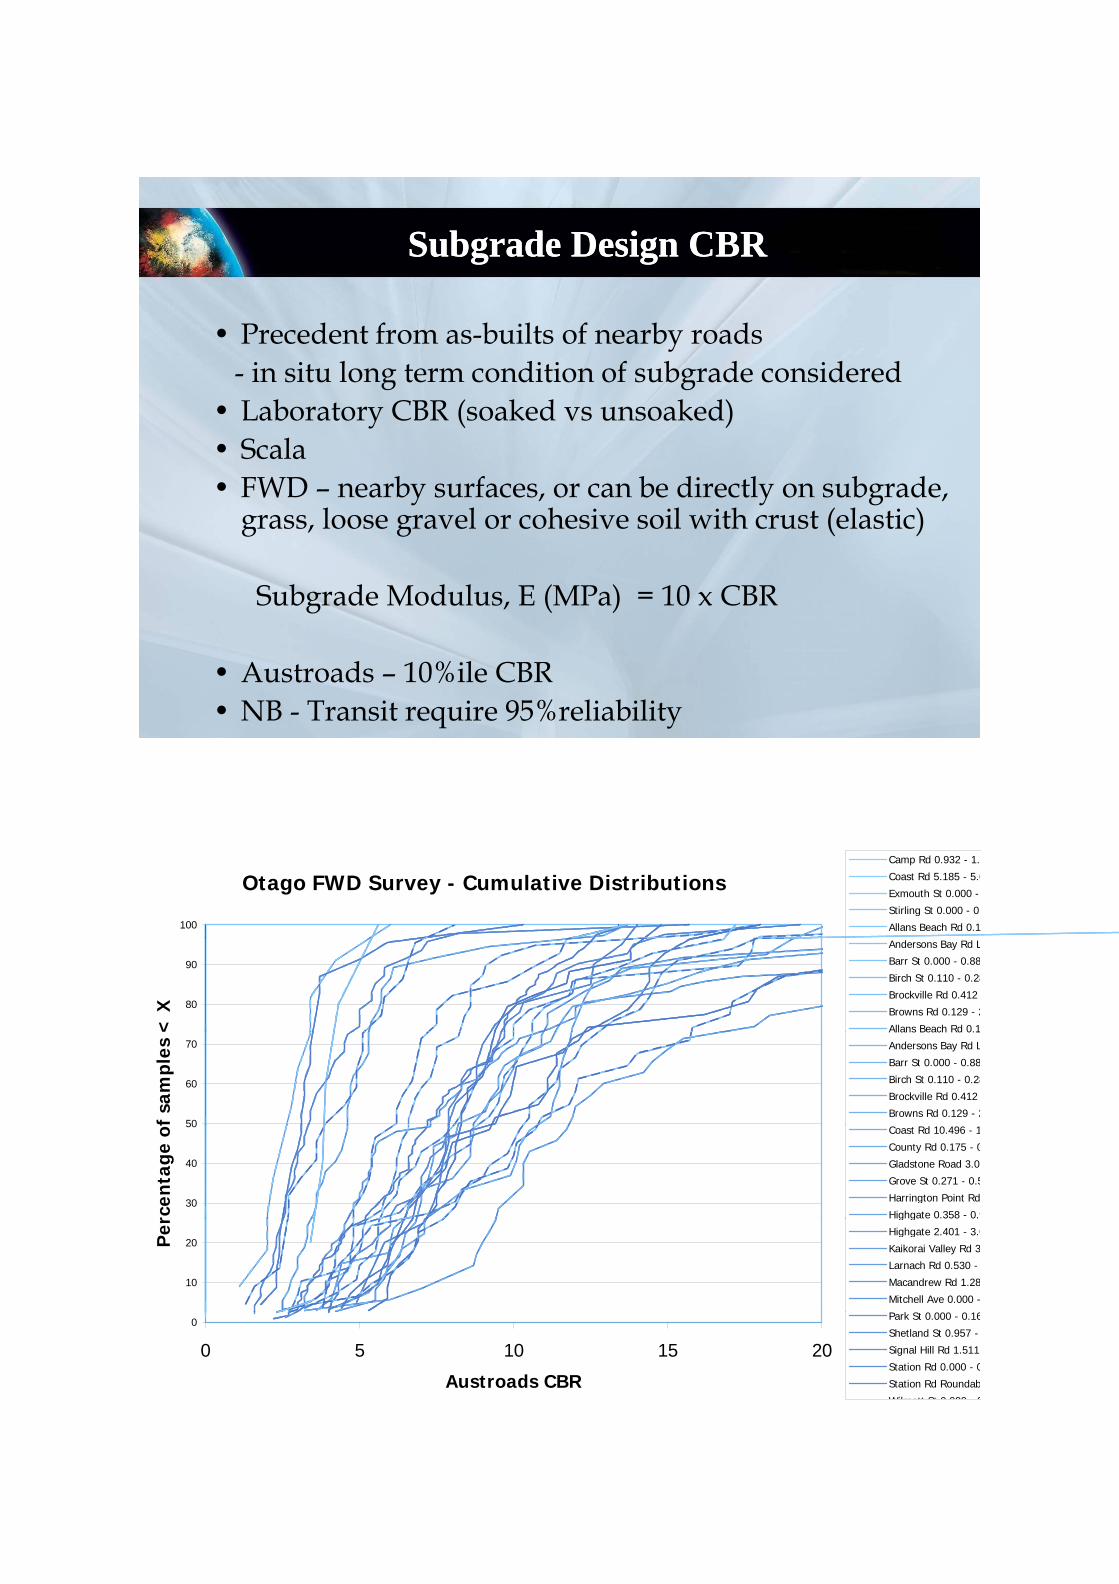
Subgrade Design CBRSubgrade Design CBR
• Precedent from as-builts of nearby roadsi it l t diti f b d id d- in situ long term condition of subgrade considered
• Laboratory CBR (soaked vs unsoaked)• ScalaScala• FWD – nearby surfaces, or can be directly on subgrade,
grass, loose gravel or cohesive soil with crust (elastic)
Subgrade Modulus, E (MPa) = 10 x CBR
• Austroads – 10%ile CBR • NB - Transit require 95%reliability
Otago FWD Survey - Cumulative Distributions
100
Camp Rd 0.932 - 1.4
Coast Rd 5.185 - 5.6
Exmouth St 0.000 -
Stirling St 0.000 - 0.
Allans Beach Rd 0.1
80
90
< X
Andersons Bay Rd L
Barr St 0.000 - 0.88
Birch St 0.110 - 0.28
Brockville Rd 0.412
Browns Rd 0.129 - 2
Allans Beach Rd 0.1
50
60
70
f sa
mpl
es Allans Beach Rd 0.1
Andersons Bay Rd L
Barr St 0.000 - 0.88
Birch St 0.110 - 0.28
Brockville Rd 0.412
Browns Rd 0.129 - 2
30
40
50
rcen
tage
of
Coast Rd 10.496 - 1
County Rd 0.175 - 0
Gladstone Road 3.0
Grove St 0.271 - 0.5
Harrington Point Rd
Highgate 0.358 - 0.9
10
20Per
g g
Highgate 2.401 - 3.0
Kaikorai Valley Rd 3
Larnach Rd 0.530 -
Macandrew Rd 1.28
Mitchell Ave 0.000 -
P k S 0 000 0 160
0 5 10 15 20
Austroads CBR
Park St 0.000 - 0.16
Shetland St 0.957 -
Signal Hill Rd 1.511
Station Rd 0.000 - 0
Station Rd Roundab
Wilmott St 0 000 0
80
90
100
X
60
70
80
mpl
es <
X
40
50
60
ge o
f sa
m
20
30
40
Per
cen
tag
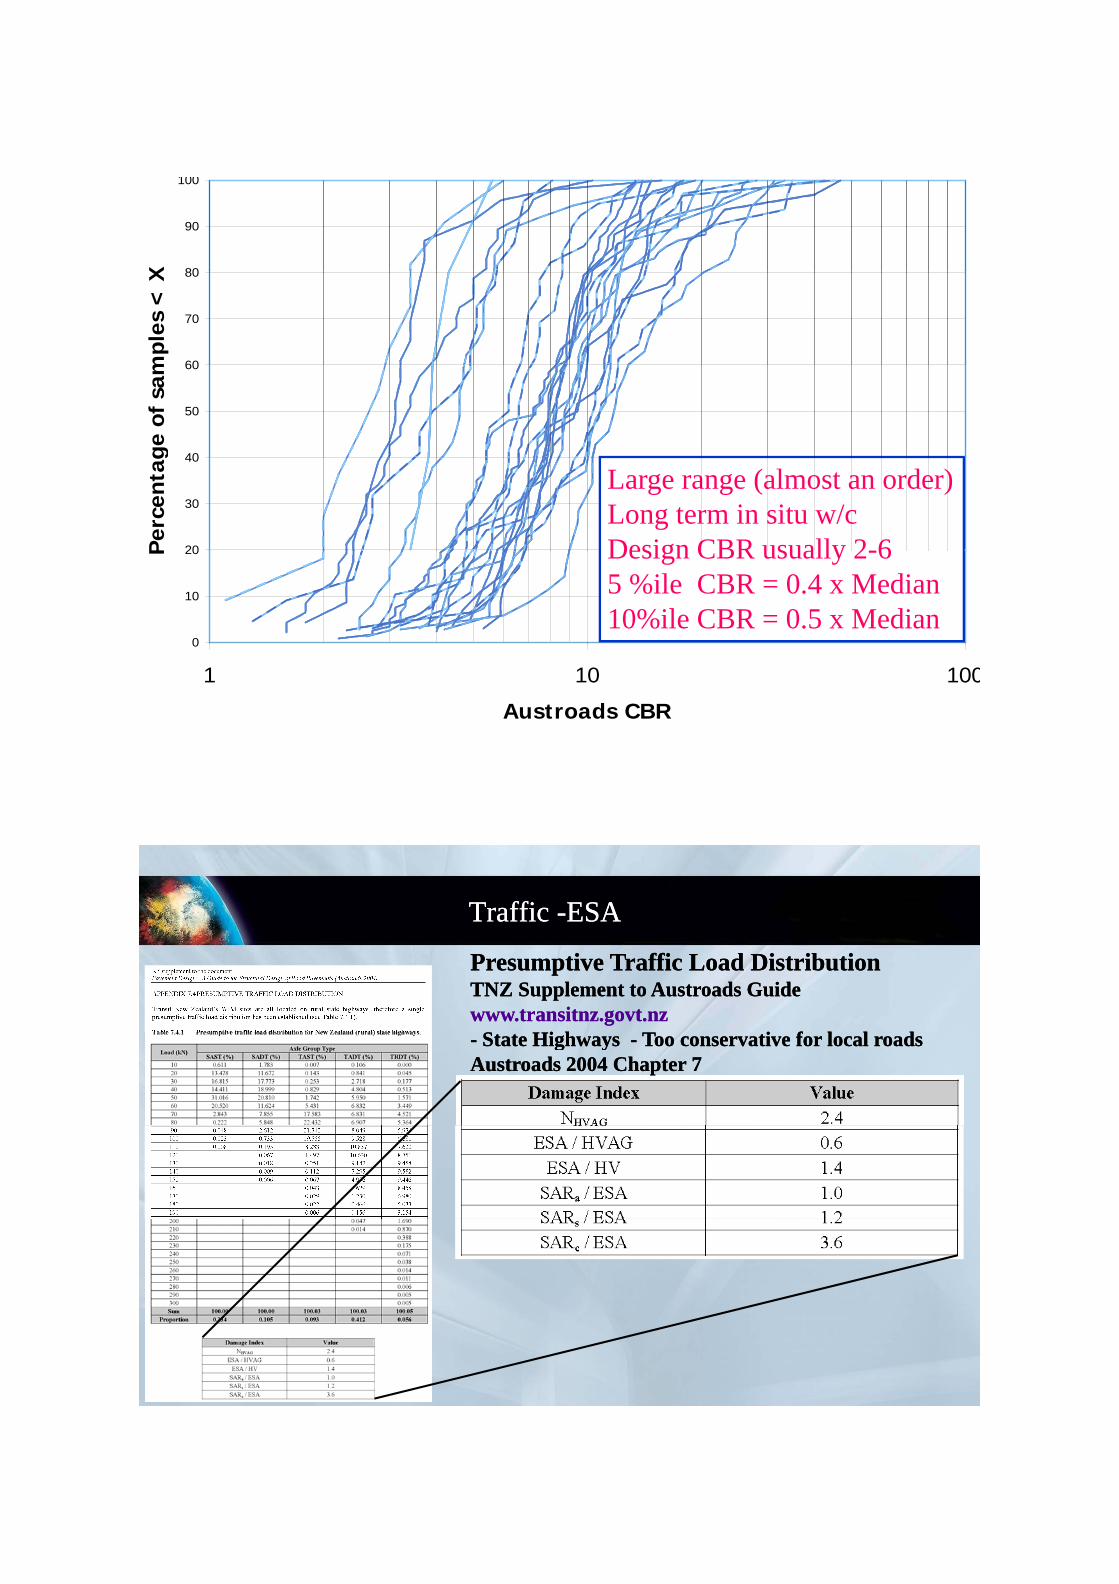
Large range (almost an order)Long term in situ w/cDesign CBR usually 2 6
0
10
20P Design CBR usually 2-65 %ile CBR = 0.4 x Median10%ile CBR = 0.5 x Median
0
1 10 100
Austroads CBR
Traffic Traffic --ESAESA
Presumptive Traffic Load DistributionPresumptive Traffic Load DistributionTNZ Supplement to Austroads GuideTNZ Supplement to Austroads Guidewww.transitnz.govt.nz www.transitnz.govt.nz
S iS i i fi f-- State Highways State Highways -- Too conservative for local roadsToo conservative for local roadsAustroads 2004 Chapter 7Austroads 2004 Chapter 7
DesignDesign
• TrafficExperienced Based Mechanistic-Empirical
•Traffica c• Materials• Long term in situ water content• Chart Design
•Traffic•Materials•Long term in situ water content•Design criteriaChart Design
- (Austroads Fig. 8.4)Design criteria
•Structural analyses•Determine stresses/strains•Compare design criteria
>>>New pavements
p g-(Layered Elastic Theory)
>>>Rehabilitation, widening, g
Post-construction verification: B/2 compliance, Deflection
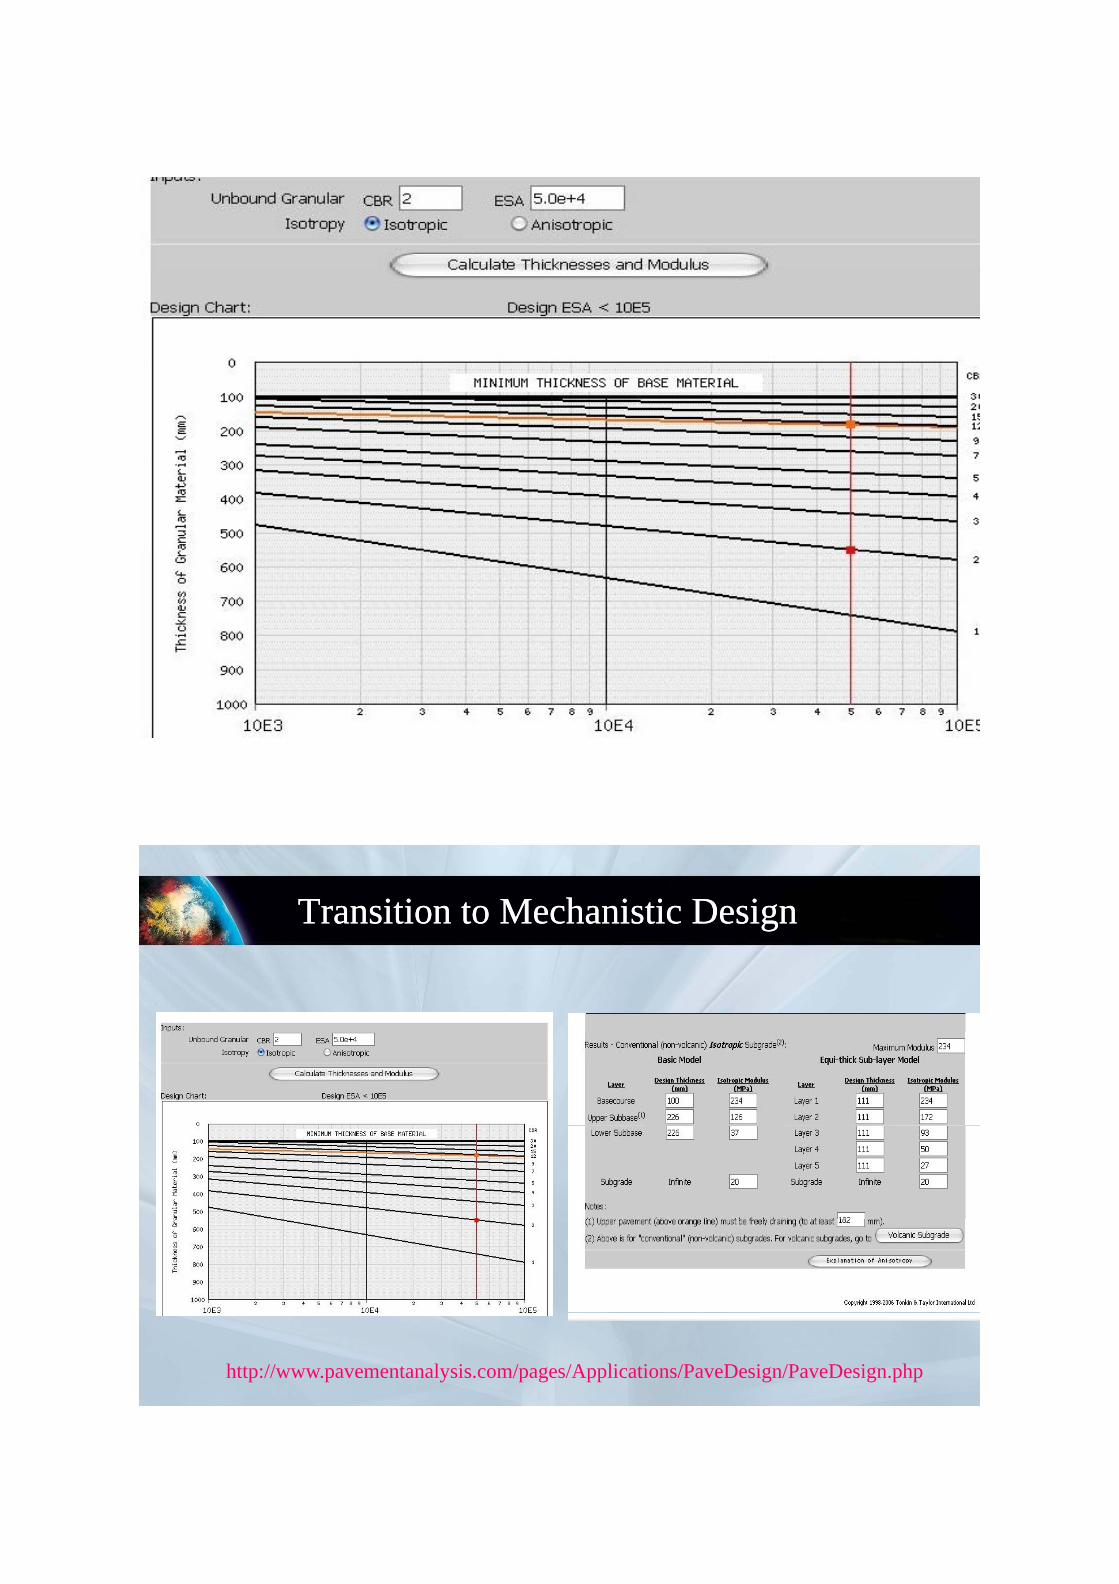
Transition to Mechanistic DesignTransition to Mechanistic Design
http://www.pavementanalysis.com/pages/Applications/PaveDesign/PaveDesign.php
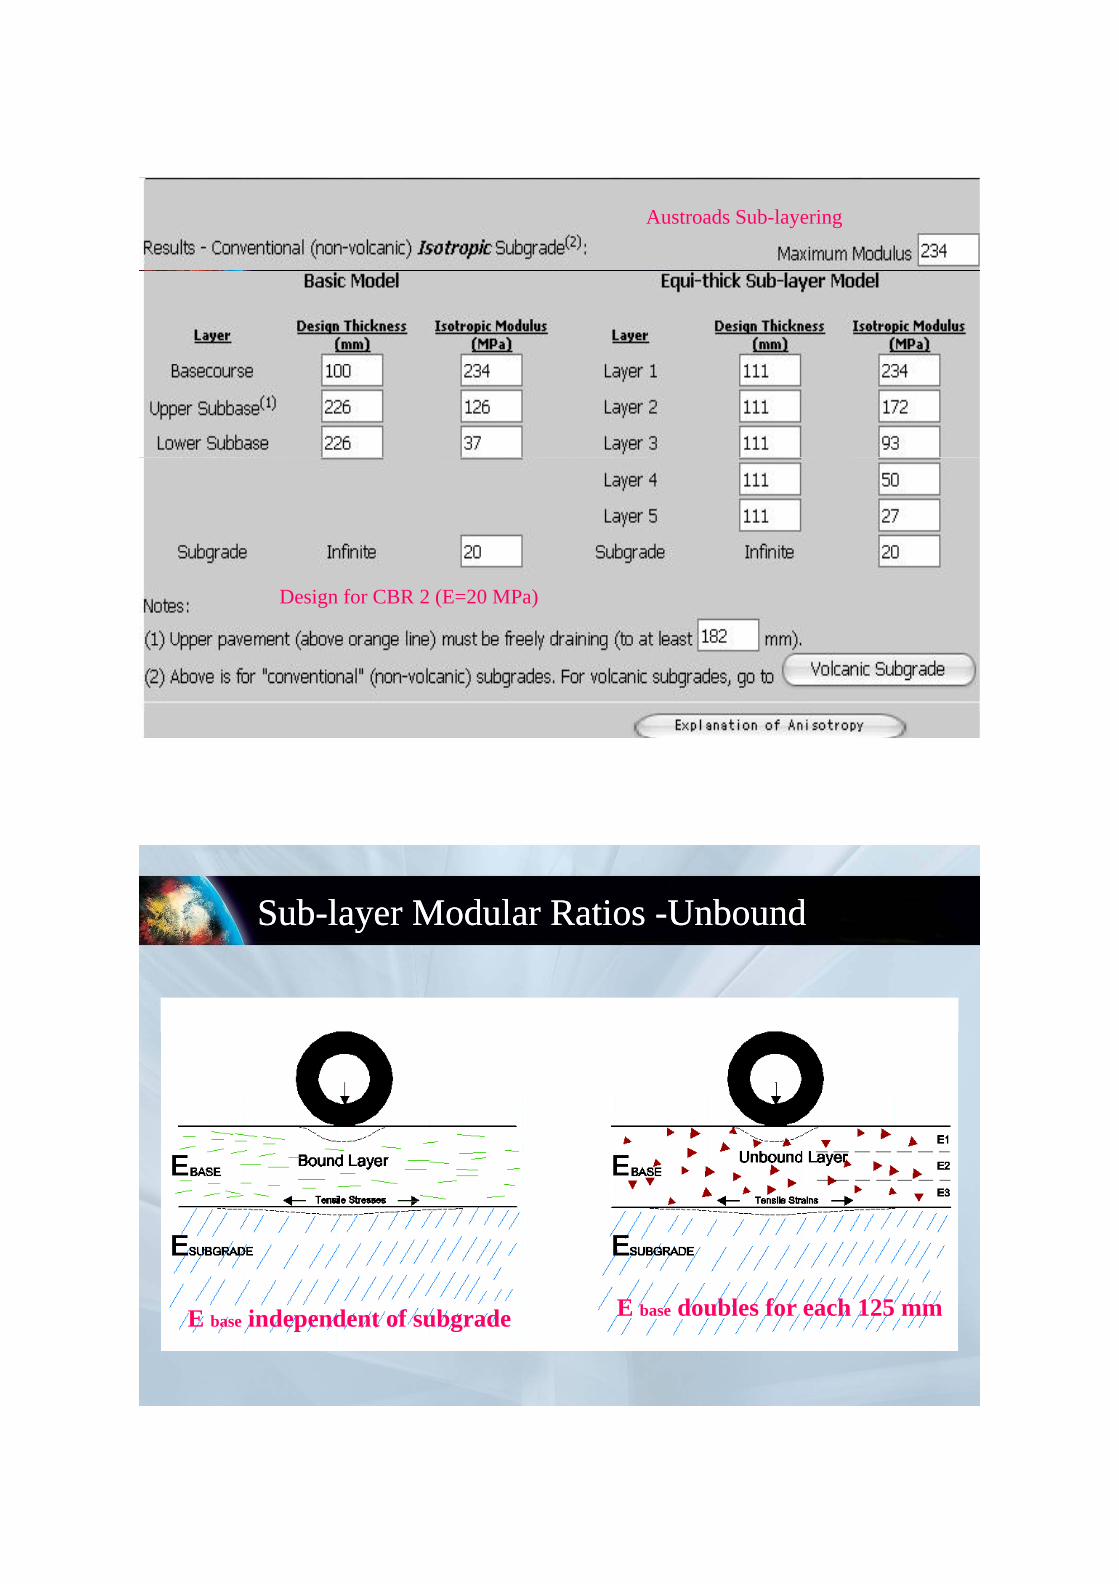
Austroads Sub-layering
Design for CBR 2 (E=20 MPa)
SubSub--layer Modular Ratios layer Modular Ratios --UnboundUnbound
E base doubles for each 125 mmE i d d t f b d E base doubles for each 125 mmE base independent of subgrade
Austroads SubAustroads Sub--layer Modular Ratioslayer Modular RatiosAustroads (2004) Chapter 8•Divide the granular materials into 5 layers of equal thickness•Adopt the vertical modulus for the top sub-layer from:
E top of base = E subgrade x 2(total granular thickness/125)
(But not exceeding tabulated upper bounds for the materials.)(But not exceeding tabulated upper bounds for the materials.)
•Determine the modular ratio of successive sub-layers from:R = [E top of base / E subgrade ] 1/5
•Calculate the modulus of each layer beginning with that•Calculate the modulus of each layer beginning with that immediately overlying the subgrade of known modulus.In summary:E top of base = E subgrade x (function of total granular thickness)
With little dependence on the quality of the unbound granular materialif proper compactive effort is applied.
Modular RatiosModular Ratios
Transit – Research into Performance Based Specificationsusing FWD.
Normalised Modular Ratio: NMRNormalised Modular Ratio: NMR
NMR = As-built modular ratioStandard modular ratioStandard modular ratio
Measure of compaction compliance with Austroads expectations
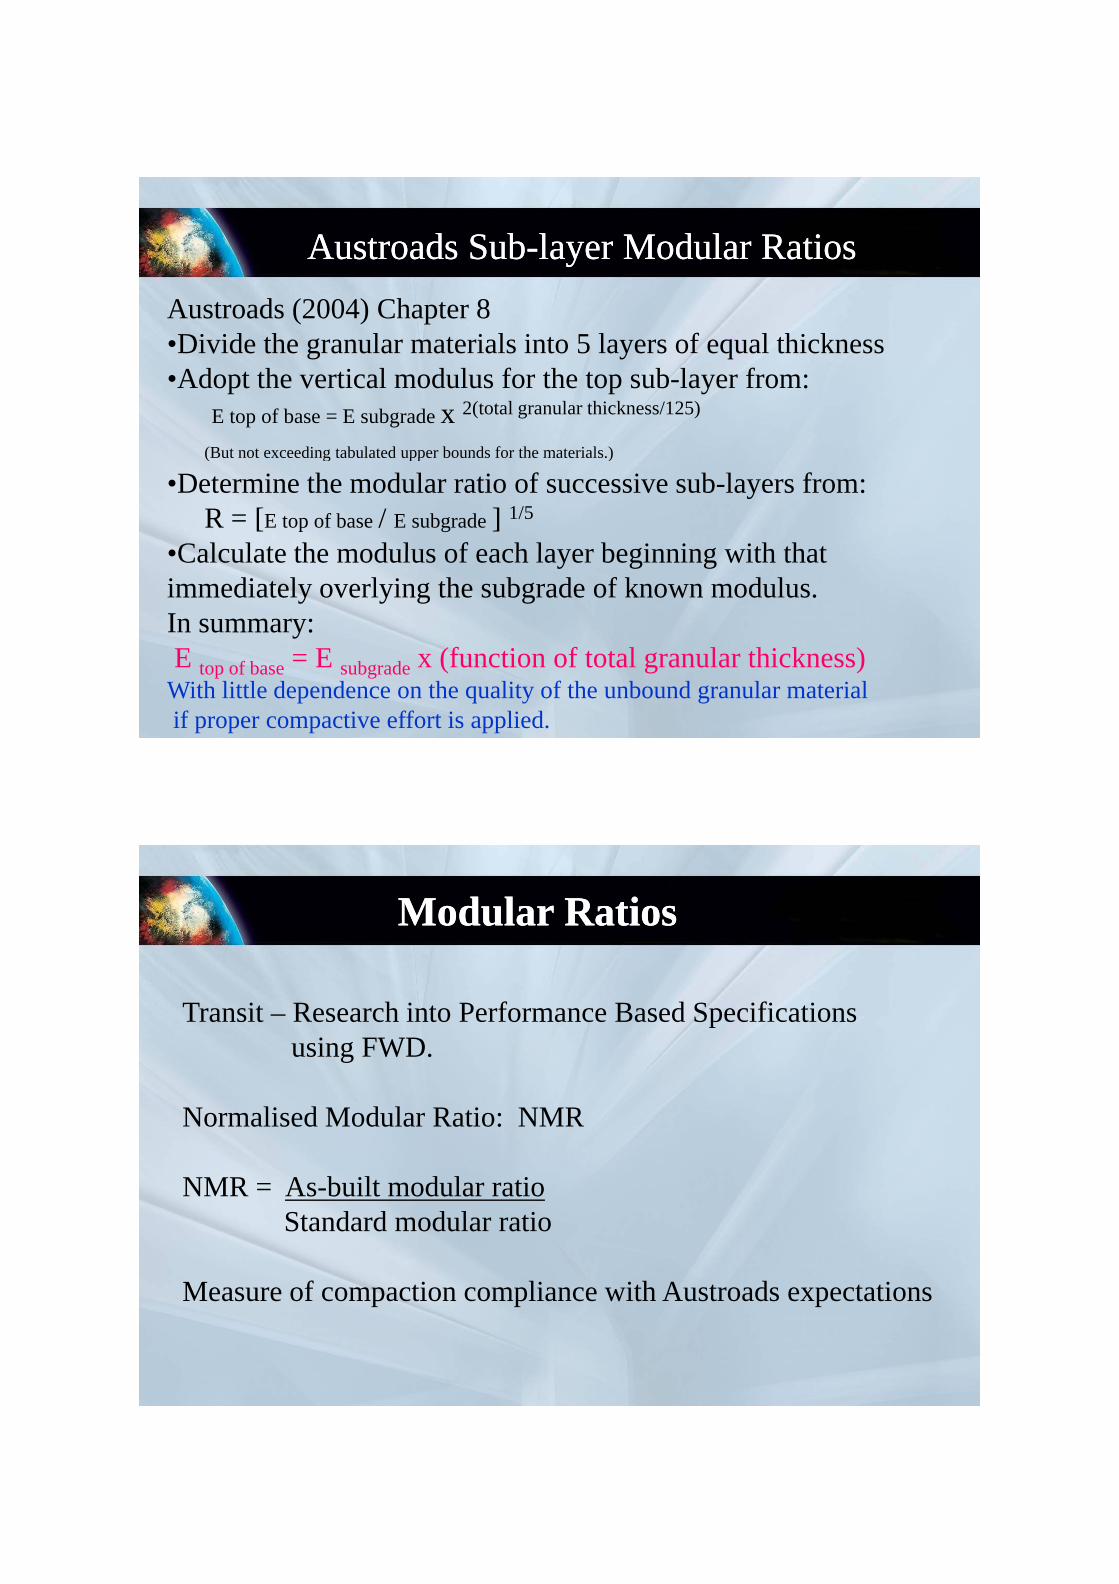
Case Histories: PostCase Histories: Post--constructionconstruction
10000
100000
a)
Basecourse Modulus
Upper Subbase Modulus
Lower Subbase Modulus
Subgrade Modulus
1000
r Mod
ulus
(MP
a Normalised Modular Ratio
10
100Laye
10
0.5
1
1.5
2
2.5
NM
R
Moduli and normalised ratios for firm subgrade
0 0.5 1 1.5 2Station (km)
0
Case Histories: PostCase Histories: Post--constructionconstruction
10000
100000
a)
Basecourse Modulus
Upper Subbase Modulus
Lower Subbase Modulus
Subgrade Modulus
1000
er M
odul
us (M
Pa Normalised Modular Ratio
10
100Laye
10
0.5
1
1.5
2
2.5
NM
R
Moduli and normalised ratios for variable subgrade
0 1 2Station (km)
0
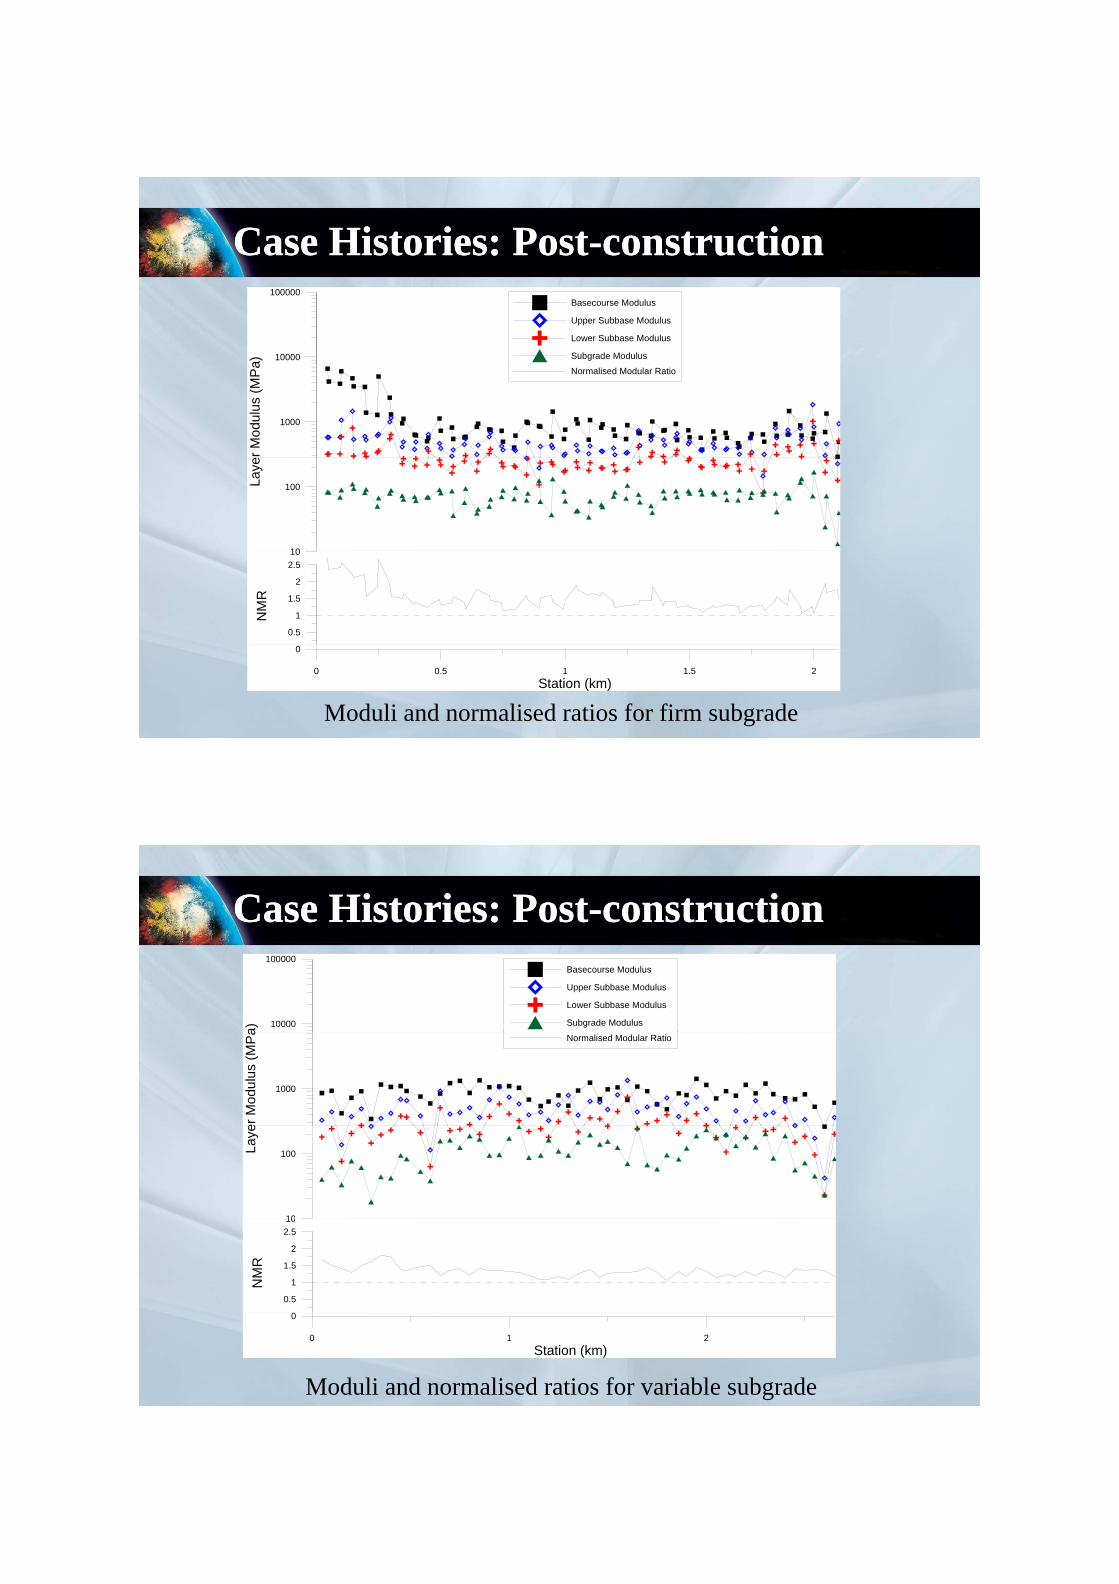
Case Histories: PostCase Histories: Post--constructionconstruction
100
Variable Subgrade CaseFirm Subgrade Case
75
ampl
es <
X
50
enta
ge o
f Sa
0
25
Per
c
Cumulative Normalised Modular Ratio Distributions for New Trafficked Pavements
0.5 1 1.5 2X axis - Normalised Modular Ratio
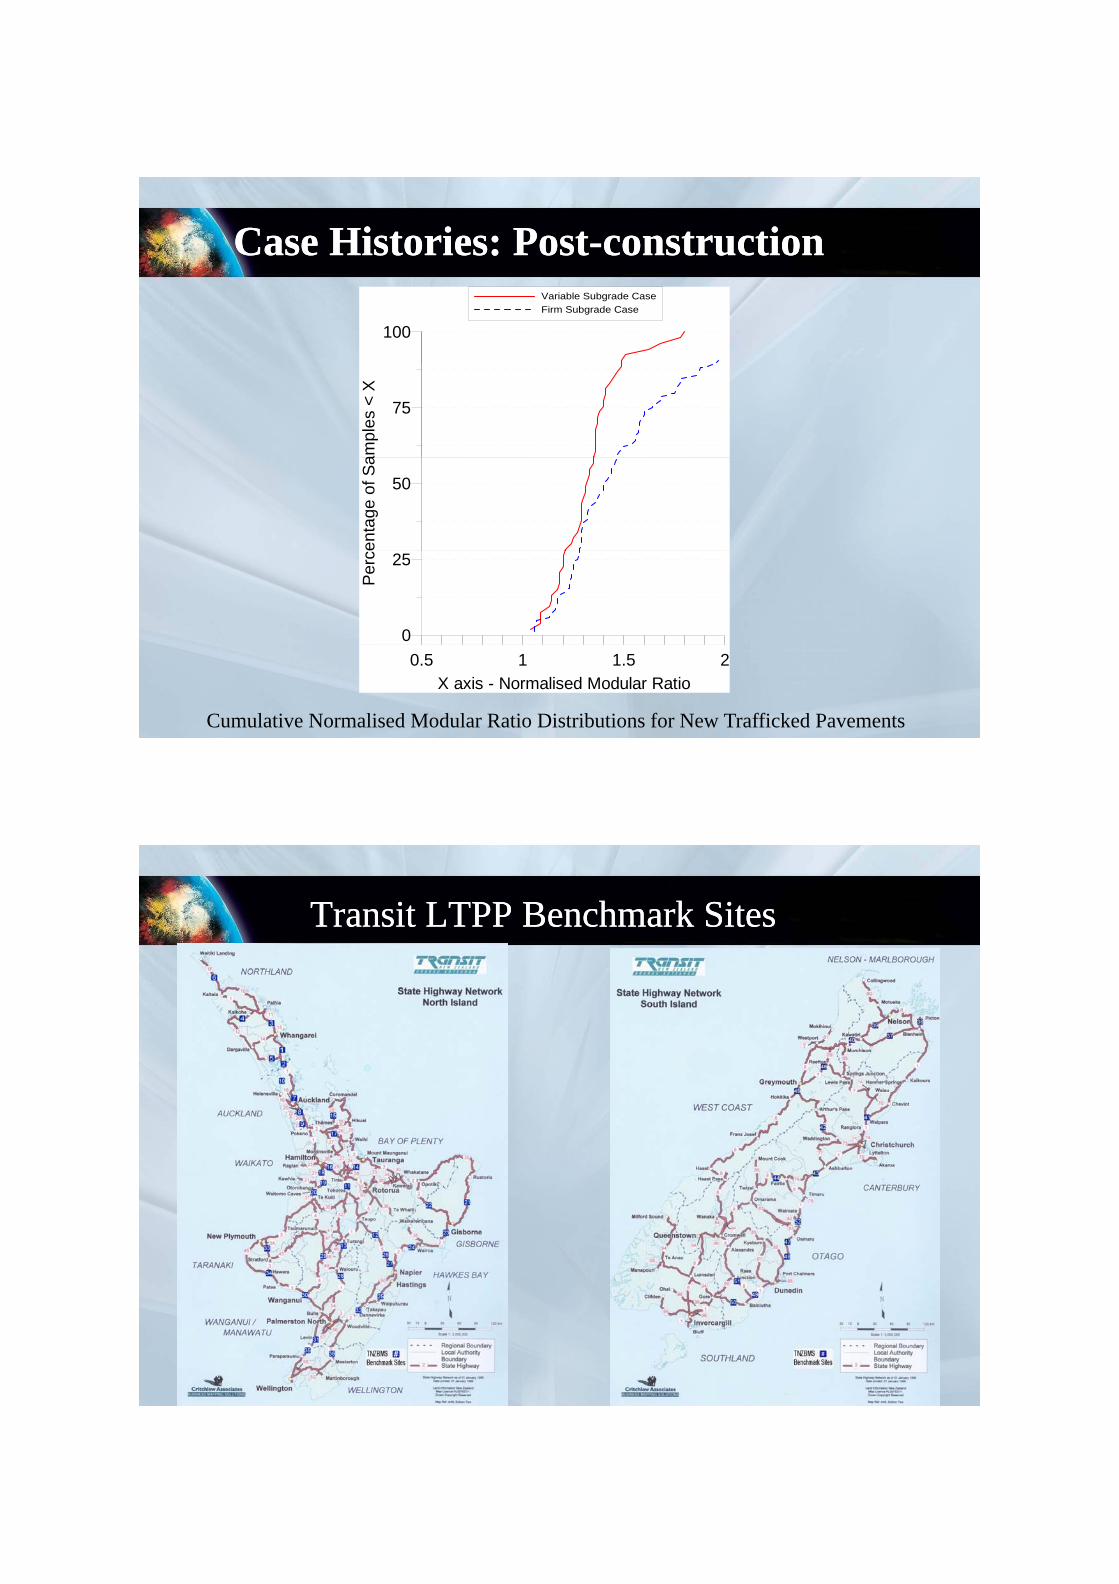
Transit LTPP Benchmark SitesTransit LTPP Benchmark Sites
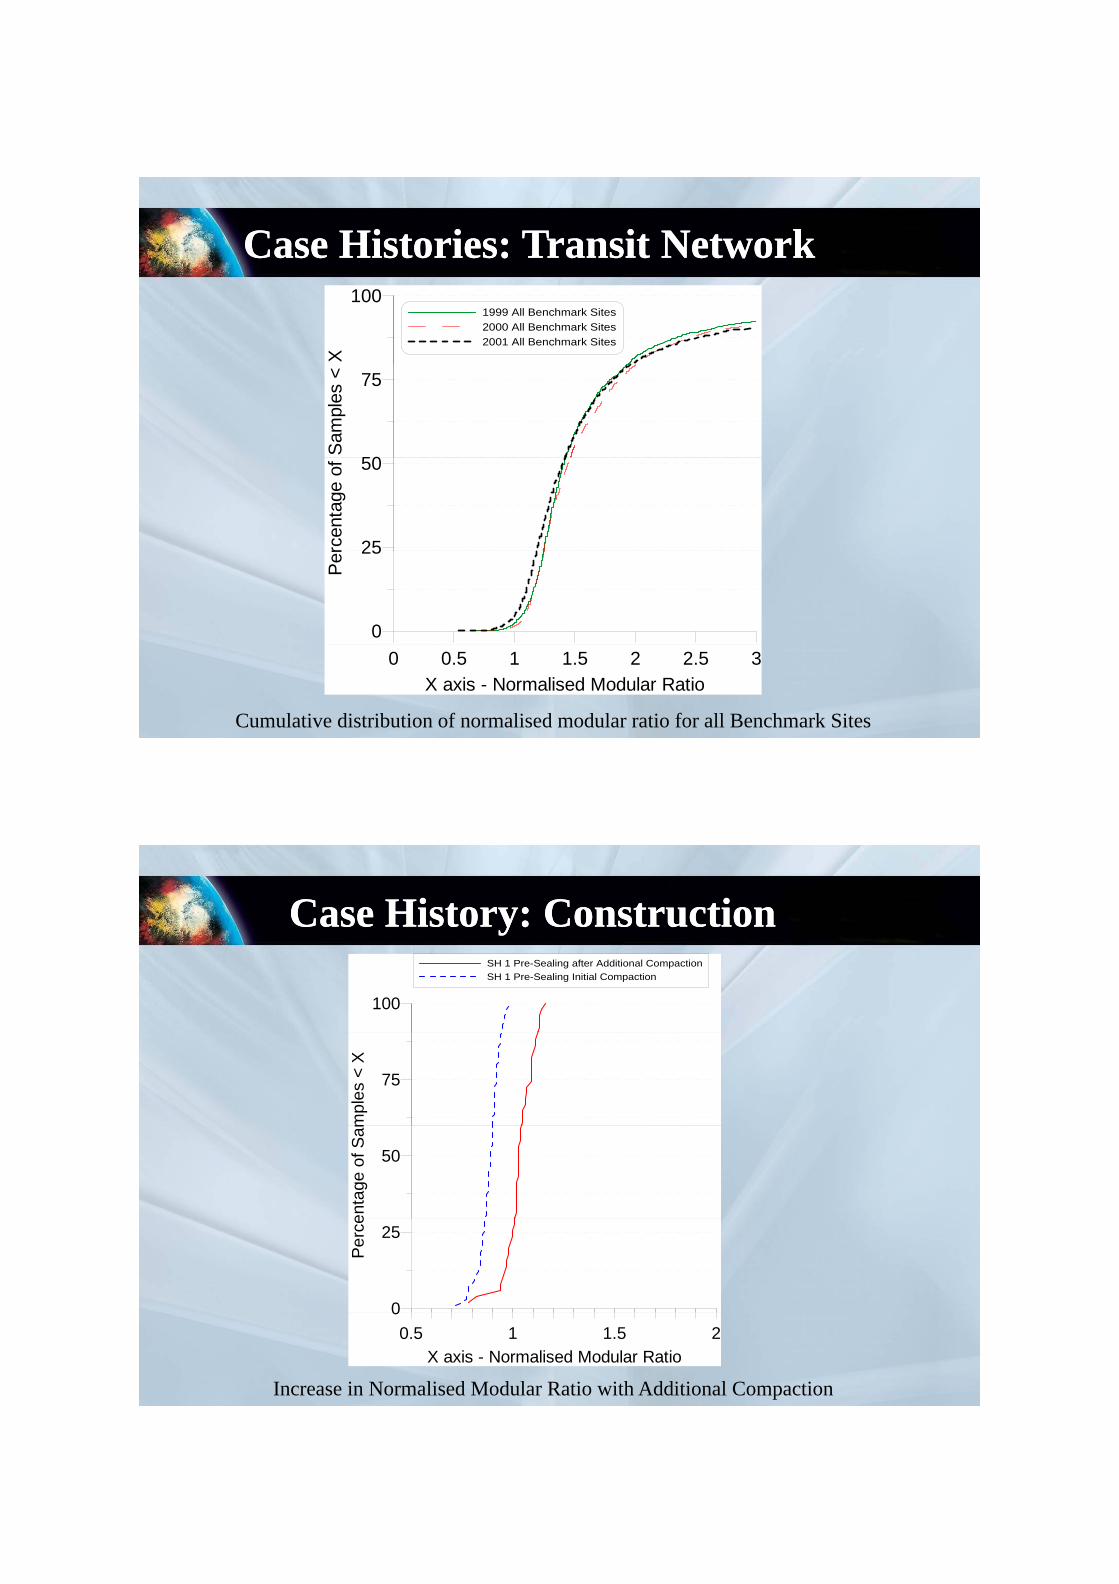
Case Histories: Transit NetworkCase Histories: Transit Network100
X1999 All Benchmark Sites2000 All Benchmark Sites2001 All Benchmark Sites
50
75
Sam
ples
<
25
50
rcen
tage
of
0
25
Per
Cumulative distribution of normalised modular ratio for all Benchmark Sites
0 1 2 30.5 1.5 2.5X axis - Normalised Modular Ratio
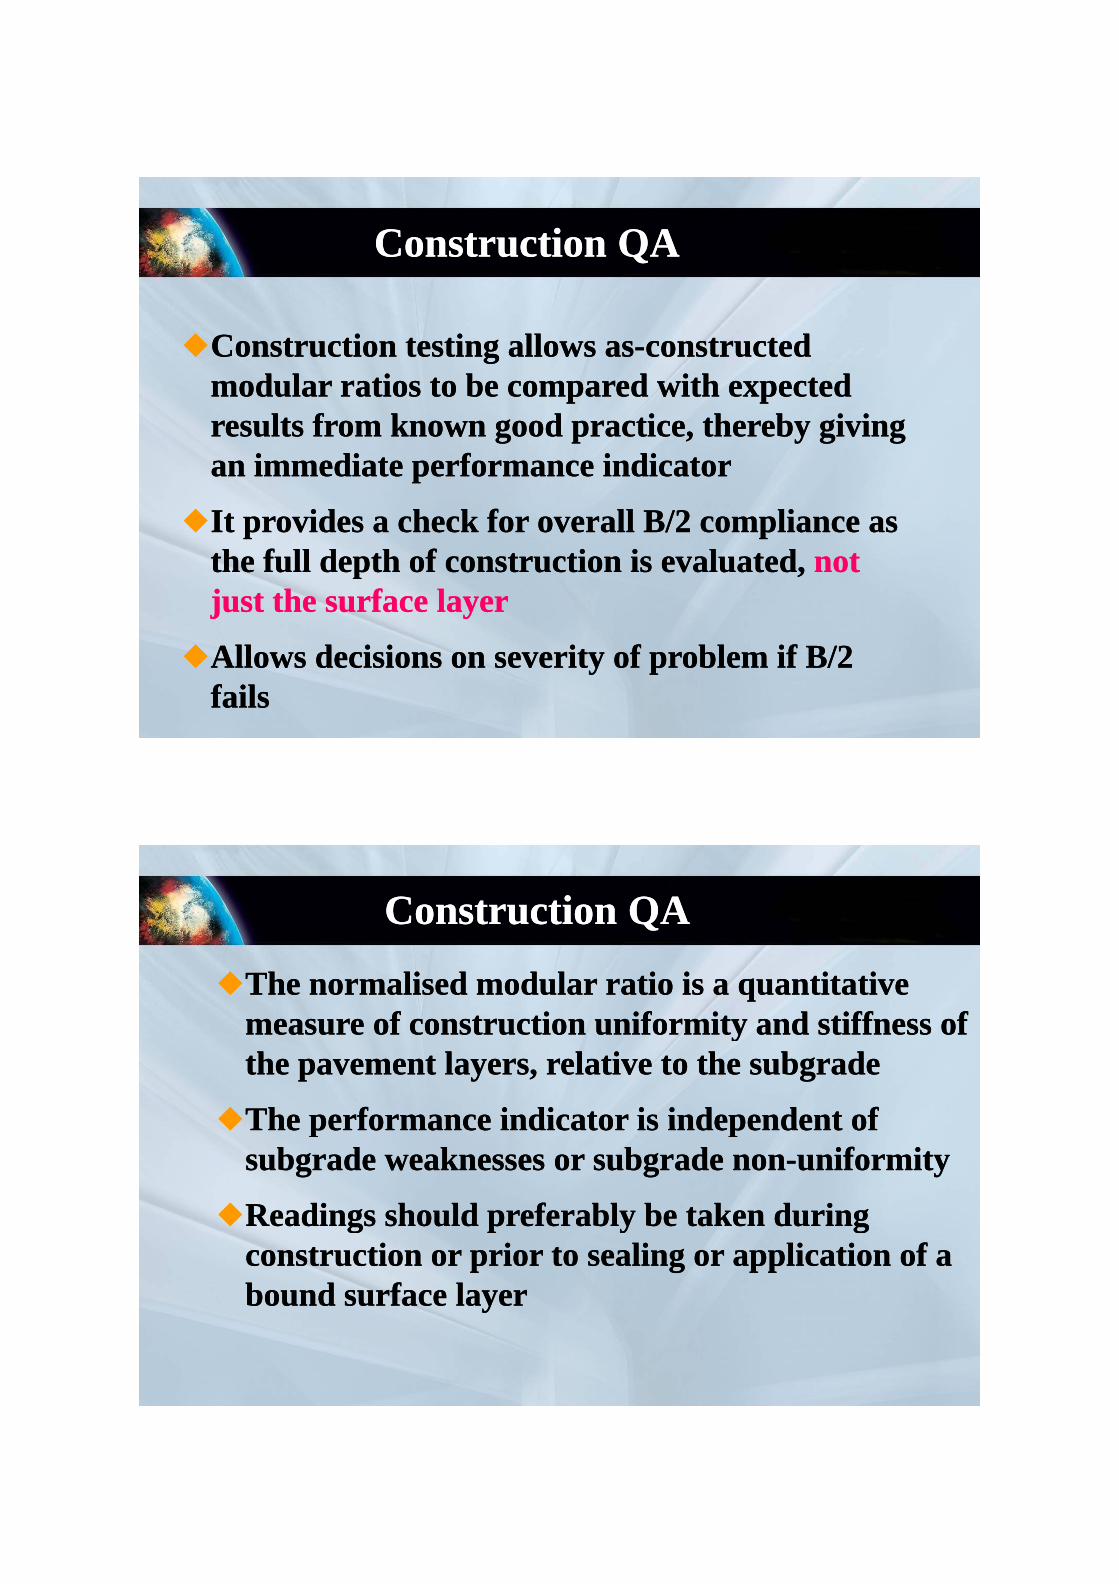
Case History: ConstructionCase History: Construction
100
SH 1 Pre-Sealing after Additional CompactionSH 1 Pre-Sealing Initial Compaction
75
mpl
es <
X
50
enta
ge o
f Sam
0
25
Perc
e
Increase in Normalised Modular Ratio with Additional Compaction
0.5 1 1.5 2X axis - Normalised Modular Ratio
0
Construction QA Construction QA
Construction testing allows asConstruction testing allows as--constructed constructed modular ratios to be compared with expected modular ratios to be compared with expected results from known good practice, thereby giving results from known good practice, thereby giving
i di t f i di ti di t f i di tan immediate performance indicatoran immediate performance indicator
It provides a check for overall B/2 compliance as It provides a check for overall B/2 compliance as h f ll d h f i i l dh f ll d h f i i l dthe full depth of construction is evaluated, the full depth of construction is evaluated, not not
just the surface layerjust the surface layer
Allows decisions on severity of problem if B/2 Allows decisions on severity of problem if B/2 failsfails
Construction QAConstruction QA
The normalised modular ratio is a quantitative The normalised modular ratio is a quantitative measure of construction uniformity and stiffness ofmeasure of construction uniformity and stiffness ofmeasure of construction uniformity and stiffness of measure of construction uniformity and stiffness of the pavement layers, relative to the subgradethe pavement layers, relative to the subgrade
The performance indicator is independent ofThe performance indicator is independent ofThe performance indicator is independent of The performance indicator is independent of subgrade weaknesses or subgrade nonsubgrade weaknesses or subgrade non--uniformityuniformity
Readings should preferably be taken duringReadings should preferably be taken duringReadings should preferably be taken during Readings should preferably be taken during construction or prior to sealing or application of a construction or prior to sealing or application of a bound surface layerbound surface layeryy
Otago Issues: Very soft subgrades (CBR<3)Otago Issues: Very soft subgrades (CBR<3)• Austroads Light Traffic – 100-150 mm stabilised then CBR =3• Transit – 150+ mm stabilisation
d l- geogrid & geotextile *- 150 mm sacrificial granular layer and same CBR
• Geotextile – ideal if cost effectiveGeotextile ideal if cost effective• Geogrid – applicable in highly yielding subgrades (deflection
100 mm in trials). * Transit Supplement: Caution: “ It is up to the geosynthetic supplier to provide relevant and credible evidence that geosynthetic supplier to provide relevant and credible evidence that such savings are applicable for the particular product in question”
• Geogrid trials on SH1 Fairfield Bypass – evidence lackingG id d t t bl i hit & i l t t ti l• Geogrid undetectable in hit & miss layout –construction only
• Drainage plus validation of design CBR for any SIL on CBR<3
Otago Issues: SchistOtago Issues: Schist--derived siltderived silt
• Transit Supplement: Care should be taken assessing silty and sensitive subgrades. They can be significantly weakened by the i i t f t ti i t d thi inappropriate use of construction equipment and this should be noted in the contract documents.
• Otago schist deri ed micaceous silts• Otago schist-derived micaceous silts:+1 m of granular subbase needed on SH 1
pavements with silt fills compacted wet of pavements with silt fills compacted wet of optimum.
Otago Issues: Solid DensityOtago Issues: Solid Density• B/2 Compliance• AP65- Correction for oversize in %MDD • Saturation and %MDD are very dependent on
solid density• Solid density often “assumed”• Percentage Solid Density Concept – an
independent check on B/2 resultsindependent check on B/2 resultsGrading exponent “n”
Fine M/4 n=0 41 coarse M/4 n= 63Fine M/4, n=0.41, coarse M/4 n=.63Dmax % = 86 + 20(0.5-n)
Otago Issues: FrostOtago Issues: Frost
• Transit Supplement: Indefinite guidance.• Frost Resistant Design and Construction of Pavements • Frost Resistant Design and Construction of Pavements
in Central Otago www.pavementanalysis.com
S d E i l t > 50 • Sand Equivalent > 50 or;• Percent passing 2.36 and 0.15 mm sieves give
P 2.36 / P 0.15 > 3 or;.36 0. 5• Freeze-thaw Heave < 14 mm
Laboratory after compaction or better, field afterLaboratory after compaction or better, field aftercompaction
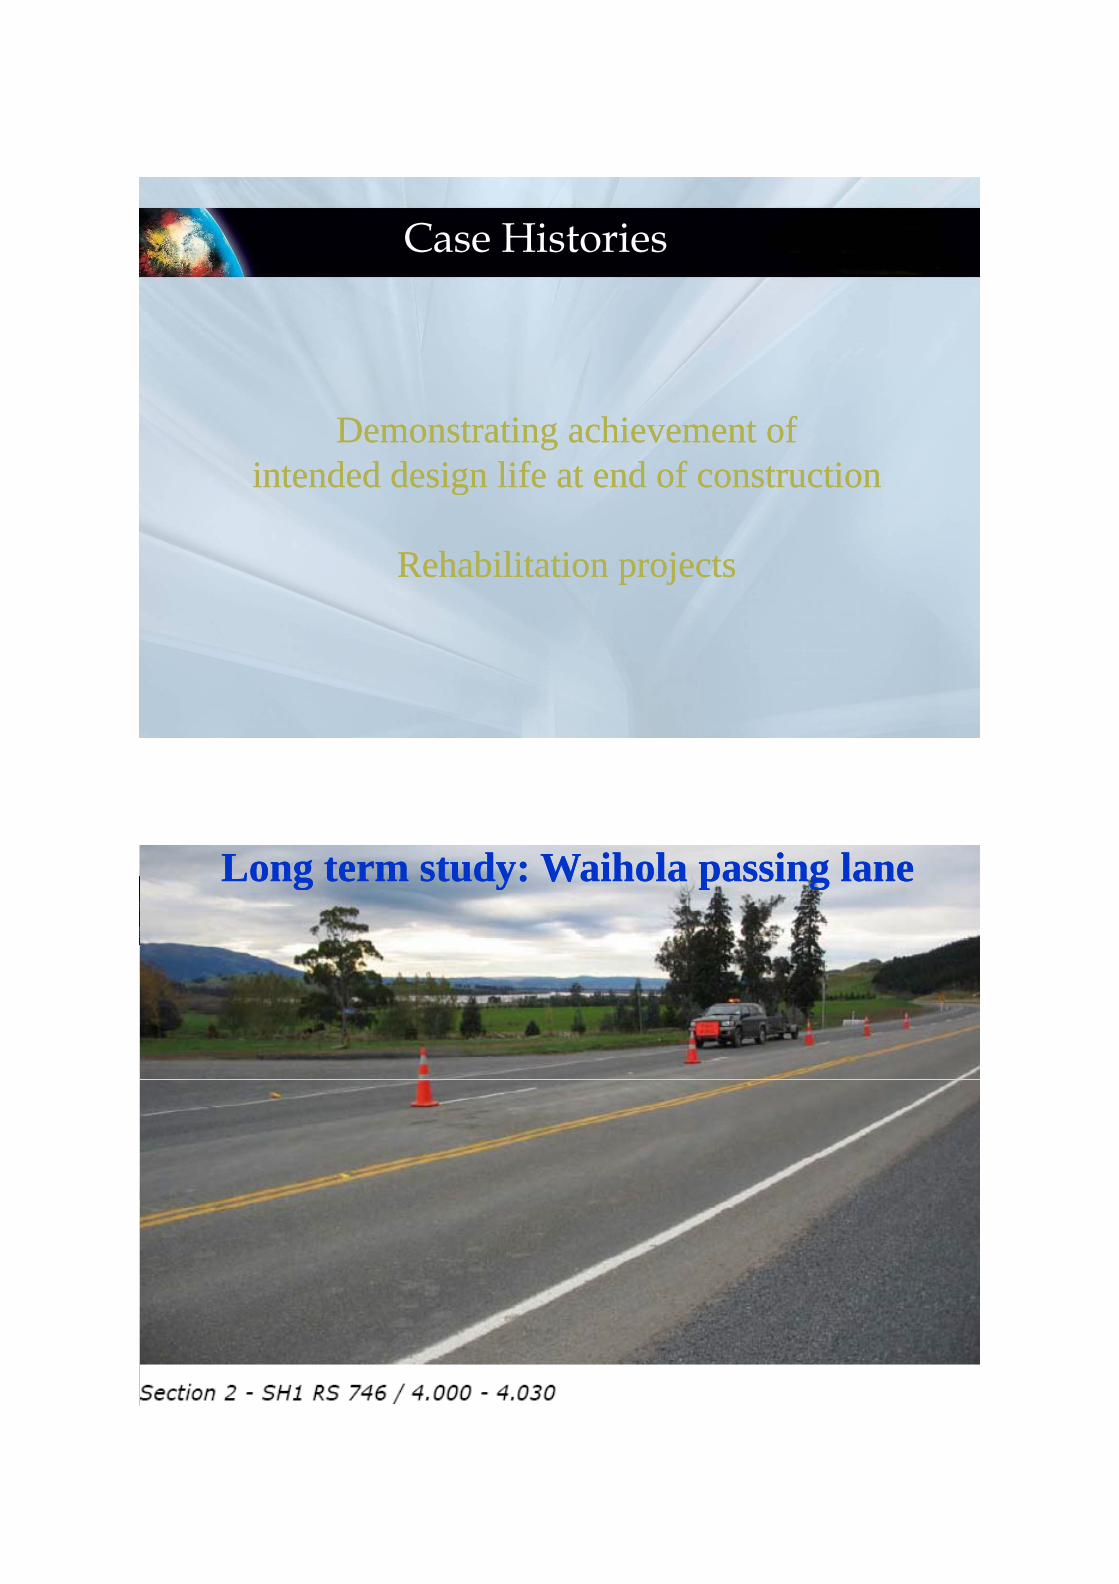
Case Histories
Demonstrating achievement of Demonstrating achievement of intended design life at end of constructionintended design life at end of construction
Rehabilitation projectsRehabilitation projects
Long term study: Waihola passing laneLong term study: Waihola passing lane
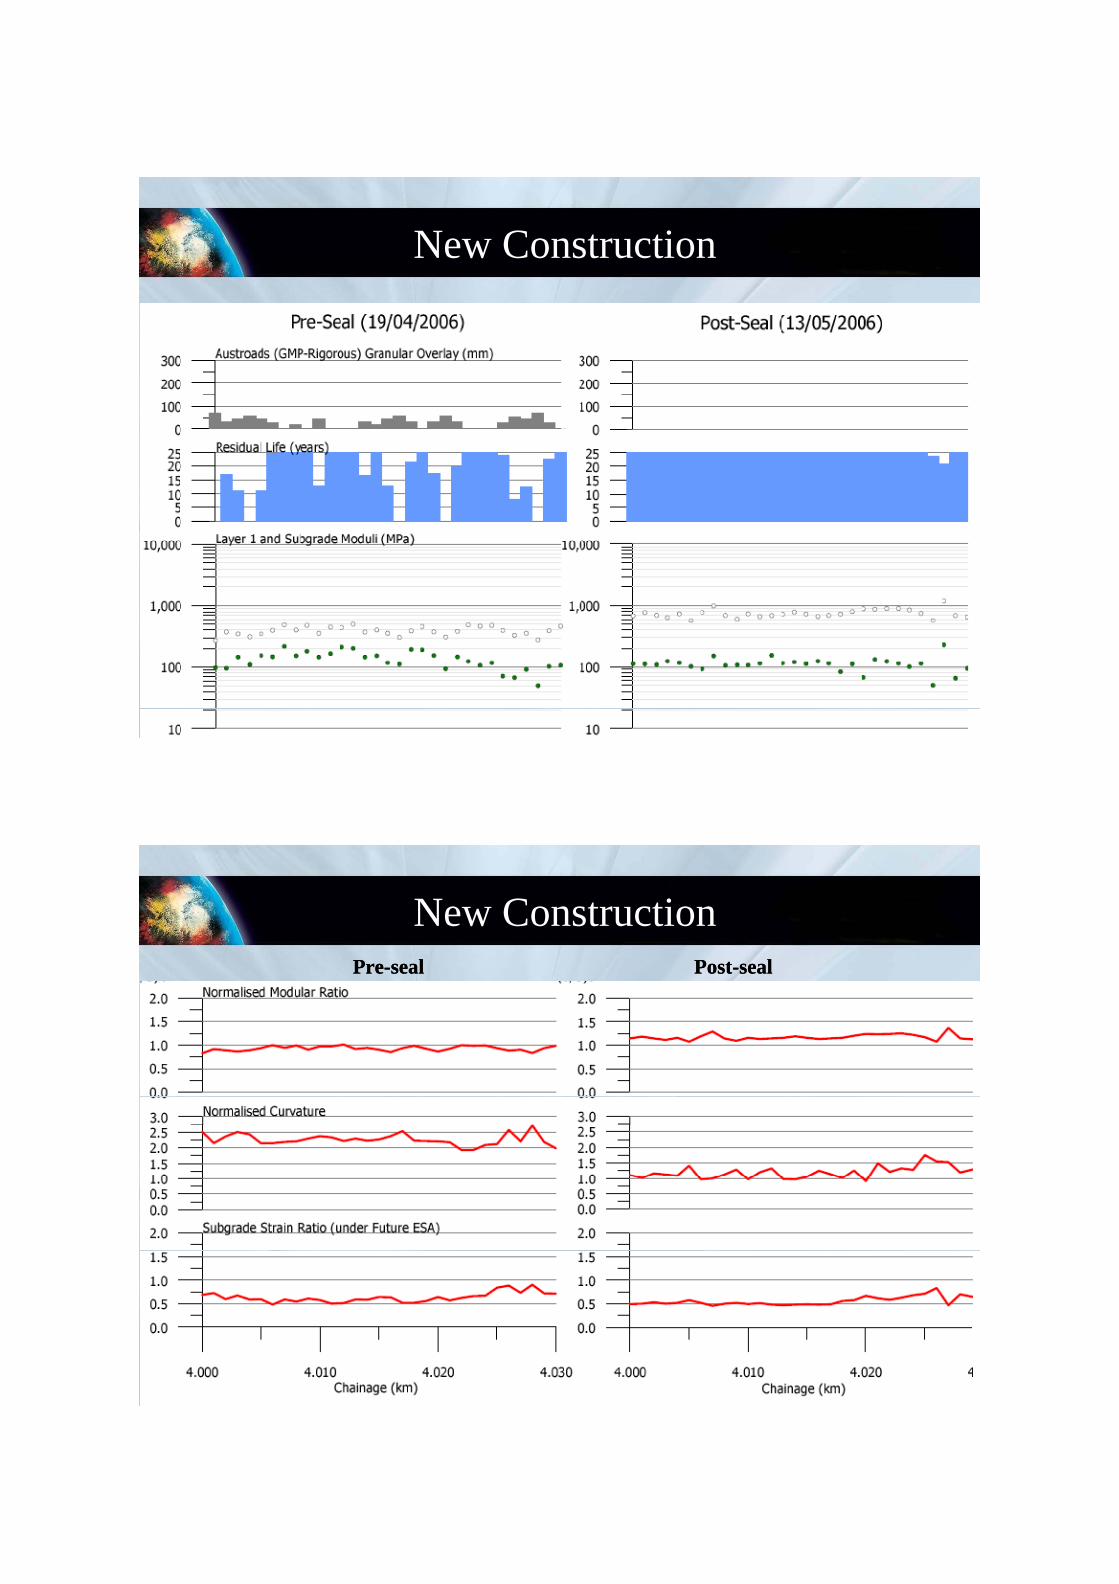
New Construction
New ConstructionPrePre--seal Postseal Post--sealseal
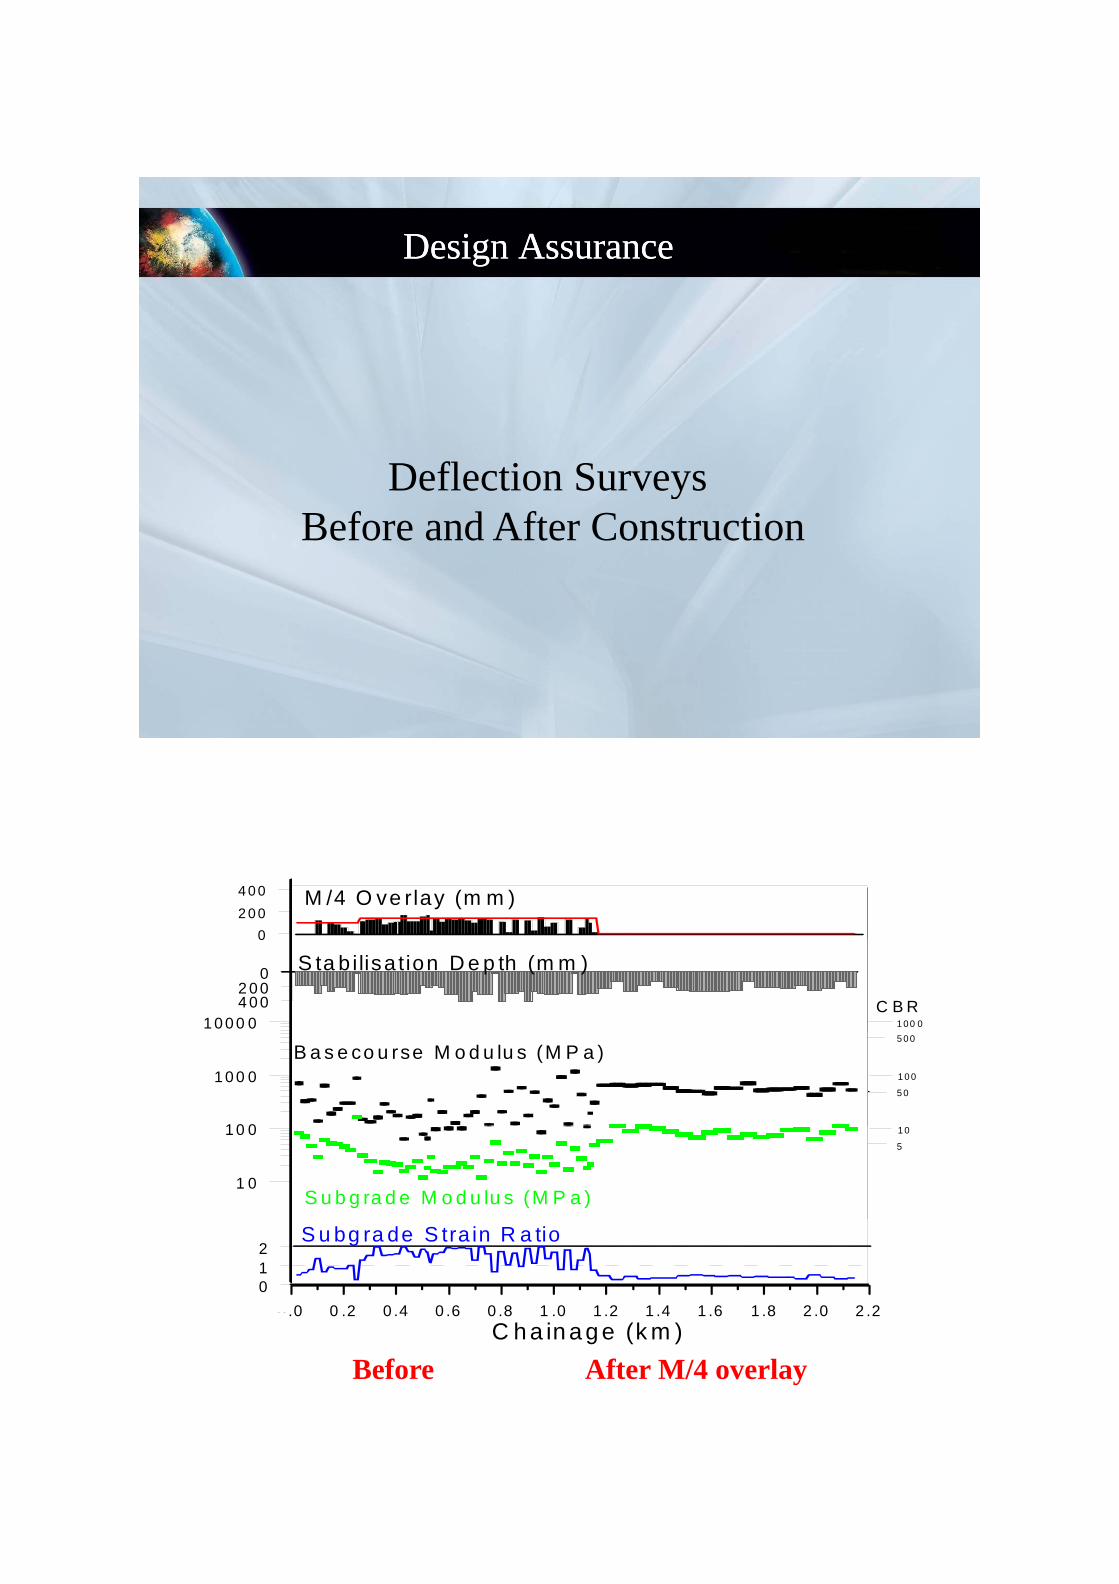
Design AssuranceDesign Assurance
Deflection Surveys Before and After Construction
02 0 04 0 0 M /4 O ve rlay (m m )
0
1 0 0 0 0 1 00 0
02 0 04 0 0
S ta b ilisa tion D e p th (m m )
C B R
B a s e co u rse M o d u lu s (M P a )
1 0 0
1 0 0 0
5 00
1 0 0
5 0
S u b g ra d e M o d u lu s (M P a )1 0
1 0 0 1 0
5
0 0 0 2 0 4 0 6 0 8 1 0 1 2 1 4 1 6 1 8 2 0 2 2012
S u bg ra de S tra in R a tio
0 .0 0 .2 0 .4 0 .6 0 .8 1 .0 1 .2 1 .4 1 .6 1 .8 2 .0 2 .2 C h a in a g e (k m )
Before After M/4 overlay
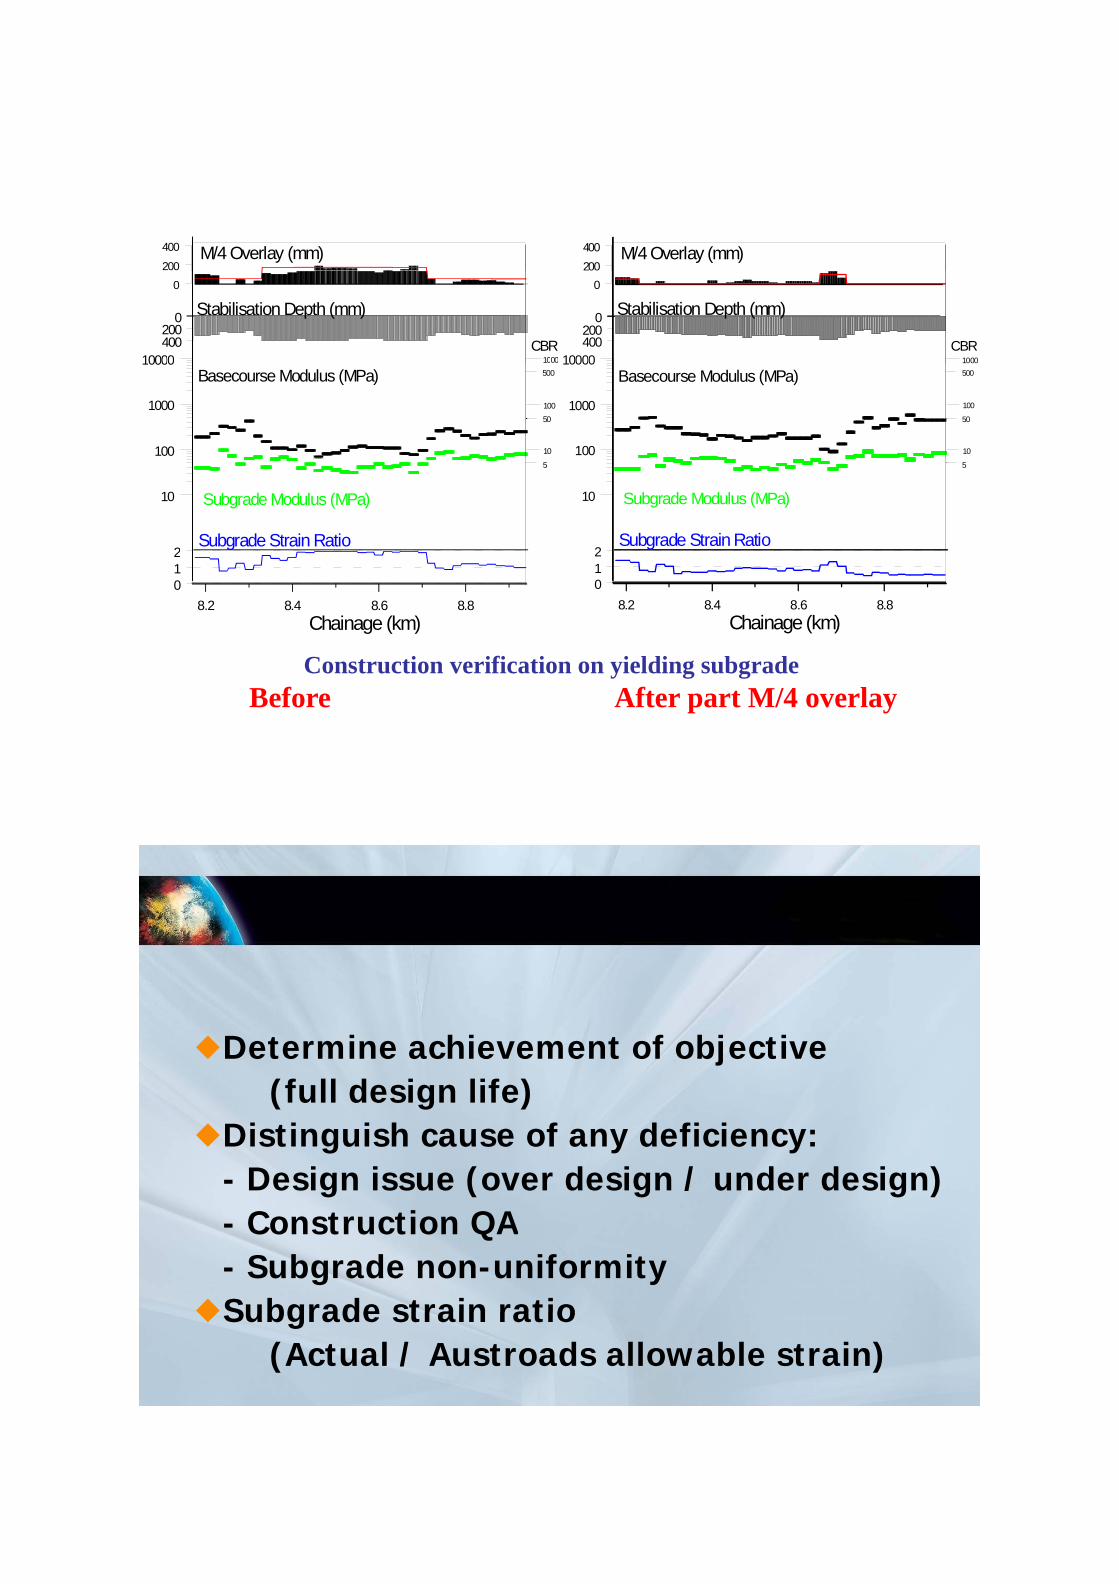
200
400 M/4 Overlay (mm)200400 M/4 Overlay (mm)
0
10000 1000
0200400
Stabilisation Depth (mm)
CBR
0
10000 1000
0200400
Stabilisation Depth (mm)
CBR
Basecourse Modulus (MPa)
100
1000
10000500
10050
10
Basecourse Modulus (MPa)
100
1000
10000500
100
50
10
Subgrade Modulus (MPa)10
5
2Subgrade Strain Ratio
Subgrade Modulus (MPa)10
5
2Subgrade Strain Ratio
8.2 8.4 8.6 8.8 Chainage (km)
012
8.2 8.4 8.6 8.8 Chainage (km)
012
Construction verification on yielding subgradeBefore After part M/4 overlay
Determine achievement of objective (full design life)
Di ti i h f d fi iDistinguish cause of any deficiency:- Design issue (over design / under design)
Construction QA- Construction QA- Subgrade non-uniformitySubgrade strain ratioSubgrade strain ratio
(Actual / Austroads allowable strain)
References & FiguresReferences & Figures
• References, 2004 anb LVR, both TNZ supplements to Austroads 2005 and 2002? **• Light Pavements – corresponding figure with same reliability No• Transit requirements 95% 25 year design (but note 10 percentile CBR normally q y g ( p y• dcc criterion is for acceptance of new pavements• Austroads 2004 – Fig 8.4 with hatched zone from S4 – reliability=?• Traffic p 32 of TNZ supp to 04, ESA=1.4*HV, 3% growth, 25 years **• Selection of design CBR, (copy ex Aust2004), Scala (silts not sands), deflection testing, design moisture content. Back
l l t d CBR (P d t th d)calculated CBR (Precedent method).• Mechanistic design concepts• Subgrade strain criterion – all graphs from Odemark 2006*• Determination of pavement parameters – using FWD – BMS subsection Es cumulative• Manapouri es plotsp p• Mechanistic design spreadsheet – not if Fig 8.4• Field verification of subgrade – during construction – Scala, FWD • Weaving excess moisture.• Compliance monitoring- spreadsheet ‘refer to nmr if fails
f t it i i f **• frost criterion paper in references **• Verification of design life – post construction testing• Rehabilitation Design – Transit supplement
Subgrade improvementSubgrade improvement
• SIL propertiesp p• Schist derived subgrade issues• Geogrid/geofabricGeog d/geo ab c
Acceptance testing of pavement layersAcceptance testing of pavement layers
• Austroads moduli for unbound layersy• Checks on compaction• Case Histories from Otagog
Demonstrating achievement of intended Demonstrating achievement of intended d i lif d f id i lif d f idesign life at end of constructiondesign life at end of construction
• Transit requirements• Transit requirements• Local Authority requirements• Case History from Otago• Case History from Otago


