Embed Size (px)
Citation preview

Oa
IJMa
b
c
a
ARRA
KACCMR
1
stat2kpcitAod
agf
0d
Computers and Electronics in Agriculture 68 (2009) 207–215
Contents lists available at ScienceDirect
Computers and Electronics in Agriculture
journa l homepage: www.e lsev ier .com/ locate /compag
bject- and pixel-based analysis for mapping crops and their agro-environmentalssociated measures using QuickBird imagery
sabel Luisa Castillejo-González a,∗, Francisca López-Granados b, Alfonso García-Ferrer a,osé Manuel Pena-Barragán b, Montserrat Jurado-Expósito b, Manuel Sánchez de la Orden a,
aría González-Audicana c
Department of Cartography Engineering, Geodesy and Photogrammetry, University of Córdoba, Campus de Rabanales, 14071 Córdoba, SpainInstitute for Sustainable Agriculture, CSIC, Apdo. 4084, 14080 Córdoba, SpainDepartment of Projects and Rural Engineering, Public University of Navarre, Campus de Arrosadía, 31006 Pamplona, Spain
r t i c l e i n f o
rticle history:eceived 27 January 2009eceived in revised form 18 May 2009ccepted 9 June 2009
eywords:
a b s t r a c t
Currently, monitoring of agrarian policy actions usually requires ground visits to sample targeted farms,a time-consuming and very expensive procedure. To improve this, we have undertaken a study of theaccuracy of five supervised classification methods (Parallelepiped, Minimum Distance, Mahalanobis Clas-sifier Distance, Spectral Angle Mapper and Maximum Likelihood) using multispectral and pan-sharpenedQuickBird imagery. We sought to verify whether remote sensing offers the ability to efficiently identify
gro-environmental measuresonservation agriculturerop inventoryultispectral and pan-sharpened imagery
emote sensing
crops and agro-environmental measures in a typical agricultural Mediterranean area characterized by dryconditions. A segmentation of the satellite data was also used to evaluate pixel, object and pixel + object asminimum information units for classification. The results indicated that object- and pixel + object-basedanalyses clearly outperformed pixel-based analyses, yielding overall accuracies higher than 85% in mostof the classifications and exhibiting the Maximum Likelihood of being the most accurate classifier. Theaccuracy for pan-sharpened image and object-based analysis indicated a 4% improvement in performance
ata.
relative to multispectral d. Introduction
The Mediterranean basin is conducive to non-irrigated, inten-ive and tillage agricultural practices, which have great relevancy inerms of desertification and land degradation (Hill et al., 1995). Thegro-environmental implications and consequences of traditionalillage systems, mainly with regard to erosion, soil loss (Gómez et al.,003) and sediment transport (Mickelson et al., 2003), are widelynown. Due to these negative environmental impacts, the Euro-ean Union (E.U.) only subsidizes cropping systems under certainonservation agro-environmental measures such as cover cropsn olive orchards, the non-burning of crop stubble and no-tillage
echniques to maintain crop residues after harvesting (Andalusiandministration Regulation, 2007). Currently, around 45% (4.3 M ha)f the whole Andalusian (Andalusia, southern Spain) surface isevoted to intensive agricultural production, and to control these∗ Corresponding author at: Department of Cartography Engineering, Geodesynd Photogrammetry, University of Córdoba, Campus de Rabanales, edificio Gre-or Mendel, 2a planta, 14071 Córdoba, Spain. Tel.: +34 957 218 537;ax: +34 957 218 537.
E-mail address: [email protected] (I.L. Castillejo-González).
168-1699/$ – see front matter © 2009 Elsevier B.V. All rights reserved.oi:10.1016/j.compag.2009.06.004
© 2009 Elsevier B.V. All rights reserved.
agrarian policy actions a precise monitoring of crop inventories andcropping systems by the E.U. and local administrations is required.
In Southern Europe, the monitoring of cropping systems by theE.U. administration has been achieved by sampling and groundvisits covering at least 1% of the entire area under study. Obviously,this procedure is time-consuming, very expensive and deliversinconsistent results because it covers relatively small areas or onlyvery few target fields. Remotely sensed data can significantly lowercosts, speed up work and improve reliability compared to groundvisits. However, particularly for this purpose, the accuracy of thethematic map is extremely important. This map could be used as atool to facilitate the administrative monitoring necessary to deter-mine whether or not to concede the subsidy.
Several studies have been developed to monitor diverse agri-cultural topics by remote sensing, such as vegetation inventories(Van Niel and McVicar, 2004; Yu et al., 2006) and no-tillage/tillagesystems (South et al., 2004; Bricklemyer et al., 2006). Mediumspatial resolution satellite imagery, such as that from Landsat The-
matic Mapper and Spot, has often proven to have insufficientaccuracy for detailed vegetation studies (Harvey and Hill, 2001).However, higher spatial resolution satellite imagery, such as thatfrom IKONOS and QuickBird, has already been accepted as a use-ful data source that accurately determines ecological, agronomic
2 nd Ele
aeihodaethtoptimsto
evakspbtmcdsPvaoumm
pacaactbtocIutomi
heotl(lc
08 I.L. Castillejo-González et al. / Computers a
nd forest variables (Chubey et al., 2006; Yang et al., 2006; Mallinist al., 2008). Companies that distribute Earth Observation Satellitemages usually offer the user community two separate products: aigh-spatial resolution panchromatic image and a low-spatial res-lution multispectral one. A high spectral resolution facilitates theiscrimination of land cover types, but a high spatial resolution islso necessary to be able to accurately delimit the area occupied byach land cover type, as well as to locate the different terrain fea-ures and structures (González-Audicana et al., 2004). Image fusionas been used extensively to provide a single image that simul-aneously combines high spectral information (from multispectralr hyperspectral images) with high spatial information from theanchromatic ones. A good fusion method must allow for the injec-ion into each band of the multispectral image of spatial detailnformation from the panchromatic image that is not present in the
ultispectral one (Otazu et al., 2005). Different researchers havehown that wavelet-based methods provide satisfactory high spa-ial resolution images, maintaining the spectral properties of theriginal multispectral data (Choi et al., 2005; Vijayaraj et al., 2006).
Several supervised and unsupervised classification methodsxist and have been used for land use classification studies. Super-ised classification is a procedure for identifying spectrally similarreas in an image in which the user recognizes training sites ofnown land covers; the classification algorithm extrapolates thosepectral characteristics to other areas for classification. The unsu-ervised classification comprises the categorization of an imagey computer processing based solely on image statistics, withouthe intervention of direct user guidance. South et al. (2004) sum-
arized most supervised classification routines into three mainategories: distance-based, probability-based and angular-basedecision rules. Distance-based classifiers rely primarily on meanpectral values of distinct classes, ignoring variance within classes.robability classification routines incorporate both the mean andariance of the data set into the classification decision rule. Finally,ngular-based classifiers use a classification decision rule basedn spectral angles formed between a referenced spectrum and annclassified pixel. There is no one ideal classification routine. Theost appropriate method is determined by the needs and require-ents of each study.
Most remote sensing land use classification studies are based onixel information. However, an increase in spatial resolution causesn increase in intraclass spectral variability and a reduction inlassification performance and accuracy when pixel-based analysesre used. To overcome this problem, it could be useful to groupdjacent pixels into spectrally and spatially homogeneous objectsreated via a segmentation process. Funck et al. (2003) groupedhe main segmentation algorithms into two general classes: edge-ased and object-merging algorithms. Object merging algorithmsake some pixels as seeds and grow the regions around them basedn certain homogeneity criteria (Yu et al., 2006). Thereafter, thelassification is not based on pixels but on objects as the Minimumnformation Unit (MIU). These objects are not characterized by aniform reflectance value, but by the distribution of a certain spa-ial autocorrelation (Lobo, 1997). This spatial information is basedn object size, shape and context, and can be calculated as infor-ation pertaining to an object’s sub- or super-object if a multilevel
mage object hierarchy has been created (Chubey et al., 2006).Since Kettig and Landgrebe (1976), the object-based approach
as hardly been used in favor of easier pixel-based analyses. How-ver, in recent years, and probably due to the current availabilityf more powerful software, some researchers have reported that
he segmentation techniques used in classifications reduce theocal variation caused by textures, shadows and shape in forestryChubey et al., 2006; Yu et al., 2006; Mallinis et al., 2008) andandscapes (Hay et al., 2003) classifications. However, object-basedlassifications in typical agricultural dryland Mediterranean areasctronics in Agriculture 68 (2009) 207–215
to map cropping systems and key agro-environmental measureswith high spatial resolution satellite imagery are lacking.
Therefore, the main objective of this paper was to examinefive supervised classification routines applied to pixel, object, andpixel + object (analysis of pixel and object bands together) data asMIU to analyze the potential of each method for the identificationand mapping of cropping systems and their agro-environmentalmeasures using multispectral QuickBird images. An additional goalwas to check the accuracy of these supervised classification routinesand MIU using QuickBird pan-sharpened and multispectral imageryto test whether an improvement of spatial resolution increased thereliability of the classification.
2. Materials
2.1. Land covers and data acquisition
The study area is about 87.21 km2 (15.3 km × 5.7 km) locatednear Montilla, province of Córdoba (Andalusia, southern Spain,Fig. 1). This agricultural area is representative of Andalusian drylandcrops and has a typical continental Mediterranean climate, charac-terized by long dry summers and mild winters and a relatively flatrelief with an average height of 380 m above sea level.
In this scene, 10 land uses were considered: (1) spring-sown sun-flower (Helianthus annuus L.), (2) olive (Olea europaea L.) orchards,(3) vineyards (Vitis vinifera L.), (4) burnt crop stubble (of win-ter cereal: wheat, Triticum durum L., generally), (5) winter cerealstubble, (6) urban soil, (7) roads, (8) river side tree areas com-prising of mulberry-trees (Morus alba L.), eucalyptus (Eucalyptusglobules Labill) and poplar (Populus nigra L.), (9) dark agriculturalbare soil, and (10) light agricultural bare soil. The latter two landuses provided radiometric signals contrasting enough to separatethe agricultural bare soil into two categories: light and dark baresoil.
The study area was visited to determine land uses. Ground-truthland use was randomly defined to substantiate and validate the clas-sification procedures. A surface of over 130 ha distributed over theentire image was georeferenced using the sub-meter differentialGPS TRIMBLE PRO-XRS provided with TDC-1. Thirty hectares of thissurface were used to collect the spectral signature in the trainingprocess. In these 30 ha, a total of 110 independent and distant sam-ples with 50 non-contiguous pixels per sample for every land usewere georeferenced. The remaining 100 ha were used to assess theaccuracy of the classifications. In these 100 ha, a total of 350 inde-pendent and distant samples with 50 non-contiguous pixels persample for every land use were collected.
2.2. Satellite data and preprocessing
Digital image data were acquired for the study area by Quick-Bird satellite on July 10, 2004. The QuickBird data set consistedof a single-band panchromatic image with a spatial resolution of0.7 m, and a 4-band multispectral image with a spatial resolutionof 2.8 m in the following spectral bands: blue (B: 450–520 nm),green (G: 520–600 nm), red (R: 630–690 nm), and near-infrared(NIR: 760–900 nm). Radiometric resolution was 8 bit. Radiometricand geometric corrections were previously carried out by thedistributor. No atmospheric corrections were needed. Also, a geo-referencing process was carried out.
In order to obtain an image of high spectral and spatial resolu-tion, the multispectral and panchromatic images were fused using
the AWLP method (Otazu et al., 2005), a generalization of the addi-tive wavelet decomposition (AWL) method, previously describedby Núnez et al. (1999). This wavelet-based fusion technique pre-serves the spectral information of the multispectral original imagesince the spatial detail information from the panchromatic image
I.L. Castillejo-González et al. / Computers and Electronics in Agriculture 68 (2009) 207–215 209
ain. Th
ioititsts
3
3
FcAmitSbawmdcistrtn2t2
d
Fig. 1. Location of the study area in Andalusia, southern Sp
s injected into each low-resolution multispectral band. As a resultf this fusion or pan-sharpening process, a 4-band multispectral
mage with a spatial resolution of 0.7 m was obtained. To estimatehe global quality of the resulting pan-sharpened image, the ERGASndex (Erreur Relative Globale Adimensionnelle de Synthèse), i.e.,he relative adimensional global error in synthesis, was calculatedhowing a value of 2.107. The lower the ERGAS value, the higherhe spectral quality of fused images. A good quality fused producthould exhibit an ERGAS error <3 (Wald, 2002).
. Methods
.1. Segmentation
QuickBird imagery was partitioned into image objects using theractal Net Evolution Approach (FNEA) segmentation algorithmarried out by the Definiens Developer 7 software (DefiniensG 2007). Segmentation subdivides an image into homogeneousulti-pixel regions based on several user-defined parameters. It
s used to produce image object primitives as a first step for fur-her classification and other processing procedures (Baatz andchäpe, 2000). The image has been processed by a multiresolutionottom-up region-merging algorithm, in which individual pixelsre merged into small objects, followed by successive iterations inhich small objects are incrementally merged into larger ones. Theerging process continues until a threshold derived from the user-
efined parameters is reached (Baatz and Schäpe, 2000). The useran influence the output of the segmentation process through spec-fications and weighting of input data and controlling parametersuch as scale (control size parameter), color (spectral informa-ion) and shape (smoothness and compactness information) of theesulting image objects. Therefore, the multiresolution segmen-ation is an optimization procedure that minimizes, for a givenumber of image objects, the average heterogeneity (Definiens,
007a) and produces highly homogeneous image objects, at an arbi-rary resolution, from different types of data (Baatz and Schäpe,000).Settings for the remaining segmentation parameters wereetermined by testing different segmentation input scenarios to
e study area is depicted by QuickBird multispectral image.
evaluate their ability to delineate meaningful agricultural compo-nents based on classification and accuracy assessments. The scaleparameter is an abstract term that determines the maximumallowed heterogeneity for the resulting image objects. Color param-eter and shape parameter (smoothness and compactness) definethe percentage that the spectral values and the shape of objects,respectively, will contribute to the homogeneity criterion. A num-ber of input parameters were tested and finally the values of50, 0.8, 0.2, 0.5 and 0.5 were defined for scale, color, shape,smoothness and compactness, respectively, of multispectral andpan-sharpened images. These parameters provided the most satis-factory inputs scenarios. Cadastre ancillary data were also includedto provide useful information to improve the segmentationprocess.
The multiresolution segmentation approach allows, fordifferent scales of segmentation, the simultaneous represen-tation of image information at different resolutions (scales) bya hierarchical network. Information about adjacent objects onthe same level (horizontal neighbors) and objects on differenthierarchical levels (vertical neighbors) are allowed by this network.Although it generates a large amount of data, this study has usedonly two types of information: spectral and textural (Table 1).To describe image objects with information derived from theirspectral properties, we have used the mean spectral value of eachobject in each band. To detect the local differences between objectsin lower levels (subobjects), homogeneity, contrast and entropyvalues have been obtained. These textural parameters have beencalculated based on Haralick’s co-occurrence matrix. This is a tabu-lation of how often different combinations of pixel gray levels occurthroughout an image (Definiens, 2007b). The mean spectral valueof each object was the basic parameter for the classification. Firstly,different classifications were carried out by using only the meanfeature, and then, the whole possible combinations between themean and the remaining object-based features. Therefore, all the
classifications were based in the combinations of mean and the restof the textural parameters. In conclusion, four object-based fea-tures (mean, entropy, homogeneity and contrast) were obtained forthe four original multispectral or pan-sharpened bands, yielding 16bands for multispectral and 16 bands for pan-sharpened imagery.
210 I.L. Castillejo-González et al. / Computers and Ele
Table 1Object-based features.
Categories Description
Spectral features pixels Mean 1#Pv
∑
(x,y) ∈ Pv
ck(x, y)
Textures GLCM Homogeneity
N−1∑
i,j=0
Pi,j
1+(i−j)2
GLCM Contrast
N−1∑
i,j=0
Pi,j(i − j)2
GLCM Entropy
N−1∑
i,j=0
Pi,j(− ln Pi,j)
#va
3
tDLma
w
the confusion matrix are significantly better than random or chance
F
Pv: the total number of pixels contained in an image object v, ck(x,y): image layeralue at pixel (x,y), i: the row number, j: the column number, N: numbers of rowsnd columns, Pi,j: the normalized value in the cell.
.2. Classification and accuracy
Five supervised classification methods were selected to examineheir suitability for classification: Parallelepiped (P), Minimumistance (MD), Mahalanobis Classifier Distance (MC), Maximum
ikelihood (ML) and Spectral Angle Mapper (SAM). The first threeethods, P, MD and MC are distance-based classifiers, while MLnd SAM are probability and angular-based ones, respectively.In pixel-based analysis, the four multispectral bands (B, G, R, NIR)
ere used for the corresponding multispectral or pan-sharpened
ig. 2. QuickBird imagery: (a) multispectral and (c) pan-sharpened pixel imagery. Segme
ctronics in Agriculture 68 (2009) 207–215
image classification (Fig. 2a and c). In object-based analysis, the16 bands described above were used for multispectral and pan-sharpened classification (Fig. 2b and d). Finally, in pixel + object-based analysis, the four multispectral or pan-sharpened bands wereadded to the 16 segmented bands, and therefore 20 bands were usedfor multispectral or pan-sharpened classifications.
A key concern in remote sensing is to quantify the coincidencebetween the estimated map and the ground-truth map. To avoidany subjective estimation, a numerical confusion matrix analysisis normally used, which determines the accuracy of the methodby comparing the percentage of classified pixels of each class withthe verified ground truth class, subsequently indicating the correctassessment and the errors between the classes studied (Congalton,1991). The confusion matrix provides the Overall Accuracy (OA)of the classification, which indicates the percentage of correctlyclassified pixels; the producer’s accuracy (PA) and omission errorindicate the probability that a classified pixel actually representsthat category in reality; and the user’s accuracy (UA) and com-mission error indicate how well training-set pixels were classified(Rogan et al., 2002). Overall classification accuracy indicates theoverall success of classification; the minimum accepted value hasbeen standardized at 85%. Data not reaching this level will requirere-classification or class aggregation (Foody, 2002). On the otherhand, the Kappa test determines whether the results presented in
classification, indicating a more conservative estimation than sim-ple percent agreement value (Congalton, 1991; Rogan et al., 2002).Landis and Kock (1977) suggested that a Kappa coefficient (Kc) ofover 0.8 strongly indicates that a given classification is unlikely
ntation into separate objects in (b) multispectral and (d) pan-sharpened imagery.

I.L. Castillejo-González et al. / Computers and Electronics in Agriculture 68 (2009) 207–215 211
Table 2Summarize of the best accuracy results of the classifications carried out with the majority filter applied.
Pa MD MC SAM ML
OAb Kc OA Kc OA Kc OA Kc OA Kc
Multispectral imagePixel 46.89 0.39 59.21 0.54 72.31 0.69 61.85 0.56 89.60 0.88Object 69.90 0.66 86.68 0.85 89.99 0.88 89.00 0.87 90.66 0.89Pixel + object 73.52 0.70 89.71 0.88 91.55 0.90 89.55 0.88 91.71 0.90
Pan-sharpened imagePixel 37.70 0.31 51.71 0.45 64.77 0.60 58.52 0.53 82.55 0.80Object 66.11 0.62 77.79 0.74 88.29 0.86 78.12 0.75 93.69 0.93P 88
anobis
tca
Isdtbfr
wat
TP
M
P
M
S
M
M
ixel + object 66.71 0.62 78.75 0.75
a Method of classificacion: P, Parallelepiped; MD, Minimum Distance; MC, Mahalb Accuracy values: OA, overall accuracy (%); Kc, Kappa coefficient.
o have been obtained by chance alone. OA, PA, UA and Kc werealculated for every final thematic map to validate and assess theccuracy of the classification procedures and imagery considered.
Verification procedure did no change in any of the classifications.n pixel-based classifications, a statistical study was made with thepectral response of all the pixels of the image included in the vali-ating sites to assess the accuracy of the classification. Then, takingo account that each object of the segmented image is composedy pixels with a same spectral value depending of the object-basedeature studied, the validating process was based on the spectral
esponse of the objects included in the validating sites.In remote sensing, salt and pepper noise refers to situations inhich isolates and, in many cases, misclassified pixels of one class
re dispersed within the area of another class. In high spatial resolu-ion satellite data, these classification errors can be considerable. To
able 3roducer’s accuracy (%) of the five classifications methods.
ethoda Imagery andMIUb
Individual land uses
River sidetrees
Roads Winter cerealstubble
Vineyard Oliveorch
M + P 81.44 92.28 95.56 71.59 25.6F + P 32.42 84.61 70.37 56.87 28.6M + O 73.22 82.31 86.26 2.70 94.4F + O 46.77 75.64 79.92 62.96 62.11M + PO 75.93 60.87 88.93 14.18 94.2F + PO 43.10 85.37 85.44 66.84 58.7
D M + P 86.03 86.11 73.46 49.64 28.2F + P 78.10 50.85 64.81 48.63 16.9M + O 72.28 71.13 95.53 87.44 92.7F + O 71.56 80.32 83.51 63.46 85.2M + PO 75.61 83.19 95.63 87.02 93.3F + PO 73.51 82.41 83.80 66.70 84.5
AM M + P 89.42 89.70 99.87 66.14 44.4F + P 81.70 55.18 98.77 64.51 40.2M + O 68.81 76.01 96.98 91.89 92.4F + O 73.96 70.47 87.32 79.32 84.6M + PO 77.58 80.81 95.78 88.21 96.8F + PO 75.36 77.61 86.94 78.43 84.3
C M + P 83.49 90.07 100.00 80.33 35.6F + P 77.04 47.81 99.18 68.47 26.19M + O 73.42 74.68 100.00 93.30 93.4F + O 74.40 84.02 99.49 92.50 93.7M + PO 76.70 75.34 100.00 93.34 96.2F + PO 68.69 62.87 97.89 96.05 91.4
L M + P 87.58 93.32 99.29 80.02 84.3F + P 82.66 73.94 97.53 77.09 68.6M + O 97.00 45.31 99.84 83.87 99.6F + O 97.75 84.93 99.75 84.83 98.4M + PO 96.48 78.01 99.77 69.64 98.3F + PO 98.28 84.41 99.75 86.89 99.4
a Method of classificacion: P, Parallelepiped; MD, Minimum Distance; MC, Mahalanobisb Imagery: M, Multispectral image; F, Fused (pan-sharpened) image; MIU, Minimum In
.02 0.86 82.26 0.79 94.51 0.94
Classifier Distance; SAM, Spectral Angel Mapper; ML, Maximum Likelihood.
improve the classified maps and obtain better accuracies, a majorityfilter of 5 × 5 was applied to decrease this noise. ENVI 4.3 (ResearchSystems Inc. 2006) was the software used for image processing.
4. Results
Object and pixel + object-based classification shown in Table 2summarize the best classification results, OA and Kc results forevery classification method and MIU for multispectral and pan-sharpened imagery, obtained from the combination between mean
and remaining textural parameters. Fig. 3 shows a portion of theimage for the less accurate (a, b, c, d, e) and most accurate (a′, b′, c′,d′, e′) land use classifications. Table 2 reveals consistent differences(over 55%) in OA and Kc for the worst (P) and best (ML) classifica-tion methods. Thus, the OA and Kc were 37.70% and 0.31, and 94.5%ardsUrbansoil
Spring-sownsunflower
Burnt cropstubble
Dark baresoil
Light baresoil
8 49.54 28.92 78.43 0.00 0.004 48.72 26.80 40.63 4.58 6.175 30.35 97.91 85.91 14.79 87.55
52.17 73.54 56.36 87.45 61.422 81.16 95.71 85.73 20.21 77.577 52.06 71.04 53.77 84.35 66.47
0 45.20 70.21 90.66 58.41 93.389 37.31 68.95 89.21 83.10 59.616 88.77 84.37 97.10 79.84 69.285 38.35 75.85 62.60 96.28 91.163 87.92 83.01 96.98 99.89 79.874 40.28 77.96 63.49 96.30 92.67
6 25.45 22.93 68.35 71.06 57.795 19.17 24.10 67.05 56.65 70.079 75.65 84.29 98.23 89.15 83.785 52.81 82.78 84.37 65.27 68.075 83.03 84.38 94.83 87.00 79.773 50.15 85.46 80.79 84.31 93.43
8 59.28 82.63 99.69 63.97 94.9752.61 78.96 91.51 86.59 64.91
4 92.30 90.35 98.38 93.22 67.838 84.29 86.70 59.49 93.36 78.590 92.35 90.31 98.49 99.94 69.766 86.37 88.81 64.87 96.31 78.96
8 84.12 89.70 96.77 93.70 93.090 68.72 89.87 92.26 91.73 90.814 61.57 95.38 79.36 90.29 89.920 93.54 88.17 92.97 90.32 90.704 98.21 94.78 86.06 89.82 89.105 94.73 88.32 94.22 90.90 91.24
Classifier Distance; SAM, Spectral Angel Mapper; ML, Maximum Likelihood.formation Unit; P, Pixel; O, Object; PO, Pixel + Object.
212 I.L. Castillejo-González et al. / Computers and Electronics in Agriculture 68 (2009) 207–215
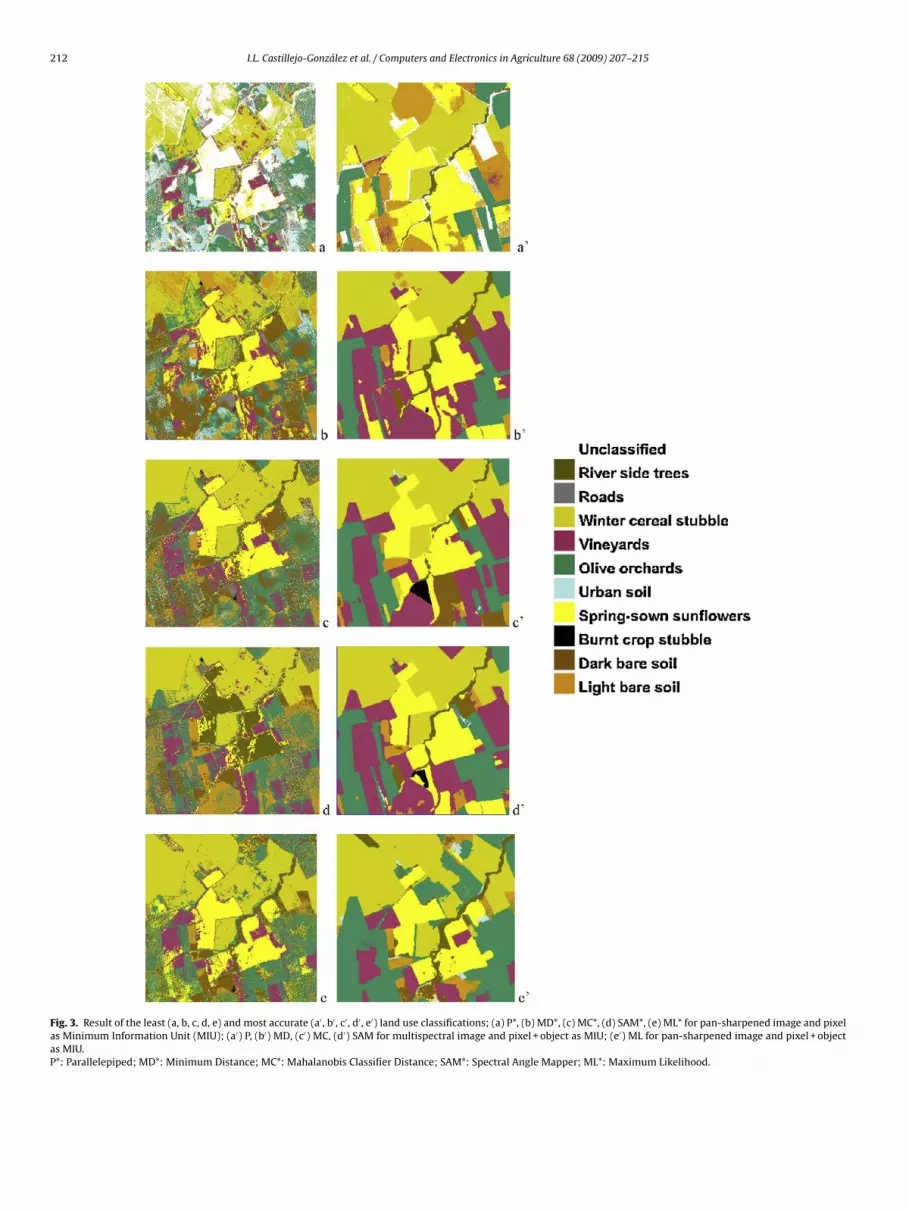
Fig. 3. Result of the least (a, b, c, d, e) and most accurate (a′ , b′ , c′ , d′ , e′) land use classifications; (a) P*, (b) MD*, (c) MC*, (d) SAM*, (e) ML* for pan-sharpened image and pixelas Minimum Information Unit (MIU); (a′) P, (b′) MD, (c′) MC, (d′) SAM for multispectral image and pixel + object as MIU; (e′) ML for pan-sharpened image and pixel + objectas MIU.P*: Parallelepiped; MD*: Minimum Distance; MC*: Mahalanobis Classifier Distance; SAM*: Spectral Angle Mapper; ML*: Maximum Likelihood.

I.L. Castillejo-González et al. / Computers and Electronics in Agriculture 68 (2009) 207–215 213
Table 4User’s accuracy (%) of the five classifications methods.
Methoda Imagery and MIUb Individual land uses
River sidetrees
Roads Wintercerealstubble
Vineyard Oliveorchards
Urbansoil
Spring-sownsunflower
Burnt cropstubble
Dark baresoil
Light baresoil
P M + P 85.99 50.72 46.03 52.31 38.20 19.55 90.66 100.00 0.00 0.00F + P 94.43 18.74 75.53 65.45 47.83 32.93 58.10 98.90 84.14 44.63M + O 75.28 31.68 100.00 100.00 94.34 66.39 39.59 100.00 100.00 73.89F + O 100.00 18.89 81.45 75.91 87.02 29.67 89.93 100.00 96.34 96.71M + PO 99.65 88.05 99.71 83.21 94.95 78.46 41.31 100.00 96.89 63.25F + PO 100.00 21.75 85.59 67.36 82.88 33.28 84.40 100.00 98.27 95.71
MD M + P 67.56 68.41 61.23 67.72 55.31 43.85 60.05 100.00 39.99 62.16F + P 46.51 35.26 61.01 63.21 43.33 43.84 58.99 89.36 47.95 37.01M + O 86.06 99.42 97.97 81.42 94.12 90.10 65.73 100.00 66.38 88.79F + O 100.00 32.01 84.71 63.81 78.68 77.51 73.03 97.56 81.29 88.07M + PO 96.32 85.14 97.39 84.96 93.60 88.99 83.58 100.00 78.56 88.06F + PO 100.00 33.67 87.47 65.35 79.22 72.19 73.63 97.43 84.75 88.05
SAM M + P 52.90 31.59 80.09 67.26 78.56 28.31 47.40 97.83 45.33 58.46F + P 49.80 23.65 79.95 53.47 75.64 25.55 36.87 78.57 51.75 51.87M + O 93.43 55.70 98.24 77.26 94.05 93.64 87.17 97.87 78.74 91.32F + O 100.00 49.62 78.64 75.96 85.88 54.05 86.41 94.83 55.26 77.13M + PO 100.00 62.77 98.71 84.20 94.04 95.60 86.13 100.00 68.13 86.16F + PO 100.00 47.66 82.18 77.12 83.98 54.37 86.65 97.32 93.30 87.03
MC M + P 85.87 77.69 76.67 91.30 80.18 42.30 80.89 100.00 51.55 67.69F + P 62.38 39.92 76.54 65.57 68.69 40.99 69.12 89.90 60.14 53.53M + O 99.53 65.52 98.04 89.93 97.33 95.48 83.70 99.11 66.61 81.59F + O 99.87 35.53 97.00 83.90 97.69 81.64 85.21 100.00 69.89 95.96M + PO 99.55 93.24 98.11 89.71 97.47 95.50 83.97 99.19 70.21 86.75F + PO 99.34 32.60 97.81 84.30 98.13 75.51 85.75 99.55 72.01 91.14
ML M + P 99.05 86.01 94.57 82.85 94.25 77.07 76.71 100.00 91.82 87.07F + P 81.80 57.87 92.16 70.74 89.72 71.22 74.33 95.48 80.43 84.47M + O 80.58 100.00 99.78 97.49 92.35 96.90 86.88 100.00 77.81 80.08F + O 90.81 82.49 100.00 87.57 96.96 95.04 86.43 99.94 82.86 95.58
89
anobisum In
ashfiMp
ocsf0yMp9
cartmtd
tceta
M + PO 99.86 87.59 99.03 92.42F + PO 97.66 83.44 99.67 90.12
a Method of classificacion: P, Parallelepiped; MD, Minimum Distance; MC, Mahalb Imagery: M, Multispectral image; F, Fused (pan-sharpened) image; MIU, Minim
nd 0.94, respectively, for P pixel and ML pixel + object-based clas-ification using pan-sharpened QuickBird data (Fig. 3a and e′). Theighest performance values of OA and Kc for most of the classi-ers occurred in multispectral image (Figs. 3a′, b′, c′, d′), except forL classification (Fig. 3e′), which achieved the maximum OA with
an-sharpened imagery.The object analyses yielded better results than the pixel-based
nes. With objects as MIU in the classification, four of the fivelassification algorithms achieved OA of over 85% among multi-pectral image. Thus, OA was 86.68%, 89.00%, 89.99% and 90.66%or MD, SAM, MC and ML, respectively, with Kc values of over.85. However, the pan-sharpened object-based classificationsielded poorer results than the multispectral classifications for P,D MC and SAM. ML classifications showed higher accuracy for
an-sharpened image than for multispectral image, with an OA of3.69% and 90.66%, and a Kc of 0.93 and 0.89, respectively.
The mixture of pixel + object bands as MIU of multispectrallassification showed very high OA values among MD, SAM, MCnd ML classifiers with OA of 89.71%, 89.52%, 91.55% and 91.71%,espectively. In these classifications, the Kc values were over 0.88. Inhe pan-sharpened data, the classification results were lower than
ultispectral ones, except for the ML classifiers, which showedhe highest OA (94.51%) and Kc (0.94) values of all classificationseveloped (Fig. 3e′).
Table 3 summarizes the PA for every individual land use for
he different MIU and classification methods considered. PA variedonsiderably according to the class classified. A generalxamination of the individual land cover classification showshat mixed covers (e.g., olive orchard, vineyard, urban soil or darknd light bare soils) presented high intraclass spectral variability9.67 87.09 76.05 100.00 90.29 96.956.91 96.09 85.27 100.00 85.60 96.00
Classifier Distance; SAM, Spectral Angel Mapper; ML, Maximum Likelihood.formation Unit; P, Pixel; O, Object; PO, Pixel + Object.
and lower PA (especially for pixel-based pan-sharpened imageclassifications), as compared to homogeneous ones (demonstratinghigher PA in any of the MIU and classifications considered). Oneof the greatest differences in PA can be observed in the oliveorchard category. The olive orchard category showed high PAvalues, greater than 92%, in all the object-based and pixel + object-based multispectral classifications. However, very high PA (up to99.45%) was also obtained for MC and ML classifiers, consideringpan-sharpened image. In contrast, riverside trees and roads, whichusually exhibit lower intraclass spectral variability, showed ahigher PA for all the multispectral pixel-based classifications,except for ML for riverside trees, where a higher PA was found forobject-based classifications. Discrimination of burnt crop stubbleland use was very successful when applying the MC method forany MIU considered in the multispectral image with PA of 99.69%,98.38% and 98.49%, respectively. Similarly, winter cereal stubblediscrimination was very accurate with PA of over 99.29% or evenof 100% in the multispectral image and for any MIU considered,when applying ML or MC classifications. When comparing theperformance of object-based and pixel + object-based analyses,there was no clear trend. For example, in ML classification, themultispectral object-based classification showed a better PAin the vineyard category than multispectral pixel-object-basedclassification (83.87% and 69.64%, respectively). By contrast, in thelight bare soil category the PA was around 89% for both MIU, and
in the roads category the PA was higher in pixel + object-basedclassification than in the object-based classification (78.01% and45.31%, respectively).Table 4 shows the UA for every individual land use for the dif-ferent MIU and classification methods considered. As stated before
2 nd Ele
fccwg1c
dwawbrsm
5
taoboror
wcMoatfiach1fnsstotfiw1tatmimtmtwPfcd
14 I.L. Castillejo-González et al. / Computers a
or PA, two of the most successful classified land uses were burntrop stubble and winter cereal stubble areas. For instance, for burntrop stubble, UA was higher than 95% in most of the classifications,ith 100% success in many of them. Winter cereal stubble cate-
ory also presented high accuracy, showing UA values from 97% to00% in all the object-based and pixel + object-based multispectrallassifications.
The differences between multispectral and pan-sharpened datao not follow a clear pattern. Generally, greater PA and UAere achieved in multispectral data than in pan-sharpened data,
lthough there were notable exceptions to this. For example, UAas 93.24% and 32.6% for the roads category in MC pixel + object-
ased classifications for multispectral and pan-sharpened imagery,espectively. However, classification of spring-sown sunflowerhowed UA of 39.59% and 89.93% for P object-based analysis, inultispectral and pan-sharpened data, respectively.
. Discussion
An overall overview of the five classification methods appliedo pan-sharpened and multispectral imagery for classifying cropsnd their agro-environmental measures resulted in both, thatbject- and pixel + object analyses clearly outperformed pixel-ased analysis yielding overall accuracies higher than 85% in mostf the classifications, being Maximum Likelihood the most accu-ate classifier, and that the accuracy for pan-sharpened image andbject-based analysis indicated a 4% improvement in performanceelative to multispectral data.
The first result to note is that the best and poorest classifiersere ML and P in both multispectral and pan-sharpened imagery,
onsidering all the land uses. More specifically, P and pixel-, andL and pixel + object-based analyses in pan-sharpened image were
bserved to be the worst and best choices, respectively. MD, MCnd SAM in multispectral image also performed well; all satisfiedhe commonly accepted requirements of at least 85% overall classi-cation accuracy (Foody, 2002), and a range of 0.75 (Montserudnd Leamans, 1992) to 0.80 (Landis and Kock, 1977) for Kappaoefficient. When considering individual land uses, accuracy wasigher since very low omission errors or a maximum PA (even00%) occurred for winter cereal stubble and burnt crop stubbleor MC and ML for any MIU and multispectral imagery. A greatumber of class classifications were efficient whatever the clas-ifier, some of them exhibiting a PA of over 70%. These resultsupport the findings of Thomlinson et al. (1999), who reportedhat the criterion for successful land cover categorization was notnly 85% minimum overall, but also inclusion of no class with lesshan 70% accuracy. According to Yu et al. (2006), an overall classi-cation accuracy surpassing 60% could be considered satisfactoryhen mapping complex vegetation classification with more than
3 alliances constructed by 52 vegetation land uses. Thus, althoughhere is no standard estimation of accuracy, there is a reason-ble consensus that a greater accuracy is necessary, especially ifhematic map results can help environmental policy and decision-
aking to address sustainable agricultural practices. Similarly, anmportant achievement of this research was the success of PA in
ost of the classes studied. This was especially noticeable for win-er cereal stubble and burnt crop stubble, which are two of the
ain agro-environmental measures for reducing erosion in E.U.;hese were the most accurately classified land uses. This, together
ith the discrimination of cover crops in olive orchards reported byena-Barragán et al. (2004), permits the undertaking of the threeundamental agro-environmental measures approved for winterereals and olive groves, two of the main crops in Mediterraneanryland conditions.
ctronics in Agriculture 68 (2009) 207–215
For olive orchards, which was one of the land uses with thehighest intraclass variability, consistent increases in PA and UA, i.e.,decreases in omission and commission errors, were obtained whencomparing pixel- and object-based analyses. This is in agreementwith the basic rationale for using image segmentation for object-based analysis in order to overcome the problems of reduction instatistical separability between classes, caused by the increase inintraclass spectral variability in traditional pixel-based classifica-tion approaches (Yu et al., 2006). Conversely, for burnt crop stubbleand winter cereal stubble, the increases in the PA for object- ascompared to pixel-based analyses were not as dramatic as for mul-tispectral or pan-sharpened imagery, probably because those landuses can be considered as being more homogeneous covers withless intraclass spectral variability.
With regard to recommending the use of multispectral orpan-sharpened imagery, two considerations should be made: theimprovement in accuracy obtained in pan-sharpened imagery andthe computational or expertise requirements involved in the fusionprocess. Considering land use classification, and ML as the bestclassifier (Table 2), the Kc for pan-sharpened image and object-based analysis indicated a 4% improvement (Kc from 0.9 to 0.94)in performance relative to multispectral data. Interestingly, thesame improvement was achieved for pixel + object-based analysis(Kc from 0.9 to 0.94 for multispectral and pan-sharpened imagery,respectively). For individual uses and in most cases (Tables 3 and 4),the accuracy of classifications based on pan-sharpened data waslower than those based on multispectral data. This indicates thatimprovements in accuracy due to the use of pan-sharpened imageryfor general classification cannot really be considered as remarkable.Over the years, many authors have applied fusion techniques toincrease the reliability of classifications. For example, studies onhigh spatial resolution have shown an overall classification accu-racy improvement of only 1.5% when evaluating the fusion ofpanchromatic and multispectral QuickBird imagery, with the addi-tion of texture information; and an improvement of 7% with 11-bitimagery, but no improvement with 8-bit data when evaluatingthe fusion of panchromatic and multispectral IKONOS imagery,respectively, for forest and urban land cover classifications (Davisand Wang, 2002; Kosaka et al., 2005). As can be seen, in pan-sharpening studies the improvement range is not as wide as thatin other fusion studies; probably due to these circumstances, ourclassification improvements were less striking. Nevertheless, thedecision of whether or not to carry out data fusion will dependon the importance of achieving maximum accuracy and the ratio ofcost/efficiency that we wish to obtain in our objectives. If one aimedto create a crop inventory, then the multispectral data would be thebest choice, offering a detailed vegetation classification by usingany of the studied classifiers for object and pixel + object as a MIU(except the P method). However, if we desire to produce a map thatis ready to be used by administrations for decision-making pro-cedures, pan-sharpened imagery would be highly recommended(using ML and pixel + object-based classification). Our maps can beused as an accurate tool to influence agro-environmental measures,crop inventories and crop surface legislation drafted by Europeanand local administrations. In our Mediterranean conditions, the riskof fire is tremendously high during the dry season (summer) andfarmers are requested not to burn the stubble. However, there aremany fires every year because farmers do not adhere to this impor-tant agro-environmental measure and then pay high penalties forit.
Our results indicate that the timing of the imaging for agro-
environmental measure classification was optimum since in animage recorded before, for example, May or June, winter cerealstubble and burnt crop stubble would have been classified as a win-ter cereal crop, and young vineyards as bare soils. Pena-Barragánet al. (2004) studied different dates and also concluded that early
nd Ele
Jo
tva
A
CC
R
A
B
B
C
C
C
D
D
DF
F
G
G
I.L. Castillejo-González et al. / Computers a
uly was the best time for discriminating cover crops in oliverchards.
In any case, the accuracies obtained noticeably reveal thathe choice of different classifiers, imagery and MIU entail highariations for the performance of crops and classification of theirgro-environmental measures.
cknowledgements
This research was partially financed by the Inter-Ministerialommission of Science and Technology throughout the projectICYT-AGL2008-04670-CO3-03.
eferences
ndalusian Administration Regulation, 2007. Orden de 5 de Junio de 2007. Desarrollode los requisitos de aplicación de la condicionalidad en relación con las ayudasdirectas en el marco de la Política Agraria Común. Andalusian Official Bulletin(BOJA) 119, pp. 7–37.
aatz, M., Schäpe, A., 2000. Multiresolution segmentation: an optimization approachfor high quality multi-scale image segmentation. In: Proceedings of the12th Symposium for Applied Geographic Information Processing (AngewandteGeographische Informationsverarbeitung XII. AGIT 2000), Salzburg, Austria, pp.12–23.
ricklemyer, R.S., Lawrence, R.L., Miller, P.R., Battogtokn, N., 2006. Predicting tillagepractices and agricultural soil disturbance in north central Montana with Landsatimagery. Agric. Ecosyst. Environ. 114, 210–216.
hoi, M., Kim, R.Y., Nam, M.-R., Kim, H.O., 2005. Fusion of multispectral and panchro-matic satellite images using the curvelet transform. IEEE Geosci. Remote Sens.2, 136–140.
hubey, M.S., Franklin, S.E., Wulder, M.A., 2006. Object-based analysis of Ikonos-2imagery for extraction of forest inventory parameters. Photogramm. Eng. RemoteSens. 72, 383–394.
ongalton, R.G., 1991. A review of assessing the accuracy of classification of remotelysensed data. Remote Sens. Environ. 37, 35–46.
avis, C.H., Wang, X., 2002. Urban land cover classification from high resolutionmulti-spectral IKONOS imagery. In: Proceedings of 2002 IEEE InternationalGeoscience and Remote Sensing Symposium, Seoul, Korea, 25–29 July, pp.2980–2983.
efiniens, 2007a. Definiens Professional 5.0 Essential Training. Definiens AG,München.
efiniens, 2007b. Definiens Developer 7-Reference Book, Definiens AG, München.oody, G.M., 2002. Status of land cover classification accuracy assessment. Remote
Sens. Environ. 80, 185–201.unck, J.W., Zhong, Y., Butler, D.A., Brunner, C.C., Forrer, J.B., 2003. Image segmenta-
tion algorithms applied to wood defect detection. Comput. Electron. Agric. 41,
157–179.ómez, J.A., Battany, M., Renschler, C.S., Fereres, E., 2003. Evaluating the impact soilmanagement on soil loss in olive orchards. Soil Use Manage. 19, 127–134.
onzález-Audicana, M., Saleta, J.L., García-Catalán, R., García, R., 2004. Fusion of mul-tispectral and panchromatic images using improved IHS and PCA mergers basedon wavelet decomposition. IEEE Trans. Geosci. Remote 42, 1291–1299.
ctronics in Agriculture 68 (2009) 207–215 215
Harvey, K.R., Hill, G.J.E., 2001. Vegetation mapping of a tropical freshwater swamp inthe Northern Territory, Australia: a comparison of aerial photography, LandsatTM and SPOT satellite imagery. Int. J. Remote Sens. 22, 2911–2925.
Hay, G.J., Blaschke, T., Marceau, D.J., Bouchard, A., 2003. A comparison of three image-object methods for the multiscale analysis of landscape structure. Photogramm.Eng. Remote Sens. 57, 327–345.
Hill, J., Megier, J., Mehl, W., 1995. Land degradation, soil erosion, and desertificationmonitoring in Mediterranean ecosystems. Int. J. Remote Sens. 12, 107–130.
Kettig, R.L., Landgrebe, D.A., 1976. Classification of multispectral image data byextraction and classification of homogeneous objects. IEEE Trans. Geosci. Remote14, 19–26.
Kosaka, N., Akiyama, T., Tsai, B., Kojima, T., 2005. Forest type classification using datafusion of multispectral and panchromatic high-resolution satellite imageries. In:Proceedings of 2005 IEEE International Geoscience and Remote Sensing Sympo-sium, Toronto, Canada, pp. 1204–1206.
Landis, J.R., Kock, G.G., 1977. The measurement of observer agreement for categoricaldata. Biometrics 33, 159–174.
Lobo, A., 1997. Image Segmentation and Discriminate Analysis for the identificationof land cover units in ecology. IEEE Trans. Geosci. Remote 35 (5), 1136–1145.
Mallinis, G., Koutsias, N., Tsakiri-Strati, M., Karteris, M., 2008. Object-based classifi-cation using QuickBird imagery for delineating forest vegetation polygons in aMediterranean test site. ISPRS J. Photogramm. 63, 237–250.
Mickelson, S.K., Baker, J.L., Ahmed, S.I., 2003. Vegetative filter strips for reducingatrazine and sediment runoff transport. J. Soil Water Conserv. 58, 359–367.
Montserud, R.A., Leamans, R., 1992. Comparing global vegetation maps with thekappa statistic. Ecol. Model. 62, 275–293.
Núnez, J., Otazu, X., Fors, O., Prades, A., Palà, V., Arbiol, R., 1999. Multiresolution-based image fusion with additive wavelet decomposition. IEEE Trans. Geosci.Remote 37, 1204–1211.
Otazu, X., González-Audicana, M., Fors, O., Núnez, J., 2005. Introduction of sen-sor spectral response into image fusion methods. Application to Wavelet-basedmethods. IEEE Trans. Geosci. Remote 43, 2376–2385.
Pena-Barragán, J.M., Jurado-Expósito, M., López-Granados, F., Atenciano, S., Sánchezde la Orden, M., García-Ferrer, A., García-Torres, L., 2004. Assessment of soil usesin olive groves from aerial photographs. Agric. Ecosyst. Environ. 103, 117–122.
Rogan, J., Franklin, J., Roberts, D.A., 2002. A comparison of methods for monitoringmultitemporal vegetation change using Thematic Mapper imagery. Remote Sens.Environ. 80, 143–156.
South, S., Qi, J., Lusch, D.P., 2004. Optimal classification methods for mapping agri-cultural tillage practices. Remote Sens. Environ. 91, 90–97.
Thomlinson, J.R., Bolstad, P.V., Cohen, W.B., 1999. Coordinating methodologies forscaling landcover classifications from site-specific to global: step toward vali-dating global map products. Remote Sens. Environ. 70, 16–28.
Van Niel, T.G., McVicar, T.R., 2004. Determining temporal Windows for crop discrim-ination with remote sensing: a case study in south-eastern Australia. Comput.Electron. Agric. 45, 91–108.
Vijayaraj, V., Younan, N.H., O’Hara, C.G., 2006. Concepts of image fusion in remotesensing applications. In: Proceedings of 2006 IEEE International Geoscience andRemote Sensing Symposium, Denver, Colorado, pp. 3798–3801.
Wald, L., 2002. Data Fusion. Definition and Architectures- Fusion of Images of Dif-ferent Spatial Resolutions. Presses de l’Ecole, Ecole des Mines de Paris, Paris.
Yang, C., Everitt, J.H., Bradford, J.M., 2006. Comparison of QuickBird satellite imageryand airborne imagery for mapping grain sorghum yield patterns. Precis. Agric.7, 33–44.
Yu, Q., Gong, P., Clinton, N., Biging, G., Kelly, M., Schirokauer, D., 2006. Object-baseddetailed vegetation classification with airborne high spatial resolution remotesensing imagery. Photogramm. Eng. Remote Sens. 72, 799–811.