Embed Size (px)
Citation preview

Objective measure of woven fabric’s cover factor by image processing
Abstract
Digital image processing techniques are applied to perform an automatic method for the
objective measure of woven fabric’s cover factor. Based on a frequency domain analysis, digital
images of woven fabric samples, obtained with a camera assembled to a microscope, are cropped
to enclose the maximum integer number of warp and weft periods and leveled for non-uniform
illumination. Posterior thresholding, designed to perform suitably for both high and low cover
factor fabric samples, gives rise to the objective value. The method has been applied to three
different sets of samples manufactured in plain weave, with known yarn numbers and thread
counts. Cover factors obtained by this method show good correlation with those obtained by a
set of visual observers and are consistent with woven fabric parameters: yarn numbers (tex) and
thread counts (yarns/cm). The procedure can be useful to monitor mean cover factor as well as
cover factor variability in fabric batches. It does not require sophisticated equipment and can be
straightforwardly implemented in a textile analysis laboratory.
Keywords – Image analysis, cover factor, woven fabrics
Introduction
Cover factor, CF, or overall cover factor is defined as the ratio of the area covered by yarns to
the total area of the web [1].
webtheofareatotal
yarnsbycoveredareaCF = (1)
CF is a basic construction parameter of woven cloth related to its end use performance [2,3].
Weaving efficiency, fabric quality [4,5], thermo-physiological comfort of garments, air
permeability [6] as well as protection against Ultra Violet Radiation [7] are features strongly
related to CF. It is a fundamental feature of multiple base fabrics used in the elaboration of

protective garments and textiles designed to protect the working environment or the natural
environment against the exposition to hazardous elements. They are found in common safety
systems in cars like airbags, for instance. CF is a critical parameter in protective clothing
required in environments exposed to this kind of risks, ranging from pharmaceutical research
laboratories to greenhouses affected by the risk of pesticides used in intensive agriculture. It is
also a key factor in geotextiles to protect the environment from erosion or dangerous wastes or in
garments for cleanrooms or surgery. The list would be endless and CF of base fabric plays a
main role in the aforementioned examples. In addition to other textile parameters, achievement
of an effective protection is not only attributable to the mean CF value, but also to the uniformity
of the CF along the base fabric.
Mean CF values of woven fabrics can be estimated from yarn numbers and thread counts by
means of several well-known theoretical formulae [8,9,10,11]. Nevertheless, objective fabric
inspection procedures should be established to monitor CF mean value and its variability. Digital
image processing techniques enable a more accurate and objective evaluation of CF from small
fabric areas than those resulting from theoretical formulae. Further statistical analysis of the CF
values obtained by suitably sampling across the fabric should provide estimates of the mean CF
value, as well as its variability.
Evaluation of CF from digital images of fabric samples has been considered in some previous
works [12-15]. The procedure applied in [12] is briefly described in two steps: once the area
corresponding to a single weave repeat was manually determined on a microscope image of a
fabric sample, CF of the fabric was obtained as the ratio of the area covered by the yarns to the
total area of the weave repeat. Areas were evaluated with the help of a precision grid.
In [13-15] CF was straightforwardly derived by tallying the pixels in binarized images produced
by thresholding.

In [13] a fabric sample was illuminated by transmission and the threshold value defined as the
average intensity of the background image without the fabric sample. So, it was related to the
experimental settings. In [14] and [15] the fabric sample was illuminated by reflection and
transmission. In [14] the threshold value was defined as the maximum intensity of the pixels
corresponding to the lightest fiber, thus requiring some operator involvement. In [15] it was
derived as a value separating two modes in the bimodal histogram of a digital fabric sample
image, so it was only suitable for fabrics with low cover factor, displaying bimodal intensity
histograms.
Besides accuracy and objectivity, automation is an important requirement for quality control
procedures and the foregoing methods are difficult to implement in a fully automatic algorithm.
The goal of this work is to develop an accurate, objective and automatic evaluation method of a
fabric sample CF based on a single digital image of the weave. The method would handle a wide
range of CF values, including those close to 1.
The proposed procedure for the automatic evaluation of the cover factor from microscope images
of fabric samples illuminated by transmission consists of two steps. First we perform an analysis
of structural features of a fabric sample from the power spectrum of its digital image. Our
purpose is to determine the biggest region within the original image containing an integer
number of complete periods, or thread interlacings. CF values obtained from images containing a
fractional number of thread interlacings would yield inaccurate or biased results. So, we crop the
initial image to fit that region.
In a second step, once a digital image of a fabric sample has been cropped to contain an integer
number of periods, fabric sample CF is obtained from a classification of pixels into two classes:
one corresponding to the threads – low intensity or dark pixels – and the other corresponding to
the areas not covered by threads (holes) – high intensity or bright pixels –. Gray pixels, located
close to thread edges, may be difficult to classify. Misclassification effects may produce

relatively large departures from exact CF for fabrics with high cover factor values. A correct
classification of pixels by intensities requires a suitable thresholding procedure. Standard
automatic thresholding methods [16] are not suited to unimodal histograms yielded by high CF
fabrics. We propose a thresholding procedure based on a slight modification of Otsu’s
thresholding method, applicable to fabrics whose respective intensity histograms are bimodal or
unimodal shaped.
We apply this method to digital images of plain fabric samples with both low and high CF. Our
interest focuses on high CF fabrics. To test the performance of the method we have considered a
set of 81 fabric samples with known yarn numbers, thread counts and types of fiber. Their CF
values have been also evaluated according to an interactive thresholding procedure carried out by
a group of observers and yielding CF values approximately ranging from 0.90 to 1.00,
Validation arises from linear regressions comparing the mean CF fitted by inspectors to the CF
yielded by the proposed method for each type of fiber. The results also show a strong
relationship with the known fabric features as proved by an analysis of variance.
Delimiting a Suitable Region by Fourier Analysis
For the sake of simplicity we present the method to determine the biggest region containing an
integer number of complete periods based on woven fabric models.
Since a woven fabric consists of regular repeating units, the Fourier Transform (FT) is
particularly useful for analyzing periodicities and orientations in the fabric.
FT of an image ),( yxf , in the spatial domain, is a two dimensional complex function ),( vuF , in
the frequency domain [17]. Its Power Spectrum (PS), 2),( vuF , is a real function accounting
for the distribution of the energy of the initial image over the spatial frequencies. It is worth
noting that all PS in this work are displayed in logarithmic reversed scale (darkest pixels
corresponding to highest intensities).
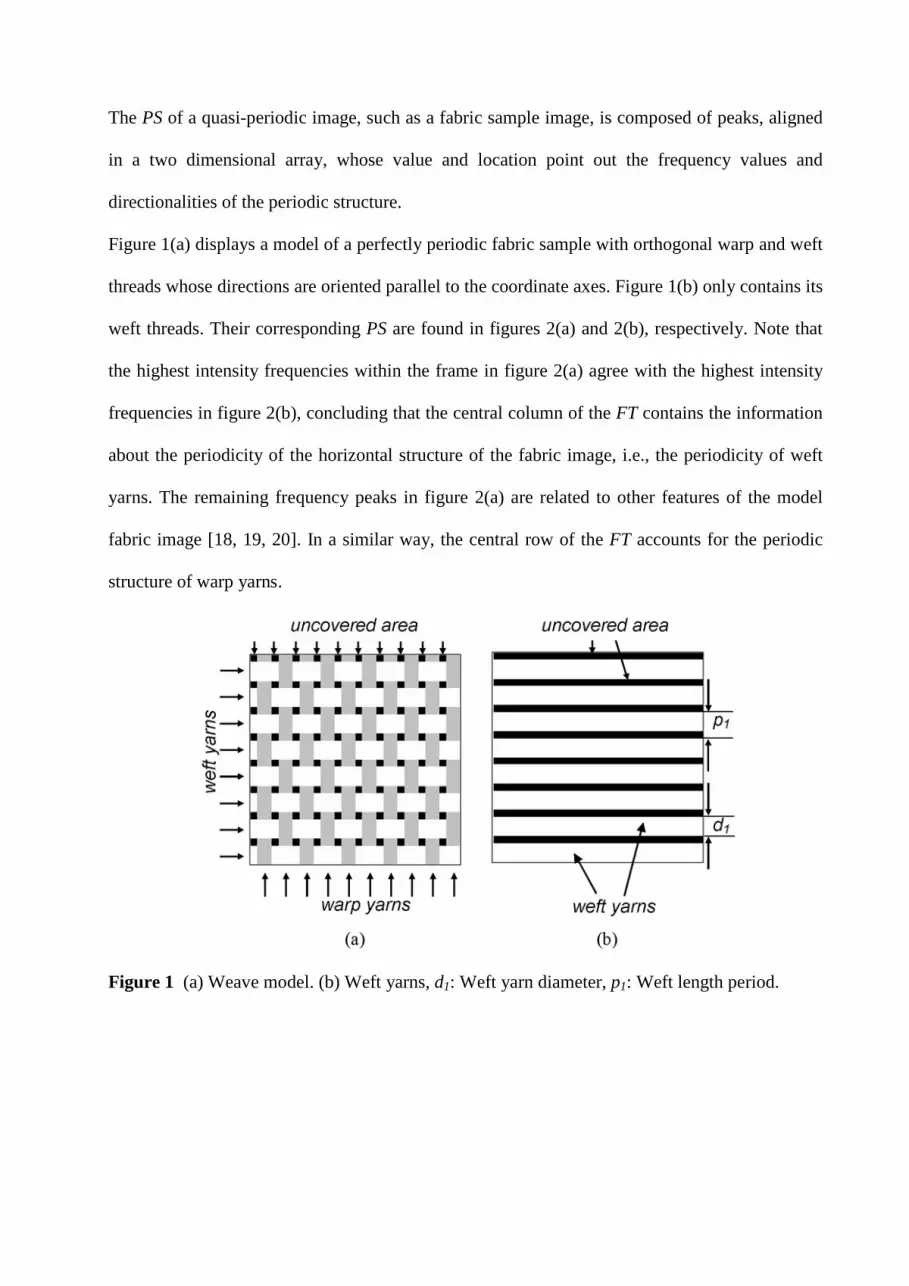
The PS of a quasi-periodic image, such as a fabric sample image, is composed of peaks, aligned
in a two dimensional array, whose value and location point out the frequency values and
directionalities of the periodic structure.
Figure 1(a) displays a model of a perfectly periodic fabric sample with orthogonal warp and weft
threads whose directions are oriented parallel to the coordinate axes. Figure 1(b) only contains its
weft threads. Their corresponding PS are found in figures 2(a) and 2(b), respectively. Note that
the highest intensity frequencies within the frame in figure 2(a) agree with the highest intensity
frequencies in figure 2(b), concluding that the central column of the FT contains the information
about the periodicity of the horizontal structure of the fabric image, i.e., the periodicity of weft
yarns. The remaining frequency peaks in figure 2(a) are related to other features of the model
fabric image [18, 19, 20]. In a similar way, the central row of the FT accounts for the periodic
structure of warp yarns.
Figure 1 (a) Weave model. (b) Weft yarns, d1: Weft yarn diameter, p1: Weft length period.

Figure 2 PS of figures 1(a) and 1(b) displaying the frequency match of the central column.
Figure 3 (a) PS of figure 1(a). (b) Enlarged image of figure 1(a): distances f1 and f2 correspond
to weft and warp frequencies respectively.
Figure 1(a) contains an integer number of periods, consequently its PS is a weighted array of
Dirac deltas as shown in figure 3(a). Figure 3(b) displays an enlargement of figure 3(a). The
distance f1, in pixels, from the central peak of the PS, or dc term, to the first peak in the vertical
direction, coincides with the number of periods (weft threads) contained in the original image in
the vertical direction [18,19,20]. Note that the PS is symmetrical with respect to the dc term.

Count of warp threads f2 follows analogously (Figure 3(b)). Their corresponding period lengths
are
pi = i
i
fN , (2)
where Ni is the number of pixels of the sample image in either direction (i = 1, 2). The size of the
whole image can be expressed as: 22112
22
1
1121 pfpf
fNf
fNfNN ⋅×⋅=⋅×⋅=× .
When the number of periods in the sample image is not an integer, the energy of the PS is not
concentrated on a perfect array of pixels, but slightly spread around them. In that case fi is
obtained as the fractional distance between the dc term and the center of mass corresponding to
the intensities of the pixels around the first frequency peak on the PS in a direction orthogonal to
the threads. The number of complete periods contained in the image in each direction are [ fi ]
(i = 1, 2), where [.] stands for the integer part. Recalling that period lengths are pi (i = 1, 2), the
dimensions of the biggest region within the fabric sample image enclosing an integer number of
periods in any direction are [ ] [ ] 221121 pfpfNN ⋅×⋅=′×′ . Thus, the initial image is cropped to fit the
dimensions of this window or its closest integer dimensions.
Thresholding Operation
The segmentation algorithm requires some previous image pre-processing. Brightness of
microscope images usually decays from the center to its borders. Image brightness and contrast
are leveled by removing low-frequency terms in the Fourier space [21]. To this end, a ring
shaped mask around the dc term is applied to the FT of the original image and then back-
transformed.
Computer screens enhance image contrast by a non-linear relationship between monitor’s gray
level and equivalent luminance [22, 23]. To match that behavior, a quadratic lookup table,
assigning to each pixel its squared intensity, is applied to the previously leveled image. The
resulting image is subsequently normalized to a 0-255 range for gray levels.

Fabric samples were illuminated by transmission to minimize the effect of color and to increase
contrast between threads and background. With this illumination, darker pixels correspond to
threads and brighter pixels to uncovered areas. Standard automatic thresholding methods [16]
failed to properly classify pixel intensities for some high CF fabric samples. Based on the
correspondence between pixels with highest intensity and the uncovered areas of the sample, we
propose a slight modification of Otsu’s method to threshold histograms coming from pre-
processed fabric sample images. For every intensity L between the minimum intensity and the
maximum intensity of the sample image, we define the sum of squared residuals (SSQ)
corresponding to L by:
∑∑>≤
−+−=Li
pLi
ppp
MiLmiLSSQ 22 )())(()( (3)
Where ip stands for the pixel’s intensity, m(L) is the average of all intensities lower than or equal
to L in the sample image and M is the maximum intensity of the sample image. Note that M
substitutes the mean intensity of the pixels brighter than L in Otsu’s method. The first sum of
equation 3 extends over all pixels with intensities lower than or equal to L and it accounts for the
sum of the squared residuals corresponding to the area covered by the yarns. The second sum
extends over all pixels with intensities higher than L. It accounts for the squared residuals
corresponding to the uncovered areas. The intensity Lo that minimizes SSQ is the threshold
value.
CF of the fabric sample is straightforwardly derived from the thresholded image as the ratio of
pixels classified as corresponding to yarns over the total number of pixels.
Application to real samples
Fabric images were obtained with the experimental device illustrated in figure 4. All samples
were unbiased or presented a small bias (<5°) and contained a number of warp threads and weft
treads greater than 7. They were illuminated by transmission and a CCD camera (Olympus
Camedia C-3030 Zoom), assembled to a microscope Olympus CX 40, yielded 24 bit color

images, in TIFF format, 1536x2048 pixels in size (2.6 x 3.4 mm linear field size) with a 2x
magnification. These images were converted to a 256 gray level scale and their resolution
reduced 4 times (384x512 pixels) to shorten the processing time. A ring shaped mask around the
dc term, with inner radius 1 and outer radius 3, is applied to the FT to level image brightness
and contrast.
Figure 4 Experimental set up of imaging device.
The method is stepwise applied to actual digital images of two fabric samples. The sample
displayed in figure 5(a) is a tightly woven fabric with high CF. Figure 6(a) displays a low CF
sample. Figures 5(b) and 6(b) show their corresponding PS.
The four highest peaks around the dc term in 5(b) and 6(b) are the fundamental frequencies.
Next, a detailed evaluation of f1 and f2 is performed for the first sample. Setting the coordinates
of the dc term to (0,0) in figure 5(b), the position of the peak at its right side is (10,0) and the
position of the peak above it is (1,10). We consider squares with center at each peak and sides of
length 7, to separate each peak from its neighbors, and then find the centers of mass

corresponding to each square. They are found to be (0.80, 9.71) and (10.37, 0.03). Distances of
these centers to the dc term are f1 = 9.71 and f2 = 10.37. Recall that these values coincide with
the number of threads, or complete periods, in the warp and weft directions.
According to equation 2, the period lengths are p1 = 39.45 pixels and p2 = 49.29 pixels. In order
to obtain an integer number of periods, the image f(x, y) is cropped to N’1 = 355 rows and N’2 =
493 columns, the rectangle plotted in figure 5(a). Similar arguments led to the rectangle plotted
in figure 6(a).
(a)
(b)
(c)
(d)

(e)
Figure 5 (a) High CF fabric with a rectangle containing an integer number of periods. (b) PS of
5(a) and squared areas enclosing warp and weft frequency peaks to evaluate the centers of mass.
(c) Intensity histogram of the image delimited by the rectangle in 5(a) displaying threshold
values yielded by different thresholding methods. 1: MSSQ, 2: GM, 3: K-I, 4: Otsu, 5: K-means
and 6: Visual. (d) Binarization of the cropped image by MSSQ method. (e) Binarization of the
cropped image by Otsu’s method.
(a)
(b)

(c)
(d)
(e)
Figure 6 (a) Low CF fabric with a rectangle containing an integer number of periods. (b) PS of
6(a) and squared areas enclosing warp and weft frequency peaks to evaluate the centers of mass.
(c) Intensity histogram of the image delimited by the rectangle in 6(a) displaying threshold
values yielded by different thresholding methods. 1: MSSQ, 2: GM, 3: K-I, 4: Otsu, 5: K-means
and 6: Visual. (d) Binarization of the cropped image by MSSQ method. (e) Binarization of the
cropped image by Otsu’s method.
Several thresholding methods are applied to the cropped images. Tresholds found by Gaussian
modeling (GM), Kittler-Illingworth (K-I), Otsu and K-means methods are compared to
interactive visual thresholding (Visual) and the automatic method proposed in this paper (MSSQ)
in figures 5(c) an 6(c). Differences among them should be evaluated from CF’s yielded by those

threshold values. Binarized images resulting from MSSQ threshold are shown in 5(d) and 6(d).
Those from K-means threshold are displayed in 5(e) and 6(e). K-means and Otsu’s thresholding
methods provide coherent threshold values when they are applied to the low CF sample, but they
are too low for the high CF sample. K-I and GM fail to provide consistent thresholding values
for both samples. CF values corresponding to each method are found in tables 1 and 2. MSSQ
thresholding method provides close values to Visual CF for both high and low CF samples.
Method Lo CF MSSQ 150 0.935 GM 48 0.594 K-I 86 0.828 Otsu 92 0.847 K-means 99 0.866 Visual 151 0.937
Table 1. Thresholds and CF yielded by different methods from the cropped image in 5(a).
Method Lo CF MSSQ 133 0.603 GM 185 0.786 K-I 9 0.483 Otsu 95 0.589 K-means 97 0.589 Visual 93 0.586
Table 2. Thresholds and CF yielded by different methods from the cropped image in 6(a).
Feature extraction from the digital image of a fabric sample and calculations yielding the final
CF value can be fully implemented in an algorithm. So the whole procedure is automatized and
the CF value directly obtained from the digital image.
Validation of the Results
The method has been applied to a set of 81 different plain fabric samples, resulting from the
combination of four fabric features, whose effects on the CF values are statistically analyzed in

section 5. The features or factors considered are: type of fiber, warp yarn number, weft yarn
number and weft thread count, each one investigated at three different levels. Thread counts in
the warp direction were kept constant. Manufacturing specifications of these fabric samples are
presented in table 3.
Manufacturing Specifications
Fiber Yarn Number (tex) Thread Count (yarns/cm)
Warp Weft Warp Weft
Cotton 14, 20, 25 14, 20, 25 38 23, 25, 27
Modal 14, 20, 25 14, 20, 25 38 23, 25, 27
Treated modal (modal sun) 14, 20, 29 14, 20, 29 38 23, 25, 27
Table 3. Manufacturing specifications of the fabrics’ samples.
CF values obtained by the proposed method are compared to mean values of CF evaluated
according to an interactive thresholding procedure carried out by a group of experimented
observers. We also analyze the relationship of the foregoing fabric features with CF values
yielded by the method.
Interactive visual thresholding is performed with the help of a PC. Two identical gray scale
images of a sample are presented to the observer on a PC screen (Figure 7). The left side image
remains fixed while the observer slides a cursor in order to select a threshold value. The pixels
with intensities higher than the selected threshold change their color to magenta in the right side
image for a better visualisation of the thresholding result. The observer sets the threshold value
by seeking the best match between the bright pixels corresponding to the fabric holes in the left
side image and the magenta pixels in the right side image. To conclude, CF is straightforwardly
obtained as the ratio of gray pixels to the total number of pixels of the right side image.

Figure 7 Screen presented to observers; left: fixed image; right: visually thresholded image.
Visual tresholding of the complete set of 81 samples has been performed by 20 different
observers and the visual CF value of each sample computed as the average of the 20 values
individually obtained.
A correlation analysis to assess the relationship between CF values obtained by the automatic
method presented in this paper with both the visual CF of the fabric samples and the type of fiber
yields an overall determination coefficient of 94.71%. Figure 8 displays three regression lines
corresponding to the three types of fibers considered. All points are close to the diagonal. This
fact indicates a very good agreement between the values obtained by both methods. The models
fitted to modal and modal sun fibers are very similar and the model fitted to cotton fibers differs
slightly from them. A possible explanation for that fact could be the higher irregularity of the
cotton fiber when compared to modal and modal sun. The last fibers, although made from a
natural polymer, have undergone a spinning process that provides a more uniform subsequent
fabric surface, while cotton is a natural fiber and thus the cotton fabrics present more free ends of
fibers arising from the surface. These free fibers on cotton fabrics would account for a higher

difficulty to assess both the CF values obtained by the proposed method and the visual CF. The
confirmation of this conjecture, however, will require further research and analysis.
(a)
(b)
(c)
Figure 8 Comparison between visual CF and CF obtained by the method. Regression lines and
linear correlation coefficients r for the three types of yarns analyzed: a) Cotton b) Modal c)
Modal sun.
The analysis of the relationship of the CF obtained by the method presented in this paper with
fabric features is performed by means of a multi-factor Analysis of Variance (ANOVA). Results
are displayed in figure 9 and show a consistent behavior of the adjusted CF mean values. An
increase of yarn numbers for both warp and weft entails an increase of the adjusted mean CF
(p < 0.0001) as displayed in figures 9(a) and 9(b). Weft density values do not differ enough to
produce a significant change on the adjusted mean CF values (p = 0.6749) (Figure 9(c)). Fiber
type also affects adjusted means (p < 0.0001) (Figure 9(d)).

(a)
(b)
(c)
(d)
Figure 9 Multifactor ANOVA, relationship between the adjusted mean CF measured and: (a)
Warp yarn numbers (b) Weft yarn numbers (c) Weft thread counts (d) Type of fiber.
Conclusions
We have developed an accurate, objective and automatic evaluation method of the CF of a fabric
sample based on a single digital image of it, suitable for a wide range of CF values, comprising
values close to 1. The algorithm is fully automatic and only requires as an input a digital image
of the sample under inspection.
The method has been validated with a large set of plain fabric samples with known yarn
numbers, thread counts and types of fiber. CF values yielded by the method are consistent with
fabric features. We have also found a very good agreement between these values and those
obtained by an interactive visual thresholding of the images performed by a large set of
observers, demonstrating its versatility and accuracy.

Taking into account that fabric samples are illuminated by transmission together with the scale
of the image field, the method should properly perform for interlacing patterns other than plain.
All the mentioned characteristics show that this method can be very useful to implement quality
control procedures to monitor CF of fabrics.
Acknowledgements
To Dr. Jordi Morató from Departament d’Òptica i Optometria of UPC, for supplying the system
to capture the images. To MCYT (Proyecto DPI2006-05479) and FEDER for supporting this
work.
Literature Cited
1. Marks, R., Lawton, P.J., Holme, D.A., An Introduction to Textiles. Vol. III – Fabrics,
School of Textile Studies, Bolton Institute of Higher Education, UK (1993)
2. Milasius, V., Milasius, R., Kumpikaite, E., Olsauskiene, A., Influence of Fabric Structure on
some Technological and End-use Properties, Fibres & textiles in Eastern Europe, 11(2:41),
48-51 (2003)
3. Milasius, V., An Integrated Structure Factor for Woven Fabrics. Part I: Estimation of the
Weave. Journal of the Textile Institute, 91 Part 1(2), 268-276 (2000)
4. Seyam, A., El-Shiekh, A., Mechanics of Woven Fabrics. Part III: Critical Review of
Weavability Limit Studies, Textile Research Journal, 63(7), 371-378 (1993)
5. Seyam, A., El-Shiekh, A., Mechanics of Woven Fabrics. Part IV: Critical Review of Fabric
Degree of Tightness and Its Applications, Textile Research Journal, 64(11), 653-662
(1994)
6. Olsauskiene, A., Milasius, R., Dependence of Air Permeability on Various Integrated
Fabric Firmness Factors, Materials Science, 9(4), 401-404 (2003)

7. Algaba, I., Riva, A., Crews, P.C., Influence of Fiber Type and Fabric Porosity on the UPF
of Summer Fabrics, AATCC Review, 4(2), 26-31 (2004)
8. Peirce, F.T., The Geometry of Cloth Structure, Journal of the Textile Institute, 28, 45-96
(1937)
9. Brierley, S., Cloth Settings Reconsidered, The Textile Manufacturer, 78, 349-351; 79, 533-
537; 595-597 (1952)
10. Galcerán, V., Tecnología del tejido. Vol. 2: Análisis de tejidos y técnica de su fabricación.
2ª Ed, ETSIIT, Terrassa (1961)
11. Galuszynski, S., Structure and Tightness of Woven Fabrics, Indian Journal of Textile
Research, 12, 71-77 (1987)
12. Castellar, M.D., Manich, A.M., Carvalho, J., Barella, A., An application of the image
analysis to the woven fabric cover factor determination, in “Niches in the World of
Textiles: The 77th World Conference of the Textile Institute, Tampere”, Vol. 2, 56-72, The
Textile Institute, Manchester (1997)
13. Kang, T.J., Choi, S.H., Kim, S.M., Oh, K.W., Automatic Structure Analysis and Objective
Evaluation of Woven Fabric Using Image Analysis, Textile Research Journal, 71(3), 261-
270 (2001)
14. Abou-llana, M., Youssef, S., Pastore, C., Gowayed, Y., Assessing Structural Changes in
Knits During Processing, Textile Research Journal, 73(6), 535-540 (2003)
15. Cardamone, J.M., Damert, W.C., Phillips, J.C., Marmer, W.N., Digital Image Analysis for
Fabric Assessment, Textile Research Journal, 72(10), 906-916 (2002)
16. Sezgin, M., Sankur, B., Survey over image thresholding techniques and quantitative
performance evaluation, Journal of Electronic Imaging, 13 (1), 146-168, (2004).
17. Gonzalez, R.C., Woods, R.E., Digital Image Processing, Adisson-Wesley, London (1993)
18. Xu, B., Identifying Fabric Structures with Fast Fourier Transform Techniques, Textile
Research Journal, 66 (8), 496-506(1996)
19. Escofet, J., Millán, M.S., Ralló, M., Modelling of woven fabric structures based on Fourier
image analysis, Applied Optics, 40(34), pp. 6170-6176 (2001)
20. Ralló, M., Escofet, J., Millán, M.S., Weave-repeat identification by structural analysis of
fabric images, Applied Optics, 42(17), pp. 3361-3372 (2003)
21. Russ, J.C., The Image Processing Handbook. 2nd ed, CRC Press, Boca Raton FL (1995)
22. Koren, N., Making fine prints in your digital darkroom, available at:
http://www.normankoren.com/makingfineprints1A.html (accessed 5 September 2008)
(2000)
23. Holst, G.C., CCD arrays, cameras and displays, SPIE Optical Engineering Press,
Bellingham (WA) (1998)


