Embed Size (px)
Citation preview

OBR Targets Assessment
November 2021
© Arcadis 2021 19 November 2021 1

Our Team
Jason BucklandHead of Aviation Consultancy and Mobility
M: +44 (0)7736 778 756E: [email protected]
Angus McIntyreAssociate Director
M: +44 (0)7884 115 917E: [email protected]
© Arcadis 2021 19 November 2021 2

Version Control
Author Chris Kirby
Checker Orrin James
Reviewer Angus McIntyre
Approver Jason Buckland
Date NOVEMBER 2021
Version Control
This report dated 19 November 2021 has been prepared for the CAA (the “Client”) in accordance with the terms and conditions of appointment dated 01
April 2021(the “Appointment”) between the Client and Arcadis Consulting (UK) Limited (“Arcadis”) for the purposes specified in the Appointment. For
avoidance of doubt, no other person(s) may use or rely upon this report or its contents, and Arcadis accepts no responsibility for any such use or reliance
thereon by any other third party.
Version Date Author Checker Reviewer Approver Changes
1.0 05/11/21 CK OJ AM JB Initial Report
2.0 15/11/21 OJ AM JB JB CAA Amendments
3.0 16/11/21 OJ AM JB JB Finalised for Fact Check
4.0 19/11/21 OJ AM JB JB Fact Checked, For Final Issue
© Arcadis 202119 November 2021
3

Contents
© Arcadis 2021 19 November 2021 4
Project Objectives
Executive Summary
Approach
Evaluation
• Stand Facilities
• Wayfinding
• Transfer and Staff Search
• Security and control posts
• Departure Flight Punctuality
• Cleanliness
Airline Feedback 40
Target Stretch Analysis 41
Conclusions 47
• Pier Served Stand Usage
• Lifts Escalators and Travelators
• Terminal 5 TTS
• Baggage Reclaim System Availability
• Wi-Fi Performance
• Overall Satisfaction
• PRS / PRM
5
7
10
12
13
17
19
20
24
25
26
28
30
32
34
36
38

Project Objectives
© Arcadis 2021 19 November 2021
The CAA is seeking a view from Arcadis on whether the service quality targets that HAL has proposed for its “optimal plan” need tobe adjusted in view of the capex and opex allowances that the CAA has initially proposed for the H7 period, and therefore whetherany adjustments are needed and the potential size of any such adjustments.
Arcadis Scope is to consider:
(a) HAL’s targets and determine whether the argument / logic / operational reasons used by HAL to determine any degradation in targets is reasonable, could materialise and is reflective of past performance and spending levels; and
(b) Whether the improved targets HAL proposes in the “Optimal Plan” can be delivered within the allowances the CAA is minded to set
In reaching its view, the CAA expect Arcadis to take account of, among other things:
• the lower service quality targets that HAL has proposed for its “safety only” plan (particularly for security queues and assetavailability), any supporting evidence that is available in relation to these, and the credibility of HAL’s case for lower targets
• whether the improved targets HAL proposes can be delivered within the capex and opex allowances CAA are minded to set
• the range of passenger forecasts (medium, high and low) currently being considered by CAA, and the extent to which the CAA’scurrent expenditure allowances might be expected to be flexed under different outturns (whether through the development to coreframework or otherwise)”
For context:
HAL proposed 36 measures in total for H7. A number of these measures do not yet have targets due to the need to gather robust baseline data. Of the targets that have been set, a number are maintained at Q6 levels and a small number show improved targets (ie: higher then previously set). Under the Safety Only Plan, several targets are set at a lower level than both the Optimal Plan and current and historic performance.
5

Disclaimer
© Arcadis 2021 19 November 2021 6
This report dated November 2021 has been prepared for the Civil Aviation Authority (CAA) (the “Client”)in accordance with the terms and conditions of appointment between the Client and Arcadis UKLimited (“Arcadis”) for the purposes specified in the Appointment. For avoidance of doubt, no otherperson(s) may use or rely upon this report or its contents, and Arcadis accepts no responsibility for anysuch use or reliance thereon by any other third party.

Overall conclusions
© Arcadis 2021 19 November 2021 7
Based on the information provided by HAL, considering HAL’s historic performance on delivering its targets, and taking an
industry level view of how assets perform and degrade over time, Arcadis considers that the targets set in the optimal plan could
be delivered based on the allowances the CAA has set in its Initial Proposals. Many of HAL’s proposed H7 targets are
maintaining existing Q6 targets and there is little evidence that has been shared by HAL that clearly links the level of capex
alone with a reduction in asset and service performance.
Arcadis has not seen clear evidence or data that can justify the levels of degradation in service that HAL has set out in the
targets in its Safety Only plan. Much of the information presented does not take into account that HAL has been outperforming
its current targets both before and during Q6 and since Covid-19. There was little evidence presented by HAL that showed data
or evidence that linked degradations directly with capex expenditure. It is therefore difficult at this juncture, based on the
evidence supplied by HAL, to accept that the levels of degradation set out by HAL could materialise based on the allowances the
CAA has set in its Initial Proposals.
Arcadis understands that there is still assessment work being undertaken by HAL to support some of these degradation levels
and recommends that any adjustments that the CAA may consider should be evidence based and supported by data. This
evidence should be able to directly map the reduction in capex expenditure to the degradation in service performance over time
to justify any adjustment. This evidence would allow the CAA to determine whether any increase in capex is deemed
reasonable.
Based on the information reviewed to date, including both historic and recent performance, it is evident that there is scope for a
review of the targets proposed by HAL and the potential for some areas of further stretching targets for H7. This is covered later
in this report.
Executive Summary

Executive Summary
© Arcadis 2021 19 November 2021
• Many of the targets in HAL's optimal plan are maintained from Q6 with a small number of improved targets in the areas of baggage, punctuality and the passenger experience. HAL's safety only plan sets out 17 lower targets that it considers could materialise in areas including security and assets.
• Although HAL has set out some rationale for a degradation of targets between the Safety Only and Optimal Plans, there is a lack of substantive data or modelling evidence to support these arguments.
• Data surrounding critical areas such as security, where HAL has indicated a significant potential degradation in service levels, that is required to assist in justifying the levels of degradation is not available and, in this case, detailed modelling and trials have either not yet taken place or concluded. A lack of visibility and data therefore hampers Arcadis’ ability to make informed judgements not just when comparing the two business plans but also when compared against current performance metrics.
• HAL needs to share as much information as possible from areas such as the current trials but also manufacturer developments anddialogue that are helping to shape the new products to determine whether a degradation in service, if any, will take place due to theallowances the CAA has proposed. HAL’s Updated Capex Plan does not have sufficient detail to allow a clear view between spendlevels and degradation to determine the quantum of spend required to deliver the two plans and effect OBR targets.
• The concept of an Enhanced Service Overlay (ESO) is deemed reasonable for asset related measures to ensure the reliable delivery of services and to mitigate against low frequency, but high impact events as is evidenced in baggage system reclaim availability (arrivals), T5 TTS and lifts, escalators and travellators. HAL has presented their thinking behind why there is a requirement for the ESO but there was no detailed evidence to underpin the quantum of opex requested. It should also be noted that the CAA has made an allowance for opex overlays in their Initial Proposals published in October 2021.
• HAL did not provide a detailed breakdown of the Security Programme spend under the Safety Only Plan beyond the £420m total, so it could not be categorically determined whether the H7 targets could be met within the proposed CAA allowances. However, the funding available for security under the safety only programme is deemed more than sufficient for the procurement of the necessary equipment, factoring in both Airline and Arcadis benchmarking data, whilst also being able to contribute to the transformation and compliance spend categories as well. The proposed targets for all security measures under the Safety Only Plan are therefore not deemed reasonable or representative of the possible outcome.
8

Executive Summary
© Arcadis 2021 19 November 2021
• Some of the targets proposed for H7 do not offer sufficient stretch or challenge based on historic or current performance and some suggested levels of degradation do not take into consideration the existing (positive) gap between existing performance and current targets nor proposed targets in the two H7 plans. These are analysed later in this report and are accompanied by some suggested ranges that are considered more appropriate.
• Overall, it does not seem that HAL has recognised their historic or current performance levels sufficiently when setting the targets for H7 under either the Optimal Plan or the Safety Only Plan. Current performance levels are almost exclusively above existing SQRB Q6 Targets and proposed targets for both plans, notwithstanding the fact the last two years during the pandemic have not been typical. This is especially apparent when looking at measures such as Wayfinding, Cleanliness and Wi-Fi, with performance levels generally increasing over time. This performance has been measured on an annual basis from QSM data.
9

Approach
© Arcadis 2021 19 November 2021 10

Our approach
© Arcadis 2021 19 November 2021
• Reviewed Chapter 9.2 Revised Business Plan , 5.3 (capex), 5.4 (opex) and 6.2 (measures, targets and incentives) in
Updated Business Plan. This material can be found in the following link.
• Reviewed HAL’s targets and supporting rationale in the business plan
• Reviewed relevant extracts from Cepa Taylor Airey (CTA) report regarding relevant opex overlays supplied by the
CAA
• Considered HAL’s service quality performance in Q6/2019 and the capex/opex HAL spent on service quality in Q6.
• Engaged with HAL to understand methodology, thinking and logic used to determine the difference in targets between
‘Optimal’ and ‘Safety Only’ Plans – focussed on the degradation elements.
• Arcadis has undertaken several dissemination sessions with HAL and have been provided with some supporting
information as follow-up to these sessions for review.
• To determine how the different forecasts used (High/Medium/Low) feature in how HAL has set its targets:
• We engaged with the airline community to seek their views on HAL’s proposed targets including the degradation
targets HAL has developed in its “Safety Only Plan” for H7
• We considered the allowances the CAA has set for Initial Proposals and what impact that may have on the targets
that HAL has set.
• Recognises the opex overlays that the CAA has put forward in its Initial Proposals which are subject to further
consultation as part of the H7 price control decision.
11

Evaluation
© Arcadis 2021 19 November 2021
Arcadis has reviewed the documentation and has engaged with HAL in 5 workshop sessions for them to present their rationale
regarding the potential degradation in service from the Optimal Plan to the Safety Only Plan. Arcadis has considered this rationale
and where HAL has supplied some further information, we have compiled an opinion on whether HAL’s position is well reasoned
and supported by evidence. Arcadis has also engaged with the airline community to understand their views on HAL’s proposed
safety only plan targets. Arcadis has analysed HALs QSM data on an annual score basis against target, rather than on a monthly
basis, and this is shown in the charts against each measure within the report. It is acknowledged that on some measures, in year
monthly performance has dropped below target.
Arcadis has undertaken a detailed assessment of a number of the targets set out in HAL’s business plan. The following slides set
out the relevant measure and associated target, HAL’s evidence and our conclusions based on this information, noting the airlines
views. Where no detailed evidence was presented by HAL, we have not been able to assess whether the degradations outlined by
HAL could materialise.
• Stand Facilities • Wi-Fi performance
• Wayfinding • PRM/PRS satisfaction
• Security including Control Posts • Departure flight punctuality
• Cleanliness • Pier-served stand usage
• Lifts, Escalators and Travelators/ Passenger Sensitive • Overall satisfaction Equipment (PSE)
• Terminal Track Transit System (TTS)
• Baggage System Reclaim availability (arrivals)
12

OBR Target Assessment | Stand Facilities
© Arcadis 2021 19 November 2021
• The optimal plan includes the Enhanced ServiceOverlay that HAL says it needs to protect servicelevels for H7 and minimise the impact on H8.
• Stand availability – the Optimal Plan target is 99%compared to the Safety Only Plan of 98%.
• Provision of stand facilities combines and measures the average availability of four SQRB measures – SEGS, PCA, FEGP and APBB (Jetties).The overall target is 99% (Optimal Plan) and 97.25% (Safety Only Plan).
• The Safety Only Plan contains £1.5bn of prioritised capital spend on asset management but no increased Opex allowance for increased inspection and maintenance compared to Q6.
• The Optimal Plan provides £1.5bn of capital spend and additional capital for the renewal of PCA under the carbon and sustainability programme, as well as the increased Opex allowance for Enhanced Service Overlay (ESO) to allow for an increase in the inspection and maintenance regime.
• Because the Safety Only Plan does not include the ESO , HAL has set lower targets. HAL says this is because of the expectation that assets may be out of service more frequently due to increasing age and the inability to increase the frequency of inspection and maintenance services.
Consumer Outcome Measure Optimal Plan Safety Only Plan
Predictable
and Reliable
Stand Availability 99% 98%
Provision of Stand
Facilities99% 97.25%
Availability of Stand
Entry Guidance System
(SEGS)
99% 98%
Pre-Conditioned Air
(PCA)98%
95% / 97% - subject to
sustainability
investment profile
Fixed Electrical Ground
Power (FEGP)99% 98%
Air Passenger
Boarding Bridges
(APBB) Availability
(Jetties)
99% 98%
13

OBR Target Assessment | Stand Facilities
• It is clear that based on historical performance data, HAL has generally been outperforming their targets between 2008-2021.
• FEGP and SEGS SQRB performance has been above 99%. Except for T3 and T5 performance in 2010-2012, the SQRB performance for PCA has been above its target of 98% though we note that airlines consider that, notwithstanding the high availability scores, the current PCA product is suboptimal.
• As the target is already at 99% there is little scope for stretch on these measures.
Source: HAL data, Arcadis analysis
Target at 99% -not visible on
chart due to scale
© Arcadis 2021 19 November 2021 14

OBR Target Assessment | Stand Facilities
© Arcadis 2021 19 November 2021
Evidence Appraisal Conclusion
HAL says most assets were close to mid-life at the start of Q6. It is
anticipated that all 4 asset groups will be at end of life by 2026 (end of
H7). The rationale for an increase in the inspection and maintenance
regime via the Enhanced Service Overlay is deemed reasonable by HAL
on the premise of:
• The continuing increase in the average age of critical SQRB asset
life which presents an increase risk of simultaneous failure during
H7
• The current regime has limited availability to allow for dead
banding of assets such as APBB (jetties) – these have never
received “major” maintenance interventions during their operational
life
• Increased safety driven alleviations and passenger driven service
Having engaged with HAL to understand the rationale behind this, it
would be reasonable to conclude that HAL would need some additional
opex (Enhanced Service Overlay) to provide resilience for its older stand
assets.
HAL argue that by not having the Enhanced Service Overlay, there would
be compounded reductions in service levels that continue through to H8.
This would explain the degradation between the Optimal and Safety Only
plans if it is anticipated that assets would be out of service at a greater
frequency due to them becoming unserviceable and requiring
intervention. However the enhanced opex allowance should provide the
necessary means to achieve the optimal plan targets.
According to HAL, the majority of APBB (jetties) and PCA units will
exceed the end of asset life by middle of H7. The rationale behind this is
that the risk of major maintenance intervention increases requiring more
inspection and servicing. Targeted maintenance extends the asset life.
Whilst there is logic behind this, we would highlight that the assets should
not just be assessed in years but also the mode and frequency of
operation for each individual unit. HAL is also aware of this and appears
to be prioritising its highest risk assets for replacement.
HAL says assets such as the SEGS and FEGP will require maintenance
throughout H7. The SEGS is deemed medium risk with upgrades through
H7 not within the optimal plan. For FEGP, the asset replacement
programme only includes funding to start replacement of T5 units only.
For PCA, the asset replacement plan includes limited investment to
address life expired and unsupported units in T5, as well as those stands
which have the highest utilisation.
Through our sessions with HAL, we understand that their strategy is a
”Safety Plan Plus” approach in asset management. This implies that
there is a requirement for opex to facilitate the maintenance regime.
The Safety Only Plan would address those stand assets which are at
highest risk of failure and need replacement. However, there is the risk
that those assets classified as a lower priority could require more
maintenance intervention based on continued usage and / or increasing
age, which the Safety Only Plan does not cover.
15

OBR Target Assessment | Stand Facilities
© Arcadis 2021 19 November 2021
Evidence Appraisal Conclusion
Without adequate expenditure, HAL says it will not be able to provide the
same levels of asset availability. With assets increasing in age, HAL
argues that the greater volume of renewals and maintenance required
will lead to more time where an asset is out of operation in order to
facilitate replacement or repair interventions.
There is less resilience in H7 against assets becoming unserviceable and
having to be closed for repair / replacement without some form of
additional operating expenditure. With increased risk of assets failing
simultaneously, we can see why there are degradations between the
Optimal and Safety Only Plan targets. These degradations should be
mitigated by the enhanced opex allowance.
However, we are not clear on the extent of the degradation. The general
rationale is that stand assets are increasing in age, requiring increased
frequencies of maintenance and inspection. From our engagement with
HAL, they have stated that assets such as APBBs (jetties), which are
relatively new or in good condition will need limited interventions. Those
in the poorest condition will require full replacement whilst an optimal
decision will be needed for those assets at mid-life.
It is not clear, based on this information, what this means for the extent of
the degradation and whether the targets set by HAL reflect the different
conditions of all of the stand assets. It is advisable that HAL provides
more data or information to explain the rationale behind the difference in
targets for the Optimal and Safety Only Plans.
16

OBR Target Assessment | Wayfinding
Consumer
OutcomeMeasure Optimal Plan Safety Only Plan
Predictable and
ReliableWayfinding 4.15 4.10
• The chart to the left shows the SQRB performance for Wayfinding since 2008. Bar two years on T1, HAL has exceeded the target every year across all other terminals accommodating a target rise from 4.0 to 4.1 in 2014/15.
• HAL says passenger perception of wayfinding is linked to their experiences of wayfinding outside of airports, which in turn shapes their expectations of what will be available at the airport.
• HAL says this is confirmed by its passenger priority research, which shows an increasing desire, especially among non-UK residents (54% of 2019 passengers), to get wayfinding support through their personal electronic devices.
• The Optimal Capital plan includes programmes (“Efficient Airport” and “Future Ready - Service, Resilience”) to make investments in digital wayfinding to keep pace with consumer expectations and deliver HAL’s 2019 improvements on Q6 perception of wayfinding.
• The Safety Only plan does not allow for these investments and therefore HAL anticipates some deterioration in wayfinding satisfaction as they fail to keep up with consumer expectations. While HAL argues that consumers’ expectations are rising, we note that this is not reflected in lower QSM scores/levels of satisfaction, which instead are trending upward.
• We also note that the Safety Only Plan target is consistent with the current Q6 target at 4.10 which HAL has consistently outperformed.
Source: HAL data, Arcadis analysis
© Arcadis 2021 19 November 2021 17

© Arcadis 2021
OBR Target Assessment | Wayfinding
16 November 2021 16
Evidence Appraisal Conclusion
• HAL says the Safety Only plan does not allow for these investments and therefore HAL anticipates some deterioration in wayfinding satisfaction as they fail to keep up with consumer expectations.
HAL has performed above target (except T1) every year since 2008. It
would appear in setting the targets for both the Optimal Plan and the
Safety Only Plan that HAL has not considered their current performance
sufficiently. In the last 5 years from the chart on the previous slide, the
Wayfinding QSM score has not dipped below 4.20* suggesting a long-
term trajectory of improved performance. In arriving at its H7 targets,
HAL has taken the lowest performing month by terminal from the period
2012-2018 and the lowest month by terminal in 2019.HAL then used the
higher of those two figures (4.22 T5 September 2019) and apportioned a
margin of error to arrive at 4.15 under the Optimal Plan. The average
based on HAL’s data for Q6 was 4.24.
At 4.24 for Q6, this is already higher by 0.09 than the target HAL
proposes for H7 in the Optimal Plan and 0.14 higher than is proposed
under the Safety Only Plan. HAL have not yet provided sufficient
rationale for the degradation from existing or historic levels of service to
those proposed under either H7 plan.
Whilst the lack of investment in the Safety Only Plan for digital wayfinding
could logically explain the 0.05 differential to the Optimal Plan, neither
target appears reflective of current performance and the Safety Only Plan
simply maintains the same historic SQRB target that HAL has
consistently outperformed against on an upwards trajectory and on that
basis does not seem reasonable. Consequently, this is an area that could
justify a stretch review on the proposed targets for H7 which is discussed
further on in slide 42.
* Note – it is noted that HAL’s performance on Wayfinding has generated
bonus payments since 2016 as follows (information from published
regulatory accounts, see following link):
• 2016 - £353k
• 2017 - £520k
• 2018 - £684k
• 2019 - £1,045k
• 2020 - £144k© Arcadis 2021 19 November 2021 18

© Arcadis 2021
OBR Target Assessment | Transfer & Staff SearchConsumer
OutcomeMeasure Optimal Plan Safety Only Plan
Predictable &
Reliable
% Queue times <
10 mins95% 46%-89%
• As can be seen from the charts to the right, SQRB performance for
<10-minute queue times for both transfer and staff search have been
consistently above target since 2015, notwithstanding T3 and T5 being
closer to target on occasion.
• HAL says the material difference between the Optimal Plan and the
Safety Only Plan target as shown above is down to the much later
delivery of compliant lanes under the Safety Only Plan. The wide
range target proposed by HAL under the Safety Only Plan is due to a
lack of robust data to propose a more accurate and narrow target
range. Trials are yet to conclude (due to conclude June 2022) on the
new technology being deployed and modelling into the new
configurations has yet to commence.
• In consultation with HAL, there appears to be no substantive evidence
or modelling behind the wide OBR percentage ranges proposed by
HAL under the Safety Only Plan, potentially explaining why such a
broad range has been applied.
Source: HAL data, Arcadis analysis
19 November 2021© Arcadis 202119

© Arcadis 2021
OBR Target Assessment | Security & Control PostsConsumer
OutcomeMeasure Optimal Plan Safety Only Plan
Predictable &
Reliable
% Central search
queue times < 5
mins
% Central search
queue times < 10
mins
% Vehicle queue
times <15 mins
95%
99%
95%
33%-75%
46%-89%
46%-89%
• The two charts to the right show the SQRB annual average performance for
<5 and <10-minute security queue times across all terminals has been
consistently above target since 2015, except for T2 in 2020/21. The dip in
performance around 2012/13 was in part due to the introduction of the liquids
rules and enhanced protocols which took time to normalise, with T3 showing
the most notable reduction against both time metrics. Prior to this dip,
performance had again been above target since 2008. Control post
performance during Q6 has generally been strong, with July 2021 data
showing all control post group scores exceeded 99%, some 4%pts above
vehicle queue time target. The material differences between the Optimal Plan
and the Safety Only Plan targets as shown above are down to the much later
delivery of the compliant lanes under the Safety Only Plan. The wide range
targets proposed by HAL under the Safety Only Plan are due to a lack of
robust data to propose a more accurate and narrow target range. Trials are
yet to conclude (due to conclude June 2022) on the new technology being
deployed and modelling into the new configurations.
• During consultation with HAL, there appears to be no substantive evidence or
modelling behind the wide SQRB percentage ranges proposed by HAL under
the Safety Only plan, potentially explaining why such a broad range has been
applied. This applies to all 3 measures as shown in the table above. Source: HAL data, Arcadis analysis
© Arcadis 2021 19 November 2021 20

© Arcadis 2021
OBR Target Assessment | Security & Control Posts
16 November 2021 19
Evidence Appraisal Conclusion
The Safety Only Plan alone (£420m) does not allow for all scanners to be
replaced or for the delivery of adequate lanes for HAL’s forecast
passenger numbers. HAL says this will lead to longer queue times as
passengers have to use a smaller number of compliant lanes.
• Benchmark information suggests installing and commissioning a lane
would cost c£1.5m (new x-rays and scanners, but no discounts for
scale of project applied). £2m per lane would be considered a
maximum.
• At £1.5m per lane, this would equate to c£245m for 163 lanes (which
would cover the entire campus, including passenger terminals, staff,
transfer and control post security areas), leaving c£175m to be
allocated for compliance/transformation. The additional funding under
the Optimal Plan is described as £230m – Security Compliance to
ensure all lanes are compliant prior to the end of H7 and £130m for
Security Transformation to improve service levels and operating
costs.
• It is therefore deemed reasonable to conclude that HAL could afford to
procure all the lanes it requires and make a material contribution
towards the security compliance/transformation programme from the
Safety Only Plan allocation of £420m.
• A detailed breakdown of these costs has not been provided despite
being requested and HAL should be encouraged to share this
information as soon as possible to give greater clarity.
HAL says there is a risk of cabin baggage flow rates improving by 23
seconds on average putting them out of sync with the associated
passenger and the risk of the x-rays having to be stopped to alleviate
baggage backing up into the x-ray from the rear roller beds.
• Part of the challenge appears to be around the ability to design the
new lanes into the optimal configuration to allow for possibly longer
rear roller beds and optimised flow rate. Having requested any
modelling or data to provide evidence on this point, HAL stated that the
modelling is currently taking place as part of the ongoing trials (due to
conclude in June 2022).
• It is therefore an area that needs further analysis in order to determine
the actual impact of the new lanes in the existing space and what any
options would look like. HAL should substantiate this risk. Without any
substantive evidence to support this view from HAL it is difficult to
draw any conclusions from the evidence presented.© Arcadis 2021 19 November 2021 21

OBR Target Assessment | Security & Control Posts
© Arcadis 2021 19 November 2021
Evidence Appraisal Conclusion
HAL says the new scanner technology in the security lanes will create an
incremental delay per passenger as the scanners are slower than the
existing archway system. This will cause a degradation in the queue flow
rates.
• Whilst some modelling has been presented to suggest a degradation
of 2.6 seconds per clear passenger who does not set off any alarm,
this is an average.
• The data made available for queue time degradation appears to
ignore any possible benefits from the new technology that could
reduce queue times. For example, not having to remove liquids and
electronics at divestment stage, with an assumed resultant reduction
in trays per passenger, which could offset the delay at the scanner as
well as further potential efficiencies as passengers become more
familiar with the process over time.
• Robust trial data is required to provide substantive evidence to the
real impact of the new lanes technology and configuration impact.
• In addition, with the lower passenger volumes anticipated in the early
part of H7, this should allow HAL to meet its targets before passenger
volumes are forecast to reach pre-pandemic levels again later in H7.
• Whilst every passenger will have to go through a scanner which is
recognised as slowing down flow rates when compared to a standard
archway, there will be one scanner per lane rather than the current
one scanner to two lanes which in itself would suggest an immediate
efficiency. HAL state this would only be possible as part of the
regulatory and transformation programmes.
• HAL is understood to also be proposing new passenger queue
measurement technology to better manage the security process
enabling a more dynamic and proactive scheduling of resource to
meet demand. This again needs to be reflected in the targets and
more information shared as to the likely benefits this will bring.
22

OBR Target Assessment | Security & Control Posts
© Arcadis 2021 19 November 2021
Evidence Appraisal Conclusion
Under the Safety Only Plan – HAL says only 18% of passenger lanes will
be compliant by December 2024 compared to 88% under the Optimal Plan.
Both plans would mean that a number of lanes will be non-compliant
against the 1st June 2024 deadline, resulting in reduced operational
capacity, leading to longer average queue times.
HAL conclude that service levels under the safety only plan will be poor and
continue in their discussions with the DfT and the CAA to ascertain what
the consequences for non-compliance by 1st June 2024 would be.
Only by the end of H7 are all lanes forecast to be compliant which is
deemed best case scenario by HAL owing to a 1.5 year lead time on the
programme. Again, HAL state that this would only be possible through
both the regulatory and transformation programmes.
• The wide range target proposed by HAL under the Safety Only plan is
due to the lack of robust data and it appears that there is no substantive
data or modelling behind this range. Even under the Optimal Plan, HAL
says it will not meet its regulatory deadline for compliant lanes, putting
pressure on their service in the latter part of H7 if they are to hit the
targets they suggest under this plan. HAL will be assisted potentially by
the lower forecast passenger volumes in the earlier years of H7 as they
build back up to pre pandemic levels.
• The impact of a 1.5 year programme lead time to install the lanes could
contribute to a degradation in service levels as HAL is not forecasting to
operate any non-compliant lanes beyond the 1st June 2024 deadline.
HAL will only have c18% terminal passenger lanes available under the
Safety Only Plan at December 2024 and circa 50% by December 2026.
If non-compliant lanes are not operated then this could lead to a material
drop in performance without all lanes being available to process
passengers. On the basis that HAL could afford the required lanes and
some transformation/compliance work from its £420m Safety Only plan
as concluded previously, it would be reasonable to also conclude that
the gap between the 18% and 88% as at December 2024 for
programme completion would also narrow and possibly even close.
• There is insufficient evidence to determine if either plans timelines are
realistic as there is no trial data to back up the data received. The trials
currently underway are due to conclude in June 2022. More data and
evidence from HAL should be provided as soon as possible from the
current trials but the disparity in the percentage programme completion
between the two plans is not supported based on the information
reviewed.
• Given the above, we review the options for further stretch measures on
slide 43.
23

• HAL states that consumer insights confirm that punctuality is a
key area where passengers value improvements. In 2019 alone,
78.4% of flights departed on time, which was a rise of 59% compared
with 2007. On-time departure is a function of a number of areas, and it
is recognised that not all of these areas are within HAL’s control or
linked to the allowances the CAA sets.
• As mentioned, it is recognised that many elements of the
passenger journey fall outside HAL’s direct control. However, it would
appear based on the evidence seen to date that a significant
contributing factor for the proposed degradation between the Safety
Only and Optimal Plan targets could be the knock on impact the
degradation in security performance under the Safety Only Plan at
44%-89% (longer security queues) would have on departures flight
punctuality.
• As the relevant security target degradation is in itself not
deemed reasonable based on evidence provided to Arcadis, so it is
logical to conclude that the knock on impact from security on
departures flight punctuality is also to be challenged in more detail
as the security trial data and configuration modelling become
available.
Source: HAL/CAA data, Arcadis analysis
OBR Target Assessment | Dep. Flight punctuality• Historic SQRB performance data is not available for departures flight
punctuality as this is a proposed reputational OBR measure. However, the
Safety Only Plan target is aligned with HALs 2019 performance (78.4%)
• Arcadis has also received performance data from the CAA showing latest
operational performance covering the period August 2019 to August 2021.
• Prior to the pandemic in March 2020, HAL appears to have been operating
at a Moving Annual Average (MAA) of c78% in February 2020 on departures
punctuality, only exceeding the target in month in November 2019.
From March 2020, performance exceeds the target month on month until the
cumulative effect of the in-month improvements start to come through in the
MAA reporting with June 2020 as the first month whereby the MAA reaches
the target set. From July 2020 to August 2021, HAL’s departure MAA
flight punctuality is consistently above target despite an in-month reduction in
score achieved in December 2020 to around c72%.
• It would be reasonable to deduce that the impact of the pandemic and
the resultant lower passenger numbers from reduced aircraft traffic
movements (ATMs) has contributed to the improvement in this metric. As
ATMs start to increase again, it is reasonable to anticipate that the MAA will
decline. This potential decline in punctuality could be a function of a number
of areas, not all of which are within HAL’s control or linked to the allowances
the CAA sets.
• Given the lack of historic data, it is difficult to form any robust conclusions
but the Safety Only plan target (2019 performance) appears in line with
historic performance but does not take into account the ESO that the CAA
has allowed for in its Initial Proposals that should mitigate many of the
challenges around stand facilities that could reasonably impact on punctuality.
As such the Optimal Plan target should be considered and this is further
analysed on slide 45.
Consumer
OutcomeMeasure
2019
performanceOptimal Plan
Safety Only
Plan
Predictable &
reliable
Departures
flight punctuality 78.4% 80.5% 78.4%
© Arcadis 2021 19 November 2021 24

OBR Target Assessment | Cleanliness
Consumer
OutcomeMeasure Optimal Plan
Safety Only
Plan
Comfortable
and secureCleanliness 4.05 4.00
• HAL has stated that consumers have heightened needs in the area of
cleanliness as a result of the Covid-19 pandemic. This is understood and the
CAA have included an allowance for this in their Initial Proposals for H7
specifically for Covid-19 related additional cleaning.
• The chart on the left, clearly shows that HAL has performed above the SQRB
target every year since 2008/9 with a brief exception in T3 in 2008/9, indicating
a long term upward trajectory of improved performance.
• It is therefore reasonable to deduce that HAL would appear to have not
sufficiently taken into consideration, its historic strong performance when
setting its targets for H7 in either plan.
• Since the SQRB target rose to 4.00 in 2014/15, the lowest score achieved was
T3 in 2014/15 at 4.11. A broad average since 2014/15 across all terminals is
4.25, suggesting the targets HAL proposes in both plans are rather
conservative and not reflective of past performance.
• Given HAL’s strong performance in this area and the CAA’s proposed
allowance for the Covid-19 overlay, this is another area that would warrant
further stretch on the proposed targets for H7.
Source: HAL data, Arcadis analysis
© Arcadis 2021 19 November 2021 25

OBR Target Assessment | Pier served stand usage
Consumer
OutcomeMeasure Optimal Plan
Safety Only
Plan
Predictable &
reliable
Pier served stand
usage 95.00% 94.00%
• HAL states that, with a reduction in stand facilities
available due to reduced resilience levels in the Safety
Only Plan there will be a direct knock on impact on stand
availability and therefore pier service.
• In the Optimal Plan, HAL states this risk would be
reduced or even mitigated because of the availability of
the additional operating expenditure for stand facilities
and that further improvements could also be realised due
to the planned capital expenditure in areas such as
airfield automation and specifically, the delivery of Smart
Stand.
• As none of these investments are present in the Safety
Only Plan, HAL have reduced the proposed target.
• Historic and current performance for this measure has
been generally strong as can be seen in the chart above
right.
• As T5 has no Q6 target for pier served stands there is data missing. Terminals 2
and 4 have been performing above target since 2011-2012, albeit T3 has been
closer to target, especially in the period 2017-2019.
• HAL has understandably operated from a rationalised terminal operation since
the impact and subsequent response to the pandemic. Given the lower ATMs
and passenger numbers, recent performance data is unlikely to be fully reflective
of long term performance and issues across individual terminals.
Source: HAL data, Arcadis analysis
© Arcadis 2021 19 November 2021 26

OBR Target Assessment | Pier served stand usage
© Arcadis 2021 19 November 2021
• As the CAA has proposed in its H7 Initial Proposals in October to allow an ESO, and the ESO is considered a reasonable concept in its principle, so
this would logically flow through into pier-served stand usage which would assist in mitigating any proposed 1%pt degradation in the 94% proposed
by HAL under the Safety Only Plan v the Optimal Plan and current SQRB target of 95%.
• This is supported by HAL’s own view that the ESO under the Optimal Plan would mitigate the risk of pier service having a consequential impact if the
additional opex is not allowed. Whilst the CAA have made an allowance for the ESO as part of its Initial Proposals, this is subject to further
consultation as part of the H7 price control decision.
• It would be reasonable to deduce that the impact of the pandemic and the resultant lower passenger numbers from reduced aircraft traffic
movements (ATMs) will have eased pressure on the 95% target being achieved.
• In conclusion HAL’s strong performance on this measure and the inclusion of an ESO suggests HAL should be able to meet the optimal plan target,
thus mitigating the risk of the degradation materialising.
• There is scope here to consider a stretch target.
27

© Arcadis 2021
OBR Target Assessment | Lifts, Escalators & Travellators
16 November 2021 26
Consumer
OutcomeMeasure Optimal Plan
Safety Only
Plan
Predictable &
reliable
Lifts, Escalators
and Travellators 99% 97%
• The charts to the right, clearly show that HAL has exceeded its SQRB
target of 99% every year since 2008 with only T5 falling below target in
2008/9 on both General & Priority PSE, which coincides with the opening
of the terminal. The working session with HAL provided some insight into
the general age of the assets with c340 assets being aged between 5-10
years, c410 being aged between 10-15 years and c180 being aged
around 15-20 years. Either side of these ranges were smaller samples.
HAL currently operates >550 lifts and >350 escalators.
• HAL says the degradation in service level between the two plans of
2%pts is due to the increased risk of failures and resultant downtime
owing to the Safety Only Plan not having the Enhanced Service Overlay
(ESO) to enable more inspections and maintenance. The ESO would
enable a more proactive maintenance approach to the assets given the
age profile that HAL is operating.
• The lack of ESO under the Safety Only Plan is deemed a reasonable
explanation for the degradation in SQRB target from the optimal plan to
the safety only plan but does not sufficiently account for the historic
strong performance on this category against previous SQRB targets in
setting the targets for H7. The concept of the ESO is however regarded
as reasonable and furthermore, it should be noted that the CAA has
made an allowance for the ESO in its Initial Proposals in October 2021.
Source: HAL data, Arcadis analysis© Arcadis 2021 19 November 2021
28

OBR Target Assessment | Lifts, Escalators & Travellators
Evidence Appraisal Conclusion
HAL has stated that they can continue to operate and maintain the lifts,
escalators and travelators under the Safety Only Plan but there will be an
increased risk of more frequent outages and the possible risk of longer time
out of service. The Safety Only plan would also not allow them to carry out
dead-banding activities such as fire cleans.
• HAL says it will not be able to maintain the assets to the level they would
wish without some additional operating expenditure. Consequently, there
is an increased risk of the service being disrupted due to more frequent
failures and potentially greater downtime per frequency.
• On lifts for example, there will be certain assets that are more heavily
used owing to proximity to entrances and exits, leaving some assets less
used. Whilst the age of the asset is not an absolute guide to an assets
health, HAL proactively manages the assets in order to ensure their safe
and efficient operation. Components from more lower traffic areas can be
changed into high traffic assets. The harvesting of reusable components
from assets is standard practice to create a stock of spares. The
downtime during the pandemic has reduced wear and tear which may
have added a few months life but not 1.5 years as might be assumed.
• When HAL’s lifts are compared to a comparator such as TfL, HAL
acknowledge that their own lifts are less industrial than those used by TfL
but that they endure very high throughput with trolleys and heavy wheeled
suitcases, that cause the level of maintenance that is regularly required to
ensure they can operate safely.
• No detailed modelling or data has been shared that definitively proves the
impact of the ESO but given the criticality of the assets and the age
profile, the degradation of 2%pts is considered reasonable for the Safety
Only Plan excluding any ESO spending in H7.
• The requirement for additional opex via a mechanism such as the ESO is
deemed reasonable for this asset class to improve the reliability of the
assets in question. It should be noted that the CAA has made an
allowance for the ESO in its H7 Initial Proposals which could therefore
mitigate the risk of asset failure and make the optimal/Q6 target
achievable.
© Arcadis 2021 19 November 2021 29

© Arcadis 2021
OBR Target Assessment | Terminal 5 TTS
Consumer
OutcomeMeasure Optimal Plan Safety Only Plan
Predictable &
Reliable
Availability 1
Train
Availability 2
Train
99%
97%
97%
95%
• All assets clearly age and the Track Transit System (TTS) will, during
H7 reach its mid life point. Because of this occurrence, there will be
several elements of the system that will require replacement in order to
maintain the appropriate levels of service. Important to note, is that
these elements are not included as capex in either of the proposed
plans, as HAL states they do not have a risk rating as a minimum of
“medium”.
• In the Optimal Plan HAL account for an Enhanced Service Overlay that
as stated, can mitigate the residual risk of failure and maintain the Q6
target as a consequence. The Safety Only Plan does not include this
overlay and as a result HAL has reduced the targets.
• The charts to the right show that since 2008 on an annual score
basis, HAL has exceeded the SQRB target every year for both 1 and
2 train availability, though it fell below the 2-train availability target for
1 month during this period.
• Given the strong historic annual performance score, there is a case
for considering these measures for further stretch in H7, albeit there is
less scope for the 1 Train measure as this target is already at 99%.Source: HAL data, Arcadis analysis
© Arcadis 202119 November 2021 30

OBR Target Assessment | TTS
Evidence Appraisal Conclusion
HAL has stated that they can continue to operate and maintain the TTS
under the safety only plan but there will be an increased risk of more
frequent outages and possible risk of longer time out of service. The
safety only plan would also not allow them to carry out dead-banding
activities.
Without the Enhanced Service Overlay (ESO), HAL says it will not be
able to maintain the TTS to the level they would want, Consequently,
HAL considers there is an increased risk of the service being disrupted
due to more frequent failures and potentially greater downtime per
frequency. HAL would be able to use the ESO to further improve the
maintenance regime and leverage economies of scale when accessing
the equipment such as Tunnel Ventilation Control System (TCVS) fans
which need attention. The TCVS as an example has multiple fans which
need attention. In order to access the fans the service needs to be
switched off. This can take around 4 hours for each maintenance
window. As the CAA has made an allowance for an ESO in its Initial
Proposals in October 2021, the risk HAL states under the Safety Only
plan is considered as being mitigated.
HAL has stated that the asset requires more intensive maintenance given
it has gone beyond its 10 year asset window.
It is recommended by the manufacturers that the maintenance regime is
be enhanced as once the asset goes beyond 10 years the bearings as an
example will need replacing in all TCVS fans. All fans are showing signs
of vibration. Fan 3 is at high risk.
HAL has not provided any detailed modelling but has provided annual
occasions and minutes downtime over the last 10 years which shows the
level of disruption. In 2020 the service was down for most of the time but
this is clearly explained by HAL’s own energy saving initiative and the
impact of the global pandemic. An ESO as a concept is considered
reasonable to maintain the reliability of the assets in question and
importantly should be noted that the CAA has made an allowance for the
ESO in its H7 Initial Proposals which could therefore mitigate the risk of
asset failure and make the Optimal Plan/Q6 target achievable.
© Arcadis 2021 19 November 2021 31

© Arcadis 2021
OBR Target Assessment | Baggage System Reclaim Availability – Arrivals Carousel
16 November 2021 30
Consumer Outcome Measure Optimal Plan Safety Only Plan
Comfortable and
secure
Baggage System
Reclaim Availability –
Arrivals Carousel
99% 98%
• The Optimal Plan target for baggage reclaim SQRB performance is 99% compared to the Safety Only Plan of 98%.
• The historical data for 2008-2021 clearly indicates that across all terminals, the airport has been performing above the baggage reclaim target of 99%.
• HAL is not proposing any expenditure for replacement of its baggage reclaim assets. However, they have requested additional opex through the Enhanced Service Overlay to mitigate the risk of asset failure.
• Without the overlay in the Safety Only Plan, HAL forecasts a drop in service levels across both baggage reclaim availability for H7. The rationale for this is around the age of the assets. By start of H7, the majority of baggage carousels in T3 and T4 will be over 25 years old and at the end of their asset life. T5 carousels will be 18 years old by the end of H7. With greater age, there is increased risk associated with outages or failures of the equipment.
• The Optimal Plan mitigates against the risk of equipment outages with the Enhanced Service Overlay, which allows for increased maintenance / inspection regimes. Without the overlay in the Safety Only Plan, HAL says that it will not be able to achieve this maintenance frequency, which will increase the risk of asset failure occurring. It should be noted that the CAA has made an allowance for the ESO in its H7 Initial Proposals which could mitigate the risk of asset failure.
Source: HAL data, Arcadis analysis
19 November 2021© Arcadis 2021 32

© Arcadis 2021
OBR Target Assessment | Baggage System Reclaim Availability – Arrivals Carousel
16 November 2021 31
Evidence Appraisal Conclusion
HAL says that across the Heathrow
campus, the baggage reclaim
infrastructure is either approaching or
exceeding its expected life, which
increases the risk of asset failure.
The rationale of ageing baggage reclaim assets can be justified in T3 and T4, which are the oldest terminal
buildings. We do not think that the same rationale could be applied to T2 and T5 as these facilities have
been opened within the last 10-15 years, and we would expect that there has been ongoing maintenance /
inspection regimes of the baggage reclaim assets to date.
HAL says that the reclaim assets in
T3 that are proposed for replacement
are more than 50 years old – reclaim
units 3 and 8. These have the lowest
baggage throughput in T3 but the
highest rate of maintenance resource
utilisation.
Whilst we would accept that the original footprint of the unit is 50 years old, we would conclude that the
systems and relevant components are not as old as HAL is suggesting. The reason being, that components
within the reclaim units have been replaced over time with new parts.
According to HAL, 80% of components in the reclaim units are non-original. The percentage of replaced
components suggests that the reclaim assets are in reasonably good condition. The last major overhauls
took place in 2012 and 2013 for reclaim units 3 and 8.
We think that the degradation suggested by HAL is less likely because of the reclaim assets and
components having been refurbished or replaced over time. This suggests that the increased frequency of
maintenance / inspection regimes that HAL has said would be required, may not be necessary across the
whole campus.
HAL says that unavailability of
baggage reclaim assets due to
unserviceability will have a
detrimental impact on passenger
service.
We asked HAL about its contingency process if reclaim units are unavailable. Standard practice is that only
a single flight is allocated to a reclaim unit. Two flights could be squeezed on to a single reclaim with
resilience resource deployed to offload and pen bags using available floor space. Reclaim units 3 and 8 are
deemed to be fragile and cannot be used to double stack bags due to the risk of breakages. According to
HAL, this reduces reclaim capacity by 50% and lowers the ability to use units 3 and 8 for contingency if
other belts are taken out of service.
This potentially explains the reduction in target between the Safety Only and Optimal plan of 1%. Without
some additional opex via the resilience component of the Enhanced Service Overlay, there is the
expectation they will not be able to maintain the ageing assets as thoroughly, which increases the risk of
equipment becoming unserviceable more frequently. It should be noted that the CAA has made an
allowance for the ESO in its H7 Initial Proposals which could therefore mitigate the risk of asset failure and
make the optimal/Q6 target achievable.
The contingency process potentially provides some resilience although it is not ideal from an operational or
passenger experience perspective.
© Arcadis 2021 19 November 2021
33

OBR Target Assessment | Wi-Fi performance
Consumer
OutcomeMeasure Optimal Plan Safety Only Plan
Enjoyable
experienceWi-Fi Performance 4.00 3.93
• Consumer expectations of Wi-Fi performance at airports are shaped
and informed by passengers own experiences of Wi-Fi that they
experience in their day to day lives outside of the airport environment.
HAL has upgraded their Wi-Fi performance twice in the last decade to
keep pace with consumer expectations.
• HAL saw satisfaction levels with the service decline by 0.07 prior to
any upgrades being deployed and then subsequently recover once the
new service was introduced.
• In the Optimal Plan HAL plans to upgrade their Wi-Fi service (captured
under “Commercial Revenue Generation” programme). This upgrade
HAL believes, will enable them to achieve their Q6 target
• Under the Safety Only Plan HAL would have their existing Wi-Fi
capability until at least 2027, which they say will leave them “lagging
behind consumer expectations”. HAL therefore forecast a drop in
satisfaction below Q6 levels.
• Current performance suggests a QSM score of circa 4.20-4.25 in the
period 2020/21 and rising in 2021/22 except for T2 which has seen a
0.05 reduction.
• Currently this metric is for reporting purposes only and does not have
an SQRB target or attract financial incentives. For H7 Arcadis has
been advised that this will become a measure with a target and
financial incentive.Source: HAL data, Arcadis analysis
© Arcadis 2021 19 November 2021
H7 Optimal Plan Target
at 4.00 used as proxy in absence of
Q6 target
34

OBR Target Assessment | Wi-Fi Performance
© Arcadis 2021 19 November 2021
Evidence Appraisal Conclusion
• In the Safety Only Plan HAL will have existing Wi-Fi capability until at
least 2027, which they say will leave them lagging behind consumer
expectations. HAL therefore forecast a drop in satisfaction below Q6
levels.
• The SQRB score for Wi-Fi has been above the optimal plan target
(4.0) every year since 2015/16. It is recognised that passengers
regard Wi-Fi as somewhat of a hygiene factor and just expect it to be
available, reliable and of an appropriate speed.
• Under the Safety Only Plan HAL is proposing a drop of c0.25 based
on 2020/21 levels. This seems at odds with HAL’s own metric of a
c0.07 drop in SQRB score prior to any upgrades the airport had
previously introduced.
• The degradation of 0.07 between the plans could be explained by the
inability to upgrade the infrastructure but as stated above this should
be reflected from the current performance level and not downgrading
from the Q6 average of c4.09. Current performance as at August 2021
is c4.20-4.30 across the operational terminals, with existing
infrastructure, but recognising lower passenger volumes may help to
provide improved connections and bandwidth which could be reflected
in these higher scores.
• The degradations HAL suggests do not therefore appear to take into
account the current level of service offered and suggests the levels
proposed by HAL under either plan could be seen as a worst case
scenario.
• Please see slide 45 which discusses options for potential stretch
beyond the optimal plan target.
35

OBR Target Assessment | Overall Satisfaction
Measure2019
performanceOptimal Plan Safety Only Plan
Overall
Satisfaction 4.24 4.26 4.17
• The Optimal Plan Target in H7 is 4.26. In comparison the Safety Only Plan is lower at 4.17.
• Historic SQRB performance data is not available for overall satisfaction as this is a new proposed reputational OBR measure. However, HAL’s 2019 performance is set at 4.24.
• We also note that HAL’s QSM performance data in recent months is as follows:
• June 2021 - overall departures satisfaction was 4.42 and for arrivals was 4.33
• May 2021 -overall departures satisfaction was 4.39 and for arrivals was 4.42
• April 2021 - overall departures satisfaction was 4.44 and for arrivals was 4.22
• March 2021 - overall departures satisfaction was 4.27 and for arrivals was 4.10
• HAL’s most recent performance on overall satisfaction would indicate that HAL is exceeding the optimal plan target in 3 of the 4 months shown above, with only March being below 2019 performance level. This further emphasises the point that historic and current/recent performance is not being taken into account sufficiently when HAL has set its proposed target, albeit set against lower passenger volumes due to the pandemic potentially leading to inflated scores in the period 2020/21.
© Arcadis 2021 19 November 2021
36

OBR Target Assessment | Overall Satisfaction
© Arcadis 2021 19 November 2021
Evidence Appraisal Conclusion
Key areas that drive overall satisfaction will see either improvements or
deterioration in H7 depending on which plan is delivered. In its Updated
Business Plan, HAL states that the cumulative impact of reduced targets
in its safety only plan for measures including security, wayfinding,
cleanliness, Wi-Fi, baggage reclaim (availability) and T5 TTS will lead to
a reduce target of 4.17
Overall satisfaction is a culmination of consumer satisfaction in other
areas. The degradation from 4.24 to 4.17 is caused by different
measures having lower targets in the Safety Only Plan compared to the
Optimal Plan. Each measure is covered off individually but overall, the
degradation is not supported based on the evidence seen.
To provide more detail, if one considers the degradation seen under
Security areas as an example for the Safety Only Plan, this is not
supported by the analysis seen to date. As such any knock on effect this
has on Overall Satisfaction must therefore also be challenged and
deemed unreasonable. When other areas such as Cleanliness and
Wayfinding are then also factored in, it becomes clear that the Safety
Only Plan target at 4.17 is not reasonable on the basis of the CAA’s Initial
Proposals where opex allowances are included, thus mitigating some of
the risks identified by HAL.
Over H7 an Optimal Plan will, relative to a Safety Only Plan, mean:
• 4.9 million more passengers will experience a Very Good or Excellent
journey (ASQ score 4 & 5)
• 2 million fewer passengers will experience a Poor or Fair journey
(ASQ scores 1 & 2)
Based on the historical data which shows that HAL is achieving between
4.1 and 4.2 for Overall Satisfaction,(this is the ASQ score which is on
a different scale to the QSM score that will be used for OBR), it is
reasonable to assume that the Optimal Plan in H7 could lead to this
projected number of passengers experiencing a Very Good or
Excellent journey.
It is advisable that HAL provides more evidence to support this
statement.
37

OBR Target Assessment | PRS / PRM
Customer
Satisfaction
2019
PerformanceOptimal Target
Safety Only
Target
Cared for and
supported
3.95*
*April 2019 –
March 2020)
4.00 3.92
• The Optimal Target is 4.00 compared to a Safety Only Target of 3.92. HAL’s 2019 performance was 3.95 between April 2019 – March 2020. Under the Optimal Plan, the indication is that PRS / PRM satisfaction would increase, whilst under the Safety Only Plan, satisfaction would decrease. The Safety Only Plan target is 0.03 less than its 2019-2020 performance. The Safety Only Plan allows for business as usual for PRS / PRM services to be provided. Therefore, it is difficult to reconcile why HAL’s position is that there would be a degradation in service / satisfaction.
• The most recent PRS / PRM performance indicates that HAL’s performance is well above target;
• June 2021 – Total (4.78); Departures (4.76); Arrivals (4.80); Connections (4.83); Staff Satisfaction (4.78)
• August 2021 – Total (4.62); Departures (4.58); Arrivals (4.70); Connections (4.59); Staff Satisfaction (4.62)
• It would be reasonable to assume that HAL has not sufficiently considered the historical and current performance in setting their targets for H7. Based on the recent performance (see above), it is not clear why HAL would set a lower target of 4.00. Furthermore, we would also question why the 2019-2020 performance of 3.95 cannot be achieved in H7 without the Enhanced Service Overlay (Safety Only Target of 3.92).
• Notwithstanding reduced passenger volumes over the last 18 months, it would be rational to conclude that the service providers operation would be scaled back to reflect demand so current performance is not through over resourcing but perhaps reflective of a less congested airport environment, but still the recent scores shown above are significantly higher than those proposed under either HAL plan.
Source: HAL data
© Arcadis 2021 19 November 2021
Chart goes up to 2019 – the score of 3.95 is for the period Apr
2019 to Mar 2020 which is not shown on the chart
38

OBR Target Assessment | PRS / PRM
© Arcadis 2021 19 November 2021
Evidence Appraisal Conclusion
The position from HAL is that the Optimal Plan would provide
the necessary enhanced service overlay to improve PRM
service offering. The overlay would provide for retail
engagement tools and a personal digital system (buzzer
system), estimated at £2.5m for rollout.
HAL has stated that the proposed personal digital system are not considered to be
safety critical and therefore would not be delivered without the Optimal Plan. Such
a system offers the means to provide PRM / PRS passengers with dignity and care
and therefore we would challenge why HAL considers this could not be delivered in
the Safety Only Plan. To date, HAL has not provided substantial evidence as to
why the £2.5m to deliver this system could not be made available in the Safety
Only Plan budget
HAL has said that a Safety Only Plan will result in the gains
made in the last few years being eroded.
HAL’s position is that in a Safety Only Plan, PRM / PRS will be more adversely
affected at multiple points in their Heathrow journey compared to non assistance
users. The assumption is that other points within the journey such as check-in,
security, connections, will offer a less satisfactory service under a Safety Only
Plan. Whilst this is reasonable, we observe that HAL has not been able to model
the impact of this on PRM / PRS. The graph on slide 38 shows that overall
satisfaction for users of the PRM service increased between 2015-2019. Without
the modelling, so it is not clear as to why HAL suggest gains will be eroded.
HAL has told us that decreasing satisfaction has been driven
by a decrease in personal space for PRM / PRS users.
Reduced passenger numbers following Covid-19 suggests that the terminal
facilities will have less operating constraints during H7. HAL has said that they do
not expect PRM space to be constrained until passenger numbers return to
approximately 70 million, which is not likely to occur until at least 2025 based on
current forecasts. It is more likely that with increased space, satisfaction rates will
remain constant, or not decrease.
HAL has told us that PRS / PRM service decline based on an
increased need for personal space.
From our engagement with HAL, we understand that PRS who use assistance
services account for a very small percentage of all passengers. If passenger traffic
is expected to be lower in H7, this would imply that the number of PRS will also be
lower placing less demand on the services. If there is less demand for the
provision of PRS / PRM services over the course of H7, would the service levels
actually decline and does this mean that performance standards could be
maintained? If so, then this raises the question of why the Optimal Plan target
cannot be delivered, especially when considering the current / historical
performance.
39

Airline Feedback
© Arcadis 2021 19 November 2021
• A feedback session was convened with the airline community on 20th September 2021 to seek their views on HAL's proposed OBR targets.
The session was attended by British Airways, Virgin, Star Alliance and the AOC.
• Airlines have concerns over the lack of data and modelling that has been shared to date that substantiates either of the business plans HAL
has proposed. This has caused delays in being able to progress the H7 plans.
• On security specifically but not exclusively, the airlines need far more information on what each of the capital spend categories actually
represent especially when viewed against HAL’s own pilot lanes (costing £2m/lane) and market benchmark information suggesting lower
investment would be required for the scanners and x-rays. Once this information is available, then more constructive dialogue can take place.
• Airline engagement appeared to endorse the benchmarking position Arcadis has concluded on the Security programme whereby the £420m
in the Safety Only Plan, would be more than sufficient to procure and commission all 163 lanes at the airport in order to make them compliant
with sufficient spend to also make a contribution in part or in full to the compliance and transformation programmes as/if required. The airlines
note that they are unclear as to why the level of spend is so high across the security program as HAL has provided very few details.
• The airlines also noted their September 2021 Capital Plan submission which set out their views on the costs per security lane. Accordingly,
the airlines’ current view is that £244m is sufficient spend to replace all 163 security lanes and that they have not had seen information from
HAL to understand why the total should be any higher than that. The airlines noted if there are requirements for further spend, they would
assess those requirements when presented.
• It is understood from liaising with airlines representatives subsequently, that a site visit took place at the airport with the security equipment
manufacturers, HAL staff and airline representatives. The purpose of the visit was conveyed as being to better understand the
challenges/opportunities to accommodate the new technology into the search areas. This collaboration is welcomed and encouraged but no
substantive conclusions can be drawn from it at this stage and it should be noted that Arcadis was not present at the session.
• The airlines continue to work with HAL to formulate a way forward and continue to seek greater insight.
40

Target stretch analysis
Areas for further consideration(Q6 scores drawn from HAL QSM data – score is annual average from available data over the Q6 time frame*)
*Some terminal specific data is missing for certain years, results are still considered reflective of overall performance
• The following slides seek to build upon the earlier analysis and demonstrate where HAL may reasonably exceed their suggested targets and so be in scope for further stretch
© Arcadis 202119 November 2021
41
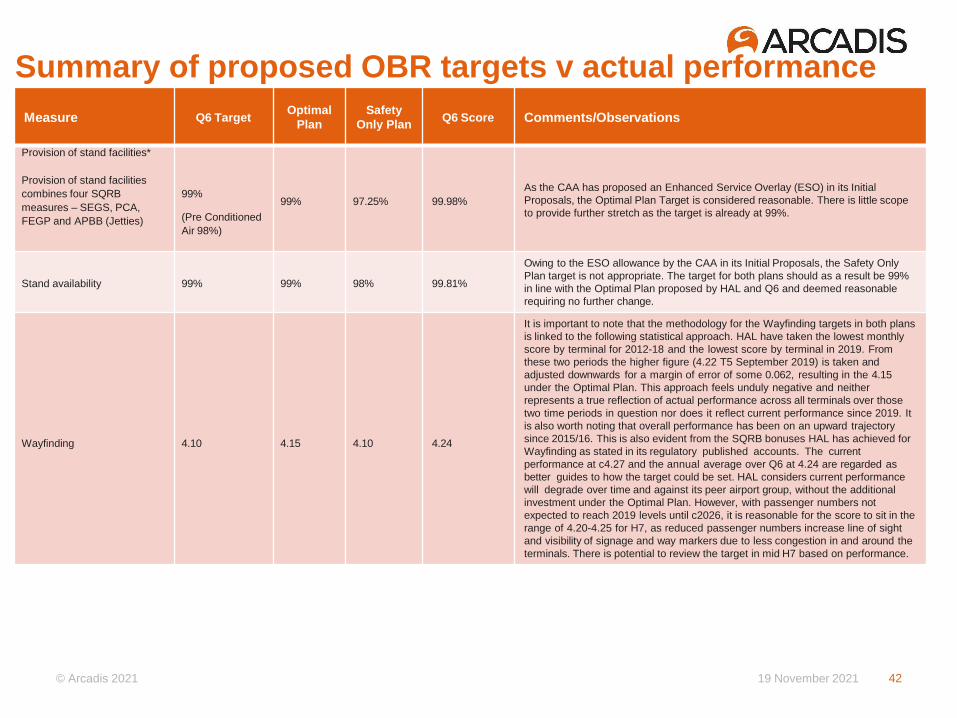
Summary of proposed OBR targets v actual performance
© Arcadis 2021 19 November 2021
Measure Q6 TargetOptimal
Plan
Safety
Only PlanQ6 Score Comments/Observations
Provision of stand facilities*
Provision of stand facilities
combines four SQRB
measures – SEGS, PCA,
FEGP and APBB (Jetties)
99%
(Pre Conditioned
Air 98%)
99% 97.25% 99.98%
As the CAA has proposed an Enhanced Service Overlay (ESO) in its Initial
Proposals, the Optimal Plan Target is considered reasonable. There is little scope
to provide further stretch as the target is already at 99%.
Stand availability 99% 99% 98% 99.81%
Owing to the ESO allowance by the CAA in its Initial Proposals, the Safety Only
Plan target is not appropriate. The target for both plans should as a result be 99%
in line with the Optimal Plan proposed by HAL and Q6 and deemed reasonable
requiring no further change.
Wayfinding 4.10 4.15 4.10 4.24
It is important to note that the methodology for the Wayfinding targets in both plans
is linked to the following statistical approach. HAL have taken the lowest monthly
score by terminal for 2012-18 and the lowest score by terminal in 2019. From
these two periods the higher figure (4.22 T5 September 2019) is taken and
adjusted downwards for a margin of error of some 0.062, resulting in the 4.15
under the Optimal Plan. This approach feels unduly negative and neither
represents a true reflection of actual performance across all terminals over those
two time periods in question nor does it reflect current performance since 2019. It
is also worth noting that overall performance has been on an upward trajectory
since 2015/16. This is also evident from the SQRB bonuses HAL has achieved for
Wayfinding as stated in its regulatory published accounts. The current
performance at c4.27 and the annual average over Q6 at 4.24 are regarded as
better guides to how the target could be set. HAL considers current performance
will degrade over time and against its peer airport group, without the additional
investment under the Optimal Plan. However, with passenger numbers not
expected to reach 2019 levels until c2026, it is reasonable for the score to sit in the
range of 4.20-4.25 for H7, as reduced passenger numbers increase line of sight
and visibility of signage and way markers due to less congestion in and around the
terminals. There is potential to review the target in mid H7 based on performance.
42

Summary of proposed OBR targets v actual performance
© Arcadis 2021 19 November 2021
Measure Q6 TargetOptimal
Plan
Safety
Only
PlanQ6 Score Comments/Observations
Central search queue time
% queue times < 5 mins
% queue times < 10 mins
95.00%
99.00%
95.00%
99.00%
33%-75%
46%-89%
96.99%
99.84%
Given the evidence shared by HAL to date, it is believed that HAL could
procure sufficient lane equipment to have all lanes compliant. What is less
clear is by what date this could be achieved given the 1.5-year lead time on
the project as advised by HAL. The range suggested by HAL under the
Safety Only Plan appears to have little or no substantive evidence to
robustly support it. More data is required but without more information it is
hard to see anything other than the current Q6 and Optimal Plan targets as
being appropriate. Current and historic performance is strong and
consistently above target on average, notwithstanding T2 falling below
target in 2020/21 based on QSM data seen for <5 mins queue time. There
is little room for further stretch for the 10-minute queue time given it is
already at 99%. The Optimal Plan targets for both measures are therefore
considered appropriate.
Transfer search queue time
% queue times < 10 mins95.00% 95.00% 46%-89% 98.09%
Opportunity to continue to achieve 96-97% given strong historic
performance. Again, consideration must be given in the early part of H7 to
the disruption from the security compliance transformation programme,
notwithstanding T3 and T5 being very close to and on occasion, slightly
below target in the period 2012-2015. The prudent view may be to defer
any possible stretch for this measure owing to the disruption from the
security compliance programme.
Staff search queue time %
queue times < 10 mins95.00% 95.00% 46%-89% 98.79%
Opportunity to maintain 96-97% given strong historic performance,
notwithstanding T5 performing c3.0%pts lower than the other terminals
during the period 2013/14 to 2019/20. Again, consideration must be given
in the early part of H7 to the disruption from the security compliance
transformation programme. There is potential to use staff search as a test
case for any target stretch. The prudent view may be to defer any possible
stretch for this measure owing to the disruption from the security
compliance programme.
Control post vehicle Queue
Time % vehicle queue
times < 15 mins95.00% 95.00% 46%-89% 96.29%
In line with Central search <5 mins rationale, control posts have performed
well historically so there is potential to uplift metric to 95%-96% or consider
reducing the time band from 15 minutes downwards. Will be an impact from
the transformation programme which again must be factored into any
stretch proposal considerations. We understand there are ongoing
stakeholder discussions relating to control posts but as with other areas,
the prudent view may be to defer any possible stretch for this measure
owing to the disruption from the security compliance programme.43

Summary of proposed OBR targets v actual performance
© Arcadis 2021 19 November 2021
Measure Q6 TargetOptimal
Plan
Safety
Only
PlanQ6 Score Comments/Observations
Availability of lifts,
escalators, travellators
(renamed from PSE)99% 99% 97% 99.64
As the CAA is allowing an Enhanced Service Overlay (ESO), the Safety
Only Plan target is no longer applicable. As such the target for both plans
should be 99%. The CAA has recognised the criticality of the assets and
the need for enhanced maintenance which should therefore enable HAL to
achieve 99% as per their rationale for the Optimal Plan target. 99%
deemed appropriate – no change required from Q6 target or Optimal Plan
for H7 as target is already 99% and therefore there is little scope for further
stretch.
TTS Availability 1 train
TTS Availability 2 train
99%
97%
99%
97%
97%
95%
99.96
99.47
1 Train Q6 Targets and therefore the Optimal Plan for H7 are deemed
appropriate owing to the fact the CAA has granted a quantum of the ESO
requested by HAL under the Optimal Plan and there is also little scope for
stretch beyond 99%. 2 Train targets could reasonably be increased to a
range from 97.00% to 99.00% based on the ESO being allowed in part and
historic annual performance being in excess of target on an annual average
basis in Q6 and on that same basis, above 98.50% every year since 2010.
The CAA ESO proposed allowance mitigates the degradation in the target
percentage seen under the Safety Only Plan for the 2-train availability
target.
Cleanliness 4.00 4.05 4.00 4.25
With the Covid overlay the CAA has allowed in its Initial Proposals there
would appear to be scope for uplift based on performance throughout Q6
(which was comfortably above target and improving over time in T3-T5,
and notably above target in T2) and lower passenger numbers than 2019
with passenger levels not expected to match 2019 levels until possibly
2026. HAL are currently achieving scores in the region of 4.30+ with a
continuous positive trajectory making the 4.05 suggested under the
Optimal Plan seem unduly low and a contender for uplift to a range of 4.20-
4.30 which aligns with recent performance and is therefore considered
achievable and reasonable.
Pier served stand usage 95% 95% 94% 98.80%
As a minimum, the Q6 target should be maintained but historic
performance has been consistently strong achieving 97.77% in 2019 and
as an average 98.80% during Q6. Given this and the lower passenger
numbers in early H7 and the proposed ESO assisting with asset
maintenance, there is scope to increase this target to a range from 95.00%
to 97.00%, notwithstanding T3 being close to target in 2017-2019 as seen
previously.
44

Summary of proposed OBR targets v actual performance
© Arcadis 2021 19 November 2021
Measure Q6 TargetOptimal
Plan
Safety
Only
PlanQ6 Score Comments/Observations
Baggage system reclaim
availability99% 99% 98% 99.68
As the CAA is allowing an Enhanced Service Overlay (ESO), the Optimal Plan target
is reasonable. As such 99% continues to be achievable. The CAA has recognised the
criticality of the assets and the need for enhanced maintenance which should
therefore enable HAL to achieve 99% as per their rationale for the Optimal Plan
target. 99% deemed appropriate – no change required from Q6 target or Optimal Plan
for H7 as the target is already 99% and therefore there is little scope for further
stretch.
Wi-Fi performance N/A 4.00 3.93 4.09
There is no financial incentive to date but there is little evidence to substantiate any
drop in performance from Q6 actuals, at on average 4.09. With lower passenger
numbers in the early part of H7, the availability and speed of Wi-Fi should be less
impacted and a drop below the Q6 level would need further substantiation. Given
rising customer expectations around Wi-Fi, it is suggested that the Wi-Fi performance
could be between c4.00-4.20 with current actual c4.19 suggesting this is reasonable
and achievable based on historic degradations (c-0.07) evidenced when upgrades do
not occur. The Optimal Plan should therefore be seen as the minimum.
Overall satisfaction 4.24 * 4.26 4.17
May 2021
4.39 Departures
4.42 Arrivals
The Optimal Plan target (4.26) when compared to 2019 average performance at 4.24
suggests the Safety Only plan is not justified, particularly considering the CAA has
made an allowance for the ESO. The suggested target for H7 is 4.26, acknowledging
more information is required around security compliance based on trial data and
configuration modelling which would likely have a direct impact on Overall
Satisfaction. There might be scope for further stretch beyond the optimal target if
performance continues at the current May 2021 level in establishing a longer-term
trend, but we also note that performance may have been temporarily increased
through the significant reduction in passengers. Currently the Optimal Plan target is
considered reasonable but should be reviewed based on any further data surrounding
the security transformation plan that is made available. The May 2021 scores shown
left are likely to have been positively affected by lower passenger volumes.
Departure flight punctuality 78.4%* 80.5% 78.4% 2019 – 78.4%
The Optimal Plan target should be considered based on recent performance and
ESO to enhance stand facilities which will impact in this metric. It is recognised that
much falls outside of HALs direct control and this is factored into the rationale for
recommending the adoption of the Optimal Plan target.
* Figures based on 2019 performance
45

Summary of proposed OBR targets v actual performance
© Arcadis 2021 19 November 2021
Measure Q6 TargetOptimal
Plan
Safety
Only
PlanQ6 Score Comments/Observations
PRS satisfaction3.95 (April 2019
– March 2020)*4.00 3.92
April 2019 –
Mar 2020 @
3.95
August 21 @
4.62
The Optimal Plan target at 4.00 is deemed as being achievable but given
recent performance in August 2021 at 4.62 and the score of 3.95 April
2019 to March 2020, then the Optimal Plan target should be viewed as this
measures baseline. It is recognised that the recent 2021 scores will be
affected by lower passenger volumes due to Covid-19 but given the
significance of the gap between the August 2021 score and the Optimal
Plan Target, it is considered that there is scope for some further stretch.
* Figures based on 2019/20 data
46

Overall conclusion - summary
© Arcadis 2021 19 November 2021
• The approach from HAL to this piece of work has been collaborative and engaging, but often the level of detail required to substantiate a position taken has been either lacking or not available.
• Where HAL has been able to provide sufficient evidence to support a metric, then this has been acknowledged in our findings for each category.
• There seems to have been an approach from HAL in not sufficiently recognising its historic and current levels of performance when setting targets for either plan in H7. Taking Wayfinding as an example, HAL has exceeded the SQRB target every year, using annual data, including when the target was raised in 2014, indicating a long-termupwards trajectory of improved performance. Even under the Optimal Plan at 4.15, this target is still below thecurrent performance level of c4.20+. So, despite more investment HAL is suggesting performance/satisfactionwould drop.
• On Security, there needs to be more transparency and where it is possible HAL should share any modelling and trial data at the earliest opportunity to enable all stakeholders to form views on expected performance and therefore the appropriate metrics to set as OBR targets. With the trials not concluding until June 2022, the data provided to date to support the Safety Only Plan is rather subjective and falls short of providing substantive evidence as to the range proposed by HAL. Benchmarking data would suggest HAL has sufficient funds in the Safety Only Plan to provide compliant lanes across its campus albeit set against a challenging delivery programme.
• Some areas such as Baggage Reclaim, Stand Facilities and TTS where an Enhanced Service Overlay has been requested by HAL under the Optimal Plan, the evidence provided was adequate to form a view that some additional opex via the ESO would be beneficial to overall service levels and reliability of the assets and services in question and is therefore deemed reasonable as a concept. It should be noted that the CAA has made an allowance for opex overlays in their Initial Proposals published in October 2021.
47

Overall conclusion – summary (continued)
© Arcadis 2021 19 November 2021
• Some areas have been identified that would warrant more stretching targets. This view is principally based on strong historic performance, lower passenger volumes anticipated in the early years of H7, and the CAA’s Initial Proposals to include some form of Enhanced Service Overlay. HAL has clearly performed well against several SQRB measures in Q6 and as such it would be appropriate to review these measures in particular and set them at a level that is challenging to the operator but also and importantly deemed to be realistic and achievable.
• In conclusion, HAL needs to provide greater visibility of any substantive evidence to demonstrate and justify its current position of service degradation under the Safety Only Plan against current service performance and the Optimal Plan. The current dynamic of operating on a year to year basis since Q6 appears to be constraining development of the services with HAL unable to set a clear strategy for service delivery given the uncertainty surrounding the regulatory settlement for H7. Whilst entirely understandable, this should only serve to encourage HAL to provide as much data and evidence as possible, as soon as possible.
48


