Embed Size (px)
Citation preview

arX
iv:1
310.
8150
v1 [
astr
o-ph
.HE
] 3
0 O
ct 2
013
Observation of Markarian 421 in TeV gamma rays over
a 14-year time span
V. A. Acciaria,b, T. Arlenc, T. Auned, W. Benbowb, R. Birde, A. Bouvierd,S. M. Bradburyf, J. H. Buckleyg, V. Bugaevg, I. de la Calle Perezh,D. A. Carter-Lewisi, A. Cesarinij, L. Ciupikk, E. Collins-Hughese,
M. P. Connollyj, W. Cuil, C. Dukem, J. Dummn, A. Falconeo, S. Federicip,q,D. J. Fegane, S. J. Feganr, J. P. Finleyl, G. Finnegans, L. Fortsonn, J. Gaidosl,
N. Galanteb, D. Gallt, K. Gibbsb, G. H. Gillandersj, S. Griffinu, J. Grubek,G. Gyukk, D. Hannau, D. Horanr, T. B. Humenskyv, P. Kaarett,
M. Kertzmanw, Y. Khassene, D. Kiedas, H. Krawczynskig, F. Krennrichi,M. J. Langj, J. E. McEneryx,y, A. S. Madhavani, P. Moriartya,∗, T. Nelsonn,
A. O’Faolain de Bhroithee, R. A. Ongc, M. Orri, A. N. Ottez,J. S. Perkinsaa,ab, D. Petryac, A. Pichelad, M. Pohlp,q, J. Quinne, K. Raganu,
P. T. Reynoldsae, E. Roacheb, A. Roveroad, M. Schroedterb, G. H. Sembroskil,A. Smiths, I. Telezhinskyp,q, M. Theilingl, J. Tonerj,1, J. Tyleru, A. Varlottal,
M. Vivieraf, S. P. Wakelyag, J. E. Wardg, T. C. Weekesb,∗∗, A. Weinsteini,R. Welsingp,q, D. A. Williamsd, S. Wisselc
aSchool of Science, Galway-Mayo Institute of Technology, Dublin Road, Galway, IrelandbFred Lawrence Whipple Observatory, Harvard-Smithsonian Center for Astrophysics,
Amado, AZ 85645, USAcDepartment of Physics and Astronomy, University of California, Los Angeles, CA 90095,
USAdSanta Cruz Institute for Particle Physics and Department of Physics, University of
California, Santa Cruz, CA 95064, USAeSchool of Physics, University College Dublin, Belfield, Dublin 4, Ireland
fDepartment of Physics, University of Leeds, Leeds, LS2 9JT, Yorkshire, England, UKgDepartment of Physics, Washington University, St. Louis, MO 63130, USA
hEuropean Space Astronomy Center, 28080 Villafranca del Castillo, Madrid, SpainiDepartment of Physics and Astronomy, Iowa State University, Ames, IA 50011, USA
jSchool of Physics, National University of Ireland Galway, University Road, Galway, IrelandkAstronomy Department, Adler Planetarium and Astronomy Museum, Chicago, IL 60605,
USAlDepartment of Physics, Purdue University, West Lafayette, IN 47907, USAmDepartment of Physics, Grinnell College, Grinnell, IA 50112-1690, USA
nSchool of Physics and Astronomy, University of Minnesota, Minneapolis, MN 55455, USAoDepartment of Astronomy and Astrophysics, 525 Davey Lab, Pennsylvania State
University, University Park, PA 16802, USApInstitute of Physics and Astronomy, University of Potsdam, 14476 Potsdam, Germany
qDESY, Platanenallee 6, 15738 Zeuthen, GermanyrLaboratoire Leprince-Riguet, Ecole Polytechnique, CNRS/IN2P3, Palaiseau, France
sDepartment of Physics and Astronomy, University of Utah, Salt Lake City, UT 84112,USA
∗Principal corresponding author∗∗Corresponding author
Email addresses: [email protected] (P. Moriarty),[email protected] (T. C. Weekes)
1Current address: Valeo Vision Systems, Tuam, Co. Galway, Ireland
Preprint submitted to Elsevier December 16, 2013

tDepartment of Physics and Astronomy, University of Iowa, Van Allen Hall, Iowa City, IA52242, USA
uPhysics Department, McGill University, Montreal, QC H3A 2T8, CanadavDepartment of Physics and Astronomy, Barnard College, Columbia University, NY 10027,
USAwDepartment of Physics and Astronomy, DePauw University, Greencastle, IN 46135-0037,
USAxNASA Goddard Space Flight Center, Greenbelt, MD 20771, USA
yDepartment of Physics and Department of Astronomy, University of Maryland, CollegePark, MD 20742, USA
zSchool of Physics and Center for Relativistic Astrophysics, Georgia Institute ofTechnology, 837 State Street NW, Atlanta, GA 30332-0430, USA
aaCRESST and Astroparticle Physics Laboratory NASA/GSFC, Greenbelt, MD 20771, USAabUniversity of Maryland, Baltimore County, 1000 Hilltop Circle, Baltimore, MD 21250,
USAacALMA Regional Centre, ESO, Karl-Schwarzschild-Strasse 2, 85748 Garching, Germany
adInstituto de Astronomıa y Fısica del Espacio, Casilla de Correo 67 - Sucursal 26(C1428ZAA), Ciudad Autonoma de Buenos Aires, Argentina
aeDepartment of Applied Physics and Instrumentation, Cork Institute of Technology, Cork,Ireland
afDepartment of Physics and Astronomy and the Bartol Research Institute, University ofDelaware, Newark, DE 19716, USA
agEnrico Fermi Institute, University of Chicago, Chicago, IL 60637, USA
Abstract
The variability of the blazar Markarian 421 in TeV gamma rays over a 14-yeartime period has been explored with the Whipple 10 m telescope. It is shown thatthe dynamic range of its flux variations is large and similar to that in X-rays. Acorrelation between the X-ray and TeV energy bands is observed during somebright flares and when the complete data sets are binned on long timescales. Themain database consists of 878.4 hours of observation with the Whipple telescope,spread over 783 nights. The peak energy response of the telescope was 400 GeVwith 20% uncertainty. This is the largest database of any TeV-emitting activegalactic nucleus (AGN) and hence was used to explore the variability profileof Markarian 421. The time-averaged flux from Markarian 421 over this periodwas 0.446±0.008 Crab flux units. The flux exceeded 10 Crab flux units on threeseparate occasions. For the 2000–2001 season the average flux reached 1.86 Crabunits, while in the 1996–1997 season the average flux was only 0.23 Crab units.
Keywords: AGN, TeV gamma rays, Markarian 421
1. Introduction
Blazars are the most powerful active galactic nuclei (AGN) observed andare remarkable for their variability. Their most prominent characteristic is therelativistic jets which are aligned with the line of sight to the observer. In thispreferred direction the blazar can be very bright. Although they are detectable
2

over a wide range of frequencies, their alignment does not permit spatial res-olution and makes the detection of optical spectral lines very difficult. Theirbroadband emission is clearly nonthermal and the nature of the progenitor parti-cles (electrons or protons) is uncertain. In principle, there is much observationalevidence which should make their understanding straightforward, but in prac-tice there is a wealth of often contradictory observations which demonstratethat the underlying mechanisms are complex and often ambiguous. While theirvariability makes these AGN inherently interesting, observations (preferably si-multaneous) over a long time interval at a variety of wavelengths are requiredto draw any firm conclusions.
The spectral energy distribution (SED) of blazars is generally represented bya double-peaked structure, with the lower-energy peak modeled by a synchrotronemission mechanism in which the synchrotron photons arise from electrons inthe relativistic beam; the Compton scattering of these electrons on the low-energy photons (which may be either of synchrotron origin or external from someother mechanism) results in high-energy gamma-ray emission [1]. Generally, theformer simple model (i.e., self-Compton) is preferred, but some sources appearto require external photons [2]. In another class of model, hadronic interactionsare invoked to explain the higher-energy peak [3].
Markarian 421 (Mrk421) was one of 70 AGN reported in the Third EGRETCatalog of 100 MeV sources [4, 5]. It was remarkable in that it was both theweakest and the closest (redshift z = 0.031) of these AGN. Its variability was notparticularly noteworthy in the discovery gamma-ray observation. Subsequentlyit was determined that, unlike the other AGN in the EGRET catalog, it shouldbe classified as a HBL (high-frequency-peaked BL Lacertae object) in whichthe synchrotron and Compton peaks in its spectral energy distribution weredisplaced some decades to higher frequency relative to the norm of EGRET-detected AGN. This made it a prime candidate for TeV emission. It was ona short list of EGRET-detected AGN selected for observation at TeV energieswith the Whipple 10 m telescope [6]. It was the only one on the list whichgave evidence of a signal, and the subsequent paper [7] announced the firstunambiguous detection of an extragalactic source at TeV energies.
Since that time, Mrk421 has been observed every season at the WhippleObservatory. Although more than 50 AGN have now been detected at TeVenergies [8], Mrk421 is still, on average, the strongest AGN source of TeV gammarays in the northern hemisphere. Because of its proximity and high degree ofvariability, it was considered a good candidate for the detailed study of an AGNthat was a TeV gamma-ray emitter. During the large flare in 2001, it wasobserved to reach a peak emission of 13 times the level of the Crab Nebula (thebrightest known steady TeV source) over a four-minute integration time and toshow other rapid variations [9].
Atmospheric Cherenkov telescopes are particularly useful for the study ofHBLs such as Mrk421 because of their high sensitivity to rapid variations. TheWhipple telescope has detected flux variability with doubling times as short as15 minutes [10]; there is some correlation between emission at X-ray keV energiesand gamma-ray TeV energies [11, 12]. Rapid variations in TeV emission have
3

also been observed in other AGN [13, 14]. It has been shown that the energyspectrum of Mrk421 hardens with increasing intensity [9].
In this paper, we summarize intensive observations of Mrk421 with a singlegamma-ray telescope over a long period. The principal telescope used in thisstudy, the 10 m reflector and imaging camera at the Whipple Observatory, isdescribed in Section 2. Section 3 describes the database of TeV observationstaken over the 14-year epoch. Correlations with simultaneous X-ray observa-tions are presented in Section 4. The level of variability in the TeV signal isexplored in Section 5. Section 6 explores those intervals in which the TeV signalwas particularly strong and the source may be said to have been flaring.
2. Whipple Observations.
The principal data reported here were taken at TeV energies with the Whip-ple 10 m atmospheric Cherenkov telescope and imaging camera over a 14-yearperiod (December 1995 – May 2009). Although observations were made bothbefore and after this period, this time interval was chosen as it represents thebest period of uniform operation and performance of the telescope.
The Whipple photomultiplier (PMT) camera evolved during this time [15].From 2001 to 2009, the camera consisted of a hexagonal array of 379 PMTs ofdiameter 1.2 cm, giving a total field of view of 2.8◦. Winston light cones in frontof the PMTs minimized the light loss and gave a relatively uniform sensitivityacross the face of the camera. The camera was triggered when the light level inat least three tubes exceeded a preset threshold. Before 2001, the camera hadPMTs of 2.5 cm diameter and had a larger field of view.
The Whipple observations were supplemented by observations with the VER-ITAS (Very Energetic Radiation Imaging Telescope Array System) observatory,located at the basecamp of the Fred Lawrence Whipple Observatory in southernArizona, USA; this was completed in June 2007. The observatory consists offour 12m-diameter imaging atmospheric Cherenkov telescopes, with a typicalbaseline between telescopes of ∼100 m [16]. Each telescope has a 499-PMTcamera, spanning a field of view of 3.5◦.
The Whipple telescope observations were taken in intervals of 28 siderealminutes during which the telescope was directed at the source. This constitutedan ON run. In order to estimate the background, the ON run was sometimesfollowed (or preceded) by an OFF run during which the telescope tracked a point30 minutes later (earlier) in right ascension but at the same declination, so thattelescope traced out the same path in azimuth and elevation as the ON run.Often no OFF runs were taken, so that the source was tracked continuously(TRACKING mode) and the background determined from the known imageparameter distributions in the absence of a source.
Observations were taken on clear moonless nights. For much of this time,Mrk421 was the prime target, and it was observed whenever it was at an ele-vation greater than 55◦. Where possible, one or two ON/OFF pairs were alsotaken on the Crab Nebula each night for calibration purposes. The rest of
4

the darktime was used to observe other candidate sources (mostly AGN) orgamma-ray bursts.
The Cherenkov images of air showers recorded with the telescope were char-acterized by the moments of the angular distribution of light as determined bythe output of the PMTs. The division of the data into candidate gamma-rayimages and background images was made on the basis of selection criteria opti-mized by Monte Carlo simulations of gamma-ray and hadron shower images andchecked (and again optimized) on known sources such as the Crab Nebula [17].On-line analysis was performed at the conclusion of each data run so that thestate of the source was known promptly and the observing program adjustedif necessary. Only data taken on clear nights (judged by fluctuations in thebackground trigger rate and by the observers’ comments) were used in the finaldatabase.
At the beginning of each observing season, the trigger threshold was raisedor lowered, if required, to compensate for changes in the telescope and in thecamera; these changes included replacement of PMTs, recoating of mirrors,upgrades to trigger electronics, optimisation of mirror-facet alignments, andimprovements in telescope pointing corrections. The adjustment to the triggerlevel from one season to the next was never more than ±10%, and the thresholdwas always maintained well above the noise trigger level.
In order to analyze all the Mrk421 data in a uniform manner, the averageCrab Nebula flux for each observing season was used for calibration. Althoughthe MeV-GeV flux from the Crab Nebula has recently been shown to exhibitshort-term flares [20, 21, 22], they are infrequent (<2 per year) and their dutycycle is short (∼10 days); a search of the Whipple database [23] did not showany evidence for such flares over a ten-year epoch. Long-term secular variationssuch as those seen in X-ray experiments [24] have not been seen at TeV gamma-ray energies, so that the Crab Nebula can still be regarded as a standard candlein this energy regime.
On-source observations of Mrk421 (ON runs and TRACKING runs) werechosen and selection criteria as described above applied to identify gamma-raycandidate events. Estimation of the background was based on the distribution ofthe angle θ between the major axis of the event image and the line from cameracentre to image centroid. The region θ < 15◦ was taken as the signal region andthe region 20◦ ≤ θ < 65◦ as control region. The background in the signal regionwas estimated by multiplying the number of events in the control region by a“tracking ratio”. The tracking ratio ρ for each season was determined from a setof “darkfield” runs (i.e., observing runs with no known source in the field of view)as the number of size- and shape-selected events in the signal region divided bythe corresponding number of events in the control region [18]. Usually the OFFruns from ON/OFF observations of Mrk421 were used as darkfield runs, butwhere these were insufficient they were supplemented by OFF data on othersources. For an on-source run of duration t, the gamma-ray rate was then foundas g = (Non − ρNoff)/t, where Non and Noff are the number of size- and shape-selected events in the signal and control regions, respectively. The error on therate was calculated as ∆g =
√
Non + ρ2Noff + (∆ρ)2N2off , where ∆ρ is the error
5

on the tracking ratio (typically ∼1–3%). The significance of the detection wastaken as g/∆g; this formulation was used in preference to that of Li & Ma [19]in order to take account of the error on the tracking ratio.
Since gamma-ray observations could only be taken with the Whipple 10 mtelescope on moonless nights, there were about eight nights around the time offull moon of each lunar cycle when no gamma-ray observations could be made.The periods (∼21 days each) during which the gamma-ray data were takenare referred to as “darkruns”. Typically, each observing season for Mrk421 atthe Whipple Observatory spans between 6 and 8 darkruns, from November–December to May–June.
3. Gamma-ray Database
The gamma-ray data for Mrk421 between December 1995 and May 2009,in runs of (generally) 28-minute duration, comprise the database for this work;in all cases, the measured flux is given in Crab units based on the Crab signalrecorded that season. These Mrk421 runs were combined (weighted average)to give the mean flux over larger time intervals: nightly (individual nights of1–6 hour duration), monthly (entire dark runs) and yearly. The peak energyresponse of the telescope during these observations was 400 GeV with a 20%uncertainty.
In this work, the assumption is made that the Crab Nebula flux at TeV ener-gies is constant over the season. The typical nightly rate from the Crab Nebulaas measured by the Whipple telescope for one season is shown in Figure 1. Al-though the energy spectrum of Mrk421 has been observed to harden when theflux level is high [9], the spectral shape in the energy range 400 GeV to 4 TeVis typically similar to that of the Crab Nebula, so that for most nights (whenMrk421 is not flaring strongly) the rates expressed in Crab units are insensitiveto small changes in peak energy response. Some results from this data set havebeen published previously [25, 26, 27, 11, 12]. Several of these reports were mo-tivated by the observation of exceptional activity (May 1996 [10]; February 2001[11]; May 2008 [28]) and the reports included light curves on short timescalesand spectral analysis. These flares are discussed in Section 6.
The Mrk421 observations reported here represent a total exposure time of878.4 hours over 14 years. The nightly gamma-ray rate from Mrk421 for thetypical 2007–2008 observing season, expressed in Crab units, is shown in Fig-ure 2; the horizontal line indicates the average rate for this season. Mrk421varies on many time scales.
The mean gamma-ray rate from Mrk421 was calculated for each observingseason; the results are given in Table 1 and plotted in Figure 3. The tableincludes the ON-source observing time (all the time in which the telescope waspointing at Mrk421) and the statistical significance of the detection for eachseason. For the hypothesis that the annual rate is a constant, equal to theoverall mean rate for the complete 14-year data set, the χ2 value is 1022 for13 degrees of freedom, corresponding to a chance probability of P < 10−300.
6

Table 1: Yearly Summary of Mrk421 observationsSeason Exposure Significance Mean gamma-ray rate
(hours) (standard deviation) (Crab units)1995-1996 51.8 36 0.32 ± 0.021996-1997 53.2 25 0.23 ± 0.021997-1998 52.1 24 0.50 ± 0.041998-1999 45.2 23 0.48 ± 0.031999-2000 38.7 36 0.91 ± 0.042000-2001 78.1 88 1.86 ± 0.092001-2002 32.9 14 0.28 ± 0.022002-2003 45.0 35 0.54 ± 0.032003-2004 51.8 82 1.29 ± 0.082004-2005 23.0 25 0.60 ± 0.042005-2006 75.1 88 1.00 ± 0.042006-2007 52.0 18 0.28 ± 0.022007-2008 148.9 84 1.46 ± 0.092008-2009 130.6 39 0.55 ± 0.03
During some observing seasons Mrk421 was the brightest TeV source in the sky,whereas in others it was barely detectable with the Whipple telescope.
Figure 4 (bottom) shows the gamma-ray rate averaged over each darkrun(monthly) for the 14 years of data. With this unique dataset, it is possibleto look for long-term temporal changes in flux levels, slow periodicities andcorrelation with experiments at other wavelengths with long time constants.
The discrete autocorrelation function (DACF) allows the study of the level ofautocorrelation in unevenly sampled datasets [29, 30] without any interpolationor addition of artificial data points. It can reveal the presence of periodicity(intrinsic or spurious) in the time series. The DACF for the gamma-ray datasetfor Mrk421 is plotted in Figure 5; it shows no evidence for periodicity at anyperiod between 2 months and 7 years.
4. Correlations
We correlated these Whipple 10 m observations with archival data taken atother wavelengths for part or all of the epoch 1995–2009. The most completeoverlap was with the Rossi X-ray Timing Explorer (RXTE) database for theentire 14 years [31, 32]. There was also significant overlap with Milagro [33].There was partial overlap with observations by Fermi-LAT [34] and with datafrom three radio AGN monitoring programs (Metsahovi Radio Observatory [35],the University of Michigan Radio Observatory [36], and MOJAVE [37]). Thecorrelation with the X-ray data from RXTE will be considered here; the corre-lation with Milagro, Fermi-LAT and the radio programs will be the subject ofa separate publication.
7

RXTE has three non-imaging X-ray detectors, one of which is the All-SkyMonitor (ASM); it was launched in December 1995 and was operational forthe period of the Whipple 10 m monitoring program described here. The ASMscanned nearly 80% of the sky in each orbit and was sensitive to X-rays of energy2–10 keV. Systematic uncertainties in the ASM rate were large, but relative fluxestimates were available for month-scale monitoring.
In the ASM database [38], each data point represents the one-day average ofthe fitted source fluxes from a number (typically 5–10) of individual ASM dwells(90 seconds each). The selection criteria for the observations are described in[38]. The data are quoted as nominal 2–10 keV rates in ASM counts per second,where the Crab Nebula rate is about 75 counts per second. The daily rates werecombined (weighted average) in ∼21-day intervals to reduce statistical errors.
The gamma-ray rates for the 1995–2009 Mrk421 Whipple observations werecompared with the X-ray flux from the ASM. The light curves for the X-ray andgamma-ray data on Mrk421 from December 1995 to May 2009 are plotted inFigure 4 (top and bottom, respectively). The data are plotted for the Whipple10 m darkrun periods (6 − 8 for each season) in which both X-ray and gamma-ray data were taken, i.e., the X-ray data were averaged for each period in whichWhipple gamma-ray data were available (usually 21-day periods).
The RXTE ASM data (1995–2009) show evidence for emission correlatedwith the gamma-ray data on monthly and yearly timescales, as shown in Fig-ure 6. In previous papers [11, 12, 39], the correlation on short timescaleswas treated in detail. Here, we concentrate on the longer timescales whichare uniquely available in our large database. The correlation coefficients areR = 0.75 and R = 0.89 for the monthly- and yearly-binned data, respectively.There is general agreement between these values and those obtained in previousstudies of parts of this database [11, 12]. The strong correlation suggests thatthe X-rays and gamma rays are emitted by the same population of electronsin the same region of the jet. During one flaring episode, a 2.1 ± 0.7 ks timelag of the TeV flare with respect to the 2–4 keV X-ray band was observed [11].For the 14-year data set, the discrete correlation function (DCF) between thegamma-ray and X-ray monthly-averaged fluxes for time lags (gamma ray rela-tive to X-ray) between −4800 and +4800 days is shown in Figure 7. The TeVand keV fluxes are seen to be significantly correlated (with a DCF value of 0.82)for a time shift shorter than 30 days; the maximum of the DCF is centered ata lag of (0 ± 15) days.
5. Variability
Mrk421 is the brightest AGN at TeV energies (on average) and was the firstsuch AGN to be discovered at TeV energies. Mrk421 is thus the ideal candidatefor the detailed study of the variability of this type of object, with the caveatthat it may have a greater degree of variability than the norm for such objectson all timescales. It is remarkable also in being the closest TeV-emitting AGN.It is certainly the most studied of the known TeV blazars. Most of the variationsseen in Mrk421 on the various timescales have been seen also in other AGN, but
8

the statistics are sparse. It is probably the youngest such AGN. Because it is soclose, it has the lowest spectral distortion due to absorption by pair productionwith the extragalactic background light.
It is difficult to compile a large data sample from a variety of observato-ries, because observing modes may be quite different and the relative sensitivityof the experiments is often not well-defined. The Whipple 10 m database iscomparatively uniform and covers a long time interval; during the period 1995–2009, the system was operated in a relatively stable configuration of telescopeand camera [15]. It is thus useful to use this database to investigate the sta-tistical distribution of the time variability of Mrk421 and, by inference, that ofother AGN. If Mrk421 is typical of all (or a subclass of) TeV AGN, then we canuse these distributions to predict how often a more distant AGN might flare orbe above a certain level of brightness. Four different timescales are considered:yearly, monthly, daily and run-by-run (half-hourly).
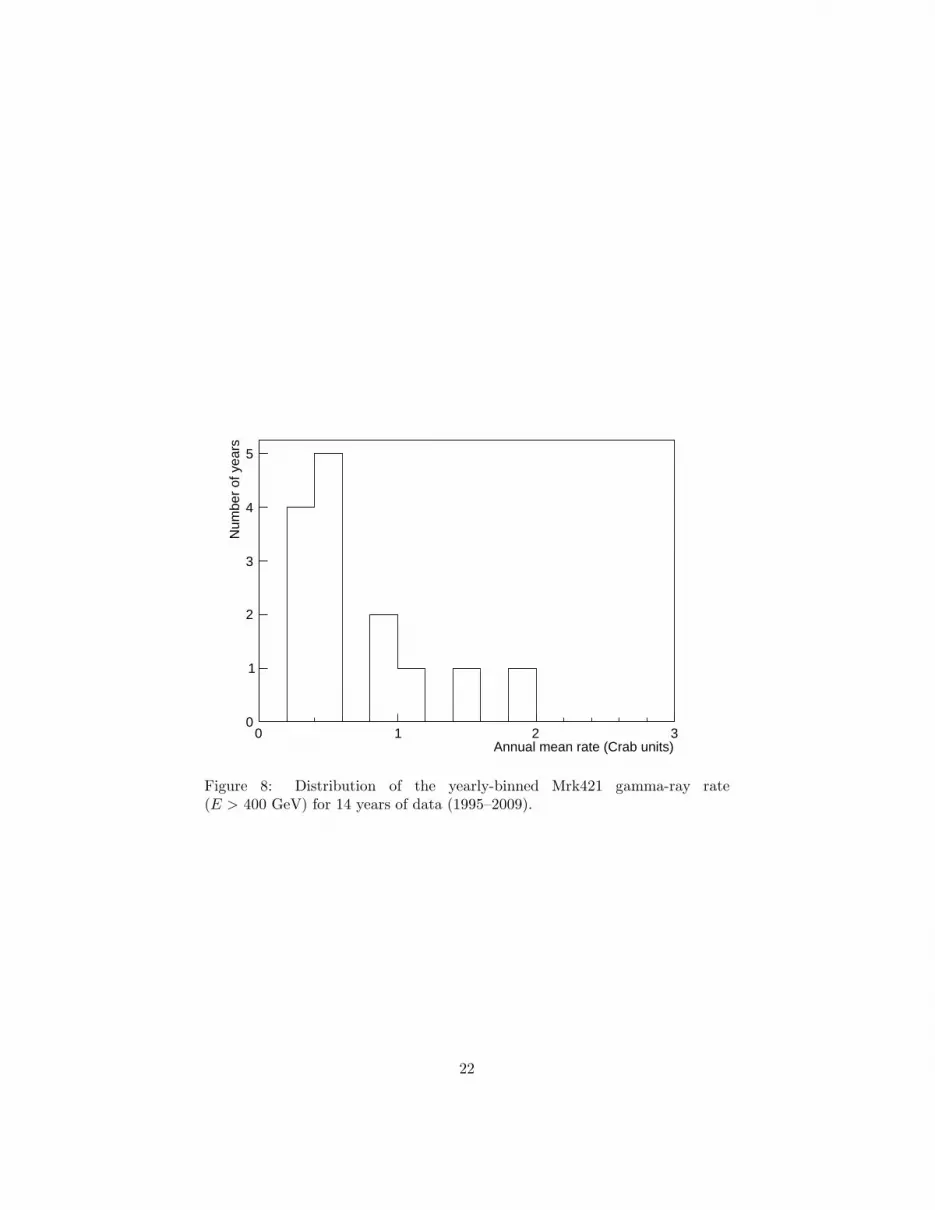
Yearly variations: As seen in Figure 8, there are significant variations on ayearly timescale, with mean annual rates ranging from 0.23 Crab units to 1.86Crab units. Mrk421 was brighter than any other TeV source in the sky duringmost of the 2007–2008 observing season (see Figure 2); this was also the casefor the 2000–2001 season.
Monthly variations (Figure 9): There are clearly large variations on thistimescale over the full 14 years of data. There were 19 months (out of a totalof 95 months) in which the average rate was at least 1 Crab unit.
Nightly variations: The distribution of the average rate for each of the 783nights of observation is shown in Figure 10. The duration of the observationson which the average is based varied from night to night as observing priorities,weather, etc., changed. There were 49 nights (out of a total of 783 nights, 6.3%)for which the average rate was at least 2 Crab units.
Run variations: Observing runs were generally of 28-minute duration. Thedistribution of the run-by-run rates is shown in Figure 11. This distribution isnot a completely unbiased sample, since for a subset of the data there was atendency for the observers to continue observations when the initial observedsignal was high. There is therefore some bias towards including observationswhen Mrk421 was in a high state (there is no bias against runs where the signalwas low, as all observations were included in the analysis irrespective of theapparent flux level). However, when only the first run in each night is considered,this bias was not found to be strong, as can be seen in Figure 12 which shows theflux using all the data satisfying weather, hardware and elevation criteria and asmaller set of data where the fluxes are based on only the first run of each night.In later years, this bias was largely removed as observations were concentratedon just Mrk421. 34% of the runs, taken at random, show Mrk421 to be at anemission level of > 1 Crab unit, and 3.5% of the runs have levels above 3 Crabunits. The highest fluxes (> 7 Crab units) were observed in sub-run intervalsof 2–5 minutes (see next section).
If Mrk421 is typical (which is probably not the case), these distributionscould be used to predict the expected level of variation in other TeV-emittingAGN, scaling by the ratio of their average TeV gamma-ray intensity to that
9

of Mrk421 (e.g., for a TeV-emitting AGN one-third as bright as Mrk421 onaverage, ∼3.5% of the runs taken on it might be expected to exhibit flaringabove the 1 Crab level).
6. Large Flares
Mrk421 is characterized by significant flux variations on timescales of a fewminutes to years and perhaps longer. During the 14 years of monitoring re-ported here, there were three instances in which the variations were sufficientlystrong that they were regarded as “flares” and were so reported in subsequentpublications [10, 11, 39]. Although the timescales were quite different, the com-mon factor was that in each case the observed flux reached a flux level in excessof 10 Crab in a bin of ≤ 5 minutes. For completeness, the salient features ofthese three instances of exceptional variability are summarized here.
The particular value of these observations was that the signal-to-noise ratio(number of gamma-ray events to background events) was sufficiently large thatthe spectrum of gamma rays could be determined. In the normal operation ofobserving a relatively weak source with a single Cherenkov telescope, a parallelseries of observations of an off-source region must be taken before a reliablespectrum can be derived. Hence, in this long-term monitoring program, wherethe emphasis was on determining the lightcurve and off-source measurementswere not routinely made, the spectrum could not be reliably derived.
(i) During the 1995–1996 season, Mrk421 was relatively quiet; the meangamma-ray rate for the season was 0.32 ± 0.01 Crab, with a significance of36σ for a total exposure of 51.8 hours (Figure 4). There were two remarkableoutbursts of TeV gamma rays just eight days apart [10]. The first of theseoccurred on 7th May 1996 (MJD 50210), when over the course of 2.5 hours theflux increased by a factor of five and reached a maximum rate of ∼10 Crab (∼30times the average flux for that season). The observations had to be terminatedwhile the flux was still rising due to increasing moonlight so that the peakof the flare was probably not observed. However, on the following night theflux was down to 0.39 ± 0.05 Crab, just above the season average. A secondflare of lower intensity, but unusual for its very short duration, occurred on15th May 1996 (MJD 50218), when a rise and fall within ∼30 minutes wasobserved. The spectrum of the large flare was reported in [40] as F (E) =(2.24 ± 0.12 ± 0.7)E−2.56±0.07±0.1 s−1 cm−2 TeV−1, where the first error isstatistical and the second systematic. This spectrum was confirmed in [41],where slight evidence for curvature was found.
ii) In 2007–2008, the Whipple monitoring program again found Mrk421 in astrong flaring state; on 2nd May 2008 (MJD 54588), the flux exceeded 10 Crab[42] in a 5-minute interval (Figure 13). It appeared that the observation wasduring the declining phase of a flare whose maximum was not observed. Obser-vations with the VERITAS telescope on the following night confirmed the highlevel of gamma-ray activity [39].
On 3rd May (MJD 54589), the Whipple telescope and VERITAS observedMrk421 [39], and the light curves are shown in Figure 14, binned in 2-minute
10
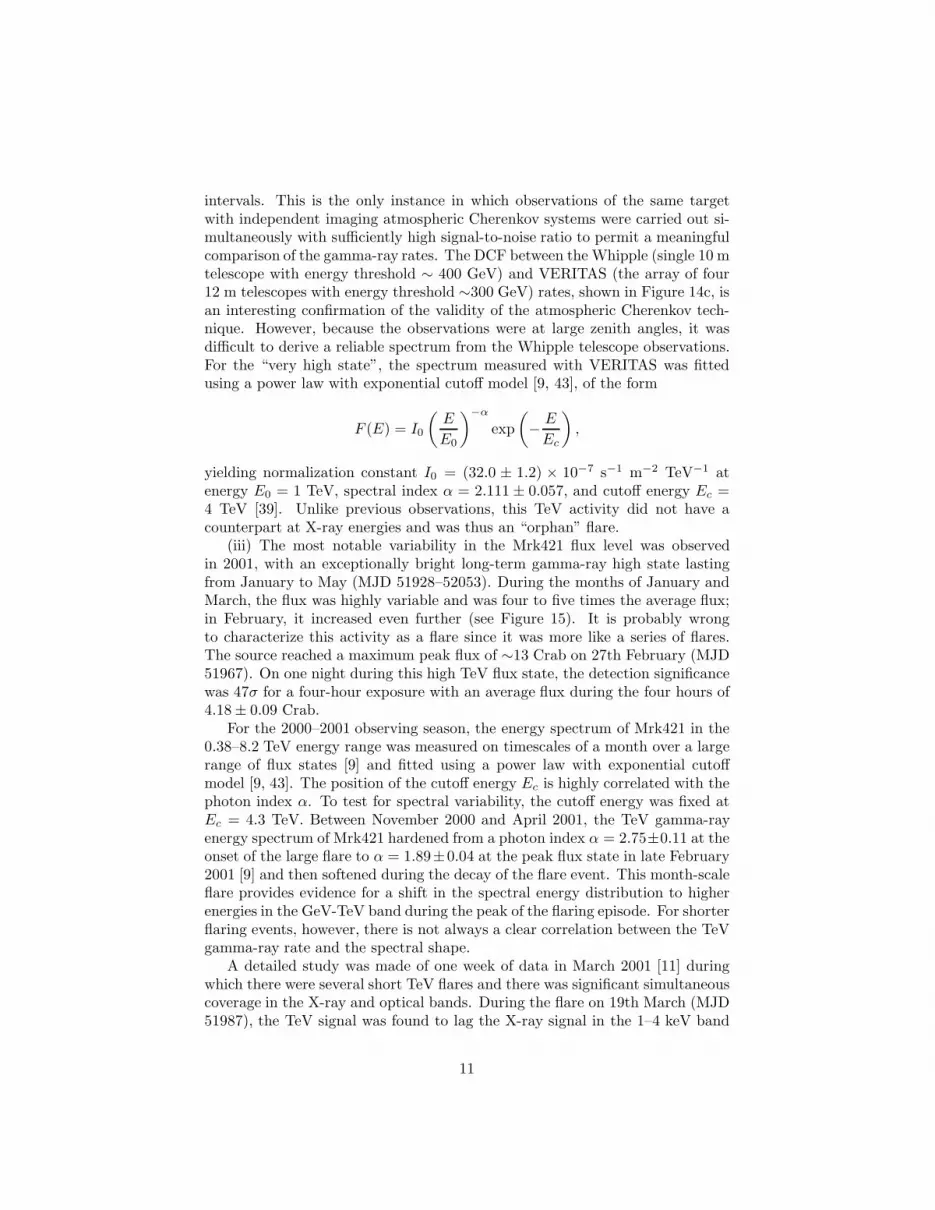
intervals. This is the only instance in which observations of the same targetwith independent imaging atmospheric Cherenkov systems were carried out si-multaneously with sufficiently high signal-to-noise ratio to permit a meaningfulcomparison of the gamma-ray rates. The DCF between the Whipple (single 10 mtelescope with energy threshold ∼ 400 GeV) and VERITAS (the array of four12 m telescopes with energy threshold ∼300 GeV) rates, shown in Figure 14c, isan interesting confirmation of the validity of the atmospheric Cherenkov tech-nique. However, because the observations were at large zenith angles, it wasdifficult to derive a reliable spectrum from the Whipple telescope observations.For the “very high state”, the spectrum measured with VERITAS was fittedusing a power law with exponential cutoff model [9, 43], of the form
F (E) = I0
(
E
E0
)−α
exp
(
−E
Ec
)
,
yielding normalization constant I0 = (32.0 ± 1.2) × 10−7 s−1 m−2 TeV−1 atenergy E0 = 1 TeV, spectral index α = 2.111 ± 0.057, and cutoff energy Ec =4 TeV [39]. Unlike previous observations, this TeV activity did not have acounterpart at X-ray energies and was thus an “orphan” flare.
(iii) The most notable variability in the Mrk421 flux level was observedin 2001, with an exceptionally bright long-term gamma-ray high state lastingfrom January to May (MJD 51928–52053). During the months of January andMarch, the flux was highly variable and was four to five times the average flux;in February, it increased even further (see Figure 15). It is probably wrongto characterize this activity as a flare since it was more like a series of flares.The source reached a maximum peak flux of ∼13 Crab on 27th February (MJD51967). On one night during this high TeV flux state, the detection significancewas 47σ for a four-hour exposure with an average flux during the four hours of4.18 ± 0.09 Crab.
For the 2000–2001 observing season, the energy spectrum of Mrk421 in the0.38–8.2 TeV energy range was measured on timescales of a month over a largerange of flux states [9] and fitted using a power law with exponential cutoffmodel [9, 43]. The position of the cutoff energy Ec is highly correlated with thephoton index α. To test for spectral variability, the cutoff energy was fixed atEc = 4.3 TeV. Between November 2000 and April 2001, the TeV gamma-rayenergy spectrum of Mrk421 hardened from a photon index α = 2.75±0.11 at theonset of the large flare to α = 1.89±0.04 at the peak flux state in late February2001 [9] and then softened during the decay of the flare event. This month-scaleflare provides evidence for a shift in the spectral energy distribution to higherenergies in the GeV-TeV band during the peak of the flaring episode. For shorterflaring events, however, there is not always a clear correlation between the TeVgamma-ray rate and the spectral shape.
A detailed study was made of one week of data in March 2001 [11] duringwhich there were several short TeV flares and there was significant simultaneouscoverage in the X-ray and optical bands. During the flare on 19th March (MJD51987), the TeV signal was found to lag the X-ray signal in the 1–4 keV band
11
by 35 ± 12 minutes. However, the lag was less at higher X-ray energies. Nocorrelation was found between the TeV and optical signals.
7. Conclusions
Atmospheric Cherenkov telescopes are ideally suited for studying AGN, butobservations are most sensitive on clear dark nights. The large collection areasassociated with the technique make them particularly suited to the study oftime variations. Because of their small fields of view, they are generally limitedto the study of just one AGN at a time. The profusion of sources and thesmall number of sensitive telescopes available makes long-term monitoring of aparticular source difficult. The Whipple 10 m telescope, while lacking the fluxsensitivity of the major new observatories, H.E.S.S., MAGIC and VERITAS,was devoted over a 14-year timespan to observations of Mrk421 (along with asmall number of other AGN) and thus provided a unique database. The Whipple10 m gamma-ray telescope has since been mothballed in the summer of 2011,after 43 years of operation.
Mrk421 is the brightest and most studied blazar that is an emitter at TeVenergies. The wealth of observational data makes it an ideal target for modelingthe possible emission mechanisms. However, it is not yet clear to what extentit can be regarded as the archetypal TeV-emitting AGN. Given that a largenumber of blazars are only observed when they flare, it is useful to know theduty cycle of the flaring activity in order to estimate the chances of detection inany planned observing campaign. Although emission at X-ray and TeV gamma-ray wavelengths has been shown to be correlated, emission at other wavelengths(radio, optical, infrared), which can be studied with ground-based telescopes, isnot strongly correlated. Hence it is difficult to plan a multiwavelength campaignto observe flaring activity that could be triggered by a non-gamma-ray signal.
Only a small number of blazars have been detected by the Whipple 10 mtelescope (Mrk421, Markarian 501 (Mrk501), 1ES2344+514, H1426+428 and1ES1959+650). Apart from Mrk421 and Mrk501, the average TeV flux levelmeasured for these blazars is extremely low. For example, the average rateobserved by the Whipple 10 m telescope from H1426+428 during 2000 and2001 was only (10 ± 2)% of the Crab Nebula rate [44]. 1ES2344+514 and1ES1959+650 were only detected by the 10 m telescope because of strong flaringactivity [18, 45].
It is therefore difficult to confirm the predictions of flaring frequency using10 m data alone. As more TeV blazars are identified using data from H.E.S.S.,MAGIC, and VERITAS, and their flaring statistics determined in long expo-sures, it will be possible to ascertain to what extent Mrk421 is typical of TeV-emitting AGN.
Acknowledgements
This research is supported by grants from the U.S. Department of En-ergy Office of Science, the U.S. National Science Foundation and the Smith-
12

sonian Institution, by NSERC in Canada, by Science Foundation Ireland (SFI10/RFP/AST2748) and by STFC in the U.K. We acknowledge the excellentwork of the technical support staff at the Fred Lawrence Whipple Observatoryand at the collaborating institutions in the construction and operation of theinstruments.
References
References
[1] Ulrich, M.H. et al. 1997, Ann. Rev. Astron. Astrophys., 35, 445
[2] Dermer, C. and Schlickeiser, R. 1993, Astrophysical Journal, 416, 458
[3] Pohl, M. and Schlickeiser, R. 2000, Astronomy and Astrophysics, 354, 395
[4] Michelson, P.F. et al. 1992, IAU Circular 5470, 1
[5] Hartman, R.C. et al. 1999, Astrophysical Journal Supplement, 123, 79
[6] Kerrick, A.D. et al. 1995, Astrophysical Journal, 452, 227
[7] Punch, M. et al. 1992, Nature, 358, 477
[8] Wakely, S. and Horan, D. 2012, http//tevcat.uchicago.edu/
[9] Krennrich, F. et al. 2002, Astrophysical Journal Letters, 575, L9
[10] Gaidos, J. et al. 1996, Nature, 383, 319
[11] Fossati, G. et al. 2008, Astrophysical Journal, 677, 906
[12] Horan, D. et al. 2009, Astrophysical Journal, 695, 596
[13] Albert, J. et al. 2007, Astrophysical Journal, 669, 862
[14] Aharonian, F. et al. 2007, Astrophysical Journal Letters, 664, 71
[15] Kildea, J. et al. 2007, Astroparticle Physics, 28, 182
[16] Weekes, T.C. et al. 2002, Astroparticle Physics 17, 221
[17] Reynolds, P.T. et al. 1993, Astrophysical Journal, 404, 206
[18] Catanese, M. et al. 1998, Astrophysical Journal, 501, 616
[19] Li, T. and Ma, Y. 1983, Astrophysical Journal, 272, 317
[20] Tavani, M. et al. 2011, Science: 10.1126/science.1200083
[21] Abdo, A.A. et al. 2011, Science, 10.1126/science.1199705
[22] Buehler, R. et al. 2012, Astrophysical Journal, 749, 26
13

[23] O’Faolain de Bhroithe, A. 2012, Proceedings of the 5th International Meet-ing on High Energy Gamma-Ray Astronomy (Heidelberg), AIP ConferenceProceedings 1505, 309
[24] Wilson-Hodge, C.A. et al. 2011, Astrophysical Journal Letters, 727, L40
[25] Krawcyznski, H. et al. 2000, Astrophysical Journal, 559, 187
[26] B lazejowski, M. et al. 2005, Astrophysical Journal, 630, 130
[27] Rebillot, P.F. et al. 2006, Astrophysical Journal, 641, 740
[28] Ong, R. 2008, The Astronomer’s Telegram #1506.
[29] Edelson, R.A. and Krolik, J.H. 1988, Astrophysical Journal, 333, 646
[30] Hufnagel, B.R. and Bregman, J.N. 1992, Astrophysical Journal 386, 473
[31] Bradt, H.V., Rothschild, R.E. and Swank, J.H. 1993, Astronomy and As-trophysics Supplement 97, 355
[32] Levine, A.M. et al. 1996, Astrophysical Journal, 469, L33
[33] Smith, A.J. et al. 2001, Proceedings of the 27th International Cosmic RayConference (Hamburg) 7, 2731
[34] Atwood, W.B. et al. 2009, Astrophysical Journal, 697, 1071
[35] Terasranta, H. et al. 1998, Astronomy and Astrophysics Supplement 132,305
[36] Aller, H.D. et al. 1985, Astrophysical Journal Supplement, 59, 513
[37] Lister, M.L and Homan, D.C. 2005, Astronomical Journal, 130, 1389
[38] http://xte.mit.edu/asmlc/
[39] Acciari, V. et al. 2011, Astrophysical Journal, 738, 25
[40] Zweerink, J. et al. 1997, Astrophysical Journal Letters, 490, L141
[41] Krennrich, F. et al. 1999, Astrophysical Journal, 511, 149
[42] Swordy, S. 2008, The Astronomer’s Telegram, #1506
[43] Aharonian, F. et al. 2005, Astronomy and Astrophysics, 437, 95
[44] Horan, D. et al. 2002, Astrophysical Journal, 571, 753
[45] Holder, J. et al. 2003, Astrophysical Journal Letters, 583, L9
14

Modified Julian Day54400 54450 54500 54550
)-1
Gam
ma-
ray
rate
(m
in
0
1
2
3
4
5
6
Figure 1: Nightly gamma-ray rate from the Crab Nebula from October 2007to March 2008 at energies E > 400 GeV. The mean rate for the season isrepresented by the dashed line. The χ2 value is 31.6 for 29 degrees of freedom,giving a probability of 34% that the rate is constant.
15

Modified Julian Day54400 54450 54500 54550 54600
Gam
ma-
ray
rate
(C
rab
units
)
0
1
2
3
4
5
Modified Julian Day54400 54450 54500 54550 54600
Gam
ma-
ray
rate
(C
rab
units
)
1
2
3
Figure 2: The gamma-ray light curve for Mrk421 at energies E > 400 GeV forthe 2007–2008 observing season. Top: daily gamma-ray rate; bottom: monthlygamma-ray rate. The dashed lines represent the mean rate for the 2007–2008season.
16

Observing season1996 1998 2000 2002 2004 2006 2008 2010
> 4
00 G
eV)
/ Cra
b un
itsE
Gam
ma-
ray
rate
(
0.5
1.0
1.5
2.0
2.5
Figure 3: The gamma-ray light curve for Mrk421 at energies E > 400 GeV from1995 to 2009, showing the mean rate for each observing season; the horizontalbar on each point indicates the duration of the observing season. The dashedline represents the mean gamma-ray rate (0.446 ± 0.008 Crab units) for theentire 14-year dataset.
17

Modified Julian Day50000 50500 51000 51500 52000 52500 53000 53500 54000 54500 55000
-1A
SM
Rat
e (2
-10k
eV)
/ cou
nts
s
0
1
2
3
4
5
Modified Julian Day50000 50500 51000 51500 52000 52500 53000 53500 54000 54500 55000
>40
0 G
eV)
/ Cra
b un
itsE
Gam
ma-
ray
Rat
e (
0
1
2
3
4
Figure 4: The monthly X-ray and gamma-ray light curves for Mrk421 (1995–2009). Top: RXTE ASM (2–10 keV); bottom:Whipple 10 m telescope (> 400 GeV). The RXTE data are shown as circles for periods during which Mrk421 was observablewith the Whipple 10 m telescope (typically from November-December to May-June each season) and as triangles for intervalswhen it was not.
18

Time lag (days)-2500 -2000 -1500 -1000 -500 0 500 1000 1500 2000 2500
Aut
ocor
rela
tion
coef
ficie
nt
-1.0
-0.5
0.0
0.5
1.0
Figure 5: The discrete autocorrelation function for the monthly-binned Mrk421 Whipple gamma-ray database.
19

> 400 GeV) / Crab unitsEGamma-ray Rate (0 1 2 3 4
-1X
-ray
Rat
e (2
-10
keV
) / c
ount
s s
0
1
2
3
4
5
> 400 GeV) / Crab unitsEGamma-ray Rate (0.0 0.5 1.0 1.5 2.0
-1X
-ray
Rat
e (2
-10
keV
) / c
ount
s s
0
1
2
3
Figure 6: Flux-flux correlation for the Whipple 10 m (> 400 GeV) and RXTEASM (2–10 keV) Mrk421 data on two different timescales. The dashed lines arethe best-fit straight lines. Top: monthly-binned gamma-ray and RXTE ASMdata ((the best-fit line has slope 1.63 and correlation coefficient R = 0.75));bottom: annual-binned gamma-ray and RXTE ASM data (slope 2.43, R =0.89).
20

Time lag (days)-4000 -3000 -2000 -1000 0 1000 2000 3000 4000
Cor
rela
tion
coef
ficie
nt
-1.0
-0.5
0.0
0.5
1.0
Figure 7: The discrete correlation function between Mrk421 X-ray (2–20 keV) and gamma-ray (> 400 GeV) light curves.
21
Annual mean rate (Crab units)0 1 2 3
Num
ber
of y
ears
0
1
2
3
4
5
Figure 8: Distribution of the yearly-binned Mrk421 gamma-ray rate(E > 400 GeV) for 14 years of data (1995–2009).
22

Monthly mean rate (Crab units)0 1 2 3 4
Num
ber
of m
onth
s
0
5
10
15
20
25
Figure 9: Distribution of the monthly-binned Mrk421 gamma-ray rate(E > 400 GeV) for 95 months (darkruns), representing 14 years of data (1995–2009).
23

Nightly gamma-ray flux (Crab units)0 1 2 3 4 5 6 7
Num
ber
of n
ight
s
0
50
100
150
Figure 10: Distribution of the nightly-binned Mrk421 gamma-ray rate(E > 400 GeV) for 14 years of data (1995–2009), covering 783 nights.
24

Mean rate (Crab units)0 1 2 3 4 5 6 7 8 9
Num
ber
of r
uns
0
100
200
300
Figure 11: Distribution of the Mrk421 gamma-ray rate (E > 400 GeV) for2007 individual runs (generally of 28-minute duration) taken over 14 years ofobservation (1995–2009).
25

Modified Julian Day50000 50500 51000 51500 52000 52500 53000 53500 54000 54500 55000
>40
0 G
eV)
/ Cra
b un
itsE
Gam
ma-
ray
Rat
e (
0
1
2
3
4All runsFirst run each night
Figure 12: Mrk421 gamma-ray flux (E > 400 GeV) for each darkrun from 1995 to 2009. Fluxes calculated using all availabledata runs (typical duration 28 minutes) satisfying weather, hardware and elevation criteria are shown as circles (blue); triangles(red) are fluxes calculated using only the first data run on each night of observation.
26

2008 May 2, UT (hours)4 5 6 7 8
Gam
ma-
ray
rate
(C
rab
units
)
0
2
4
6
8
10
12
Figure 13: Whipple 10 m gamma-ray (E > 400 GeV) light curve for Mrk421on 2nd May 2008 (MJD 54588), binned in 5-minute intervals. The dashed lineshows the mean rate for the 2007–2008 season. The gap in the plot arisesfrom two factors: firstly, the data run immediately before the gap was taken inON/OFF mode, and secondly, the telescope had already been slewed to observeanother target before the analysis of the Mrk421 run showed that a major flarewas taking place.
27

2008 May 3, UT (hours)3 4 5 6 7 8 9
Whi
pple
gam
ma-
ray
rate
(C
rab
units
)
0
1
2
3
4
5
6
7
8
9
2008 May 3, UT (hours)3 4 5 6 7 8 9
VE
RIT
AS
gam
ma-
ray
rate
(C
rab
units
)
0
1
2
3
4
5
6
7
8
9
−100 −80 −60 −40 −20 0 20 40 60 80 100−0.4
−0.2
0.0
0.2
0.4
0.6
0.8
1.0
Whipple time shift relative to VERITAS (minutes)
Cor
rela
tion
coef
ficie
nt
Figure 14: Mrk421 gamma-ray rate on 3rd May 2008 (MJD 54589), from Whip-ple (E > 400 GeV) and VERITAS (E > 300 GeV) observations (top and middlepanels, respectively). Both light curves are binned in 2-minute intervals. Thebottom panel shows the DCF between the Whipple and VERITAS data.
28

Modified Julian Day51920 51930 51940 51950 51960 51970 51980 51990 52000
>40
0 G
eV)
/ Cra
b un
itsE
Gam
ma-
ray
Rat
e (
0
1
2
3
4
5
Figure 15: Mrk421 gamma-ray rate (E > 400 GeV) for the period of high VHE activity from January 2001 to March 2001.The dashed lines represent the average rate (weighted mean) for each of the three darkruns in this period; the dot-dashed lineindicates the mean rate for the full 14-year data set (1995–2009).
29


