Embed Size (px)
Citation preview
CHAPTER 8
OECD INTERNATIONAL EDUCATION INDICATORS*
NORBERTO BO-ITANI
Center for Educational Research and Innovation, Organization for Economic Cooperation and Development, 2, rue Andre Pascal, 75775 Paris Cedex 16, France
Abstract
In this chapter three sets of international education indicators produced by OECD in the INES project
are briefly compared and the nature and composition of these sets is analyzed. The policy relevance of
the indicator set is discussed and finally some priorities for future developments are suggested. Copyright Q 1996 Elsevier Science Ltd
Introduction
The Organization for Economic Cooperation and Development (OECD) has deployed a substantial and increasing effort since 1988 - the year of the beginning of the International Indicators of Education Systems (INES) Project - to gather, process, improve, and report statistics and indicators on education and related fields. The importance of the international dimension of educational matters calls for cross-national information and data. OECD countries need international statistics and indicators on education and training that are reliable and valid and take into account the complexity to which learning provisions have grown in modem societ- ies.
The launch of the INES project in 1988 was a consequence of growing dissatisfaction with the disparity between the simplicity of the definitions and instruments used for gathering data on education at the international level and the perceived complexity of education and training reali- ties. Decision makers in several countries required the means to compare the performance of their education systems with those of other countries, to better assess the effectiveness of their education systems, and to monitor their evolution. The type and quality of data available were not appropriate to achieve these aims.
The most troublesome problem was the definition of “education” that inspired the scope of
*This chapter is a revised version of a paper prepared for the European Conference on Educational Research held in Bath (U.K.), September 1995. The opinions expressed are strictly personal and do not reflect the views of OECD.
279
280 N. BOTTANI
the statistical questionnaires used at the international level. It was conventional and problematic given the growing diversity of educational provisions and of analytic needs. The educational activities taken into account were only those provided in schools and universities or other establishments that are considered part of the overall education system. All training activities for adults or specific target groups such as young people seeking jobs and the unemployed were excluded from the data collection. Also excluded were activities of the education and care programs for children outside of formal kindergarten, and moreover the education efforts of private independent institutions not supported by governments. This situation made it impos- sible to provide an estimate of the relevance of the education sector in OECD member countries.
The INES project has thus had a pivotal role in the last seven years not only for proposing and producing a set of education indicators, but also for improving the quality of education statistics at the international level. There is now widespread interest in improving international data and information in terms of the quality and comparability of existing educational statistics as well as in terms of broadening the scope of regularly gathered data. This broadening refers both to the range of educational statistics and indicators currently gathered as well as the links with related labor market and social fields.
The most visible result of this work is the production of a set of education indicators largely advertised and used by the mass media. After three years of preparatory work, OECD, between 1992 and 1995, has produced three sets of education indicators which have to be considered as three successive improved editions of an “ideal” set of indicators approved by member countries in 1991.
The OECD Sets of International Education Indicators
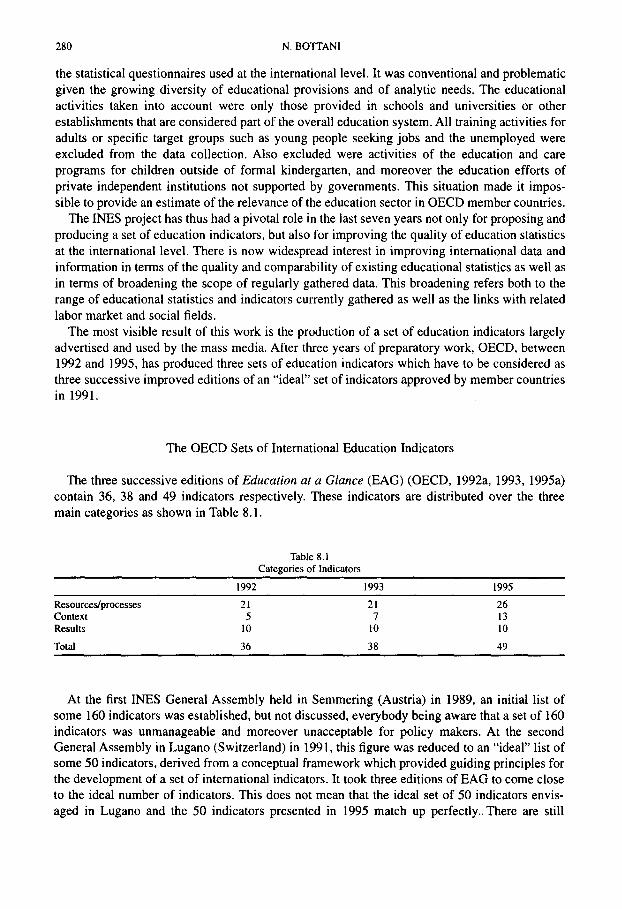
The three successive editions of Education at a Glance (EAG) (OECD, 1992a, 1993, 1995a) contain 36, 38 and 49 indicators respectively. These indicators are distributed over the three main categories as shown in Table 8.1.
Table 8.1 Categories of Indicators
1992 1993 1995
Resources/processes 21 21 26 Context 5 7 13 Results 10 10 10
Total 36 38 49
At the first INES General Assembly held in Semmering (Austria) in 1989, an initial list of some 160 indicators was established, but not discussed, everybody being aware that a set of 160 indicators was unmanageable and moreover unacceptable for policy makers. At the second General Assembly in Lugano (Switzerland) in 1991, this figure was reduced to an “ideal” list of some 50 indicators, derived from a conceptual framework which provided guiding principles for the development of a set of international indicators. It took three editions of EAG to come close to the ideal number of indicators. This does not mean that the ideal set of 50 indicators envis- aged in Lugano and the 50 indicators presented in 1995 match up perfectly.. There are still
Indicators of Educational Perfomance 281
shortcomings, particularly in the domain of outcomes. Nevertheless, Orivel (1995) concluded that at least 80% of the desirable indicators are present in EAG 3 and that the gap has been narrowed considerably over the three editions. The following discussion is based largely on Orivel’s analysis of the three editions of EAG.
Context Indicators
The context of education is the domain which has changed the most over the three editions. It has grown from 5 to 13 indicators, the most significant change being the introduction in 1995 of the results of a common survey on public opinions and expectations regarding national education systems (OECD, 1995b; INES, 1995). This area of context indicators will not be covered every year, because OECD does not have the resources to implement an annual public opinion poll.
In the three editions, there are two common subgroups of indicators in this domain: demographic and economic. Both of these subgroups are problematic. They provide only very general information focused on educational attainment of the population, gender differences in education, labor force participation and education, and national income per capita. These data show the proportion of country wealth which is devoted to education and provides a first interesting picture about the relation between the rank by the total educational investment and the rank by Gross Domestic Product (GDP) per capita. Some countries like Finland and Canada spend considerably more on education than countries having a higher GDP per capita like the United States. It is interesting to note that some of the less affluent countries like Ireland and Spain spend a greater percentage of their GDP per capita to achieve the same level of spending on education as some of the most prosperous countries such as the Netherlands, Japan, Germany, Australia, and France. The weakest and unresolved problem is the lack of data on health, housing, cultural and social dimensions. This information is crucial for better understanding of the education context and the conditions of education systems.
Resource and Process Indicators
The domain of costs, resources, and school processes comprises four subcategories, three of which are contained in the successive editions of EAG. The permanent subcategories concern financial resources, human resources (staff employed in education), and enrollments at the vari- ous levels (using enrollment ratios).
Financial indicators
There are eight financial indicators, but the eight in the third edition are not the same as those in the first. The financial section has been substantially reorganized. Thanks to the work carried out to improve the quality and comparability of the definitions and measurements of financial resources, the expenditure categories have been revised. A clear distinction has been made between education expenditures or costs and sources of education funds. New financial data collection questionnaires, with accompanying definitions and instructions, allowed the implementation of explicit categories of transfer payments and subsidies. The changes made it
282 N. BOTTANI
possible to trace flows of education funds from initial sources to ultimate users and to calculate both initial (before transfer) and final (after transfer) distributions of education fund- ing by source.
Moreover, the new instruments separate expenditures by or for educational institutions from subsidies to students. This distinction is especially relevant at the level of tertiary education. The total funds used to subsidize the living costs of students is very impressive; however, it is not currently possible to obtain adequate exact figures or even acceptable estimates because there are multiple sources of funds, not only by level of government but also by type of administra- tion. In France, for example, one 1994 estimate was that the total amount of financial aid for student living expenses (subsidies for room, board, and other living expenses) was around 18 billion French francs. While excluding these funds from the calculation of indicators allows avoiding major distortions in the calculation, it is not an acceptable solution. For some countries student scholarships and other subsidies are an important part of their education budgets and simply cannot be ignored. The actual figures concerning education expenditures are underestimated and the rank of countries in terms of education expenditures could change dramatically if one includes student subsidies in the total.
Participation indicators
Participation comprised six indicators in the first edition and seven in the subsequent editions. Again, the indicators in the third edition differ from those in the first: the labels are the same, but understanding the changes is important. Indicators have been constantly refined and improved. One example is the indicator on participation in formal education relative to the population aged 5 to 29. In EAG 3, the indicator includes a table on the average schooling expectancy which provides information about the hypothetical duration of schooling for a Syear-old child. The average expectancy is about 14 or 15 years. It is lowest - 13 years or less - in the Eastern countries and in Turkey. It is highest, 15.5 years or more, in Belgium, Denmark, France, Germany, and the Netherlands. A 5-year-old student in one of these latter countries has an aver- age of 15 years of schooling ahead of him or her. The student will not leave the formal education system before the age of 20.
This indicator is interesting because it corrects the distortion of the demography of the young generation in the calculation of gross enrollment rates. Two other new approaches developed in the 1995 edition are the calculation of the ratio of enrolled students in second educational programs of upper secondary education*, and calculation of the proportion of children who make the transition from childhood education to primary education. But the real new indicator in this section is the enrollments of adults in job-related continuing education and training which announced future developments in the area of adult education (OECD, 1995e; Borkowsky, Van der Heiden, & Tuijman, 1995).
*In some countries students who have completed a normal or regular program of upper secondary education and
graduated from that sequence (i.e., obtained the certificate or diploma) can enroll in upper secondary education again in
order to pursue another program. In this case these students are following a second upper secondary educational program. If these students then obtain an additional certificate or diploma, they graduate from a second (or subsequent)
upper secondary educational program.
Indicators of Educational Performance 283
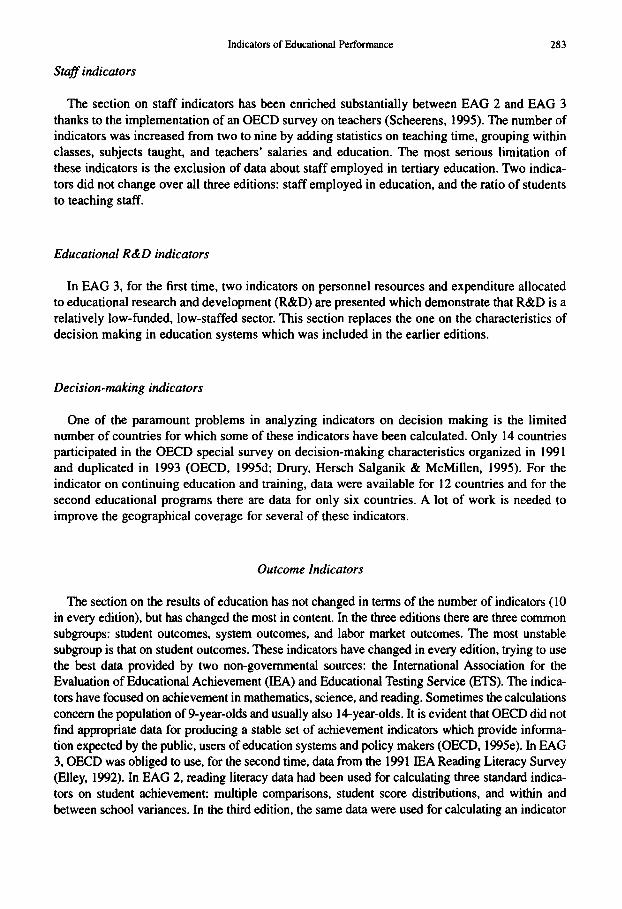
Staff indicators
The section on staff indicators has been enriched substantially between EAG 2 and EAG 3 thanks to the implementation of an OECD survey on teachers (Scheerens, 1995). The number of indicators was increased from two to nine by adding statistics on teaching time, grouping within classes, subjects taught, and teachers’ salaries and education. The most serious limitation of these indicators is the exclusion of data about staff employed in tertiary education. Two indica- tors did not change over all three editions: staff employed in education, and the ratio of students to teaching staff.
Educational R&D indicators
In EAG 3, for the first time, two indicators on personnel resources and expenditure allocated to educational research and development (R&D) are presented which demonstrate that R&D is a relatively low-funded, low-staffed sector. This section replaces the one on the characteristics of decision making in education systems which was included in the earlier editions.
Decision-making indicators
One of the paramount problems in analyzing indicators on decision making is the limited number of countries for which some of these indicators have been calculated. Only 14 countries participated in the OECD special survey on decision-making characteristics organized in 1991 and duplicated in 1993 (OECD, 1995d; Drury, Hersch Salganik & McMillen, 1995). For the indicator on continuing education and training, data were available for 12 countries and for the second educational programs there are data for only six countries. A lot of work is needed to improve the geographical coverage for several of these indicators.
Outcome Indicators
The section on the results of education has not changed in terms of the number of indicators (10 in every edition), but has changed the most in content. In the three editions there are three common subgroups: student outcomes, system outcomes, and labor market outcomes. The most unstable subgroup is that on student outcomes. These indicators have changed in every edition, trying to use the best data provided by two non-governmental sources: the International Association for the Evaluation of Educational Achievement (IEA) and Educational Testing Service (ETS). The indica- tors have focused on achievement in mathematics, science, and reading. Sometimes the calculations concern the population of 9-year-o& and usually also 14year-olds. It is evident that OECD did not find appropriate data for producing a stable set of achievement indicators which provide informa- tion expected by the public, users of education systems and policy makers (OECD, 1995e). In EAG 3, OECD was obliged to use, for the second time, data from the 1991 IRA Reading Literacy Survey (Elley, 1992). In EAG 2, reading literacy data had been used for calculating three standard indica- tors on student achievement: multiple comparisons, student score distributions, and within and between school variances. In the third edition, the same data were used for calculating an indicator
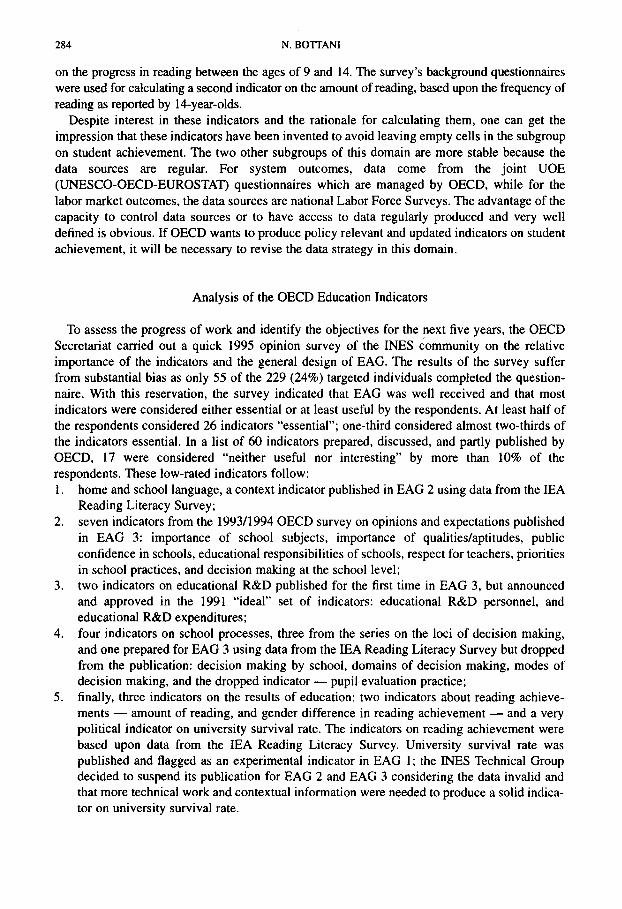
284 N. BOITANI
on the progress in reading between the ages of 9 and 14. The survey’s background questionnaires were used for calculating a second indicator on the amount of reading, based upon the frequency of reading as reported by lCyear-olds.
Despite interest in these indicators and the rationale for calculating them, one can get the impression that these indicators have been invented to avoid leaving empty cells in the subgroup on student achievement. The two other subgroups of this domain are more stable because the data sources are regular. For system outcomes, data come from the joint UOE (UNESCO-OECD-EUROSTAT) questionnaires which are managed by OECD, while for the labor market outcomes, the data sources are national Labor Force Surveys. The advantage of the capacity to control data sources or to have access to data regularly produced and very well defined is obvious. If OECD wants to produce policy relevant and updated indicators on student achievement, it will be necessary to revise the data strategy in this domain.
Analysis of the OECD Education Indicators
To assess the progress of work and identify the objectives for the next five years, the OECD Secretariat carried out a quick 1995 opinion survey of the INES community on the relative importance of the indicators and the general design of EAG. The results of the survey suffer from substantial bias as only 55 of the 229 (24%) targeted individuals completed the question- naire. With this reservation, the survey indicated that EAG was well received and that most indicators were considered either essential or at least useful by the respondents. At least half of the respondents considered 26 indicators “essential”; one-third considered almost two-thirds of the indicators essential. In a list of 60 indicators prepared, discussed, and partly published by OECD, 17 were considered “neither useful nor interesting” by more than 10% of the respondents. These low-rated indicators follow: 1. home and school language, a context indicator published in EAG 2 using data from the IEA
Reading Literacy Survey; 2. seven indicators from the 1993/1994 OECD survey on opinions and expectations published
in EAG 3: importance of school subjects, importance of qualities/aptitudes, public confidence in schools, educational responsibilities of schools, respect for teachers, priorities in school practices, and decision making at the school level;
3. two indicators on educational R&D published for the first time in EAG 3, but announced and approved in the 1991 “ideal” set of indicators: educational R&D personnel, and educational R&D expenditures;
4. four indicators on school processes, three from the series on the loci of decision making, and one prepared for EAG 3 using data from the IEA Reading Literacy Survey but dropped from the publication: decision making by school, domains of decision making, modes of decision making, and the dropped indicator - pupil evaluation practice;
5. finally, three indicators on the results of education: two indicators about reading achieve- ments - amount of reading, and gender difference in reading achievement - and a very political indicator on university survival rate. The indicators on reading achievement were based upon data from the IEA Reading Literacy Survey. University survival rate was published and flagged as an experimental indicator in EAG 1; the INES Technical Group decided to suspend its publication for EAG 2 and EAG 3 considering the data invalid and that more technical work and contextual information were needed to produce a solid indica- tor on university survival rate.
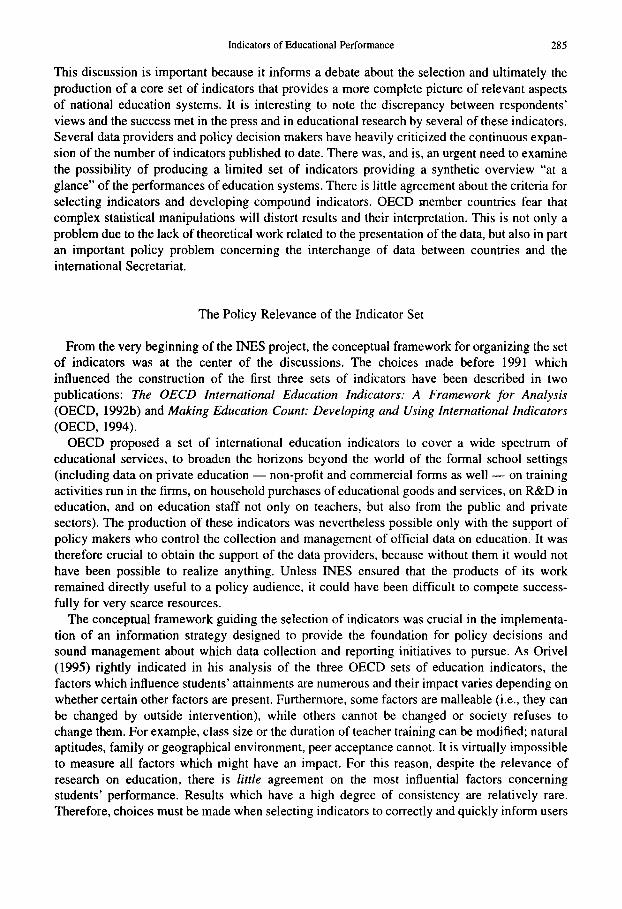
Indicators of Educational Performance 285
This discussion is important because it informs a debate about the selection and ultimately the production of a core set of indicators that provides a more complete picture of relevant aspects of national education systems. It is interesting to note the discrepancy between respondents’ views and the success met in the press and in educational research by several of these indicators. Several data providers and policy decision makers have heavily criticized the continuous expan- sion of the number of indicators published to date. There was, and is, an urgent need to examine the possibility of producing a limited set of indicators providing a synthetic overview “at a glance” of the performances of education systems. There is little agreement about the criteria for selecting indicators and developing compound indicators. OECD member countries fear that complex statistical manipulations will distort results and their interpretation. This is not only a problem due to the lack of theoretical work related to the presentation of the data, but also in part an important policy problem concerning the interchange of data between countries and the international Secretariat.
The Policy Relevance of the Indicator Set
From the very beginning of the INES project, the conceptual framework for organizing the set of indicators was at the center of the discussions. The choices made before 1991 which influenced the construction of the first three sets of indicators have been described in two publications: The OECD International Education Indicators: A Framework for Analysis (OECD, 1992b) and Making Education Count: Developing and Using International Indicators (OECD, 1994).
OECD proposed a set of international education indicators to cover a wide spectrum of educational services, to broaden the horizons beyond the world of the formal school settings (including data on private education - non-profit and commercial forms as well - on training activities run in the firms, on household purchases of educational goods and services, on R&D in education, and on education staff not only on teachers, but also from the public and private sectors). The production of these indicators was nevertheless possible only with the support of policy makers who control the collection and management of official data on education. It was therefore crucial to obtain the support of the data providers, because without them it would not have been possible to realize anything. Unless INES ensured that the products of its work remained directly useful to a policy audience, it could have been difficult to compete success- fully for very scarce resources,
The conceptual framework guiding the selection of indicators was crucial in the implementa- tion of an information strategy designed to provide the foundation for policy decisions and sound management about which data collection and reporting initiatives to pursue. As Orivel (1995) rightly indicated in his analysis of the three OECD sets of education indicators, the factors which influence students’ attainments are numerous and their impact varies depending on whether certain other factors are present. Furthermore, some factors are malleable (i.e., they can be changed by outside intervention), while others cannot be changed or society refuses to change them. For example, class size or the duration of teacher training can be modified; natural aptitudes, family or geographical environment, peer acceptance cannot. It is virtually impossible to measure all factors which might have an impact. For this reason, despite the relevance of research on education, there is little agreement on the most influential factors concerning students’ performance. Results which have a high degree of consistency are relatively rare. Therefore, choices must be made when selecting indicators to correctly and quickly inform users
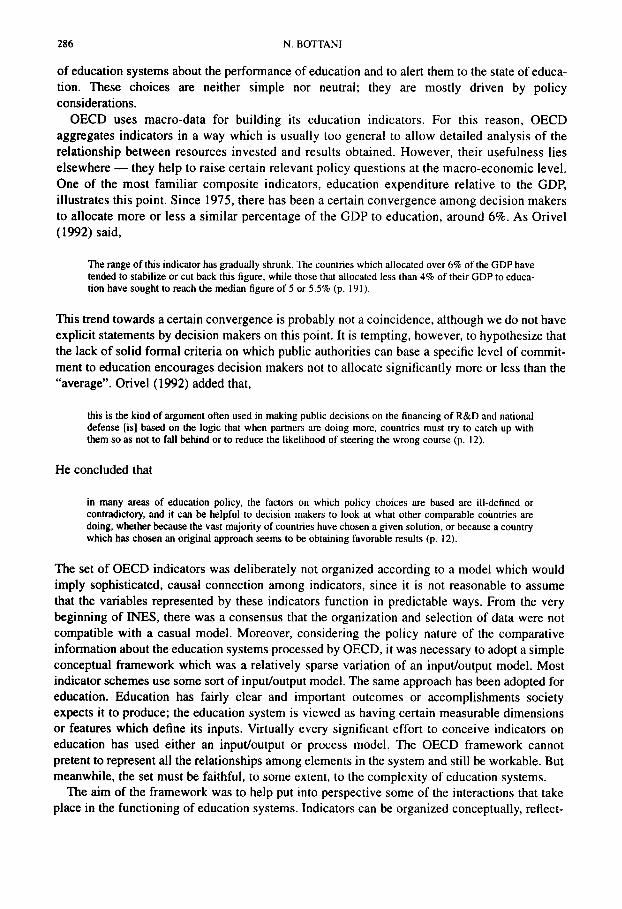
286 N. BOTTANI
of education systems about the performance of education and to alert them to the state of educa- tion. These choices are neither simple nor neutral; they are mostly driven by policy considerations.
OECD uses macro-data for building its education indicators. For this reason, OECD aggregates indicators in a way which is usually too general to allow detailed analysis of the relationship between resources invested and results obtained. However, their usefulness lies elsewhere - they help to raise certain relevant policy questions at the macro-economic level. One of the most familiar composite indicators, education expenditure relative to the GDP, illustrates this point. Since 1975, there has been a certain convergence among decision makers to allocate more or less a similar percentage of the GDP to education, around 6%. As Orivel (1992) said,
The range of this indicator has gradually shrunk. The countries which allocated over 6% of the GDP have tended to stabilize or cut back this figure, while those that allocated less than 4% of their GDP to educa- tion have sought to reach the median figure of 5 or 5.5% (p. 191).
This trend towards a certain convergence is probably not a coincidence, ahhough we do not have explicit statements by decision makers on this point. It is tempting, however, to hypothesize that the lack of solid formal criteria on which public authorities can base a specific level of commit- ment to education encourages decision makers not to allocate significantly more or less than the “average”. Orivel (1992) added that,
this is the kind of argument often used in making public decisions on the financing of R&D and national defense [is] based on the logic that when partners are doing more, countries must try to catch up with them so as not to fall behind or to reduce the likelihood of steering the wrong course (p. 12).
He concluded that
in many areas of education policy, the factors on which policy choices are based are ill-defined or contradictory, and it can be helpful to decision makers to look at what other comparable countries are doing, whether because the vast majority of countries have chosen a given solution, or because a country which has chosen an original approach seems to be obtaining favorable results (p, 12).
The set of OECD indicators was deliberately not organized according to a model which would imply sophisticated, causal connection among indicators, since it is not reasonable to assume that the variables represented by these indicators function in predictable ways. From the very beginning of INES, there was a consensus that the organization and selection of data were not compatible with a casual model. Moreover, considering the policy nature of the comparative information about the education systems processed by OECD, it was necessary to adopt a simple conceptual framework which was a relatively sparse variation of an input/output model. Most indicator schemes use some sort of input/output model. The same approach has been adopted for education. Education has fairly clear and important outcomes or accomplishments society expects it to produce; the education system is viewed as having certain measurable dimensions or features which define its inputs. Virtually every significant effort to conceive indicators on education has used either an input/output or process model. The OECD framework cannot pretent to represent all the relationships among elements in the system and still be workable. But meanwhile, the set must be faithful, to some extent, to the complexity of education systems.
The aim of the framework was to help put into perspective some of the interactions that take place in the functioning of education systems. Indicators can be organized conceptually, reflect-
Indicators of Educational Performance 287
ing a working model of the system they are intended to describe or pragmatically, like the gauges in a locomotive, to inform a set of specific, practical planning decisions, such as hiring staff where they are needed, allocating space, or addressing specific achievement problems. They also can be organized around policy issues such as equity, acquisition of learning, and/or contribution to economic productivity. The OECD set combines both conceptual and pragmatic bases and incorporates policy concerns. An approach of this nature seemed the most appropriate way to organize comparative international data on education in a broad policy-oriented frame.
It was thought that using a combined approach should provide some built-in balance between stability and flexibility in a set of indicators that would evolve over time. A conceptual model to design an indicator set would have more than likely generated a relatively rigid product that risked not being attuned to present concerns. Moreover, a lot of time would have been spent in reaching agreement on the model without producing any useful information and without any improvement of the data gathering strategy. A policy-issue approach would have had similar consequences from the operational point of view (it is necessary to remember that there was a consensus about the lack of validity of data gathered thus far) and would have produced highly volatile sets of indicators as priorities come and go.
The conceptual and organizational framework provided a structure for producing three sets of indicators. This framework is now outdated; it is not effective for piloting and controlling indicator development and it does not provide analytic support for the interpretation of data. Further work is urgently needed to revise it for the production of a new generation of indicators that should allow rigorous policy analysis of education systems.
Future Developments
The INES project proved that the indicator development process provides an opportunity to improve education statistics, to stimulate a process of exchange and innovation at the international level, and to establish international benchmarks.
The main point of agreement about future objectives concerns the definition of clear criteria for selecting a core set of indicators. It will be necessary to drop from the set indicators that are not really indicators at all, but simply statistical data. A serious effort is needed to develop composite indicators which are meaningful and useful.
OECD member countries agree that priority domains, hitherto neglected, include student achievement (curricular and cross-curricular competencies), higher education, the transition process from school to work, continuing education and training for adults, and educational disparities within each country. The crucial problem will be the capacity to obtain data on student achievement to satisfy the policy needs of member countries. OECD would like to find an acceptable solution to this problem before the year 2001. This means that member countries will have to seriously envisage the possibility of implementing a new data strategy, not merely focused on census data but using survey methodology based upon the use of representative samples.
This approach will represent a substantial change and improvement of established educa- tion statistics at OECD. It will involve more costs as well, because countries will not discharge their census practices which provide statistical data used by international organiza- tions. Thus, the implementation of surveys will at the same time allow the coordination of various data requests that have been expressed by the INES project and represent an additional burden for member countries.
288 N. BOTTANI
At the country level, the implementation of regular data collection through surveys, particularly on student achievement will call for the development of an appropriate infrastructure for data collection. For countries without a tradition of large-scale assessment studies or sample survey approaches in education, the decision to implement a second data collection approach representing a complement to a census approach could constitute an opportunity for diversifying and improving the capacity to generate and process new data. If such a decision is made, it will require a substantial reorganization of the statistical work and new expertise both at the national and international levels. This will be the major challenge of the next step of the INES project.
References
Borkowsky, A., Van der Heiden, M., & Tuijman, A. (1995) Indicators of continuing education and training. In OECD, Education and employment (pp. 139-156). Paris: Author.
Drury D., Hersch Salganik, L., & McMillen, M. (1995). Perspectives on decision-making in education systems and the development of the network C locus of decision-making survey. In OECD, Measuring the quality ofschoofs (pp. 179-199). Paris: Author.
Elley. W. B. (1992). How in the world do students read? IEA study of reading literacy. Hamburg: International Association for the Evaluation of Educational Achievement.
INES (1995). Public expectations of the final stage of compulsory education. Technical Report Network D. Edinburgh: The Scottish Office Education Department.
Organization for Economic Cooperation and Development [OECD] (1992a). Education at a glance. OECD Indicators. Paris: Author.
OECD (1992b). The OECD international educ&on indicators. A framework for analysis. Paris: Author. OECD (1993). Education at a glance 2. OECD Indicators. Paris: Author. OECD (1994). Making education count. Developing and using international indicators. Paris: Author. OECD (1995a). Education at a glance 3. OECD Indicators. Paris: Author. OECD (1995b). Public expectations of the final stage of compulsory education. Paris. Author. OECD (1995~). Measuring the quality of schools. Paris: Author. OECD (1995d). Decision-making in 14 OECD education systems. Paris: Author. OECD (1995e). Measuring what students learn. Paris: Author. OECD (19950. Education and employment. Paris: Author. Orivel, F. (1992). Le financement des systemes Bducatifs: Theories, contraintes et pratiques. In Actes du colloque,
L’enseignement en Europe, l’enseignement en belgique: Anaiyse. bilan et perspectives. Bruxelles: Universite Libre de Bruxelles Collection Education.
Orivel, F. (1995). Three sets of education indicators from OECD. Internal unpublished OECD paper. Paris: OECD. Scheerens, J. (1995). The selection and definitions of international indicators on teachers. In OECD, Measuring the
quality of schools (pp. 59-79). Paris: Author.
Biography
Norberto Bottani, Swiss, is Principal Administrator at OECD in Paris. He is head of the International Indicators of Education Systems (INES) at the Center for Educational Research and Innovation.


