Embed Size (px)
Citation preview
For updated information, please visit www.ibef.orgJanuary 2021
OIL & GAS
2
Executive Summary 3
Advantage India 4
Market Overview and Trends 6
Sector Drivers 9
Recent Trends and Strategies 24
Growth Drivers 30
Opportunities 36
Key Industry Contacts 38
Appendix 40
Table of Contents
3
Executive summary
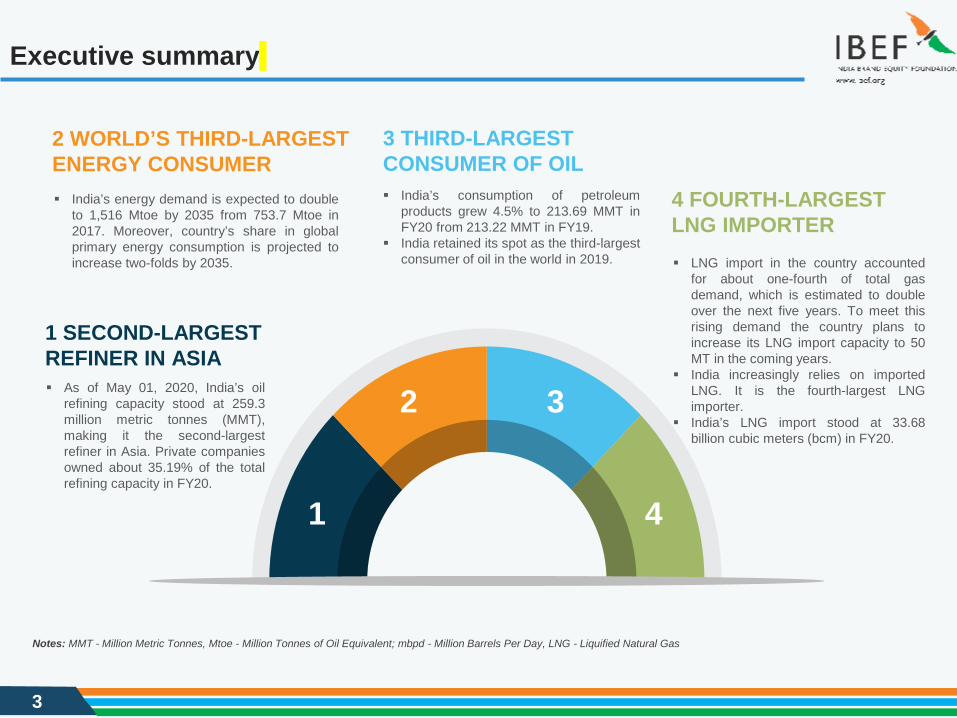
4 FOURTH-LARGEST LNG IMPORTER LNG import in the country accounted
for about one-fourth of total gasdemand, which is estimated to doubleover the next five years. To meet thisrising demand the country plans toincrease its LNG import capacity to 50MT in the coming years.
India increasingly relies on importedLNG. It is the fourth-largest LNGimporter.
India’s LNG import stood at 33.68billion cubic meters (bcm) in FY20.
1 SECOND-LARGEST REFINER IN ASIA As of May 01, 2020, India’s oil
refining capacity stood at 259.3million metric tonnes (MMT),making it the second-largestrefiner in Asia. Private companiesowned about 35.19% of the totalrefining capacity in FY20.
3 THIRD-LARGEST CONSUMER OF OIL India’s consumption of petroleum
products grew 4.5% to 213.69 MMT inFY20 from 213.22 MMT in FY19.
India retained its spot as the third-largestconsumer of oil in the world in 2019.
2 WORLD’S THIRD-LARGEST ENERGY CONSUMER India’s energy demand is expected to double
to 1,516 Mtoe by 2035 from 753.7 Mtoe in2017. Moreover, country’s share in globalprimary energy consumption is projected toincrease two-folds by 2035.
1
2 3
4
Notes: MMT - Million Metric Tonnes, Mtoe - Million Tonnes of Oil Equivalent; mbpd - Million Barrels Per Day, LNG - Liquified Natural Gas
4
Advantage India
5
Advantage India
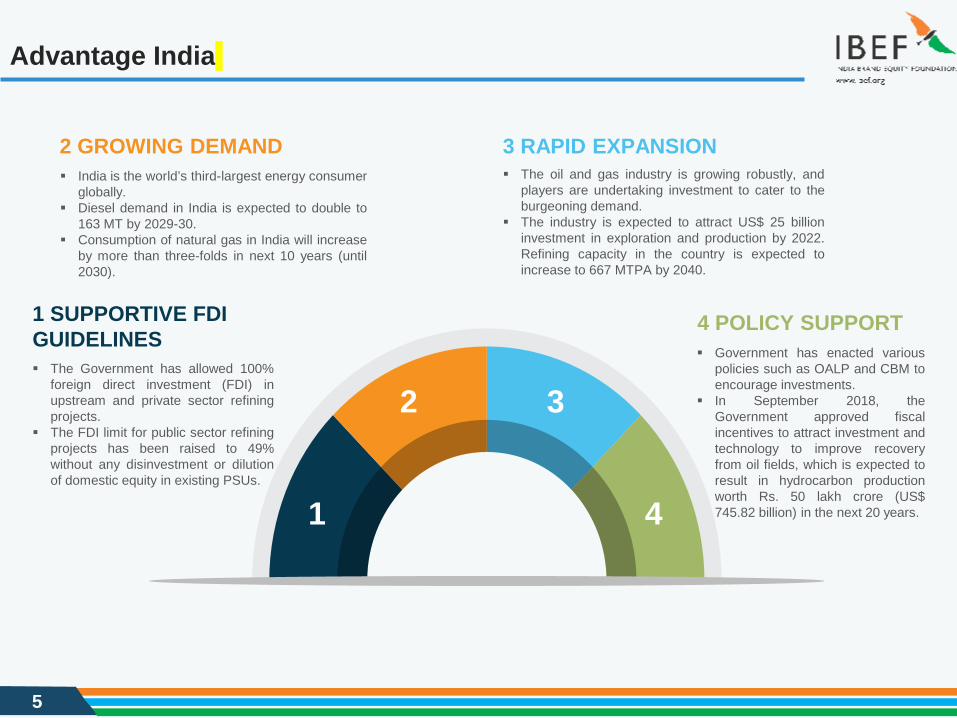
4 POLICY SUPPORT Government has enacted various
policies such as OALP and CBM toencourage investments.
In September 2018, theGovernment approved fiscalincentives to attract investment andtechnology to improve recoveryfrom oil fields, which is expected toresult in hydrocarbon productionworth Rs. 50 lakh crore (US$745.82 billion) in the next 20 years.
1 SUPPORTIVE FDI GUIDELINES The Government has allowed 100%
foreign direct investment (FDI) inupstream and private sector refiningprojects.
The FDI limit for public sector refiningprojects has been raised to 49%without any disinvestment or dilutionof domestic equity in existing PSUs.
3 RAPID EXPANSION The oil and gas industry is growing robustly, and
players are undertaking investment to cater to theburgeoning demand.
The industry is expected to attract US$ 25 billioninvestment in exploration and production by 2022.Refining capacity in the country is expected toincrease to 667 MTPA by 2040.
2 GROWING DEMAND India is the world’s third-largest energy consumer
globally. Diesel demand in India is expected to double to
163 MT by 2029-30. Consumption of natural gas in India will increase
by more than three-folds in next 10 years (until2030).
1
2 3
4
6
Market Overview And Trends
7
State-owned companies dominate oil and gas in India
Source: BP Statistical Review 2020, US Energy Information Administration, Petroleum Planning and Analysis Cell
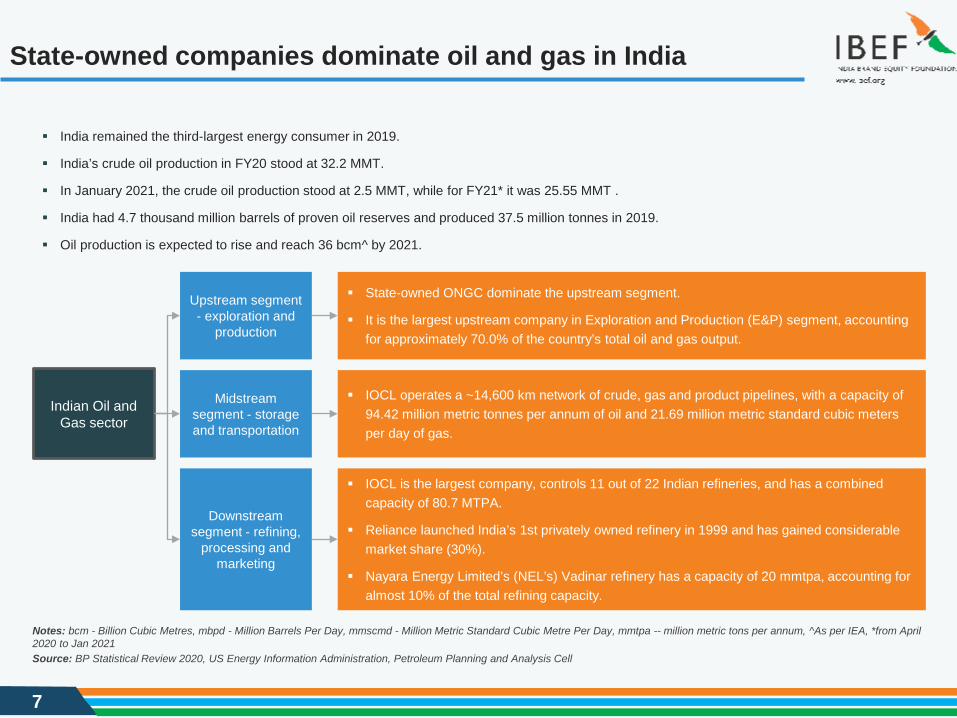
India remained the third-largest energy consumer in 2019.
India’s crude oil production in FY20 stood at 32.2 MMT.
In January 2021, the crude oil production stood at 2.5 MMT, while for FY21* it was 25.55 MMT .
India had 4.7 thousand million barrels of proven oil reserves and produced 37.5 million tonnes in 2019.
Oil production is expected to rise and reach 36 bcm^ by 2021.
Notes: bcm - Billion Cubic Metres, mbpd - Million Barrels Per Day, mmscmd - Million Metric Standard Cubic Metre Per Day, mmtpa -- million metric tons per annum, ^As per IEA, *from April 2020 to Jan 2021
State-owned ONGC dominate the upstream segment.
It is the largest upstream company in Exploration and Production (E&P) segment, accounting for approximately 70.0% of the country’s total oil and gas output.
IOCL operates a ~14,600 km network of crude, gas and product pipelines, with a capacity of 94.42 million metric tonnes per annum of oil and 21.69 million metric standard cubic meters per day of gas.
IOCL is the largest company, controls 11 out of 22 Indian refineries, and has a combined capacity of 80.7 MTPA.
Reliance launched India’s 1st privately owned refinery in 1999 and has gained considerable market share (30%).
Nayara Energy Limited’s (NEL’s) Vadinar refinery has a capacity of 20 mmtpa, accounting for almost 10% of the total refining capacity.
Indian Oil and Gas sector
Upstream segment - exploration and
production
Midstream segment - storage and transportation
Downstream segment - refining,
processing and marketing
8
Oil supply and demand in India
Source: Ministry of Petroleum and Natural Gas, BP Statistical Review 2020Note: CAGR - Compound Annual Growth Rate, mbpd - Million Barrels Per Day, P - Provisional, ^As per OPEC, Based on 50 MMT = 1 MBPD, *- Until November 2020
3.91 4.
23 4.63 4.
86 5.11 5.27
0.00
1.00
2.00
3.00
4.00
5.00
6.00
2014
2015
2016
2017
2018
2019
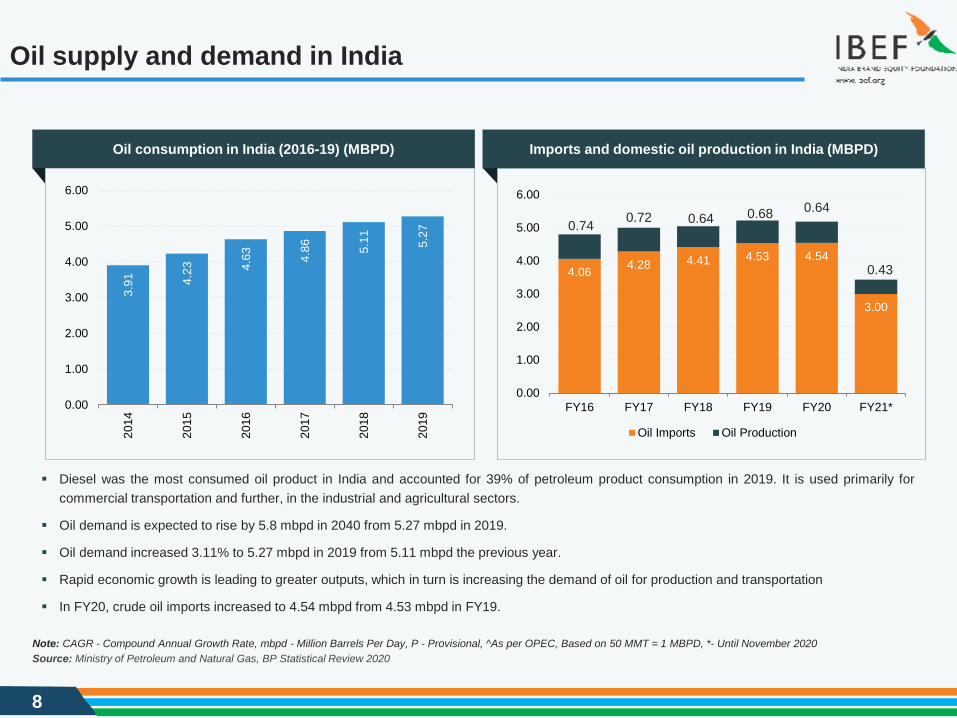
Oil consumption in India (2016-19) (MBPD)
Diesel was the most consumed oil product in India and accounted for 39% of petroleum product consumption in 2019. It is used primarily forcommercial transportation and further, in the industrial and agricultural sectors.
Oil demand is expected to rise by 5.8 mbpd in 2040 from 5.27 mbpd in 2019.
Oil demand increased 3.11% to 5.27 mbpd in 2019 from 5.11 mbpd the previous year.
Rapid economic growth is leading to greater outputs, which in turn is increasing the demand of oil for production and transportation
In FY20, crude oil imports increased to 4.54 mbpd from 4.53 mbpd in FY19.
Imports and domestic oil production in India (MBPD)
4.06 4.28 4.41 4.53 4.54
3.00
0.74 0.72 0.64 0.68 0.64
0.43
0.00
1.00
2.00
3.00
4.00
5.00
6.00
FY16 FY17 FY18 FY19 FY20 FY21*
Oil Imports Oil Production

9
Sector Drivers
10
Gas supply and demand in India
64,4
51
57,3
67
52,3
75
51,3
00
52,5
17
55,6
97
59,1
70
60,7
98
63,9
32
0
10000
20000
30000
40000
50000
60000
70000
FY12
FY13
FY14
FY15
FY16
FY17
FY18
FY19
FY20
Source: PPAC, BP Statistical Review 2020Note: F - Forecast, bcm - Billion Cubic Metres, CAGR - Compound Annual Growth Rate, *- Until November 2020
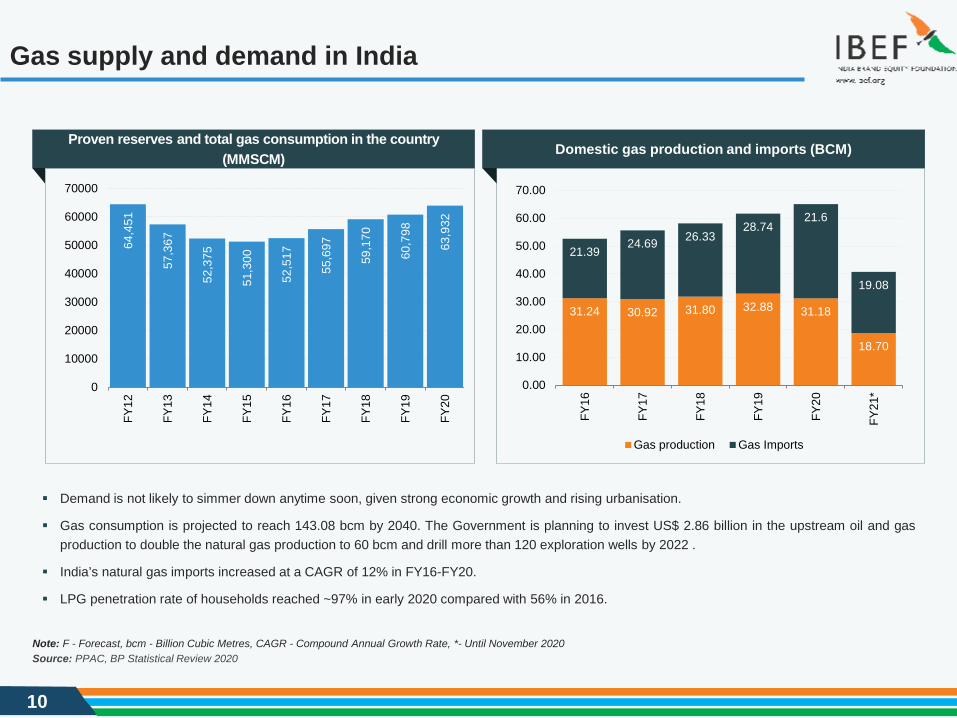
Demand is not likely to simmer down anytime soon, given strong economic growth and rising urbanisation.
Gas consumption is projected to reach 143.08 bcm by 2040. The Government is planning to invest US$ 2.86 billion in the upstream oil and gasproduction to double the natural gas production to 60 bcm and drill more than 120 exploration wells by 2022 .
India’s natural gas imports increased at a CAGR of 12% in FY16-FY20.
LPG penetration rate of households reached ~97% in early 2020 compared with 56% in 2016.
Proven reserves and total gas consumption in the country (MMSCM) Domestic gas production and imports (BCM)
31.24 30.92 31.80 32.88 31.18
18.70
21.3924.69 26.33
28.7421.6
19.08
0.00
10.00
20.00
30.00
40.00
50.00
60.00
70.00
FY16
FY17
FY18
FY19
FY20
FY21
*
Gas production Gas Imports
11
Exports of petroleum products from India
60.5465.51 66.76
61.1065.7
37.40
0
10
20
30
40
50
60
70
80
FY16
FY17
FY18
P
FY19
FY20
FY21
*
Source: PPAC, BP Statistical Review 2020
Note: MMT - Million Metric Tonnes, P - Provisional, HSD - High speed Diesel, MS - Motor Spirit, ATF - Aviation Turbine Fuel, LPG - Liquefied Petroleum Gas, LDO - Light Diesel Oil, SKO -Superior Kerosene Oil, LOBS - Lubricating Oil Base Stocks, ^Others includes Hexane, Benzene, MTO (Mineral Turpentine Oil), Sulphur, etc, *- Until November 2020
20,4
21
7,58
9
2,08
0
3,94
5
743
575
277
0 0 8 13 1,
760
0
5,000
10,000
15,000
20,000
25,000
HSD M
S
ATF
Nap
htha
Fuel
Oil
Petc
oke/
CBF
S
LPG
LDO
Bitu
men
SKO
LOBS
/ Lub
e O
il
Oth
ers^
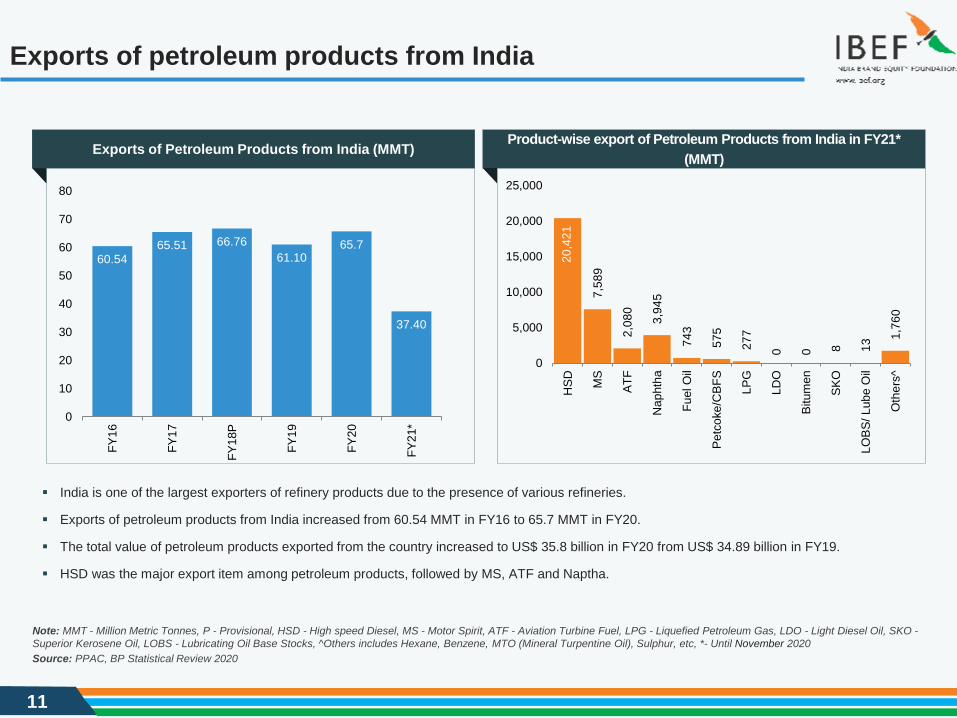
Product-wise export of Petroleum Products from India in FY21* (MMT)
India is one of the largest exporters of refinery products due to the presence of various refineries.
Exports of petroleum products from India increased from 60.54 MMT in FY16 to 65.7 MMT in FY20.
The total value of petroleum products exported from the country increased to US$ 35.8 billion in FY20 from US$ 34.89 billion in FY19.
HSD was the major export item among petroleum products, followed by MS, ATF and Naptha.
Exports of Petroleum Products from India (MMT)
12
Upstream segment: crude oil and gas production… (1/2)
Source: Ministry of Petroleum and Natural GasNotes: MMT - Million Metric Tonne, JV - Joint Venture, P-Provisional, *- Until November 2020
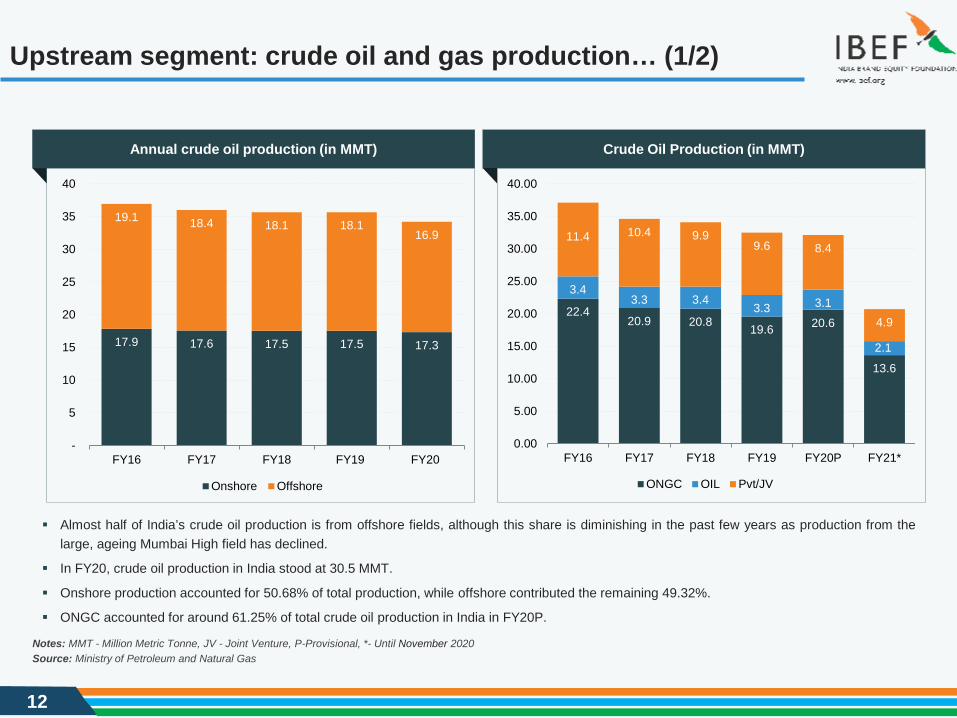
Crude Oil Production (in MMT)
17.9 17.6 17.5 17.5 17.3
19.1 18.4 18.1 18.116.9
-
5
10
15
20
25
30
35
40
FY16 FY17 FY18 FY19 FY20
Onshore Offshore
Almost half of India’s crude oil production is from offshore fields, although this share is diminishing in the past few years as production from thelarge, ageing Mumbai High field has declined.
In FY20, crude oil production in India stood at 30.5 MMT.
Onshore production accounted for 50.68% of total production, while offshore contributed the remaining 49.32%.
ONGC accounted for around 61.25% of total crude oil production in India in FY20P.
22.420.9 20.8 19.6 20.6
13.6
3.43.3 3.4
3.3 3.1
2.1
11.4 10.4 9.99.6 8.4
4.9
0.00
5.00
10.00
15.00
20.00
25.00
30.00
35.00
40.00
FY16 FY17 FY18 FY19 FY20P FY21*
ONGC OIL Pvt/JV
Annual crude oil production (in MMT)
13
Upstream segment: crude oil and gas production… (2/2)
Source: Ministry of Petroleum and Natural GasNote: JV - Joint Venture, ^Including CBM production *Provisional, ^- Until November 2020
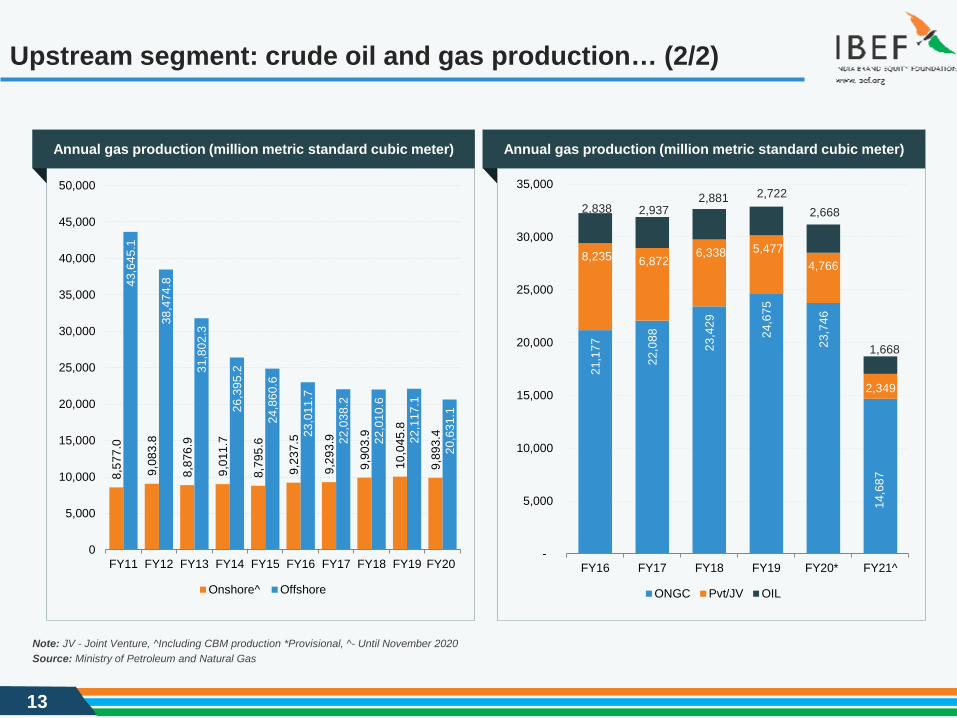
8,57
7.0
9,08
3.8
8,87
6.9
9,01
1.7
8,79
5.6
9,23
7.5
9,29
3.9
9,90
3.9
10,0
45.8
9,89
3.4
43,6
45.1
38,4
74.8
31,8
02.3
26,3
95.2
24,8
60.6
23,0
11.7
22,0
38.2
22,0
10.6
22,1
17.1
20,6
31.1
0
5,000
10,000
15,000
20,000
25,000
30,000
35,000
40,000
45,000
50,000
FY11 FY12 FY13 FY14 FY15 FY16 FY17 FY18 FY19 FY20
Onshore^ Offshore21
,177
22,0
88
23,4
29
24,6
75
23,7
46
14,6
87
8,235 6,872 6,338 5,477
4,766
2,349
2,838 2,937 2,881 2,722
2,668
1,668
-
5,000
10,000
15,000
20,000
25,000
30,000
35,000
FY16 FY17 FY18 FY19 FY20* FY21^
ONGC Pvt/JV OIL
Annual gas production (million metric standard cubic meter)Annual gas production (million metric standard cubic meter)
14
Upstream segment: exploration and development activities
5985
149
266
0
50
100
150
200
250
300
350
400
Offshore Onshore
Wells Meterage ('000 metres)
Source: Ministry of Petroleum and Natural Gas, BMINotes: P- Provisional, *OALP - Open Acreage Licensing Policy
63
338165
649
0
200
400
600
800
1000
1200
Offshore Onshore
Wells Meterage ('000 metres)
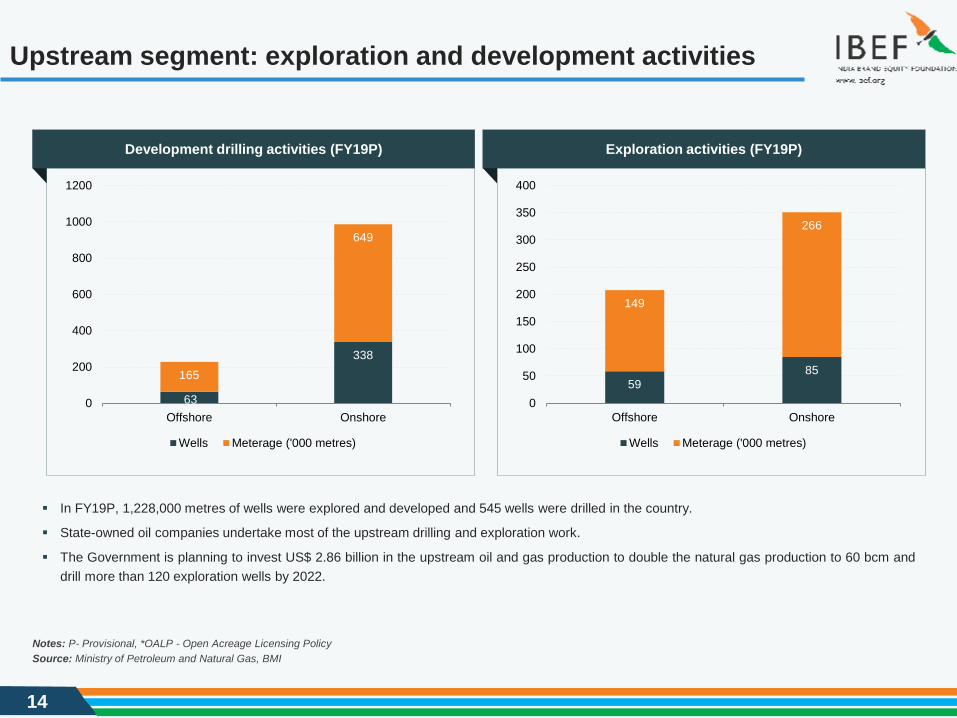
In FY19P, 1,228,000 metres of wells were explored and developed and 545 wells were drilled in the country.
State-owned oil companies undertake most of the upstream drilling and exploration work.
The Government is planning to invest US$ 2.86 billion in the upstream oil and gas production to double the natural gas production to 60 bcm anddrill more than 120 exploration wells by 2022.
Development drilling activities (FY19P) Exploration activities (FY19P)
15
Pipelines: crude pipeline network
40.97%
32.86%
6.09%
20.08%ONGC
IOC
OIL
Others*
50.88%
11.45%
12.31%
25.36%
IOCL
OIL
ONGC
Others*
Source: Ministry of Petroleum and Natural GasNote: km - Kilometre, mmtpa - Million Metric Tonnes Per Annum, *Others includes HMEL, BPCL and Cairn
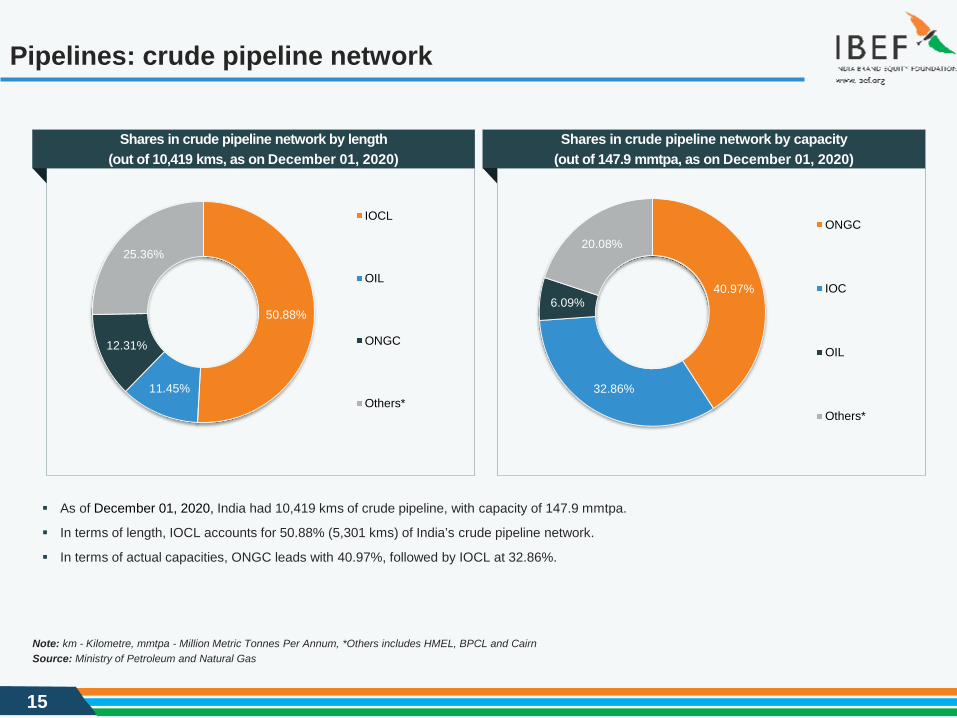
Shares in crude pipeline network by capacity (out of 147.9 mmtpa, as on December 01, 2020)
As of December 01, 2020, India had 10,419 kms of crude pipeline, with capacity of 147.9 mmtpa.
In terms of length, IOCL accounts for 50.88% (5,301 kms) of India’s crude pipeline network.
In terms of actual capacities, ONGC leads with 40.97%, followed by IOCL at 32.86%.
Shares in crude pipeline network by length (out of 10,419 kms, as on December 01, 2020)
16
Pipelines: existing pipelines in India
IOCL BPCL(1) HPCL(2) OIL ONGC Cairn HMEL Others (GAIL and Petronet India.) Total industry
Length (kms)
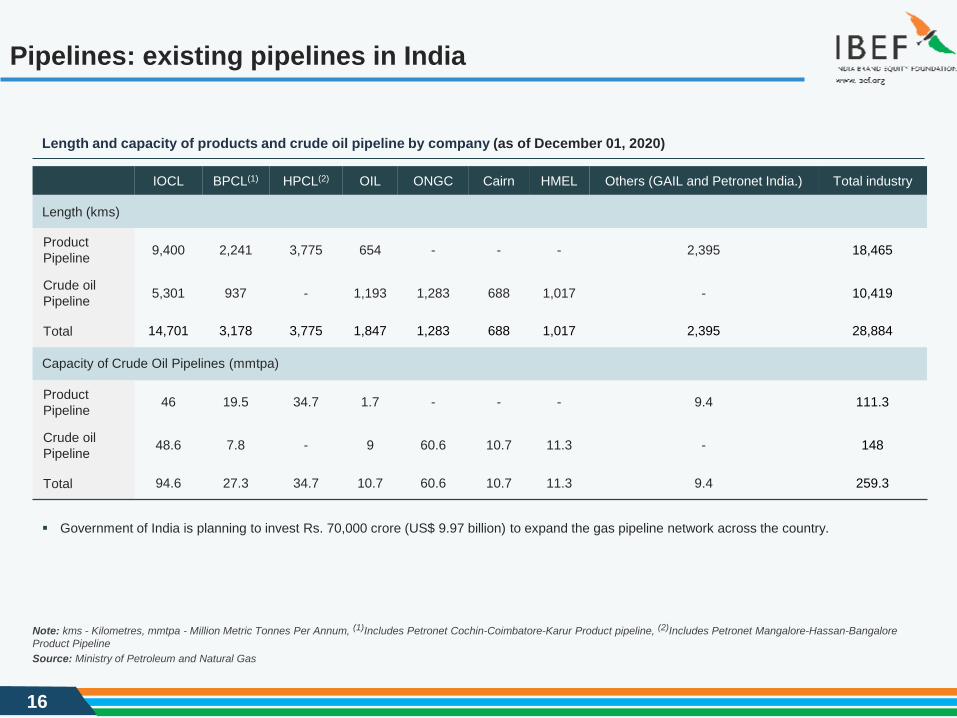
Product Pipeline 9,400 2,241 3,775 654 - - - 2,395 18,465
Crude oil Pipeline 5,301 937 - 1,193 1,283 688 1,017 - 10,419
Total 14,701 3,178 3,775 1,847 1,283 688 1,017 2,395 28,884
Capacity of Crude Oil Pipelines (mmtpa)
Product Pipeline 46 19.5 34.7 1.7 - - - 9.4 111.3
Crude oil Pipeline 48.6 7.8 - 9 60.6 10.7 11.3 - 148
Total 94.6 27.3 34.7 10.7 60.6 10.7 11.3 9.4 259.3
Source: Ministry of Petroleum and Natural Gas
Note: kms - Kilometres, mmtpa - Million Metric Tonnes Per Annum, (1)Includes Petronet Cochin-Coimbatore-Karur Product pipeline, (2)Includes Petronet Mangalore-Hassan-Bangalore Product Pipeline
Length and capacity of products and crude oil pipeline by company (as of December 01, 2020)
Government of India is planning to invest Rs. 70,000 crore (US$ 9.97 billion) to expand the gas pipeline network across the country.
17
Pipelines: refined products and LPG pipeline network
69.19%
13.31%
8.58%
1.83% 0.91%6.17% GAIL
GSPL
PIL
Reliance
IOCL
Others
50.91%
20.44%
12.14%
3.54%
12.97%IOC
HPCL
BPCL
OIL
Others
Source: Ministry of Petroleum and Natural Gas
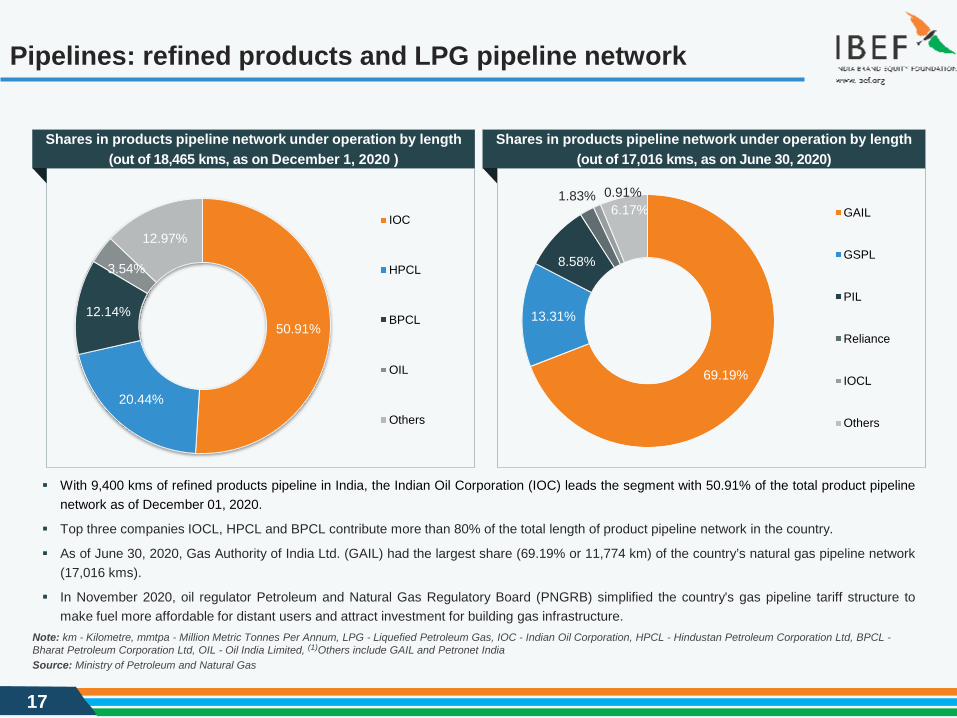
Shares in products pipeline network under operation by length (out of 18,465 kms, as on December 1, 2020 )
Shares in products pipeline network under operation by length(out of 17,016 kms, as on June 30, 2020)
With 9,400 kms of refined products pipeline in India, the Indian Oil Corporation (IOC) leads the segment with 50.91% of the total product pipelinenetwork as of December 01, 2020.
Top three companies IOCL, HPCL and BPCL contribute more than 80% of the total length of product pipeline network in the country.
As of June 30, 2020, Gas Authority of India Ltd. (GAIL) had the largest share (69.19% or 11,774 km) of the country’s natural gas pipeline network(17,016 kms).
In November 2020, oil regulator Petroleum and Natural Gas Regulatory Board (PNGRB) simplified the country's gas pipeline tariff structure tomake fuel more affordable for distant users and attract investment for building gas infrastructure.
Note: km - Kilometre, mmtpa - Million Metric Tonnes Per Annum, LPG - Liquefied Petroleum Gas, IOC - Indian Oil Corporation, HPCL - Hindustan Petroleum Corporation Ltd, BPCL -Bharat Petroleum Corporation Ltd, OIL - Oil India Limited, (1)Others include GAIL and Petronet India
18
Downstream segment: refinery crude throughput… (1/2)
108.03 112.5 112.17 112.13 115.11 122.58 130.57 134.22 134.73 144.20 154.30 160.77 169.16 164.80
88.40
33.43 38.29 48.5474.44 81.38 81.18
88.27 88.23 88.53 88.66 91.09 91.16 88.04 89.50
50.90
0
50
100
150
200
250
300
FY07
FY08
FY09
FY10
FY11
FY12
FY13
FY14
FY15
FY16
FY17
FY18
FY19
FY20
FY21
*
Public sector Private sector
Source: Ministry of Petroleum and Natural GasNote: MMT - Million Metric Tonne, Public Sector includes IOCL ,BPCL ,HPCL, CPCL and ONGC, Private sector includes RIL and NEL, *Provisional
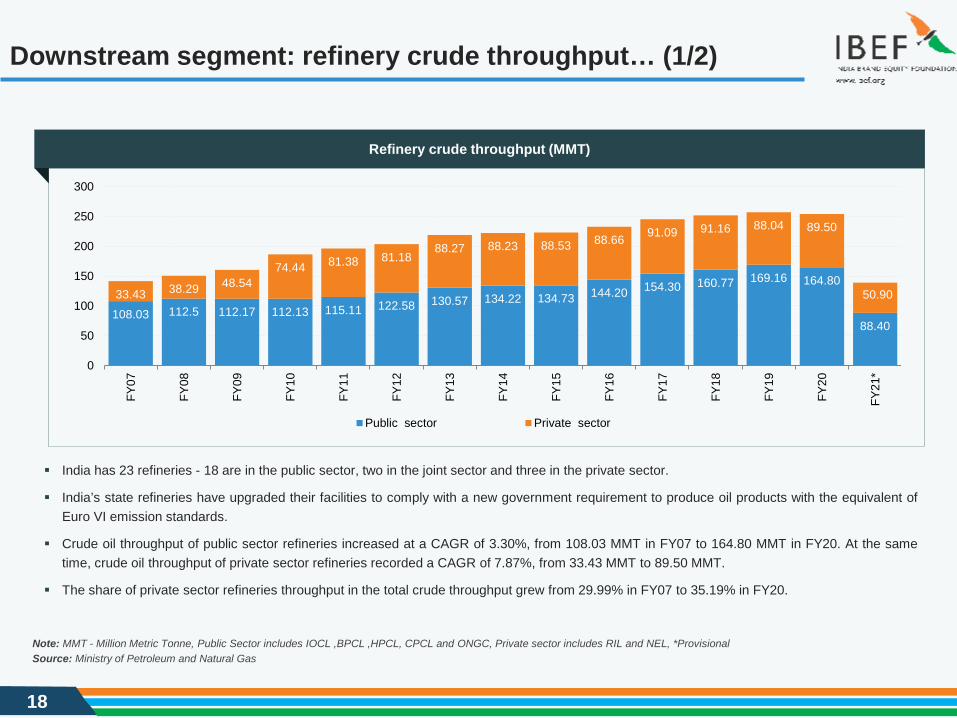
India has 23 refineries - 18 are in the public sector, two in the joint sector and three in the private sector.
India’s state refineries have upgraded their facilities to comply with a new government requirement to produce oil products with the equivalent ofEuro VI emission standards.
Crude oil throughput of public sector refineries increased at a CAGR of 3.30%, from 108.03 MMT in FY07 to 164.80 MMT in FY20. At the sametime, crude oil throughput of private sector refineries recorded a CAGR of 7.87%, from 33.43 MMT to 89.50 MMT.
The share of private sector refineries throughput in the total crude throughput grew from 29.99% in FY07 to 35.19% in FY20.
Refinery crude throughput (MMT)
19
Downstream segment: refinery crude throughput… (2/2)
116.
89
120.
07
120.
07
120.
07
120.
07
135.
07
139.
00
142.
10
142.
07
164.
80
161.
6776.5
0
93.0
0
95.0
0
95.0
0
95.0
0
95.0
0
95.0
0
105.
50
110.
00
89.5
0
88.2
0
0.00
50.00
100.00
150.00
200.00
250.00
300.00
Public sector Private sector (incl JV)
Source: Ministry of Petroleum and Natural Gas, PPAC
Total installed refinery capacity (MMT)
Note: MMT - Million Metric Tonne; HPCL - Hindustan Petroleum Corporation Ltd, BPCL - Bharat Petroleum Corporation Ltd, OIL - Oil India Limited, ONGC - Oil and Natural Gas Corporation, IOCL - Indian Oil Corporation Ltd, CPCL - Chennai Petroleum Corporation Limited, FY 21* - December 01, 2020
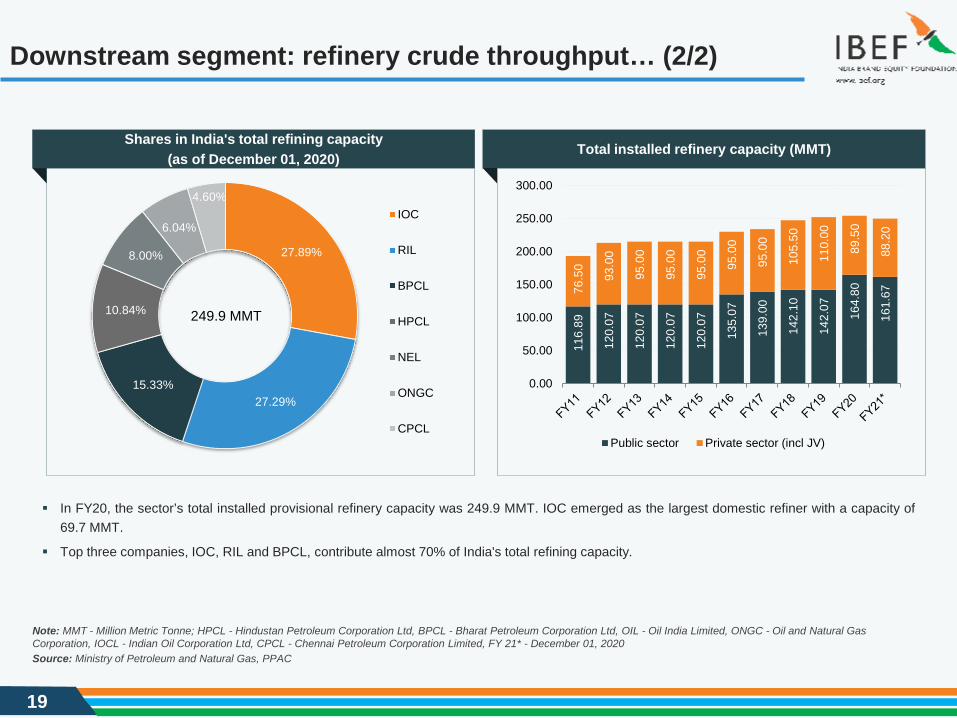
In FY20, the sector’s total installed provisional refinery capacity was 249.9 MMT. IOC emerged as the largest domestic refiner with a capacity of69.7 MMT.
Top three companies, IOC, RIL and BPCL, contribute almost 70% of India's total refining capacity.
249.9 MMT
27.89%
27.29%15.33%
10.84%
8.00%
6.04%
4.60%IOC
RIL
BPCL
HPCL
NEL
ONGC
CPCL
Shares in India's total refining capacity (as of December 01, 2020)
20
Downstream segment: petroleum products
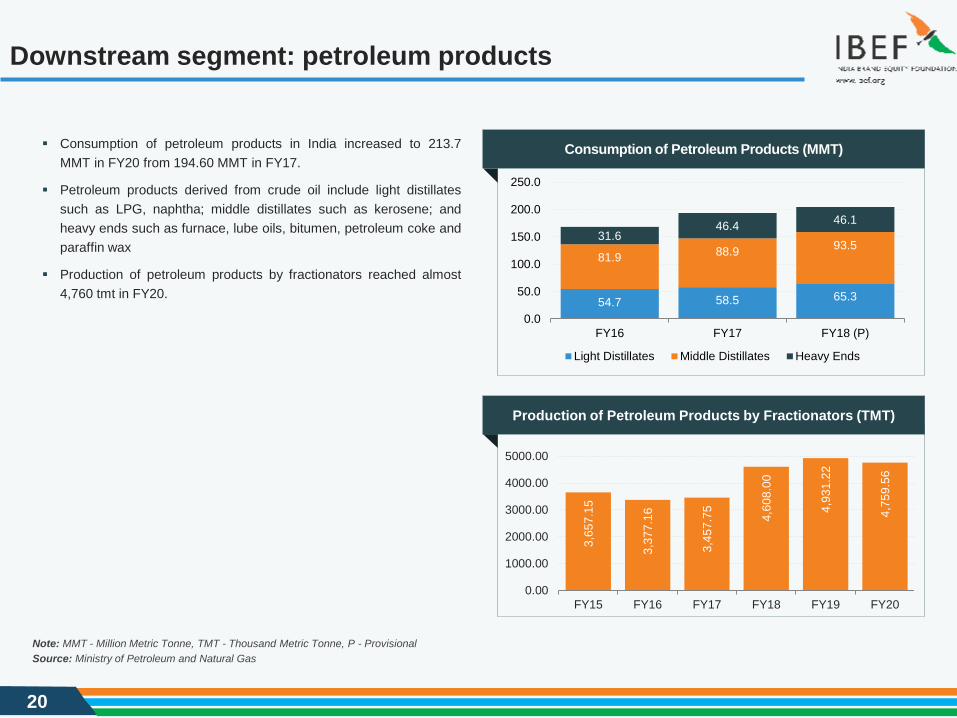
Consumption of petroleum products in India increased to 213.7MMT in FY20 from 194.60 MMT in FY17.
Petroleum products derived from crude oil include light distillatessuch as LPG, naphtha; middle distillates such as kerosene; andheavy ends such as furnace, lube oils, bitumen, petroleum coke andparaffin wax
Production of petroleum products by fractionators reached almost4,760 tmt in FY20. 54.7 58.5 65.3
81.9 88.9 93.531.6
46.4 46.1
0.0
50.0
100.0
150.0
200.0
250.0
FY16 FY17 FY18 (P)
Light Distillates Middle Distillates Heavy Ends
Source: Ministry of Petroleum and Natural Gas
3,65
7.15
3,37
7.16
3,45
7.75 4,
608.
00
4,93
1.22
4,75
9.56
0.00
1000.00
2000.00
3000.00
4000.00
5000.00
FY15 FY16 FY17 FY18 FY19 FY20
Production of Petroleum Products by Fractionators (TMT)
Note: MMT - Million Metric Tonne, TMT - Thousand Metric Tonne, P - Provisional
Consumption of Petroleum Products (MMT)
21
Downstream segment: distribution and marketing
85.1
0
89.5
7
97.7
0
104.
50
110.
50
114.
30
111.
30
109.
72
97.3
6
97.3
6
96.6
1
107.
58
102.
36
93.6
9
0.0
50.0
100.0
150.0
200.0
250.0
FY14 FY15 FY16 FY17 FY18 FY19 FY20*Product pipeline Natural Gas Pipeline
Downstream distribution statistics (MMT)
PipelineCapacity (mmtpa)
as on December 01, 2020
Length (kms)as on
December 01, 2020
Crude Pipeline 147.9 10,419
Product Pipeline 111.3 18,465
Natural Gas Pipeline* 337.3 17,016
Note: MMT - Million Metric Tonne, mmtpa - Million Metric Tonnes Per Annum, OMC - Oil Marketing Companies, (P) - Provisional, PSU - Public Sector Unit, *- as on 1st December 2020 for product pipeline and on 30th June 2020 for natural gas pipeline
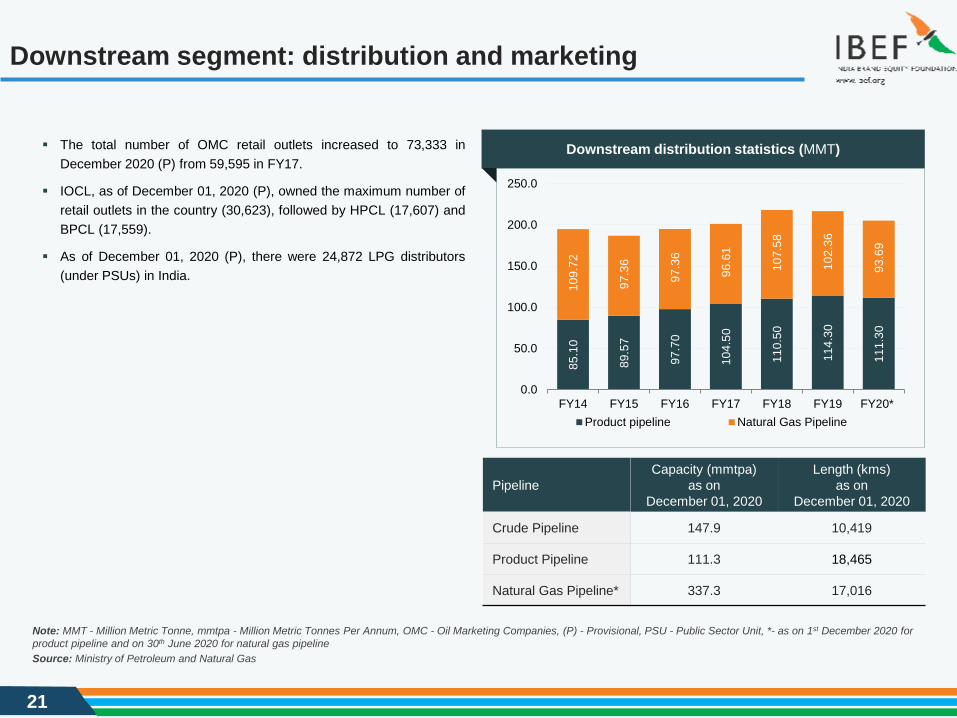
The total number of OMC retail outlets increased to 73,333 inDecember 2020 (P) from 59,595 in FY17.
IOCL, as of December 01, 2020 (P), owned the maximum number ofretail outlets in the country (30,623), followed by HPCL (17,607) andBPCL (17,559).
As of December 01, 2020 (P), there were 24,872 LPG distributors(under PSUs) in India.
Source: Ministry of Petroleum and Natural Gas
22
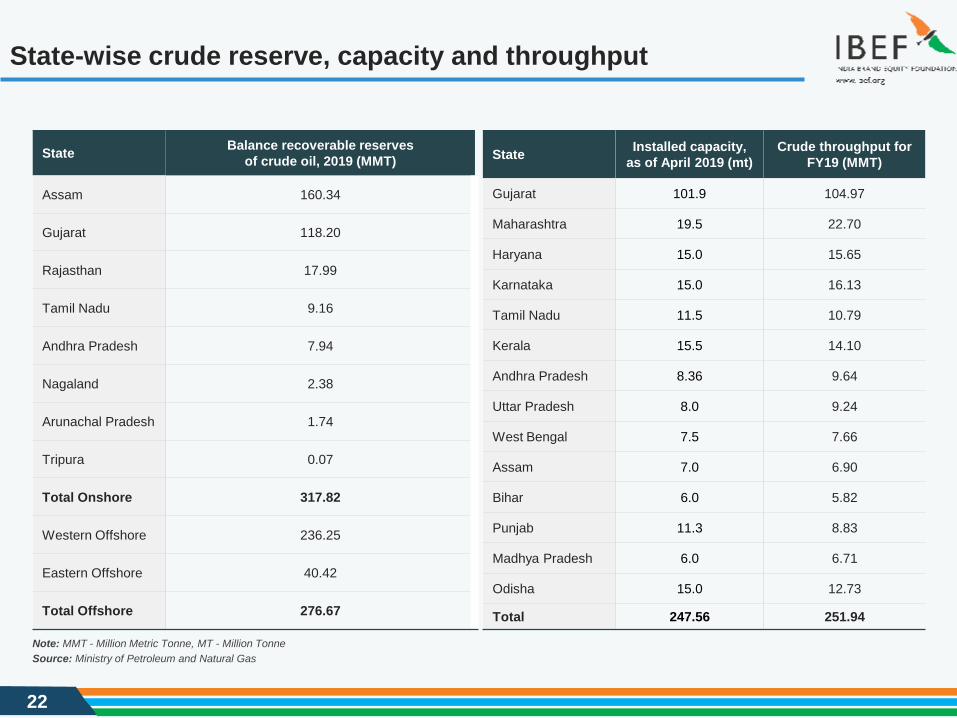
State-wise crude reserve, capacity and throughput
Source: Ministry of Petroleum and Natural Gas
State Balance recoverable reserves of crude oil, 2019 (MMT)
Assam 160.34
Gujarat 118.20
Rajasthan 17.99
Tamil Nadu 9.16
Andhra Pradesh 7.94
Nagaland 2.38
Arunachal Pradesh 1.74
Tripura 0.07
Total Onshore 317.82
Western Offshore 236.25
Eastern Offshore 40.42
Total Offshore 276.67
State Installed capacity, as of April 2019 (mt)
Crude throughput for FY19 (MMT)
Gujarat 101.9 104.97
Maharashtra 19.5 22.70
Haryana 15.0 15.65
Karnataka 15.0 16.13
Tamil Nadu 11.5 10.79
Kerala 15.5 14.10
Andhra Pradesh 8.36 9.64
Uttar Pradesh 8.0 9.24
West Bengal 7.5 7.66
Assam 7.0 6.90
Bihar 6.0 5.82
Punjab 11.3 8.83
Madhya Pradesh 6.0 6.71
Odisha 15.0 12.73
Total 247.56 251.94
Note: MMT - Million Metric Tonne, MT - Million Tonne
23
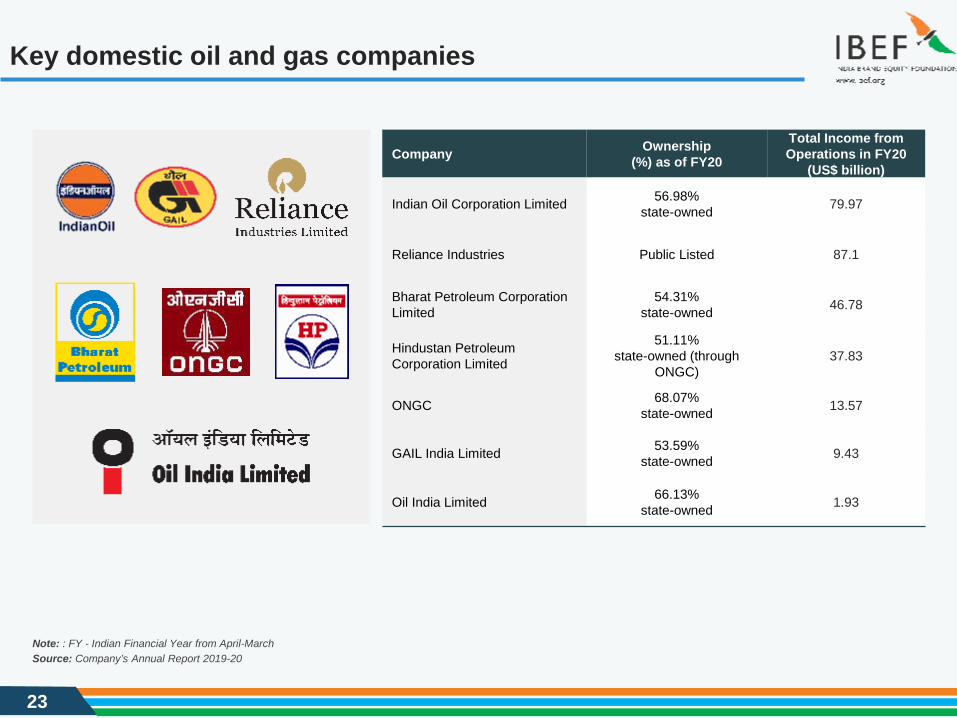
Key domestic oil and gas companies
Source: Company’s Annual Report 2019-20
Company Ownership (%) as of FY20
Total Income from Operations in FY20
(US$ billion)
Indian Oil Corporation Limited 56.98% state-owned 79.97
Reliance Industries Public Listed 87.1
Bharat Petroleum Corporation Limited
54.31% state-owned 46.78
Hindustan Petroleum Corporation Limited
51.11% state-owned (through
ONGC)37.83
ONGC 68.07% state-owned 13.57
GAIL India Limited 53.59% state-owned 9.43
Oil India Limited 66.13% state-owned 1.93
Note: : FY - Indian Financial Year from April-March

24
Recent Trends and Strategies
25
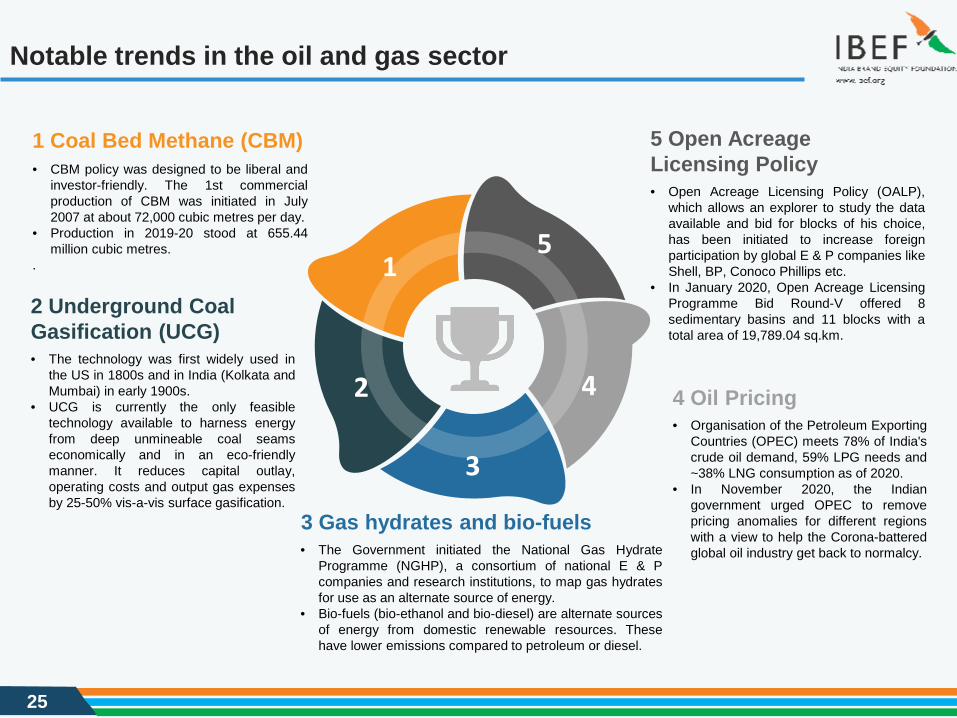
Notable trends in the oil and gas sector
5 Open Acreage Licensing Policy• Open Acreage Licensing Policy (OALP),
which allows an explorer to study the dataavailable and bid for blocks of his choice,has been initiated to increase foreignparticipation by global E & P companies likeShell, BP, Conoco Phillips etc.
• In January 2020, Open Acreage LicensingProgramme Bid Round-V offered 8sedimentary basins and 11 blocks with atotal area of 19,789.04 sq.km.
1 Coal Bed Methane (CBM)• CBM policy was designed to be liberal and
investor-friendly. The 1st commercialproduction of CBM was initiated in July2007 at about 72,000 cubic metres per day.
• Production in 2019-20 stood at 655.44million cubic metres.
.5
4
3
2
1
4 Oil Pricing• Organisation of the Petroleum Exporting
Countries (OPEC) meets 78% of India'scrude oil demand, 59% LPG needs and~38% LNG consumption as of 2020.
• In November 2020, the Indiangovernment urged OPEC to removepricing anomalies for different regionswith a view to help the Corona-batteredglobal oil industry get back to normalcy.
2 Underground Coal Gasification (UCG)• The technology was first widely used in
the US in 1800s and in India (Kolkata andMumbai) in early 1900s.
• UCG is currently the only feasibletechnology available to harness energyfrom deep unmineable coal seamseconomically and in an eco-friendlymanner. It reduces capital outlay,operating costs and output gas expensesby 25-50% vis-a-vis surface gasification.
3 Gas hydrates and bio-fuels• The Government initiated the National Gas Hydrate
Programme (NGHP), a consortium of national E & Pcompanies and research institutions, to map gas hydratesfor use as an alternate source of energy.
• Bio-fuels (bio-ethanol and bio-diesel) are alternate sourcesof energy from domestic renewable resources. Thesehave lower emissions compared to petroleum or diesel.
26
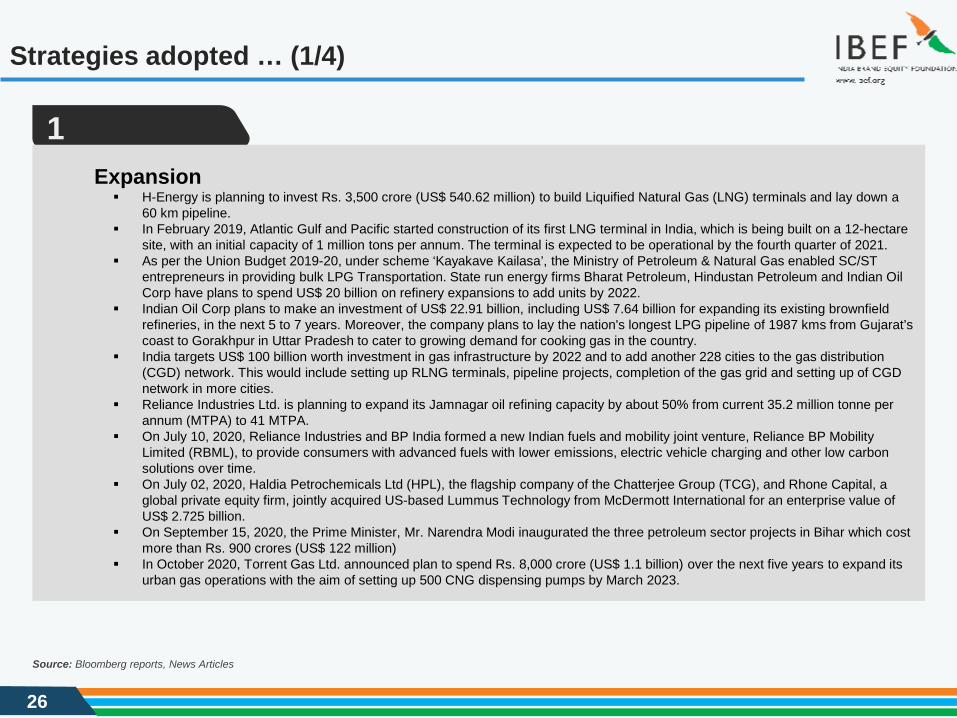
Strategies adopted … (1/4)
Source: Bloomberg reports, News Articles
1Expansion H-Energy is planning to invest Rs. 3,500 crore (US$ 540.62 million) to build Liquified Natural Gas (LNG) terminals and lay down a
60 km pipeline. In February 2019, Atlantic Gulf and Pacific started construction of its first LNG terminal in India, which is being built on a 12-hectare
site, with an initial capacity of 1 million tons per annum. The terminal is expected to be operational by the fourth quarter of 2021. As per the Union Budget 2019-20, under scheme ‘Kayakave Kailasa’, the Ministry of Petroleum & Natural Gas enabled SC/ST
entrepreneurs in providing bulk LPG Transportation. State run energy firms Bharat Petroleum, Hindustan Petroleum and Indian Oil Corp have plans to spend US$ 20 billion on refinery expansions to add units by 2022.
Indian Oil Corp plans to make an investment of US$ 22.91 billion, including US$ 7.64 billion for expanding its existing brownfield refineries, in the next 5 to 7 years. Moreover, the company plans to lay the nation's longest LPG pipeline of 1987 kms from Gujarat’s coast to Gorakhpur in Uttar Pradesh to cater to growing demand for cooking gas in the country.
India targets US$ 100 billion worth investment in gas infrastructure by 2022 and to add another 228 cities to the gas distribution (CGD) network. This would include setting up RLNG terminals, pipeline projects, completion of the gas grid and setting up of CGDnetwork in more cities.
Reliance Industries Ltd. is planning to expand its Jamnagar oil refining capacity by about 50% from current 35.2 million tonne per annum (MTPA) to 41 MTPA.
On July 10, 2020, Reliance Industries and BP India formed a new Indian fuels and mobility joint venture, Reliance BP MobilityLimited (RBML), to provide consumers with advanced fuels with lower emissions, electric vehicle charging and other low carbonsolutions over time.
On July 02, 2020, Haldia Petrochemicals Ltd (HPL), the flagship company of the Chatterjee Group (TCG), and Rhone Capital, a global private equity firm, jointly acquired US-based Lummus Technology from McDermott International for an enterprise value of US$ 2.725 billion.
On September 15, 2020, the Prime Minister, Mr. Narendra Modi inaugurated the three petroleum sector projects in Bihar which costmore than Rs. 900 crores (US$ 122 million)
In October 2020, Torrent Gas Ltd. announced plan to spend Rs. 8,000 crore (US$ 1.1 billion) over the next five years to expand its urban gas operations with the aim of setting up 500 CNG dispensing pumps by March 2023.
27
Strategies adopted… (2/4)
Source: News Articles, techARC1
Notes: ISEER - Indian Seasonal Energy Efficiency Ratio
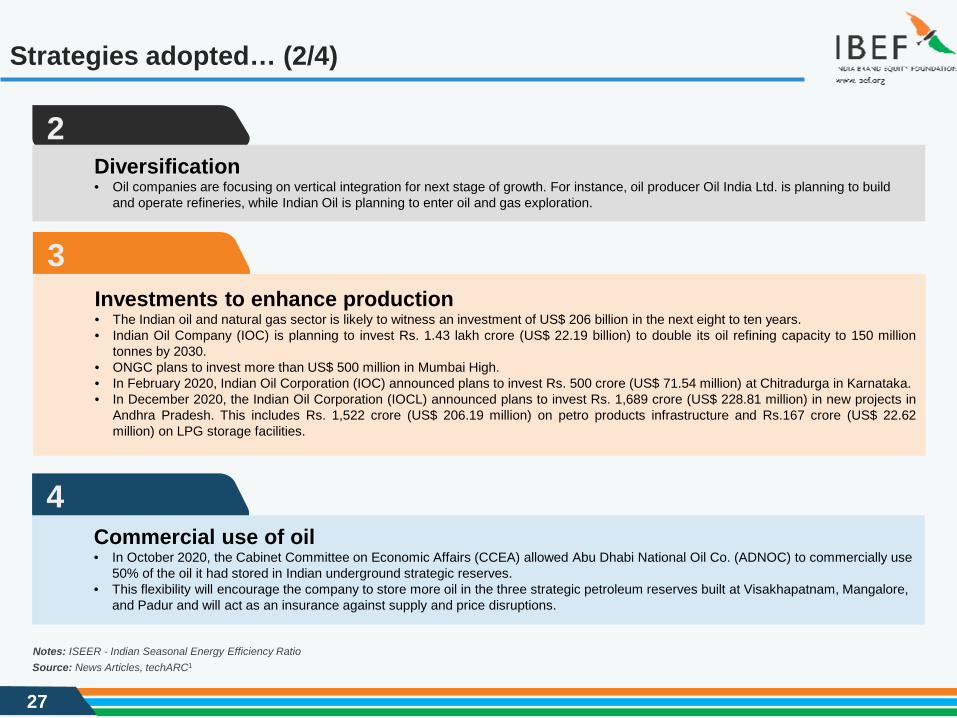
2Diversification• Oil companies are focusing on vertical integration for next stage of growth. For instance, oil producer Oil India Ltd. is planning to build
and operate refineries, while Indian Oil is planning to enter oil and gas exploration.
3Investments to enhance production • The Indian oil and natural gas sector is likely to witness an investment of US$ 206 billion in the next eight to ten years.• Indian Oil Company (IOC) is planning to invest Rs. 1.43 lakh crore (US$ 22.19 billion) to double its oil refining capacity to 150 million
tonnes by 2030.• ONGC plans to invest more than US$ 500 million in Mumbai High.• In February 2020, Indian Oil Corporation (IOC) announced plans to invest Rs. 500 crore (US$ 71.54 million) at Chitradurga in Karnataka.• In December 2020, the Indian Oil Corporation (IOCL) announced plans to invest Rs. 1,689 crore (US$ 228.81 million) in new projects in
Andhra Pradesh. This includes Rs. 1,522 crore (US$ 206.19 million) on petro products infrastructure and Rs.167 crore (US$ 22.62million) on LPG storage facilities.
4Commercial use of oil• In October 2020, the Cabinet Committee on Economic Affairs (CCEA) allowed Abu Dhabi National Oil Co. (ADNOC) to commercially use
50% of the oil it had stored in Indian underground strategic reserves. • This flexibility will encourage the company to store more oil in the three strategic petroleum reserves built at Visakhapatnam, Mangalore,
and Padur and will act as an insurance against supply and price disruptions.
28
Strategies adopted… (3/4)
Source: CEAMA, India Retail Report, Business Line, IMAP India, News Sources
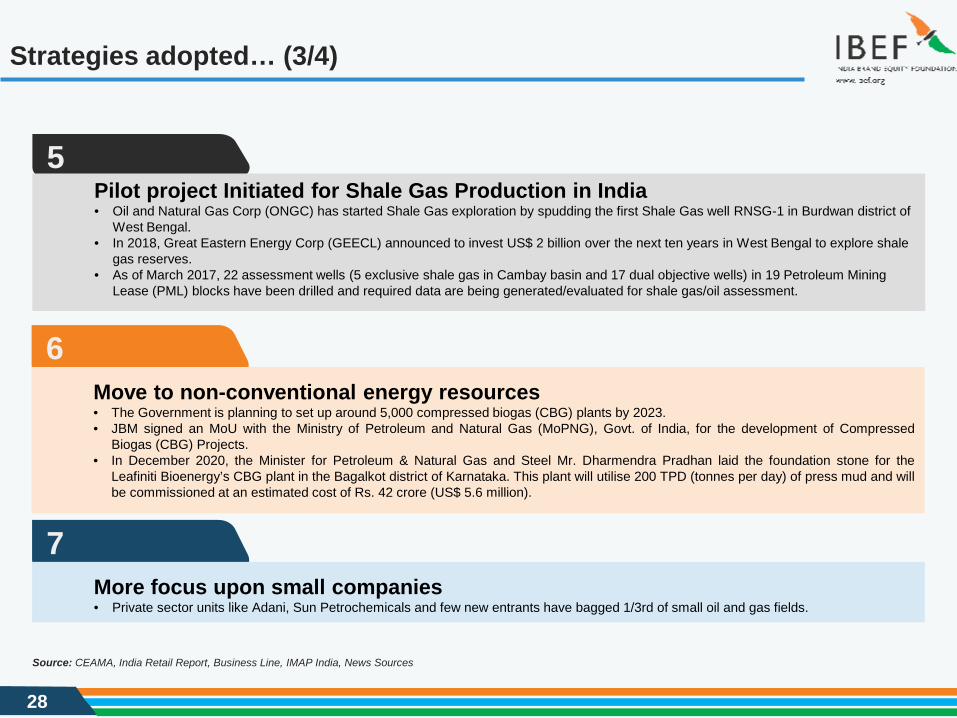
6Move to non-conventional energy resources • The Government is planning to set up around 5,000 compressed biogas (CBG) plants by 2023.• JBM signed an MoU with the Ministry of Petroleum and Natural Gas (MoPNG), Govt. of India, for the development of Compressed
Biogas (CBG) Projects.• In December 2020, the Minister for Petroleum & Natural Gas and Steel Mr. Dharmendra Pradhan laid the foundation stone for the
Leafiniti Bioenergy’s CBG plant in the Bagalkot district of Karnataka. This plant will utilise 200 TPD (tonnes per day) of press mud and willbe commissioned at an estimated cost of Rs. 42 crore (US$ 5.6 million).
7More focus upon small companies• Private sector units like Adani, Sun Petrochemicals and few new entrants have bagged 1/3rd of small oil and gas fields.
5Pilot project Initiated for Shale Gas Production in India • Oil and Natural Gas Corp (ONGC) has started Shale Gas exploration by spudding the first Shale Gas well RNSG-1 in Burdwan district of
West Bengal. • In 2018, Great Eastern Energy Corp (GEECL) announced to invest US$ 2 billion over the next ten years in West Bengal to explore shale
gas reserves.• As of March 2017, 22 assessment wells (5 exclusive shale gas in Cambay basin and 17 dual objective wells) in 19 Petroleum Mining
Lease (PML) blocks have been drilled and required data are being generated/evaluated for shale gas/oil assessment.
29
Strategies adopted… (4/4)
Source: CEAMA, India Retail Report, Business Line, IMAP India, News Sources
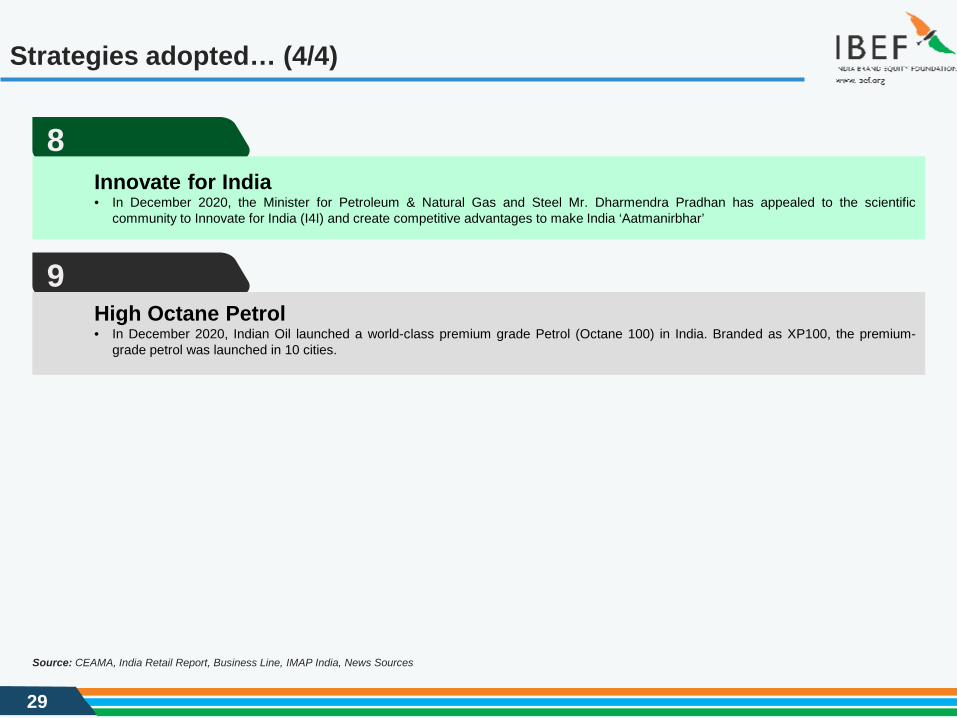
9High Octane Petrol• In December 2020, Indian Oil launched a world-class premium grade Petrol (Octane 100) in India. Branded as XP100, the premium-
grade petrol was launched in 10 cities.
8Innovate for India• In December 2020, the Minister for Petroleum & Natural Gas and Steel Mr. Dharmendra Pradhan has appealed to the scientific
community to Innovate for India (I4I) and create competitive advantages to make India ‘Aatmanirbhar’

30
Growth Drivers
31
Growth drivers
Source: Ministry of Petroleum and Natural Gas, US Energy Information Administration, BP Statistical Review of World 2015 Energy, June 2012; BMINotes: TCM - Trillion Cubic Metres, EandP - Exploration and Production
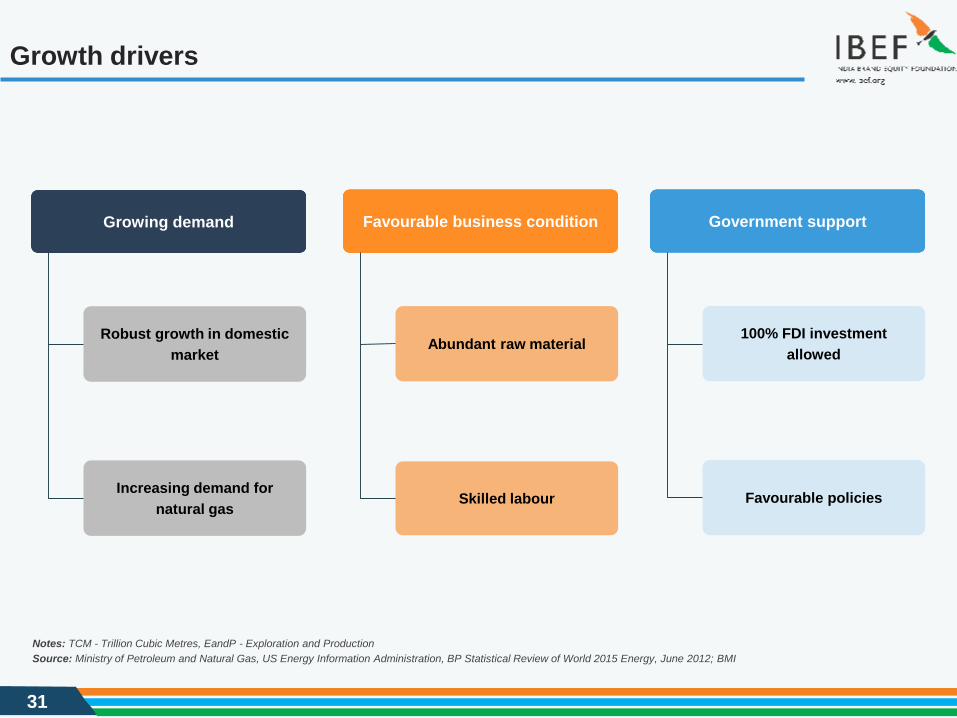
Growing demand
Robust growth in domestic market
Increasing demand for natural gas
Favourable business condition
Abundant raw material
Skilled labour
Government support
100% FDI investment allowed
Favourable policies
32
Rising demand
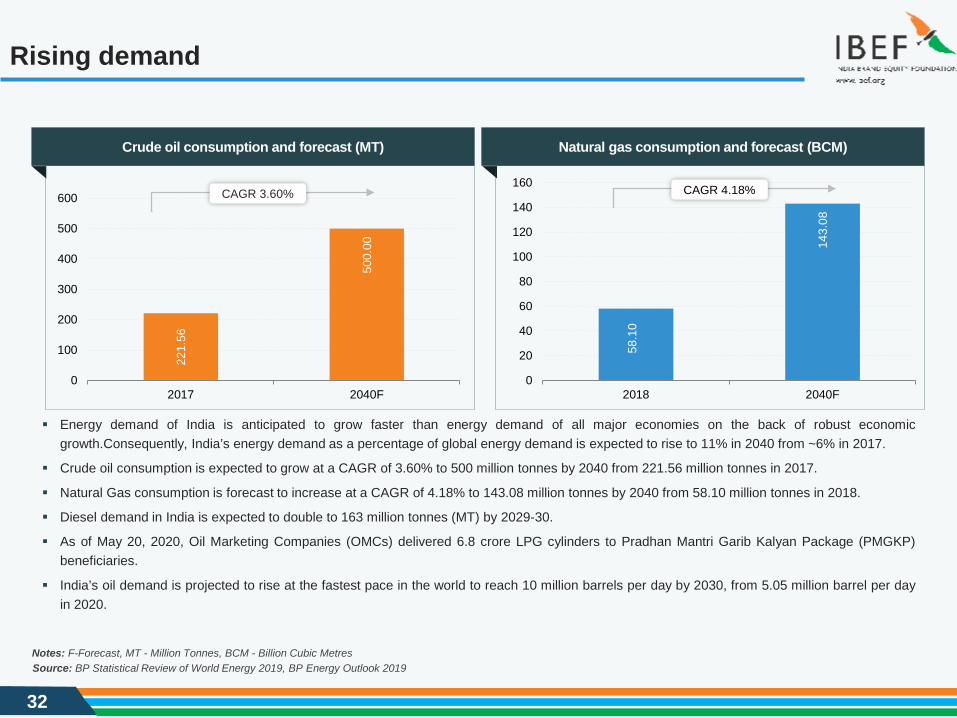
Energy demand of India is anticipated to grow faster than energy demand of all major economies on the back of robust economicgrowth.Consequently, India’s energy demand as a percentage of global energy demand is expected to rise to 11% in 2040 from ~6% in 2017.
Crude oil consumption is expected to grow at a CAGR of 3.60% to 500 million tonnes by 2040 from 221.56 million tonnes in 2017.
Natural Gas consumption is forecast to increase at a CAGR of 4.18% to 143.08 million tonnes by 2040 from 58.10 million tonnes in 2018.
Diesel demand in India is expected to double to 163 million tonnes (MT) by 2029-30.
As of May 20, 2020, Oil Marketing Companies (OMCs) delivered 6.8 crore LPG cylinders to Pradhan Mantri Garib Kalyan Package (PMGKP)beneficiaries.
India’s oil demand is projected to rise at the fastest pace in the world to reach 10 million barrels per day by 2030, from 5.05 million barrel per dayin 2020.
Source: BP Statistical Review of World Energy 2019, BP Energy Outlook 2019Notes: F-Forecast, MT - Million Tonnes, BCM - Billion Cubic Metres
Crude oil consumption and forecast (MT)
221.
56
500.
000
100
200
300
400
500
600
2017 2040F
Natural gas consumption and forecast (BCM)
58.1
0
143.
08
0
20
40
60
80
100
120
140
160
2018 2040F
CAGR 3.60% CAGR 4.18%
33
Regulatory overview of the industry
Source: CEAMA, India Retail Report, Business Line, IMAP India, News Sources
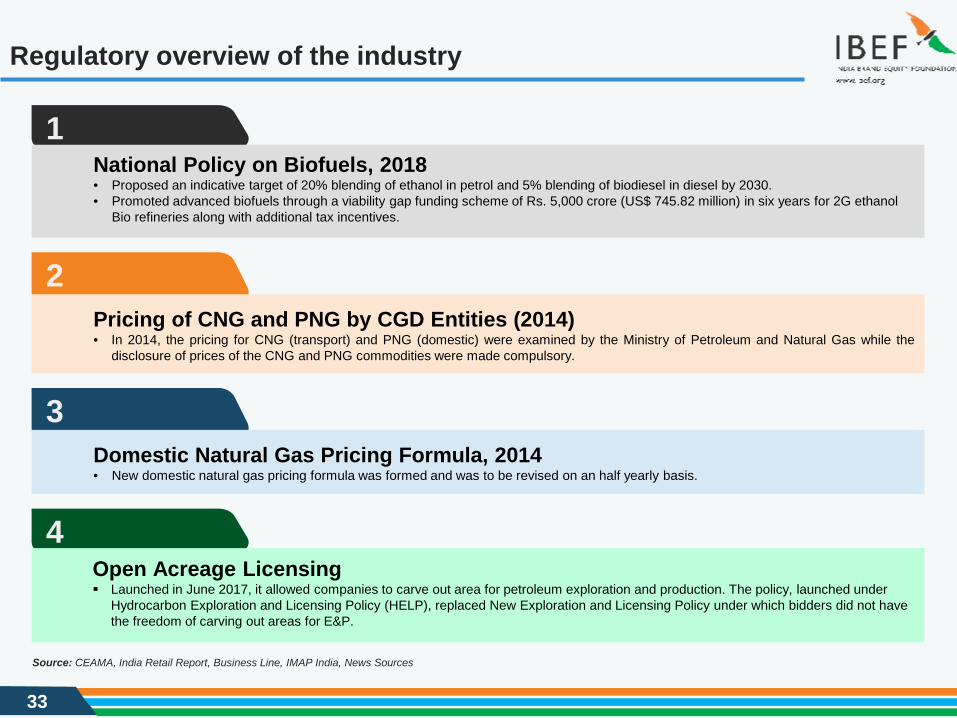
1National Policy on Biofuels, 2018• Proposed an indicative target of 20% blending of ethanol in petrol and 5% blending of biodiesel in diesel by 2030.• Promoted advanced biofuels through a viability gap funding scheme of Rs. 5,000 crore (US$ 745.82 million) in six years for 2G ethanol
Bio refineries along with additional tax incentives.
2Pricing of CNG and PNG by CGD Entities (2014) • In 2014, the pricing for CNG (transport) and PNG (domestic) were examined by the Ministry of Petroleum and Natural Gas while the
disclosure of prices of the CNG and PNG commodities were made compulsory.
3Domestic Natural Gas Pricing Formula, 2014• New domestic natural gas pricing formula was formed and was to be revised on an half yearly basis.
4Open Acreage Licensing Launched in June 2017, it allowed companies to carve out area for petroleum exploration and production. The policy, launched under
Hydrocarbon Exploration and Licensing Policy (HELP), replaced New Exploration and Licensing Policy under which bidders did not have the freedom of carving out areas for E&P.
34
FDI investments in petroleum and gas in India
Source: Department Of Promotion Of Industry And Internal Trade
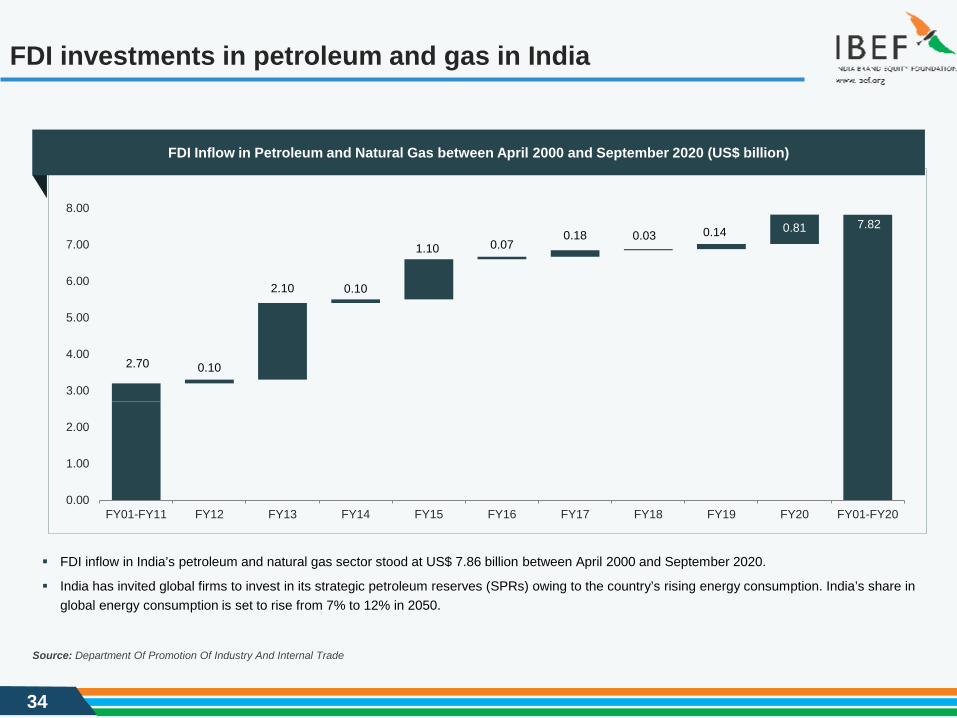
FDI inflow in India’s petroleum and natural gas sector stood at US$ 7.86 billion between April 2000 and September 2020.
India has invited global firms to invest in its strategic petroleum reserves (SPRs) owing to the country’s rising energy consumption. India’s share inglobal energy consumption is set to rise from 7% to 12% in 2050.
FDI Inflow in Petroleum and Natural Gas between April 2000 and September 2020 (US$ billion)
2.70
7.82
0.10
2.10 0.10
1.10 0.070.18 0.03 0.14 0.81
0.00
1.00
2.00
3.00
4.00
5.00
6.00
7.00
8.00
FY01-FY11 FY12 FY13 FY14 FY15 FY16 FY17 FY18 FY19 FY20 FY01-FY20
35
M&A activities in the Indian oil and gas sector
Source: Thomson Banker, News Articles
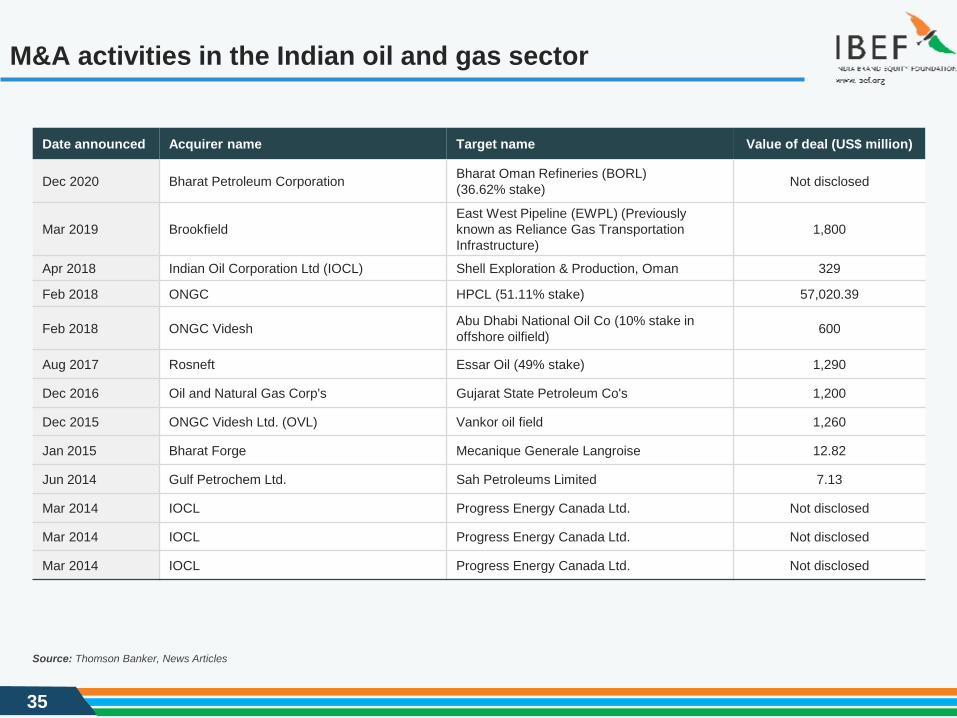
Date announced Acquirer name Target name Value of deal (US$ million)
Dec 2020 Bharat Petroleum Corporation Bharat Oman Refineries (BORL) (36.62% stake) Not disclosed
Mar 2019 BrookfieldEast West Pipeline (EWPL) (Previously known as Reliance Gas Transportation Infrastructure)
1,800
Apr 2018 Indian Oil Corporation Ltd (IOCL) Shell Exploration & Production, Oman 329
Feb 2018 ONGC HPCL (51.11% stake) 57,020.39
Feb 2018 ONGC Videsh Abu Dhabi National Oil Co (10% stake in offshore oilfield) 600
Aug 2017 Rosneft Essar Oil (49% stake) 1,290
Dec 2016 Oil and Natural Gas Corp's Gujarat State Petroleum Co's 1,200
Dec 2015 ONGC Videsh Ltd. (OVL) Vankor oil field 1,260
Jan 2015 Bharat Forge Mecanique Generale Langroise 12.82
Jun 2014 Gulf Petrochem Ltd. Sah Petroleums Limited 7.13
Mar 2014 IOCL Progress Energy Canada Ltd. Not disclosed
Mar 2014 IOCL Progress Energy Canada Ltd. Not disclosed
Mar 2014 IOCL Progress Energy Canada Ltd. Not disclosed

36
Opportunities
37
Opportunities
2
1
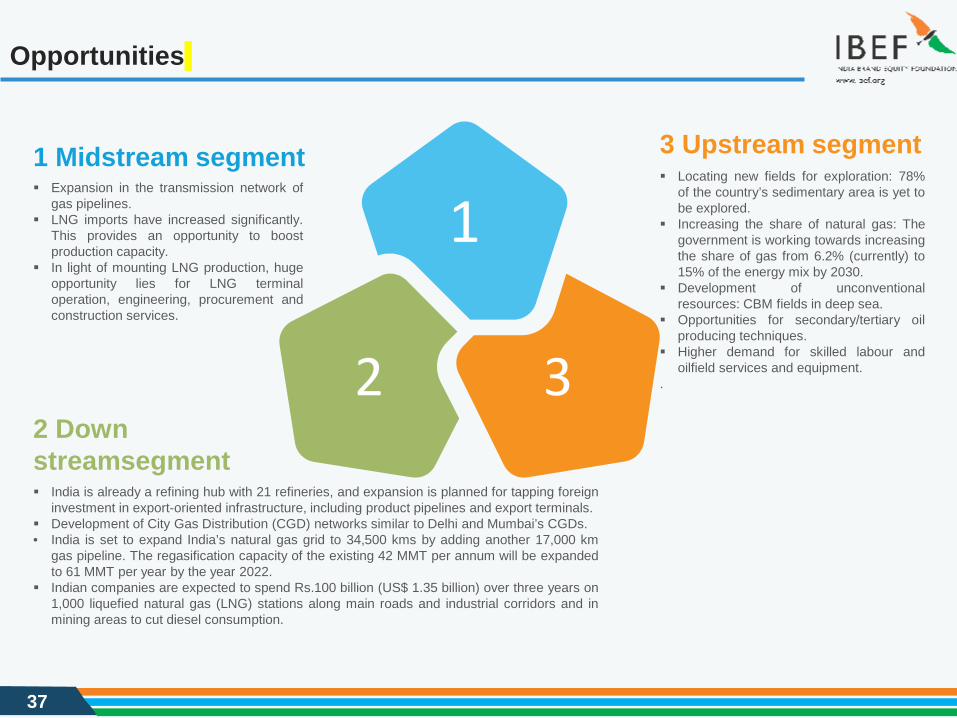
32 Down streamsegment India is already a refining hub with 21 refineries, and expansion is planned for tapping foreign
investment in export-oriented infrastructure, including product pipelines and export terminals. Development of City Gas Distribution (CGD) networks similar to Delhi and Mumbai’s CGDs.• India is set to expand India’s natural gas grid to 34,500 kms by adding another 17,000 km
gas pipeline. The regasification capacity of the existing 42 MMT per annum will be expandedto 61 MMT per year by the year 2022.
Indian companies are expected to spend Rs.100 billion (US$ 1.35 billion) over three years on1,000 liquefied natural gas (LNG) stations along main roads and industrial corridors and inmining areas to cut diesel consumption.
3 Upstream segment Locating new fields for exploration: 78%
of the country’s sedimentary area is yet tobe explored.
Increasing the share of natural gas: Thegovernment is working towards increasingthe share of gas from 6.2% (currently) to15% of the energy mix by 2030.
Development of unconventionalresources: CBM fields in deep sea.
Opportunities for secondary/tertiary oilproducing techniques.
Higher demand for skilled labour andoilfield services and equipment.
.
1 Midstream segment Expansion in the transmission network of
gas pipelines. LNG imports have increased significantly.
This provides an opportunity to boostproduction capacity.
In light of mounting LNG production, hugeopportunity lies for LNG terminaloperation, engineering, procurement andconstruction services.

38
Key Industry Contacts
39
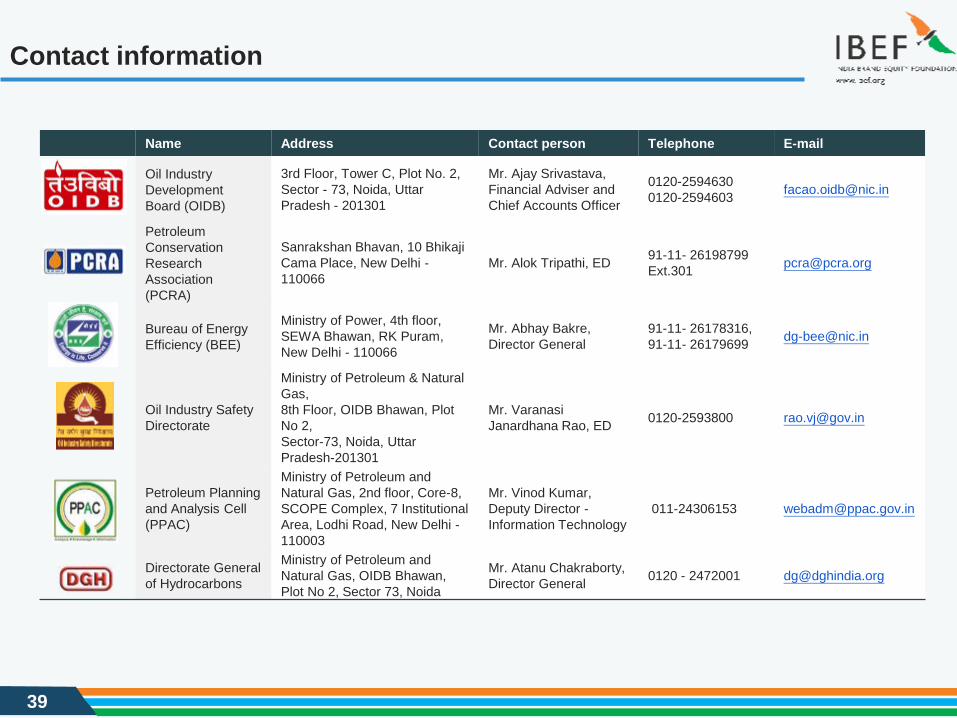
Contact information
Name Address Contact person Telephone E-mail
Oil Industry Development Board (OIDB)
3rd Floor, Tower C, Plot No. 2, Sector - 73, Noida, Uttar Pradesh - 201301
Mr. Ajay Srivastava, Financial Adviser and Chief Accounts Officer
0120-25946300120-2594603 [email protected]
Petroleum Conservation Research Association (PCRA)
Sanrakshan Bhavan, 10 BhikajiCama Place, New Delhi -110066
Mr. Alok Tripathi, ED 91-11- 26198799 Ext.301 [email protected]
Bureau of Energy Efficiency (BEE)
Ministry of Power, 4th floor, SEWA Bhawan, RK Puram, New Delhi - 110066
Mr. Abhay Bakre, Director General
91-11- 26178316, 91-11- 26179699 [email protected]
Oil Industry Safety Directorate
Ministry of Petroleum & Natural Gas, 8th Floor, OIDB Bhawan, Plot No 2, Sector-73, Noida, Uttar Pradesh-201301
Mr. Varanasi Janardhana Rao, ED 0120-2593800 [email protected]
Petroleum Planning and Analysis Cell (PPAC)
Ministry of Petroleum and Natural Gas, 2nd floor, Core-8, SCOPE Complex, 7 Institutional Area, Lodhi Road, New Delhi -110003
Mr. Vinod Kumar, Deputy Director -Information Technology
011-24306153 [email protected]
Directorate General of Hydrocarbons
Ministry of Petroleum and Natural Gas, OIDB Bhawan, Plot No 2, Sector 73, Noida
Mr. Atanu Chakraborty, Director General 0120 - 2472001 [email protected]
40
Appendix
41
Glossary
B/D (or bpd): Barrels Per Day
MBPD (or mbpd): Million Barrels Per Day
BCM (or bcm): Billion Cubic Metres
CBM: Coal Bed Methane
CGD: City Gas Distribution
EandP: Exploration and Production
FDI: Foreign Direct Investment
FY: Indian Financial Year (April to March)
FY20 implies April 2019 to March 2020
GoI: Government of India
Rs.: Indian Rupee
PM: Prime Minister
LNG: Liquefied Natural Gas
MMT (or MMT): Million Metric Tonne
MMTPA (or mmtpa): Million Metric Tonnes Per Annum
EBITDA: Earning Before Interest Taxes Depreciation Amortisation
NRL: Numaligarh Refinery Limited
CPCL: Chennai Petroleum Corporation Limited
HPCL: Hindustan Petroleum Corporation Limited
BPCL: Bharat Petroleum Corporation Limited
42
Glossary
IOC: Indian Oil Corporation Ltd
EOL: Essar Oil Ltd
RPL: Reliance Petroleum Limited
MRPL: Mangalore Refinery and Petrochemicals Limited
PCCK: Petronet Cochin-Coimbatore-Karur
PMHB: Petronet Mangalore-Hassan-Bangalore
OALP: Open Acreage Licensing Policy
TOE (or toe): Tonnes of Oil Equivalent
US$ : US Dollar
ONGC: Oil and Natural Gas Corporation of India
IOCL: Indian Oil Corporation Limited
mn bbl: Million Barrels
CAGR: Compound Annual Growth Rate
JV: Joint Venture
UCG: Underground Coal Gasification
NGL: Natural Gas Liquids
OMCs: Oil Marketing Companies
NHGP: National Gas Hydrate Programme
Wherever applicable, numbers have been rounded off to the nearest whole number
43
Exchange rates
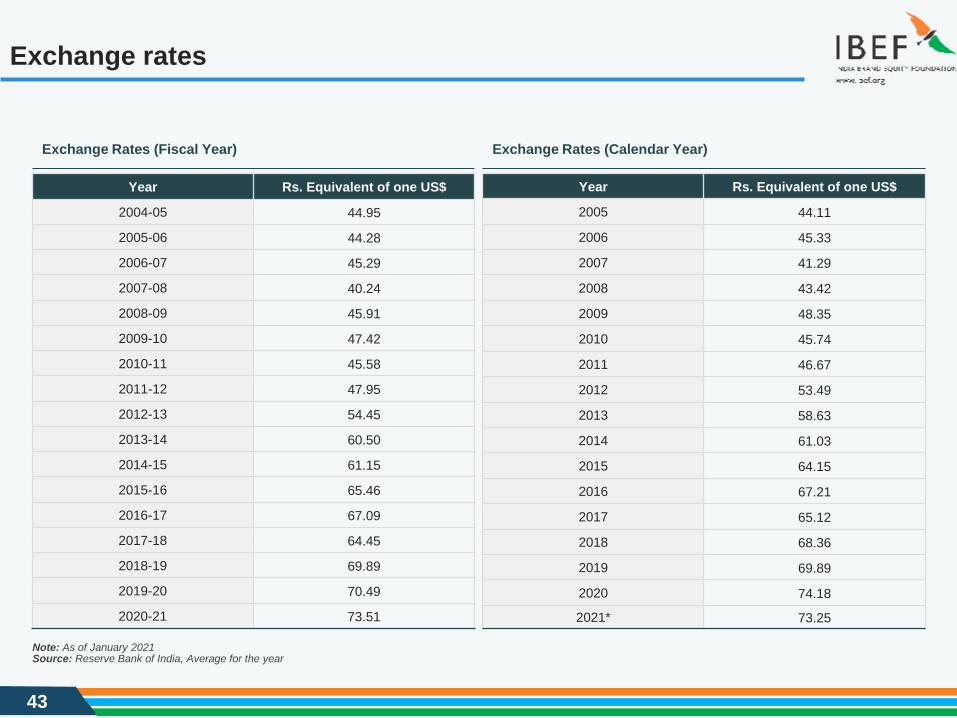
Exchange Rates (Fiscal Year) Exchange Rates (Calendar Year)
Year Rs. Equivalent of one US$
2004-05 44.95
2005-06 44.28
2006-07 45.29
2007-08 40.24
2008-09 45.91
2009-10 47.42
2010-11 45.58
2011-12 47.95
2012-13 54.45
2013-14 60.50
2014-15 61.15
2015-16 65.46
2016-17 67.09
2017-18 64.45
2018-19 69.89
2019-20 70.49
2020-21 73.51
Source: Reserve Bank of India, Average for the yearNote: As of January 2021
Year Rs. Equivalent of one US$
2005 44.11
2006 45.33
2007 41.29
2008 43.42
2009 48.35
2010 45.74
2011 46.67
2012 53.49
2013 58.63
2014 61.03
2015 64.15
2016 67.21
2017 65.12
2018 68.36
2019 69.89
2020 74.18
2021* 73.25
44
Disclaimer
India Brand Equity Foundation (IBEF) engaged Sutherland Global Services private Limited to prepare/update this presentation.
All rights reserved. All copyright in this presentation and related works is solely and exclusively owned by IBEF, delivered during the course ofengagement under the Professional Service Agreement signed by the Parties. The same may not be reproduced, wholly or in part in any materialform (including photocopying or storing it in any medium by electronic means and whether or not transiently or incidentally to some other use of thispresentation), modified or in any manner communicated to any third party except with the written approval of IBEF.
This presentation is for information purposes only. While due care has been taken during the compilation of this presentation to ensure that theinformation is accurate to the best of Sutherland Global Services’ Private Limited and IBEF’s knowledge and belief, the content is not to be construedin any manner whatsoever as a substitute for professional advice.
Sutherland Global Services Private Limited and IBEF neither recommend nor endorse any specific products or services that may have beenmentioned in this presentation and nor do they assume any liability, damages or responsibility for the outcome of decisions taken as a result of anyreliance placed on this presentation.
Neither Sutherland Global Services Private Limited nor IBEF shall be liable for any special, direct, indirect or consequential damages that may arisedue to any act or omission on the part of the user due to any reliance placed or guidance taken from any portion of this presentation.