Embed Size (px)
Citation preview
Ife Journal of Science vol. 17, no. 1 (2015)
COMPARATIVE ANALYSIS OF GROUNDWATER RECHARGE ESTIMATION VALUE OBTAINED USING EMPIRICAL METHODS IN OGUN AND OSHUN RIVER
BASINS
1* 2 2 3Oke, M.O. , Martins, O. , Idowu, O.A. and Aiyelokun, O.
1
2Department of Water Resources Management and Agricultural Meteorology, Federal University of Agriculture, Abeokuta, Nigeria.
3Eclat Global Resources, Podo, Ibadan, Nigeria.Correspondence:[email protected]; +2347038844902
st nd(Received: 21 Oct., 2014; Accepted: 22 Dec., 2014)
Estimation of natural groundwater recharge is a pre-requisite for efficient groundwater resource management especially in regions with large demands for groundwater supplies, where such resources are the key to economic development. Groundwater recharge, by whatever method, is normally subjected to large uncertainties and errors. In this paper, an attempt has been made to derive groundwater recharge from rainfall in Ogun and Oshun River Basin using three empirical formulae which include modified Chaturvedi formula, Krishna Rao and Kumar and Seethapathi. Results from these three empirical formulae were compared using line graph, inter-item correlation and one way analysis of variance (ANOVA). Although correlation coefficients of 0.99-1.0 were obtained which make any of the formula applicable, the Kumar and Seethapathi equation is preferred for preliminary recharge estimation in the basins.
Keywords: Empirical Formulae; Groundwater Recharge; Ogun River Basin; Oshun River Basin, Inter Item Correlation; ANOVA.
Directorate of Research, National Institute of Policy and Strategic Studies, Kuru, Jos.
ABSTRACT
053
INTRODUCTION Groundwater recharge is defined as water that infiltrates through the subsurface to the zone of saturation beneath the water table (Reese and Risser, 2010). It results in the increase of groundwater storage and contributes to groundwater flow (Idowu and Martins, 2010). The amount of recharge in humid region is usually high because the region receives large amount of rainfall, have favorable surface conditions for infiltration, and are less susceptible to the inf luences of h igh temperatures and evapotranspiration (Reese and Risser, 2010). For example, Assez, (1972) reported that a substantial rate of groundwater recharge occur in the regolith overburden in the Basement Complex of southwestern Nigeria where the mean annual rainfall ranges from 1145 mm to 1270 mm (OORBDA, 1982) but the surface runoff is quite low. Recharge in such a region is dependent on isolated areas where soils may be shallow and field capacities are exceeded locally, or on areas where there are fractured rock outcrops at the surface. The existence of large macropores (large pore spaces such as animal burrows, root channels,
worm and termite casts) may also provide an important pathway for rainfall to bypass the soil mass and contribute to recharge.
The quantification of the rate of natural ground water recharge is a pre-requisite for efficient ground water resource management (Kumar, 1977). Hence, recharge estimate is peculiarly important in regions with large demands for ground water supplies, where such resources are the key to economic development. While the estimation of recharge, by whatever method, is normally subject to large uncertainties and errors; the use of empirical formulae shows great potential as an easy means of estimating recharge, which is often difficult if not impossible to obtain reliably by other methods (Adelana, et al., 2006). Several methods of estimating groundwater recharge have been used in Nigeria in the last two decades (Uma and Egboka, 1988; Oteze, 1989;
. However, Adelana et al., (2006) argued that empirical methods, using simple mathematical
Carter, 1994, Udoh, 1995; Agbo et al., 1998; Edmunds, et al., 1999; Goes, 1999; Shekwolo, 2000; Goni, 2001; Edmunds et al., 2002; Adelana, et al., 2006 and Idowu and Martins, 2007)

054
relations, can give a quick recharge value for water resources decision making processes. Thus, this paper employed the empirical methods for estimating groundwater recharges from rainfall data obtained from Nigeria Meteorological Agency (NIMET) recognized raingauge stations within Ogun and Osun River Basins such as Abeokuta, Ijebu Ode, Ibadan, Oshogbo and Ikeja.
Study Areas
The Ogun River BasinThe Ogun River Basin, located in Southwestern Nigeria, is bordered geographically by latitudes 6º 26' N and 9º 10'N and longitudes 2º 28'E and 4º 8 'E (Fig.1). About 2% of the basin area falls outside Nigeria in the Benin Republic. The land area is
2about 23,000 km . The relief is generally low, with the gradient in the north-south direction. The Ogun River takes its source from the Igaran hills at an elevation of about 530 m above mean sea level and flows directly southwards over a distance of about 480 km before it discharges into the Lagos lagoon. The major tributaries of the Ogun River are the Ofiki and Opeki Rivers. Two seasons are distinguishable in the Ogun River Basin; a dry season from November to March and a wet season between April and October. Mean annual rainfall ranges from 900 mm in the north to 2000 mm towards the south. The total annual potential evapotranspiration is estimated at between 1600 and 1900 mm (Bolaji and Bhattacharya, 2010).
The two major vegetation zones that can be identified within the watershed are the high forest vegetation in the north and central parts, and the swamp/mangrove forests that cover the southern coastal and floodplains, next to the lagoon.
The geology of the study area is described as a rock sequence that starts with the Precambrian Basement. The foliation and joints on these rocks control the course of the rivers, causing them to form a trellis drainage pattern, particularly to the
north of the study area. The overlying sedimentary rock sequences are from Cretaceous to Recent; the oldest of them, the Abeokuta Formation, consists of grey sandstones intercalated with clay. It is overlain by Ewekoro Formation, which typically contains thick limestone layers at its base. Overlying the Ewekoro Formation is the sand of the Ilaro Formation, which is overlain by the Coastal Plain Sands (Jones and Hockey, 1964). About 9 km upstream of Abeokuta town there is a sharp change in land gradient, changing the river morphology from fast flowing to slow moving and leading to the formation of alluvial deposits overlying the sedimentary formation of Ewekoro, Ilaro and Coastal Plain Sands in sequence towards the Lagos lagoon.
The Osun River BasinThe drainage system of Osun River rises in Oke-Mesi ridge, about 5 km North of Effon Alaiye on the border between Oshun and Ekiti States of Nigeria, and flows North through the Itawure gap to latitude 7 º53' before winding its way westwards through Oshogbo and Ede and Southwards to enter Lagos lagoon about 8 km east of Epe. Substantial part of the basin is underlain by rocks of Precambrian Basement Complex, the great majority of which are very ancient in age. This Basement Complex rocks showed great variations in grain size and in mineral composition. The rocks are quartz gneisses and schist consisting essential of quartz with small amounts of white micaceous minerals (Akande, 2006). Although in many places outcrops are plainly visible, large areas are overlain by layers of laterite soil formed by weathering and decomposition of the prevent rock material. Along the river basin, the provenance of the minerals has been dealt with, based on heavy minerals studies. In addition, sedimentary rocks of Cretaceous and latter deposits are found in the southern section of the basin.
Oke et al.: Comparative Analysis of Groundwater Recharge Estimation Value

055
MATERIALS AND METHODS
MaterialsRainfall data were obtained from the Nigerian Meteorological Agency (NIMET), Oshodi Lagos State data base. Twenty years continuous monthly data were available for Abeokuta, Oshogbo, Ikeja, Ibadan, and Ijebu-Ode; between 1987 and 2006.
Empirical MethodThree empirical formulae showing rainfall-recharge relationship were selected for the estimation of recharge based on the work of Chaturvedi (1936) in Kumar (2009) which was later modified, Krishna Rao (1970) in Kumar (2009) and Kumar and Seethapathi (2002). The formulae were selected because of the similarities between the Indian monsoons climate where they were created and the humid sub-tropical climate of southwest Nigeria. The evolution of the empirical equations is discussed below.
(a) Modified Chaturvedi formula (1936)
Chaturvedi derived an empirical equation which expresses recharge as a function of annual precipitation, thus:
0.4Rr = 2.0 (P - 15) (1)where, Rr = net recharge due to precipitation during the year, in inches; and P = annual precipitation, in inches.
This formula was later modified by further work at the U.P. Irrigation Research Institute, Roorkee and the modified form of the formula is:
0.5 Rr = 1.35 (P - 14) (2)
(b) Kumar and Seethapathi Formula (2002) The following empirical relationship (similar to Chaturvedi formula) was derived by fitting the estimated values of rainfall recharge and the corresponding values of rainfall in the monsoon
Fig. 1. Map of Ogun and Osun River Basins and the Adjacent Basins
Oke et al.: Comparative Analysis of Groundwater Recharge Estimation Value

056
season through the non-linear regression equation.
0.76Rr = 0.63 (P - 15.28) (3)
where,Rr = Groundwater recharge from rainfall in monsoon season (inch);P = Mean rainfall in monsoon season (inch).
(c) Krishna Rao (1970)
Krishna Rao gave the following empirical relationship in 1970 to determine the groundwater recharge in limited climatological homogeneous areas:
Rr = K (P - X) (4)
where, Rr = RechargeK = constantP = PrecipitationX = No of point rainfall
The following specific empirical equations were applied to different parts of Karnataka: Rr = 0.20 (P - 400); for areas with annual normal rainfall (P) between 400 and 600 mm Rr = 0.25 (P - 400); for areas with P between 600 and 1000 mm Rr = 0.35 (P - 600); for areas with P above 2000 mm, (this equation was used in this study)where, Rr and P are expressed in millimeters.
The areal rainfall for the two River basins under investigation was computed using Arithmetic mean before recharge using the formulae.
(5)
where, Ra = Areal rainfall Pa = point rainfall N = number of total point rainfall
Data analysis was undertaken using descriptive statistics with graphical representation and inferential statistics, which include inter-item correlation and ANOVA. Statistical analysis was generally carried out on rainfall and recharge of the Ogun-Osun River Basin using the computer software, statistical package for social sciences (SPSS 16.0).
RESULTS AND DISCUSSION
Descriptive Statistics of Rainfall Table 1 shows the annual rainfall data obtained from Nigeria Meteorological Agency (NIMET). The study was limited to twenty years from 1987-2006 for consistency purpose as only two stations – Abeokuta and Oshogbo were up to 2010.
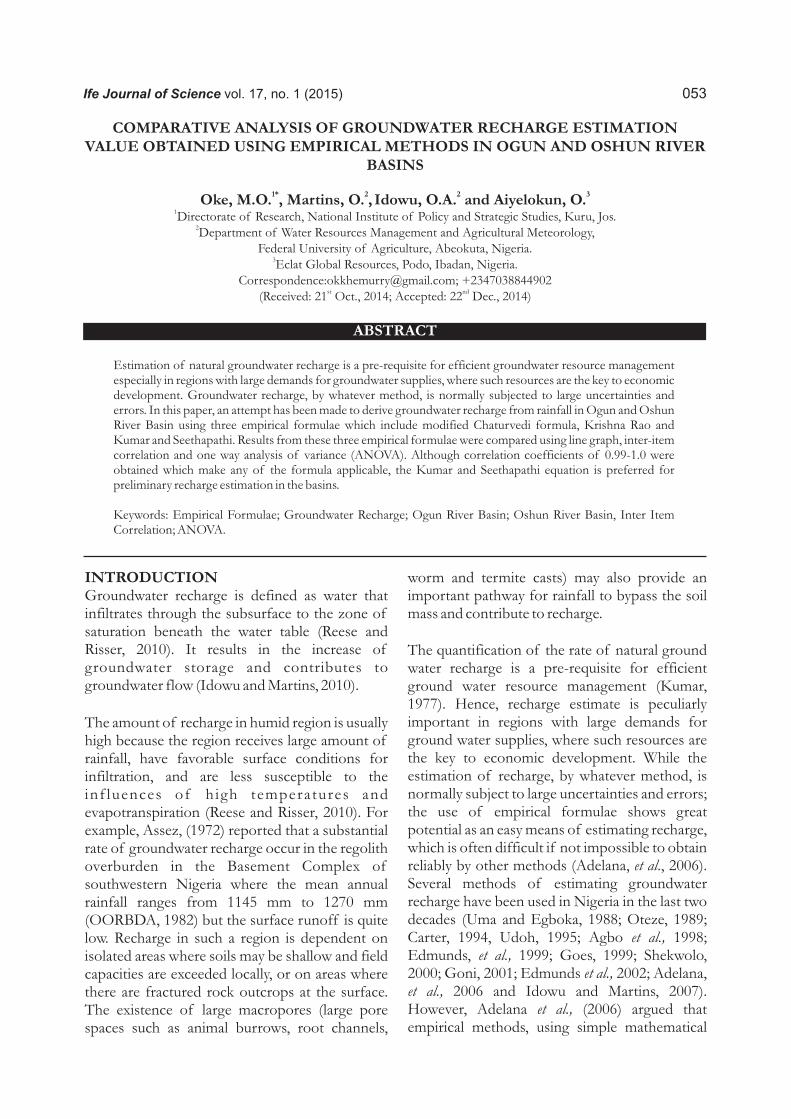
Statistical analysis of annual rainfall data (Table 2) shows that Abeokuta contributed the lowest mean annual rainfall of 1196.54 mm (see Figure 2 for the variation of the mean annual rainfall) to the drainage basin, with a maximum and minimum of 1604.40 mm and 712.20 mm respectively. Also rainfall within the years of study deviates largely from the mean with a standard deviation of 216.91 mm; while Oshogbo contributed a mean annual rainfall of 1356.59 mm with maximum and minimum of 1684.40 mm and 1014.70 mm respectively. A standard deviation of 165.41 mm indicates a largely distributed rainfall with the years.
Oke et al.: Comparative Analysis of Groundwater Recharge Estimation Value

057
Table 1: Table of Annual Rainfall from NIMET
Annual Rainfall (mm) Year Abeokuta Oshogbo Ibadan Ijebu-ode Lagos 1 1987 1277.10 1368.60 1285.10 1501.90 2057.00 2 1988 1604.40 1464.50 1397.80 1653.20 2432.10 3 1989 1401.00 1191.10 1223.70 1445.50 1702.60 4 1990 1111.00 1411.10 1283.90 1713.80 2030.20 5 1991 1173.10 1684.40 1369.30 1646.90 1722.90 6 1992 1076.70 1404.80 1088.60 1611.80 1357.60 7 1993 1193.60 1263.80 1478.10 1456.90 1828.20 8 1994 712.20 1207.80 905.90 1556.90 1602.30 9 1995 1177.50 1452.50 1534.70 1643.80 2025.30 10 1996 1471.60 1349.40 1653.70 2032.40 2535.90 11 1997 1354.90 1231.10 1097.10 1705.70 1936.80 12 1998 1118.40 1203.30 1018.00 1172.80 1232.90 13 1999 1530.40 1529.30 1814.90 1819.40 2056.90 14 2000 1201.90 1367.80 1244.50 1655.00 1458.90 15 2001 849.20 1014.70 1289.70 1462.30 1110.00 16 2002 1235.10 1361.00 1515.30 1426.50 1523.20 17 2003 1214.70 1633.00 1143.00 1572.00 1549.00 18 2004 1153.30 1393.70 1314.20 1766.60 2117.40 19 2005 917.50 1130.20 1204.20 1473.30 1745.60 20 2006 1157.20 1469.70 1260.10 2043.60 996.20 21 2007 1615.70 1421.70 22 2008 1408.70 1610.10 23 2009 1351.10 1310.20 24 2010 1450.70 1691.80
Table 2: Tables of Descriptive Statistics of Annual Rainfall
Annual Rainfall Abeokuta Oshogbo Ibadan Ijebu-Ode Lagos
N Valid 20 20 20 20 20 Missing 0 0 0 0 0 Mean 1196.54 1356.59 1306.09 1618.00 1751.05 Median 1185.55 1368.20 1284.50 1627.80 1734.25 Std. Deviation
216.90 165.41 217.98 204.12 410.53
Variance 47047.55 27361.25 47516.62 41660.00 168536.16 Minimum 712.20 1014.70 905.90 1172.80 996.20 Maximum 1604.40 1684.40 1814.90 2043.60 2535.90
Ibadan contributed a mean annual rainfall of 1306.09 mm, with a maximum and minimum of 1814.90 mm and 905.90 mm respectively. Rainfall also largely dispersed from the mean with a
standard deviation of 217.98 mm. Ijebu-Ode had a mean of 1618.0 mm annual rainfall with a standard deviation of 204.11 mm.
Oke et al.: Comparative Analysis of Groundwater Recharge Estimation Value
058
Lagos contributed the highest annual rainfall to the drainage area within the years of study with a mean annual rainfall of 1751.05 mm. The maximum and minimum annual rainfall were 2525.90 mm and 996.20 mm respectively. The rainfall variations in Lagos deviate largely from the mean with a standard deviation of 410.53 mm. This is generally because Lagos State is a coastal area having an advantage of tropical Mari-time Air mass blowing from the Atlantic Ocean.
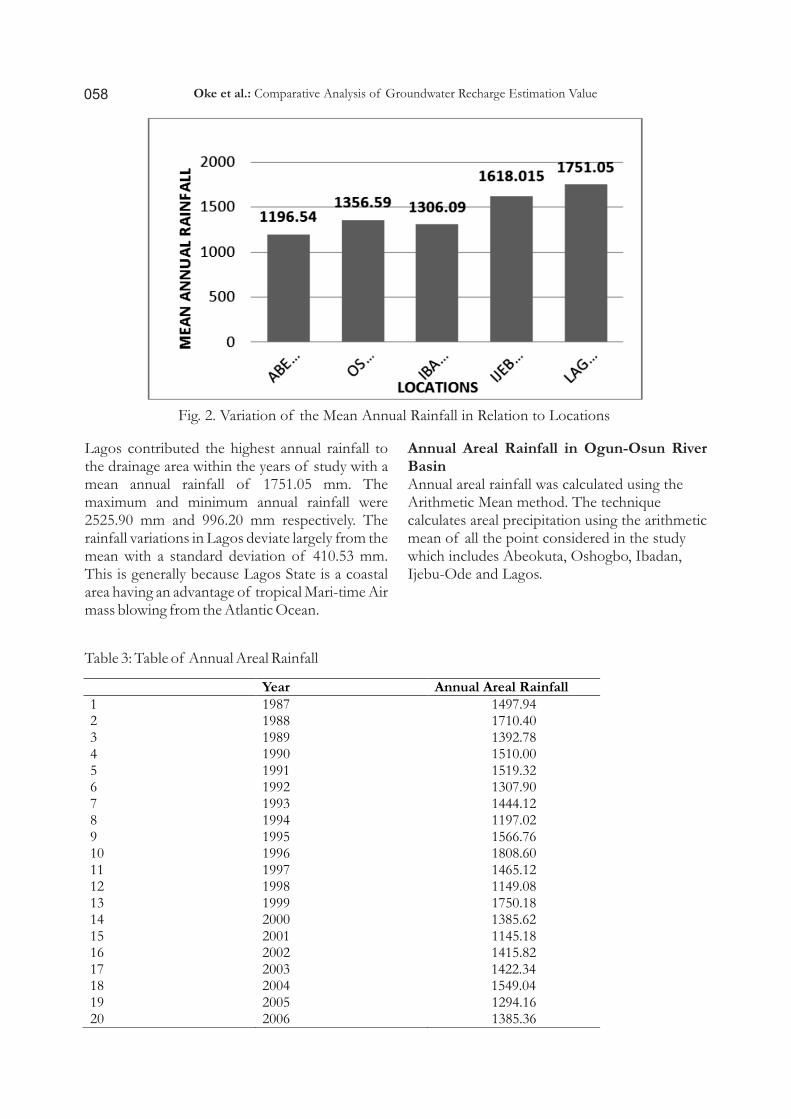
Annual Areal Rainfall in Ogun-Osun River BasinAnnual areal rainfall was calculated using the Arithmetic Mean method. The technique calculates areal precipitation using the arithmetic mean of all the point considered in the study which includes Abeokuta, Oshogbo, Ibadan, Ijebu-Ode and Lagos.
Fig. 2. Variation of the Mean Annual Rainfall in Relation to Locations
Table 3: Table of Annual Areal Rainfall
Year Annual Areal Rainfall 1 1987 1497.942 1988 1710.403 1989 1392.784 1990 1510.005
1991
1519.32
6
1992
1307.907
1993
1444.12
8
1994
1197.029
1995
1566.76
10
1996
1808.6011
1997
1465.12
12
1998
1149.08
13
1999
1750.18
14
2000
1385.62
15
2001
1145.18
16
2002
1415.82
17
2003
1422.34
18 2004 1549.0419 2005 1294.1620 2006 1385.36
Oke et al.: Comparative Analysis of Groundwater Recharge Estimation Value

059
The annual areal rainfall (Table 3) statistically described in Table 4 shows that for the twenty
years of study, the mean annual areal rainfall of the river basin was 1445.8 mm.
Table 4: Descriptive Statistics of Annual Areal Rainfall
N Mean Std. Deviation Minimum Maximum
20 1445.8 181.52 1145.18 1808.6
The standard deviation of 181.5 mm shows that the areal rainfall deviated largely within the twenty years; with the highest areal rainfall of 1808.60 mm in 1996, and lowest mean annual rainfall of 1145.18 mm in 2001.
Groundwater Recharge EstimationThe annual areal recharge of the river basin within 1987 and 2006 was calculated using the three formulae: Modified Chaturvedi formula (MCF), Krishna Rao Formula (KRF) in (Kumar, 2009) and Kumar and Seethapathi (2002) Formula (KSF). Although the Chaturvedi and the Kumar and Seethapathi's were developed in inches, the final recharge estimated was converted to millimeters (mm) to ensure consistency in unit of measurement.
Table 5 shows that the average areal annual rainfall for the whole Ogun and Oshun River Basin was 1263.2 mm/year, with values ranging from 1120.7 mm/year to 1521.8 mm/year. This is evidence of high amount of rainfall within the river basins. The computed values of groundwater recharge using Modified Chaturvedi formula (MCF) ranged from 178.7 mm/year to 232.3 mm/year, with an average of 204.6 mm/year. The percentage recharge of rainfall ranged from 15.3 % to 16.9 %
with an average of 16.2 %. Result from KSF revealed that the values of groundwater recharge ranged from 189.6 mm/year to 272.1 mm/year, with an average of 235.4 mm/year. The recharge percentage of rainfall ranged from 18.1 % to 18.9 %, with 18.6% as average. Using KRF the computed values for groundwater recharge for the Ogun and Oshun River Basin ranged from 155.82 mm/year to 295.68 mm/year, with an average of 232.1 mm/year, while the percentage groundwater recharge of rainfall ranged from 15.9 % to 21.2 %, with an average of 18.2 %. Based on the three methods, the ground water recharge on the average ranged from 204.6 mm/year to 235.4 mm/year. This is 16.2 % to 18.6 % of rainfall.
Descriptive Statistics of Annual Areal Groundwater RechargeTable 6 shows that the standard deviation of 17.79 mm signifies that the recharge slightly deviate from the mean of 213.81 mm. However, when the mean of the annual areal recharge is divided by the mean of the annual areal rainfall and multiplied by 100; it was discovered that 16 % of the rainfall became groundwater recharge. In addition, the line graph indicates that the recharge varies below 211.66 mm within the twenty years of study.
Oke et al.: Comparative Analysis of Groundwater Recharge Estimation Value

060
YEAR
ANNUAL
AREAL
RAINFALL
(mm)
KSF (mm)
%R
KRF
(mm)
%R MCF
(mm)
%R
1987 1271.5 205.9 16.2 237.4 18.7 235.01 18.5
1988 1444.8 224.5 15.5 272.1 18.8 295.68 20.5
1989 1207.0 198.5 16.4 224.2 18.6 212.45 17.6
1990 1328.4 212.2 16.0 249.0 18.7 254.94 19.2
1991 1364.6 216.1 15.8 256.2 18.8 267.62 19.6
1992
1183.3
195.7
16.5
219.2
18.5
204.16
17.3
1993
1284.0
207.3
16.1
240.0
18.7
239.38
18.6
1994
1128.8
189.2
16.8
207.7
18.4
185.07
16.4
1995
1326.7
212.0
16.0
248.7
18.7
254.36
19.2
1996
1521.8
232.3
15.3
287.0
18.9
322.61
21.2
1997
1280.0
206.9
16.2
239.2
18.7
237.98
18.6
1998
1045.2
178.7
17.1
189.6
18.1
155.82
14.9
1999
1413.9
221.3
15.7
266.0
18.8
284.86
20.1
2000
1239.4
202.3
16.3
230.9
18.6
223.79
18.1
2001
1099.4
185.6
16.9
201.4
18.3
174.79
15.9
2002
1243.7
202.8
16.3
231.7
18.6
225.29
18.1
2003
1268.8
205.6
16.2
236.9
18.7
234.09
18.4
2004
1398.9
219.8
15.7
263.0
18.8
279.61
20.0
2005
1209.9
198.9
16.4
224.8
18.6
213.47
17.6
2006
1243.8
202.8
16.3
231.8
18.6
225.32
18.1
2007
1120.7
188.2
16.8
206.0
18.4
182.25
16.3
2008
1224.7
200.6
16.4
227.8
18.6
218.65
17.9
2009
1173.3
194.6
16.6
217.1
18.5
200.66
17.1
2010
1294.1
208.4
16.1
242.1
18.7
242.94
18.8
AVGR
1263.2
204.6
16.2
235.4
18.6
232.1
18.2
Table 5:Groundwater Recharge Computed using Different Empirical Formulae
Oke et al.: Comparative Analysis of Groundwater Recharge Estimation Value

061
Table 6: Statistics of Areal Recharge from the Formulae
N Valid
Mean
Std. Deviation
P-Value
Decision
Modified Chaturvedi formula
20
213.81
17.79416
0.000
P ˂
0.05
Kumar and Seethapathi formula
20
271.73
35.27197
Krishna Rao Formula
20 261.46 45.38243
The recharge estimated from the Kumar and Seethapathi's formula within the twenty years of study has a mean of 271.73 mm and standard variations of 35.27 mm showing that the recharge values deviate largely from their mean. When the mean of the annual areal recharge is divided by the mean of the annual areal rainfall and multiplied by 100, it was deduced that about 18% of the rain that fell in the twenty years of study went into the ground. Recharge from Kumar and Seethapathi's formulae has the highest mean. The line graph shows that recharge ranges from 340 mm to 211.66 mm. Recharge values from the Krishna Rao's formula is quite similar to Kumar and Seethapathi's, because it also deviate largely from its mean of 261.46 with a standard deviation of 45.38. When considering the amount annual areal rainfall within the years of study with the estimated recharge; like the Kumar and Seethapathi's formula about 18 % of the rainfall became groundwater recharge.
From descriptive statistics it can be concluded that 'Kumar and Seethapathi' and the Krishna Rao's formulae are similar, while the modified Chaturvedi formula is slightly different from both.
Comparative Analysis of Recharge Formulae Using Inter-Item Correlation Matrix and ANOVA
In other to find out if any differences actually exist between these formulae, inter item correlation Matrix was used. Table 7 shows that the correlation between Modified Chaturvedi Formula and Kumar and Seethapathi Formula is positive one (+1), which means they are perfectly positively correlated; while its correlation with Krishna Rao Formula is (+0.999), which means they are highly positively correlated.
Oke et al.: Comparative Analysis of Groundwater Recharge Estimation Value
Table 7: Inter-Item Correlation Matrix of Annual Areal Recharge
Modified Chaturvedi formula
Kumar and Seethapathi formula
Krishna Rao formula
Modified Chaturvedi formula
1.000 1.000 0.999
Kumar and Seethapathi formula
1.000 1.000 1.000
Krishna Rao formula
0.999 1.000 1.000

062
Table 8 reveals that the three formulae do not vary in correlations which make them highly similar to each other.
Significance Testing Using One Way- ANOVAThe results from the three formulae were tested using One-way ANOVA in other to determine if there are significant differences between the means of the three recharge formulae. Table 6 shows that the significant value of 0.00 are less than 0.05, meaning that there is significant difference in the means of the three formulae.
It is argued that, taking a clue from the Table 7 that although Modified Chaturvedi formula, Kumar and Seethapathi's formula and Krishna Rao formula are perfectly correlated; Table 6 shows that there exists a significant difference in the means. Thus, the correlation between Krishna Rao formula and Modified Chaturvedi formula at 0.999 could be suspected. It is therefore concluded that although any of the recharge formula can be used for estimations, the Kumar and Seethapathi's formula is preferred.
CONCLUSIONThis paper compares three empirical methods used to estimate recharge in the Ogun-Oshun River Basin southwest Nigeria. The high amount of rainfall both in temporal and spatial strongly affects recharge in this area, and as a result high recharge coincided with periods of high rainfall
and low recharge with low rainfall. Result shows that there was high amount of rainfall in Lagos State within the twenty years of study. This could be due to the moist, relatively cool, monsoon wind which blew from the south-west across the Atlantic Ocean towards the country and brought rainfall to the area; while Abeokuta has the lowest rainfall.
It was observed that about 16% to 18% of the areal rainfall of the study area became groundwater recharge which fell within the result (2 – 20%) of a study carried out by Idowu and Martins (2007) on the groundwater recharge estimation using hydrograph analysis in the phreatic basement aquifer of the Opeki River Basin which is one of sub-water shed of the Ogun River.
The three empirical formulae correlate positively with each other when subjected to inter-item correlation analysis; and with results from the analysis of variance (ANOVA). It can be concluded that although Modified Chaturvedi formula, Kumar and Seethapathi formula and Krishna Rao formula are perfectly correlated, there exists a significant difference in the means. Thus, the correlation between Krishna Rao formula and Modified Chaturvedi formula at 0.999 could be suspected. It is therefore concluded that although any of the recharge formula can be used for estimations, the Kumar and Seethapathi formula is preferred.
The Kumar and Seethapathi formula and Krishna Rao have a correlation of (+1) which makes them perfectly positively correlated to each other.
Being perfectly and positively correlated needed to be examined further to confirm if there exist any
variations. Thus the item statistics showing the mean, minimum and maximum, range and variation of the three formulae was analyzed (Table 8).
Table 8: Summary Item Statistics of the Recharge Formulae
Mean Minimum Maximum Range Minimum/Maximum Variance N of Items
Inter-Item Correlations
.999
.999 1.000 .001 1.001 .000 3
Oke et al.: Comparative Analysis of Groundwater Recharge Estimation Value

063
REFERENCESAdelana, S.M.A., Olasehinde, P. I., and Vrbka, P.
2006. A quantitative estimation of groundwater recharge in part of the Sokoto basin, Nigeria. Journal of Environmental Hydrology 14 (5):1-16.
Agbo, J.U., Alkali, S. C., and Nwaiwu, C. M. O. 1998. Groundwater recharges patterns in the Yobe River Fadama: Evidence from hydrochemistry. Journal of Mining and Geology 34(1): 69-76.
Akande, A. 2006. Radiological hazard Index Assessment of River Osun Sediment. Unpublished B.Sc. Project submitted to the Department of Physics, Tai Solarin University of Education, Ijagun, Ijebu-Ode: Ogun State, Nigeria.
Asseez, L.O. 1972. Rural water supply in the Basement Complex of Western State, Nigeria. Hydrological Science Bulletin 17(1): 97-110.
Bolaji, G. A. and Bhattacharya, A. K. 2010. Fluid Flow Interactions in Ogun River. IJRRAS. 2(2).
Carter, R.C. 1994. The groundwater hydrology of the Manga grasslands, northeast Nigeria: Importance to agricultural development strategies for the area. Quarterly Journal Engineering Geology 27: 73-83.
Edmunds, W. M., Fellman, E., Goni, I. B., and Prudhomme, C. 2002. Spatial and temporal distribution of groundwater recharge in northern Nigeria. Hydrogeology Journal 10: 205-215.
Edmunds, W. M., Fellman, E., Goni, I. B. 1999. Lakes, groundwater and palaeohydrology in the Sahel of Northeast Nigeria: evidence from hydrogeochemistry. Journal of Geological Society. London. 156: 345-355.
Goes, B. J. M. 1999. Estimate of shallow groundwater recharge in the Hadejia-Nguru wetlands, semi-arid northeast Nigeria. Hydrogeology Journal 7: 305-316.
Goni, I. B. 2001. Estimating groundwater recharges using the unsaturated zone chloride profile technique in semiarid northeastern Nigeria. Proceedings of 14th Annual Conference of the Nigerian Associat ion of Hydrogeologists, Abeokuta, Nigeria.
Idowu, O. A., Martins, O. 2007. Hydrograph Analysis for Groundwater Recharge In The Phreatic Basement Aquifer of The Opeki River Basin, Southwestern Nigeria. ASSET- An International Journal, ASSET Series B. 6(2): 132-141.
Jones, A., and Hockey C. 1964. Geology of Southwestern Nigeria. Report. 21:108.
Kumar, C.P. 1977. Estimation of Natural Ground Water Recharge. ISH Journal of Hydraulic Engineering 3(1); 61-74.
Kumar, C. P. 2009. Groundwater Assessment methodology. National Institute of H y d r o l o g y , R o o r k e e - 2 4 7 6 8 7 (Uttarakhand).
Kumar, C. P., and Seethapathi, P. V. 2002. Assessment of Natural Groundwater Recharge in Upper Ganga Canal Command Area. Journal of Applied Hydrology Association of Hydrologists of India. 15 (4):13-20.
Reese, S. O., Risser, D.W. 2010. Summary of groundwater-recharge estimates for Pennsylvania: Pennsylvania Geological Survey, 4. Water Resource Report 70(18): 6.
Ogun River Basin Feasibility Study (OORBDA), 1982. Report of Ogun-Oshun River Basin Development Authority, 2, Ibadan.
Oteze, G. E. 1989. Recharge characteristics of Rima aquifers, Sokoto Basin. Water Resources 1:154-160.
Shekwolo, P. D. 2000. Applying limited data to estimate groundwater recharge in the Bida Basin,Central Nigeria. Journal of Mining and Geology 36(1): 93-104.
Udoh, E. E. 1995. Modeling of Groundwater in Sokoto-Basin, Nigeria. Shaker, Aachen, German.
Uma, K. O. and Egboka, B. C. E. 1988. Groundwater recharge from three cheap and independent methods in the small watersheds of the rain forest belt of Nigeria. In: I. Simmers (eds.) Estimation of Groundwater Recharge 435-447.
Oke et al.: Comparative Analysis of Groundwater Recharge Estimation Value


