Embed Size (px)
Citation preview

The Auk 125(1):20–29, 2008 c� The American Ornithologists’ Union, 2008. Printed in USA.
ON DETERMINING THE SIGNIFICANCE OF EPHEMERAL CONTINENTAL
WETLANDS TO NORTH AMERICAN MIGRATORY SHOREBIRDS
SUSAN K. SKAGEN,1,3 DIANE A. GRANFORS,2 AND CYNTHIA P. MELCHER1
1U.S. Geological Survey, Fort Collins Science Center, 2150 Centre Avenue, Building C, Fort Collins, Colorado 80526, USA; and 2U.S. Fish and Wildlife Service, Habitat and Population Evaluation Team, 21932 State Highway 210, Fergus Falls, Minnesota 56537, USA
Abstract.—Conservation challenges enhance the need for quantitative information on dispersed bird populations in extensivelandscapes, for techniques to monitor populations and assess environmental effects, and for conservation strategies at appropriatetemporal and spatial scales. By estimating population sizes of shorebirds in the U.S. portion of the prairie pothole landscape in centralNorth America, where most migrating shorebirds exhibit a highly dispersed spatial pattern, we determined that the region may play avital role in the conservation of shorebirds. During northward and southwardmigration, 7.3million shorebirds (95%CI: 4.3–10.3million)and 3.9 million shorebirds (95% CI: 1.7–6.0 million) stopped to rest and refuel in the study area; inclusion of locally breeding speciesincreases the estimates by 0.1 million and 0.07 million shorebirds, respectively. Seven species of calidridine sandpipers, includingSemipalmated Sandpipers (Calidris pusilla),White-rumped Sandpipers (C. fuscicollis), and Stilt Sandpipers (C. himantopus), constituted 50% of northbound migrants in our study area. We present an approach to population estimation and monitoring, based on stratifiedrandom selection of townships as sample units, that is well suited to 11 migratory shorebird species. For extensive and dynamic wetlandsystems, we strongly caution against a monitoring program based solely on repeated counts of known stopover sites with historicallyhigh numbers of shorebirds. We recommend refinements in methodology to address sample-size requirements and potential sourcesof bias so that our approach may form the basis of a rigorous migration monitoring program in this and other prairie wetland regions.Received 22 May 2006, accepted 28 January 2007.
Key words: calidridine sandpipers, midcontinental North America, migration, monitoring, population estimation, prairie wetlands,shorebird.
Sobre la Determinaci´ ımeros para las Aves Playeras on de la Importancia de Humedales Continentales Ef´Migratorias Norteamericanas
Resumen.—Los desafıos de conservaci´ on cuantitativa sobre poblaciones de aves on acrecientan la necesidad de contar con informaci´dispersas en paisajes extensos para desarrollar tecnicas para monitorearlas y evaluar efectos ambientales, y para desarrollar estrategias de conservaci´ on de los tama˜on a las escalas temporales y espaciales adecuadas. Mediante la estimaci´ nos poblacionales de aves playeras en la porcion perteneciente a los Estados Unidos del paisaje de humedales ef´ ımeros de las praderas del centro de Norte America, donde la mayorıa de las aves playeras migratorias exhiben un patr´ on espacial altamente disperso, determinamos que la regi´on de distribuci´ on podrıa jugar un papel vital en la conservaci´ on hacia el norte, 7.3 millones de aves playeras (IC on de las aves playeras. Durante la migraci´del 95%: 4.3–10.3 millones) se detuvieron a descansar y a reabastecerse en el on hacia area de estudio, mientras que durante la migraci´el sur, lo hicieron 3.9 millones (IC del 95%: 1.7–6.0 millones). Si se incluyen las especies que se reproducen localmente, los estimadosaumentan en 0.1 y 0.007 millones de aves playeras, respectivamente. Siete especies de playeros calidrinos, incluyendo a Calidris pusilla, C. fuscicollis yC. himantopus, constituyeron el 50% de losmigrantes que se dirigen hacia el norte en nuestra area de estudio. Presentamos un enfoque para estimar y monitorear las poblaciones que se basa en la seleccion aleatoria de municipios como unidades de muestreo, y que se ajusta bien al estudio de 11 especies migratorias de aves playeras. Para sistemas de humedales extensos y dinamicos, sugerimos que no es adecuado realizar programas de monitoreo que se basen solo en conteos repetidos realizados en sitios conocidos de escala migratoria, que siempre han albergado numeros altos de aves playeras. Recomendamos que las metodologıas sean refinadas para evaluar los requerimientos en t´ nos muestrales y las posibles fuentes de sesgo, de manera que nuestro enfoque podrerminos de los tama˜ ıa servir como base para un programa riguroso de monitoreo de la migracion para esta y otras regiones de humedales de praderas.
3E-mail: [email protected]
cPlease direct all requests for permission to photocopy or reproduce article content through the University of California Press’s Rights and Permissions website, http://www.ucpressjournals.com/reprintInfo.asp. DOI: 10.1525/auk.2008.125.1.20
— 20 —
The Auk, Vol. 125, Number 1, pages 20–29. ISSN 0004-8038, electronic ISSN 1938-4254. � 2008 by The American Ornithologists’ Union. All rights reserved.

21 JANUARY 2008 — MIGRATORY SHOREBIRDS IN CONTINENTAL WETLANDS —
The identification of important habitats in all stages of avianlife cycles, including migration, is essential to conservation planning for migratory species. Recent studies suggest that populationlimitation in birds may occur during migration as well as duringbreeding and wintering seasons (Sillett and Holmes 2002, Baker etal. 2004, Morrison 2006). Although more is known about migratory habitats and critical staging sites of shorebirds than of manybird groups, there are several aspects of shorebird migration systems that remain unexplored.TheWestern Hemisphere ShorebirdReserve Network (see Acknowledgments), a voluntary nonregulatory coalition of more than 240 private and public organizations inseven countries, has designated 67 migration sites for protection,totaling ∼9 million ha at the international, hemispheric, national,and regional levels. Although the site-based approach used toidentify and designate most of the WHSRN sites has been highlysuccessful, especially in coastal areas, it has failed to reveal the significance of ephemeral continental wetlands in prairie landscapes.
The extensive wetland systems in central North Americaprovide stopover resources for large populations of migratingshorebirds during northward and southward migrations (Skagenet al. 1999), yet the sizes of these populations are unknown. Inthe extreme and variable climate of the central North American prairie region, highly dynamic wetlands shape a landscape with acontinually changing spatial configuration of micro- and macro-habitats preferred by shorebirds. Migrating shorebirds seekingstopover resources in prairie wetlands respond to the amountof water and suitable habitat on the landscape and, therefore,disperse broadly and unpredictably each spring and fall migration,making monitoring and conservation efforts highly challenging(Skagen and Knopf 1994a, Skagen 1997, Skagen et al. 1999). As aresult, a site-based approach to monitoring shorebirds, althougheffective in describing chronology and use of selected sites, hasbeen unsuccessful in estimating total populations of transitorybirds using the prairie region as a whole.
With forecasts of agricultural intensification to meet growingdemands for food and biofuel production and predictions of globalwarming (Tilman et al. 2001, Johnson et al. 2005, Farrell et al.2006), the next 50 years will bring profound changes in landuse and agricultural practices to the world’s agricultural regions,including the prairie region of North America. To adequatelyaddress shorebird conservation needs in light of these loomingconservation challenges, we must first determine the significanceof the prairie regions to shorebird ecology. There is a strong needfor quantitative information onmigrant population sizes to be usedas a baseline in assessing environmental effects and to inspire thedevelopment of inventive conservation strategies at appropriatetemporal and spatial scales.
Here, we estimated migrant shorebird populations usinga dynamic prairie wetland landscape, the U.S. portion of thePrairie Pothole Region, where 3 million wetlands extend over >300,000 km2. To do so, we used stratified random samplingas an alternative to the standard site-based approach commonto shorebird studies. We were especially interested in estimatingpopulations of several long-distance calidridine migrants, such asStilt Sandpipers and White-rumped Sandpipers (scientific namesof species are given in Table 1), that are abundant yet somewhatrestricted to a narrow band between 90◦W and 100◦W longitudeduring northwardmigration across the United States (Skagen et al.
1999). As a secondary objective, we also evaluate the use of ourpopulation estimation technique as a monitoring tool for highlymobile and dispersed shorebird populations in extensive prairiewetland systems.
METHODS
Study area.—The Prairie Pothole Region of central North Americais characterized by millions of small depressional wetlands leftby receding ice sheets in the late Pleistocene and by a seasonalrelatively dry climate punctuated by severe droughts and deluges(Johnson et al. 2005). The region was part of one of the largestgrassland–wetland ecosystems on earth until agriculture began transforming the landscape around 1890 (Ringelman 2005).Presently, ∼70% of the original grasslands within the regionsupport crop production and >50% of the historical wetlands are gone. Physiographic regions within the study area range from theDrift Prairie, with low relief, fertile soils, and crop agricultureas the dominant land use, to the Missouri and Prairie Coteau regions, with steeper terrain and poorer soils on which grasslandis predominant.
Sampling design.—The sampling frame of this study, definedas portions of North Dakota, eastern South Dakota, and western Minnesota that lie within the Prairie Pothole Region, totals302,250 km2. We specified townships (an area of 36 square miles [93.3 km2] in theU.S. public land surveying system) as the samplingunit. We stratified the sampling frame into four landscape types(defined below) on the basis of attributes that influence shorebirdabundance as determined by preliminary investigations of northbound migrants in eastern South Dakota. Abundances of several shorebird species, including Semipalmated Sandpipers, Whiterumped Sandpipers, and Stilt Sandpipers, were positively associated with total wetland area and cropland area in the landscapesurrounding a wetland (Skagen et al. 2005). We determined thetotal percentage of wetland and cropland area for each township inthe sampling frame and calculated themedian values (median wetland area= 8%, and median cropland area= 60%). We designated four landscape classes: 1 = low wetland area (<8%) and low cropland area (<60%); 2 = low wetland area (<8%) and high cropland area (>60%); 3 = high wetland area (>8%) and low cropland area (<60%); and 4 = high wetland area (>8%) and high cropland area (>60%). We assigned each township within the sampling frame toone of four landscape classes; 14.4%, 36.5%, 32.7%, and 16.4% fellunder landscape classification 1, 2, 3, and 4, respectively, withinthe 302,250-km2 study area.We selected a random sample withoutreplacement of townships from each landscape class and allocateda similar number of sample units to each stratum. A preferredmethod of apportioning effort would be to allocate sample units inrelation to strata variation; we did not do this because we had no prior estimates of variance within strata and because we expectedwithin-stratum variance to differ among species.
Within each township, transects (1.6 km long × 200 m wide; one road segment) were specified as the subsampling unit. Wesurveyed 18–24 systematically selected transects in each townshipwhen feasible; when surveying 18 transects was not feasible, wesurveyed as many as possible. We prioritized viewing to thenorth side of east–west roads and modified transect choices for
22 — SKAGEN, GRANFORS, AND MELCHER — AUK, VOL. 125
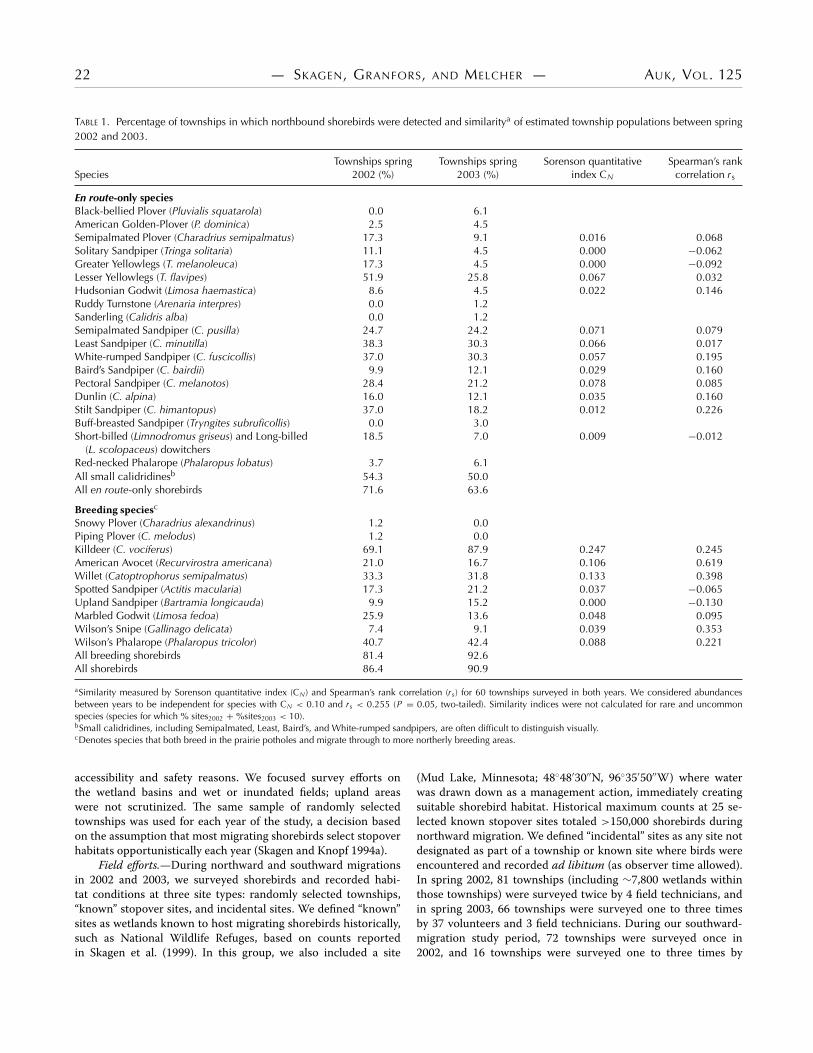
TABLE 1. Percentage of townships in which northbound shorebirds were detected and similaritya of estimated township populations between spring 2002 and 2003.
Townships spring Townships spring Sorenson quantitative Spearman’s rank Species 2002 (%) 2003 (%) index CN correlation rs
En route-only species Black-bellied Plover (Pluvialis squatarola) 0.0 6.1 American Golden-Plover (P. dominica) 2.5 4.5 Semipalmated Plover (Charadrius semipalmatus) 17.3 9.1 0.016 0.068 Solitary Sandpiper (Tringa solitaria) 11.1 4.5 0.000 −0.062 Greater Yellowlegs (T. melanoleuca) 17.3 4.5 0.000 −0.092 Lesser Yellowlegs (T. flavipes) 51.9 25.8 0.067 0.032 Hudsonian Godwit (Limosa haemastica) 8.6 4.5 0.022 0.146 Ruddy Turnstone (Arenaria interpres) 0.0 1.2 Sanderling (Calidris alba) 0.0 1.2 Semipalmated Sandpiper (C. pusilla) 24.7 24.2 0.071 0.079 Least Sandpiper (C. minutilla) 38.3 30.3 0.066 0.017 White-rumped Sandpiper (C. fuscicollis) 37.0 30.3 0.057 0.195 Baird’s Sandpiper (C. bairdii) 9.9 12.1 0.029 0.160 Pectoral Sandpiper (C. melanotos) 28.4 21.2 0.078 0.085 Dunlin (C. alpina) 16.0 12.1 0.035 0.160 Stilt Sandpiper (C. himantopus) 37.0 18.2 0.012 0.226 Buff-breasted Sandpiper (Tryngites subruficollis) 0.0 3.0 Short-billed (Limnodromus griseus) and Long-billed 18.5 7.0 0.009 −0.012
(L. scolopaceus) dowitchers Red-necked Phalarope (Phalaropus lobatus) 3.7 6.1 All small calidridinesb 54.3 50.0 All en route-only shorebirds 71.6 63.6
Breeding speciesc
Snowy Plover (Charadrius alexandrinus) 1.2 0.0 Piping Plover (C. melodus) 1.2 0.0 Killdeer (C. vociferus) 69.1 87.9 0.247 0.245 American Avocet (Recurvirostra americana) 21.0 16.7 0.106 0.619 Willet (Catoptrophorus semipalmatus) 33.3 31.8 0.133 0.398 Spotted Sandpiper (Actitis macularia) 17.3 21.2 0.037 −0.065 Upland Sandpiper (Bartramia longicauda) 9.9 15.2 0.000 −0.130 Marbled Godwit (Limosa fedoa) 25.9 13.6 0.048 0.095 Wilson’s Snipe (Gallinago delicata) 7.4 9.1 0.039 0.353 Wilson’s Phalarope (Phalaropus tricolor) 40.7 42.4 0.088 0.221 All breeding shorebirds 81.4 92.6 All shorebirds 86.4 90.9
aSimilarity measured by Sorenson quantitative index (CN) and Spearman’s rank correlation (rs) for 60 townships surveyed in both years. We considered abundances between years to be independent for species with CN < 0.10 and rs < 0.255 (P = 0.05, two-tailed). Similarity indices were not calculated for rare and uncommon species (species for which % sites2002 + %sites2003 < 10). bSmall calidridines, including Semipalmated, Least, Baird’s, and White-rumped sandpipers, are often difficult to distinguish visually. cDenotes species that both breed in the prairie potholes and migrate through to more northerly breeding areas.
accessibility and safety reasons. We focused survey efforts on (Mud Lake, Minnesota; 48◦48�30��N, 96◦35�50��W) where waterthe wetland basins and wet or inundated fields; upland areas was drawn down as a management action, immediately creatingwere not scrutinized. The same sample of randomly selected suitable shorebird habitat. Historical maximum counts at 25 se-townships was used for each year of the study, a decision based lected known stopover sites totaled >150,000 shorebirds during on the assumption that most migrating shorebirds select stopover northward migration. We defined “incidental” sites as any site nothabitats opportunistically each year (Skagen and Knopf 1994a). designated as part of a township or known site where birds were
Field efforts.—During northward and southward migrations encountered and recorded ad libitum (as observer time allowed).in 2002 and 2003, we surveyed shorebirds and recorded habi- In spring 2002, 81 townships (including ∼7,800 wetlands within tat conditions at three site types: randomly selected townships, those townships) were surveyed twice by 4 field technicians, and“known” stopover sites, and incidental sites. We defined “known” in spring 2003, 66 townships were surveyed one to three timessites as wetlands known to host migrating shorebirds historically, by 37 volunteers and 3 field technicians. During our southward-such as National Wildlife Refuges, based on counts reported migration study period, 72 townships were surveyed once inin Skagen et al. (1999). In this group, we also included a site 2002, and 16 townships were surveyed one to three times by

�
23 JANUARY 2008 — MIGRATORY SHOREBIRDS IN CONTINENTAL WETLANDS —
volunteers in 2003. In addition, known sites (25 during northwardmigration in 2002 and 2003; 24 and 11 during southwardmigrationin 2002 and 2003, respectively) were surveyed as completely aspossible from existing roads and vantage points. We providedsite maps showing all National Wetlands Inventory wetlands fortownships and known sites, comprehensive documents describingfield protocol, and data sheets to all volunteers and field assistants.
Surveys were conducted from 24 April to 25 May (32 days) in2002 and 3–31 May (29 days) in 2003. Survey dates were selectedon the basis of existing chronology information on shorebirdmigration in the region (S. K. Skagen unpubl. data); 90% ofnorthbound migrants were sighted during late April and May.Southward-migration study periods were from 23 July to 5 August2002 and from 20 July to 13 August 2003; because southwardmigration is protracted, these dates captured only part of themigration.
Data analyses.—To test our assumption that most en route shorebirds select stopover habitats opportunistically each year, weevaluated whether bird abundances were independent betweenyears in 60 townships that were common to both northwardmigration samples. We evaluated between-year independence for21 species that occurred, on average, in ≥5% of the townshipsites. We used Spearman’s rank correlation (rs ) and Sorensen’s quantitative index of similarity, CN = 2 j N/(aN + bN), where aN is the total number of individuals in spring 2002, bN is the total number of individuals in spring 2003, and jN is the sumof the lower of the two abundances recorded for species found in both yearsacross all sites (Magurran 1988:95). We considered abundancesbetween years to be independent for species with CN < 0.10 and rs < 0.255 (P = 0.05, two-tailed).
Population estimates for the entire study area were calculatedusing only the township counts. For each surveyed township,we estimated the mean numbers of all shorebird species in thetownship by extrapolating shorebird numbers recorded from thesampled area (road segments) to the entire township area, assuming no biases. We then extrapolated mean numbers from ourcounts to the respective landscape strata. Formulae for populationestimates, standard errors, and degrees of freedom for stratifiedsampling follow Scheaffer et al. (1986) and Bart et al. (1998) and donot include finite population correction factors. We present population estimates for each season, having combined the northwardmigration data to build two-year population estimates only forspecies whose abundances within sites were independent between years.
We distinguished between two groups of shorebirds basedon location of breeding grounds: (1) species that breed northof the prairie potholes and occur in the study area only whenmigrating between wintering and breeding areas (“en route-only”species), and (2) species that breed in the prairie potholes (breeding species), of which some proportion of the population is likely en route to more northern breeding grounds. For the secondgroup, we estimated the proportion of each population that is likely en route by viewing Breeding Bird Survey distributionmaps (Saueret al. 2005) and assessing the extent of breeding range north of thePrairie Pothole Region. Our estimates of the proportion en route were as follows: Killdeer, 0.2; American Avocet, 0.0; Willet, 0.1; Spotted Sandpiper, 0.3; Upland Sandpiper, 0.1; Marbled Godwit,0.2; Wilson’s Snipe, 0.5; and Wilson’s Phalarope, 0.1.
For species that are en route only, we estimated the totalpopulation (i.e., the number of shorebirds stopping in the studyarea during the study period) as
TN = y
B
where T is the length of the survey period in days,B is the assumed average residency period in days, and y is the estimate of the mean number of birds present in the study area during the study period.For ease of calculation and because more precise information isnot yet available, we assumed a seven-day residency period for en routemigrants for both northward and southwardmigrations.This estimate was based on average residency periods of a few speciesin the midcontinental region, notably northbound Semipalmatedand White-rumped sandpipers in Kansas (3.8 days and 7.0 days,respectively; Skagen andKnopf 1994b), southboundLeast and Pectoral sandpipers in Minnesota (7.2 days and 4.9 days, respectively;N. Thomas pers. comm.), and northbound [and southbound]Least and Pectoral sandpipers in Missouri (9.7 days and 10.5 days[3.6 days and 4.9 days], respectively; Farmer and Durbian 2006).We determined the percentage of en route shorebirds that were likely sampled during our study period by using chronology information from a database used to generate chronology histograms inSkagen et al. (1999).
RESULTS
Shorebirds were recorded in 88.4% of townships surveyed duringnorthward migration 2002 and 2003 (86.4% and 90.0%, respectively). During southward migration surveys, shorebirds wererecorded in 61.1% of townships in 2002 and in 64.8% of townshipsacross both years. Bird distributions during northward migrationwere independent between years for all en route-only species andbreeding species except Killdeer, American Avocet, Willet, andWilson’s Snipe (Table 1). Between-year similarity in distribution(measured by Sorenson’s similarity index) was greater for breedersand for widespread species, as indicated by a regression modelcontaining both migration status (coded as 0 for en route species and 1 for breeding species; partial t = 2.243, df = 2 and 18, P = 0.038) and frequency of occurrence (percentage of townships withspecies occurrence; partial t = 7.117, df = 2 and 18, P = 0.000).
Average daily use.—On average, on any day during ournorthward-migration study period, ∼2.3 million (95% confidenceinterval [CI]: 1.6–3.0million) shorebirdswere present in the prairiepothole landscape (Table 2). Northbound en route-only migrantsconstituted 72% of all shorebirds documented. Small calidridine species, or peeps, constituted 53% of the en route-only shorebird population. The average abundances of en route migrants in thestudy area differed between spring 2002 and 2003, with notablymore yellowlegs, Hudsonian Godwits, Pectoral Sandpipers, anddowitchers in spring 2002, and more White-rumped, Baird’s, andStilt sandpipers in spring 2003 (Table 2).
During southward migration, 2.4 million (95% CI: 1.2–3.6million) shorebirds occurred daily in wetland habitats and inundated fields in the study area; 82% were en route-only shorebirds(Table 3). Small calidridine sandpipers were less numerous inthe fall (16% of all en route-only shorebirds) than in the spring,

24 — SKAGEN, GRANFORS, AND MELCHER — AUK, VOL. 125
TABLE 2. Number of shorebirds (mean ± SE) in the prairie pothole study area during northward migration and coefficient of variation (CV) of population estimates for spring 2002, 2003, and both years combined where appropriate.
Average number of shorebirds in the study area during the study period
Spring 2002 (n = 81) Spring 2003 (n = 66) Springs 2002 + 2003 (n = 147)
Species (mean ± SE) CV (mean ± SE) CV (mean ± SE) CV
En route-only species Black-bellied Plover 0 9,758 ± 5,428 0.56 4,337 ± 3,687 0.85 Semipalmated Plover 12,904 ± 5,399 0.42 15,354 ± 7,148 0.47 14,229 ± 4,716 0.33 Greater Yellowlegs 33,312 ± 14,748 0.44 2,677 ± 1,743 0.65 20,832 ± 9,102 0.44 Lesser Yellowlegs 200,980 ± 53,138 0.26 24,435 ± 7,077 0.29 128,101 ± 34,693 0.27 Solitary Sandpiper 5,212 ± 1,800 0.35 1,957 ± 1,309 0.67 3,809 ± 1,330 0.35 Hudsonian Godwit 25,269 ± 12,125 0.48 5,332 ± 3,780 0.71 16,229 ± 6,974 0.43 Semipalmated Sandpiper 168,833 ± 51,881 0.31 177,092 ± 66,886 0.38 170,681 ± 43,645 0.26 Least Sandpiper 165,005 ± 44,653 0.27 122,170 ± 41,781 0.34 145,642 ± 34,152 0.23 White-rumped Sandpiper 222,971 ± 63,369 0.28 605,343 ± 265,590 0.44 388,781 ± 132,773 0.34 Baird’s Sandpiper 17,411 ± 8,834 0.51 75,179 ± 48,378 0.64 43,377 ± 32,082 0.74 Pectoral Sandpiper 77,621 ± 24,019 0.31 28,969 ± 12,794 0.44 55,730 ± 14,998 0.27 Dunlin 78,804 ± 35,635 0.45 91,429 ± 58,575 0.64 86,017 ± 36,375 0.42 Stilt Sandpiper 160,552 ± 51,691 0.32 449,592 ± 210,986 0.47 285,440 ± 96,597 0.34 Dowitchers 224,591 ± 124,412 0.55 54,141 ± 36,018 0.67 140,409 ± 63,658 0.45 Red-necked Phalarope 4,446 ± 2,736 0.62 40,468 ± 30,502 0.75 19,171 ± 12,246 0.64 All small calidridinesb 721,268 ± 169,560 0.24 1,116,407 ± 365,661 0.33 887,189 ± 197,613 0.22 All en route-only shorebirds 1,566,201 ± 326,374 0.21 1,844,937 ± 659,213 0.36 1,675,664 ± 346,954 0.21
Breeding species Killdeer 109,716 ± 16,925 0.15 208,766 ± 37,777 0.18 American Avocet 59,148 ± 25,202 0.43 26,777 ± 10,558 0.39 Willet 56,674 ± 25,101 0.44 33,805 ± 12,404 0.37 Spotted Sandpiper 9,043 ± 3,958 0.44 20,276 ± 13,160 0.65 14,064 ± 9,223 0.66 Upland Sandpiper 8,129 ± 4,395 0.54 11,211 ± 4,375 0.39 9,464 ± 4,037 0.43 Marbled Godwit 53,363 ± 22,040 0.41 11,429 ± 5,364 0.47 35,767 ± 13,435 0.38 Wilson’s Snipe 5,901 ± 2,563 0.43 75,347 ± 69,431 0.92 Wilson’s Phalarope 291,469 ± 90,339 0.31 317,438 ± 92,335 0.29 303,441 ± 65,329 0.22 All breeding shorebirds 597,962 ± 125,861 0.21 705,048 ± 138,667 0.20 651,505 ± 93,634c 0.14
All shorebirds 2,159,644 ± 415,747 0.19 2,549,985 ± 695,759 0.27 2,327,169 ± 359,367d 0.15
aNumber of townships surveyed each year is designated by n. American Golden Plover, Ruddy Turnstone, Sanderling, Buff-breasted Sandpiper, Snowy Plover, and Piping Plover are not included, because population estimation using this method was clearly not successful (CV = 1.00). bSemipalmated, Least, Baird’s, and White-rumped sandpipers are often difficult to distinguish visually. cMeans derived by averaging estimates of 2002 and 2003. dSum of en route-only shorebirds and breeding shorebirds in the combined years of 2002–2003.
primarily because of the absence of White-rumped Sandpipers which shorebird species were detected (r = 0.613, df = 20, P <
and Dunlin. Yellowlegs, Pectoral Sandpipers, and dowitchers were 0.005 for northward migration and r = 0.601, df = 16, P < 0.01 more abundant during southward than northward migrations and for southward migration).constituted 17%, 18%, and 23% of the southbound en route-only To determine whether stratification into four landscape typesshorebird population, respectively. With the exception of Killdeer improved precision of the average daily population estimates overand Spotted Sandpipers, breeding species were less abundant a simple random sample, we calculated the percentage of reductionduring the late-summer–fall than spring study periods. in standard errors afforded by stratification as (SEsrs – SEstr) /
Precision of estimates.—In 2002, the precision of average daily SEstr, where SEsrs is the standard error under the assumption thatpopulation estimates (coefficient of variation) was positively cor- townships represent a simple random sample, and SEstr is the related with extent of occurrence (for breeding and en route-only standard errors obtained from the stratified random samples. (Wespecies combined, Pearson’s r = −0.837, df = 20, P < 0.001 for recognize that a proportional allocation of samples across thenorthward migration; r = −0.862, df = 16, P < 0.001 for south- four strata would improve the value of this exercise.) Stratificationward migration; Fig. 1). In other words, population estimates for improved population estimates for six species and two groups of en widespread species tended to be more precise than estimates for route-only migrants; standard errors were reduced by >5% duringspecies with more constrained distributions. Widespread species both of the two spring seasons for Semipalmated Plover (32%were also more abundant, as revealed by positive correlations average reduction for 2002 and 2003 spring seasons), Hudsonianbetween population estimates and the percentage of townships in Godwit (25%), Semipalmated Sandpiper (30%), Least Sandpiper

25 JANUARY 2008 — MIGRATORY SHOREBIRDS IN CONTINENTAL WETLANDS —
TABLE 3. Percentage of townships surveyed (n = 72) in which southbound shorebirds were detected (% sites), number of shorebirds (mean ± SE), and coefficient of variation (CV) in late summer and early fall 2002.
Average number of shorebirds in the study area during the study period
Species (% sites) (mean ± SE) CV
En route-only species Semipalmated Plover 15.3 29,829 ± 13,323 0.45 Greater Yellowlegs 22.2 52,985 ± 15,700 0.30 Lesser Yellowlegs 50.0 283,578 ± 63,956 0.23 Solitary Sandpiper 13.9 12,320 ± 5,578 0.45 Semipalmated Sandpiper 19.4 60,716 ± 26,860 0.44 Least Sandpiper 36.1 96,473 ± 24,022 0.25 Baird’s Sandpiper 19.4 59,116 ± 26,977 0.46 Pectoral Sandpiper 40.3 356,712 ± 98,380 0.28 Stilt Sandpiper 16.7 225,412 ± 106,268 0.47 Dowitchers 16.7 444,791 ± 284,791 0.64 All small calidridinesa 40.3 320,111 ± 90,463 0.28 All en route-only shorebirds 55.6 1,946,224 ± 539,160 0.28
Breeding and en route species Killdeer 58.3 260,322 ± 47,715 0.18 American Avocet 4.2 5,216 ± 3,603 0.69 Willet 5.6 8,088 ± 5,812 0.72 Spotted Sandpiper 19.4 14,503 ± 5,737 0.40 Upland Sandpiper 2.8 2,796 ± 2,416 0.86 Marbled Godwit 2.8 4,683 ± 4,302 0.92 Wilson’s Snipe 0 0 ± 0 Wilson’s Phalarope 19.4 141,592 ± 65,893 0.47 All breeding shorebirds 61.1 437,201 ± 98,282 0.22 All shorebirds 61.1 2,383,425 ± 615,004 0.26
aSemipalmated, Least, Baird’s, and White-rumped sandpipers are often difficult to distinguish visually.
(7%), White-rumped Sandpiper (26%), Stilt Sandpiper (35%),dowitchers (70%), and all small calidridines (29%). The first sixspecies exhibited similar affinities, occurring in greatest densitiesin stratum 4 (high wetland area and high cropland area, mean ± SE= 844± 467 birds per township, n = 36), intermediate densities in strata 1 (340± 136 birds per township, n= 37) and 3 (338± 114 birds per township, n = 38), and lowest densities in stratum 2 (lowwetland area and high cropland area, 129 ± 93 birds per township, n = 36). By contrast, dowitchers occurred in greatest densities instratum 1 (low wetland area and low cropland area, 171 ± 128 birds per township), in intermediate densities in strata 3 (31 ± 14 birds per township) and 4 (51 ± 31 birds per township), and wereabsent from stratum2.Consistent increases in standard errorswith stratification suggested that a simple random sampling approach(or stratification with differently designated strata) would providebetter precision for Baird’s Sandpiper; standard errors in 2002 and2003 increased by 10% and 31% under stratification.
Study periods in relation to migration chronology.—Our northward-migration study period encompassed the major en route movements of many, but not all, of the abundant shorebird species. We estimate that 89% of the northbound migrantswere sampled in our study, based on species-specific migrationchronology data (Skagen et al. 1999; Table 4), including nearly100% of Least Sandpipers, Dunlin, and Stilt Sandpipers. Existingchronology information suggests, however, that survey coverageextending into early to mid-April would capture a larger portionof northbound Greater and Lesser yellowlegs, Solitary Sandpipers,Hudsonian Godwits, and Baird’s Sandpipers, and later surveyswould include more Black-bellied Plovers, White-rumped Sand-pipers, and Red-necked Phalaropes (Fig. 2).
By contrast, our briefer southward-migration study period encompassed only a fraction of the migration periods of most en route species. Survey periods of 8–10 weeks, generally
FIG. 1. Precision of population estimates (as expressed by the coefficient of variation) is greater for breeding and migrating shorebirds with broader distributions (species that occupy a larger percentage of surveyed townships) during (A) northward and (B) southward migration across the prairie pothole landscape of the United States, 2002.

26 — SKAGEN, GRANFORS, AND MELCHER — AUK, VOL. 125
TABLE 4. Estimate (± SE) of the total number of en route shorebirds using the prairie pothole study area during northward (average 30.5 days) and southward (14 days) migration study periods, assuming average residency of 7 days for northbound and southbound birds.a
Northward migration 2002–2003 Southward migration 2002
Species Sampled (%) Estimate ± SE Sampled (%) Estimate ± SE
Black-bellied Plover 67 18,897 ± 16,064 5 0 Semipalmated Plover 91 61,999 ± 20,546 22 59,658 ± 26,645 Greater Yellowlegs 31 90,766 ± 39,658 16 105,971 ± 31,399 Lesser Yellowlegs 80 558,156 ± 151,163 17 567,156 ± 127,913 Solitary Sandpiper 74 16,596 ± 5,797 23 24,639 ± 11,156 Hudsonian Godwit 73 70,710 ± 30,385 N/A 0 Semipalmated Sandpiper 92 743,683 ± 190,166 26 121,432 ± 53,719 Least Sandpiper 98 634,582 ± 148,806 22 192,947 ± 48,045 White-rumped Sandpiper 83 1,693,976 ± 578,512 N/A 0 Baird’s Sandpiper 73 189,000 ± 139,786 19 118,232 ± 53,954 Pectoral Sandpiper 90 242,824 ± 65,349 15 713,424 ± 196,761 Dunlin 99 374,787 ± 158,491 N/A 0 Stilt Sandpiper 100 1,243,703 ± 420,889 29 450,825 ± 212,536 All dowitchers 86 611,784 ± 277,366 10 889,582 ± 569,582 Red-necked Phalarope 86 83,530 ± 53,358 13 0 All small calidridinesb 86 3,865,609 ± 861,029 24 640,222 ± 180,926 All en route-only shorebirds 89 7,301,108 ± 1,511,728 16 3,892,447 ± 1,078,319 En route component of breeding populationsc 99,347 ± 36,724 71,440 ± 18,430
aEstimates of the percentage of the total population sampled (percentage sampled) during the study periods are based on species-specific migration chronology (Skagen et al. 1999). bSemipalmated, Least, Baird’s, and White-rumped sandpipers are often difficult to distinguish visually. cThe en route component of breeding populations calculated as proportion en route × average population size for each species. N/A = not available.
extending to mid-September, would be necessary to cover ≥80% of many southbound shorebird populations (Fig. 2).
Estimates of total migrant population.—When incorporatingassumptions of residency periods from township counts, we estimated that 7.3 million en route-only shorebirds (95% CI: 4.3–10.3 million) stop to rest and refuel in the study area during northwardmigration (Table 4). During the shorter southward-migrationstudy period, 3.9 million en route-only shorebirds (95% CI: 1.7–6.0 million) stopped in the study area. By adding in the breeding species and their estimated “en route proportion,” the above estimates would increase by 0.1million and 0.07million shorebirdsduring northward and southward migrations, respectively.
Survey results from known site counts.—When incorporatingour assumptions of residency periods, the known stopover siteshosted 26,247 and 29,495 northbound en route-only migrantsduring our study periods in 2002 and 2003, and 13,028 southbound en route-only shorebirds in 2002. Breeding birds (adjusted toinclude the en route proportion) totaled 1,506 and 2,042 in springs2002 and 2003 and 3,333 in fall 2002. Approximately 62% ofnorthbound shorebirds and 27% of southbound shorebirds at the known sites were small calidridines.
DISCUSSION
Several lines of evidence reveal the vital role that wetlands of the central prairies of North America play in the life cycles of migratory shorebirds. Shorebirds following a transcontinental migrationroute appear to be more vulnerable to population declines than
coastal or oceanic migrants (Thomas et al. 2006) and, as is thecase with coastal shorebird migrants, the reproductive success oftranscontinental migrant shorebirds may be closely linked withforaging conditions at the last few, or the penultimate, springstopover sites (Krapu et al. 2006,Morrison 2006, Skagen 2006).Thepopulation estimates reported here suggest that 7.3 million shorebirds refuel in the U.S. portion of the Prairie Pothole Region duringnorthward migration. Many of these birds, and notably calidridinesandpipers, which constitute more than half of the northboundmigrants, may depend highly on these penultimate spring stopoversites to maintain adequate body condition for successful breeding.
Our point estimates of northbound shorebirds (7.3 million,including 3.9 million calidridines) far exceed earlier compilationsof maximum counts across the entire interior flyway (2.3 millionshorebirds, including 1.4 million calidridines; Morrison et al.2001). Several million shorebirds sought foraging resources duringour study, even though less suitable shorebird habitat was probablyavailable to birds than during wetter years (when calidridine sandpipers primarily use temporary and seasonal wetlands containingwater) or after a series of dry years (when calidridines congregate insemipermanent wetlands with exposed muddy shorelines; Skagenet al. 2005). In general, the condition of wetlands in our study areaduring 2002–2003 reflected a time of transition from a 10-year wetperiod to a drier period (Johnson et al. 2004); most semipermanentwetlands affected by groundwater levels were still full, yielding little or no shoreline or mudflats, and many temporary and seasonalwetlands normally filled by precipitation and runoff were dry.
There is a growing need for quantitative information ondispersed bird populations during migration, for methods and

27 JANUARY 2008 — MIGRATORY SHOREBIRDS IN CONTINENTAL WETLANDS —
FIG. 2. Expected migration chronology of northbound and southbound shorebirds between 45◦N and 50◦N latitude (modified from Skagen et al. 1999). Wide hatched bars represent two-week periods that cover 60–75% of the population, wide bars in combination with black bars of intermediate width cover 80–92% of the population, and all bars, including narrow black bars, cover 95–99% of the population.
techniques to monitor populations and to assess environmentaleffects, and for conservation strategies that can operate at the appropriate temporal and spatial scales. Especially during migration,dispersed bird populations in highly dynamic landscapes oftendo not gain the attention of scientists and managers as strikinglylarge avian congregations in well-known important sites do. Ourstudy illustrates a place in time where most migrating birds arehighly dispersed. Further, in the extensive wetland landscapes ofthe Prairie Pothole Region, environmental threats such as erosionand sedimentation can be subtle and far-reaching. This studyreveals that many shorebird species, especially calidridines, tendto occur in landscapes of high wetland densities in matrices oftilled croplands (see also Skagen et al. 2005). We commend theWestern Hemisphere Shorebird Reserve Network HemisphericCouncil for recently creating a new designation—a Landscape ofHemispheric Importance—to supplement their set of conservationtools and to herald a new generation of conservation efforts thatcan more effectively address shorebird conservation in extensiveprairie wetland landscapes.
Our approach to population estimation, based on stratifiedrandom selection of townships as sample units, holds promise asa monitoring tool for several migrating wetland-dependentshorebird species, especially those that are common and widespread. The findings of our study and another study of smallisolated wetlands in the Drift Prairie of North Dakota are mutually
supportive; Niemuth et al. (2006) estimate that 3.6 million (95%CI: 2.0–5.2 million) breeding and en route-only shorebirds usethe temporary and seasonal wetlands in the Drift Prairie duringspring. A target coefficient of variation for the population estimateof 0.31 or lower, based on guidelines of the Program for Regionaland International Shorebird Monitoring (PRISM; 80% power todetect a 50% decline occurring during 20 years, using a two-tailedtest with the significance level set at 0.15; Bart et al. 2005), was metor nearly met for northbound and southbound Lesser Yellowlegs,Least Sandpipers, and Pectoral Sandpipers, northbound Semipalmated Plovers, Solitary Sandpipers, Semipalmated Sandpipers,White-rumped Sandpipers, and Stilt Sandpipers, and southboundGreater Yellowlegs. This target level of precision could be attainedfor northbound Hudsonian Godwit, Dunlin, and dowitchers with a larger sample or an alternative design such as a serial alternatingpanel approach (Roesch and Reams 1999, Manley et al. 2005).However, our method is clearly inappropriate for other species,especially those that are rare or whose distributions are highlyaggregated, for example, American Golden-Plovers, Ruddy Turnstones, Sanderlings, Buff-breasted Sandpipers, and Black-belliedPlovers.
In extensive and dynamic wetland systems such as the prairiepothole landscape, we do not recommend a monitoring programbased solely on repeated counts of important sites with historicallyhigh shorebird numbers. With a few exceptions, such sites in this

28 — SKAGEN, GRANFORS, AND MELCHER — AUK, VOL. 125
study did not provide optimal habitat for migrating shorebirdsduring northward migration in 2002 and 2003, and shorebirdcounts at these sites were lower than expected on the basisof historical counts. For example, prior spring counts in thedrier years of the early 1990s at Dry Lake, South Dakota(44◦56�45��N, 97◦40�50��W), and Minnewaukan Flats, North Dakota (48◦03�50��N, 99◦09�20��W), exceeded 50,000 and 80,000shorebirds, respectively (Skagen 1997), whereas counts of thesame areas in 2002 and 2003 were less than 150 and 1,300, respectively. The low counts during our study were a direct resultof the exceedingly high water levels at Dry Lake andMinnewaukanFlats (many roads were under water). Because the known stopoversites were not selected randomly from the landscape, there is nostatistical basis by which to extrapolate these counts to estimatenumbers of shorebirds across the landscape. However, surveyingknown sites as a separate stratum in conjunction with therandomly selected township-based approach could be especiallyimportant when shorebirds tend to congregate (e.g., in drieryears when semipermanent wetlands provide substantial suitablehabitat). With this dual approach, the area of the known siteswould be subtracted from the total area used to extrapolate thetownship-based estimates, and the resulting census numbers fromthe known sites would be added to the township-based estimates.
Study design considerations.—The approach we used toestimate populations of migrating shorebirds could apply morebroadly to other groups of birds and other regions where suitablehabitats are widely dispersed and spatially and temporallyunpredictable. We consider the population estimates presentedhere conservative in light of four potential sources of bias,sources that would need to be addressed before basing a rigorousmonitoring program on this approach. First, we suspect a smallnegative bias because detection probability was <1 in parts ofthe transect area. Although we surveyed relatively narrow striptransects within 200 m of the road and assumed all birds presentwere detected, some birds may have been obscured by vegetationor topographical features. We suspect the bias is small becausemany of our target species avoid dense vegetation and prefersubstrates with <25% vegetative cover (Helmers 1992), and mostof the wetlands within 200 m in this relatively flat and rollinglandscape were fully visible to the surveyor. Similarly, Niemuthet al. (2006) found that <4% of 1,181 temporary and seasonalwetlands in the agricultural Drift Prairie region of North Dakotawere not completely visible from the road. In a sample of 759wetlands, 14.4% (906 of 6,276 ha) of the habitat was wet mud orshallow water covered by vegetation (S. K. Skagen unpubl. data),which suggests that 14.4% of our strip transects was potentialshorebird habitat in which the probability of detection was <1. If we adjust our population estimates based on recent estimates ofdetectability in moderately vegetated Missouri wetlands (Farmerand Durbian 2006), our estimates increase by ∼10%.
Second, the population estimates could be positively or negatively biased if shorebirds distribute nonrandomly with respectto roads, either because of varying wetland distribution in relationto roads or because shorebirds avoid or are attracted to roads or roadside habitats. Two studies evaluating the potential for roadsidebias in the prairie potholes found no evidence of such bias inwaterfowl (Austin et al. 2003) or in areas of temporary and seasonalwetlands along Breeding Bird Survey (BBS) routes in relation to
the surrounding landscape (N. D. Niemuth pers. comm.). Thearea of semipermanent wetlands, however, is significantly underrepresented along roadsides (N. D. Niemuth pers. comm.), whichsuggests that our methods would underestimate shorebirds associated with this wetland type.
A third potential source of bias in population estimates mayderive from assumptions of residency periods at stopover sites.We assumed an average residency period of seven days based onavailable estimates from the midcontinental region. A handling effect when capturing birds to apply radiotransmitters may increasethe length of stay at the point of capture by as many as threedays (Warnock and Bishop 1998, Lehnen and Krementz 2005).Because our assumptions of length of stay were based on studiesthat estimated residency at point of capture only, these estimatesmay be longer than actual residency periods. If we assumed ashorter average duration of stay, our population estimates wouldbe greater. Finally, our estimates of southbound migrants arenegatively biased because the migration window within which wesurveyed did not encompass the entire migratory period. Further, to detect potential future shifts in chronology, we advise extendingthe study periods to encompass the entiremigratory season duringboth spring and fall (Fig. 2).
Central North American prairie wetlands play a vital rolein the conservation of migratory shorebirds, hosting >7,300,000 shorebirds, of which half are calidridine sandpipers. Becauseenvironmental threats in extensive wetland landscapes are oftensubtle but far-reaching, there is a pressing need for quantitativeinformation on dispersed bird populations in highly dynamiclandscapes. An approach to population estimation andmonitoringthat is based on stratified random selection of townships as sampleunits is well suited to at least 11 migratory shorebird species. With the recommended extensions and refinements, this approach mayform the basis of rigorous monitoring programs in this and otherprairie-wetland regions.
ACKNOWLEDGMENTS
This project was funded by the U.S. Geological Survey nationallevel Science Support Program,U.S.Geological Survey FortCollinsScience Center, Prairie Pothole Joint Venture, and U.S. Fish and Wildlife Service Region 3. We sincerely appreciate the land-usedata and in-kind support contributed by the U.S. Fish andWildlife Service Habitat and Population Evaluation Teams. J. Bart provided statistical consultation. B. Harrington and the InternationalShorebird Survey provided administrative support to volunteers.We thank A. Taylor, A. Lueders, C. Brundy, M. B. Dillon, N.Thomas, and 37 volunteers for their invaluable field assistance, and B. S. Cade, N. D. Niemuth, and N. Warnock for comments on the manuscript. For information on the Western HemisphereShorebird Reserve Network, see www.whrsn.org
LITERATURE CITED
Austin, J. E., G. R. Guntenspergen, H. T. Sklebar, and T.K. Buhl. 2003. Differences in distribution of modified basins and ducks relative to roadside transects. Wetlands 23:140– 148.

29 JANUARY 2008 — MIGRATORY SHOREBIRDS IN CONTINENTAL WETLANDS —
Baker, A. J., P. M. Gonzalez, T. Piersma, L. J. Niles, I. de L. S. do Nascimento, P. W. Atkinson, N. A. Clark, C. D. T. Minton, M. K. Peck, and G. Aarts. 2004. Rapid populationdecline in Red Knots: Fitness consequences of decreased refuelling rates and late arrival in Delaware Bay. Proceedings of theRoyal Society of London, Series B 271:875–882.
Bart, J., B. Andres, S. Brown, G. Donaldson, B. Harrington, V. Johnston, S. Jones, R. I. G. Morrison, S. Skagen. 2005.The Program for Regional and International Shorebird Monitoring (PRISM). Pages 893–901 in Bird Conservation Implementation and Integration in the Americas: Proceedings of theThird International Partners in Flight Conference, vol. 2 (C. J. Ralph and T. D. Rich, Eds.). U.S. Department of Agriculture,Forest Service, General Technical Report PSW-GTR-191.
Bart, J., M. A. Fligner, and W. I. Notz. 1998. Sampling andStatistical Methods for Behavioral Ecologists. Cambridge University Press, Cambridge, United Kingdom.
Farmer,A., andF.Durbian. 2006. Estimating shorebird numbersat migration stopover sites. Condor 108:778–807.
Farrell, A. E., R. J. Plevin, B. T. Turner, A. D. Jones, M. O’Hare, and D. M. Kammen. 2006. Ethanol can contribute to energy and environmental goals. Science 311:506–508.
Helmers, D. L. 1992. Shorebird Management Manual. WesternHemisphere Shorebird Reserve Network, Manomet, Massachusetts.
Johnson, W. C., S. E. Boettcher, K. A. Poiani, and G. Guntenspergen. 2004. Influence of weather extremes on thewater levels of glaciated prairiewetlands.Wetlands 24:385–398.
Johnson, W. C., B. V. Millett, T. Gilmanov, R. A. Voldseth, G. R. Guntenspergen, andD. E. Naugle. 2005. Vulnerabilityof northern prairie wetlands to climate change. BioScience55:863–872.
Krapu, G. L., J. L. Eldridge, C. L. Gratto-Trevor, and D. A. Buhl. 2006. Fat dynamics of Arctic-nesting sandpipers duringspring in mid-continental North America. Auk 123:323–334.
Lehnen, S. E., and D. G. Krementz. 2005. Turnover rates of fallmigrating Pectoral Sandpipers in the LowerMississippi alluvialvalley. Journal of Wildlife Management 69: 671–680.
Manley, P. N., B. Van Horne, J. K. Roth, W. J. Zielinski, M.M. McKenzie, T. J. Weller, F. W. Weckerly, and C. Vojta.2005. Multiple species inventory and monitoring technicalguide, version 1.0. U.S. Department of Agriculture, ForestService, Washington, D.C. [Online.] Available at www.fs.fed.us/psw/programs/snrc/featured topics/msim/documents/ msim preprint.pdf.
Margurran, A. E. 1988. Ecological Diversity and Its Measurement. Princeton University Press, Princeton, New Jersey.
Morrison, R. I. G. 2006. Body transformations, condition, andsurvival in Red Knots Calidris canutus travelling to breed at Alert, Ellesmere Island, Canada. Ardea 94:607–618.
Morrison, R. I. G., R. E. Gill, Jr., B. A. Harrington, S. [K.]Skagen, G.W. Page, C. L. Gratto-Trevor, and S. M. Haig.2001. Estimates of shorebird populations in North America.Canadian Wildlife Service Occasional Paper, no. 104. Ottawa,Ontario.
Niemuth, N. D., M. E. Estey, R. E. Reynolds, C. R. Loesch,and W. A. Meeks. 2006. Use of wetlands by spring-migrant
shorebirds in agricultural landscapes of North Dakota’s driftprairie. Wetlands 26:30–39.
Ringelman, J. K., Ed. 2005. Prairie Pothole Joint Venture 2005Implementation Plan, Section I – Plan Foundation. [Online.]Available at www.ppjv.org/pdf/Part1 Foundation.pdf.
Roesch, F. A., and G. A. Reams. 1999. Analytical alternativesfor an annual inventory system. Journal of Forestry 97:33–37.
Sauer, J. R., J. E. Hines, and J. Fallon. 2005. The North American Breeding Bird Survey, draft results and analysis1966–2005, version 6.2.2006. U.S. Geological Survey, PatuxentWildlife Research Center, Laurel, Maryland. [Online.] Availableat www.mbr-pwrc.usgs.gov/bbs/.
Scheaffer, R. L., W. Mendenhall, and L. Ott. 1986. Elementary Survey Sampling, 3rd ed. Duxbury Press, Boston,Massachusetts.
Sillett, T. S., and R. T. Holmes. 2002. Variation in survivorshipof a migratory songbird throughout its annual cycle. Journal ofAnimal Ecology 71:296–308.
Skagen, S. K. 1997. Stopover ecology of transitory populations:The case of migrant shorebirds. Ecological Studies 125:244–269.
Skagen, S. K. 2006. Migration stopovers and the conservation of Arctic-breeding calidridine sandpipers. Auk 123:313–322.
Skagen, S. K., S. Brown, and R. Johnson. 2005. Implicationsof different shorebird migration strategies for habitat conservation. Pages 680–683 in Bird Conservation Implementationand Integration in the Americas: Proceedings of the ThirdInternational Partners in Flight Conference, vol. 2 (C. J. Ralphand T. D. Rich, Eds.). U.S. Department of Agriculture, ForestService, General Technical Report PSW-GTR-191.
Skagen, S. K., and F. L. Knopf. 1994a. Migrating shorebirds andhabitat dynamics at a prairie wetland complex. Wilson Bulletin 106:91–105.
Skagen, S. K., and F. L. Knopf. 1994b. Residency patterns ofmigrating sandpipers at a midcontinental stopover. Condor96:949–958.
Skagen, S. K., P. B. Sharpe, R. G. Waltermire, and M. B.Dillon. 1999. Biogeographical profiles of shorebird migrationin midcontinental North America. U.S. Geological Survey,Biological Science Report USGS/BRD/BSR—2000–0003. FortCollins, Colorado. [Online.] Available at www.fort.usgs.gov/Products/Publications/555/toc.html.
Thomas, G. H., R. B. Lanctot, and T. Szekely. 2006. Canintrinsic factors explain population declines inNorthAmericanbreeding shorebirds? A comparative analysis. Animal Conservation 9:252–258.
Tilman, D., J. Fargione, B. Wolff, C. D’Antonio, A. Dobson, R. Howarth, D. Schindler, W. H. Schlesinger, D.Simberloff, andD. Swackhamer. 2001. Forecasting agriculturally driven global environmental change. Science 292:281–284.
Warnock, N., and M. A. Bishop. 1998. Spring stopover ecologyof migrant Western Sandpipers. Condor 100:456–467.
Associate Editor: J. Jones


