Embed Size (px)
Citation preview

Bioresource Technology 102 (2011) 6702–6709
Contents lists available at ScienceDirect
Bioresource Technology
journal homepage: www.elsevier .com/locate /bior tech
On-line monitoring of the transesterification reaction between triglyceridesand ethanol using near infrared spectroscopy combined with gas chromatography
Romain Richard a,b,c, Ying Li a,b, Brigitte Dubreuil a,b, Sophie Thiebaud-Roux a,b,⇑, Laurent Prat c
a Université de Toulouse, INPT, LCA (Laboratoire de Chimie Agro-Industrielle), ENSIACET, 4 allée Emile Monso, F-31030 Toulouse, Franceb INRA, LCA (Laboratoire de Chimie Agro-Industrielle), F-31030 Toulouse, Francec Université de Toulouse, INPT, CNRS, Laboratoire de Génie Chimique, UMR 5503, 4, allée Emile Monso, BP 44362, 31030 Toulouse cedex 4, France
a r t i c l e i n f o
Article history:Received 10 February 2011Received in revised form 31 March 2011Accepted 31 March 2011Available online 5 April 2011
Keywords:BiodieselTransesterificationNIR spectroscopyGas chromatographyEthanol
0960-8524/$ - see front matter � 2011 Elsevier Ltd. Adoi:10.1016/j.biortech.2011.03.111
⇑ Corresponding author. Address: INPT-ENSIACET,industrielle, 4 allée Emile Monso, BP 44362, 31030 T+33 5 34 32 35 04; fax: +33 5 34 32 35 97.
E-mail address: [email protected] (
a b s t r a c t
Many analytical procedures have been developed to determine the composition of reaction mixtures dur-ing transesterification of vegetable oils with alcohols. However, despite their accuracy, these methods aretime consuming and cannot be easily used for on-line monitoring. In this work, a fast analytical methodwas developed to on-line monitor the transesterification reaction of high oleic sunflower oil with ethanolusing Near InfraRed spectroscopy and a multivariate approach. The reactions were monitored throughsequential scans of the reaction medium with a probe in a one-liter batch reactor without collectingand preparing samples. To calibrate the NIR analytical method, gas chromatography-flame ionizationdetection was used as a reference method. The method was validated by studying the kinetics of theEtONa-catalyzed transesterification reaction. Activation energy (51.0 kJ/mol) was also determined byconsidering a pseudo second order kinetics model.
� 2011 Elsevier Ltd. All rights reserved.
1. Introduction
Due to the related increasing price and depletion of fossil fuelsand the worldwide environmental concern about green house ef-fect, alternative fuels for diesel engines have been widely studiedduring the last decades. Biodiesel, as a renewable alternative dieselfuel, can be derived from vegetable oils, animal fats, and wastecooking oils which contain triglycerides (Demirbas and Karslioglu,2007; Encinar et al., 2007). It has the following advantages: techni-cally feasible, environmentally acceptable, economically competi-tive and constantly available (Srivastava and Prasad, 2000). Themost common method used to produce biodiesel is the transeste-rification, which refers to a chemical reaction between vegetableoil (triglycerides) and a short chain alcohol with a catalyst to pro-duce fatty acid alkyl esters (biodiesel) and glycerol as a by-product.The overall process is normally a sequence of three consecutivesteps, which are reversible reactions. In the first step, from triglyc-erides (TG), diglycerides (DG) are obtained; monoglycerides (MG)are then produced from diglycerides and in the last step, frommonoglycerides, glycerol (GL) is obtained. In all these reactions, es-ters are produced. Many works have used methanol (Darnoko andCheryan, 2000; Fukuda et al., 2001) as alcohol reactant which
ll rights reserved.
Laboratoire de Chimie Agro-oulouse cedex 4, France. Tel.:
S. Thiebaud-Roux).
mainly results from oxidation processes of methane, a naturalgas component, hence a non-renewable energy. Ethanol and par-ticularly bioethanol from sugar cane, sugar beet or corn is prefera-ble to methanol due to its superior dissolving power for vegetableoils, low toxicity and its renewable origin.
However, various affecting factors such as vegetable oils fattyacid composition (Pinzi et al., 2011a, b), free fatty acid (FFA) con-tent, moisture in oil or alcohol, type and amount of catalyst, molarratio of oil to ethanol, type and speed of stirring, pressure and tem-perature (Freedman et al., 1984; Darnoko and Cheryan, 2000;Meher et al., 2006; Demirbas and Karslioglu, 2007) should be con-sidered in the transesterification process. Among alkali (non-ionic(Gerhard et al., 1978) or ionic (Arzamendi et al., 2007; Sharma andSingh, 2008)), acid (Al-Widyan and Al-Shyoukh, 2002), enzyme (Isoet al., 2001) or heterogeneous (Dossin et al., 2006; Li and Xie, 2006)catalysts used in transesterification of triglycerides, alkali ionicbases such as NaOH or KOH are effective homogeneous catalysts(Ma and Hanna, 1999; Dorado et al., 2004). Alkoxides, which havebeen rarely studied, are even more efficient.
In previous studies, different analytical procedures (gas chro-matography (Mittelbach, 1993; Knothe, 2001), high performanceliquid chromatography (Holcapek et al., 1999), Fourier transforminfrared spectroscopy (Zagonel et al., 2004; Mahamuni andAdewuyi, 2009) have been developed to off-line monitor the com-position of reaction mixtures obtained during or after transesteri-fication of vegetable oils with ethanol containing also FFA, ethylesters, monoglycerides, diglycerides, triglycerides and glycerol.

R. Richard et al. / Bioresource Technology 102 (2011) 6702–6709 6703
Up to now, only a few techniques such as ultrasonication-assistedspray ionization mass spectroscopy (Chen et al., 2010) or mid-infrared spectroscopy (Trevisan et al., 2008) can on-line monitororganic reactions. In each on-line method development, an off-linereference method has to be used for analysis of transesterificationreaction.
Near Infrared (NIR) spectroscopy with multivariate analysis is awell-established, fast, reliable, inexpensive and non-destructiveanalytical technique, and does not require complex pre-treatment(Knothe, 1999; Balabin et al., 2010). In the NIR region from 780 to2500 nm (12,800–4000 cm�1), all components typically absorb atmore than one wavelength. This kind of method has already beenused to determine off-line the biodiesel quality obtained fromtransesterification of soybean oil with methanol (Baptista et al.,2008) or to predict methanol and water content in biodiesel(Felizardo et al., 2007). Calibration models for the prediction ofmethyl ester content in biodiesel were developed in a wide rangewith prediction errors comparable to the references method ones.
The aim of this work is to develop, validate and optimize a fast,reliable and inexpensive analytical method to monitor the transe-sterification reaction of high oleic sunflower oil with ethanolhomogeneously catalyzed by sodium ethoxide in a one-liter batchreactor by using NIR spectroscopy on-line. This method was asso-ciated with off-line Gas Chromatography-Flame Ionisation Detec-tion (GC-FID) as a reference method to determine thecomposition of the medium during the reaction. This techniquecould avoid using GC-FID analysis which is precise but shows sev-eral drawbacks. Indeed, it cannot be used as an on-line techniquebecause the reaction needs to be quenched (neutralizing catalystwith acid) to follow the reaction kinetics, samples have to be pre-treated (several dilutions, addition of an internal standard. . .),analysis is long (approximately 1 h per sample) and finally, it gen-erates a disturbance of the medium (a few mL are taken for eachanalysis, the samples being not surely homogeneous). For this, sev-eral significant parameters of the reaction such as water content inethanol, ethanol to oil molar ratio and temperature will be studiedin this work. Hence kinetics parameters, in particular activationenergy, will be determined precisely.
Table 1Experimental conditions for each transesterification batch and results obtained byGC-FID (1 wt% of EtONa was used in all experiments).
Batch Temperature(�C)
Ethanolto oilmolarratio
Watercontentinethanol(wt.%)
Reactiontime(min)
YEE
(%)YVG
(%)vTG
(%)
1 30 6:1 0.16 60 87.0 8.3 100.02 40 6:1 0.16 60 95.5 0.4 99.83 50 6:1 0.16 60 96.3 0.4 99.94 60 6:1 0.16 60 94.8 2.3 100.05 70 6:1 0.16 60 98.2 0.9 99.96 80 6:1 0.16 60 96.1 2.0 100.07 70 6:1 5.54 60 46.3 8.6 95.18 70 6:1 3.26 60 61.7 13.7 99.19 70 6:1 1.59 60 80.7 14.6 100.0
10 70 6:1 0.08 3 93.2 6.8 100.010 70 6:1 0.08 6 94.9 5.1 100.0
2. Methods
2.1. Material and reagent
High oleic sunflower oil was obtained from ITERG (Pessac,France). Its fatty acid composition is as follows: palmitic acid of3.5%, stearic acid of 3.0%, oleic acid of 87.6%, linoleic acid of 4.9%and other acids of 1.2% (by weight). Hydrochloric acid (analyticallypure, 37% solution in water) and sodium ethoxide EtONa (analyti-cally pure, 21 wt% in ethanol) were purchased from Acros Organ-ics; absolute ethanol (99.95%), grade ethanol (96%) andcyclohexane were supplied by Scharlau. N-methyl-N-trimethyl-silyl-heptafluorobutyramide (MSHFBA) and methylimidazole (MI)were purchased respectively from Macherey Nagel and Sigma–Aldrich.
10 70 6:1 0.08 10 96.0 4.0 100.010 70 6:1 0.08 15 97.2 2.8 100.010 80 6:1 0.08 20 98.0 2.0 100.010 70 6:1 0.08 30 98.7 1.3 100.010 70 6:1 0.08 40 99.0 1.0 100.010 70 6:1 0.08 50 99.2 0.8 100.010 70 6:1 0.08 60 99.3 0.7 100.011 70 6:1 0.08 60 99.6 0.4 100.012 70 6:1 0.08 60 99.5 0.5 100.013 70 9:1 0.08 60 94.1 5.5 100.014 70 9:1 0.08 60 93.9 5.6 100.015 70 9:1 0.08 60 95.3 4.7 100.016 70 3:1 0.08 60 75.3 9.5 98.4
2.2. Transesterification reaction
The transesterification reaction was carried out in a one-literbatch reactor with a double-jacket and counter-blades. Water froma temperature-controlled bath flows inside the double-jacket tomaintain the targeted reactor temperature. This reactor wasequipped with a condenser, a thermocouple, a probe linked tothe NIR spectra analytical system with optic fibers and a mechan-ical stirrer as it has been demonstrated that mechanical stirrers aremore efficient than magnetic stirrers (Sharma and Singh, 2008).
Moreover, all the processes were led under atmospheric pressure.Transesterification of high oleic sunflower oil was carried out byusing the following procedure: 600 g of high oleic sunflower oilwere introduced into the dried reactor and the mechanical stirringwas turned on at 750 rpm. The sunflower oil was heated until thedesired temperature was reached. At this point, a mixture of etha-nol and EtONa (1 wt% compared to oil mass) was added to the oil.EtONa/EtOH addition was considered as time zero of the reaction.All different conditions applied for the batch reaction are listed inTable 1. Different oil to alcohol molar ratios were tested (1:3, 1:6,1:9). A series of ethanol with different water content were used(5.54, 3.26, 1.59, 0.16 and 0.08 wt%). The moisture analysis wasperformed by Karl-Fisher titration (Karl-Fisher titrator DL38 fromMETTLER TOLEDO, Switzerland). Besides, the temperature rangewas tested from 30 �C to 80 �C (close to boiling point of thealcohol).
Concerning the off-line analysis, 1 mL of sample was collectedfrom reactor at different reaction times (3, 6, 10, 15, 20, 30, 40,50 and 60 min), immediately quenched by adding a requiredamount of HCl (3.7%) in order to neutralize the alkali catalyst (96lL for 1 wt% of catalyst). These samples were analyzed by GC-FID. In the meanwhile, NIR spectroscopy was performed at mo-ments corresponding to the time of sample collection in order toon-line monitor the transesterification reaction. At the end of theconversion of the sunflower oil (1 h), the reaction medium wasneutralized by HCl addition, and then was allowed to stand fordecantation. For all these experiments, each phase was analyzedseparately by GC-FID. The majority of the ester was contained inthe upper layer where as glycerol formed the lower layer in atwo-phase system. The non-reacted ethanol was distributed be-tween the two phases, monoglycerides and diglycerides remainingin the ester phase.
2.3. Gas chromatography analysis
The collected samples were analyzed by gas chromatographyusing a Perkin Elmer Instrument (Perkin Elmer, USA) coupled to

6704 R. Richard et al. / Bioresource Technology 102 (2011) 6702–6709
a flame ionization detector (FID). Separation was carried out with asilica capillary column (CP-Sil 8 CB lowbleed/MS, 5% phenyl + 95%dimethylpolysiloxane, 15 m, 0.32 mm, 0.25 lm) from Varian(USA). The chromatograph was equipped with an automatic injec-tor and the injections (1 lL) were performed with an ‘‘on-column’’mode.
The carrier gas was helium (Air Liquide, France) at a pressure of15 psi at the head of the column. Injector temperature was 55 �Cduring 0.5 min and ramped to 340 �C at 200 �C.min�1 (held43 min). Temperature in the oven was held 0.5 min at 55 �C, thenramped to 80 �C at 45 �C.min�1 and finally increased to 360 �C at10 �C.min�1 (held 16 min). The total running time was 45 min.The temperature of the detector (FID) was 360 �C.
All the samples (180 lL) were previously silylated with 20 lL ofa mixture of MSHFBA (1 mL) and MI (50 lL). This hydroxyl groupsilylation is intended to increase volatility and stability of the hy-droxy compounds injected, and therefore to improve their detec-tion. Cyclohexane was used as solvent to prepare standardsolutions and heptadecane was used as the internal standard(1 mg/mL).
This analytical procedure allows to determine the molar con-centrations of ethyl ester, oleic acid, monoglycerides, diglyceridesand triglycerides in the different phases resulting from the reac-tion. These gas chromatography data was used to calculate the to-tal ethyl ester (more precisely ethyl oleate) content in oleic chainsmixture:
Ethyl Ester Content ð%Þ ¼ ½EE�t½EE�t þ ½C18:1�t þ ½MG�t þ 2� ½DG�t þ 3� ½TG�t
where [EE]t, [C18:1]t, [MG]t, [DG]t, and [TG]t represent respectivelythe molar concentrations (lmol/ml) of ethyl oleate, oleic acid andoleic monoglycerides, diglycerides and triglycerides at a given time.
Ethyl ester yields (YEE) and triglycerides conversion (vTG) canalso be calculated with the following formula:
YEE ¼½EE�t
3� ½TG�0and vTG ¼
½TG�0 � ½TG�t½TG�0
where [TG]0 is the triglycerides concentration at initial time.
2.4. NIR spectroscopy analysis
The NIR spectra of the transesterification reaction mixture sam-ples were recorded by averaging 32 scans (approximately 1s/scan)in the wavelength range of 10,000–4000 cm�1 using a NIR spec-trometer (Antaris MX FT-NIR Process Analyzer from Thermo FisherScientific, USA). This apparatus was equipped with a fiber-opticprobe working by transflectance, which means that the beampasses through the solution, reflects on a mirror, before passingagain through the solution. The optical beam path was 1.5 mm
Table 2External validation results (random selection of 18 standards) for the prediction of ethyl olmethods.
Compounds Parameter Baseline correction a a + SG sm
Ethyl ester Latent variables 10 10RMSEC 2.78 2.89RMSEP 5.45 5.64
Monoglycerides Latent variables 8 8RMSEC 1.22 1.23RMSEP 1.83 1.83
a Obtained using as reference the region between the wave lengths of 9000–10,000 cb Savitzky–Golay smoothing obtained by a 3rd order polynomial using 37 points winc First derivative obtained by 37 points window.d Mean centering calculates the average spectrum and subtracts it from each calibratio
each X-axis location in the calibration spectra is obtained dividing each data point in ea
and the spectral resolution was 2 cm�1. The spectrometer wasoperated by Omnic (Thermo Fisher Scientific, USA) software.
2.5. Statistical analysis
Unscrambler 9.5 (Camo, Process AS, Norway) and TQ Analyst(Thermo Fisher Scientific, USA) software were used to import andanalyze the data. Principal Component Analysis (PCA), which is aqualitative method, was performed on NIR data in order to showthe influences of water content in ethanol and temperature onNIR spectroscopic data. Each NIR spectrum corresponds to a reac-tion aliquot which was collected and analyzed by GC-FID. PCAwas not led on the total wavelength range of NIR spectra(10,000–4000 cm�1) because several regions were not useful fordata treatment. Thus, to improve the results of the statistical treat-ment, two different spectral regions were suggested to work withby Unscrambler software: from 7456 to 6907 cm�1 and from 6102to 4563 cm�1.
A series of ethanol with different water content (from 0.08 wt%to 5.54 wt% of water in ethanol) were tested in the transesterifica-tion reaction at 70 �C, with ethanol to oil molar ratio of 6:1 and1 wt% of catalyst (batch 5, 7, 8, 9 and 10 in Table 2). This PCAwas performed on a total of 45 samples corresponding to 9 differ-ent reaction times for each experiment.
PCA was also used to perform the qualitative analysis of thespectra at different temperatures from 30 �C to 80 �C with theother parameters fixed: ethanol to oil molar ratio of 6:1, 1 wt% ofcatalyst and a water content in ethanol of 0.16 wt% (batch 1 to 6in Table 1). 52 samples were used to lead this PCA (9 different reac-tion times for each experiment but 2 samples have been removedbecause of a too important noise).
Partial Least Squares (PLS) regression was also used to developcalibration models between spectral and analytical GC data. Thismethod is quantitative unlike PCA. The values of ethyl oleate andmonoglycerides contents were used to establish a multivariatemodel with the NIR spectra. In order to remove small inter-batchdifferences due to uncontrolled sources of variation, data pre-pro-cessing methods were applied to the spectra, such as baseline cor-rection, Savitzky–Golay smoothing, derivative, mean centering,variable scaling, multiplicative signal correction (MSC), standardnormal variate (SNV) and also variables selection. Performance in-dex was used to evaluate the performance of the method. It indi-cates how well the calibrated method can classify the validationstandards. As the performance index algorithm is set to ‘‘RMSE’’,the root mean square error is reported. The closer the RMSE valueis to zero, the smaller are the differences between the calculatedconcentrations values and the actual values. Root Mean Square Er-ror on Calibration (RMSEC) and Root Mean Square Error on Predic-tion (RMSEP) have been calculated.
eate and oleic monoglycerides contents (batches 1 to 6) using different pre-processing
oothing b b + Derivative c c + Mean-centering + variance scaling d
10 101.35 1.262.13 1.74
8 81.00 0.901.79 1.49
m�1.dow.
n spectrum. With variance scaling, the standard deviation of the intensity values ofch calibration spectrum by its estimated standard deviation.

R. Richard et al. / Bioresource Technology 102 (2011) 6702–6709 6705
From PLS regression, two calibration models have been devel-oped. The first model is able to predict variations of the ethyl esterand oleic monoglycerides contents in the reaction mixtures withvarying temperatures from 30 to 80 �C. We used the same 52 sam-ples (34 for calibration and 18 for validation) as those used for thePCA to establish this model. Besides, an other calibration modelwas developed from the spectra of the set of 27 samples (21 forthe calibration and 6 for the external validation) all measured at70 �C (batches 10, 11 and 12) to predict the contents of the twomain chemical components: ethyl ester and oleic monoglycerides.
3. Results and discussion
3.1. Validation of NIR spectroscopic analytical method for on-linemonitoring of the ethanolysis of high oleic sunflower oil
All NIR spectra have been carried out without quenchingthe reaction because neither collection nor sample preparationare needed. Fig. 1a shows the 3D-spectral variations observed inthe batch reaction (batch 10 of Table 1: 70 �C, ethanol to oil molarratio 6:1, 1 wt% of catalyst, water content in ethanol 0.08 wt% forall reaction times) as a function of the wavelengths and reactiontime. It can be noticed that the total amount of triglycerides anddiglycerides have been converted even after 3 min reaction time(only ethyl oleate and monoglycerides are remaining). Under theexperimental conditions employed, above 9000 cm�1 absorptionsignals are practically inexistent, whereas below 4500 cm�1 signif-icant variation of the instrumental noise appears. Significant spec-tral variations are observed between the wavelengths 6000 and5200 cm�1 and 5100 and 4500 cm�1 depending on the reactiontime. The peaks of ethyl esters are localized in the first region be-tween 6000 and 5200 cm�1. The formation of ethyl ester could alsobe distinguished by the evolution of peaks intensities shown ine-supplement Figure (2D-representation of Fig. 1a) at 6998, 5160,and 4582 cm�1. Each spectrum at different reaction time of thisbatch reaction as well as the ethanol and oil mixture exhibits dif-ferent intensities at these wavelengths. Indeed, these peaks inten-sities are definitely less important for the ethanol and oil mixturethan those for the reaction mixtures. Moreover, two shoulders maybe distinguished at 5941 and 5901 cm�1 for the reaction mixturesas the focus on e-supplement Figure shows. These both shouldersdo not appear for the mixture of oil and ethanol. According tochanges in the NIR spectra of the reaction mixture during sun-flower oil ethanolysis, a multivariate method was developed to al-low the in situ evaluation of ethyl ester and monoglyceridescontents. Therefore, the two regions were used for the followingdata treatment of this work: one region covering wavelengths from7456 to 6907 cm�1 and another region between 6102 and4563 cm�1. It has been checked that the results on performance in-dex were improved while using these two regions rather than thewhole wavelength range.
The effect of temperature on NIR spectra of oil and ethanol mix-tures is shown in Fig. 1b. Significant and similar spectral variationswere observed in the same regions of the variations observed withreaction time. The absorbance of the mixture increases when tem-perature increases from ambient temperature to 80 �C.
The results of the PCA (Fig. 2a on data from batch 1 to 6 in Table1 show that three principal components (PC) are sufficient to pre-dict 100% of the total variance: 95% for PC1, 4% for PC2 and 1% forPC3. The presence of clusters demonstrated a significant effect oftemperature on the spectral data according to the gradual variationof ethyl ester composition. Moreover, inside those clusters, it canbe observed that reaction time has an influence on the reactionmedia composition as long as the reaction occurs.
The Fig. 2b shows the graph of scores obtained for the PrincipalComponent Analysis (PCA) of the spectral data from the batchs 5, 7,8, 9 and 11 (see Table 1). In each cluster corresponding to a specificwater content, the reaction kinetics follow a continuous orderalthough this 3D-graph only allows us to well represent the kinet-ics for water contents of 0.08 wt% and 0.16 wt%. It demonstratesthat initial water content in ethanol has a significant effect onthe triglycerides conversion to ethyl ester in the spectral regionselected.
Concerning the PLS regressions, only ethyl ester and monogly-cerides contents have been predicted because they are the maincompounds of the medium as soon as the reaction starts. Diglyce-rides and triglycerides contents were not determined because theiramounts were too low to establish a valuable predicting model.The comparison of the obtained results with different methodsled to apply all the pre-processing methods described in 2.5 (Table2) for prediction of ethyl ester and of monoglycerides contents. Tenlatent variables for ethyl ester and eight latent variables for mono-glycerides have been used to build the PLS model for predictingboth ethyl ester and monoglycerides contents. Indeed, by increas-ing the number of latent variables, PLS can capture both the varia-tion introduced by temperature differences and compoundspercentage into the new score matrix (Hageman et al., 2005). Thepredicted contents of ethyl ester obtained during transesterifica-tion show no significant differences with the chromatographic re-sults as shown in Fig. 3a using the method d of pre-processing(Table 2) because the correlation coefficients (R2) was 0.99361whereas the RMSEC and RMSEP were respectively 1.26 and 1.74.The model used is then able to predict composition of batches withtemperature varying from 30 to 80 �C.
Using experiments in the same conditions (batches 10, 11 and12), the calibration plot for ethyl ester content (Fig. 3b) shows agood correlation from 93% to 100% with a R2 of 0.98244 using fourlatent variables. Less latent variables are used here because tem-perature was fixed for all samples at 70 �C. The RMSEC and RMSEPwere respectively 0.378 and 0.433. Concerning the calibration plotfor monoglycerides content, Fig. 3c shows a good correlation foroleic monoglycerides contents between 0% and 7% with a R2 of0.98610 using four latent variables. The RMSEC and RMSEP wererespectively 0.338 and 0.338. By comparison with the previousPLS model, the quality of prediction is better for the samples ana-lyzed in the same temperature conditions.
3.2. Kinetics of high oleic sunflower oil transesterification to ethylesters
Before determining the kinetics parameters of this reaction,classical influence of parameters were verified. First of all, a highwater content limits the efficiency of transesterification even un-der optimal conditions (ethanol to oil molar ratio 6:1, 1 wt.% EtON-a, 70 �C). So, ethanol containing the less water was used(0.08 wt.%), in accordance with previous studies with methanol(Romano, 1982; Kusdiana and Saka, 2004; Srivastava and Verma,2008). Otherwise, according to previous works (Noureddini andZhu, 1997), the use of high ethanol to oil molar ratio results ingreater ester formation in a shorter time. Indeed, the maximumethyl esters content was obtained when the molar ratio was in-creased to a value of 6:1 (even if the stoichiometric ratio for transe-sterification requires three moles of alcohol for one mole oftriglycerides). Finally, we showed that all reactions at differenttemperatures (from 30 to 80 �C) were very rapid, the highest reac-tion rate being at 70–80 �C.
Concerning the kinetic model to describe sunflower oil transe-sterification, limited studies have been reported. The only onereferring to the transesterification with ethanol was studied inthe presence of NaOH catalyst (Marjanovic et al., 2010). Generally,

Fig. 1. (a) 3D-plot of FT-NIR spectra of the batch 5 reaction as a function of wavelengths and reaction time. (b) FT-NIR spectra of mixture of ethanol and oil (molar ratio 6:1) atdifferent temperatures.
6706 R. Richard et al. / Bioresource Technology 102 (2011) 6702–6709
second order reaction for all three reversible reactions provided asatisfactory mechanism (Noureddini et al., 1998; Darnoko andCheryan, 2000). The ethanolysis of triglycerides was consideredas an irreversible pseudo second-order reaction in the early periodof the reaction due to the excess of ethanol, followed by first orderor zero order kinetics (Marjanovic et al., 2010). Therefore, twomodels based on the kinetics of triglycerides transesterificationwere developed in this work to verify this hypothesis. The irrevers-
ible pseudo second-order reaction rate in the early period of thereaction for triglycerides in Fig. 4a would be written as follows:
�rTG ¼ �d½TG�
dt¼ k2½TG�2 ð1Þ
where k2 is the reaction rate constant for the irreversible pseudosecond-order reaction.
Integration of equation (1) gives:
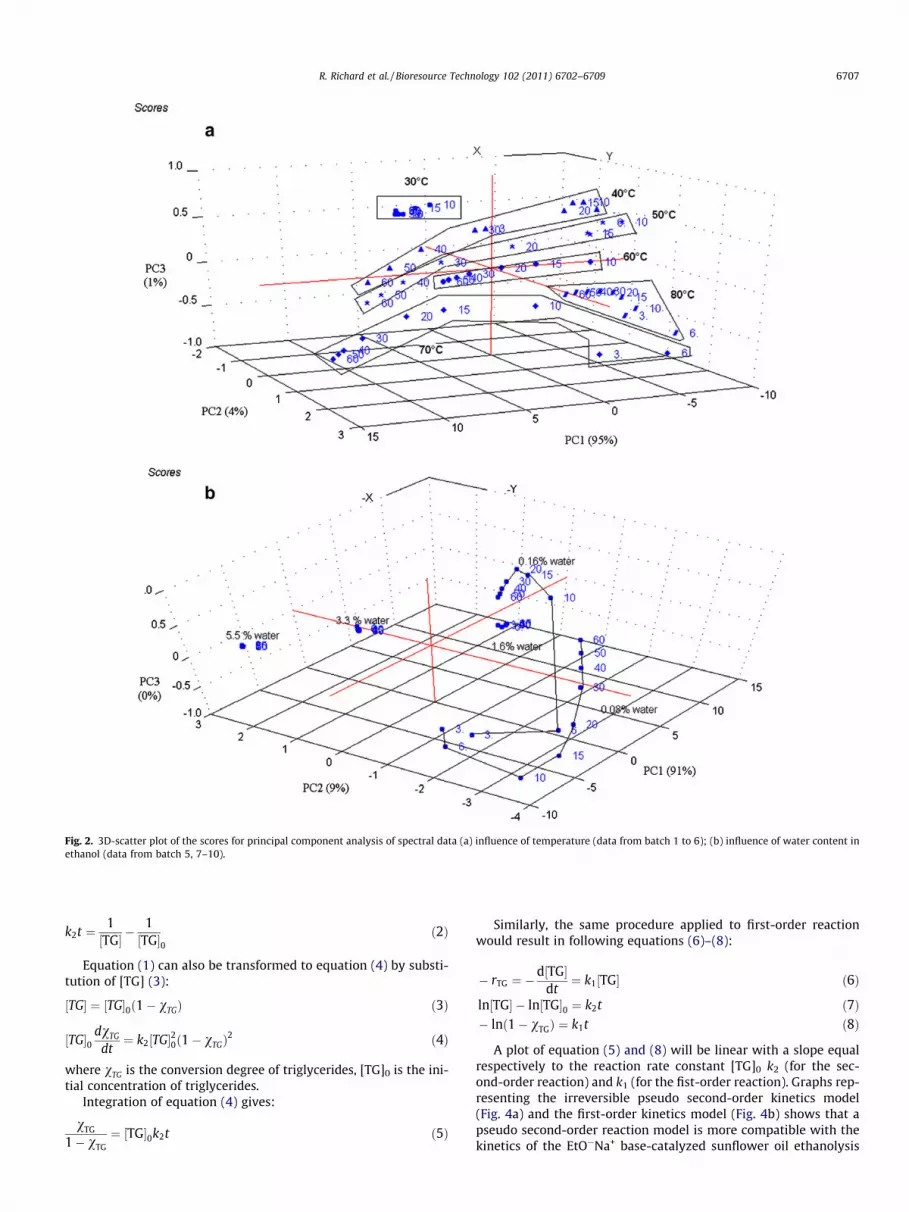
Fig. 2. 3D-scatter plot of the scores for principal component analysis of spectral data (a) influence of temperature (data from batch 1 to 6); (b) influence of water content inethanol (data from batch 5, 7–10).
R. Richard et al. / Bioresource Technology 102 (2011) 6702–6709 6707
k2t ¼ 1½TG� �
1½TG�0
ð2Þ
Equation (1) can also be transformed to equation (4) by substi-tution of [TG] (3):
½TG� ¼ ½TG�0ð1� vTGÞ ð3Þ
½TG�0dvTG
dt¼ k2½TG�20ð1� vTGÞ
2 ð4Þ
where vTG is the conversion degree of triglycerides, [TG]0 is the ini-tial concentration of triglycerides.
Integration of equation (4) gives:
vTG
1� vTG¼ ½TG�0k2t ð5Þ
Similarly, the same procedure applied to first-order reactionwould result in following equations (6)–(8):
� rTG ¼ �d½TG�
dt¼ k1½TG� ð6Þ
ln½TG� � ln½TG�0 ¼ k2t ð7Þ� lnð1� vTGÞ ¼ k1t ð8Þ
A plot of equation (5) and (8) will be linear with a slope equalrespectively to the reaction rate constant [TG]0 k2 (for the sec-ond-order reaction) and k1 (for the fist-order reaction). Graphs rep-resenting the irreversible pseudo second-order kinetics model(Fig. 4a) and the first-order kinetics model (Fig. 4b) shows that apseudo second-order reaction model is more compatible with thekinetics of the EtO�Na+ base-catalyzed sunflower oil ethanolysis

Fig. 3. (a) Correlation between ethyl oleate contents obtained by GC-FID andthrough the FT-NIR/PLS model for different temperatures. Correlation betweenethyl oleate contents (b) and monoglycerides (c) obtained by GC-FID and throughthe FT-NIR/PLS model for experiments at 70 �C.
Fig. 4. (a) Reverse pseudo second-order kinetics model: XTG/(1 � XTG) versus time;(b) First-order kinetics model: �ln(1 � XTG) versus time at different temperatures(30 �C, 40 �C, 50 �C, 60 �C); (c) Arrhenius plot of the reaction rate versus temper-ature for the reverse pseudo second-order reaction (Patm; ethanol to oil molar ratio6:1; catalyst amount 1 wt%; water content in ethanol 0.08 wt%).
6708 R. Richard et al. / Bioresource Technology 102 (2011) 6702–6709
in a batch reactor than the first order reaction model. The R2 valuesfor the second order reaction ranged between 0.8800 and 0.9901for varying temperature, which are higher than values for the firstorder reaction (between 0.8975 and 0.9498). However, R2 value forthe second order reaction at 30 �C is lower than that for the first or-der reaction at the same temperature.
Based on an irreversible pseudo second-order model in theearly period of the reaction, reaction rate constants at differenttemperatures and the Arrhenius law was used to determine thepre-exponential factor A and also the activation energy Ea of thereaction plotting equation (10) obtained from Arrhenius law (9):
k2 ¼ A exp � Ea
RT
� �ð9Þ
Equation (9) can also be written as ln k2 in function of 1/T:
ln k2 ¼ ln A� EaR� 1T
ð10Þ
where Ea is the activation energy, R is the gas constant(�8.314 J.K�1 mol�1), and T is the absolute temperature (K). Theplot is shown in Fig. 4c, and activation energy (51.0 kJ/mol) wascalculated. The value of Ea is in the same order of magnitude as

R. Richard et al. / Bioresource Technology 102 (2011) 6702–6709 6709
previous work mentioned for NaOH-catalyzed sunflower oil ethan-olysis (Marjanovic et al., 2010).
4. Conclusions
Two calibration models of NIR spectroscopy were developed toon-line evaluate the main components during the high oleic sun-flower oil transesterification reaction with ethanol catalyzed byEtONa. Results demonstrate that NIR spectroscopy is a fast andreliable technique to on-line determine the composition of a reac-tion mixture during transesterification without collecting and pre-paring samples. This method elaborated at laboratory-scale couldalso be used at industrial-scale, either in batch systems or contin-uous systems. Regarding to the kinetics, a pseudo second-orderreaction model is the most compatible and activation energy(51.0 kJ/mol) was calculated.
Acknowledgements
We gratefully acknowledge the co-financial support from INRA(Institut National de la Recherche Agronomique) and the RégionMidi-Pyrénées in France which enabled us to lead this researchwork in the Laboratoire de Chimie Agro-industrielle (LCA).
Appendix A. Supplementary data
Supplementary data associated with this article can be found, inthe online version, at doi:10.1016/j.biortech.2011.03.111.
References
Al-Widyan, M.I., Al-Shyoukh, A.O., 2002. Experimental evaluation of thetransesterification of waste palm oil into biodiesel. Bioresour. Technol. 85,253–256.
Arzamendi, G., Campo, I., Arguiñarena, E., Sánchez, M., Montes, M., Gandía, L.M.,2007. Synthesis of biodiesel with heterogeneous NaOH/alumina catalysts:Comparison with homogeneous NaOH. Chem. Eng. J. 134, 123–130.
Balabin, R.M., Safieva, R.Z., Lomakina, E.I., 2010. Gasoline classification using nearinfrared (NIR) spectroscopy data: Comparison of multivariate techniques. Anal.Chim. Acta 671, 27–35.
Baptista, P., Felizardo, P., Menezes, J.C., Correia, M.J.N., 2008. Multivariate nearinfrared spectroscopy models for predicting the methyl esters content inbiodiesel. Anal. Chim. Acta 607, 153–159.
Chen, T.-Y., Chao, C.-S., Mong, K.-K.T., Chen, Y.-C., 2010. Ultrasonication-assistedspray ionization mass spectrometry for on-line monitoring of organic reactions.Chem. Commun. 46, 8347–8349.
Darnoko, D., Cheryan, M., 2000. Kinetics of palm oil transesterification in a batchreactor. J. Am. Oil Chem. Soc. 77, 1263–1267.
Demirbas, A., Karslioglu, S., 2007. Biodiesel production facilities from vegetable oilsand animal fats. Energy Sources Part A 29, 133–141.
Dorado, M.P., Ballesteros, E., Mittelbach, M., López, F.J., 2004. Kinetic parametersaffecting the alkali-catalyzed transesterification process of used olive oil.Energy Fuels 18, 1457–1462.
Dossin, T.F., Reyniers, M.-F., Berger, R.J., Marin, G.B., 2006. Simulation ofheterogeneously MgO-catalyzed transesterification for fine-chemical andbiodiesel industrial production. Appl. Catal., B 67, 136–148.
Encinar, J.M., González, J.F., Rodríguez-Reinares, A., 2007. Ethanolysis of used fryingoil. Biodiesel preparation and characterization. Fuel Process. Technol. 88, 513–522.
Felizardo, P., Baptista, P., Menezes, J.C., Correia, M.J.N., 2007. Multivariate nearinfrared spectroscopy models for predicting methanol and water content inbiodiesel. Anal. Chim. Acta 595, 107–113.
Freedman, B., Pryde, E.H., Mounts, T.L., 1984. Variables affecting the yields of fattyesters from transesterified vegetable-oils. J. Am. Oil Chem. Soc. 61, 1638–1643.
Fukuda, H., Kondo, A., Noda, H., 2001. Biodiesel fuel production bytransesterification of oils. Soc. Biotechnol., Jpn. 92, 405–416.
Gerhard, H., Wolfgang, S., Helmut, V., 1978. 4-Dialkylaminopyridines as highlyactive acylation catalysts. [New synthetic method (25)]. Angew. Chem., Int. Ed.17, 569–583.
Hageman, J.A., Westerhuis, J.A., Smilde, A.K., 2005. Temperature robust multivariatecalibration: an overview of methods for dealing with temperature influences onnear infrared spectra. J. Near Infrared Spectrosc. 13, 53–62.
Holcapek, M., Jandera, P., Fischer, J., Prokes, B., 1999. Analytical monitoring of theproduction of biodiesel by high-performance liquid chromatography withvarious detection methods. J. Chromatogr. A 858, 13–31.
Iso, M., Chen, B., Eguchi, M., Kudo, T., Shrestha, S., 2001. Production of biodiesel fuelfrom triglycerides and alcohol using immobilized lipase. J. Mol. Catal. B Enzym.16, 53–58.
Knothe, G., 1999. Rapid monitoring of transesterification and assessing biodieselfuel quality by near-infrared spectroscopy using a fiber-optic probe. J. Am. OilChem. Soc. 76, 795–800.
Knothe, G., 2001. Analytical methods used in the production and fuel qualityassessment of biodiesel. Trans. ASAE 44, 193–200.
Kusdiana, D., Saka, S., 2004. Effects of water on biodiesel fuel production bysupercritical methanol treatment. Bioresour. Technol. 91, 289–295.
Li, H., Xie, W., 2006. Transesterification of soybean oil to biodiesel with Zn/I2catalyst. Catal. Lett. 107, 25–30.
Ma, F., Hanna, M.A., 1999. Biodiesel production: A review. Bioresour. Technol. 70, 1–15.
Mahamuni, N.N., Adewuyi, Y.G., 2009. Fourier Transform Infrared Spectroscopy(FTIR) method to monitor soy biodiesel and soybean oil in transesterificationreactions, petrodiesel – biodiesel blends, and blend adulteration with soy oil.Energy Fuels 23, 3773–3782.
Marjanovic, A.V., Stamenkovic, O.S., Todorovic, Z.B., Lazic, M.L., Veljkovic, V.B., 2010.Kinetics of the base-catalyzed sunflower oil ethanolysis. Fuel 89, 665–671.
Meher, L.C., Vidya Sagar, D., Naik, S.N., 2006. Technical aspects of biodieselproduction by transesterification – a review. Renew. Sust. Energy Rev. 10, 248–268.
Mittelbach, M., 1993. Diesel fuel derived from vegetable-oils, V [1] – gas-chromatographic determination of free glycerol in transesterified vegetable-oils. Chromatographia 37, 623–626.
Noureddini, H., Harkey, D., Medikonduru, V., 1998. A continuous process for theconversion of vegetable oils into methyl esters of fatty acids. J. Am. Oil Chem.Soc. 75, 1775–1783.
Noureddini, H., Zhu, D., 1997. Kinetics of transesterification of soybean oil. J. Am. OilChem. Soc. 74, 1457–1463.
Pinzi, S., Gandía, L.M., Arzamendi, G., Ruiz, J.J., Dorado, M.P., 2011a. Influence ofvegetable oils fatty acid composition on reaction temperature and glyceridesconversion to biodiesel during transesterification. Bioresour. Technol. 102,1044–1050.
Pinzi, S., Mata-Granados, J.M., Lopez-Gimenez, F.J., Luque de Castro, M.D., Dorado,M.P., 2011b. Influence of vegetable oils fatty-acid composition on biodieseloptimization. Bioresour. Technol. 102, 1059–1065.
Romano, S., 1982. Vegetable oils-a new alternative. In: Vegetable oil fuels-proceedings of the international conference on plant and vegetable oils asfuels. ASAE Pub. 82, 101–116.
Sharma, Y.C., Singh, B., 2008. Development of biodiesel from karanja, a tree found inrural India. Fuel 87, 1740–1742.
Srivastava, A., Prasad, R., 2000. Triglycerides-based diesel fuels. Renew. Sust. EnergyRev. 4, 111–133.
Srivastava, P.K., Verma, M., 2008. Methyl ester of karanja oil as an alternativerenewable source energy. Fuel 87, 1673–1677.
Trevisan, M.G., Garcia, C.M., Schuchardt, U., Poppi, R.J., 2008. Evolving factoranalysis-based method for correcting monitoring delay in different batch runsfor use with PLS: On-line monitoring of a transesterification reaction by ATR-FTIR. Talanta 74, 971–976.
Zagonel, G.F., Peralta-Zamora, P., Ramos, L.P., 2004. Multivariate monitoring ofsoybean oil ethanolysis by FTIR. Talanta 63, 1021–1025.