Embed Size (px)
Citation preview
HAL Id: hal-01054784https://hal.inria.fr/hal-01054784
Submitted on 8 Aug 2014
HAL is a multi-disciplinary open accessarchive for the deposit and dissemination of sci-entific research documents, whether they are pub-lished or not. The documents may come fromteaching and research institutions in France orabroad, or from public or private research centers.
L’archive ouverte pluridisciplinaire HAL, estdestinée au dépôt et à la diffusion de documentsscientifiques de niveau recherche, publiés ou non,émanant des établissements d’enseignement et derecherche français ou étrangers, des laboratoirespublics ou privés.
Distributed under a Creative Commons Attribution| 4.0 International License
On Planning of FTTH Access Networks with andwithout Redundancy
M. Tahir Riaz, Gustav H. Haraldsson, Jose G. Lopaz, Jens M. Pedersen, OleB. Madsen
To cite this version:M. Tahir Riaz, Gustav H. Haraldsson, Jose G. Lopaz, Jens M. Pedersen, Ole B. Madsen. On Planningof FTTH Access Networks with and without Redundancy. 9th IFIP TC9 International Conferenceon Human Choice and Computers (HCC) / 1st IFIP TC11 International Conference on Critical In-formation Infrastructure Protection (CIP) / Held as Part of World Computer Congress (WCC), Sep2010, Brisbane, Australia. pp.326-337, �10.1007/978-3-642-15479-9_31�. �hal-01054784�
On Planning of FTTH Access Networks with and
without Redundancy
M. Tahir Riaz, Gustav H. Haraldsson, Jose G. Lopaz,
Jens M. Pedersen and Ole B. Madsen
Aalborg University, Networking and Security Section, Fredrik Bajers vej 5,
9220 Aalborg, Denmark
[email protected], [email protected], [email protected],
[email protected], [email protected]
Abstract. This paper presents a planning analysis of FTTH access network with
and without redundancy. Traditionally, access networks are planned only
without redundancy, which is mainly due to lowering the cost of deployment.
As fiber optics provide a huge amount of capacity, more and more services are
being offered on a single fiber connection. Therefore, as a single point of failure
in fiber connection can cause multiple service deprivation, redundancy is very
crucial. In this work, an automated planning model was used to test different
scenarios of implementation. Cost estimation is presented in terms of digging
and amount of fiber used. Three topologies, including the traditional one “tree
topology”, were tested with a combination of various passive optical
technologies.
Keywords: FTTH, Network Planning, Future Networks, Reliability,
Broadband, ICT infrastructure, Modeling, Passive Optical Networks.
1 Introduction
Data communication over the Internet has been exponentially growing since the 90’s.
The Plain Old Telephone System (POTS) network has been great in meeting the
demands of increasing bandwidth (with Integrated Service Digital Network (ISDN),
asymmetrical digital subscriber line (ADSL), Symmetric digital subscriber line
(SDSL), etc.) demands over its copper network. However the POTS network is
already being pushed to its limit in trying to offer more bandwidth with new
technology over the coppers. The downside is that the user has to be closer and closer
to the connecting equipment.
Today more and more services are being introduced through the copper based
network, not only the Internet, therefore making it an all-purpose network. These
services (VoIP, VoD, other Internet applications) are demanding a lot of bandwidth,
therefore it is apparent that though the current network media holds, it is becoming
exhausted and a new type of media in which to use this all purpose network, is
required. Optical fiber is one possible successor in planning a new installation,
upgrading or expansion of, and to, an all purpose network. Optical fiber offers new
possibilities compared to the older medium of copper based communication systems.
One of these possibilities is Fiber To The Home (FTTH), where the complete network
infrastructure is fiber, from the supplier all the way to the Network Termination (NT)
- end user. By doing so the NT has a greater amount of capacity available.
All NTs are thus now more than ever becoming reliant on the reliability of an all-
purpose network, since all these services are now being transferred to this all it.
However, today’s network planning has mainly focused on the upper levels of the
network when creating redundancies, rather than planning the access networks with
non redundant topologies. But as NTs in the access network are relying on the
network, some research is needed to offer redundancy to the access network without
introducing too much extra cost.
This paper contributes with an analysis of implementing FTTH with redundancy at
the infrastructure level, which includes digging and amount of fiber optic used. The
paper also introduces a new topology, namely eartree topology, which is seen as a
compromise for lowering the cost of infrastructure, hence still providing good
redundancy [1].
The structure for the rest of the paper is as follows: Section 2 provides terms and
definitions used in the paper. Section 3 presents the planning method. Section 4
presents different topologies for the FTTH access network. Section 5 presents a case
study where the area of Hals (rural area in Denmark) was chosen as a test subject.
Section 6 lists phases and implementation scenarios with achieved results. And finally
Section 7 provides a conclusion to the work.
2 Terms and Definitions
Some terms and definitions are used throughout the paper in order to explain different
aspects of the network. The Swedish ICT commission [2] has standardized some
terms used in planning a fiber network. In order to clarify these terms they are
explained here as they are used throughout the paper.
2.1 Network Architecture
Figure 1 shows how the network architecture is a set up of 3 network layers and is as
follows:
Main network: The main network, sometimes called the backbone network, is the
highest level in the municipality’s network hierarchy. This layer connects the
municipality to the external network with links going out of the municipality and also
down to the distribution network.
Distribution network: The distribution network consists of distribution nodes and
lines, which connect the access network. In this paper the distribution network is the
municipal network.
Access network: The access network is a network of Network Termination points
(NTs) connected to the distribution node. NTs nodes are households, apartment
buildings, business and government places. This paper will not distinguish between
them.
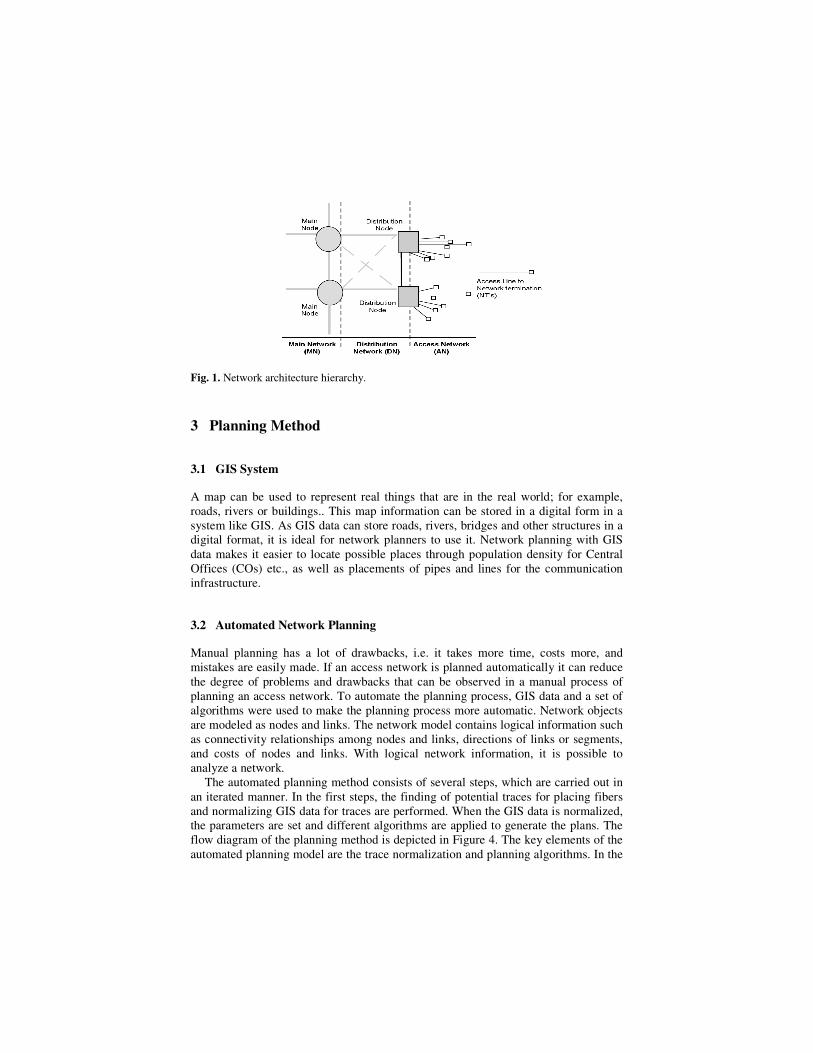
Fig. 1. Network architecture hierarchy.
3 Planning Method
3.1 GIS System
A map can be used to represent real things that are in the real world; for example,
roads, rivers or buildings.. This map information can be stored in a digital form in a
system like GIS. As GIS data can store roads, rivers, bridges and other structures in a
digital format, it is ideal for network planners to use it. Network planning with GIS
data makes it easier to locate possible places through population density for Central
Offices (COs) etc., as well as placements of pipes and lines for the communication
infrastructure.
3.2 Automated Network Planning
Manual planning has a lot of drawbacks, i.e. it takes more time, costs more, and
mistakes are easily made. If an access network is planned automatically it can reduce
the degree of problems and drawbacks that can be observed in a manual process of
planning an access network. To automate the planning process, GIS data and a set of
algorithms were used to make the planning process more automatic. Network objects
are modeled as nodes and links. The network model contains logical information such
as connectivity relationships among nodes and links, directions of links or segments,
and costs of nodes and links. With logical network information, it is possible to
analyze a network.
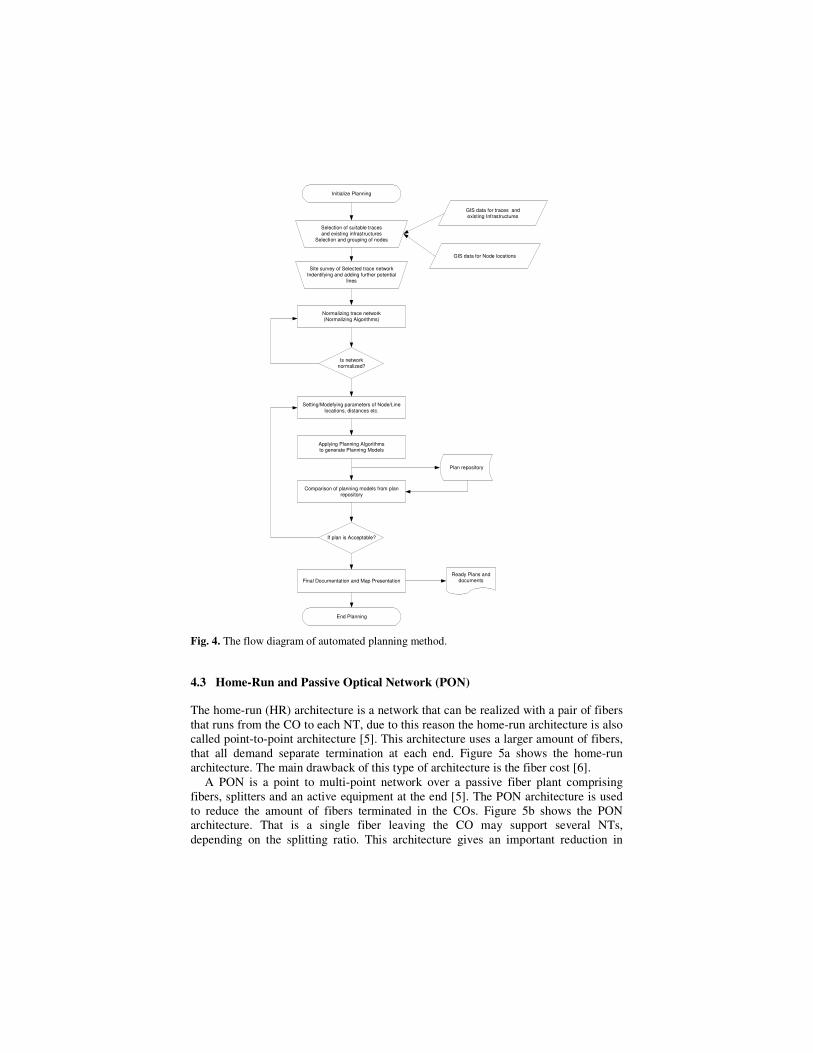
The automated planning method consists of several steps, which are carried out in
an iterated manner. In the first steps, the finding of potential traces for placing fibers
and normalizing GIS data for traces are performed. When the GIS data is normalized,
the parameters are set and different algorithms are applied to generate the plans. The
flow diagram of the planning method is depicted in Figure 4. The key elements of the
automated planning model are the trace normalization and planning algorithms. In the
trace normalization, the digital road network is simplified by reducing the number
segments. When the trace network is normalized and the parameters set, the trace
network is processed further by a set of graph algorithms. In this study: spanning tree,
shortest path, and various modified path algorithms were used. The algorithms
perform calculations for the laying of fiber cables and ducts based on the specified
parameters. The planning algorithm selects the traces for fiber, which gives optimal
paths (i.e. shortest or cheapest).
4 FTTH Access Network Topologies
The basic idea behind network topologies is to explain a network and is determined
by the configuration between the nodes in a network. While some network topologies
show simple means in connecting a network, other network topologies are more
focused on offering redundancy and availability in a network.
4.1 Topologies
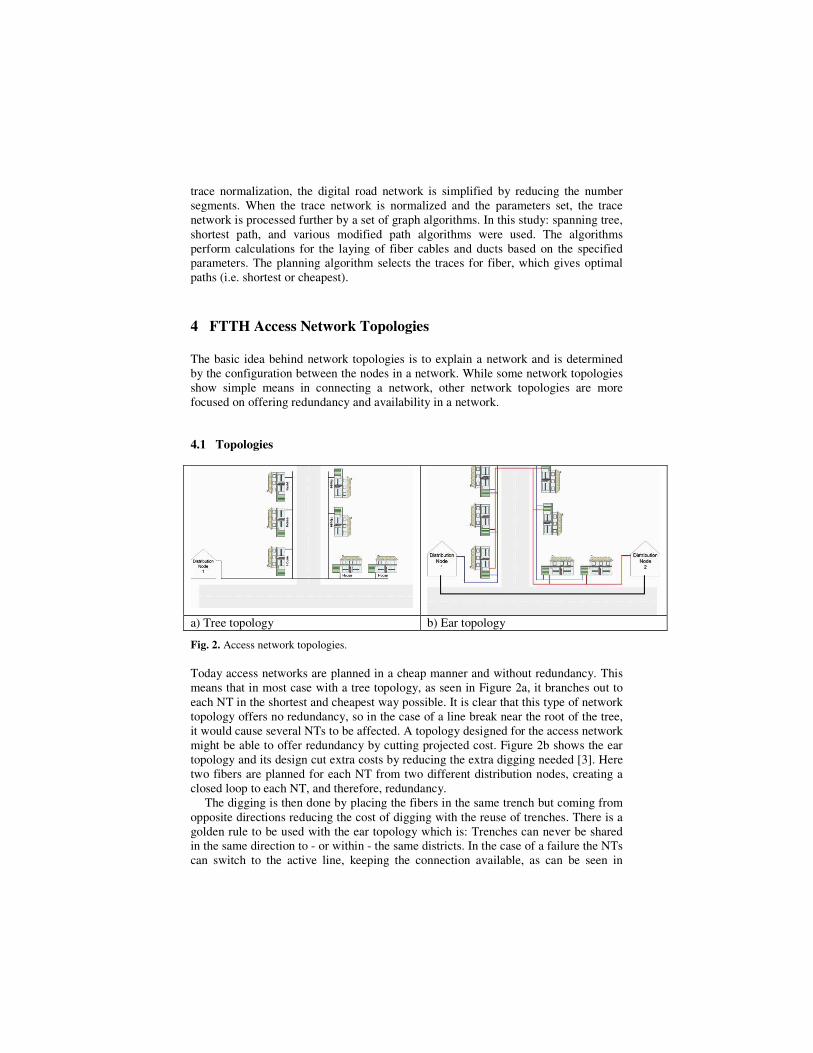
a) Tree topology b) Ear topology
Fig. 2. Access network topologies.
Today access networks are planned in a cheap manner and without redundancy. This
means that in most case with a tree topology, as seen in Figure 2a, it branches out to
each NT in the shortest and cheapest way possible. It is clear that this type of network
topology offers no redundancy, so in the case of a line break near the root of the tree,
it would cause several NTs to be affected. A topology designed for the access network
might be able to offer redundancy by cutting projected cost. Figure 2b shows the ear
topology and its design cut extra costs by reducing the extra digging needed [3]. Here
two fibers are planned for each NT from two different distribution nodes, creating a
closed loop to each NT, and therefore, redundancy.
The digging is then done by placing the fibers in the same trench but coming from
opposite directions reducing the cost of digging with the reuse of trenches. There is a
golden rule to be used with the ear topology which is: Trenches can never be shared
in the same direction to - or within - the same districts. In the case of a failure the NTs
can switch to the active line, keeping the connection available, as can be seen in
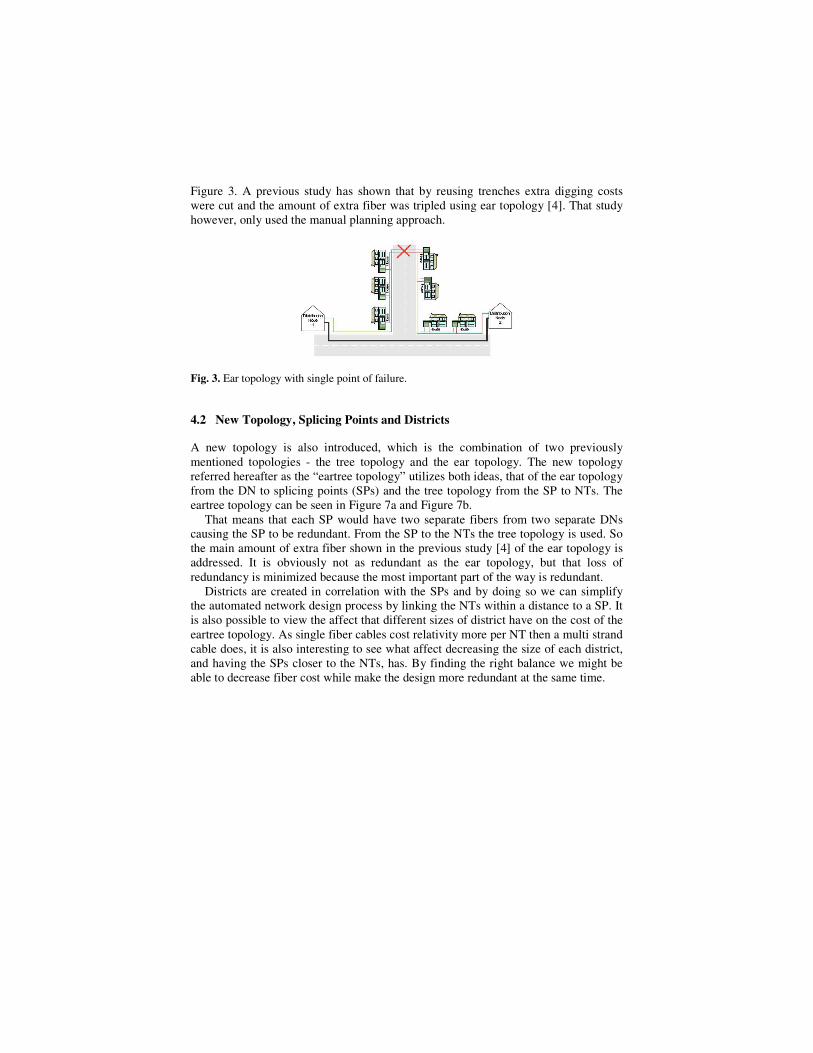
Figure 3. A previous study has shown that by reusing trenches extra digging costs
were cut and the amount of extra fiber was tripled using ear topology [4]. That study
however, only used the manual planning approach.
Fig. 3. Ear topology with single point of failure.
4.2 New Topology, Splicing Points and Districts
A new topology is also introduced, which is the combination of two previously
mentioned topologies - the tree topology and the ear topology. The new topology
referred hereafter as the “eartree topology” utilizes both ideas, that of the ear topology
from the DN to splicing points (SPs) and the tree topology from the SP to NTs. The
eartree topology can be seen in Figure 7a and Figure 7b.
That means that each SP would have two separate fibers from two separate DNs
causing the SP to be redundant. From the SP to the NTs the tree topology is used. So
the main amount of extra fiber shown in the previous study [4] of the ear topology is
addressed. It is obviously not as redundant as the ear topology, but that loss of
redundancy is minimized because the most important part of the way is redundant.
Districts are created in correlation with the SPs and by doing so we can simplify
the automated network design process by linking the NTs within a distance to a SP. It
is also possible to view the affect that different sizes of district have on the cost of the
eartree topology. As single fiber cables cost relativity more per NT then a multi strand
cable does, it is also interesting to see what affect decreasing the size of each district,
and having the SPs closer to the NTs, has. By finding the right balance we might be
able to decrease fiber cost while make the design more redundant at the same time.
Initialize Planning
GIS data for traces andexisting Infrastructures
Is networknormalized?
Normalizing trace network(Normalizing Algorithms)
Site survey of Selected trace networkIndentifying and adding further potential
lines
Ready Plans anddocuments
Selection of suitable tracesand existing infrastructures
Selection and grouping of nodes
Plan repository
Setting/Modefying parameters of Node/Linelocations, distances etc.
Comparison of planning models from planrepository
Applying Planning Algorithmsto generate Planning Models
If plan is Acceptable?
Final Documentation and Map Presentation
End Planning
GIS data for Node locations
Fig. 4. The flow diagram of automated planning method.
4.3 Home-Run and Passive Optical Network (PON)
The home-run (HR) architecture is a network that can be realized with a pair of fibers
that runs from the CO to each NT, due to this reason the home-run architecture is also
called point-to-point architecture [5]. This architecture uses a larger amount of fibers,
that all demand separate termination at each end. Figure 5a shows the home-run
architecture. The main drawback of this type of architecture is the fiber cost [6].
A PON is a point to multi-point network over a passive fiber plant comprising
fibers, splitters and an active equipment at the end [5]. The PON architecture is used
to reduce the amount of fibers terminated in the COs. Figure 5b shows the PON
architecture. That is a single fiber leaving the CO may support several NTs,
depending on the splitting ratio. This architecture gives an important reduction in
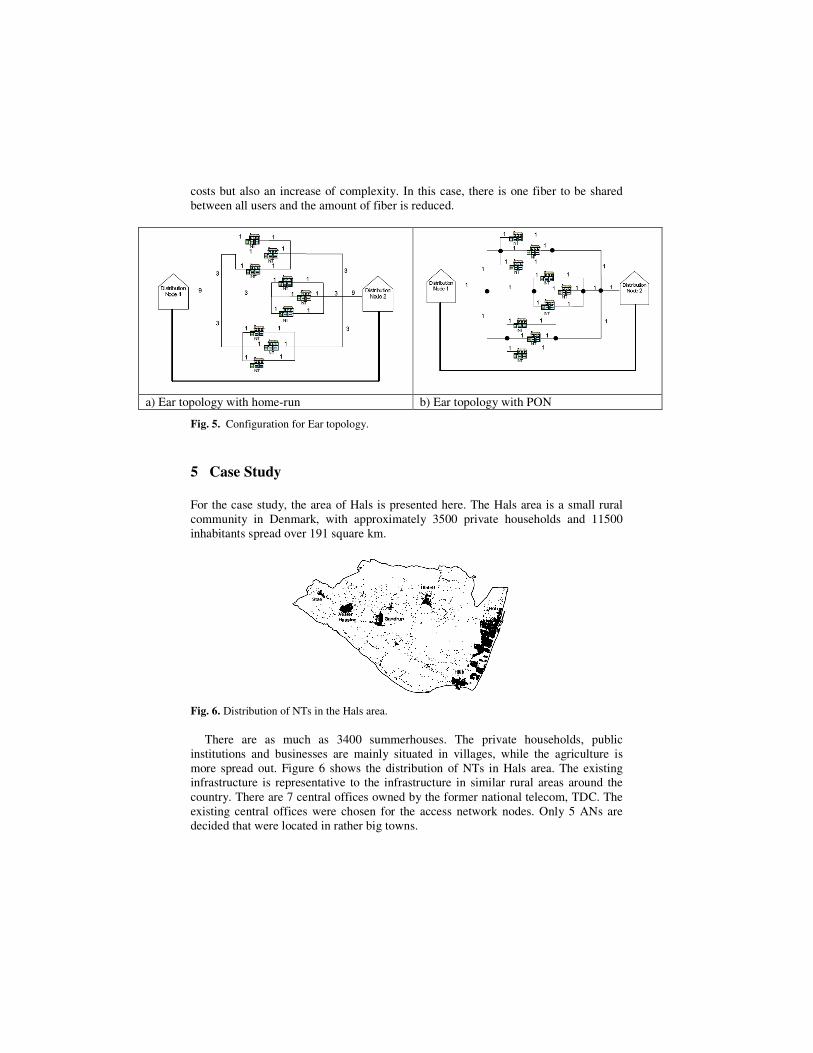
costs but also an increase of complexity. In this case, there is one fiber to be shared
between all users and the amount of fiber is reduced.
a) Ear topology with home-run b) Ear topology with PON
Fig. 5. Configuration for Ear topology.
5 Case Study
For the case study, the area of Hals is presented here. The Hals area is a small rural
community in Denmark, with approximately 3500 private households and 11500
inhabitants spread over 191 square km.
Fig. 6. Distribution of NTs in the Hals area.
There are as much as 3400 summerhouses. The private households, public
institutions and businesses are mainly situated in villages, while the agriculture is
more spread out. Figure 6 shows the distribution of NTs in Hals area. The existing
infrastructure is representative to the infrastructure in similar rural areas around the
country. There are 7 central offices owned by the former national telecom, TDC. The
existing central offices were chosen for the access network nodes. Only 5 ANs are
decided that were located in rather big towns.
6 Phases and Implementation Scenarios
The study conducted the testing in two phases. The first phase focused on the dense
local area and tested and compared several scenarios.. While the second phase
focused on taking the results from phase one and applying the best solutions on a
larger area, including rural areas.
6.1 Phase One
Basically there are three types of scenarios that are considered in this work, these are
tree topology, ear topology and eartree topology. Further, each scenario was tested
with HR and PON, and also with DN, in the same or different locations. This was
done in a small focused area in Hals.
6.1.1 Phase One Scenarios
The scenarios were home run using the previous mentioned automated network
planning and the GIS data. These scenarios are explained in table 1.
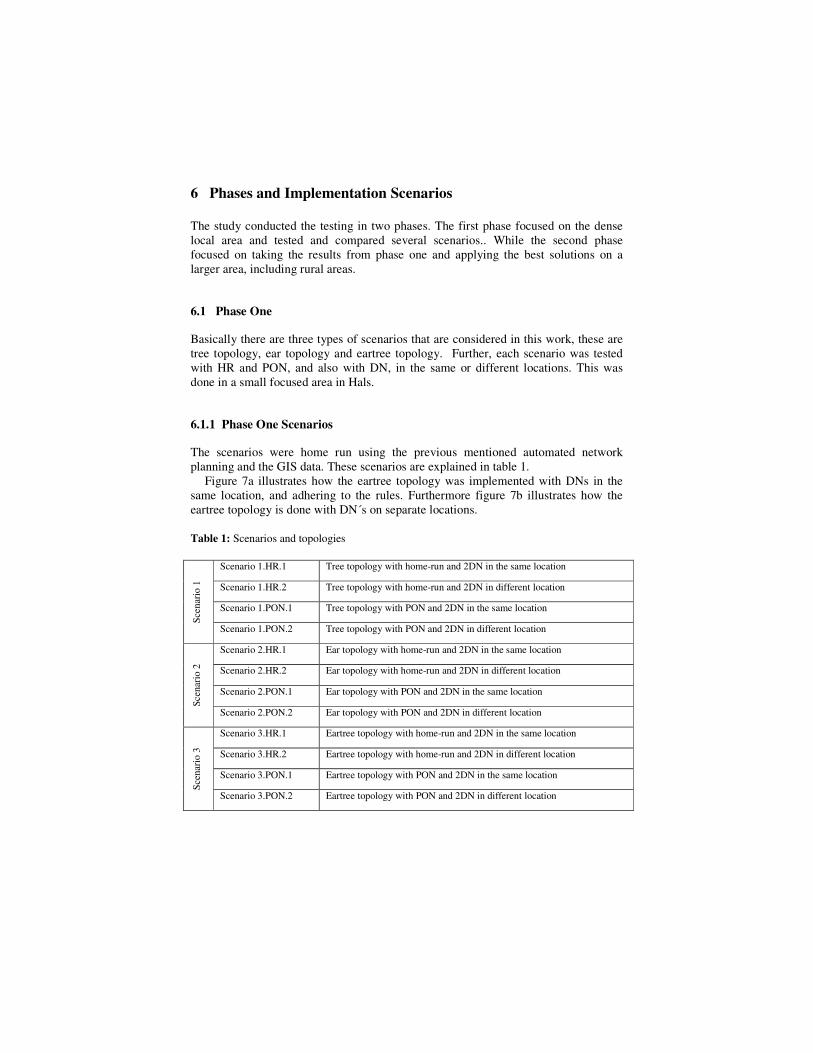
Figure 7a illustrates how the eartree topology was implemented with DNs in the
same location, and adhering to the rules. Furthermore figure 7b illustrates how the
eartree topology is done with DN´s on separate locations.
Table 1: Scenarios and topologies
Scenario 1.HR.1 Tree topology with home-run and 2DN in the same location
Scenario 1.HR.2 Tree topology with home-run and 2DN in different location
Scenario 1.PON.1 Tree topology with PON and 2DN in the same location
Sce
nar
io 1
Scenario 1.PON.2 Tree topology with PON and 2DN in different location
Scenario 2.HR.1 Ear topology with home-run and 2DN in the same location
Scenario 2.HR.2 Ear topology with home-run and 2DN in different location
Scenario 2.PON.1 Ear topology with PON and 2DN in the same location
Scen
ario
2
Scenario 2.PON.2 Ear topology with PON and 2DN in different location
Scenario 3.HR.1 Eartree topology with home-run and 2DN in the same location
Scenario 3.HR.2 Eartree topology with home-run and 2DN in different location
Scenario 3.PON.1 Eartree topology with PON and 2DN in the same location
Sce
nar
io 3
Scenario 3.PON.2 Eartree topology with PON and 2DN in different location
6.1.2 Phase One Results
The results obtained from the phase one - seen from Figure 8 - show that in
comparison to the ear topology the amount of fiber is almost triple, making the cost
difference about two and a half times more than in the tree topology. While a tree
topology can place a splicing point (DN, or any kind of distribution point) in an
optimal position to acquire the least amount of fiber. In order to offer the redundancy
and offer savings on extra digging means the placement of the splicing points are
faulty in this problem. Because it is necessary to situate them on each side of the
district, the distance will grow more rapidly as we need to access NTs from each side
and all over the area. This is actually noticed in the creation of the topology but as it
was a theory, it is based on the fact that fiber prices are going down thus not making it
a deciding factor. There are more important factors involved such as the blowing of
the fiber.
a) Eartree topology with 2DN in the
same location.
b) Eartree topology with 2DN in different
locations.
Fig. 7. Configuration of eartree topology.
All of this actually collaborated with the results acquired, making the ear topology
expensive to deploy. The ear topology is still an interesting topology, if a method is
found to decrease the fiber. Another solution is to look at it when the fiber prices have
gone even further down, but then again, the tree topology cost would also decrease.
A new topology was introduced which could offer redundancy to the access
network but not use an excessive amount of fiber like the ear topology. The result was
the eartree topology, where each splicing point would be redundant. But from the
splicing point the tree topology would be used. For this topology the absolute worst
case scenario is that it would loose one district when either a splicing point would be
made unavailable or a cut near the splicing point occured. The further the cut is from
the splicing point, in most cases, the less the number of NTs that become affected.
Now the only extra fiber needed is for doubling the main duct lines unaffecting the
NT to splicing points fiber required. Now, this is done to limit the extra amount of
fiber by not doubling the NT to SP. Comparing the cost it can be seen that the cost
only increases around 25% between the eartree topology and tree topology throughout
the scenarios - see Figure 8 - thus making eartree topology a feasible topology to
investigate further in phase 2.
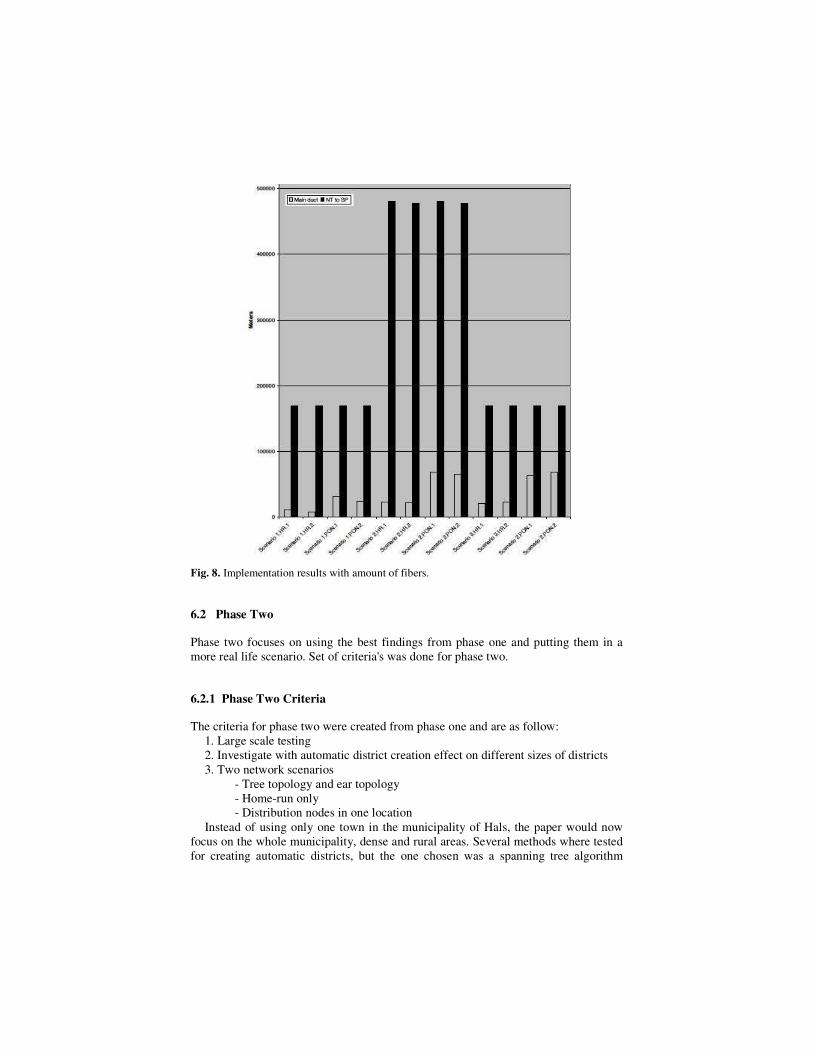
Fig. 8. Implementation results with amount of fibers.
6.2 Phase Two
Phase two focuses on using the best findings from phase one and putting them in a
more real life scenario. Set of criteria's was done for phase two.
6.2.1 Phase Two Criteria
The criteria for phase two were created from phase one and are as follow:
1. Large scale testing
2. Investigate with automatic district creation effect on different sizes of districts
3. Two network scenarios
- Tree topology and ear topology
- Home-run only
- Distribution nodes in one location
Instead of using only one town in the municipality of Hals, the paper would now
focus on the whole municipality, dense and rural areas. Several methods where tested
for creating automatic districts, but the one chosen was a spanning tree algorithm
starting from each DN. Placing of the splicing points was then done from the point
with the shortest distance to all NTs.
6.1.2 Phase Two Results
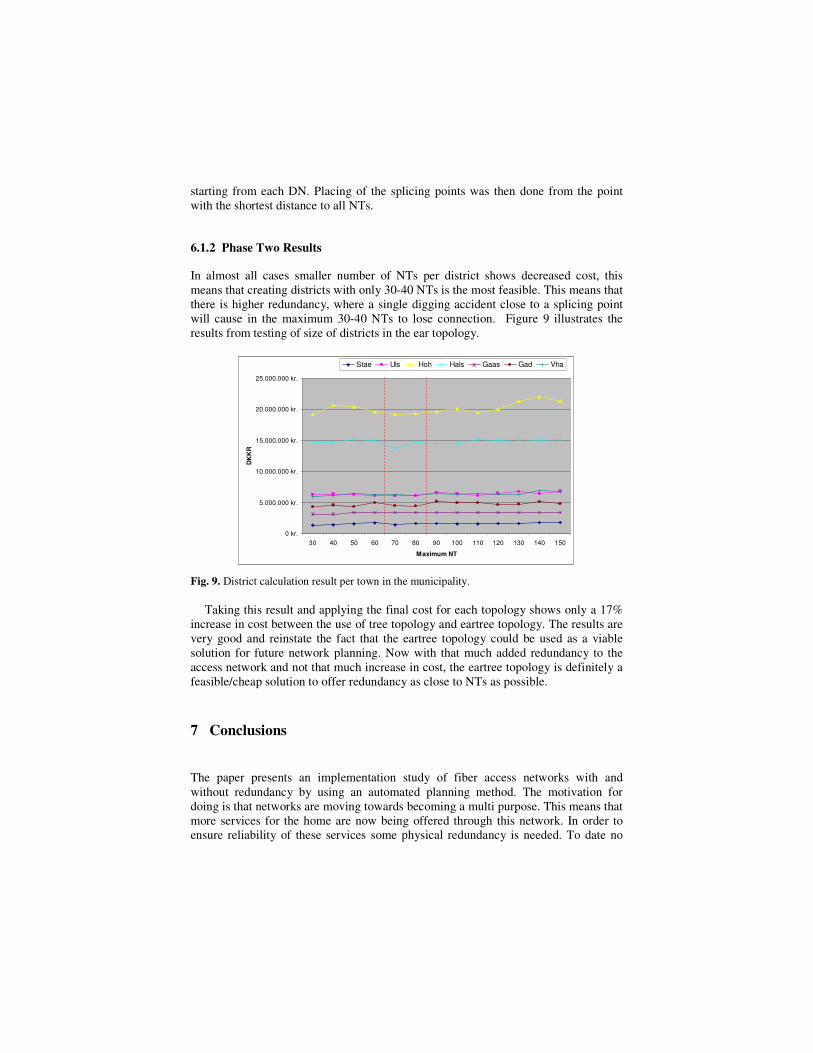
In almost all cases smaller number of NTs per district shows decreased cost, this
means that creating districts with only 30-40 NTs is the most feasible. This means that
there is higher redundancy, where a single digging accident close to a splicing point
will cause in the maximum 30-40 NTs to lose connection. Figure 9 illustrates the
results from testing of size of districts in the ear topology.
0 kr.
5.000.000 kr.
10.000.000 kr.
15.000.000 kr.
20.000.000 kr.
25.000.000 kr.
30 40 50 60 70 80 90 100 110 120 130 140 150
Maximum NT
DK
KR
Stae Uls Hoh Hals Gaas Gad Vha
Fig. 9. District calculation result per town in the municipality.
Taking this result and applying the final cost for each topology shows only a 17%
increase in cost between the use of tree topology and eartree topology. The results are
very good and reinstate the fact that the eartree topology could be used as a viable
solution for future network planning. Now with that much added redundancy to the
access network and not that much increase in cost, the eartree topology is definitely a
feasible/cheap solution to offer redundancy as close to NTs as possible.
7 Conclusions
The paper presents an implementation study of fiber access networks with and
without redundancy by using an automated planning method. The motivation for
doing is that networks are moving towards becoming a multi purpose. This means that
more services for the home are now being offered through this network. In order to
ensure reliability of these services some physical redundancy is needed. To date no
practical investigations have been done into offering redundancy in the access
network, meaning that it should be considered a necessity to review this.
The results showed that PON had little or no affect on the cost as the district
method already mimicked the PON affect. Furthermore it showed little or no
difference in the fiber usage when using two DN locations or one. In Phase one, three
scenarios where created with the three topologies in question. The PON and DN
location was included in those scenarios as sub scenarios, but as explained, had little
effect. This project was unsuccessful in reducing the fiber enough for the ear topology
to become a cost efficient solution. The eartree topology showed some good results,
and in comparison to the tree topology, the cost difference of the fiber showed to be
only around 25%. Thus it was used in phase two.
In phase two the eartree topology was again compared to the tree topology, but
now on a larger scale and focused with the criteria that showed best results. By
looking at the district, and possibly making districts smaller and thus minimizing the
need for single fiber, the cost could be reduced and the redundancy increased. This
proved to be true as most areas showed that the sweet spot was 30-40 NTs per district.
By using this, we were also able to reduce the difference in overall cost and the
difference between the eartree topology and tree topology now only showed a 17%
increase in cost, making this a highly feasible solution.
In conclusion, the results shown are quite good and are found to be a viable and
interesting solution in offering redundancy or at least minimizing the affect of digging
accidents to a few NTs. From this conclusion it is of interest to conduct further
research on eartree topology in comparison to the tree topology in order to truly view
whether redundant topology can be planned without costing more than a normal tree
topology in a large scale environment.
References
1. Haraldsson, G. H., Beshir, O.: Automatic Network Planning for Access Networks in
FTTH with and without Redundancy. Master thesis, Aalborg University (2007).
2. The Swedish ICT Commission. General guide to a future-proof IT infrastructure, April
(2005).
3. Pedersen, J.M., Riaz, T.M., Knudsen, T.P., Madsen, O.B.: Designing Broadband Access
Network with triple redundancies. Department of Control Systems, Aalborg University
(2005).
4. Haraldsson, G.H., Pedersen, J.M.: Cost vs. Redundancy in FTTH access networks: A case
study of a Danish village. CSNDSP 2006, Patras, Greece, July (2006).
5. Lin, C. (ed.): Broadband Optical Access Networks and Fiber to the Home: Systems
Technologies Development and Strategy. Wiley (2006).
6. Pedersen, J.M.: Structural Quality of Service in Large-Scale Networks, PhD thesis,
Department of Control Systems, Aalborg University, April (2005).


