Embed Size (px)
Citation preview

Journal of Mechanical Science and Technology 21 (2007) 1100~1111
Journal of
MechanicalScience andTechnology
On The Dependence of Spray Momentum Flux in Spray Penetration:
Momentum Flux Packets Penetration Model
R. Payri*, S. Ruiz, F. J. Salvador, J. Gimeno
CMT-Motores Térmicos, Universidad Politécnica de Valencia Camino de Vera s/n, E-46022 Spain
(Manuscript Received July 14, 2006; Revised March 29, 2007; Accepted March 29, 2007)
--------------------------------------------------------------------------------------------------------------------------------------------------------------------------------------------------------------------------------------------------------
Abstract
Momentum flux is a very important parameter for predicting the mixing potential of injection processes. Important
factors such as spray penetration, spray cone angle, and air entrainment depend largely on spray momentum. In this
article, a model is obtained which is able to predict the spray tip penetration using as an input the spray momentum flux
signal. The model is based on the division of the momentum flux signal into momentum packets (fuel parcels)
sequentially injected, and the tracking of them along the spray. These packets follow a theoretical equation which
relates the penetration with the ambient density, momentum, spray cone angle and time. In order to validate the method,
measures of momentum flux (impingement force) and macroscopic spray visualization in high density conditions have
been performed on several mono-orifice nozzles. High agreement has been obtained between spray penetration
prediction from momentum flux measurements and real spray penetration from macroscopic visualization.
Keywords: Spray; Penetration; Momentum flux; Model; Fuel parcel --------------------------------------------------------------------------------------------------------------------------------------------------------------------------------------------------------------------------------------------------------
1. Introduction
The objective of the fuel injection process in diesel
engines is the preparation of the fuel-air mixture in
order to achieve an efficient combustion process with
low pollutants formation. This process is strongly
influenced by the spray behavior which depends
mainly on the spray momentum (Payri et al., 2005a).
The spray momentum gives information about the
mass flow rate and the flow exit velocity simulta-
neously, thus controlling the mixture of the fuel and
the air together with the ambient density (Payri et al.,
2005a; Desantes et al., 2006; Desantes et al., 2007).
In recent years the trend in diesel engine design has
been an increase in the ambient density (higher boost
pressure) and of the spray momentum (higher
injection pressure and the use of convergent nozzles).
In this paper a new algorithm based on the use of
the experimental measurement of spray momentum in
order to predict the transient behavior of the spray
penetration is presented. The main contribution of this
model, and what makes it different from previous
empirical or semi-empirical equations in the literature
(Dent, 1971; Koo, 1996; Naber and Siebers, 1996;
Wakuri et al., 1960; Payri et al., 2005b; Yeom, 2003)
is that it takes into account non-stationary conditions
due to the dynamic behavior of the injector, specially
at the beginning of the injection process (during
needle lift), or possible injection pressure fluctuations.
In order to validate the model a wide experimental
program is presented; three axi-symetrical convergent
nozzles, three injection pressures and two discharge
pressure (discharge densities) have been tested.
The paper is structured in six main sections. First
the experimental setup and the test matrix are
presented. The second and third section describe the
spray momentum and the macroscopic spray
visualization techniques and the results obtained with
*Corresponding author. Tel.: +34 96 387 9658, Fax.: +34 96 387 7659
E-mail address: [email protected]

R. Payri et al. / Journal of Mechanical Science and Technology 21(2007) 1100~1111 1101
those capabilities. In the fourth section the penetration
model is presented, which is validated in section five.
In the last section, a study of the influence of mo-
mentum flux signal shape on the spray tip penetration
is performed.
2. Experimental set-up
The injection system used was a conventional
Common Rail Fuel Injection system (Flaig et al.,
1999) which allows fuel injection under high (up to
180 MPa) and relatively constant pressure.
To perform this investigation three different mono-
orifice sac nozzles have been used. In order to obtain
the internal geometrical characteristics of the nozzles,
a special methodology described in Macián et
al.(2003) was used. This methodology is based on the
use of a special type of silicone to obtain the internal
moulds of the nozzle. Once the moulds have been
obtained, pictures of them are taken with a
microscope. This experimental tool is useful for the
study of diesel nozzles, because it enables researchers
to establish relationships between internal geometry,
flow characteristics and spray behavior. The k-factor
is an indicator of the nozzle conicity, and it is defined
as:
10
i oD Dk factor −− = (1)
The diameters and the k-factor of the investigated
nozzles obtained following the silicone methodology
are shown in Table 1. As can be seen from the table,
all nozzles are convergent, with high k-factors.
2.1 Spray momentum test rig
With this experimental equipment it is possible to
determine the impingement force of a spray on a
surface. This force is equivalent to the spray
momentum flux. Figure 1 shows a sketch of the
momentum test rig. Sprays are injected into a
chamber that can be pressurized with nitrogen up to 8
MPa in order to simulate pressure discharge
conditions that are representative of real pressure
conditions inside the engine combustion chamber
during the injection process.
Table 1. List of nozzle characteristics.
Name Dout (μm) k-factor
A 112 2.1
B 137 2
C 156 1.8
2.2 Macroscopic spray visualization: Nitrogen test rig.
For the macroscopic spray characterization, an
injection test rig is used that reproduces both the high
gas density and pressure encountered in a diesel
engine combustion chamber. The test rig is pre-
ssurized with nitrogen and it basically consists of a
constant volume vessel with optical access for
visualization purpose. The design is modular, and
ancillaries can be added depending on the required
experiment. The rig is designed for a maximum gas
pressure of 6 MPa.
It is necessary to circulate the nitrogen through the
rig because otherwise the injected diesel would
obscure the windows and severely degrade the quality
of the images. Furthermore, it is important to keep rig
pressure (Pb) and nitrogen temperature constant
during each experiment. A sketch of the high pressure
nitrogen test rig is shown in Fig. 2.
Acquisition System
Injector
Rail
High pressure pump
Force Sensor
Back pressure sensor
Nitrogen up to 100 bar
Injection pressure sensor
Spray momentum
rig
Injection control system
Fig. 1. Spray momentum test rig.
1 2
3
4
5 6
7
8
9
10
1. Injection pump2. Rail3. Injector4. High pressure test rig5. Flash6. CCD Camera
11
N2
CPU
7. Image acquisition and synchronization system
8. Temperature regulator9. Root compressor10. Down-stream pressure control valve11. Nitrogen-fuel separator
Fig. 2. Sketch of the nitrogen chamber configuration.

1102 R. Payri et al. / Journal of Mechanical Science and Technology 21(2007) 1100~1111
2.3 Image acquisition system and image processing software
The images are taken with a 12-bit color CCD
camera with a spatial resolution of 1280 x 1024 pixels,
and a minimum exposure time of 10 microseconds
with a jitter of ± 5 microseconds. All the experimental
equipment (camera-flash-injection) has been synch-
ronized with an electronic system, by using the
injector trigger signal as a reference signal to take the
image sequences. In this study, spray visualization is
carried out by using the back lighting technique
(Pastor et al., 2001).
The injection is controlled with a modified ECU
system that allows injection at a very low frequency
(0.5 Hz). This low frequency is required for the
nitrogen flow within the rig to be able to remove the
fuel droplets from the previous injection and thus
maintain good optical access to the spray.
The images were digitally processed using our own
software. The segmentation algorithm used, based on
the log-likelihood ratio test (LRT), has the advantage
of using the three channels of RGB images for a
proper determination of boundaries that are not well
defined, as in the case of sprays. Details are available
in Pastor et al.(2001).
2.4 Experimental conditions
Spray momentum flux measurements and
macroscopic spray visualization have been performed
at different experimental conditions, which are
summarized in Table 2. Three different injection
pressures (Pi) of 30, 80 and 130 MPa were tested. For
each pressure and nozzle, two different values of back
pressures (Pb) were used--2.5 MPa and 3.5 MPa--
which considering the temperature inside the test rig
constant and fixed at 25ºC, provides two different
values of air density of 30 Kg/m3 and 40 kg/m
3. In
total, six different injection conditions per nozzle
have been performed. An injection duration of 2 ms
Table 2. Experimental conditions for the spray macroscopic
characteristics and momentum flux measurements.
Nozzle Dout
(μm) Pi [MPa]
Pb
[MPa]
Density
(kg/m3)
A 112 30-80-130 2.5-3.5 30-40
B 137 30-80-130 2.5-3.5 30-40
C 156 30-80-130 2.5-3.5 30-40
has been used in order to ensure a fully developed
spray.
3. Results
3.1 Momentum flux
The instantaneous momentum flux has been
measured for the six tested points and the three
nozzles. As an example, in Fig. 3 the instantaneous
momentum flux from the three nozzles and for the
injection pressures of 30 MPa and 80 MPa, and
discharge pressure of 3.5 MPa is shown. Typical top
hat profile can be observed during the time the needle
is fully open. The small fluctuations at maximum
needle lift are produced by pressure waves inside the
injection line and the injector (Bermúdez et al., 2005;
Kim and Lee, 2003). Furthermore, a dip can be seen
in the momentum curves just after the beginning. It is
produced mainly by the increase of effective injection
pressure when the needle reaches its maximum
position. This phenomenon typically appears in
injection rate signals as well as spray momentum
signals. As can be seen from the figures, the
momentum flux increases when increasing either the
diameter or the injection pressure (Payri et al.,
2005a ; Payri et al., 2005b).
Fig. 3. Spray momentum flux for the three nozzles at Pi=
30MPa – Pb= 3.5MPa (upper part) and Pi= 80MPa –
Pb=3.5MPa (lower part).

R. Payri et al. / Journal of Mechanical Science and Technology 21(2007) 1100~1111 1103
3.2 Spray visualization
The macroscopic parameters of the spray used for
characterization are the tip penetration (S) and the
spray cone angle (θ), represented in Fig. 4. The spray
angle is considered as the cone angle which is formed
by the spray considering 60 % of the penetration
(Pastor et al., 2001). Five repetitions each 25
microseconds during an injection of 2 ms of duration
were taken. The value used for the model is the mean
value of these five repetitions in each time step. The
standard deviation was small for the spray penetration
and also for spray cone angle: for the penetration the
maximum standard deviation was around 0.7 mm.,
and for the cone angle was 1º. Therefore, the error
determining these macroscopic parameters was very
small. In Fig. 5 some examples of spray pictures can
be seen. From each picture, penetration and spray
cone angle have been determined. In Fig. 6 results of
these two variables are presented for Pi=30MPa and
Pi=80MPa with Pb=3.5MPa in all cases.
As can be seen in the results, the higher the orifice
diameter, the higher the penetration. The same
conclusion is valid for the injection pressure: the
Fig. 4. Spray macroscopic characteristics.
Fig. 5. Spray pictures. Nozzle B at point Pi=30 MPa – Pb=3.5
MPa (40 kg/m3).
Fig. 6. Penetration and spray cone angle for the three nozzles at Pi=30MPa – Pb=3.5MPa (left) and and at Pi=80MPa –
Pb=3.5MPa (right).

1104 R. Payri et al. / Journal of Mechanical Science and Technology 21(2007) 1100~1111
higher the injection pressure, the bigger the pene-
tration.
The spray cone angle presents small variations
during the injection, and for the three nozzles it is
very similar. Since the model, which will be
explained in the following section, needs as an input
the spray cone angle, and considering its steady
behavior, the mean value over the time will be
considered.
4. Momentum packets penetration model
The model is based on a division of the momentum
flux signal in momentum packets sequentially
injected and the tracking of them from the time they
are injected to the time they reach the tip of the spray.
The division of the momentum flux signal can be
seen in Fig. 7. These packets follow a theoretical
equation which relates the penetration with the
ambient density, momentum and time. The main point
of the model is that the momentum flux that controls
a given packet inside the spray is due to the addition
of its momentum flux and the momentum flux of the
previous packet. This packet moves forward inside
the spray until it reaches the spray tip and it becomes
the new leader packet. The packets which are leading
the tip of the spray, and so, describing the penetration
of the spray, penetrate against stagnant air only with
its own momentum flux.
Fig. 7. Division in packets of the momentum flux signal.
Since the model is based on sequentially injected
momentum packets (rectangular injections of constant
momentum flux), it is necessary to determine an
equation that relates the penetration and momentum
at these conditions. Looking at the studies performed
on this area (Wakuri et al., 1960; Dent, 1971; Naber
and Siebers, 1996; Payri et al., 2005b), it is possible
to find different semi-empirical models that relate
penetration with parameters related to the injection
system (injection pressure, diameter) and parameters
related to the environment where the spray is injected
(gas density). A theoretical expression can be
obtained by performing a dimensional analysis with
the following variables: ambient gas density, time
from the start of injection and instantaneous
momentum flux (Payri et al., 2005b). This
dimensional analysis leads to an equation model, Eq.
(2) that relates penetration with air density and spray
momentum:
1/ 4 1/ 4 1/ 2( ) a oS t cte M tρ −= ⋅ ⋅ ⋅� (2)
where taking into account the spray cone angle, the
cte can be expressed by:
1/ 2
tan2
pcte k θ −� �= ⋅ � �� �
(3)
Where kp can be considered a constant value
independent of injection conditions or nozzle
geometry. In a previous work a value for kp equal to
1.3 has been found for a quite large set of nozzle
diameters and injection conditions (Desantes et al.,
2006).
The momentum flux brings together the effective
flux velocity at the orifice outlet, the fuel density and
the effective diameter of the nozzles’ orifices; and it
can be expressed as (Payri et al., 2005a):
2. .
2
o f 0M m U4
oa f oC Uπ φ ρ⋅= ⋅ = ⋅ ⋅ ⋅ (4)
22 2
4
oa f v thC C Uπ φ ρ⋅= ⋅ ⋅ ⋅ ⋅
where .
fm is the instantaneous mass flow rate, Uo is
the effective outlet velocity, Uth is the Bernoulli
theoretical velocity, and Ca and Cv are the contraction
coefficient and velocity coefficient, respectively
(Payri et al., 2005a).

R. Payri et al. / Journal of Mechanical Science and Technology 21(2007) 1100~1111 1105
Introducing Eq. (4) in Eq. (2) and applying the
Bernoulli equation through the nozzle hole in order to
obtain the velocity in terms of pressure drop, the
spray tip penetration is given by:
21214141 tP� �S(t) oa ⋅φ⋅Δ⋅−
(5)
Hence the dependencies found are those proposed
by Hiroyasu (for a developed spray), Wakuri, and
Dent (in this last case without the fuel evaporation
term).
4.1 Spray axial momentum conservation
In order to understand how the model works it is
necessary to take into account the fact that
momentum is conservative in the axial direction. It
means that the value of the axial momentum flux at
the nozzle exit is the same as at any other cross-
section of the spray axis. This fact is easily
demonstrable in a stationary spray making few
reasonable assumptions. In Fig. 8 a stationary spray is
represented where a cylindrical control volume (CV)
has been defined. One of the faces of the control
volume contains the orifice outlet, and the other is
located in any axial section of the spray. Two
assumptions are made: first, pressure is uniform;
second, air goes into the spray with a velocity
component which is perpendicular to the axis of the
spray. By applying the momentum conservation
equation in these conditions, the axial momentum
flux in any section along the spray is constant and
equal to the momentum flux at the nozzle outlet.
Obviously, the farther from the origin, the lower the
axial velocity, but nevertheless, this velocity decrease
is compensated for with a bigger spray cross-section
and bigger total mass flow (fuel and air) due to air
entrainment. Figure 9 (left) shows a sketch of the
spray momentum measuring principle. The impact
force is measured with a calibrated piezo-electric
pressure sensor in order to measure force. The sensor
frontal area and position are selected so that the spray
impingement area is much smaller than that of the
sensor. Under this assumption, and due to the
conservation of momentum, the force measured by
the sensor is the same as the momentum flux at the
hole outlet or at any other axial location, since the
pressure inside the chamber is constant and sur-
rounds the entire spray, and deflected fuel flows
perpendicular to the axis of the spray. The momentum
conservation in the axial direction is experimentally
confirmed in Fig. 9 (right) where the momentum flux
signal (force) is shown for a given nozzle, and for an
Fig. 8. Momentum conservation in a stationary spray.
Fig. 9. Spray momentum measurement principle and momentum conservation.

1106 R. Payri et al. / Journal of Mechanical Science and Technology 21(2007) 1100~1111
injection pressure and back-pressure of 80 MPa and
10 MPa, respectively, and at different axial positions
of the sensor (6, 8, 10, and 13 mm.). Figures show
that the momentum at different positions is the same,
except for x=13 mm. where the section of the spray
due to air entrainment is higher than the frontal
section of the sensor.
The results obtained for the stationary spray can be
extrapolated to a transient spray whenever the two
previous assumptions are fulfilled. These conditions
are specially fulfilled in the main cone shaped part of
the spray (stationary part), being not so true in the tip
of the spray.
4.2 Model development
In order to explain how the model works a simple
case will be analyzed. It consists of two consecutive
rectangular injections which can be considered as two
packets: packet 1 and packet 2 with momentum flux
of 1M� and 2M� , respectively. The following
explanation is graphically described in Fig. 10.
At the beginning, packet 1 is injected and it
penetrates against stagnant air with its momentum
( 1M� ).
Therefore, taking into account Eq. (2), the
penetration of the packet 1 is given by Eq. (6) and,
moreover it coincides with spray front penetration,
since it is the first packet (leader packet).
1/ 4 1/ 4 1/ 2
1 1( ) aS t cte M tρ −= ⋅ ⋅ ⋅� (6)
This situation (only first packet injected) is shown
in Fig. 11, for an arbitrary time t=tI in Figure 10.
In this figure the axial momentum flux at any axial
position is represented. As can be seen, the
momentum flux has been considered constant and
equal to 1M� inside the spray, since the spray
momentum is conservative in the axial direction as
stated in the previous section and taking into account
two reasonable assumptions.
A time delay Δt after the first packet injection,
packet 2 is injected. Nevertheless, the environment
that it finds is very different than at the moment of the
packet 1 injection. In fact, unlike packet 1, packet 2
finds air in movement due to the previous injection of
packet 1, so packet 2 moves forward inside the spray
faster than the previous packet. This new situation is
depicted in Fig. 12 for a t=tII in Fig. 10. In such a
situation, packet 2 has a momentum flux, 2M� , but it
Fig. 10. Packet penetration model explanation.
Fig. 11. Packet penetration model explanation. Development
of packet 1 and axial momentum flux inside the spray.
Fig. 12. Packet penetration model explanation. Development
of packet 2 inside the spray and axial momentum flux.
moves forward inside the spray where the flow has a
movement characterized by momentum 1M� which
has been transferred by packet 1. Thus, it can be
assumed that packet 2 develops inside the spray as if
it had a total momentum 1 2M M+� � . Line 2’ in Figure
10 represents this behavior which is governed by Eq.
(7):
( ) ( )1/ 4 1/ 21/ 4
2 1 2'( ) aS t cte M M t tρ −= ⋅ ⋅ + ⋅ − Δ� � (7)
R. Payri et al. / Journal of Mechanical Science and Technology 21(2007) 1100~1111 1107
With this situation, packet 2 reaches the front of the
spray at point c (Fig. 10). The instant tc can be
calculated by combining Eqs. (6) and (7). From this
instant, packet 2 becomes the new leader packet and it
develops against stagnant air, and so its penetration is
governed by its own momentum flux 2M� . Taking
this into account, from this point (t>tc) the
development of the spray is controlled by Eq. (8). In
order to ensure the continuity of the penetration at
point c, a phase lag, ϕ, has to be considered in the
equation. Physically it represents the difference in
time as a result of the faster development inside the
spray. This phase lag can be worked out making Eqs.
(7) and (8) equal for t=tc.
( )1/ 21/ 4 1/ 4
2 2( ) aS t cte M t tρ ϕ−= ⋅ ⋅ ⋅ − Δ +� (8)
This Eq. (8) is represented by line 2 in Fig. 10. The
calculated spray tip penetration is represented by the
widest line in Fig. 10.
This is a simple example of just two packets, but
by proceeding in the same way and making use of a
good signal discretization it is possible to calculate
the spray penetration for real momentum flux mea-
surements as shown in section five about model
validation.
Full model formulation is included in the Appendix.
5. Model validation
In order to validate the model, the experimental
penetration measurements have been compared with
the model results. The model has been applied to each
momentum flux signal and the mean value of the
spray cone angle and a constant value for kp equal to
1.3 was used as additional experimental information,
which is justified in Desantes et al.(2006).
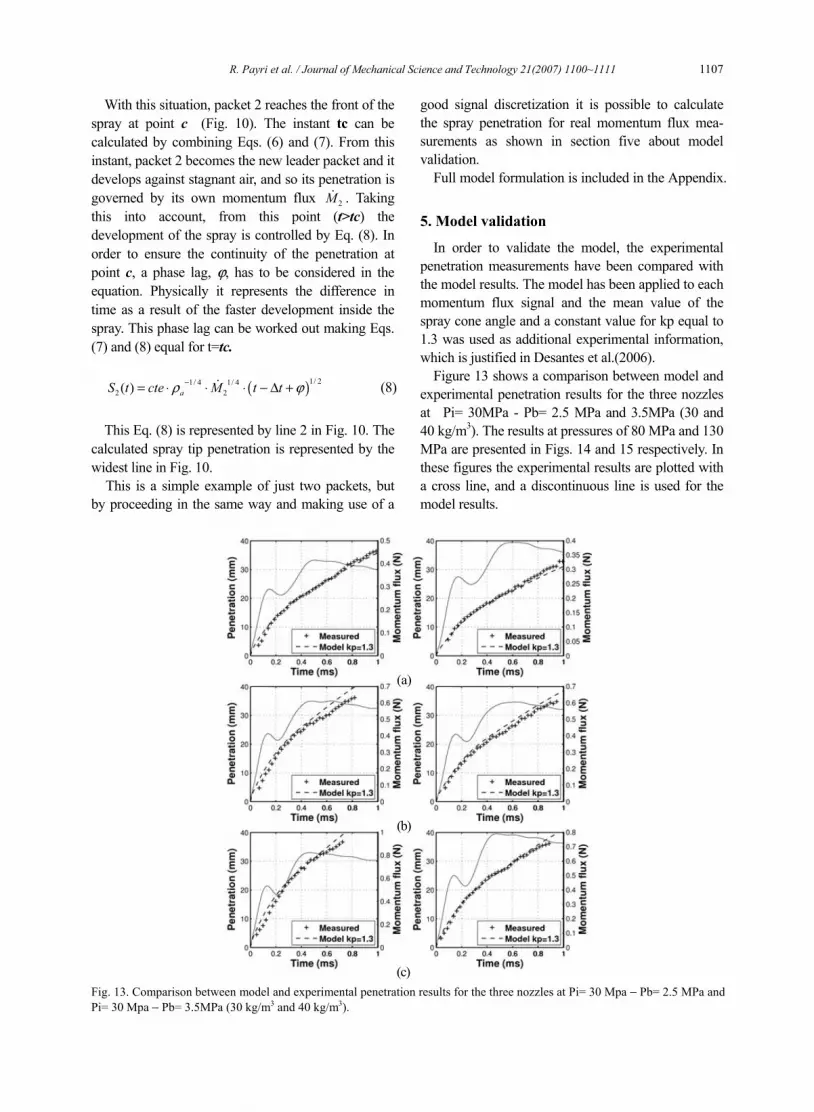
Figure 13 shows a comparison between model and
experimental penetration results for the three nozzles
at Pi= 30MPa - Pb= 2.5 MPa and 3.5MPa (30 and
40 kg/m3). The results at pressures of 80 MPa and 130
MPa are presented in Figs. 14 and 15 respectively. In
these figures the experimental results are plotted with
a cross line, and a discontinuous line is used for the
model results.
Fig. 13. Comparison between model and experimental penetration results for the three nozzles at Pi= 30 Mpa − Pb= 2.5 MPa and
Pi= 30 Mpa − Pb= 3.5MPa (30 kg/m3 and 40 kg/m3).
(a)
(b)
(c)

1108 R. Payri et al. / Journal of Mechanical Science and Technology 21(2007) 1100~1111
Fig. 14. Comparison between model and experimental penetration results for the three nozzles at Pi= 80 MPa − Pb= 2.5 MPa and
Pi= 80 Mpa − Pb= 3.5 MPa (30 kg/m3 and 40 kg/m3).
Fig. 15. Comparison between model and experimental penetration results for the three nozzles at Pi= 130 MPa − Pb= 2.5 MPa
and Pi=130 MPa − Pb= 3.5 MPa (30 kg/m3 and 40 kg/m3).
(a)
(b)
(c)
(a)
(b)
(c)

R. Payri et al. / Journal of Mechanical Science and Technology 21(2007) 1100~1111 1109
The continuous line represents the spray momen-
tum flux which is discretized in order to apply the
model formulation. It is remarkable that the model
takes into account the transient behavior of momen-
tum: the momentum at the beginning of the injection
is growing and there are also important fluctuations.
In Figs. 13, 14 and 15, it can be observed how this
momentum fluctuation is affecting the spray pene-
tration behavior. Even in these circumstances the
model is able to predict the dynamic behavior of the
spray. In general, the agreement between model and
experiments is very good except in some cases: under
prediction for nozzles (b) and (c) at high injection
pressures (130 MPa) and over prediction for nozzle
(b) at low injection pressure (30 MPa).
6. Analysis of the influence of momentum signal
characteristics on penetration behavior
Once the model is validated, in this section, the
influence of the momentum signal characteristics on
penetration is analyzed. As can be seen, from Fig. 3,
experimental momentum signals differ from a the-
oretical momentum flux signal where momentum,
and thus, injection velocity and mass flow rate are
perfectly rectangular (constant) during the whole
injection process. In real cases the needle lift is not
instantaneous, and as a consequence, momentum is
not rectangular and its shape changes for different
injection conditions. This is due to the dynamic
behavior of the injection system, which depends on
the injection pressure. Also, a real momentum signal
is affected by injection pressure oscillations due to
pressure waves inside the injection line and the
injector (Bermúdez et al., 2005).
In Fig. 16, the penetration obtained by applying the
packets model to a real momentum signal is
compared with the penetration obtained from the
model when a theoretical rectangular momentum
signal with the same maximum momentum flux value
is considered. The curves represented belong to the
point with 80 MPa of injection pressure and 2.5 MPa
of backpressure. It is important to remark that in the
theoretical case, the penetration obtained from the
packets model is the same as the penetration obtained
applying directly Eq. (3), which, as stated before,
shows the same dependencies as other models
considered in the literature Eq. (5). As can be seen
Fig. 16. Comparison between the penetration obtained from a real momentum flux signal and theoretical momentum signal.
Results for the three nozzles at Pi= 80 MPa − Pb= 2.5 MPa.
(a)
(b)
(c)
1110 R. Payri et al. / Journal of Mechanical Science and Technology 21(2007) 1100~1111
from the picture, the differences are important, and so
the model presented can be used for predicting pene-
tration taking into account real momentum signals.
7. Conclusions
The macroscopic spray characteristics and spray
momentum flux from three different nozzles with
different diameters have been evaluated in two di-
fferent test rigs.
A theoretical model for the spray penetration in
function of the time has been described.
The model is based on the division of the
momentum flux signal in momentum packets
sequentially injected and the tracking of them inside
and at the tip of the spray.
These packets follow a theoretical equation
which relates the penetration with the ambient density,
momentum and time.
The main point of the model is that the
momentum flux, which controls a given packet inside
the spray, is due to the addition of its momentum flux
and the momentum flux of the previous packet. This
packet moves forward inside the spray until it reaches
the spray tip and becomes the new leader packet. The
packets which are leading the tip of the spray, and so,
describing the penetration of the spray, penetrate
against stagnant air only with its own momentum flux.
What makes this model different from previous
empirical or semi-empirical equations in the literature
(Dent, 1971; Koo, 1996; Naber and Siebers, 1996;
Wakuri et al., 1960; Payri et al., 2005b; Yeom, 2003)
is that it takes into account non-stationary conditions
due to the dynamic behavior of the injector, especially
at the beginning of the injection process, i.e., during
needle lift.
The momentum flux measurements for different
test points have been used as an input of the model in
order to predict spray penetration. The spray tip
penetration predicted by the model has been com-
pared in all cases with the experimental penetration
obtained from the injection test rig.
The comparison has shown the ability of the
model to predict the penetration even for the first time
intervals.
Acknowledgments
The authors would like to thank José Enrique del
Rey * for his collaboration in the experimental
measurements. This research has been funded in the
frame of CAVISPRAY project; reference GV06/060
from Generalitat Valenciana.
(*) From CMT-Motores Térmicos. Universidad
Politécnica de Valencia.
Nomenclature ----------------------------------------------------------
Din : Inlet diameter of the nozzle’s orifices.
Dout : Outlet diameter of the nozzle’s orifices.
k-factor : Convergence or divergence factor.
�� : Momentum flux.
Pb : Backpressure. Pi : Injection Pressure.
S : Spray tip penetration.
T : Time.
kp : Penetration constant.
Si : Packet penetration at the front of the spray.
Si’ : Packet penetration inside the spray.
toi : Packet origin time.
tci : Packet front reaching time.
Sci : Packet front reaching penetration.
Greek symbols
ρa : Ambient density.
: Spray cone angle.
ϕi : Packet phase lag.
References
Bermúdez, V., Payri, R., Salvador, F. J. and Plazas,
A. H., 2005, “Study of the Influence of Nozzle Seat
Type on Injection Rate and Spray Behavior,” Proc. ImechE, Vol. 219, part D: J. Automobile Engineering,
pp. 677~689.
Dent, J. C., 1971, “A Basis for the Comparison of
Various Experimental Methods for Studying Spray
Penetration,” SAE Paper 710571.
Desantes, J. M., Payri, R., Salvador, F. J. and Gil,
A., 2006, “Development and Validation of a The-
oretical Model for Diesel Spray penetration,” Fuel 85,
pp. 910~917.
Desantes, J. M., Payri, R., Garca, J. M. and Salvador,
F. J., 2007, “A Contribution to the Understanding of
Isothermal Diesel Spray Dynamics,” Fuel 86, pp.
1093~1101.
Flaig, U., Polach, W. and Ziegler, G., 1999,
“Common Rail System for Passenger car DI Diesel
Engines,” Experiences with Applications for Series
Production Projects”. SAE Paper 1999-01-0191.
Kim, C. H. and Lee, J. S., 2003, “An Analytical

R. Payri et al. / Journal of Mechanical Science and Technology 21(2007) 1100~1111 1111
Study on the Performance Analysis of a Unit-Injector
System of a Diesel Engine,” KSME International Journal, Vol. 17, No. 1, pp. 146~156.
Koo, J. Y., 2003, “The Effects of Injector Nozzle
Geometry and Operating Pressure Conditions on the
Transient fuel spray Behavior,” KSME International Journal, Vol. 17, No. 3, pp. 617~625.
Macián, V., Bermúdez, V., Pyri, R. and Gimeno, J.,
2003, “New Technique for the Determination of the
Internal Geometry of Diesel Nozzles with the use of
the Silicone Methodology,” Experimental Techniques, Vol. 27, No. 2, pp. 39~43.
Naber, J. and Siebers, D. L., 1996, “Effects of Gas
Density and Vaporisation on Penetration and Dis-
persion of Diesel Sprays,” SAE Paper 960034.
Pastor, J.V., Arrègle, J., Palomares, A., 2001,
“Diesel Spray Image Segmentation with a Likelihood
Ratio Test,” Applied Optics, Vol. 40, No. 17, pp.
2876~2885.
Payri, R., Molina, S., Salvador, F. J. and Gimeno, J.,
2004, “A Study of the Relation Between Nozzle
Geometry, Internal Flow and Sprays Characteristics
in Diesel Fuel Injection Systems,” KSME Inter-national Journal, Vol. 18, No. 7, pp. 1222~1235.
Payri, R., García, J. M., Salvador, F. J. and Gimeno
J., 2005a, “Using Spray Momentum Flux Measure-
ments to Understand the Influence of Diesel Nozzle
Geometry on Spray Characteristics,” Fuel 2005; 84:
551~561.
Payri, R., Salvador, F.J., Gimeno, J., Soare, V.,
2005b, “Determination of Diesel Sprays Charac-
teristics in Real Engine in-Cylinder Air Density and
Pressure Conditions,” Journal of Mechanical Science and Technology, Vol. 19, No. 11, pp. 2040~2052.
Yeom, J. K., “A Study on the Behavior Charac-
teristics of Diesel Spray by using a High Pressure
Injection System with Common Rail Apparatus,”
KSME International Journal, Vol. 17, No. 9, pp.
1371~1379.
Wakuri, Y., Fujii, M., Amitani, T. and Tsuneya, R.,
1960, “Studies of the Penetration of a Fuel Spray in a
Diesel Engine,” Bull. J.S.M.E. 3(9), pp. 123~130.
Appendix : Full model formulation
In this appendix is presented the full formulation of
the model presented in this paper.
The penetration for the packet i when it is
advancing inside the spray is shown in Eq. (1) where
to is the injection beginning of the packet.
( ) ( )1/ 4 1/ 21/ 4
1'i a i i iS cte M M t toρ −−= ⋅ ⋅ + ⋅ −� � (1)
Once the packet reaches the spray front, its
penetration formula will be:
( )1/ 21/ 4 1/ 4
i a i i iS cte M t toρ ϕ−= ⋅ ⋅ ⋅ − +� (2)
Operating with Eq. (1) applied to packet i and Eq.
(2) applied to the packet (i-1), the point c (tc and Sc)
where the packet i reaches the front can be calculated.
( )1 1 1 1
1 1
i i i i i ii
i i i
M M to M totc
M M M
ϕ− − − −
− −
+ ⋅ − ⋅ −=
+ −
� � �
� � � (3)
( ) ( )1/ 4 1/ 21/ 4
1i a i i i iSc cte M M tc toρ −−= ⋅ ⋅ + ⋅ −� � (4)
Finally, by operating Eqs. (4) and Eq. (2) con-
sidering t equal to tc is obtained the phase lag:
( )1 1i ii i i
i
M M tc toM
ϕ −� += − ⋅ − � ��
� �� (5)
The model is getting data for previous packet so it
is necessary to take into account that for the first
packet to, tc and ϕ are equal to zero.


