Embed Size (px)
Citation preview

On the Evolution of Malware Species
Vasileios Vlachos∗, Christos Ilioudis†and Alexandros Papanikolaou∗
Abstract
Computer viruses have evolved from funny artifacts which were craftedmostly to annoy inexperienced users to sophisticated tools for industrial es-pionage, unsolicited bulk email (ube), piracy and other illicit acts. Despitethe steadily increasing number of new malware species, we observe the for-mation of monophyletic clusters. In this paper, using public available data,we demonstrate the departure of the democratic virus writing model in whicheven moderate programmers managed to create successful virus strains to anentirely aristocratic ecosystem of highly evolved malcode.
Keywords: malware, computer virus, phylogeny, cybercrime, malware writers
1 Introduction
Malicious software is one of the most persistent threats to computer users. Ear-lier types of malcode debuted at the mainframes [1, 2], but a substantial rise couldbe attributed to the proliferation of home and personal computers [3]. Computervirology was theoretically and experimentally established by Fred Cohen and his su-pervisor Leonard Adleman [4–6]. Since then, computer viruses and other parasiticapplications have became a common albeit annoyance for most computer users. Asa result a multibillion world market for security applications has emerged and soaredsince then. Europe spent more than 4.6 billion eur for security applications andservices in 2008 [7]. According to antivirus vendors more than 4500 new malwarespecies appear daily [8]. The effective handling of such a large number of threatsrequires substantial efforts and resources, human as well as computational, in orderto provide timely remedies and protective measures. As consequence the absolutenumber of malware species constantly increases and at the time exceeds 2.6 millionthreats [8]. The overwhelming majority of the malware is either proof of conceptcode or flawed malicious programming attempts. Only a small number of virusesand worms manages to propagate in the wild (or in other words to reach and affectnormal users), and merely a handful of them had the potential to become epidemicsor pandemics. Therefore it is necessary to prioritize the imminent malware threatsand devote the appropriate resources accordingly. In this paper we analyze a largedata set of the computer viruses and other forms of malcode, that have been seen in
∗{vsvlachos, alpapanik}@teilar.gr, Department of Computer Science and Telecommuni-cations, Technological Educational Institute of Larissa, Larissa, GR 411 10, Greece.†[email protected], Department of Information Technology, Alexander Technological Edu-
cational Institute of Thessaloniki, P.O. BOX 141 GR, 57400 Thessaloniki, Greece.
1
the wild and we evaluate the current landscape so as to identify current hot spotsthat should trigger immediate attention. We believe that through the understandingof malcode evolution, a prioritization of current threats is both viable and beneficial.By extending the well established Darwinian theory, we find that the small percent-age of computer viruses which is capable to mutate and adapt to the environment,is responsible for the majority of the security incidents.
The rest of this paper is organized as follows: Section 2 summarizes the relatedwork, Section 3 presents and discusses our findings, whereas Section 4 concludes thispaper along with possible future directions.
2 Related Work
A number of analogies between biological and computer viruses have been revealed [4,9] in the past and more recently [10, 11]. An important outcome of this approachis the realization that the monocultures are particular harmful for the security ofthe software ecosystem [12–15]. Most of the work, however tackled the evolutionof the security mechanisms from the defenders perspective [9, 16–18]. A more ag-gressive strategy would focus on reconnaissance of the weak points of the malwaredevelopment process through biological analogies. The Phylogenetics is the study ofthe relationships between organisms based on how closely they are related to eachother [19]. Researchers have applied similar methodologies to investigate the evolu-tion of software and malware in particular, either using manual methodologies [20]or automated techniques [21–23]. It is reasonable to expect that only successfulviruses will have the chance to mutate and eventually to create phylogenetic clus-ters. Therefore the WildList is better suited to become the basis of an evolutionarystudy. Though there is no reason to believe that the actual number of computerviruses differs from the estimation of major antivirus vendors, there is a clear differ-ence between the malcode that has been developed for proof of concept purposes,in vitro environments and the number of malware strains that can be found in vivo.Moreover even if a virus circulates, it is not expected to cause significant damagegiven the total number of viruses in the wild. In our previous work we examined thefactors that contributed to the success or the failure of a worm [10]. In this studywe decided to utilize data from the WildList Foundation to capture the malwaredynamics that have been seen in the wild. This list is somehow arbitrary as it isbased on a limited number of participants, but as we will discuss, we believe thatit provides significant advantages over other traditional approaches [24]. Despitethe fact that some antivirus vendors [25] and researchers [26] do not agree with themethodology used by the WildList, still in general “it is considered as an author-itative collection of the widespread malcode and is widely utilized as the test benchfor in-the-wild virus testing and certification of anti-virus products by the icsa andVirus Bulletin” [27].
Various av vendors provide statistical data about the proliferation of computermalcode, paying more attention to the evolution of the malware codebase and thefinancial motives of their developers [8]. On the other hand researchers have focusedon interviewing malware writers in order to explain their psychosynthesis [28–31].These findings are important and useful, but have not been updated and correlatedwith the current trends. Our work shows that the development of malcode is nomore a “democratic” activity, in which any individual with moderate skills (for fun,
2
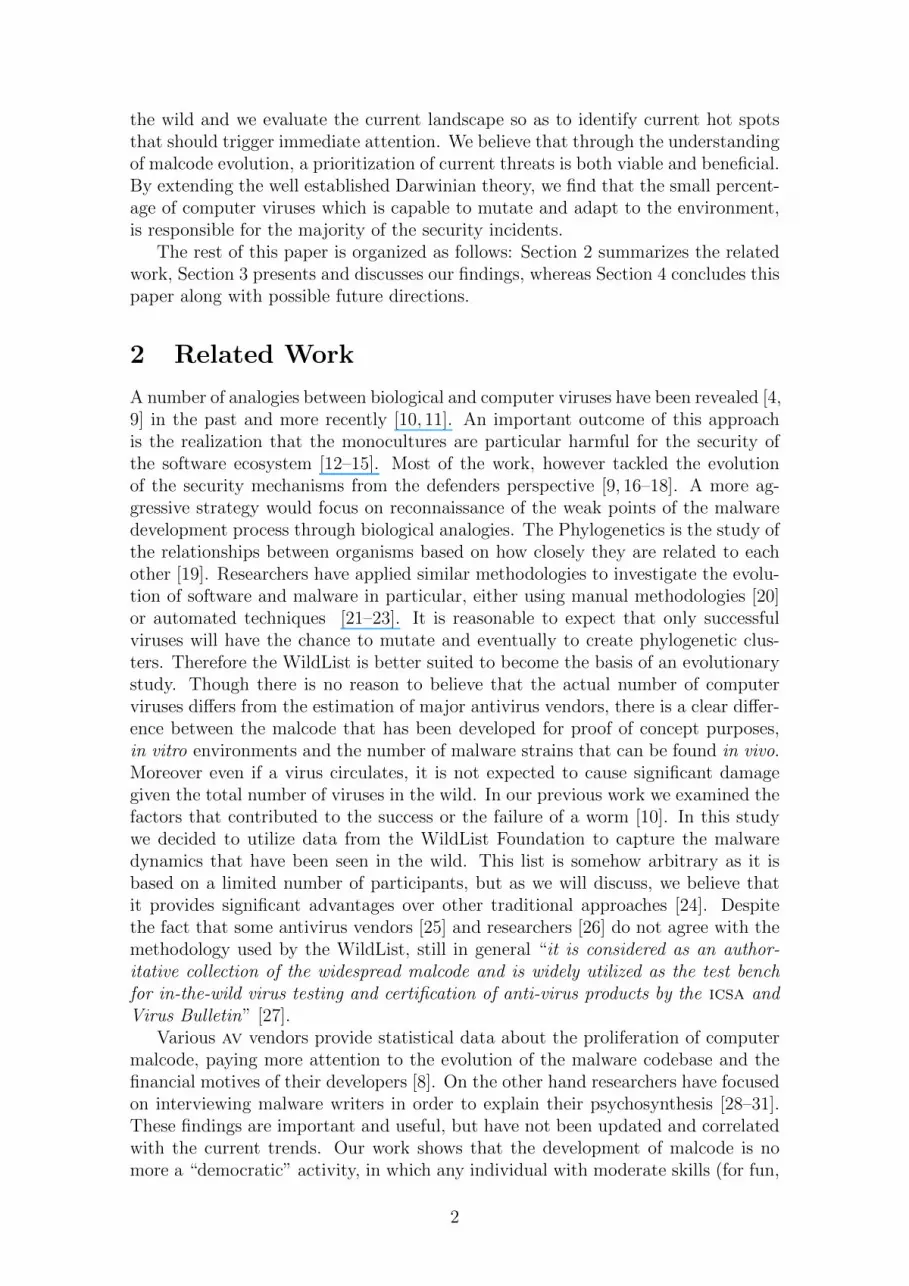
Malware FamiliesName of Virus [Alias(es) ] List Date Reported byW32/Feebs!ITW#33 [!3501..........] 7/06 SjStW32/Feebs!ITW#45 [!E7A1..........] 7/06 SjStW32/Feebs!ITW#83 [!D840..........] 5/07 JgRsStW32/Feebs!ITW#89 [!9FA2..........] 11/07 PaStTl’
Table 1: Malware.
political, religious or other reasons) could develop a new strain of a computer virusand cause significant or widespread damage. Most modern malware incidents are theresult of a few number of prominent malcode families which dominate the landscapeand are responsible for most annoyances and damages. The rate of which improvedversions of the specific families are rolled out predominates most of the malwareactivity.
3 Discussion
Although the current malware activity can be obtained through various sources, wedeliberately choose to work with the WildList because we believe it represents betterthe observed malcode dynamics. According to their definition “The list should not beconsidered a list of ‘the most common viruses’, however, since no specific provision ismade for a commonness factor. This data indicates only ’which’ viruses are In-the-Wild, but viruses reported by many (or most) participants are obviously widespread”.In other words, this list contains the viruses, worms and other types of malicioussoftware that succeeded to propagate sufficiently to be detectable, which clearlyexcludes proof of concept prototypes, academic examples, or ill engineered malcodeartifacts.
The WildList employes an arbitrary naming scheme to identify malware treatswhich is basically the name most used by different av scanners or the name given avirus by the person who first reported it. For the purpose of identifying maliciouscode of the same malware family we analyze the archives of the Wild List Organi-zation from July 1993 till June 2010 and we taxonomize them according to theirname. For example during January 2008 we identified the worm strains shown inTable 1 as members of the W32/Feebs family. This approach which is based on thecategorization of the WildList is not as detailed as the manual or automatic inspec-tion of the malcode using “phylogeny model generators (pmgs)” [21] so as to discerntheir phylogenetic characteristics. Nonetheless we find the method of the WildListOrganization sufficient to correctly categorize most of malcode species to malwarefamilies. Another issue with the Wild List is the fact that does not provide absolutenumbers regarding the malevolent activity of the malware species. Therefore weare not able to know the number of infections so as to categorize the viruses andthe worms according to their virulence. As a result a worm with a single entry inthe WildLight might have caused more infections than all mutations of a malwarefamily. On the other hand the fact that numerous mutations of a malcode phy-logeny managed to propagate to a wide scale so as to be included in the WildList isindicative of its capabilities to exploit a large pool of victims.
In order to proceed with the classification we used a small bash script to down-
3
load all the monthly archives form the WildList Organization. A Python programstripped all the unnecessary content of the archives and a subsequent Python ap-plication identified the malware families and performed analysis on the data. Ourapplications processed 175 files containing 238474 lines of text which were eventuallystripped down to 69820 lines of data.
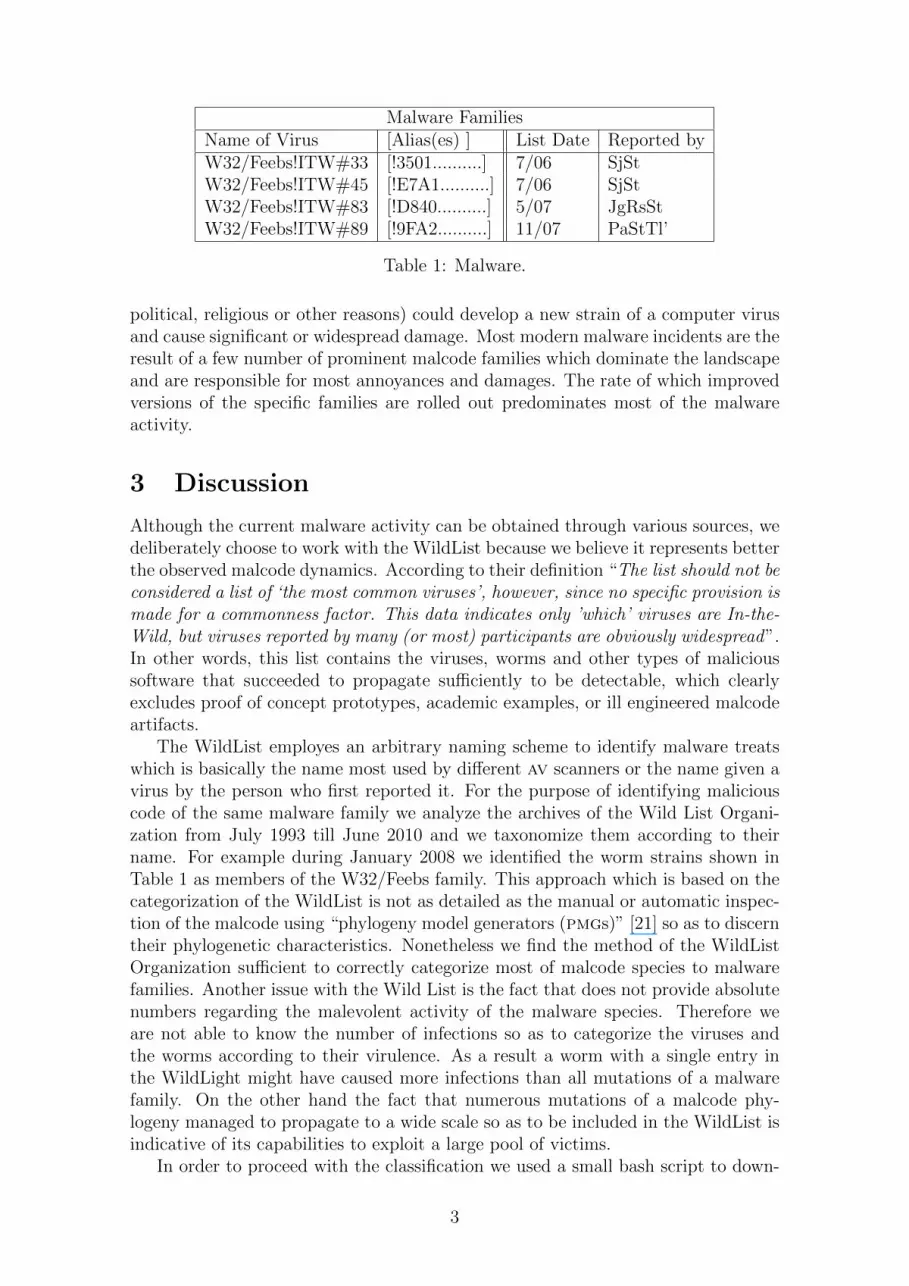
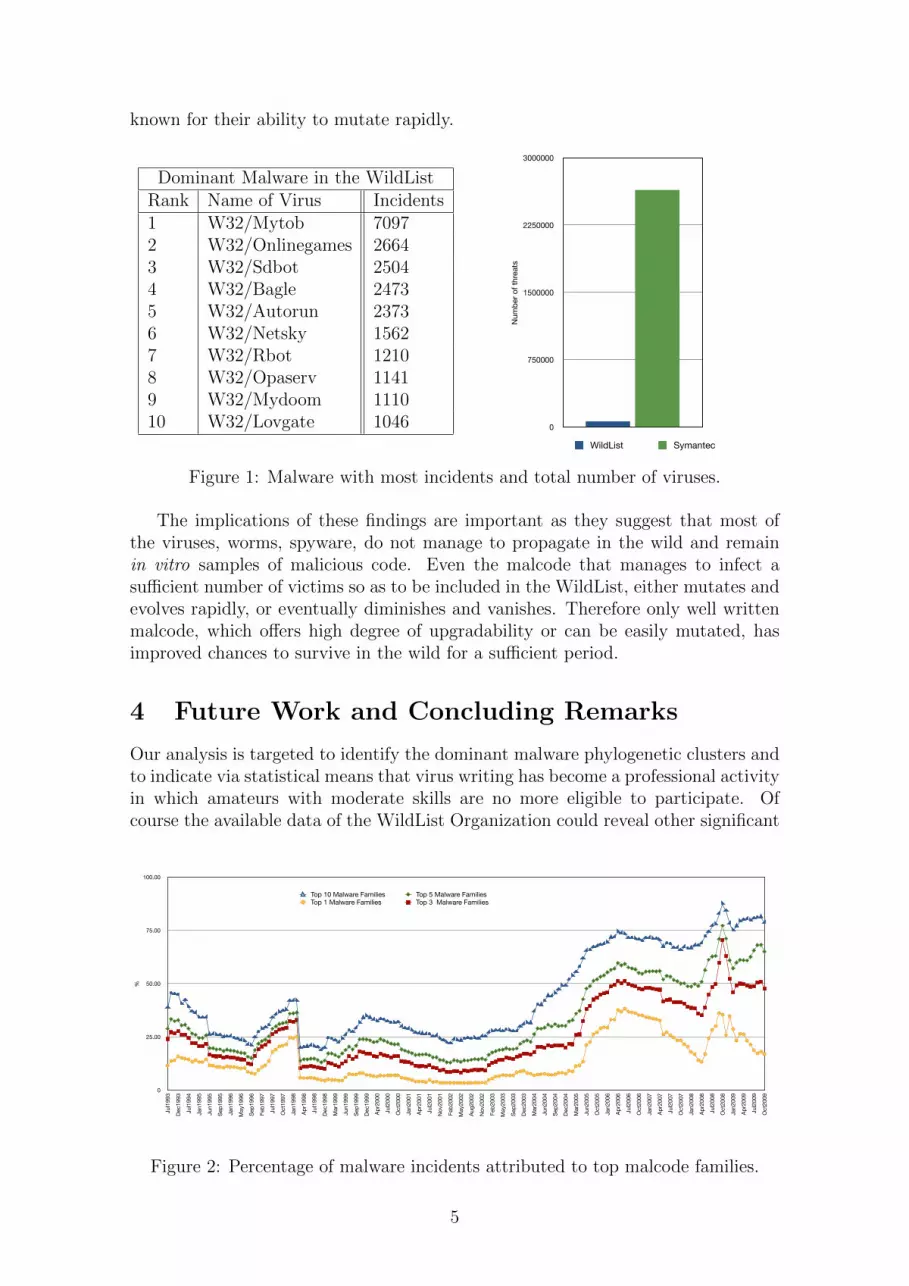
These data were the basis of the analysis for identifying the current threatsin computer virology. The first and most observable trend indicates an importantclusterization of the malicious software to a small number of malware families. FromFigure 2 we can witness that the percentage of the malcode species that belongto a dominant malware family does not show significant change in respect to thefirst available data of the year 1993. Though one can observe evident increasefor some months after the February of 1997 as well as for the period of the lastyears (after 2005), the latest measurements show a stabilization of the dominantmalicious activity related to the dominant malcode family around 15% of all theviruses, worms, spyware families that were found in the wild each month. Far moreimportant are the findings if we analyze the trends of the three, five or ten mostdominant families in conjunction. In that case we can observe that according tothe latest data (January 2010) the three most dominant families represent now the40.81% of all malware species that have been actively circulating compared to amere 24.04% of the first available data at the July of 1993. The five most dominantfamilies at the same period show a serious increase from 28.85% to 58.77%, wherefor the ten most dominant malware families we recorded a substantial growth from38.46% to 77.42%.
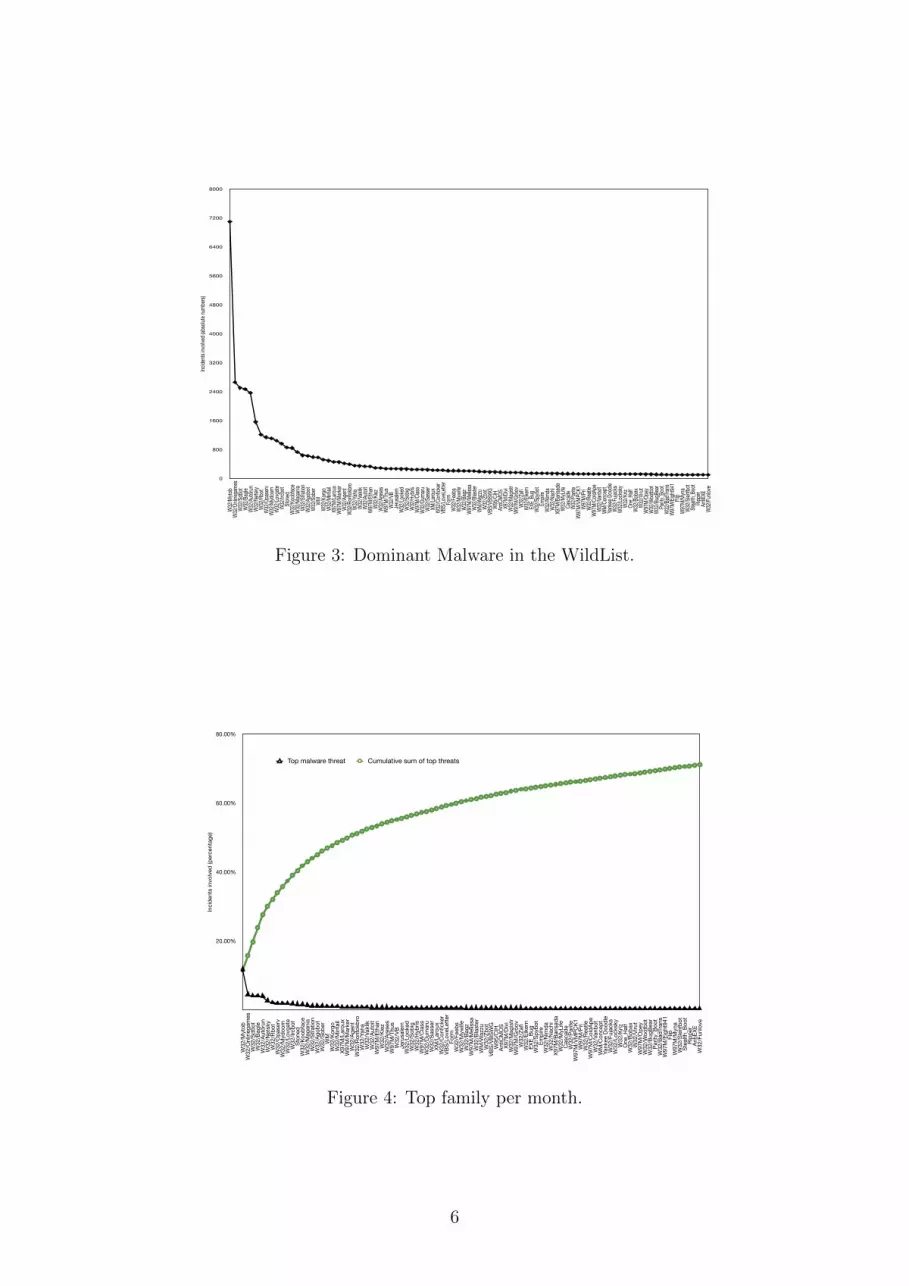
The trends depict a significant change of the malware activity. Our interpreta-tions of these findings agree with the work of S. Gordon [28–30], who examined themotivation of malware writers from a psychological perspective and that of S.Savageet al [32], which focused on the economic initiatives that drive the proliferation ofcomputer crimes through the development and the maintenance of botnets. Theearliest data (1993) depict a number of different malware strains that managed topropagate sufficiently so as to be included to the WildList. This trend eventuallyfades out as very few dominant malware families and their respective members rep-resent the vast majority of the viruses that succeed to circulate at large. Thereforeit is not as easy for a malicious entity to develop a new virus, worm or spyware asit used to be fifteen years ago. On the contrary one has much better chances toachieve widespread infection using a modified or extended version of a well main-tained malware family. Based on the data analysis, the top ten malware familieswith most incidents in the WildList are presented in the following table (Table 3),where a more extended view of the malicious software landscape is available in Fig-ure 3. Unfortunately, due to space limitations we had to include only the viruses,worms, spyware and bots that had more than 100 entries in the WildList in totaland hence Figure 3 contains only 97 from the 821 malicious applications that wereidentified in the WildList.
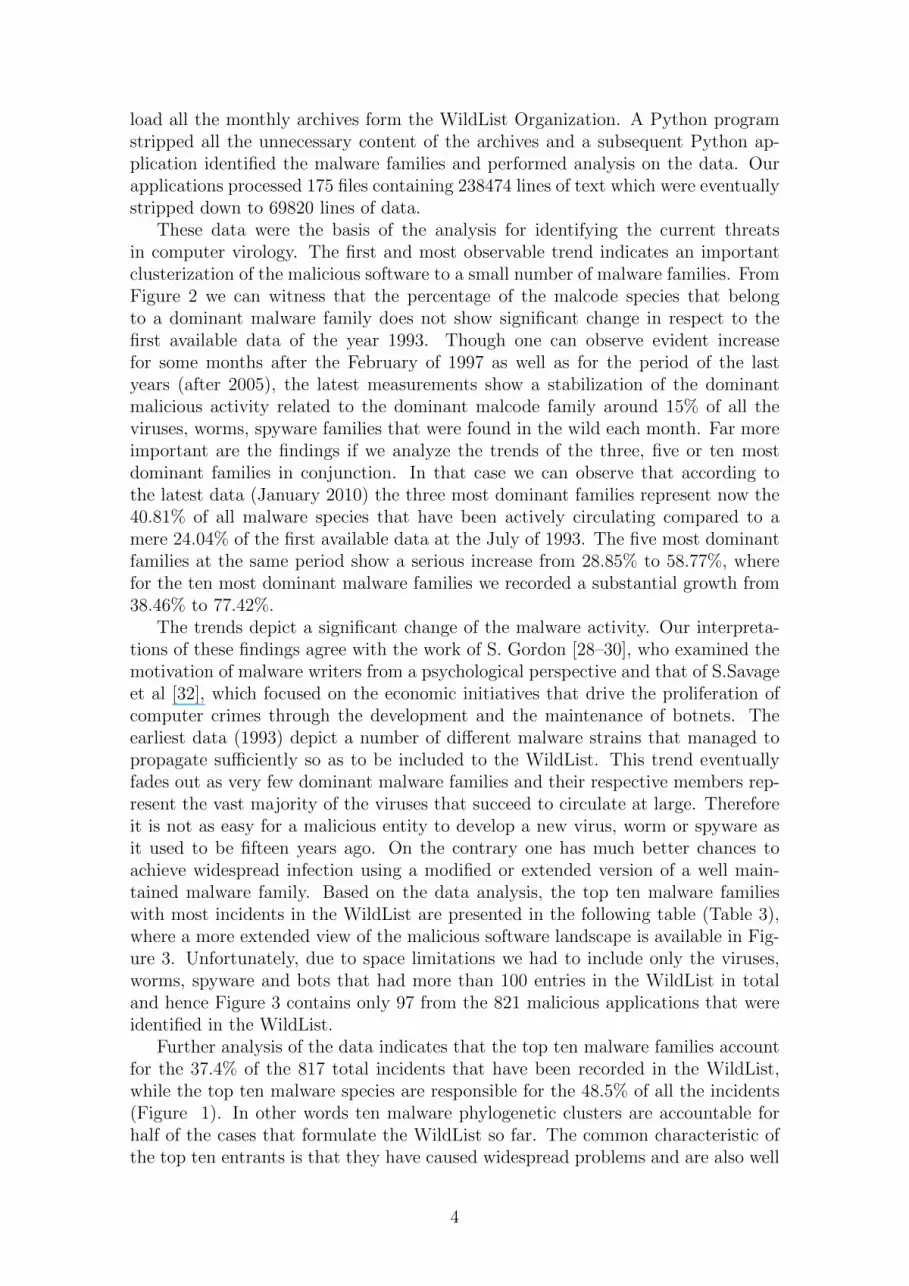
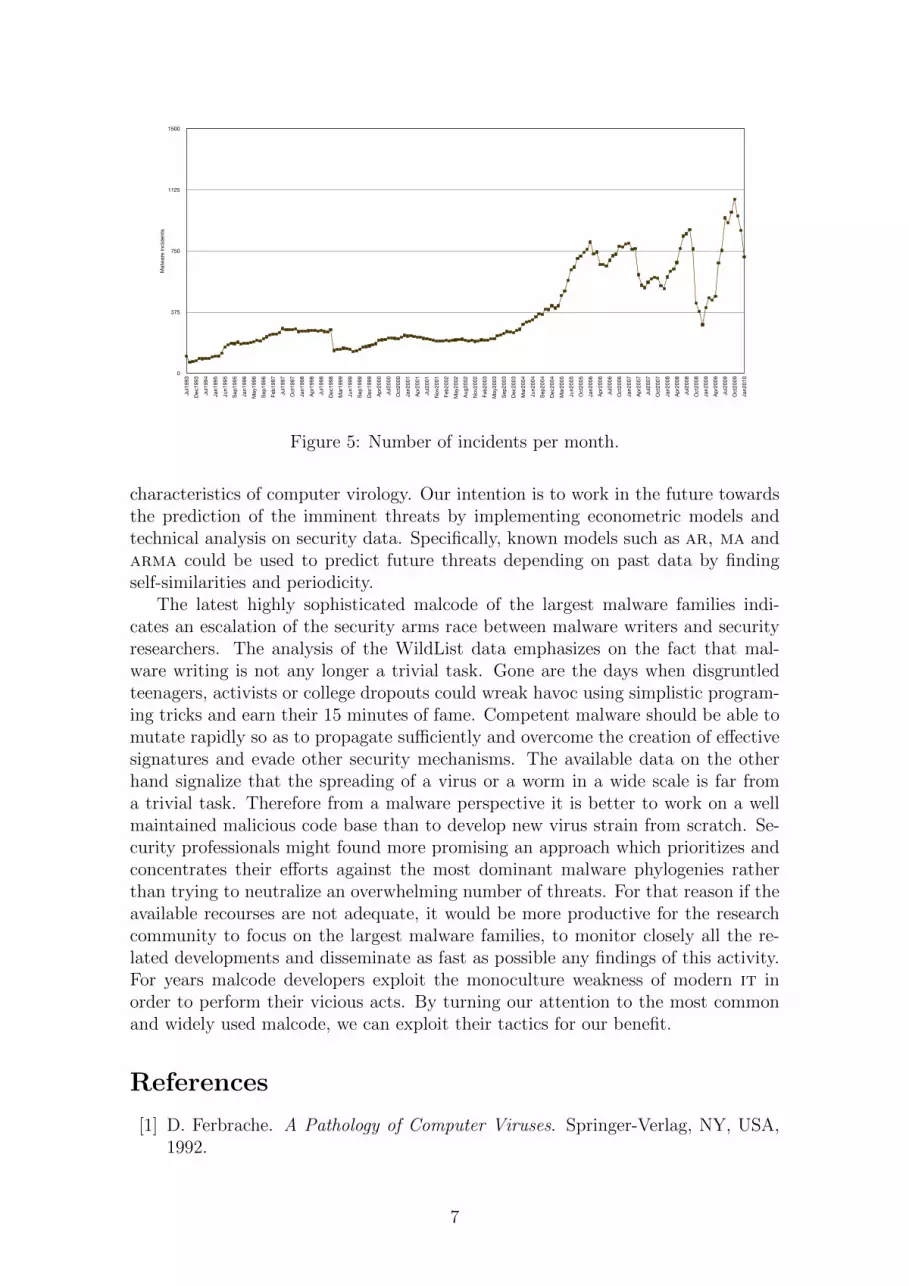
Further analysis of the data indicates that the top ten malware families accountfor the 37.4% of the 817 total incidents that have been recorded in the WildList,while the top ten malware species are responsible for the 48.5% of all the incidents(Figure 1). In other words ten malware phylogenetic clusters are accountable forhalf of the cases that formulate the WildList so far. The common characteristic ofthe top ten entrants is that they have caused widespread problems and are also well
4
known for their ability to mutate rapidly.
Dominant Malware in the WildListRank Name of Virus Incidents1 W32/Mytob 70972 W32/Onlinegames 26643 W32/Sdbot 25044 W32/Bagle 24735 W32/Autorun 23736 W32/Netsky 15627 W32/Rbot 12108 W32/Opaserv 11419 W32/Mydoom 111010 W32/Lovgate 1046
WildList 64439
Symantec 2642690 20547
18827
69107
113025
140690
624267
1656227
0
750000
1500000
2250000
3000000
Nu
mb
er
of
thre
ats
WildList Symantec
Figure 1: Malware with most incidents and total number of viruses.
The implications of these findings are important as they suggest that most ofthe viruses, worms, spyware, do not manage to propagate in the wild and remainin vitro samples of malicious code. Even the malcode that manages to infect asufficient number of victims so as to be included in the WildList, either mutates andevolves rapidly, or eventually diminishes and vanishes. Therefore only well writtenmalcode, which offers high degree of upgradability or can be easily mutated, hasimproved chances to survive in the wild for a sufficient period.
4 Future Work and Concluding Remarks
Our analysis is targeted to identify the dominant malware phylogenetic clusters andto indicate via statistical means that virus writing has become a professional activityin which amateurs with moderate skills are no more eligible to participate. Ofcourse the available data of the WildList Organization could reveal other significant
Jul1993 104 40 38.46 10Sep1993 66 30 45.45 10Nov1993 71 32 45.07 10Dec1993 76 34 44.74 10Feb1994 92 37 40.22 10Mar1994 88 37 42.05 10Jul1994 90 35 38.89 10Aug1994 90 33 36.67 10Sep1994 100 36 36.00 10Jan1995 106 36 33.96 10Feb1995 106 36 33.96 10May1995 124 42 33.87 10Jun1995 162 42 25.93 10Jul1995 173 45 26.01 10Aug1995 183 47 25.68 10Sep1995 182 47 25.82 10Oct1995 190 47 24.74 10Nov1995 179 45 25.14 10Jan1996 183 46 25.14 10Feb1996 184 45 24.46 10Mar1996 189 45 23.81 10May1996 194 45 23.20 10Jun1996 202 46 22.77 10Jul1996 198 42 21.21 10Sep1996 212 44 20.75 10Oct1996 223 55 24.66 10Dec1996 234 64 27.35 10Feb1997 239 68 28.45 10Mar1997 240 70 29.17 10May1997 249 76 30.52 10Jul1997 274 93 33.94 10Aug1997 267 94 35.21 10Sep1997 267 97 36.33 10Oct1997 267 99 37.08 10Nov1997 273 102 37.36 10Dec1997 256 107 41.80 10Jan1998 258 108 41.86 10Feb1998 258 108 41.86 10Mar1998 260 51 19.62 10Apr1998 262 53 20.23 10May1998 262 53 20.23 10Jun1998 257 53 20.62 10Jul1998 263 54 20.53 10Aug1998 255 51 20.00 10Oct1998 252 47 18.65 10Dec1998 266 52 19.55 10Jan1999 139 34 24.46 10Feb1999 145 35 24.14 10Mar1999 146 34 23.29 10Apr1999 153 34 22.22 10May1999 151 36 23.84 10Jun1999 148 38 25.68 10Jul1999 132 37 28.03 10Aug1999 136 37 27.21 10Sep1999 148 43 29.05 10Oct1999 159 50 31.45 10Nov1999 163 55 33.74 10Dec1999 168 58 34.52 10Jan2000 175 59 33.71 10Feb2000 182 60 32.97 10Apr2000 202 65 32.18 10May2000 204 68 33.33 10Jun2000 206 68 33.01 10Jul2000 217 70 32.26 10Aug2000 215 68 31.63 10Sep2000 214 67 31.31 10Oct2000 213 68 31.92 10Nov2000 220 65 29.55 10Dec2000 232 67 28.88 10Jan2001 228 65 28.51 10Feb2001 230 64 27.83 10Mar2001 225 60 26.67 10Apr2001 222 59 26.58 10May2001 221 58 26.24 10Jun2001 214 56 26.17 10Jul2001 213 56 26.29 10Aug2001 208 52 25.00 10Oct2001 201 51 25.37 10Nov2001 197 47 23.86 10Dec2001 199 46 23.12 10Jan2002 198 44 22.22 10Feb2002 201 44 21.89 10Mar2002 199 47 23.62 10Apr2002 203 47 23.15 10May2002 204 47 23.04 10Jun2002 207 50 24.15 10Jul2002 209 51 24.40 10Aug2002 203 49 24.14 10Sep2002 198 48 24.24 10Oct2002 201 48 23.88 10Nov2002 195 49 25.13 10Dec2002 196 49 25.00 10Jan2003 205 55 26.83 10Feb2003 203 56 27.59 10Mar2003 202 56 27.72 10Apr2003 212 59 27.83 10May2003 210 58 27.62 10Jun2003 229 65 28.38 10Jul2003 234 65 27.78 10Sep2003 244 67 27.46 10Oct2003 255 70 27.45 10Nov2003 253 75 29.64 10Dec2003 250 77 30.80 10Jan2004 261 82 31.42 10Feb2004 269 84 31.23 10Mar2004 301 111 36.88 10Apr2004 314 126 40.13 10May2004 319 127 39.81 10Jun2004 327 137 41.90 10Jul2004 345 152 44.06 10Aug2004 364 160 43.96 10Sep2004 361 163 45.15 10Oct2004 393 185 47.07 10Nov2004 390 190 48.72 10Dec2004 414 202 48.79 10Jan2005 399 207 51.88 10Feb2005 413 221 53.51 10Mar2005 475 263 55.37 10Apr2005 504 292 57.94 10May2005 569 351 61.69 10Jun2005 633 412 65.09 10Jul2005 651 428 65.75 10Sep2005 705 472 66.95 10Oct2005 719 484 67.32 10Nov2005 740 504 68.11 10Dec2005 761 521 68.46 10Jan2006 804 556 69.15 10Feb2006 731 522 71.41 10Mar2006 743 533 71.74 10Apr2006 667 494 74.06 10May2006 667 489 73.31 10Jun2006 656 480 73.17 10Jul2006 692 494 71.39 10Aug2006 721 515 71.43 10Sep2006 729 517 70.92 10Oct2006 780 551 70.64 10Nov2006 774 542 70.03 10Dec2006 792 564 71.21 10Jan2007 797 567 71.14 10Feb2007 761 540 70.96 10Mar2007 766 542 70.76 10Apr2007 604 424 70.20 10May2007 539 362 67.16 10Jun2007 525 362 68.95 10Jul2007 557 382 68.58 10Aug2007 580 387 66.72 10Sep2007 589 392 66.55 10Oct2007 583 383 65.69 10Nov2007 538 360 66.91 10Dec2007 519 345 66.47 10Jan2008 590 392 66.44 10Feb2008 626 423 67.57 10Mar2008 638 432 67.71 10Apr2008 678 467 68.88 10May2008 764 551 72.12 10Jun2008 841 622 73.96 10Jul2008 855 658 76.96 10Aug2008 879 682 77.59 10Sep2008 762 629 82.55 10Oct2008 431 376 87.24 10Nov2008 378 318 84.13 10Dec2008 297 232 78.11 10Jan2009 402 301 74.88 10Feb2009 461 354 76.79 10Mar2009 450 356 79.11 10Apr2009 472 377 79.87 10May2009 677 542 80.06 10Jun2009 753 599 79.55 10Jul2009 953 768 80.59 10Aug2009 922 747 81.02 10Sep2009 986 799 81.03 10Oct2009 1067 836 78.35 10
28.85 533.33 532.39 532.89 530.43 530.68 528.89 526.67 526.00 524.53 524.53 525.81 519.75 519.65 519.13 519.23 518.42 518.99 518.58 518.48 517.99 517.53 517.33 515.66 515.09 518.83 521.79 523.01 523.75 525.30 528.83 529.96 531.09 531.46 531.87 535.94 536.05 536.43 513.85 514.50 514.50 514.79 514.83 514.12 513.10 513.91 517.27 517.24 516.44 515.69 517.22 518.92 520.45 519.12 520.95 523.90 523.93 523.81 523.43 522.53 522.77 524.02 523.30 522.58 521.86 521.50 521.60 519.09 518.53 517.98 517.39 516.44 516.67 516.74 516.82 516.43 515.38 515.42 514.21 514.07 513.13 512.94 514.07 513.79 513.24 514.01 513.88 514.29 514.65 514.43 514.87 514.29 516.59 517.73 518.32 518.87 519.05 519.65 519.23 519.26 519.61 521.74 522.80 523.37 522.68 526.25 528.98 528.84 529.36 530.72 529.95 531.02 530.03 530.26 530.19 532.33 532.93 536.00 537.30 542.71 547.71 548.85 551.35 552.02 553.24 553.88 555.35 556.50 557.07 559.67 558.62 559.30 557.66 557.14 556.65 555.13 554.65 555.68 555.71 555.85 555.74 555.96 551.95 553.71 553.32 551.72 551.10 550.09 550.19 548.75 548.64 549.84 548.90 550.88 556.41 561.24 562.69 563.03 571.00 577.26 571.16 560.94 557.21 559.87 561.11 561.02 560.86 562.55 565.58 568.11 568.26 565.04 5
0
25.00
50.00
75.00
100.00
Jul1
993
Dec
1993
Jul1
994
Jan1
995
Jun1
995
Sep
1995
Jan1
996
May
1996
Sep
1996
Feb
1997
Jul1
997
Oct
1997
Jan1
998
Ap
r199
8
Jul1
998
Dec
1998
Mar
1999
Jun1
999
Sep
1999
Dec
1999
Ap
r200
0
Jul2
000
Oct
2000
Jan2
001
Ap
r200
1
Jul2
001
Nov
2001
Feb
2002
May
2002
Aug
2002
Nov
2002
Feb
2003
May
2003
Sep
2003
Dec
2003
Mar
2004
Jun2
004
Sep
2004
Dec
2004
Mar
2005
Jun2
005
Oct
2005
Jan2
006
Ap
r200
6
Jul2
006
Oct
2006
Jan2
007
Ap
r200
7
Jul2
007
Oct
2007
Jan2
008
Ap
r200
8
Jul2
008
Oct
2008
Jan2
009
Ap
r200
9
Jul2
009
Oct
2009
%
Top 10 Malware Families Top 5 Malware FamiliesTop 1 Malware Families Top 3 Malware Families
11.54 113.64 114.08 115.79 115.22 114.77 114.44 113.33 114.00 113.21 113.21 114.52 111.73 111.56 110.93 110.99 110.53 111.17 110.93 110.87 110.58 110.31 110.40 1
8.59 18.02 17.62 19.40 1
10.88 111.67 113.65 117.88 119.10 120.60 120.97 121.61 124.61 124.42 125.19 1
5.77 15.73 15.73 15.84 15.70 15.10 14.76 14.51 15.04 14.83 14.79 14.58 14.64 16.08 17.58 17.35 17.43 18.18 17.98 17.14 16.86 16.59 16.44 16.86 16.80 16.91 16.98 17.01 17.04 15.91 15.60 15.26 14.78 14.00 14.05 14.07 13.74 14.69 13.85 13.98 13.55 13.52 13.54 13.48 13.52 13.45 13.43 13.38 13.35 13.45 13.54 13.48 13.59 13.57 14.88 15.42 16.44 16.60 17.14 16.99 16.84 16.97 18.24 18.70 19.20 18.05 17.81 16.98 17.32 17.52 17.65 17.25 17.14 17.48 18.14 18.21 17.73 19.02 18.72 1
11.37 111.71 113.53 121.33 122.58 126.24 127.12 128.92 129.57 129.35 133.11 133.11 137.63 136.88 138.26 136.85 136.62 136.21 135.26 135.14 134.22 134.00 133.51 133.42 132.78 126.16 127.24 125.67 124.66 123.43 123.50 121.56 120.42 117.97 116.93 114.11 113.27 116.88 124.26 128.30 130.15 136.22 135.50 125.93 134.68 128.61 123.21 126.44 126.27 123.19 121.38 118.68 117.35 118.05 116.87 1
24.04 327.27 326.76 327.63 326.09 326.14 324.44 322.22 322.00 320.75 320.75 321.77 316.67 316.18 315.85 315.93 315.26 315.64 315.30 315.22 314.81 314.43 314.36 312.63 312.26 316.14 319.23 320.50 321.25 322.89 326.28 327.34 328.46 328.84 329.30 332.42 332.17 332.95 310.38 311.07 311.07 311.28 311.03 310.59 310.32 310.15 312.95 312.41 311.64 311.11 312.58 313.51 315.91 314.71 315.54 318.24 317.79 317.26 317.14 315.93 315.84 317.16 316.50 316.13 315.35 315.89 315.96 313.64 313.36 313.16 312.61 311.56 311.26 311.31 311.21 311.74 310.58 310.45 3
9.14 39.55 38.59 38.46 39.05 38.87 38.33 39.18 39.09 39.36 39.60 39.45 39.74 39.18 3
11.71 312.81 313.37 314.15 314.29 315.28 314.96 314.75 315.69 316.21 317.20 317.24 316.73 317.94 320.38 320.38 319.88 321.16 320.60 321.05 320.87 321.03 320.05 321.80 321.55 325.89 326.19 332.51 338.23 339.63 342.55 343.39 344.86 345.47 345.77 348.70 349.39 351.27 350.22 351.37 349.86 349.24 348.83 347.82 347.29 347.98 348.06 347.57 347.39 347.19 341.74 342.29 342.55 341.38 341.43 341.34 340.71 339.11 338.64 338.34 336.05 335.10 338.74 344.83 348.42 349.83 359.84 370.53 362.96 352.19 346.02 349.24 350.00 349.79 349.04 348.61 348.79 350.54 350.91 347.61 3
Figure 2: Percentage of malware incidents attributed to top malcode families.
5
W32/Mytob 7097 0.115 0.115 W32/Onlinegames 2664 0.043 0.158 W32/Sdbot 2504 0.040 0.198 W32/Bagle 2473 0.040 0.238 W32/Autorun 2373 0.038 0.276 W32/Netsky 1562 0.025 0.301 W32/Rbot 1210 0.020 0.321 W32/Opaserv 1141 0.018 0.339 W32/Mydoom 1110 0.018 0.357 W32/Lovgate 1046 0.017 0.374 W32/Ircbot 969 0.016 0.39 Stoned 863 0.014 0.404 W32/Koobface 847 0.014 0.418 W32/Magania 727 0.012 0.43 W32/Stration 639 0.010 0.44 W32/Agobot 621 0.010 0.45 W32/Sober 595 0.010 0.46 WM 584 0.009 0.469 W32/Korgo 521 0.008 0.477 W32/Mimail 492 0.008 0.485 X97M/Laroux 456 0.007 0.492 W97M/Marker 453 0.007 0.499 W32/Agent 422 0.007 0.506 W32/Rontokbro 395 0.006 0.512 W32/Yaha 358 0.006 0.518 W32/Vaklik 348 0.006 0.524 W32/Autoit 340 0.005 0.529 W97M/Ethan 332 0.005 0.534 W32/Klez 296 0.005 0.539 W32/Areses 291 0.005 0.544 W97M/Thus 273 0.004 0.548 W32/VB 272 0.004 0.552 Jerusalem 268 0.004 0.556 W32/Looked 263 0.004 0.56 W32/Sobig 262 0.004 0.564 W32/Hybris 248 0.004 0.568 W97M/Class 247 0.004 0.572 W32/Dumaru 246 0.004 0.576 W32/Sasser 242 0.004 0.58 XM/Laroux 236 0.004 0.584 W32/Conficker 234 0.004 0.588 VBS/LoveLetter 232 0.004 0.592 Form 219 0.004 0.596 W32/Feebs 218 0.004 0.6 W32/Mywife 217 0.004 0.604 W32/Bagz 212 0.003 0.607 W97M/Melissa 209 0.003 0.61 W32/Blaster 204 0.003 0.613 WM/Wazzu 196 0.003 0.616 W32/Zbot 187 0.003 0.619 VBS/VBSWG 180 0.003 0.622 W95/CIH 179 0.003 0.625 AntiCMOS 176 0.003 0.628 X97M/Divi 170 0.003 0.631 W32/Magistr 165 0.003 0.634 W97M/Groov 163 0.003 0.637 W32/Zafi 162 0.003 0.64 W32/Elkern 153 0.002 0.642 EXE_Bug 153 0.002 0.644 W32/Spybot 150 0.002 0.646 Empire 146 0.002 0.648 W32/Nimda 143 0.002 0.65 W32/Nachi 139 0.002 0.652 X97M/Barisada 138 0.002 0.654 W32/MyLife 135 0.002 0.656 Cascade 134 0.002 0.658 W32/Parite 133 0.002 0.66 W97M/VMPCK1 131 0.002 0.662 W97M/Pri 131 0.002 0.664 W32/Reatle 130 0.002 0.666 W97M/ColdApe 129 0.002 0.668 W32/Vanbot 128 0.002 0.67 WM/Concept 127 0.002 0.672 Yankee Doodle 125 0.002 0.674 W32/Fujacks 123 0.002 0.676 W32/Locksky 122 0.002 0.678 W32/Kriz 122 0.002 0.68 One_Half 122 0.002 0.682 W32/Bobax 121 0.002 0.684 W32/Virut 119 0.002 0.686 W97M/Opey 118 0.002 0.688 W32/Wootbot 117 0.002 0.69 W32/BugBear 115 0.002 0.692 Parity_Boot 115 0.002 0.694 W32/BadTrans 111 0.002 0.696 W97M/Eight941 106 0.002 0.698 Flip 105 0.002 0.7 W97M/Myna 103 0.002 0.702 W32/Slenfbot 103 0.002 0.704 Stealth_Boot 103 0.002 0.706 Ripper 103 0.002 0.708 AntiEXE 103 0.002 0.71 W32/Funlove 102 0.002 0.712
0
800
1600
2400
3200
4000
4800
5600
6400
7200
8000
W32
/Myt
ob
W
32/O
nline
gam
es W
32/S
dbot
W32
/Bag
le
W
32/A
utor
un
W
32/N
etsk
y
W32
/Rbo
t
W
32/O
pase
rv
W
32/M
ydoo
m
W
32/L
ovga
te
W
32/Ir
cbot
Sto
ned
W
32/K
oobf
ace
W
32/M
agan
ia
W32
/Stra
tion
W
32/A
gobo
t
W32
/Sob
er
W
M
W32
/Kor
go
W
32/M
imail
X97
M/L
arou
x
W97
M/M
arke
r
W32
/Age
nt
W
32/R
onto
kbro
W
32/Y
aha
W32
/Vak
lik
W
32/A
utoi
t
W97
M/E
than
W32
/Klez
W
32/A
rese
s
W97
M/T
hus
W32
/VB
J
erus
alem
W32
/Loo
ked
W32
/Sob
ig
W
32/H
ybris
W97
M/C
lass
W
32/D
umar
u
W
32/S
asse
r
XM
/Lar
oux
W32
/Con
ficke
r V
BS/L
oveL
ette
r F
orm
W32
/Fee
bs
W
32/M
ywife
W32
/Bag
z
W
97M
/Meli
ssa
W
32/B
laste
r
WM
/Waz
zu
W32
/Zbo
t
V
BS/V
BSW
G
W
95/C
IH
Ant
iCM
OS
X97
M/D
ivi
W
32/M
agist
r
W97
M/G
roov
W32
/Zaf
i
W
32/E
lkern
EXE
_Bug
W
32/S
pybo
t
Em
pire
W
32/N
imda
W32
/Nac
hi
X
97M
/Bar
isada
W
32/M
yLife
Cas
cade
W
32/P
arite
W97
M/V
MPC
K1
W
97M
/Pri
W32
/Rea
tle
W
97M
/Col
dApe
W
32/V
anbo
t
WM
/Con
cept
Yan
kee
Dood
le
W32
/Fuja
cks
W
32/L
ocks
ky
W
32/K
riz
One
_Half
W
32/B
obax
W32
/Viru
t
W
97M
/Ope
y
W
32/W
ootb
ot
W
32/B
ugBe
ar
P
arity
_Boo
t
W32
/Bad
Tran
s
W97
M/E
ight
941
F
lip
W
97M
/Myn
a
W
32/S
lenfb
ot
Ste
alth_
Boot
R
ippe
r
Ant
iEXE
W
32/F
unlo
ve
Incid
ents
invo
lved
(abs
olut
e nu
mbe
rs)
20.00%
40.00%
60.00%
80.00%
W32
/Myt
ob
W
32/O
nline
gam
es W
32/S
dbot
W32
/Bag
le
W
32/A
utor
un
W
32/N
etsk
y
W32
/Rbo
t
W
32/O
pase
rv
W
32/M
ydoo
m
W
32/L
ovga
te
W
32/Ir
cbot
Sto
ned
W
32/K
oobf
ace
W
32/M
agan
ia
W32
/Stra
tion
W
32/A
gobo
t
W32
/Sob
er
W
M
W32
/Kor
go
W
32/M
imail
X97
M/L
arou
x
W97
M/M
arke
r
W32
/Age
nt
W
32/R
onto
kbro
W
32/Y
aha
W32
/Vak
lik
W
32/A
utoi
t
W97
M/E
than
W32
/Klez
W
32/A
rese
s
W97
M/T
hus
W32
/VB
J
erus
alem
W32
/Loo
ked
W32
/Sob
ig
W
32/H
ybris
W97
M/C
lass
W
32/D
umar
u
W
32/S
asse
r
XM
/Lar
oux
W32
/Con
ficke
r V
BS/L
oveL
ette
r F
orm
W32
/Fee
bs
W
32/M
ywife
W32
/Bag
z
W
97M
/Meli
ssa
W
32/B
laste
r
WM
/Waz
zu
W32
/Zbo
t
V
BS/V
BSW
G
W
95/C
IH
Ant
iCM
OS
X97
M/D
ivi
W
32/M
agist
r
W97
M/G
roov
W32
/Zaf
i
W
32/E
lkern
EXE
_Bug
W
32/S
pybo
t
Em
pire
W
32/N
imda
W32
/Nac
hi
X
97M
/Bar
isada
W
32/M
yLife
Cas
cade
W
32/P
arite
W97
M/V
MPC
K1
W
97M
/Pri
W32
/Rea
tle
W
97M
/Col
dApe
W
32/V
anbo
t
WM
/Con
cept
Yan
kee
Dood
le
W32
/Fuja
cks
W
32/L
ocks
ky
W
32/K
riz
One
_Half
W
32/B
obax
W32
/Viru
t
W
97M
/Ope
y
W
32/W
ootb
ot
W
32/B
ugBe
ar
P
arity
_Boo
t
W32
/Bad
Tran
s
W97
M/E
ight
941
F
lip
W
97M
/Myn
a
W
32/S
lenfb
ot
Ste
alth_
Boot
R
ippe
r
Ant
iEXE
W
32/F
unlo
ve
Figure 3: Dominant Malware in the WildList.
W32/Mytob 7097 0.115 0.115 W32/Onlinegames 2664 0.043 0.158 W32/Sdbot 2504 0.040 0.198 W32/Bagle 2473 0.040 0.238 W32/Autorun 2373 0.038 0.276 W32/Netsky 1562 0.025 0.301 W32/Rbot 1210 0.020 0.321 W32/Opaserv 1141 0.018 0.339 W32/Mydoom 1110 0.018 0.357 W32/Lovgate 1046 0.017 0.374 W32/Ircbot 969 0.016 0.39 Stoned 863 0.014 0.404 W32/Koobface 847 0.014 0.418 W32/Magania 727 0.012 0.43 W32/Stration 639 0.010 0.44 W32/Agobot 621 0.010 0.45 W32/Sober 595 0.010 0.46 WM 584 0.009 0.469 W32/Korgo 521 0.008 0.477 W32/Mimail 492 0.008 0.485 X97M/Laroux 456 0.007 0.492 W97M/Marker 453 0.007 0.499 W32/Agent 422 0.007 0.506 W32/Rontokbro 395 0.006 0.512 W32/Yaha 358 0.006 0.518 W32/Vaklik 348 0.006 0.524 W32/Autoit 340 0.005 0.529 W97M/Ethan 332 0.005 0.534 W32/Klez 296 0.005 0.539 W32/Areses 291 0.005 0.544 W97M/Thus 273 0.004 0.548 W32/VB 272 0.004 0.552 Jerusalem 268 0.004 0.556 W32/Looked 263 0.004 0.56 W32/Sobig 262 0.004 0.564 W32/Hybris 248 0.004 0.568 W97M/Class 247 0.004 0.572 W32/Dumaru 246 0.004 0.576 W32/Sasser 242 0.004 0.58 XM/Laroux 236 0.004 0.584 W32/Conficker 234 0.004 0.588 VBS/LoveLetter 232 0.004 0.592 Form 219 0.004 0.596 W32/Feebs 218 0.004 0.6 W32/Mywife 217 0.004 0.604 W32/Bagz 212 0.003 0.607 W97M/Melissa 209 0.003 0.61 W32/Blaster 204 0.003 0.613 WM/Wazzu 196 0.003 0.616 W32/Zbot 187 0.003 0.619 VBS/VBSWG 180 0.003 0.622 W95/CIH 179 0.003 0.625 AntiCMOS 176 0.003 0.628 X97M/Divi 170 0.003 0.631 W32/Magistr 165 0.003 0.634 W97M/Groov 163 0.003 0.637 W32/Zafi 162 0.003 0.64 W32/Elkern 153 0.002 0.642 EXE_Bug 153 0.002 0.644 W32/Spybot 150 0.002 0.646 Empire 146 0.002 0.648 W32/Nimda 143 0.002 0.65 W32/Nachi 139 0.002 0.652 X97M/Barisada 138 0.002 0.654 W32/MyLife 135 0.002 0.656 Cascade 134 0.002 0.658 W32/Parite 133 0.002 0.66 W97M/VMPCK1 131 0.002 0.662 W97M/Pri 131 0.002 0.664 W32/Reatle 130 0.002 0.666 W97M/ColdApe 129 0.002 0.668 W32/Vanbot 128 0.002 0.67 WM/Concept 127 0.002 0.672 Yankee Doodle 125 0.002 0.674 W32/Fujacks 123 0.002 0.676 W32/Locksky 122 0.002 0.678 W32/Kriz 122 0.002 0.68 One_Half 122 0.002 0.682 W32/Bobax 121 0.002 0.684 W32/Virut 119 0.002 0.686 W97M/Opey 118 0.002 0.688 W32/Wootbot 117 0.002 0.69 W32/BugBear 115 0.002 0.692 Parity_Boot 115 0.002 0.694 W32/BadTrans 111 0.002 0.696 W97M/Eight941 106 0.002 0.698 Flip 105 0.002 0.7 W97M/Myna 103 0.002 0.702 W32/Slenfbot 103 0.002 0.704 Stealth_Boot 103 0.002 0.706 Ripper 103 0.002 0.708 AntiEXE 103 0.002 0.71 W32/Funlove 102 0.002 0.712
0
800
1600
2400
3200
4000
4800
5600
6400
7200
8000
W32
/Myt
ob
W
32/O
nlin
egam
es W
32/S
db
ot
W
32/B
agle
W32
/Aut
orun
W32
/Net
sky
W32
/Rb
ot
W32
/Op
aser
v
W32
/Myd
oom
W32
/Lov
gate
W32
/Irc
bot
Sto
ned
W
32/K
oob
face
W
32/M
agan
ia
W
32/S
trat
ion
W
32/A
gob
ot
W
32/S
ober
WM
W
32/K
orgo
W32
/Mim
ail
X
97M
/Lar
oux
W
97M
/Mar
ker
W
32/A
gent
W32
/Ron
tokb
ro
W32
/Yah
a
W
32/V
aklik
W32
/Aut
oit
W97
M/E
than
W32
/Kle
z
W
32/A
rese
s
W
97M
/Thu
s
W
32/V
B
Jer
usal
em
W
32/L
ooke
d
W
32/S
obig
W32
/Hyb
ris
W
97M
/Cla
ss
W
32/D
umar
u
W
32/S
asse
r
X
M/L
arou
x
W
32/C
onfic
ker
V
BS
/Lov
eLet
ter
For
m
W
32/F
eeb
s
W
32/M
ywife
W32
/Bag
z
W
97M
/Mel
issa
W
32/B
last
er
W
M/W
azzu
W
32/Z
bot
V
BS
/VB
SW
G
W
95/C
IH
Ant
iCM
OS
X
97M
/Div
i
W
32/M
agis
tr
W
97M
/Gro
ov
W
32/Z
afi
W32
/Elk
ern
EX
E_B
ug
W32
/Sp
ybot
Em
pire
W
32/N
imd
a
W
32/N
achi
X97
M/B
aris
ada
W
32/M
yLife
Cas
cad
e
W32
/Par
ite
W
97M
/VM
PC
K1
W
97M
/Pri
W32
/Rea
tle
W
97M
/Col
dA
pe
W
32/V
anb
ot
W
M/C
once
pt
Yan
kee
Doo
dle
W
32/F
ujac
ks
W
32/L
ocks
ky
W
32/K
riz
One
_Hal
f
W
32/B
obax
W32
/Viru
t
W
97M
/Op
ey
W
32/W
ootb
ot
W
32/B
ugB
ear
P
arity
_Boo
t
W32
/Bad
Tran
s
W97
M/E
ight
941
F
lip
W
97M
/Myn
a
W
32/S
lenf
bot
S
teal
th_B
oot
R
ipp
er
Ant
iEX
E
W32
/Fun
love
Inci
den
ts in
volv
ed (a
bso
lute
num
ber
s)
20.00%
40.00%
60.00%
80.00%
W32
/Myt
ob
W
32/O
nlin
egam
es W
32/S
db
ot
W
32/B
agle
W32
/Aut
orun
W32
/Net
sky
W32
/Rb
ot
W32
/Op
aser
v
W32
/Myd
oom
W32
/Lov
gate
W32
/Irc
bot
Sto
ned
W
32/K
oob
face
W
32/M
agan
ia
W
32/S
trat
ion
W
32/A
gob
ot
W
32/S
ober
WM
W
32/K
orgo
W32
/Mim
ail
X
97M
/Lar
oux
W
97M
/Mar
ker
W
32/A
gent
W32
/Ron
tokb
ro
W32
/Yah
a
W
32/V
aklik
W32
/Aut
oit
W97
M/E
than
W32
/Kle
z
W
32/A
rese
s
W
97M
/Thu
s
W
32/V
B
Jer
usal
em
W
32/L
ooke
d
W
32/S
obig
W32
/Hyb
ris
W
97M
/Cla
ss
W
32/D
umar
u
W
32/S
asse
r
X
M/L
arou
x
W
32/C
onfic
ker
V
BS
/Lov
eLet
ter
For
m
W
32/F
eeb
s
W
32/M
ywife
W32
/Bag
z
W
97M
/Mel
issa
W
32/B
last
er
W
M/W
azzu
W
32/Z
bot
V
BS
/VB
SW
G
W
95/C
IH
Ant
iCM
OS
X
97M
/Div
i
W
32/M
agis
tr
W
97M
/Gro
ov
W
32/Z
afi
W32
/Elk
ern
EX
E_B
ug
W32
/Sp
ybot
Em
pire
W
32/N
imd
a
W
32/N
achi
X97
M/B
aris
ada
W
32/M
yLife
Cas
cad
e
W32
/Par
ite
W
97M
/VM
PC
K1
W
97M
/Pri
W32
/Rea
tle
W
97M
/Col
dA
pe
W
32/V
anb
ot
W
M/C
once
pt
Yan
kee
Doo
dle
W
32/F
ujac
ks
W
32/L
ocks
ky
W
32/K
riz
One
_Hal
f
W
32/B
obax
W32
/Viru
t
W
97M
/Op
ey
W
32/W
ootb
ot
W
32/B
ugB
ear
P
arity
_Boo
t
W32
/Bad
Tran
s
W97
M/E
ight
941
F
lip
W
97M
/Myn
a
W
32/S
lenf
bot
S
teal
th_B
oot
R
ipp
er
Ant
iEX
E
W32
/Fun
love
Inci
den
ts in
volv
ed (p
erce
ntag
e)
Top malware threat Cumulative sum of top threats
Figure 4: Top family per month.
6
Jul1993 104 104 40 38.46 10Sep1993 66 170 30 45.45 10Nov1993 71 241 32 45.07 10Dec1993 76 317 34 44.74 10Feb1994 92 409 37 40.22 10Mar1994 88 497 37 42.05 10Jul1994 90 587 35 38.89 10Aug1994 90 677 33 36.67 10Sep1994 100 777 36 36.00 10Jan1995 106 883 36 33.96 10Feb1995 106 989 36 33.96 10May1995 124 1113 42 33.87 10Jun1995 162 1275 42 25.93 10Jul1995 173 1448 45 26.01 10Aug1995 183 1631 47 25.68 10Sep1995 182 1813 47 25.82 10Oct1995 190 2003 47 24.74 10Nov1995 179 2182 45 25.14 10Jan1996 183 2365 46 25.14 10Feb1996 184 2549 45 24.46 10Mar1996 189 2738 45 23.81 10May1996 194 2932 45 23.20 10Jun1996 202 3134 46 22.77 10Jul1996 198 3332 42 21.21 10Sep1996 212 3544 44 20.75 10Oct1996 223 3767 55 24.66 10Dec1996 234 4001 64 27.35 10Feb1997 239 4240 68 28.45 10Mar1997 240 4480 70 29.17 10May1997 249 4729 76 30.52 10Jul1997 274 5003 93 33.94 10Aug1997 267 5270 94 35.21 10Sep1997 267 5537 97 36.33 10Oct1997 267 5804 99 37.08 10Nov1997 273 6077 102 37.36 10Dec1997 256 6333 107 41.80 10Jan1998 258 6591 108 41.86 10Feb1998 258 6849 108 41.86 10Mar1998 260 7109 51 19.62 10Apr1998 262 7371 53 20.23 10May1998 262 7633 53 20.23 10Jun1998 257 7890 53 20.62 10Jul1998 263 8153 54 20.53 10Aug1998 255 8408 51 20.00 10Oct1998 252 8660 47 18.65 10Dec1998 266 8926 52 19.55 10Jan1999 139 9065 34 24.46 10Feb1999 145 9210 35 24.14 10Mar1999 146 9356 34 23.29 10Apr1999 153 9509 34 22.22 10May1999 151 9660 36 23.84 10Jun1999 148 9808 38 25.68 10Jul1999 132 9940 37 28.03 10Aug1999 136 10076 37 27.21 10Sep1999 148 10224 43 29.05 10Oct1999 159 10383 50 31.45 10Nov1999 163 10546 55 33.74 10Dec1999 168 10714 58 34.52 10Jan2000 175 10889 59 33.71 10Feb2000 182 11071 60 32.97 10Apr2000 202 11273 65 32.18 10May2000 204 11477 68 33.33 10Jun2000 206 11683 68 33.01 10Jul2000 217 11900 70 32.26 10Aug2000 215 12115 68 31.63 10Sep2000 214 12329 67 31.31 10Oct2000 213 12542 68 31.92 10Nov2000 220 12762 65 29.55 10Dec2000 232 12994 67 28.88 10Jan2001 228 13222 65 28.51 10Feb2001 230 13452 64 27.83 10Mar2001 225 13677 60 26.67 10Apr2001 222 13899 59 26.58 10May2001 221 14120 58 26.24 10Jun2001 214 14334 56 26.17 10Jul2001 213 14547 56 26.29 10Aug2001 208 14755 52 25.00 10Oct2001 201 14956 51 25.37 10Nov2001 197 15153 47 23.86 10Dec2001 199 15352 46 23.12 10Jan2002 198 15550 44 22.22 10Feb2002 201 15751 44 21.89 10Mar2002 199 15950 47 23.62 10Apr2002 203 16153 47 23.15 10May2002 204 16357 47 23.04 10Jun2002 207 16564 50 24.15 10Jul2002 209 16773 51 24.40 10Aug2002 203 16976 49 24.14 10Sep2002 198 17174 48 24.24 10Oct2002 201 17375 48 23.88 10Nov2002 195 17570 49 25.13 10Dec2002 196 17766 49 25.00 10Jan2003 205 17971 55 26.83 10Feb2003 203 18174 56 27.59 10Mar2003 202 18376 56 27.72 10Apr2003 212 18588 59 27.83 10May2003 210 18798 58 27.62 10Jun2003 229 19027 65 28.38 10Jul2003 234 19261 65 27.78 10Sep2003 244 19505 67 27.46 10Oct2003 255 19760 70 27.45 10Nov2003 253 20013 75 29.64 10Dec2003 250 20263 77 30.80 10Jan2004 261 20524 82 31.42 10Feb2004 269 20793 84 31.23 10Mar2004 301 21094 111 36.88 10Apr2004 314 21408 126 40.13 10May2004 319 21727 127 39.81 10Jun2004 327 22054 137 41.90 10Jul2004 345 22399 152 44.06 10Aug2004 364 22763 160 43.96 10Sep2004 361 23124 163 45.15 10Oct2004 393 23517 185 47.07 10Nov2004 390 23907 190 48.72 10Dec2004 414 24321 202 48.79 10Jan2005 399 24720 207 51.88 10Feb2005 413 25133 221 53.51 10Mar2005 475 25608 263 55.37 10Apr2005 504 26112 292 57.94 10May2005 569 26681 351 61.69 10Jun2005 633 27314 412 65.09 10Jul2005 651 27965 428 65.75 10Sep2005 705 28670 472 66.95 10Oct2005 719 29389 484 67.32 10Nov2005 740 30129 504 68.11 10Dec2005 761 30890 521 68.46 10Jan2006 804 31694 556 69.15 10Feb2006 731 32425 522 71.41 10Mar2006 743 33168 533 71.74 10Apr2006 667 33835 494 74.06 10May2006 667 34502 489 73.31 10Jun2006 656 35158 480 73.17 10Jul2006 692 35850 494 71.39 10Aug2006 721 36571 515 71.43 10Sep2006 729 37300 517 70.92 10Oct2006 780 38080 551 70.64 10Nov2006 774 38854 542 70.03 10Dec2006 792 39646 564 71.21 10Jan2007 797 40443 567 71.14 10Feb2007 761 41204 540 70.96 10Mar2007 766 41970 542 70.76 10Apr2007 604 42574 424 70.20 10May2007 539 43113 362 67.16 10Jun2007 525 43638 362 68.95 10Jul2007 557 44195 382 68.58 10Aug2007 580 44775 387 66.72 10Sep2007 589 45364 392 66.55 10Oct2007 583 45947 383 65.69 10Nov2007 538 46485 360 66.91 10Dec2007 519 47004 345 66.47 10Jan2008 590 47594 392 66.44 10Feb2008 626 48220 423 67.57 10Mar2008 638 48858 432 67.71 10Apr2008 678 49536 467 68.88 10May2008 764 50300 551 72.12 10Jun2008 841 51141 622 73.96 10Jul2008 855 51996 658 76.96 10Aug2008 879 52875 682 77.59 10Sep2008 762 53637 629 82.55 10Oct2008 431 54068 376 87.24 10Nov2008 378 54446 318 84.13 10Dec2008 297 54743 232 78.11 10Jan2009 402 55145 301 74.88 10Feb2009 461 55606 354 76.79 10Mar2009 450 56056 356 79.11 10Apr2009 472 56528 377 79.87 10May2009 677 57205 542 80.06 10Jun2009 753 57958 599 79.55 10Jul2009 953 58911 768 80.59 10Aug2009 922 59833 747 81.02 10Sep2009 986 60819 799 81.03 10Oct2009 1067 61886 836 78.35 10Nov2009 965 62851 754 78.13 10Dec2009 875 63726 685 78.29 10Jan2010 713 64439 552 77.42 10
28.85 533.33 532.39 532.89 530.43 530.68 528.89 526.67 526.00 524.53 524.53 525.81 519.75 519.65 519.13 519.23 518.42 518.99 518.58 518.48 517.99 517.53 517.33 515.66 515.09 518.83 521.79 523.01 523.75 525.30 528.83 529.96 531.09 531.46 531.87 535.94 536.05 536.43 513.85 514.50 514.50 514.79 514.83 514.12 513.10 513.91 517.27 517.24 516.44 515.69 517.22 518.92 520.45 519.12 520.95 523.90 523.93 523.81 523.43 522.53 522.77 524.02 523.30 522.58 521.86 521.50 521.60 519.09 518.53 517.98 517.39 516.44 516.67 516.74 516.82 516.43 515.38 515.42 514.21 514.07 513.13 512.94 514.07 513.79 513.24 514.01 513.88 514.29 514.65 514.43 514.87 514.29 516.59 517.73 518.32 518.87 519.05 519.65 519.23 519.26 519.61 521.74 522.80 523.37 522.68 526.25 528.98 528.84 529.36 530.72 529.95 531.02 530.03 530.26 530.19 532.33 532.93 536.00 537.30 542.71 547.71 548.85 551.35 552.02 553.24 553.88 555.35 556.50 557.07 559.67 558.62 559.30 557.66 557.14 556.65 555.13 554.65 555.68 555.71 555.85 555.74 555.96 551.95 553.71 553.32 551.72 551.10 550.09 550.19 548.75 548.64 549.84 548.90 550.88 556.41 561.24 562.69 563.03 571.00 577.26 571.16 560.94 557.21 559.87 561.11 561.02 560.86 562.55 565.58 568.11 568.26 565.04 564.46 562.63 558.77 5
0
25.00
50.00
75.00
100.00
Jul1
993
Dec
1993
Jul1
994
Jan1
995
Jun1
995
Sep
1995
Jan1
996
May
1996
Sep
1996
Feb
1997
Jul1
997
Oct
1997
Jan1
998
Ap
r199
8
Jul1
998
Dec
1998
Mar
1999
Jun1
999
Sep
1999
Dec
1999
Ap
r200
0
Jul2
000
Oct
2000
Jan2
001
Ap
r200
1
Jul2
001
Nov
2001
Feb
2002
May
2002
Aug
2002
Nov
2002
Feb
2003
May
2003
Sep
2003
Dec
2003
Mar
2004
Jun2
004
Sep
2004
Dec
2004
Mar
2005
Jun2
005
Oct
2005
Jan2
006
Ap
r200
6
Jul2
006
Oct
2006
Jan2
007
Ap
r200
7
Jul2
007
Oct
2007
Jan2
008
Ap
r200
8
Jul2
008
Oct
2008
Jan2
009
Ap
r200
9
Jul2
009
Oct
2009
Unt
itled
3
Chart 2
%
Top 10 Malware Families Top 5 Malware FamiliesTop 1 Malware Families Top 3 Malware Families
11.54 113.64 114.08 115.79 115.22 114.77 114.44 113.33 114.00 113.21 113.21 114.52 111.73 111.56 110.93 110.99 110.53 111.17 110.93 110.87 110.58 110.31 110.40 18.59 18.02 17.62 19.40 1
10.88 111.67 113.65 117.88 119.10 120.60 120.97 121.61 124.61 124.42 125.19 15.77 15.73 15.73 15.84 15.70 15.10 14.76 14.51 15.04 14.83 14.79 14.58 14.64 16.08 17.58 17.35 17.43 18.18 17.98 17.14 16.86 16.59 16.44 16.86 16.80 16.91 16.98 17.01 17.04 15.91 15.60 15.26 14.78 14.00 14.05 14.07 13.74 14.69 13.85 13.98 13.55 13.52 13.54 13.48 13.52 13.45 13.43 13.38 13.35 13.45 13.54 13.48 13.59 13.57 14.88 15.42 16.44 16.60 17.14 16.99 16.84 16.97 18.24 18.70 19.20 18.05 17.81 16.98 17.32 17.52 17.65 17.25 17.14 17.48 18.14 18.21 17.73 19.02 18.72 1
11.37 111.71 113.53 121.33 122.58 126.24 127.12 128.92 129.57 129.35 133.11 133.11 137.63 136.88 138.26 136.85 136.62 136.21 135.26 135.14 134.22 134.00 133.51 133.42 132.78 126.16 127.24 125.67 124.66 123.43 123.50 121.56 120.42 117.97 116.93 114.11 113.27 116.88 124.26 128.30 130.15 136.22 135.50 125.93 134.68 128.61 123.21 126.44 126.27 123.19 121.38 118.68 117.35 118.05 116.87 116.48 115.43 114.31 1
24.04 327.27 326.76 327.63 326.09 326.14 324.44 322.22 322.00 320.75 320.75 321.77 316.67 316.18 315.85 315.93 315.26 315.64 315.30 315.22 314.81 314.43 314.36 312.63 312.26 316.14 319.23 320.50 321.25 322.89 326.28 327.34 328.46 328.84 329.30 332.42 332.17 332.95 310.38 311.07 311.07 311.28 311.03 310.59 310.32 310.15 312.95 312.41 311.64 311.11 312.58 313.51 315.91 314.71 315.54 318.24 317.79 317.26 317.14 315.93 315.84 317.16 316.50 316.13 315.35 315.89 315.96 313.64 313.36 313.16 312.61 311.56 311.26 311.31 311.21 311.74 310.58 310.45 39.14 39.55 38.59 38.46 39.05 38.87 38.33 39.18 39.09 39.36 39.60 39.45 39.74 39.18 3
11.71 312.81 313.37 314.15 314.29 315.28 314.96 314.75 315.69 316.21 317.20 317.24 316.73 317.94 320.38 320.38 319.88 321.16 320.60 321.05 320.87 321.03 320.05 321.80 321.55 325.89 326.19 332.51 338.23 339.63 342.55 343.39 344.86 345.47 345.77 348.70 349.39 351.27 350.22 351.37 349.86 349.24 348.83 347.82 347.29 347.98 348.06 347.57 347.39 347.19 341.74 342.29 342.55 341.38 341.43 341.34 340.71 339.11 338.64 338.34 336.05 335.10 338.74 344.83 348.42 349.83 359.84 370.53 362.96 352.19 346.02 349.24 350.00 349.79 349.04 348.61 348.79 350.54 350.91 347.61 346.74 343.77 340.81 3
0
17500
35000
52500
70000
Jul1
993
Dec
1993
Jul1
994
Jan1
995
Jun1
995
Sep
1995
Jan1
996
May
1996
Sep
1996
Feb
1997
Jul1
997
Oct
1997
Jan1
998
Ap
r199
8
Jul1
998
Dec
1998
Mar
1999
Jun1
999
Sep
1999
Dec
1999
Ap
r200
0
Jul2
000
Oct
2000
Jan2
001
Ap
r200
1
Jul2
001
Nov
2001
Feb
2002
May
2002
Aug
2002
Nov
2002
Feb
2003
May
2003
Sep
2003
Dec
2003
Mar
2004
Jun2
004
Sep
2004
Dec
2004
Mar
2005
Jun2
005
Oct
2005
Jan2
006
Ap
r200
6
Jul2
006
Oct
2006
Jan2
007
Ap
r200
7
Jul2
007
Oct
2007
Jan2
008
Ap
r200
8
Jul2
008
Oct
2008
Jan2
009
Ap
r200
9
Jul2
009
Oct
2009
Jan2
010
Mal
war
e in
cid
ents
0
375
750
1125
1500
Jul1
993
Dec
1993
Jul1
994
Jan1
995
Jun1
995
Sep
1995
Jan1
996
May
1996
Sep
1996
Feb
1997
Jul1
997
Oct
1997
Jan1
998
Ap
r199
8
Jul1
998
Dec
1998
Mar
1999
Jun1
999
Sep
1999
Dec
1999
Ap
r200
0
Jul2
000
Oct
2000
Jan2
001
Ap
r200
1
Jul2
001
Nov
2001
Feb
2002
May
2002
Aug
2002
Nov
2002
Feb
2003
May
2003
Sep
2003
Dec
2003
Mar
2004
Jun2
004
Sep
2004
Dec
2004
Mar
2005
Jun2
005
Oct
2005
Jan2
006
Ap
r200
6
Jul2
006
Oct
2006
Jan2
007
Ap
r200
7
Jul2
007
Oct
2007
Jan2
008
Ap
r200
8
Jul2
008
Oct
2008
Jan2
009
Ap
r200
9
Jul2
009
Oct
2009
Jan2
010
Mal
war
e in
cid
ents
Figure 5: Number of incidents per month.
characteristics of computer virology. Our intention is to work in the future towardsthe prediction of the imminent threats by implementing econometric models andtechnical analysis on security data. Specifically, known models such as ar, ma andarma could be used to predict future threats depending on past data by findingself-similarities and periodicity.
The latest highly sophisticated malcode of the largest malware families indi-cates an escalation of the security arms race between malware writers and securityresearchers. The analysis of the WildList data emphasizes on the fact that mal-ware writing is not any longer a trivial task. Gone are the days when disgruntledteenagers, activists or college dropouts could wreak havoc using simplistic program-ing tricks and earn their 15 minutes of fame. Competent malware should be able tomutate rapidly so as to propagate sufficiently and overcome the creation of effectivesignatures and evade other security mechanisms. The available data on the otherhand signalize that the spreading of a virus or a worm in a wide scale is far froma trivial task. Therefore from a malware perspective it is better to work on a wellmaintained malicious code base than to develop new virus strain from scratch. Se-curity professionals might found more promising an approach which prioritizes andconcentrates their efforts against the most dominant malware phylogenies ratherthan trying to neutralize an overwhelming number of threats. For that reason if theavailable recourses are not adequate, it would be more productive for the researchcommunity to focus on the largest malware families, to monitor closely all the re-lated developments and disseminate as fast as possible any findings of this activity.For years malcode developers exploit the monoculture weakness of modern it inorder to perform their vicious acts. By turning our attention to the most commonand widely used malcode, we can exploit their tactics for our benefit.
References
[1] D. Ferbrache. A Pathology of Computer Viruses. Springer-Verlag, NY, USA,1992.
7
[2] P. Szor. The Art of Computer Virus Research and Defense. Addison-Wesley,Upper Saddle River, NJ, February 2005.
[3] E. Skoudis. Malware: Fighting Malicious Code. Computer Networking andDistributed Systems. Prentice Hall, NJ, USA, 6th edition, 2004.
[4] F. Cohen. Computer Viruses: Theory and Experiments. In Proceedings of the7th national security conference, pages 240–263, September 1984.
[5] F. Cohen. Computer Viruses – Theory and Experiments. Computers andSecurity, 6:22–35, 1987.
[6] F. Cohen. A Short Course on Computer Viruses. Wiley Professional Comput-ing. Wiley, Canada, 1994.
[7] R. Anderson, R. Bohme, R. Clayton, and T. Moore. Security Economics and theInternal Market. Technical report, European Network and information SecurityAgency (ENISA), January 2008.
[8] D. Turner, J. Blackbird, M. K. Low, T. Adams, David McKinney, S. Entwisle,M. Laucht C. Wueest, P. Wood, D. Bleaken, G. Ahmad, D. Kemp, and A. Sam-nani. Symantec Global Internet Security Threat Report. Trends for 2008. Tech-nical report, Symantec, April 2009.
[9] S. Forrest, S. Hofmeyr, and A. Somayaji. Computer Immunology. Communi-cations of the ACM, 40(10):88–96, 1997.
[10] V. Vlachos, D. Spinellis, and S. Androutsellis-Theotokis. Biological Aspectsof Computer Virology. Lecture Notes of the Institute for Computer Sciences,Social Informatics and Telecommunications Engineering, 26:209–219, January2010.
[11] J. Li and P. Knickerbocker. Functional Similarities Between Computer Wormsand Bilogical Pathogens. Computers & Security, 26:338–347, 2007.
[12] D. Geer. Monoculture on the Back of the Envelope. ;login, 30(6):6–8, December2005.
[13] G. Goth. Addressing the Monoculture. IEEE Security & Privacy, 1(6):8–10,December 2003.
[14] D. Geer, R. Bace, P. Gutmann, P. Metzger, C. P. Pfleeger, J. S. Quarterman,and B. Schneier. Cyber Insecurity: The Cost of Monopoly. Technical report,Computer & Communications Industry Association, 2003.
[15] D. Geer. The Evolution of Security. ACM Queue, pages 31–35, April 2007.
[16] A. Somayaji, S. Hofmeyr, and S. Forrest. Principles of a Computer ImmuneSystem. In Meeting on New Security Paradigms, 23-26 Sept. 1997, Langdale,UK, pages 75–82. New York, NY, USA: ACM, 1998, 1997.
8
[17] K. Anagnostakis, M. Greenwald, S. Ioannidis, A. Keromytis, and D. Li. ACooperative Immunization System for an Untrusting Internet. In Proceedingsof the 11th IEEE International Conference on Networks (ICON) 2003, pages403–408, October 2003.
[18] S. Sidiroglou and A. Keromytis. A Network Worm Vaccine Architecture. InIEEE International Workshops on Enabling Technologies: Infrastructure forCollaborative Enterprises (WETICE), Workshop on Enterprise Security, Linz,Austria., June 2003.
[19] MedicineNet. Definition of Phylogenetics. http://www.medterms.com/script/main/art.asp?articlekey=39615, 2010. (Accessed March 2010).
[20] F. de la Cuadra. The Geneology of Malware. Network Security, pages 17–20,April 2007.
[21] M. Hayes, A. Walenstein, and A. Lakhotia. Evaluation of Malware PhylogenyModelling Systems Using Automated Variant Generation. Journal in ComputerVirology, 5(4):335–343, November 2009.
[22] Md. Karim, Andrew Walenstein, Arun Lakhotia, and Laxmi Parida. MalwarePhylogeny Using Permutations of Code. Journal in Computer Virology, 1(1):13–23, November 2005.
[23] A. K. Seewald. Towards Automating Malware Classification and Character-ization. In Konferenzband der 4. Jahrestagung des Fachbereichs Sicherheitder Gesellschaft fur Informatik (german-language proceedings), pages 291–302,Saarbrucken, April 2008.
[24] S. Gordon. What is Wild? In Proceedings of the 20th National InformationSystems Security Conference, 1997.
[25] P. Bustamante. The Disconnect Between the WildList and Reality. Technicalreport, PandaLabs, January 2007.
[26] A. Marx and F. Dessman. The WildList is Dead, Long Live the WildList! InVirus Bulletin Conference, pages 136–146, September 2007.
[27] The WildList Organization International. Wildlist. http://www.wildlist.org/WildList/201001.htm, 2010. (Accessed 2010).
[28] S. Gordon. Inside the Mind of Dark Avenger. In Virus News International,1993.
[29] S. Gordon. Generic Virus Writer. In 4th International Virus Bulletin Confer-ence, Jersey, UK, September 1994.
[30] S. Gordon. Generic Virus Writer II. In 6th International Virus Bulletin Con-ference, Brighton, UK, September 1996.
[31] S. Gordon. Understanding the adversary. IEEE Security & Privacy, 4(5):67–70,September 2006.
9
[32] C. Kanich, C. Kreibich, K. Levchenko, B. Enright, G. Voelker, V. Paxson, andS. Savage. Spamalytics: an empirical analysis of spam marketing conversion.Commun. ACM, 52(9):99–107, 2009.
10