Embed Size (px)
Citation preview
Physics of the Earth and Planetary Interiors 124 (2001) 81–93
On the features of the geodynamo following reversals orexcursions: by absolute geomagnetic paleointensity data
Avto Goguitchaichvili a,∗, Pierre Camps b, Jaime Urrutia-Fucugauchi a
a Instituto de Geofisica, Universidad Nacional Autónoma de México, Ciudad Universitaria, 04510 Mexico DF, Mexicob Laboratoire de Geophysique, Tectonique et Sedimentologie, CNRS and University of Montpellier 2, Case 060, 34095 Montpellier, France
Received 5 June 2000; received in revised form 12 October 2000; accepted 10 February 2001
Abstract
We carried out a Thellier paleointensity study of a ∼3.6 million year Pliocene geomagnetic excursion recorded in a lavaflow succession from southern Georgia (lesser Caucasus). Previous paleomagnetic study [Phys. Earth Planet. Int. 96 (1996)41] revealed that several consecutive lava flows record an intermediate polarity direction at the base of the section followedby a thick reverse polarity zone. Samples of 71 from 26 flows from both polarity zones were pre-selected for paleointensityexperiments because of their low viscosity index, stable remanent magnetisation and close to reversible continuous thermo-magnetic curves. Altogether 54 samples from 21 flows yielded reliable paleointensity estimates. The mean paleointensity ofthe intermediate field is 7.8 ± 2.4 �T (three flows). The stable polarity paleointensity is higher with a mean 24.2 ± 8.2 �T(15 flows), which corresponds to a mean virtual dipole moment (VDM) of 4.6 ± 1.8 × 10²² Am2. This value is significantlylower than the average Pliocene geomagnetic dipole moment and post-intermediate dipole moments recorded in volcanicsequences at Hawaii (∼4 Ma) and Steens mountain (∼16.2 Ma). However, our results are quite similar to the post-intermediatefield recorded in Iceland during the Gauss–Matuyama reversal. These results suggest that the regime of the geodynamo fol-lowing reversals or excursions may vary significantly from one case to the next without any apparent systematic features.© 2001 Elsevier Science B.V. All rights reserved.
Keywords: Paleointensity; Geomagnetic excursion; Geodynamo; Lesser Caucasus; Pliocene
1. Introduction
The short periods (103–8 × 10³ years after Merrilland McFadden (1999) and ≥3 × 10³ years afterGubbins (1999)) during which the geomagnetic fieldchanges polarity are of considerable interest in ourunderstanding of the physical processes in the earthliquid core that generate the field. Detailed studies of
∗ Corresponding author. Tel.: +52-56-22-42-30;fax: +52-55-50-24-86.E-mail address: [email protected](A. Goguitchaichvili).
geomagnetic transitions and excursions have also re-vealed new features concerning possible core-mantleinteractions (Hoffman, 1992). The virtual geomagneticpoles (VGP) recorded by sedimentary rocks show theexistence of two opposite preferred longitude sectors(Laj et al., 1991). In contrast, volcanic rocks, whichare generally more reliable field recorders, indicatea uniform longitudinal distribution of VGPs (Prévotand Camps, 1993).
Geomagnetic field intensity should be a decisiveparameter to better understand the field behaviourduring and around reversals or excursions (Camps andPrévot, 1996). Following Glatzmaier et al. (1999) and
0031-9201/01/$ – see front matter © 2001 Elsevier Science B.V. All rights reserved.PII: S0 0 3 1 -9 2 01 (01 )00190 -X
82 A. Goguitchaichvili et al. / Physics of the Earth and Planetary Interiors 124 (2001) 81–93
Coe et al. (2000), paleointensity during and aroundtransitions is a fundamental constraint on recent nu-merical models that promise to provide unprecedentedinsight into the operation of the geodynamo. However,reliable absolute paleointensity is generally muchmore difficult to obtain than directional data, evenwhen the most reliable method (Thellier and Thellier,1959) is used. This is mainly because only volcanicrocks which satisfy some specific rock-magnetic cri-teria can be used for absolute intensity determination(Kosterov and Prévot, 1999). Judging from scantavailable data, there is now a general agreement thatthe intermediate polarity geomagnetic field is largelyreduced with respect to the stable, normal or reversedfield (Goguitchaichvili et al., 1999; Quidelleur andValet, 1996; Chauvin et al., 1990; Prévot et al., 1985).Bogue and Paul (1993), based on the study of about4 Ma volcanic sequence in Hawaii, proposed that thestrength of paleofield following reversals may be un-usually strong, probably indicating a prolonged periodof some ‘perturbed’ state of the geodynamo followingpolarity transitions. A somewhat similar conclusionwas reached by Valet and Maynadier (1993) analysingrelative paleointensity data. In this paper we presentthe results of Thellier–Thellier paleointensity deter-minations from the ∼3.6 Ma (Camps et al., 1996)geomagnetic excursion recorded in the southernGeorgia volcanic succession. The volcanic sequencerepresents a relatively rapid eruption rate and hence ahigh temporal resolution. Camps et al. (1996) carriedout a paleointensity study on the lower Akhalkhalakiunits. However, these results should be consideredas preliminary, because (1) no pre-selection of thesamples was made before undertaking paleointen-sity experiments; (2) no control heatings (so-called‘pTRM checks’) were performed during the measure-ments; (3) experiments were carried out in air, whichcan produce some magnetic changes at moderate/hightemperatures; (4) it is hard to estimate the reliabilityof these data, because no information about direc-tional changes during paleointensity experiments isavailable; (5) obtained results are of bad technicalquality — only 12 specimens out of 40 reported, yielda quality factor (Coe et al., 1978) above 5; (6) data for12 lava flows are based on only single determinations.
One of the main goals of the present study wasto supersede the paleoinetensity estimates of Campset al. (1996), thought to be of poor quality, by more
reliable determinations. In the present study a consid-erable effort was spent on the strict pre-selection of thesamples, based on new rock-magnetic measurements.All heatings (including various control heatings todetect possible magnetic/chemical changes due to theheating) were made in vacuum better than 10−4 mbar.Obtained results are of high technical quality and com-parable to other paleointensity data recently obtainedon young lava flows. The natural remanent mag-netisation (NRM) fractions used for paleointensitydetermination range from 28 to 87% and the qualityfactors (Coe et al., 1978) vary between 3.7 and 29.8,being normally greater than 5. Thus, present resultsshould be considered as more reliable than previouslyreported by Camps et al. (1996). Finally, we gath-ered previously reported detailed post-intermediatepaleofield records (Tanaka et al., 1995; Riisager andAbrahamsen, 2000; Prévot et al., 1985; Bogue andPaul, 1993) in order to obtain some constraints forthe functioning of the geodynamo following reversalsor excursions.
2. Geology and paleomagnetism
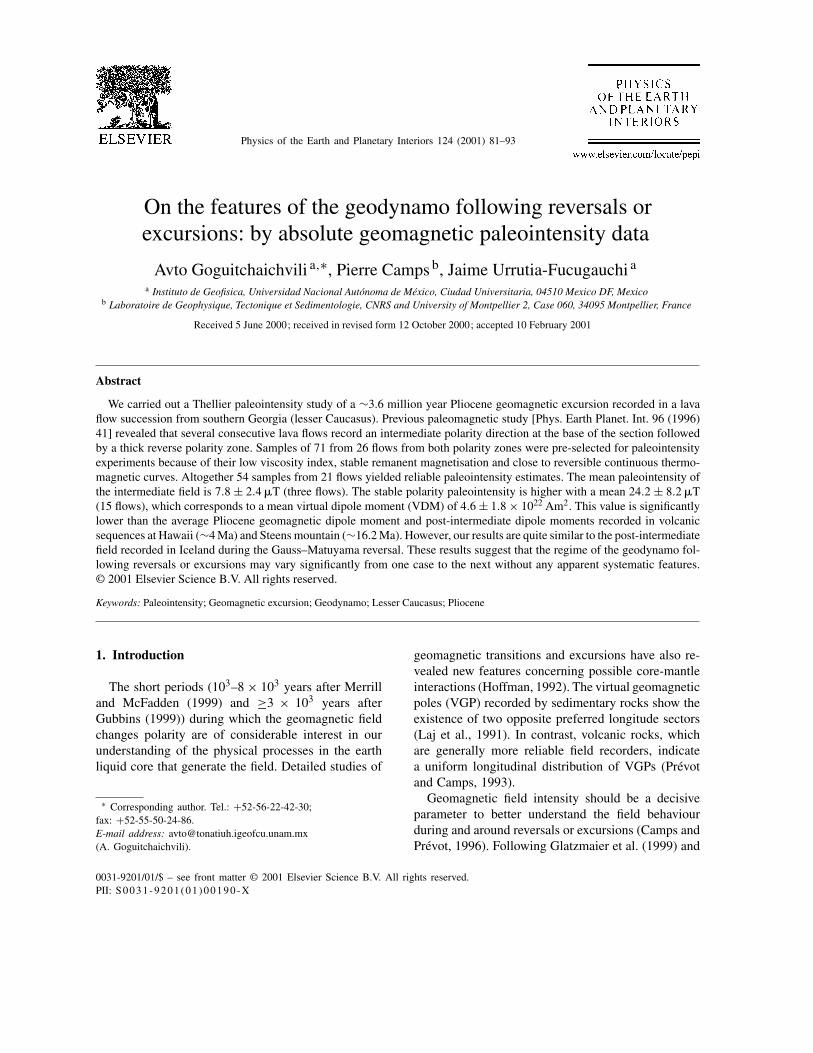
Alpine, late Miocene to Holocene compressiondue to the northern drift of the Arabian plate to-wards the stable Russian platform is responsible forthe relief of the great Caucasus. At the front of theArabian–Eurasian collision, lithospheric thinning dueto E–W extension linked to the opposite lateral ex-pulsion of the Anatolian and Iranian blocks is at theorigin of the volcanic activity in the lesser Caucasus(Rebai et al., 1993). Most of the volcanic activity is ofPliocene to Quaternary ages (Milanovski, 1968). TheAkhalkalaki volcanic area is located in the westernpart of the south Georgian volcanic province (Fig. 1).Camps et al. (1996) studied in detail this 250 m thickvolcanic sequence of some 63 lava flows. The studiedsite is located at 41◦28′37′′N latitude and 43◦22′51′′Elongitude, ∼1 km S. Se of the village of Thoki andnear the road from Aspindza to Akhalkalaki (Fig. 1a).The present paleointensity study was carried out onthe lower Akhalkalaki sequence (Fig. 1b, sections Wand Y), which overlies the Goderzi Miocene volcanictuffs. Based on two concordant Ar–Ar ages, Campset al. (1996) proposed an age of 3.60±0.06 Ma, as thebest estimate of the time of emplacement of the lower
A. Goguitchaichvili et al. / Physics of the Earth and Planetary Interiors 124 (2001) 81–93 83
Fig. 1. (a) Schematic geologic map showing the location of the Thoki site (modified from Camps et al., 1996). (b) Schematic cross-sectionshowing location of Y and W sections (also see text).
Akhalkalaki sequence. Upper Akhalkalaki sequence(section X) which were sampled from the bottom ofa paleovalley uphill (Fig. 1b) most probably wereemplaced in Holocene time.
Four directional groups (DGs after Mankinen et al.,1985) were identified from bottom to the upper partof the lower Akhalkalaki sequence by Camps et al.
(1996). The sequence starts with intermediate polar-ity flows (DG1, four flows) with mean VGP latitudeof 6.3◦ and VGP longitude of 349.9◦, followed byanother seven intermediate flows (DG2, mean VGPlatitude, 14◦). Next, 15 consecutive flows define DG3with mean VGP latitude of −55.1◦, which we assignto the already post-intermediate, reversed polarity
84 A. Goguitchaichvili et al. / Physics of the Earth and Planetary Interiors 124 (2001) 81–93
geomagnetic field. In this paper, we formally use aVGP cut-off angle of 45◦ to separate intermediate andstable regimes of geomagnetic field (McElhinny andMcFadden, 1997). The sequence is completed by 14flows (DG4, also see Table 2) with a mean VGPlatitude of −89.3◦. Because, the initial polarity ofthe geomagnetic event recorded in Thoki volcanicsuccession is not known, two possibilities may beinvoked: normal–transition–reverse (N–T–R) geo-magnetic transition or R–T–R excursion. If first caseis correct, Thoki geomagnetic event should corre-spond to either C2An·3n–C2An·2r (dated as 3.363million year in Huestis and Acton (1997) time scale)or C3n·1n–C2Ar (dated as 4.096 million year).Because, Thoki lavas are precisely dated at 3.60±0.06million year (see Camps et al., 1996), it is unlikelythat Thoki corresponds to a normal to reversedpolarity transition. The geomagnetic event recorded atThoki may correspond to some unspecified excursionwhich occurred during chron 2Ar of the Gilbert epoch(Camps et al., 1996; Goguitchaichvili et al., 1997).
3. Sample selection
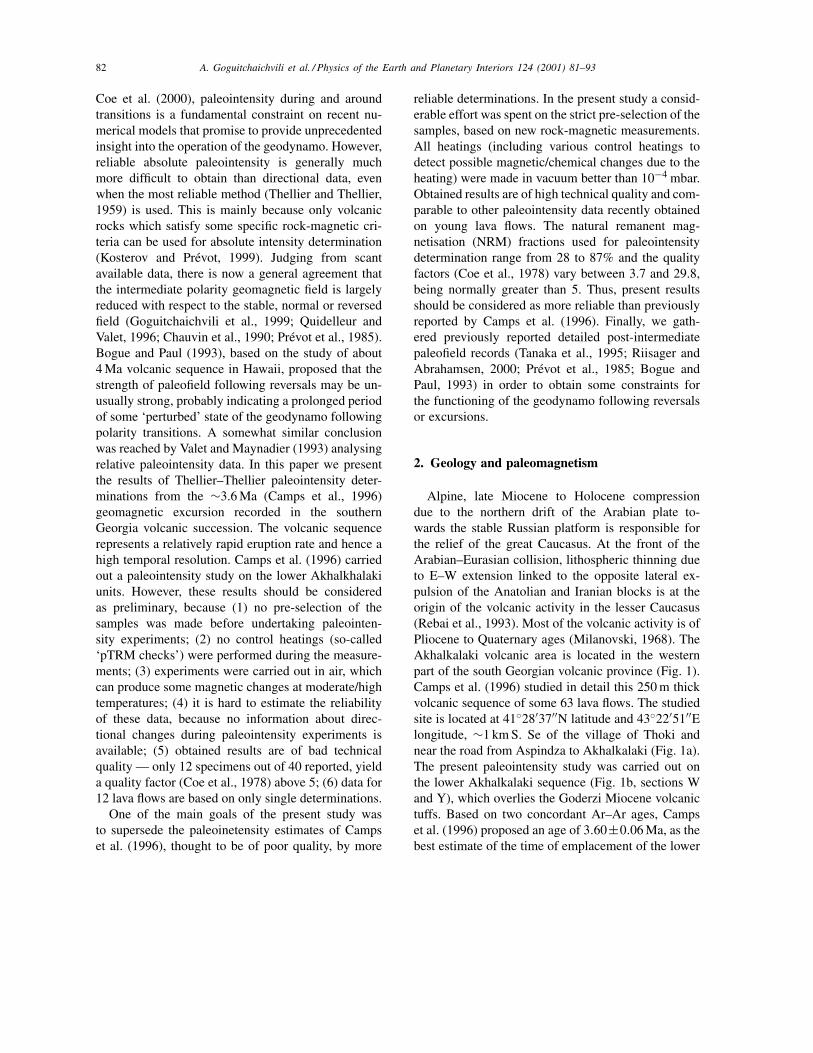
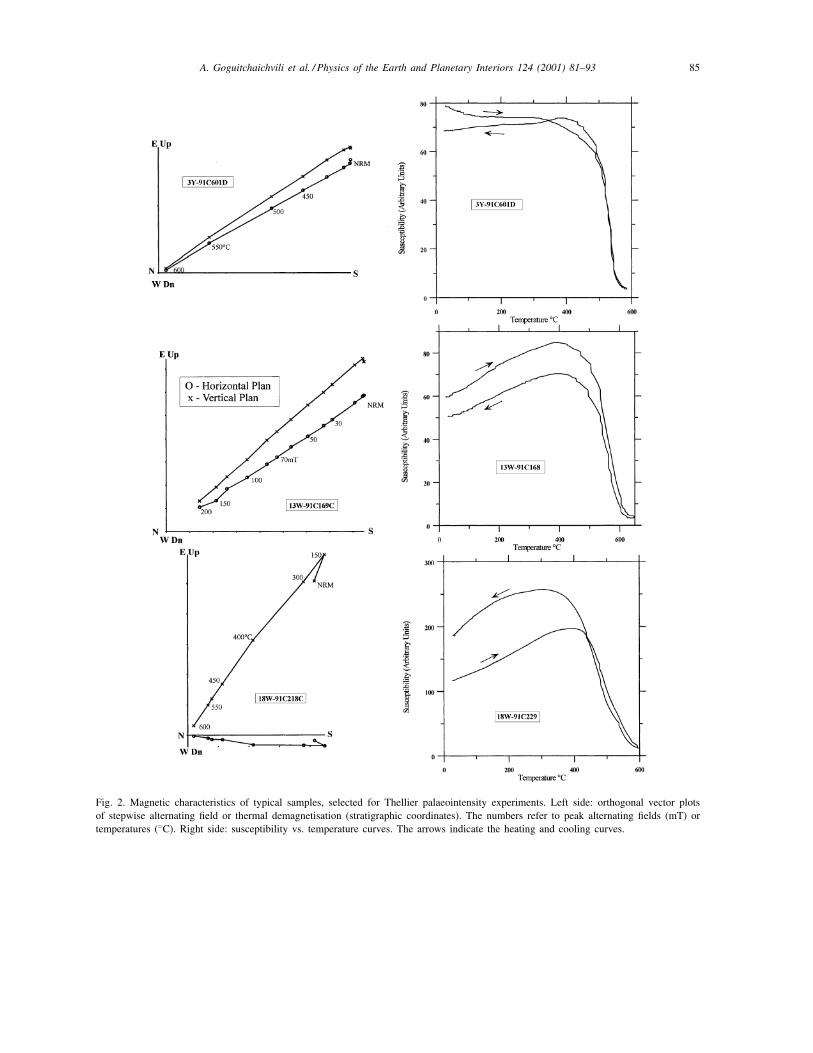
Pre-selection of the flows was mainly based on thedemagnetisation of NRM and temperature dependenceof initial magnetic susceptibility. Magnetic character-istics of typical samples selected for Thellier paleoin-tensity measurements are summarised in Fig. 2 andcould be described in the following way.
1. Samples do not present a big capacity for vis-cous remanence acquisition. Viscosity experiments(Prévot et al., 1983) provided viscosity indexesgenerally less than 5%, which are small enough toobtain precise measurements of the remanence dur-ing the process of thermal demagnetisation (Prévotet al., 1985).
2. Selected samples carry essentially a single andstable component magnetisation, observed uponalternating field treatment (Fig. 2). A generallyminor secondary component, probably of viscousorigin was present, but was easily removed. Themedian destructive fields (MDF) range mostly inthe 40–50 mT interval, suggesting the existence of‘small’ pseudo-single domain grains as remanencecarriers (Dunlop and Özdemir, 1997). Higher
coercivity components with MDF around 100 mT(Fig. 2, sample 91C169C) were systematicallyfound for site 13W. Continuous susceptibility ex-periments obtained on the same site (Fig. 2) yieldCurie temperatures (Curie temperatures were de-termined following the method of Prévot et al.(1983)) compatible to almost pure magnetite. Theseproperties may be interpreted as a predominanceof single-domain size magnetic grains of Ti-poortitanomagnetite or to mixture of single-domainand superparamagnetic grains, which are suit-able material for the Thellier paleointensitydetermination.
3. Low-field continuous susceptibility measurementsperformed in vacuum (using a Bartington suscepti-bility meter MS2 equipped with furnace) show thepresence of a single ferrimagnetic phase with Curietemperature compatible with Ti-poor titanomag-netite (Fig. 2). However, the cooling and heatingcurves are sometimes not perfectly reversible.
In all we selected for the paleointensity experiments71 samples, which belong to 26 lava flows having theabove-described magnetic characteristics.
4. Paleointensity determination
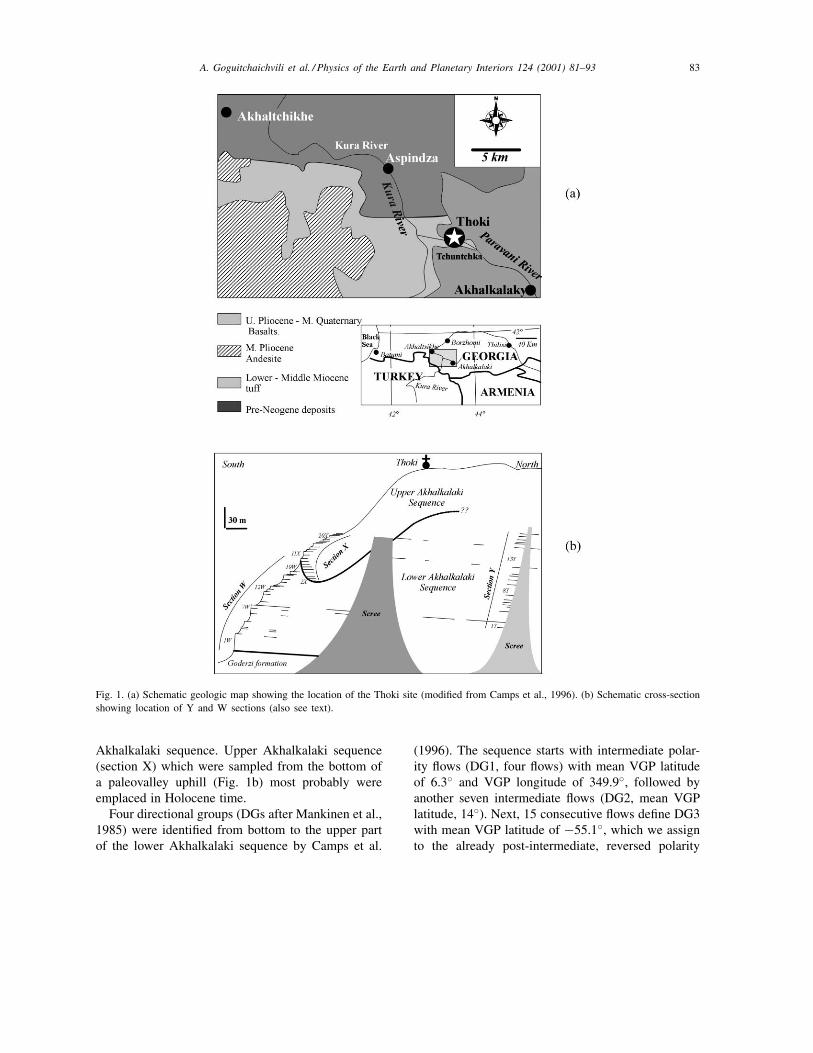
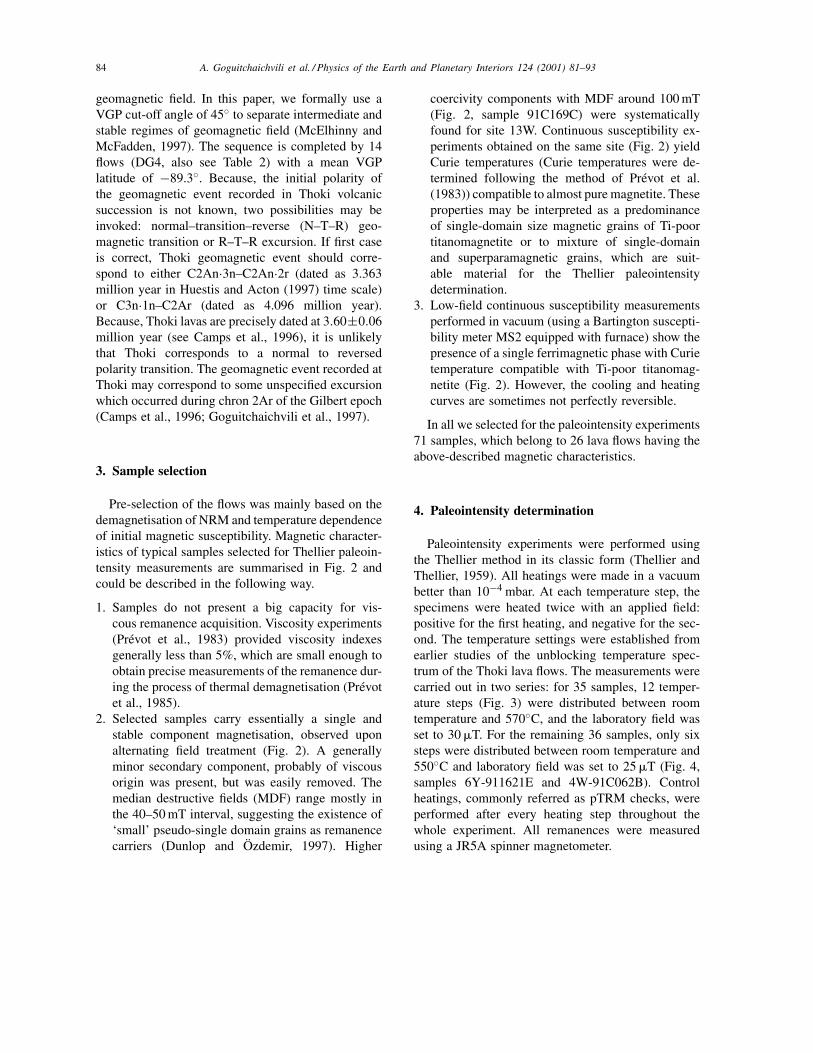
Paleointensity experiments were performed usingthe Thellier method in its classic form (Thellier andThellier, 1959). All heatings were made in a vacuumbetter than 10−4 mbar. At each temperature step, thespecimens were heated twice with an applied field:positive for the first heating, and negative for the sec-ond. The temperature settings were established fromearlier studies of the unblocking temperature spec-trum of the Thoki lava flows. The measurements werecarried out in two series: for 35 samples, 12 temper-ature steps (Fig. 3) were distributed between roomtemperature and 570◦C, and the laboratory field wasset to 30 �T. For the remaining 36 samples, only sixsteps were distributed between room temperature and550◦C and laboratory field was set to 25 �T (Fig. 4,samples 6Y-911621E and 4W-91C062B). Controlheatings, commonly referred as pTRM checks, wereperformed after every heating step throughout thewhole experiment. All remanences were measuredusing a JR5A spinner magnetometer.
A. Goguitchaichvili et al. / Physics of the Earth and Planetary Interiors 124 (2001) 81–93 85
Fig. 2. Magnetic characteristics of typical samples, selected for Thellier palaeointensity experiments. Left side: orthogonal vector plotsof stepwise alternating field or thermal demagnetisation (stratigraphic coordinates). The numbers refer to peak alternating fields (mT) ortemperatures (◦C). Right side: susceptibility vs. temperature curves. The arrows indicate the heating and cooling curves.
86 A. Goguitchaichvili et al. / Physics of the Earth and Planetary Interiors 124 (2001) 81–93
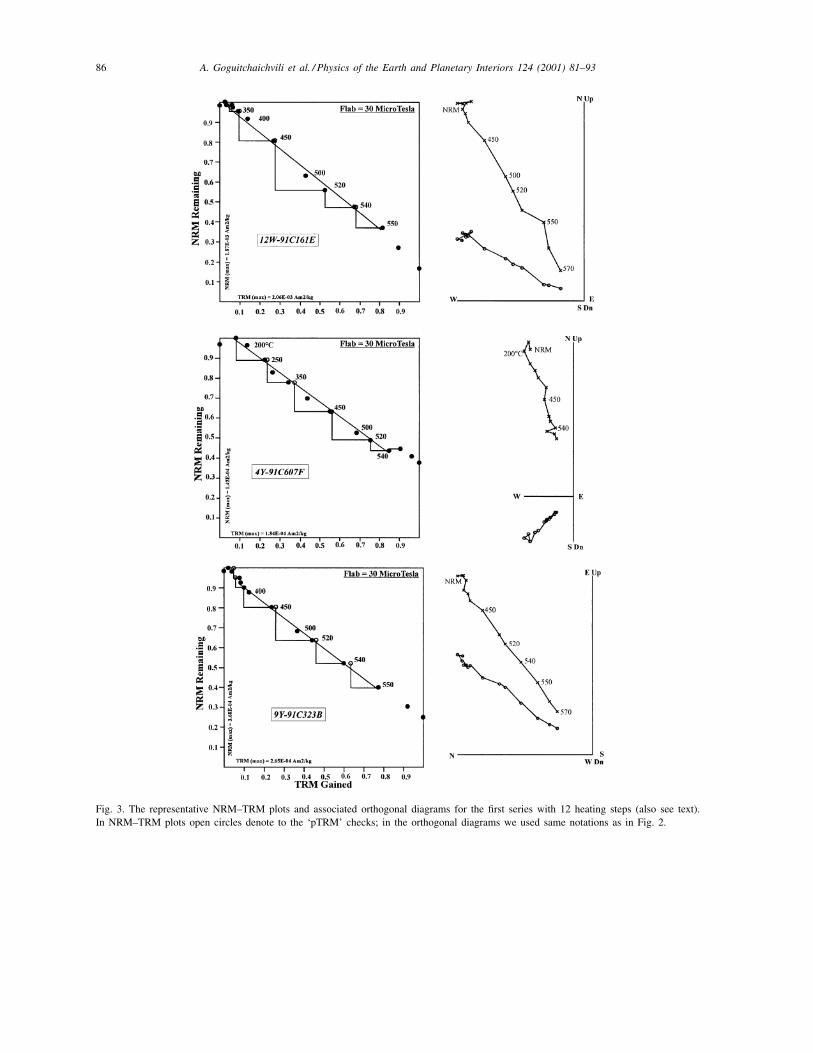
Fig. 3. The representative NRM–TRM plots and associated orthogonal diagrams for the first series with 12 heating steps (also see text).In NRM–TRM plots open circles denote to the ‘pTRM’ checks; in the orthogonal diagrams we used same notations as in Fig. 2.
A. Goguitchaichvili et al. / Physics of the Earth and Planetary Interiors 124 (2001) 81–93 87
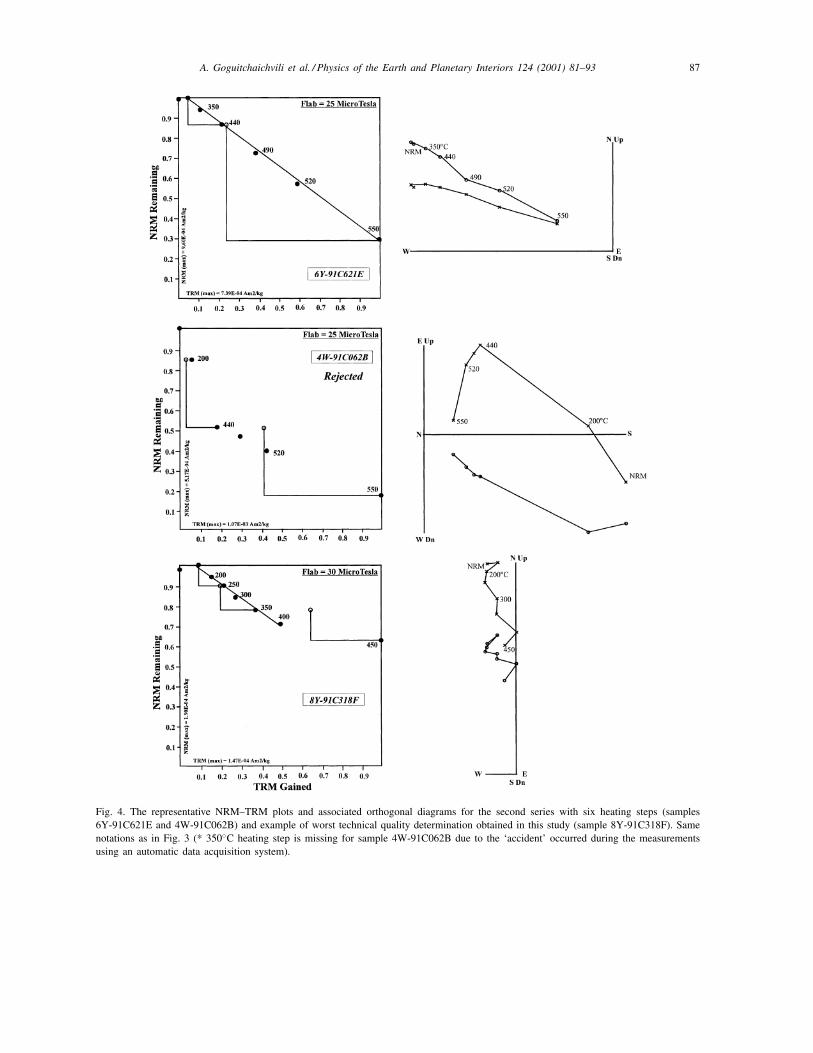
Fig. 4. The representative NRM–TRM plots and associated orthogonal diagrams for the second series with six heating steps (samples6Y-91C621E and 4W-91C062B) and example of worst technical quality determination obtained in this study (sample 8Y-91C318F). Samenotations as in Fig. 3 (* 350◦C heating step is missing for sample 4W-91C062B due to the ‘accident’ occurred during the measurementsusing an automatic data acquisition system).
88 A. Goguitchaichvili et al. / Physics of the Earth and Planetary Interiors 124 (2001) 81–93
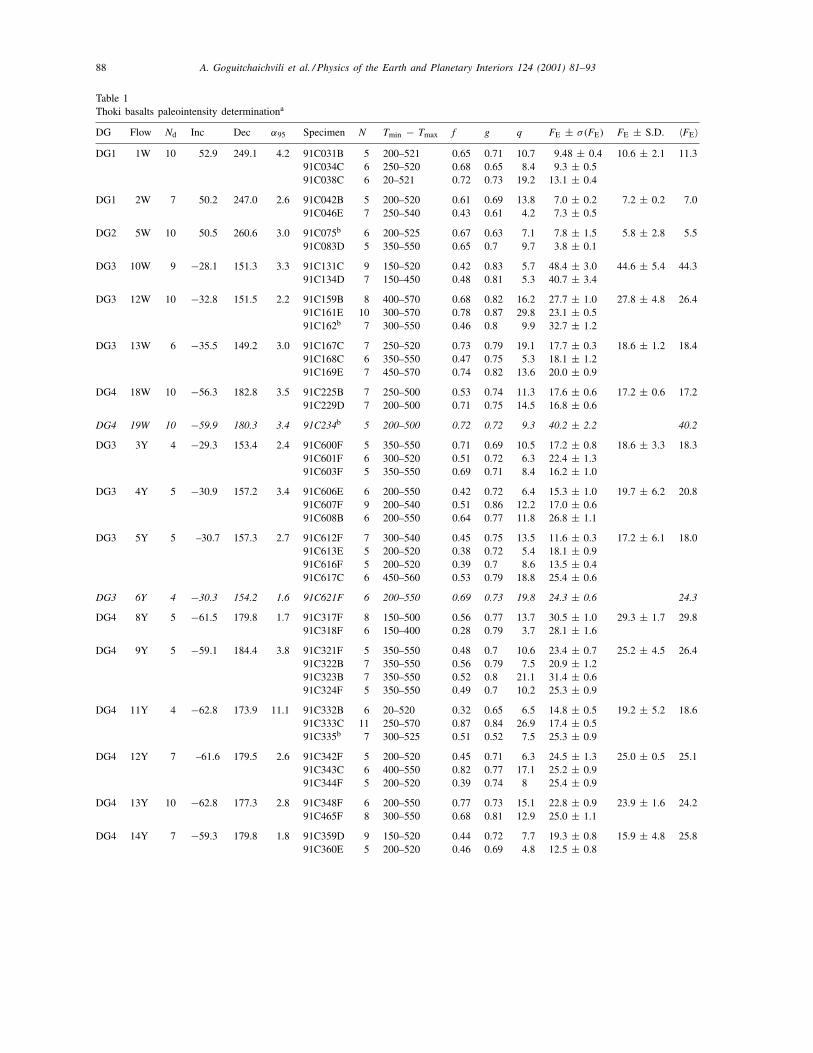
Table 1Thoki basalts paleointensity determinationa
DG Flow Nd Inc Dec α95 Specimen N Tmin − Tmax f g q FE ± σ (FE) FE ± S.D. 〈FE〉DG1 1W 10 52.9 249.1 4.2 91C031B 5 200–521 0.65 0.71 10.7 9.48 ± 0.4 10.6 ± 2.1 11.3
91C034C 6 250–520 0.68 0.65 8.4 9.3 ± 0.591C038C 6 20–521 0.72 0.73 19.2 13.1 ± 0.4
DG1 2W 7 50.2 247.0 2.6 91C042B 5 200–520 0.61 0.69 13.8 7.0 ± 0.2 7.2 ± 0.2 7.091C046E 7 250–540 0.43 0.61 4.2 7.3 ± 0.5
DG2 5W 10 50.5 260.6 3.0 91C075b 6 200–525 0.67 0.63 7.1 7.8 ± 1.5 5.8 ± 2.8 5.591C083D 5 350–550 0.65 0.7 9.7 3.8 ± 0.1
DG3 10W 9 −28.1 151.3 3.3 91C131C 9 150–520 0.42 0.83 5.7 48.4 ± 3.0 44.6 ± 5.4 44.391C134D 7 150–450 0.48 0.81 5.3 40.7 ± 3.4
DG3 12W 10 −32.8 151.5 2.2 91C159B 8 400–570 0.68 0.82 16.2 27.7 ± 1.0 27.8 ± 4.8 26.491C161E 10 300–570 0.78 0.87 29.8 23.1 ± 0.591C162b 7 300–550 0.46 0.8 9.9 32.7 ± 1.2
DG3 13W 6 −35.5 149.2 3.0 91C167C 7 250–520 0.73 0.79 19.1 17.7 ± 0.3 18.6 ± 1.2 18.491C168C 6 350–550 0.47 0.75 5.3 18.1 ± 1.291C169E 7 450–570 0.74 0.82 13.6 20.0 ± 0.9
DG4 18W 10 −56.3 182.8 3.5 91C225B 7 250–500 0.53 0.74 11.3 17.6 ± 0.6 17.2 ± 0.6 17.291C229D 7 200–500 0.71 0.75 14.5 16.8 ± 0.6
DG4 19W 10 −59.9 180.3 3.4 91C234b 5 200–500 0.72 0.72 9.3 40.2 ± 2.2 40.2
DG3 3Y 4 −29.3 153.4 2.4 91C600F 5 350–550 0.71 0.69 10.5 17.2 ± 0.8 18.6 ± 3.3 18.391C601F 6 300–520 0.51 0.72 6.3 22.4 ± 1.391C603F 5 350–550 0.69 0.71 8.4 16.2 ± 1.0
DG3 4Y 5 −30.9 157.2 3.4 91C606E 6 200–550 0.42 0.72 6.4 15.3 ± 1.0 19.7 ± 6.2 20.891C607F 9 200–540 0.51 0.86 12.2 17.0 ± 0.691C608B 6 200–550 0.64 0.77 11.8 26.8 ± 1.1
DG3 5Y 5 –30.7 157.3 2.7 91C612F 7 300–540 0.45 0.75 13.5 11.6 ± 0.3 17.2 ± 6.1 18.091C613E 5 200–520 0.38 0.72 5.4 18.1 ± 0.991C616F 5 200–520 0.39 0.7 8.6 13.5 ± 0.491C617C 6 450–560 0.53 0.79 18.8 25.4 ± 0.6
DG3 6Y 4 −30.3 154.2 1.6 91C621F 6 200–550 0.69 0.73 19.8 24.3 ± 0.6 24.3
DG4 8Y 5 −61.5 179.8 1.7 91C317F 8 150–500 0.56 0.77 13.7 30.5 ± 1.0 29.3 ± 1.7 29.891C318F 6 150–400 0.28 0.79 3.7 28.1 ± 1.6
DG4 9Y 5 −59.1 184.4 3.8 91C321F 5 350–550 0.48 0.7 10.6 23.4 ± 0.7 25.2 ± 4.5 26.491C322B 7 350–550 0.56 0.79 7.5 20.9 ± 1.291C323B 7 350–550 0.52 0.8 21.1 31.4 ± 0.691C324F 5 350–550 0.49 0.7 10.2 25.3 ± 0.9
DG4 11Y 4 −62.8 173.9 11.1 91C332B 6 20–520 0.32 0.65 6.5 14.8 ± 0.5 19.2 ± 5.2 18.691C333C 11 250–570 0.87 0.84 26.9 17.4 ± 0.591C335b 7 300–525 0.51 0.52 7.5 25.3 ± 0.9
DG4 12Y 7 –61.6 179.5 2.6 91C342F 5 200–520 0.45 0.71 6.3 24.5 ± 1.3 25.0 ± 0.5 25.191C343C 6 400–550 0.82 0.77 17.1 25.2 ± 0.991C344F 5 200–520 0.39 0.74 8 25.4 ± 0.9
DG4 13Y 10 −62.8 177.3 2.8 91C348F 6 200–550 0.77 0.73 15.1 22.8 ± 0.9 23.9 ± 1.6 24.291C465F 8 300–550 0.68 0.81 12.9 25.0 ± 1.1
DG4 14Y 7 −59.3 179.8 1.8 91C359D 9 150–520 0.44 0.72 7.7 19.3 ± 0.8 15.9 ± 4.8 25.891C360E 5 200–520 0.46 0.69 4.8 12.5 ± 0.8
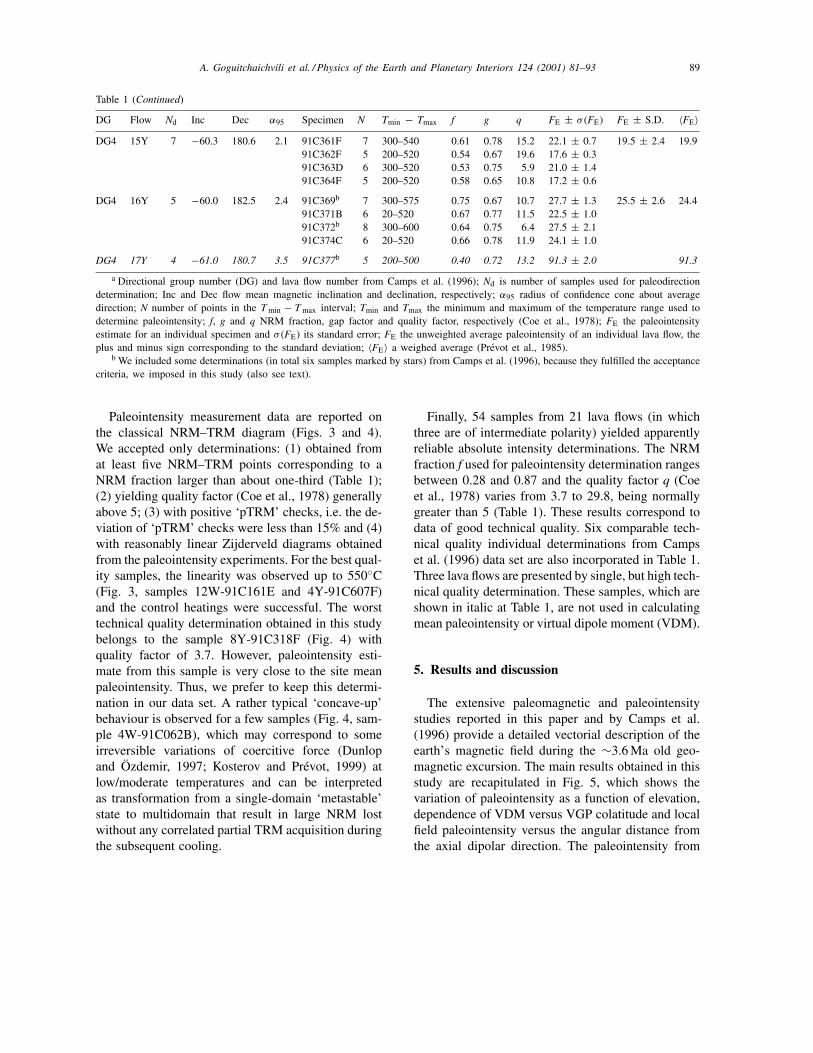
A. Goguitchaichvili et al. / Physics of the Earth and Planetary Interiors 124 (2001) 81–93 89
Table 1 (Continued)
DG Flow Nd Inc Dec α95 Specimen N Tmin − Tmax f g q FE ± σ (FE) FE ± S.D. 〈FE〉DG4 15Y 7 −60.3 180.6 2.1 91C361F 7 300–540 0.61 0.78 15.2 22.1 ± 0.7 19.5 ± 2.4 19.9
91C362F 5 200–520 0.54 0.67 19.6 17.6 ± 0.391C363D 6 300–520 0.53 0.75 5.9 21.0 ± 1.491C364F 5 200–520 0.58 0.65 10.8 17.2 ± 0.6
DG4 16Y 5 −60.0 182.5 2.4 91C369b 7 300–575 0.75 0.67 10.7 27.7 ± 1.3 25.5 ± 2.6 24.491C371B 6 20–520 0.67 0.77 11.5 22.5 ± 1.091C372b 8 300–600 0.64 0.75 6.4 27.5 ± 2.191C374C 6 20–520 0.66 0.78 11.9 24.1 ± 1.0
DG4 17Y 4 −61.0 180.7 3.5 91C377b 5 200–500 0.40 0.72 13.2 91.3 ± 2.0 91.3
a Directional group number (DG) and lava flow number from Camps et al. (1996); Nd is number of samples used for paleodirectiondetermination; Inc and Dec flow mean magnetic inclination and declination, respectively; α95 radius of confidence cone about averagedirection; N number of points in the T min − T max interval; Tmin and Tmax the minimum and maximum of the temperature range used todetermine paleointensity; f, g and q NRM fraction, gap factor and quality factor, respectively (Coe et al., 1978); FE the paleointensityestimate for an individual specimen and σ (FE) its standard error; FE the unweighted average paleointensity of an individual lava flow, theplus and minus sign corresponding to the standard deviation; 〈FE〉 a weighed average (Prevot et al., 1985).
b We included some determinations (in total six samples marked by stars) from Camps et al. (1996), because they fulfilled the acceptancecriteria, we imposed in this study (also see text).
Paleointensity measurement data are reported onthe classical NRM–TRM diagram (Figs. 3 and 4).We accepted only determinations: (1) obtained fromat least five NRM–TRM points corresponding to aNRM fraction larger than about one-third (Table 1);(2) yielding quality factor (Coe et al., 1978) generallyabove 5; (3) with positive ‘pTRM’ checks, i.e. the de-viation of ‘pTRM’ checks were less than 15% and (4)with reasonably linear Zijderveld diagrams obtainedfrom the paleointensity experiments. For the best qual-ity samples, the linearity was observed up to 550◦C(Fig. 3, samples 12W-91C161E and 4Y-91C607F)and the control heatings were successful. The worsttechnical quality determination obtained in this studybelongs to the sample 8Y-91C318F (Fig. 4) withquality factor of 3.7. However, paleointensity esti-mate from this sample is very close to the site meanpaleointensity. Thus, we prefer to keep this determi-nation in our data set. A rather typical ‘concave-up’behaviour is observed for a few samples (Fig. 4, sam-ple 4W-91C062B), which may correspond to someirreversible variations of coercitive force (Dunlopand Özdemir, 1997; Kosterov and Prévot, 1999) atlow/moderate temperatures and can be interpretedas transformation from a single-domain ‘metastable’state to multidomain that result in large NRM lostwithout any correlated partial TRM acquisition duringthe subsequent cooling.
Finally, 54 samples from 21 lava flows (in whichthree are of intermediate polarity) yielded apparentlyreliable absolute intensity determinations. The NRMfraction f used for paleointensity determination rangesbetween 0.28 and 0.87 and the quality factor q (Coeet al., 1978) varies from 3.7 to 29.8, being normallygreater than 5 (Table 1). These results correspond todata of good technical quality. Six comparable tech-nical quality individual determinations from Campset al. (1996) data set are also incorporated in Table 1.Three lava flows are presented by single, but high tech-nical quality determination. These samples, which areshown in italic at Table 1, are not used in calculatingmean paleointensity or virtual dipole moment (VDM).
5. Results and discussion
The extensive paleomagnetic and paleointensitystudies reported in this paper and by Camps et al.(1996) provide a detailed vectorial description of theearth’s magnetic field during the ∼3.6 Ma old geo-magnetic excursion. The main results obtained in thisstudy are recapitulated in Fig. 5, which shows thevariation of paleointensity as a function of elevation,dependence of VDM versus VGP colatitude and localfield paleointensity versus the angular distance fromthe axial dipolar direction. The paleointensity from
90 A. Goguitchaichvili et al. / Physics of the Earth and Planetary Interiors 124 (2001) 81–93
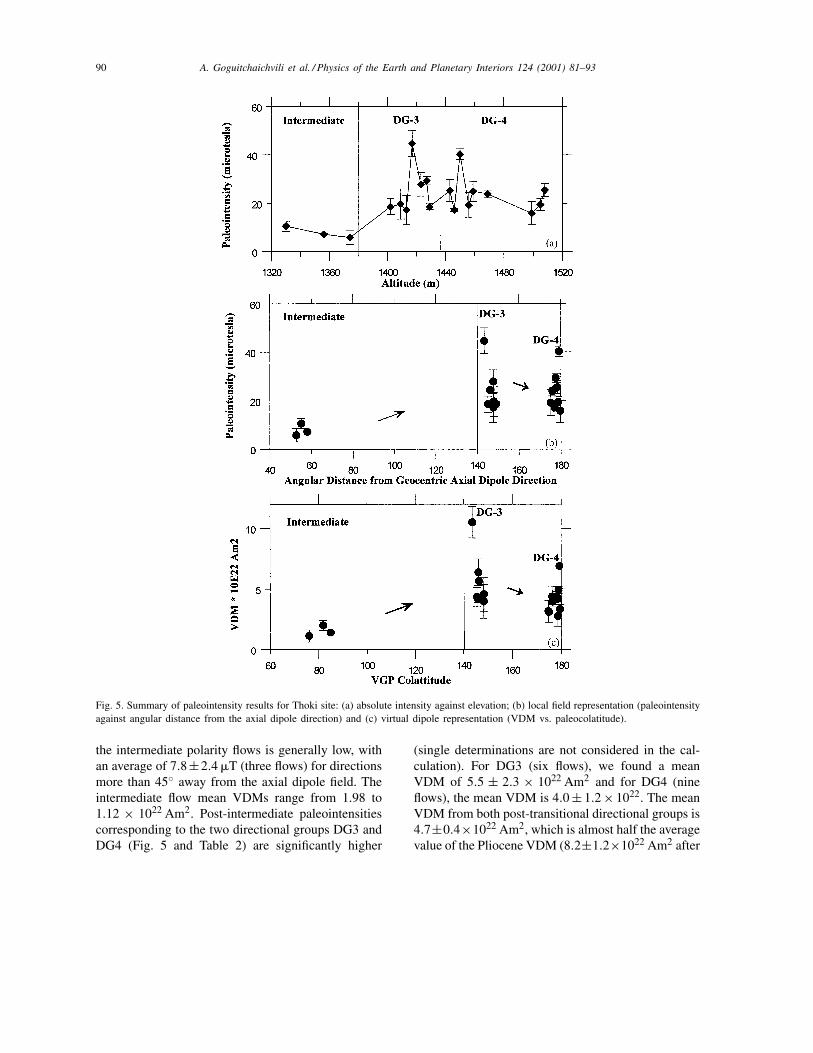
Fig. 5. Summary of paleointensity results for Thoki site: (a) absolute intensity against elevation; (b) local field representation (paleointensityagainst angular distance from the axial dipole direction) and (c) virtual dipole representation (VDM vs. paleocolatitude).
the intermediate polarity flows is generally low, withan average of 7.8±2.4 �T (three flows) for directionsmore than 45◦ away from the axial dipole field. Theintermediate flow mean VDMs range from 1.98 to1.12 × 1022 Am2. Post-intermediate paleointensitiescorresponding to the two directional groups DG3 andDG4 (Fig. 5 and Table 2) are significantly higher
(single determinations are not considered in the cal-culation). For DG3 (six flows), we found a meanVDM of 5.5 ± 2.3 × 10²² Am2 and for DG4 (nineflows), the mean VDM is 4.0 ± 1.2 × 10²². The meanVDM from both post-transitional directional groups is4.7±0.4×10²² Am2, which is almost half the averagevalue of the Pliocene VDM (8.2±1.2×10²² Am2 after
A. Goguitchaichvili et al. / Physics of the Earth and Planetary Interiors 124 (2001) 81–93 91
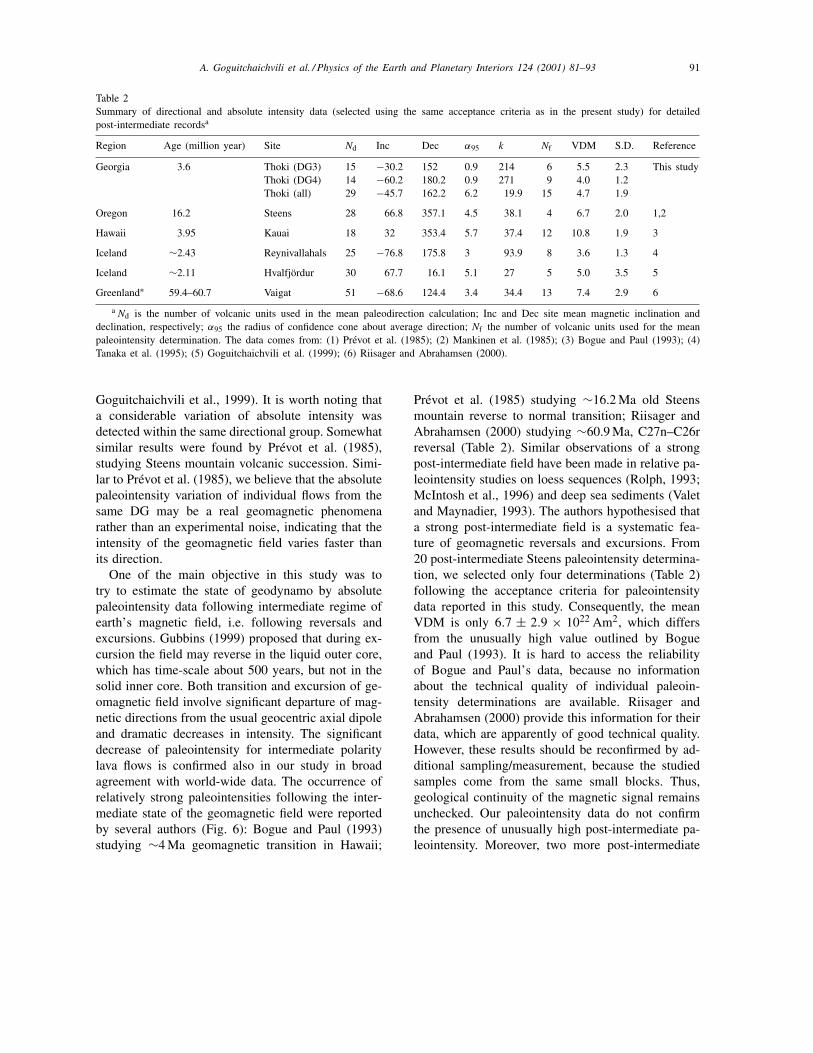
Table 2Summary of directional and absolute intensity data (selected using the same acceptance criteria as in the present study) for detailedpost-intermediate recordsa
Region Age (million year) Site Nd Inc Dec α95 k Nf VDM S.D. Reference
Georgia 3.6 Thoki (DG3) 15 −30.2 152 0.9 214 6 5.5 2.3 This studyThoki (DG4) 14 −60.2 180.2 0.9 271 9 4.0 1.2Thoki (all) 29 −45.7 162.2 6.2 19.9 15 4.7 1.9
Oregon 16.2 Steens 28 66.8 357.1 4.5 38.1 4 6.7 2.0 1,2
Hawaii 3.95 Kauai 18 32 353.4 5.7 37.4 12 10.8 1.9 3
Iceland ∼2.43 Reynivallahals 25 −76.8 175.8 3 93.9 8 3.6 1.3 4
Iceland ∼2.11 Hvalfjördur 30 67.7 16.1 5.1 27 5 5.0 3.5 5
Greenland∗ 59.4–60.7 Vaigat 51 −68.6 124.4 3.4 34.4 13 7.4 2.9 6
a Nd is the number of volcanic units used in the mean paleodirection calculation; Inc and Dec site mean magnetic inclination anddeclination, respectively; α95 the radius of confidence cone about average direction; Nf the number of volcanic units used for the meanpaleointensity determination. The data comes from: (1) Prevot et al. (1985); (2) Mankinen et al. (1985); (3) Bogue and Paul (1993); (4)Tanaka et al. (1995); (5) Goguitchaichvili et al. (1999); (6) Riisager and Abrahamsen (2000).
Goguitchaichvili et al., 1999). It is worth noting thata considerable variation of absolute intensity wasdetected within the same directional group. Somewhatsimilar results were found by Prévot et al. (1985),studying Steens mountain volcanic succession. Simi-lar to Prévot et al. (1985), we believe that the absolutepaleointensity variation of individual flows from thesame DG may be a real geomagnetic phenomenarather than an experimental noise, indicating that theintensity of the geomagnetic field varies faster thanits direction.
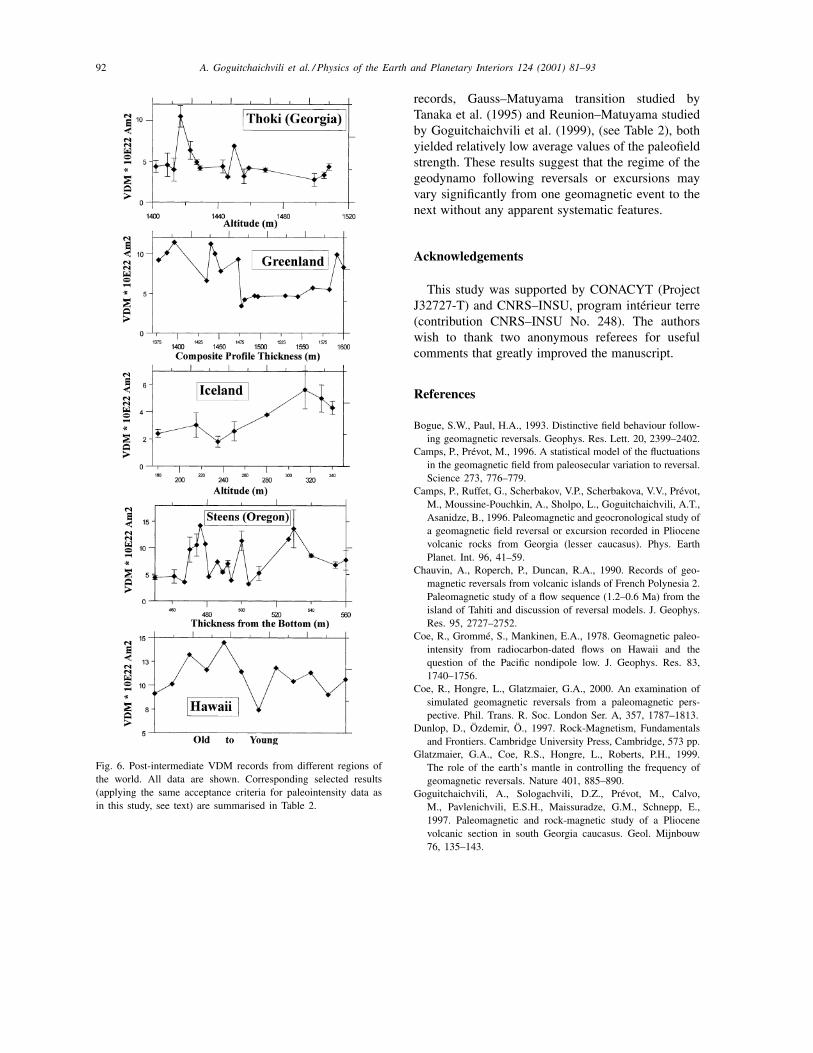
One of the main objective in this study was totry to estimate the state of geodynamo by absolutepaleointensity data following intermediate regime ofearth’s magnetic field, i.e. following reversals andexcursions. Gubbins (1999) proposed that during ex-cursion the field may reverse in the liquid outer core,which has time-scale about 500 years, but not in thesolid inner core. Both transition and excursion of ge-omagnetic field involve significant departure of mag-netic directions from the usual geocentric axial dipoleand dramatic decreases in intensity. The significantdecrease of paleointensity for intermediate polaritylava flows is confirmed also in our study in broadagreement with world-wide data. The occurrence ofrelatively strong paleointensities following the inter-mediate state of the geomagnetic field were reportedby several authors (Fig. 6): Bogue and Paul (1993)studying ∼4 Ma geomagnetic transition in Hawaii;
Prévot et al. (1985) studying ∼16.2 Ma old Steensmountain reverse to normal transition; Riisager andAbrahamsen (2000) studying ∼60.9 Ma, C27n–C26rreversal (Table 2). Similar observations of a strongpost-intermediate field have been made in relative pa-leointensity studies on loess sequences (Rolph, 1993;McIntosh et al., 1996) and deep sea sediments (Valetand Maynadier, 1993). The authors hypothesised thata strong post-intermediate field is a systematic fea-ture of geomagnetic reversals and excursions. From20 post-intermediate Steens paleointensity determina-tion, we selected only four determinations (Table 2)following the acceptance criteria for paleointensitydata reported in this study. Consequently, the meanVDM is only 6.7 ± 2.9 × 10²² Am2, which differsfrom the unusually high value outlined by Bogueand Paul (1993). It is hard to access the reliabilityof Bogue and Paul’s data, because no informationabout the technical quality of individual paleoin-tensity determinations are available. Riisager andAbrahamsen (2000) provide this information for theirdata, which are apparently of good technical quality.However, these results should be reconfirmed by ad-ditional sampling/measurement, because the studiedsamples come from the same small blocks. Thus,geological continuity of the magnetic signal remainsunchecked. Our paleointensity data do not confirmthe presence of unusually high post-intermediate pa-leointensity. Moreover, two more post-intermediate
92 A. Goguitchaichvili et al. / Physics of the Earth and Planetary Interiors 124 (2001) 81–93
Fig. 6. Post-intermediate VDM records from different regions ofthe world. All data are shown. Corresponding selected results(applying the same acceptance criteria for paleointensity data asin this study, see text) are summarised in Table 2.
records, Gauss–Matuyama transition studied byTanaka et al. (1995) and Reunion–Matuyama studiedby Goguitchaichvili et al. (1999), (see Table 2), bothyielded relatively low average values of the paleofieldstrength. These results suggest that the regime of thegeodynamo following reversals or excursions mayvary significantly from one geomagnetic event to thenext without any apparent systematic features.
Acknowledgements
This study was supported by CONACYT (ProjectJ32727-T) and CNRS–INSU, program intérieur terre(contribution CNRS–INSU No. 248). The authorswish to thank two anonymous referees for usefulcomments that greatly improved the manuscript.
References
Bogue, S.W., Paul, H.A., 1993. Distinctive field behaviour follow-ing geomagnetic reversals. Geophys. Res. Lett. 20, 2399–2402.
Camps, P., Prévot, M., 1996. A statistical model of the fluctuationsin the geomagnetic field from paleosecular variation to reversal.Science 273, 776–779.
Camps, P., Ruffet, G., Scherbakov, V.P., Scherbakova, V.V., Prévot,M., Moussine-Pouchkin, A., Sholpo, L., Goguitchaichvili, A.T.,Asanidze, B., 1996. Paleomagnetic and geocronological study ofa geomagnetic field reversal or excursion recorded in Pliocenevolcanic rocks from Georgia (lesser caucasus). Phys. EarthPlanet. Int. 96, 41–59.
Chauvin, A., Roperch, P., Duncan, R.A., 1990. Records of geo-magnetic reversals from volcanic islands of French Polynesia 2.Paleomagnetic study of a flow sequence (1.2–0.6 Ma) from theisland of Tahiti and discussion of reversal models. J. Geophys.Res. 95, 2727–2752.
Coe, R., Grommé, S., Mankinen, E.A., 1978. Geomagnetic paleo-intensity from radiocarbon-dated flows on Hawaii and thequestion of the Pacific nondipole low. J. Geophys. Res. 83,1740–1756.
Coe, R., Hongre, L., Glatzmaier, G.A., 2000. An examination ofsimulated geomagnetic reversals from a paleomagnetic pers-pective. Phil. Trans. R. Soc. London Ser. A, 357, 1787–1813.
Dunlop, D., Özdemir, Ö., 1997. Rock-Magnetism, Fundamentalsand Frontiers. Cambridge University Press, Cambridge, 573 pp.
Glatzmaier, G.A., Coe, R.S., Hongre, L., Roberts, P.H., 1999.The role of the earth’s mantle in controlling the frequency ofgeomagnetic reversals. Nature 401, 885–890.
Goguitchaichvili, A., Sologachvili, D.Z., Prévot, M., Calvo,M., Pavlenichvili, E.S.H., Maissuradze, G.M., Schnepp, E.,1997. Paleomagnetic and rock-magnetic study of a Pliocenevolcanic section in south Georgia caucasus. Geol. Mijnbouw76, 135–143.
A. Goguitchaichvili et al. / Physics of the Earth and Planetary Interiors 124 (2001) 81–93 93
Goguitchaichvili, A., Prévot, M., Camps, P., 1999. No evidence forstrong fields during the R3–N3 Icelandic geomagnetic reversals.Earth Planet. Sci. Lett. 167, 15–34.
Gubbins, D., 1999. The distinction between geomagneticexcursions and reversals. Geophys. J. Int. 137, F1–F3.
Hoffman, K.A., 1992. Dipolar reversal states of the geomagneticfield and core-mantle dynamics. Nature 359, 789–794.
Huestis, S.P., Acton, G.D., 1997. On the construction of geomag-netic time scales from non-prejudicial treatment of magneticanomaly data from multiple ridges. Geophys. J. Int. 129,176–182.
Kosterov, A., Prévot, M., 1999. Possible mechanisms causingfailure of Thellier paleointensity experiments: results ofrock-magnetic study of the Lesotho basalt. South. Afr. Geophys.J. Int. 134, 554–572.
Laj, C., Mazaud, A., Weeks, R., Herrero-Bervera, E., 1991.Geomagnetic reversal paths. Nature 351, 347–350.
Mankinen, E.A., Prévot, M., Grommé, C.S., Coe, R., 1985. TheSteens mountain (Oregon) geomagnetic polarity transition 1.Directional history, duration of episodes and rock-magnetism.J. Geophys. Res. 90, 10393–10416.
McElhinny, M.W., McFadden, P.L., 1997. Palaosecular variationsover the past 5 million year based on new generalised database.Geophys. J. Int. 131, 240–252.
McIntosh, G., Rolph, T.C., Shaw, J., Dagley, P., 1996. A detailedrecord of normal-reversed polarity transition obtained froma chick loess sequence at Jiuzhoutai, near Lanzhou, China.Geophys. J. Int. 127, 651–664.
Merrill, R.T., McFadden, P.L., 1999. Geomagnetic polaritytransitions. Rev. Geophys. 37, 201–226.
Milanovski, E.E., 1968. Neotectonics of the Caucasus. Nedra, 278pp. (in Russian).
Prévot, M., Camps, P., 1993. Absence of preferred longitude sectorsfor poles from volcanic records of geomagnetic reversals.Nature 366, 53–57.
Prévot, M., Mankinen, E.A., Grommé, S., Lecaille, A., 1983. Highpaleointensities of the geomagnetic field from thermomagneticstudy on rift valley pillow basalts from the mid-Atlantic ridge.J. Geophys. Res. 88, 2316–2326.
Prévot, M., Mainkinen, R.S., Coe, R.S., Grommé, S., 1985. TheSteens mountain (Oregon) geomagnetic polarity transition 2.Field intensity variations and discussion of reversal models. J.Geophys. Res. 90, 10417–10448.
Quidelleur, X., Valet, J.P., 1996. Geomagnetic changes across thelast reversal recorded in lava flows from la Palma (CanaryIselands). J. Geophys. Res. 101, 13755–13773.
Rebai, S., Philip, H., Dorbath, L., Borissoff, B., Haessler, H.,Cisternas, A., 1993. Active tectonics in the lesser caucasus:coexistence of compressive and extensional structures. Tectonics12, 1089–1114.
Riisager, P., Abrahamsen, N., 2000. Palaeointensity of westGreenland Palaeocene basalts: asymetric intensity around theC27n–C26r transition. Phys. Earth Planet. Int. 118, 53–64.
Rolph, T.C., 1993. Matuyama–Jaramillo R–N transition recordedin a loess section near PR China. J. Geomag. Geoelectr. 45,301–318.
Tanaka, H., Kono, M., Kaneko, S., 1995. Paleosecular variation ofdirection and intensity from two Pliocene–Pleistocene lava sect-ions in southwestern Iceland. J. Geomag. Geoelectr. 47, 89–102.
Thellier, E., Thellier, O., 1959. Sur l’intensité du champmagnétique terrestre dans le passé historique et géologique.Ann. Géophys. 15, 285–376.
Valet, J.-P., Maynadier, L., 1993. Geomagnetic field intensity andreversals during the past 4 million years. Nature 366, 234–238.


