Embed Size (px)
Citation preview
On the hydration of the phosphocholine headgroup in aqueous solutionFabrizia Foglia,1 M. Jayne Lawrence,1 Christian D. Lorenz,2,a� and Sylvia E. McLain1,b�
1Department of Pharmaceutical Sciences, King’s College London, London SE1 9NH,United Kingdom2Department of Physics, King’s College London, London SE1 9NH, United Kingdom
�Received 12 July 2010; accepted 23 August 2010; published online 13 October 2010�
The hydration of the phosphocholine headgroup in 1,2-dipropionyl-sn-glycero-3-phosphocholine�C3–PC� in solution has been determined by using neutron diffraction enhanced with isotopicsubstitution in combination with computer simulation techniques. The atomic scale hydrationstructure around this head group shows that both the uN�CH3�3 and uCH2 portions of the cholineheadgroup are strongly associated with water, through a unique hydrogen bonding regime, wherespecifically a hydrogen bond from the CuH group to water and a strong association between thewater oxygen and N+ atom in solution have both been observed. In addition, both PO4 oxygens�P�O� and CvO oxygens are oversaturated when compared to bulk water in that the averagenumber of hydrogen bonds from water to both X=O oxygens is about 2.5 for each group. That waterbinds strongly to the glycerol groups and is suggestive that water may bind to these groups whenphosophotidylcholine is embedded in a membrane bilayer. © 2010 American Institute of Physics.�doi:10.1063/1.3488998�
I. INTRODUCTION
It is well known that water is the medium in which theoverwhelming majority of biological processes take place. Incell membranes water molecules are thought to be essentialto not only the structure and stability of the membranes, butalso to play a central role in membrane transport,1,2 wherewater molecules have been proposed to be integral to mem-brane recognition of soluble proteins in vivo.3 Even thoughwater is widely acknowledged to be essential to these pro-cesses, the specific interactions between water and biologicalmolecules still remain largely unknown.
One of the difficulties in establishing the role of water inbiological processes is that with many experimental methodsit is difficult to distinguish between hydration water �e.g.,water which is in direct contact with the molecule in ques-tion� and the bulk water solvent. For this reason, it is some-times assumed that bulk water properties are the same orsimilar to hydration water properties, even though there isnot necessarily any evidence either way. Israelachvili andWennerstom4 assumed that the properties of the water mol-ecules beyond the primary hydration layer are more or lessthe same as that of bulk water and concluded there is onlyperturbation of this first layer about a cell membrane. Theysuggested that the short-range repulsion between approach-ing membrane surfaces is caused by the entropy loss due tothe confinement of thermally mobile surface groups and notfrom structured water layers beyond the primary hydrationshell.
There have been a variety of techniques employed togain further insight into the structure of the water near thelipid interface. Macromolecular techniques such as small
angle neutron scattering5–7 �SANS� and x-ray scattering8,9
�SAXS� indicate that water molecules penetrate the lipid/water interface and then rapidly decrease in concentrationwithin the hydrophobic region of the lipid bilayer. Further tothis, low temperature magic angle NMR which provides in-formation on the atomic length scale5,10–13 has been used toprobe the hydration lipids in membranes, which confirms thehypotheses from SANS and SAXS experiments. This hydra-tion behavior is also observed in various molecular dynamics�MD� simulation studies of lipid/water interactions at themembrane surface.14–18 Even though all of these experimen-tal techniques are powerful, they provide no informationabout the nature of the hydrogen bonding on an atomiclength scale to the headgroups of the membrane phospho-lipid. Macromolecular techniques are not sensitive enough tothese interactions as they measure on a length scale that is atleast an order of magnitude larger than most hydrogen bonds,e.g., SANS and SAXS measure, at best, to the tens of ang-stroms. In the case of Magic-angle spinning solid-stateNMR, even though there is information gained about thelocation of water molecules, it is difficult to assess the exactnature of the hydrogen bonding interactions �or lack thereof�as the water is in rapid exchange in the system.
Specific hydration sites of lipid headgroups such asphosphate and carbonyl groups have also been probed usingseveral different types of spectroscopies, such as vibrationaland IR;19–26 and the properties of water molecules whichdirectly bind to these headgroups has been similarlyinvestigated.27–29 It is of note that recently a range of spec-troscopic techniques have been used to probe the dynamicsof water around lipids, where these studies have been aimedspecifically at distinguishing the closest hydration layer dy-namics from the bulk water dynamics.30–32 Even thoughspectroscopy provides valuable information about the dy-namics of interactions between water molecules and the hy-
a�Electronic mail: [email protected]�Electronic mail: [email protected].
THE JOURNAL OF CHEMICAL PHYSICS 133, 145103 �2010�
0021-9606/2010/133�14�/145103/10/$30.00 © 2010 American Institute of Physics133, 145103-1

drated headgroups, it does not provide any structural infor-mation about the hydrogen bonding present in the system asthe structure can only be inferred from the dynamics of thesystem.
In order to determine the atomic scale structure �0–10 Å�of hydration between water and a phosphocholineheadgroup, 1,2-dipropionyl-sn-glycero-3-phosphocholine�C3–PC; Fig. 1� has been investigated, in aqueous solution,using a combination of neutron scattering techniques en-hanced by isotopic substitution and computer modeling.
This lipid molecule has been measured below the criticalmicelle concentration �cmc �405 mM for C3–PC�33 so as tominimize aggregation in order to measure the hydration inthe absence of aggregation. This concentration was chosenspecifically to establish the hydration of headgroup in a di-lute, unaggregated state to establish a “base-line” for hydra-tion in these molecules which can be directly compared tohydration of headgroups in membranes in order to probe thechanges between the dilute case and when the lipids are ag-gregated in a biological membrane.
II. METHODS
A. Neutron diffraction with isotopic substitution
Neutron diffraction with isotopic substitution �NDIS� isthe premier technique by which the atomic level structure�0–10 Å� of many hydrogen containing liquids and solutionshave been determined;34–38 where recently several of theseinvestigations have focused on the hydration of biologicallyrelevant molecules in aqueous solutions.39–45 The use ofNDIS for such systems is particularly effective for severalreasons, foremost among which is the “sensitivity” of neu-trons to hydrogen atoms. Neutrons scatter by virtue of aneutron-nucleus interaction where the size of the atom isdecoupled from its scattering intensity and as such neutronscattering is of similar magnitude for both light and heavyatoms as opposed to x-ray scattering where the scatteringintensity is proportional to the number of electrons present inthe element. One of the most significant benefits when usingneutrons for determining the structure of hydrogen-containing materials is that hydrogen and deuterium scatter
with different intensities and this difference is relativelylarge. This scattering intensity difference can be exploited bymeasuring isotopically unique yet chemically equivalent spe-cies, allowing for a set of unique neutron diffraction mea-surements for any one given system.
The quantity measured in a neutron diffraction experi-ment is F�Q�, the total scattering structure factor, whicharises from the “distinct scattering” contribution, and can bedefined mathematically as
F�Q� = ��,���
�2 − ����c�c�b�b��S���Q� − 1� , �1�
where ci and bi are the relative concentration and scat-tering length46 of atom i, respectively; and ��� is the Kro-neker delta function to avoid double counting like-atompairs. Q is the change in the magnitude of the incident wavevector of the neutrons when they are scattered from thesample where Q=4� sin � / and is the neutron wave-length and � is the scattering angle relative to the incidentneutron beam. Equation �1� describes the sum of all of thepartial structure factors S���Q� for which there are m�m+1� /2 partial structure factors, where m is the number ofunique atoms, for any system.
The Fourier transform of S���Q� gives the atomic dis-tances in real space �in angstrom� as a radial distributionfunction �g�r�; RDF�, where S���Q� and g���r� form a Fou-rier pair and are related by
S���Q� = 1 +4�
Q� r��g���r� − 1��sin�Qr�dr , �2�
where is the atomic number density of the sample �inatoms /Å3 and g���r�−1� is the RDF between atoms � and�.
B. Empirical potential structure refinement
Using NDIS, it is possible to experimentally extract allthe atom-atom g�r�’s �RDFs� for systems which contain onlya very small number of component atoms, such as water orHF.37,38 In more complex systems where the number ofatomic components is much larger, it is only possible to mea-sure a subset of atom-atom correlations, such as the hydro-gen bonding interactions between, for instance, water and aphosphate group. In order to produce a full set of atomiccorrelations, empirical potential structure refinement �EPSR�modeling is used herein to augment the information obtainedby neutron diffraction experiments.47 From a box of mol-ecules at the appropriate density, temperature, and concentra-tion of the measurements, EPSR begins with a standardMonte Carlo �MC� simulation using a set of atomic seedpotentials. After the initial MC, the simulation is allowed torefine these potentials, iteratively, until the simulated struc-ture fits all of the provided neutron data, ultimately resultingin a model which is consistent with the set of isotopicallyunique, chemically equivalent data. It should be noted thatwhile EPSR provides a model which is consistent with thediffraction data, it is not necessarily unique. EPSR has beendescribed in greater detail elsewhere.47
FIG. 1. Molecular structure of C3–PC.
145103-2 Foglia et al. J. Chem. Phys. 133, 145103 �2010�

By using EPSR, the atom-atom RDFs �g�r�’s� can beextracted for each unique atom-atom pair and the averagecoordination around the atoms can be determined by
n�� = 4�c��
r1
r2
r2g�r�dr , �3�
where the integral is over a specified distance range,from r1 to r2.
The EPSR model can also be used to give local three-dimensional spatial and orientational order present in thesolution41,48–50 through spatial density functions �SDFs� andorientational correlation functions �OCFs�.49,50 These tasksare achieved in the EPSR model via spherical harmonic ex-pansion of the full orientational pair correlation function us-ing the simulation box to derive the positional and orienta-tional coordinates of the molecules.51 A more thoroughexplanation of SDFs has been previously described in theliterature.42,48 SDFs give a description of the most probablelocation of molecules, or portions of molecules, relative toone another; allowing, for instance, the hydration sphere ofwater around the PO4 to be assessed in three dimensions.Similarly, OCFs are used to give the most probableorientation of the molecules or portions of molecules relativeto one another.
III. EXPERIMENTAL
A. Neutron diffraction and EPSR
Neutron diffraction measurements were performed onthe Small Angle Neutron Diffractometer for Liquids andAmorphous Samples �SANDALS� instrument located at theISIS Facility �STFC, U.K.� on C3–PC �Fig. 1� using a vari-ety of isotopically substituted water solvents, namely, H2O,HDO, D2O, and H1.23D0.67O, each at a concentration of 220mM �1:250 lipid:water ratio� at standard temperature andpressure �298 K, 1 bar�. C3–PC was purchased from AvantiLipids �Alabama, USA� and used without further purifica-tion. All samples were prepared by weight and then trans-ferred to flat plate vanadium cells which were coated with a0.1 mm layer of PTFE.® Vanadium containers were usedas the scattering of neutrons from vanadium is predomi-nantly incoherent and leads to a more tractable data analysis.Although the PTFE itself contributes to the container back-ground, the very low quantity present does not interfere withthe scattering signal of the sample itself.
For each measurement, the raw data obtained were con-verted to F�Q� after appropriate corrections for absorption,multiple scattering, and inelasticity effects were made usingthe program GUDRUN which is based on the ATLAS suite ofprograms and available at ISIS.52 The typical collection forany sample is 1000 �A. SANDALS is further equippedwith a transmission monitor, which allows for the total crosssectional area to be measured relative to the incident beam.This allows for the level of scatter to be compared with the-oretical values to check that the samples are at the appropri-ate concentration. For each data set measured here, the levelof scatter was within 10% of the expected theoretical level.46
EPSR simulations were performed by building a box ofmolecules which contained 10 C3–PC molecules and 2500
water molecules. In the present work, the seed potential con-sisted of Lennard-Jones parameters and charges for eachmolecule, which were taken from the CHARMM package53–55
for the lipid molecule and SPCE potentials for the watermolecules.56 The comparison between the fits and the mea-sured data are shown in Fig. 2.
B. MD simulations
In addition to the EPSR simulations, which are con-strained by the data, MD simulations using the CHARMM
potential53–55 were performed, providing an independent as-sessment of the lipid-water solutions. The MD simulationswere conducted at the same concentration as the NDIS ex-periment and EPSR simulations where specifically the MDsystem contained nine C3–PC molecules and 2250 watermolecules. The water molecules were modeled using TIP3P
and all of the hydrogen containing bonds and the angles ofthe water molecules were constrained using the SHAKE
algorithm.57 The volume of the system was equilibrated at300 K and 1 atm using the NPT ensemble for approximately1 ns, and then the production simulations were performedusing the NVT ensemble at 300 K and run for 30 ns. Allsimulations were conducted using the LAMMPS MD code58
and a 2.0 fs time step with the velocity Verlet integrator wasused. The van der Waals interactions were cut off at 12 Å,and the PPPM �particle-particle-particle-mesh� algorithm59
was used to compute the long-range Coulomb interactions.
−0.2
0.2
0.6
1
0 5 10 15 20 25
F(Q
)[b
arn
s/s
r/ato
m]
Q / Å−1
C3−PC in D2O
C3−PC in D1.5H0.5O
C3−PC in DHO
C3−PC in D1.34H0.66O
FIG. 2. Neutron diffraction data �crosses� and EPSR fit to the data �lines�.The difference between data and fit are also shown as lines for each data set.The data, fits, and differences have been offset vertically for clarity.
145103-3 Phosphocholine hydration J. Chem. Phys. 133, 145103 �2010�

IV. RESULTS AND DISCUSSION
A. Hydration of the onium group
Figure 3 shows the RDFs corresponding to the hydrationof the onium �N�CH3�3� headgroup. From both the EPSRmodel of the neutron data and from the MD simulations, thegCmOw�r� and gNOw�r� functions show strong peaks at 3.5 and4.2 Å, respectively. gCmHw�r� and gNHw�r�, show broad peaksat longer distances than in the corresponding OW functions,indicating that the water hydrogens are in general pointingaway from the onium headgroup. These broad peaks are in-dicative of a highly disordered interaction e.g., there is noclear hydrogen bond between the methyl groups and water inthe closest hydration shell.
Conversely, both the gNHw�r� and gNOw�r� functionsshow obvious peaks, although at relatively long distances.This is surprising as, although the nitrogen atom itself carriesa charge, it is sterically hindered by three methyl groups andthe hydrocarbon “tail” �the uCH2uCH2u group�. Theonium hydration sphere contains around 23 water moleculesas indicated by the gNOw�r� coordination number at 6 Å �farend of the broad minimum for the first peak �bottom leftpanel Fig. 3��. This water hydration is virtually identical tothat seen in a similar study on the hydration ofacetylcholine,41 which has the same onium headgroup. Whatis notable about the comparison between these two mol-ecules is that this hydration regime is consistent and is notperturbed or altered by the different chemical tails of acetyl-choline and the present phosphotidylcholine lipid.
The SDFs of the water molecules around the N�CH3�3
group from the EPSR fit to the data are shown in Fig. 4.Here, the N�CH3�3 group has been placed at the center of theCartesian axis with the nitrogen atom at the origin with thethree CH3 groups above the xy plane where they are three-
fold symmetric with respect to the +z-axis. This SDF showsthe positions of water molecules around this group where theyellow shell depicts the most probable location of water mol-ecules relative to N�CH3�3. Figure 4 shows these hydrationshells in two distance ranges which were chosen with respectto the gNOw�r� function in the lower left-hand panel of Fig. 3.
Specifically, Fig. 4�a� shows the nearest hydration shellfrom r1=2.50 Å to r2=4.05 Å �where the coordinationnumber is 3.7�, at the first peak maximum in the gNOw�r�function. Figure 4�b� shows the second hydration shell fromthe first peak maximum to the first minimum of gNOw�r� atr2=5.0 Å where the coordination number is 13.5. In bothpanels of Fig. 4, only the top percentage �or the most prob-able� of molecules are shown in the SDF. The reason for thisis that because this is an amorphous liquid, there is only localorder present in the system and as such not all molecules willshow this particular orientation at all times over the course ofthe simulation so only the most probable locations �as a per-centage of the total� are depicted.
The water molecules closest to the onium group �Fig. 4�are most likely to be found between the methyl groups, instrips above the xy plane or in a “collar” around the base ofthe nitrogen atom slightly below the xy plane. This configu-ration, is again, virtually identical to what was seen for theheadgroup hydration in acetylcholine41 and similar to mea-surements on the tertiary-butyl group in tert-butyl alcohol.60
The water molecules at larger distances �Fig. 4�b�� show asemi-isotropic distribution around the central onium group.There is a clear absence of density in both panels of Fig. 4 inthe −z direction corresponding to the space occupied by therest of the phosophotidylcholine molecule. These SDFs sug-gest that water is strongly associated with this headgroup butnot through hydrogen bonding interactions. The positivelycharged nitrogen atom appears to interact with water throughan NuOW interaction with the water hydrogens binding tothe bulk water solvent.
Probing further into the hydration of N�CH3�3 in C3–PC,the OCFs were extracted at different locations correspondingto the distribution shown in closest hydration shell �Fig.4�a��. The OCFs show the most probable orientations of thewater molecules relative to the onium group at the positionsindicated in Fig. 5 where here water molecule is at the centerof the Cartesian axis. In the OCFs, slightly different to theSDF, the surrounding shell shows a percentage of orienta-tions indicating the range of most probable orientations ofthe water molecules at a particular location around the onium
0
0.5
1
1.5
2
0 2 4 6 8
r /Å
gNOw(r)
0
0.5
1
1.5
2
gCmOw(r)
0
0.5
1
1.5
2
2.5
gHmOw(r)
0 2 4 6 8
r /Å
gNHw(r)
gCmHw(r)
gHmHw(r)
FIG. 3. Onium group-water correlations where the solid line represents theEPSR data and the dot-dash line represents the MD simulations.
FIG. 4. SDFs for water around lipid N�CH3�3 group at the distance rangeindicated where �a� shows the top 90% of water molecules in this region and�b� shows the top 25% of water molecules at this distance. Only the carbonatoms of the methyl groups are depicted as the methyl hydrogens �HM� havebeen omitted for clarity.
145103-4 Foglia et al. J. Chem. Phys. 133, 145103 �2010�
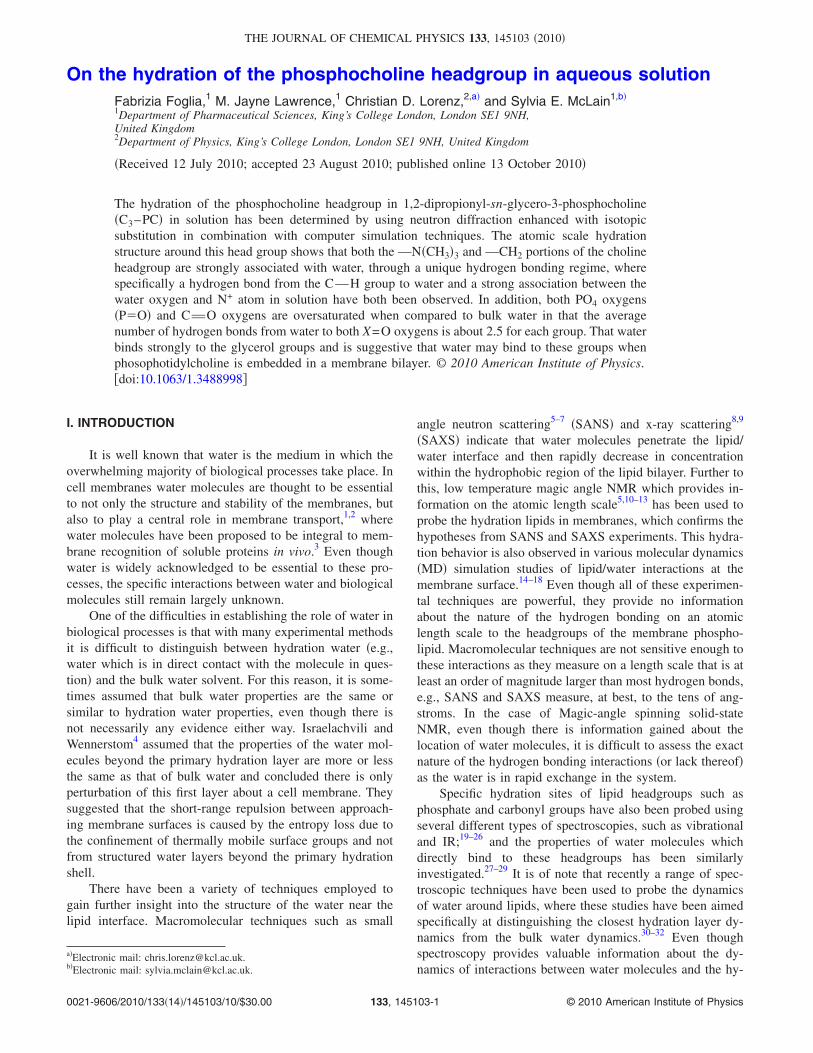
group. In each panel of Fig. 5, the representative water mol-ecule on the central axis is further rotated toward its mostprobable average position.
Figure 5�a� shows the OCF for the waters directly abovethe z-axis in Fig. 4�a� at the position r=2.5–4.05 Å, �=0°,�=0° relative to the onium headgroup on the central axis. Atthis location, the orientation of the water molecules isroughly tangential to the onium headgroup, with a tendencyfor the water hydrogens to point slightly away from theN�CH3�3 group on the average. Figures 5�b� and 5�c� showthe OCFs for water molecules located in the collar below thexy plane in Fig. 4 where specifically Fig. 5�b� shows theorientation in the direction of the positive x-axis just belowthe xy plane and Fig. 5�c� shows the OCF at the same loca-tion below the xy plane in the positive y direction—e.g.,rotated 90° from the position of the OCF in Fig. 5�b�. Here,again the most likely orientation of water molecules pointaway from the onium headgroup.
Consistent with the water-onium RDFs �Fig. 3�, thebroad distribution shells for the water orientations shown inFig. 5 suggests the water molecules are highly disorderedaround the onium headgroup. The preferred direction of thewater orientation about the onium headgroup is with the mol-ecules arranged so as to maximize their interaction with thebulk water solvent rather than with this group. In general, thewater is oriented with its positive dipole pointing away fromthe central onium group, indicating that the inside surface of
the water cavity where the onium group is located likelypossess a slight negative charge and as such can remain“bound” to the onium headgroup.
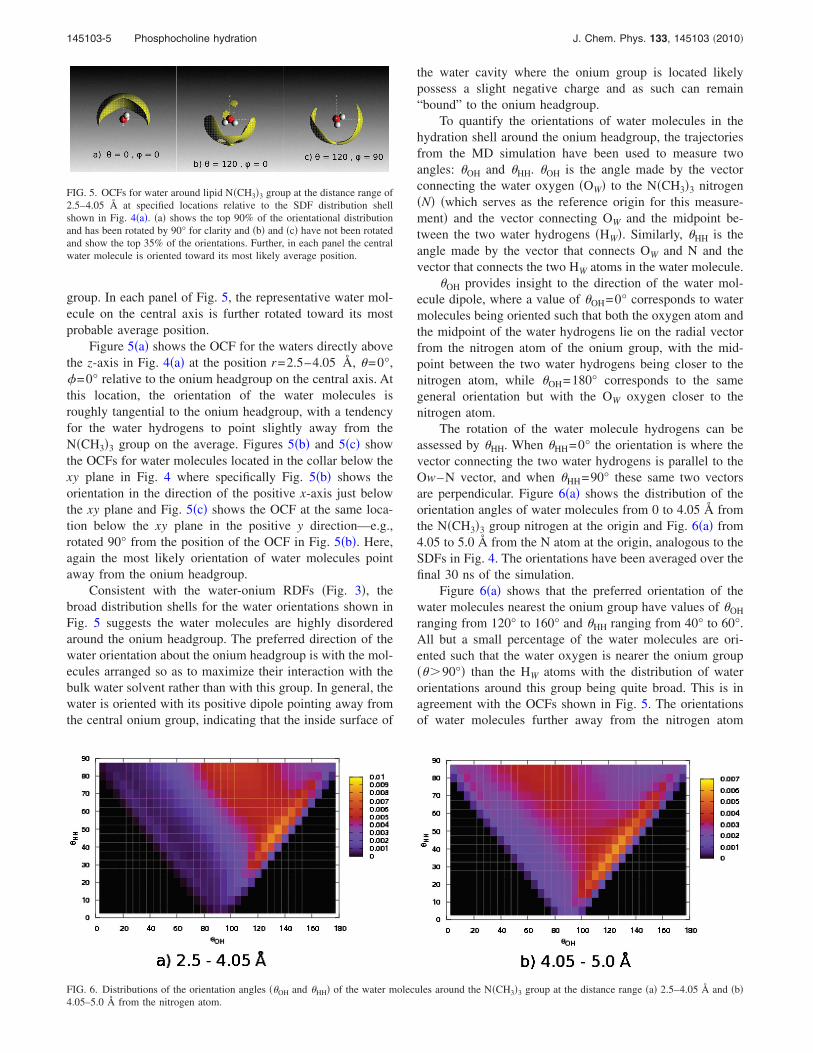
To quantify the orientations of water molecules in thehydration shell around the onium headgroup, the trajectoriesfrom the MD simulation have been used to measure twoangles: �OH and �HH. �OH is the angle made by the vectorconnecting the water oxygen �OW� to the N�CH3�3 nitrogen�N� �which serves as the reference origin for this measure-ment� and the vector connecting OW and the midpoint be-tween the two water hydrogens �HW�. Similarly, �HH is theangle made by the vector that connects OW and N and thevector that connects the two HW atoms in the water molecule.
�OH provides insight to the direction of the water mol-ecule dipole, where a value of �OH=0° corresponds to watermolecules being oriented such that both the oxygen atom andthe midpoint of the water hydrogens lie on the radial vectorfrom the nitrogen atom of the onium group, with the mid-point between the two water hydrogens being closer to thenitrogen atom, while �OH=180° corresponds to the samegeneral orientation but with the OW oxygen closer to thenitrogen atom.
The rotation of the water molecule hydrogens can beassessed by �HH. When �HH=0° the orientation is where thevector connecting the two water hydrogens is parallel to theOw–N vector, and when �HH=90° these same two vectorsare perpendicular. Figure 6�a� shows the distribution of theorientation angles of water molecules from 0 to 4.05 Å fromthe N�CH3�3 group nitrogen at the origin and Fig. 6�a� from4.05 to 5.0 Å from the N atom at the origin, analogous to theSDFs in Fig. 4. The orientations have been averaged over thefinal 30 ns of the simulation.
Figure 6�a� shows that the preferred orientation of thewater molecules nearest the onium group have values of �OH
ranging from 120° to 160° and �HH ranging from 40° to 60°.All but a small percentage of the water molecules are ori-ented such that the water oxygen is nearer the onium group�� 90°� than the HW atoms with the distribution of waterorientations around this group being quite broad. This is inagreement with the OCFs shown in Fig. 5. The orientationsof water molecules further away from the nitrogen atom
FIG. 5. OCFs for water around lipid N�CH3�3 group at the distance range of2.5–4.05 Å at specified locations relative to the SDF distribution shellshown in Fig. 4�a�. �a� shows the top 90% of the orientational distributionand has been rotated by 90° for clarity and �b� and �c� have not been rotatedand show the top 35% of the orientations. Further, in each panel the centralwater molecule is oriented toward its most likely average position.
FIG. 6. Distributions of the orientation angles ��OH and �HH� of the water molecules around the N�CH3�3 group at the distance range �a� 2.5–4.05 Å and �b�4.05–5.0 Å from the nitrogen atom.
145103-5 Phosphocholine hydration J. Chem. Phys. 133, 145103 �2010�

�Fig. 6�b�� also shows that the majority of water moleculesare oriented with the OW atom closer to the onium group,however the distribution becomes more broad than at thecloser distances with some water molecules oriented withtheir HW atoms pointing toward nitrogen. This is most likelydue to the water molecules forming hydrogen bonds withother waters nearer to the onium group.
Assessment of the MD trajectories gives a consistentpicture to the EPSR fits to the diffraction data, namely, thatthe onium headgroup forms a strong association with thesurrounding water solvent via its N+
uOW interactions butthere is no apparent hydrogen bonding between water andthis group. This allows the onium group to remain largelysoluble, even though its methyl groups are largely hydropho-bic in nature, while the surrounding water molecules canbond to the bulk water solvent.
B. Hydration of the ACH2ACH2 group
Figure 7 shows the RDFs for the interactions betweenthe water molecules the closest hydrogens �HL� to the oniumgroup on the choline tail �the uCH2uCH2u� linkage be-tween the onium headgroup and the phosphate group in Fig.1. The other atoms in this group, �Ha and Ct� are not shownas they are not unique to this particular site, but rather aredistributed around the molecule and as such will not givemuch direct information about the hydration at this particularlocation in the molecule. Because it is computationally ex-pensive to run simulations with each atom labeled individu-ally, especially in the case of EPSR, many similar atomicsites have been labeled identically for this investigation �Fig.1�.
In Fig. 7 the gHLOw�r� for both MD and EPSR modelsshows a small peak at about 2 Å where the coordinationnumber of this peak is nHL
Ow1.0 at 2.7 Å signifying, al-though at a fairly long distance, a hydrogen bond from thisethylene hydrogen to water. This is surprising and significantwhen coupled with the onium hydration. It appears that thewater molecules around the choline headgroup �onium
+CH2uCH2 tail� are bound in some fashion to the collararound the nitrogen atom and also form a further hydrogenbond at this position. Consistent with the appearance of wa-ter molecules below the xy plane which are oriented with theHW atoms pointed away from the onium group, this CH2
group closest to the onium group shows a further hydrogenbond to these water molecules in the EPSR fits to the data aswell as in the MD simulation. Water-binding to this CHgroup has been also been seen in ab initio calculations ofphosphocholine headgroups in the presence of water, whereit was noted that these moieties needed to be consideredwhen considering the interaction potentials of the PC head-groups in solution and in a membrane.26
C. Hydration of the phosphate group
Figure 8 shows the RDFs for the PO4 group-water cor-relations as labeled in Fig. 1. Both the MD and EPSR modelsshow clear evidence for hydrogen bonding from the watermolecules to the PvO oxygen atoms where the coordina-tion number at the first minimum of the gO2Hw�r� function �at2.4 � is nO2
Hw2.5. Similarly, the gO2Ow�r� function gives acoordination number of 2.5 at around 3 Å which indicatesthat more than one water molecule donates hydrogen bondsto the PvO oxygen atoms. This hydrogen bonding motif isslightly over-hydrated with respect to water as nOw
Hw1.8 inpure water,61 which is somewhat expected as this oxygenatom carries a more negative partial charge than the OW oxy-gen. Also, gO2Hw�r� in Fig. 8 shows two further distinguish-able peaks at larger distances, at around 3.5 and 5 Å wherethe larger distance is most likely related to the HW atomcovalently bound to the water molecule involved in the hy-drogen bonding.
In contrast to the PvO oxygen the PuOuC oxygen�Os1� shows relatively little hydration. This is observable in
0
0.5
1
1.5
2
0 2 4 6 8
r /Å
gHLOw(r)
0
0.5
1
1.5
2gHLHw(r)
FIG. 7. HL hydrogen-water correlations where the solid line represents theEPSR data and the dot-dash line represents the MD simulations.
0
0.5
1
1.5
2
0 2 4 6 8
r /Å
gOs1Ow(r)
0
0.5
1
1.5
2
gPOw(r)
0
0.5
1
1.5
2
2.5
gO2Ow(r)
0 2 4 6 8
r /Å
gOs1Hw(r)
gPHw(r)
gO2Hw(r)
FIG. 8. Phosphate group-water correlations where the solid line representsthe EPSR data and the dot-dash line represents the MD simulations.
145103-6 Foglia et al. J. Chem. Phys. 133, 145103 �2010�

the gOs1Hw�r� function which shows only a small peak at 2 Åwhere the coordination number is 0.6, which is underhy-drated with respect to the PvO and water. This however issomewhat expected with respect to X–O–X oxygens asethers are sparingly soluble in water and as such strong hy-drogen bonding to an oxygen in this semilinear molecularconfiguration is not expected. In both gOs1Hw�r� and gOs1Ow�r�functions there are further distinguishable peak at around 4and 5 Å which are most likely reflective of the O2Hw bondspresent. The total number of water molecules surroundingthe phosphate group in the first hydration shell, ascertainedfrom the coordination number of the first peak minimum inthe gPOw�r� function �4.5 Å�, is 8.
For a comparison, the average number of hydrogenbonds formed between water and the two phosphate groupoxygens, O2 and Os1, were also determined from the MDsimulation. In this case, hydrogen bonds were determined toexist if the distance between an OW atom on water moleculesor either O2 or Os1 phosphate oxygens were within 3.5 Å ofone another and are positioned such that the HO…O angle isgreater than 150°.62 Using this criteria the average number ofhydrogen bonds per PvO oxygen �O2� is 3.2 and perPuOuC oxygen �Os1� is 1.6. The number of hydrogenbonds per PvO oxygen being larger than number of hydro-gen bonds per PuOuC oxygen is consistent with the co-ordination number analysis of the g�r� functions in Fig. 8�Eq. �3��. That the MD simulation gives larger values is notsurprising, as the distance criterion used in this analysis islarger than the distance to either of the minima observed inthe gOs1Hw�r� or gOwHw�r� functions.
The SDFs were also determined from the EPSR modelfor the location of water molecules around the PO4 group�Fig. 9�. Here the PO4 has been placed at the center of thecentral axis. The single bond PuOuC oxygens �Os1� bi-sect the −z-axis in the zx plane at 142° and �142° relative tothe z-axis, underneath the xy plane and the PvO O2 oxy-gens are located along the y-axis at 52° and �52° bisectingthe +z axis in the zy plane, which gives tetrahedral configu-ration for this group. Similar to the onium SDFs Fig. 9�a�shows the SDF in the closest hydration shell at a range of2.5–3.8 Å, where the maximum distance is derived from thepeak maximum in the gPOw�r� function in Fig. 8 while Fig.9�b� show the SDF from 3.8 to 4.5 Å which is the distancefrom the first peak maximum to the first peak minimum; thecoordination numbers are nP
Ow=3.57 at 3.8 Å and nPOw=8 at
4.5 Å.
In both Figs. 9�a� and 9�b� the most probable location ofwater molecules is predominately in the positive z directionabove the xy with no density present below the phosphategroup. Consistent with the RDFs in Fig. 8, there is not muchdensity located around the PuOuC oxygen atoms. In theclosest hydration shell in Fig. 9�a�, the water molecules aremost likely to be found above the z-axis directly above thephosphate group or in bands in front of the PvO atoms inthe zy plane. At further distances this distribution broadens toencompass a band of density both in front of and behind themolecule in both the positive and negative x directions.
In order to probe more deeply into the orientations of thewater molecules closest to the PO4 group, the OCFs for theclosest hydration shell �Fig. 9�a�� have been extracted fromthe model at specific positions indicated in Fig. 10. All of theOCFs depicted here show hydrogen bonding from the hydro-gens of the water molecules to the PvO oxygen atoms atdifferent positions from the SDFs in Fig. 9�a�. Specifically,Fig. 10�a� shows the water OCF directly above the PO4
group in the positive z-direction, which displays a clear hy-drogen bond as the water hydrogen is oriented toward thePO4 group and shows a hydrogen bond being shared betweenthe two OvPvO oxygen atoms.
This water orientation has been observed in otherO–X–O groups which are negatively charged and form aresonance structure with a bond order of around 1.5 per X–Obond.40,42 Figures 10�b� and 10�c� show the water orientationin the lobes which are 45° below the z-axis at two differentpositions where the water molecules are oriented such thatthey can form a hydrogen bond with the PuO oxygen. TheOCFs were only shown at these locations which correspondto the density near the PvO oxygens because the Os1 oxy-gens show very little hydrogen bonding relatively; any OCFat this position yields a broad distribution where an averageorientation is difficult to assess.
Figure 11 shows the distribution of the orientation anglesof the water molecules around the PO4 group from the MDsimulations. Figure 11�a� shows this distribution for mol-ecules within 3.8 Å from the phosphorous atom and Fig.11�b� from 3.8 to 4.5 Å from the phosphorous atom, analo-gous to the SDFs from EPSR in Fig. 9. The definitions of�OH and �HH are similar to those described previously forwater about the onium group �Fig. 6�, although in this in-stance the origin of reference is the phosphorous atom in thePO4 group, rather than the nitrogen atom in the N�CH3�3
group.In Fig. 11�a�, the distribution shows that the water mol-
FIG. 9. SDFs for water around lipid PO4 group at the distance range indi-cated where �a� shows the top 70% of the water molecules in the surround-ing shell and �b� shows the top 50% of the water molecules in the surround-ing shell.
FIG. 10. OCFs for water around PO4 group at the distance range of 2.5–3.8Å at specified locations relative to the SDF distribution shell shown in Fig.9�a�. In each case the top 70% of water molecules are shown and in eachpanel the central water molecule is oriented toward its most likely position.
145103-7 Phosphocholine hydration J. Chem. Phys. 133, 145103 �2010�

ecules nearest PO4 group have a very narrow distribution oforientations, all of them with �OH�90° showing that thewater molecules are oriented with hydrogen atoms nearestthe PO4 group. This is indicative of hydrogen bonding inter-actions between the hydrogen atoms on the water moleculesand the oxygen atoms of the phosphate group. The distribu-tion of �HH is larger than that observed for the water mol-ecules around the N�CH3�3 groups; here the majority of thewater molecules are oriented such that 20° ��HH�70°.However, the range of �HH is �20° for the water moleculeswith any value of �OH, whereas the water molecules in thefirst layer around the N�CH3�3 groups have a much largerdistribution at any value of �OH, see Fig. 6. Generally, thewater molecules in this closest hydration layer adopt an ori-entation such that the hydrogen atoms are nearest the PO4
group, and therefore hydrogen bond with the oxygens in thePO4 group. Moreover, these distributions are much narrowerthan those observed for the water molecules nearest theonium group in Fig. 6, suggesting that water is more stronglyhydrogen bound to this group.
At further distances, Fig. 11�b� shows that a significantpopulation of the water molecules adopt an orientation of�OH�90°, again indicative of hydrogen bonding betweenwater and oxygen atoms of the PO4 group. At this largerdistance there is another collection of water molecules whichhave orientations of �OH 90°, corresponding to the oxygenbeing nearer the PO4 group. This configuration suggests thata portion of the water molecules in this hydration sphere areoriented to form hydrogen bonds with water moleculesnearer the PO4 group. At both distances, the values of �HH
range from 20° to 70°.
D. Hydration of the glycerol groups
Figure 12 shows the between the CvO �Ob; Fig. 1� andCuOuC �Os2; Fig. 1� the oxygens in glycerol group withwater. The ObuHW and ObuOW RDFs from both MD andEPSR show peaks at �2.8 and �1.85 Å, respectively,showing hydrogen bond donated from the water HW to thecarbonyl oxygens �Ob�. The coordination number for gObHWis 2 at 2.5 Å in the EPSR simulation, indicating that thecarbonyl is slightly oversaturated by hydrogen bonding inter-
actions from water. While the EPSR and MD simulations aregenerally consistent for the Ob-water RDFs in terms of peakpositions, EPSR gives larger peak areas. This is likely due tothe fact that slightly higher aggregation between the phos-pholipid molecules is observed in the MD simulation than inthe EPSR simulations. Because one lipid-lipid interactionsite is the carbonyl group of the molecule, some water maybe displaced by this aggregation in the MD simulations andmay be a result of the CHARMM potentials used for thiswork.53–55 Both MD and EPSR simulations show no discern-ible peaks in the RDFs for the hydration of the CuOuCether linkage in Fig. 12, indicating that water is generallydisordered around this group, similar to the hydration of thePuOuC oxygens discussed above.
From the MD simulations, the average number of hydro-gen bonds between these two oxygens and water was alsodetermined. Using the same criteria for the PO4 group oxy-gens above, the average number of hydrogen bonds per oxy-gen atom in the carbonyl group is �2.5 while for the oxygenatom in the ether linkage has less than one hydrogen bond��0.8� with the surrounding water molecules. Again thesedata are consistent with findings from the coordination num-
FIG. 11. Distributions of the orientation angles ��OH and �HH� of the water molecules around the PO4 group at the distance range �a� 2.5–3.8 Å and �b� 3.8–4.5Å from the phosphate atom.
0
0.5
1
1.5
2
0 2 4 6 8
r /Å
gOs2Ow(r)
0
0.5
1
1.5
2
gObOw(r)
0 2 4 6 8
r /Å
gOs2Hw(r)
gObHw(r)
FIG. 12. Glycerol oxygen atoms-water correlations where the solid linerepresents the EPSR data and the dot-dash line represents the MDsimulations.
145103-8 Foglia et al. J. Chem. Phys. 133, 145103 �2010�

bers of the EPSR RDFs in Fig. 12, where again this coordi-nation number is slightly larger from the MD trajectories asthe distance criterion represents a much broader representa-tion of hydrogen bonding.
V. DISCUSSION AND CONCLUSIONS
The zwitterionic phosphocholine headgroup in theC3–PC lipid appears to have a unique combination of bothhydrophobic and hydrophilic interactions with water in solu-tion. While the water molecules in the closest hydration shellaround the onium N�CH3�3 headgroup are highly disordered,there are a significant amount of NuOW contacts that showa fairly strong association between this portion of the oniumheadgroup and the surrounding water solvent. The distribu-tion of these associations is broad when compared with thesame distributions around the PO4 group leaving the waterhydrogens to bind with the bulk water solvent. Interestingly,these NuOW contacts appear to be somewhat stabilized by aunique hydrogen bond from the CH2 group closest to theonium headgroup. This configuration would seem to allowwater to be strongly associated with the N�CH3�3 headgroup,without any hydrogen bond donation from the water hydro-gens �HW� to any part of this group, leaving them, again, ableto freely bind with the surrounding water solvent, where thisunique water-CH moiety has been previously predicted tostabilize phosphotidylcholine molecules. Conversely, thenegatively charged PO4 group shows very strong hydrogenbond donation from water to the PvO oxygens, with theseoxygens being slightly overhydrated with respect to bulk wa-ter hydrogen bonds at 2.5 bonds per oxygen atom. Furtherthe hydration of the glycerol oxygens shows a similar con-figuration in the EPSR simulations but slightly less HW tocarbonyl oxygen hydration in the MD simulations, presum-ably as a result of a small number of aggregates beingformed between the C3–PC in the MD solutions that are notobserved in the EPSR simulations. The solutions were alsoprobed for the formation of clusters or aggregates in solu-tion, in both the neutron diffraction data and MD simula-tions, where it was found that clustering was very limited inboth cases.
The proximity of the different components of the head-group most likely influences the hydration around differentportions of the molecule. For instance, as stated above, theregion around the onium head group which shows the mosthighly oriented water molecules around this group �by virtueof a N+
uOW interaction� could be partly responsible for theexistence of the water-hydrogen bonding interactions withthe CH2 hydrogens. This configuration in turn may influencethe relatively large number of hydrogen bonds seen betweenthe PO4 PvO oxygens and water. Namely, hydrogens fromthe water molecules which are associated with the oniumgroups may be more likely to form hydrogen bonds with thePO4 groups, which could in turn lead to a much higher num-ber of PvOuHW contacts than would be expected withoutthe presence of the nearby onium head group.
This work also provides some insight into the nature ofthe hydration of phosophotidylcholine headgroups in solu-tion. It appears that the more hydrophobic regions of the
headgroup—the onium and CH2uCH2—tail are actuallymore highly associated with water than might be expected,where this water seems to be in a unique configuration thatallows the water to be associated with these portions of theheadgroup in the absence of strong hydrogen bonds. The PO4
group on the other hand forms very strong short hydrogenbonds with water, as do the CvO glycerol groups, indicat-ing that water actually binds further down the phosophotidyl-choline molecule. This finding is consistent with previousMD simulations, which suggest that the strength of the hy-drogen bonds formed by the water molecules near the lipidmembranes are ordered as follows: water-phosphate group water-OuCO water-water.17,63
What implications does this have for membrane hydra-tion? Although the C3–PC molecules investigated here areobviously not situated in a membrane, the nature of hydra-tion in this “dilute” case has implications for phosphotidyl-choline lipid behavior in a membrane. It has been suggestedfrom electrical conductivity measurements that the cholineportion of the headgroup is responsible for the strong waterbinding to lipids in membranes,64 but this appears not to bethe case from the measurements here, which suggest that thePO4 group and CvO form the strongest hydrogen bondswith water. The present study gives no information directlyabout the strength of hydrogen bonds, but the RDFs for thewater bonding to these groups in phosophotidylcholine �Figs.8 and 12� have higher coordination numbers and sharperpeaks when compared with similar functions for the oniumheadgroup �Fig. 3�.
Spectroscopic measurements on membranes suggest thatCvO groups in phosophotidylcholine lipids may be ex-posed to the bulk water solvent, an area deeper with in thehydrophobic portion of the membrane bilayer than was pre-viously assumed.3,65 The hydration regime measured heresupports the view, where water appears to be highly associ-ated with the lipid from the onium head group along to theOuCvO groups in the fatty acid chains. It has also beenproposed that this “interphase” water, may serve a functionalrole in site recognition by target amphiphilic molecules, suchas membrane proteins.66 This water-mediated recognition re-gime is consistent with the hydration seen here of the singlemolecule in solution, however the solvation structure ofthese headgroups in a membrane or membranelike environ-ment need to be investigated before this can be adequatelyjudged. Similar measurements to those presented here onC3–PC above the cmc,33 have been recently obtained by theauthors and a similar analysis is currently underway.
ACKNOWLEDGMENTS
The authors thank the EPSRC �Grant No. EP/F021291/1� for monies for F. Foglia, Wellcome Trust formonies for S. E. McLain, and the ISIS facility for the allo-cation of neutron beam-time. We also thank A. K. Soper�ISIS, STFC� for useful discussions and S. Imberti �ISIS,STFC� for assistance with the SANDALS experiments.
1 P. M. Wiggins and R. T. van Ryn, Biophys. J. 58, 585 �1990�.2 E. Reimhult, F. Hook, and B. Kasemo, Langmuir 19, 1681 �2003�.
145103-9 Phosphocholine hydration J. Chem. Phys. 133, 145103 �2010�
3 E. A. Disalvo, F. Lairion, F. Martini, E. Tymczyszyn, M. Frias, H. Alma-leck, and G. J. Gordillo, Biochim. Biophys. Acta 1778, 2655 �2008�.
4 J. Israelachvili and H. Wennerstron, Nature �London� 379, 219 �1996�.5 S. König, E. Sackmann, D. Richter, R. Zorn, C. Carlile, and T. Bayed, J.Chem. Phys. 100, 3307 �1994�.
6 R. Jacobs and S. White, Biochemistry 28, 3421 �1989�.7 M. C. Rheinstýýdter, T. Seydel, F. Demmel, and T. Salditt, Phys. Rev. E
71, 061908 �2005�.8 R. H. Pearson and I. Pascher, Nature �London� 281, 499 �1979�.9 G. Vanderkooi, Biochemistry 30, 10760 �1991�.
10 P. Yeagle and R. Martin, Biochem. Biophys. Res. Commun. 69, 775�1976�.
11 C. Schmidt, Y. Barenholz, C. Huang, and T. Thompson, Biochemistry16, 3948 �1977�.
12 J. Smaby, A. Hermetter, P. Schmid, F. Paltauf, and H. Brockman, Bio-chemistry 22, 5808 �1983�.
13 Z. Zhou, B. Sayer, D. Hughes, R. Stark, and R. Epand, Biophys. J. 76,387 �1999�.
14 Y. Takaoka, M. Pasenkiewicz-Gierula, H. Miyagawa, and K. Kitamura,Biophys. J. 79, 3118 �2000�.
15 K. Aman, O. Edholm, P. Hakanson, and P.-O. Westlund, Biophys. J. 84,102 �2003�.
16 C. Lopez, S. Nielsen, M. Klein, and P. Moore, J. Phys. Chem. B 108,6603 �2004�.
17 S. Bhide and M. Berkowitz, J. Chem. Phys. 123, 224702 �2005�.18 J. Chanda, S. Chakraborty, and S. Bandyopadhyay, J. Phys. Chem. B
110, 3791 �2006�.19 J. Arrondo, F. Goni, and J. Macarulla, Biochim. Biophys. Acta 794, 165
�1984�.20 H. L. Casal and H. H. Mantsch, Bioch. Biophys. Acta, 779, 381 �1984�.21 R. Dluhy, B. Chowdhry, and D. Cameron, Biochim. Biophys. Acta 821,
437 �1985�.22 A. Blume, W. Hubner, and G. Messner, Biochemistry 27, 8239 �1988�.23 L. Ter-Minassian-Saraga, E. Okamura, J. Umemura, and T. Takenaka,
Biochim. Biophys. Acta 946, 417 �1988�.24 W. Pohle, C. Selle, H. Fritzsche, and H. Binder, Biospectroscopy 4, 267
�1998�.25 H. Binder, Appl. Spectrosc. Rev. 38, 15 �2003�.26 W. Pohle, D. Gauger, M. Bohl, E. Mrazkova, and P. Hobza, Biopolymers
74, 27 �2004�.27 J. Grdadolnik, J. Kidric, and D. Hadzi, Chem. Phys. Lipids 59, 57
�1991�.28 S. Kint, P. Wermer, and J. Scherer, J. Phys. Chem. 96, 446 �1992�.29 H. Binder, A. Anikin, B. Kohlstrunk, and G. Klose, J. Phys. Chem. B
101, 6618 �1997�.30 R. K. Campen, T. T. M. Ngo, M. Sovago, J.-M. Ruysschaert, and M.
Bonn, J. Am. Chem. Soc. 132, 8037 �2010�.31 K. J. Tielrooij, D. Paparo, L. Piatkowski, H. J. Bakker, and M. Bonn,
Biophys. J. 97, 2484 �2009�.32 M. Bonn and R. K. Campen, Surf. Sci. 603, 1945 �2009�.33 S. F. Martin and G. E. Pitzer, Biochim. Biophys. Acta 1464, 104 �2000�.34 S. Dixit, J. Crain, W. C. K. Poon, J. L. Finney, and A. K. Soper, Nature
�London� 416, 829 �2002�.35 H. Thompson, J. C. Wasse, N. T. Skipper, S. Hayama, D. T. Bowron, and
A. K. Soper, J. Am. Chem. Soc. 125, 2572 �2003�.
36 D. T. Bowron, J. L. Finney, and A. K. Soper, J. Am. Chem. Soc. 128,5119 �2006�.
37 A. K. Soper and R. N. Silver, Phys. Rev. Lett. 49, 471 �1982�.38 S. E. McLain, C. J. Benmore, J. E. Siewenie, J. Urquidi, and J. F. C.
Turner, Angew. Chem., Int. Ed. 43, 1952 �2004�.39 S. E. McLain, A. K. Soper, I. Daidone, J. C. Smith, and A. Watts, Angew.
Chem., Int. Ed. 47, 9059 �2008�.40 S. E. McLain, A. K. Soper, A. E. Terry, and A. Watts, J. Phys. Chem. B
111, 4568 �2007�.41 E. C. Hulme, A. K. Soper, S. E. McLain, and J. L. Finney, Biophys. J.
91, 2371 �2006�.42 S. E. McLain, A. K. Soper, and A. Watts, J. Phys. Chem. B 110, 21251
�2006�.43 C. Malardier-Jugroot, D. T. Bowron, A. K. Soper, M. E. Johnson, and T.
Head-Gordon, Phys. Chem. Chem. Phys. 12, 382 �2010�.44 S. E. Pagnotta, S. E. McLain, A. K. Soper, F. Bruni, and M. A. Ricci, J.
Phys. Chem. B 114, 4904 �2010�.45 P. E. Mason, G. W. Neilson, C. E. Dempsey, D. L. Price, M.-L. Saboungi,
and J. W. Brady, J. Phys. Chem. B 114, 5412 �2010�.46 V. F. Sears, Neutron News 3, 26 �1992�.47 A. K. Soper, Phys. Rev. B 72, 104204 �2005�.48 S. E. McLain, A. K. Soper, and A. Luzar, J. Chem. Phys. 124, 074502
�2006�.49 I. M. Svishchev and P. G. Kusalik, Chem. Phys. Lett. 215, 596 �1993�.50 I. M. Svishchev and P. G. Kusalik, J. Chem. Phys. 99, 3049 �1993�.51 C. G. Gray and K. E. Gubbins, Theory of Molecular Liquids Vol. I:
Fundamentals �Oxford University Press, Oxford, 1984�.52 A. K. Soper, W. S. Howells, and A. C. Hannon, ATLAS: Analysis for
Time-of-Flight Diffraction Data from Liquid and Amorphous Samples�ISIS Facility, Chilton, 1989�.
53 S. E. Feller and A. D. MacKerell, Jr., J. Phys. Chem. B 104, 7510 �2000�.54 J. B. Klauda, B. R. Brooks, A. D. MacKerell, R. M. Venable, and R. W.
Pastor, J. Phys. Chem. B 109, 5300 �2005�.55 J. Hénin, W. Shinoda, and M. L. Klein, J. Phys. Chem. B 112, 7008
�2008�.56 H. Berendsen, J. Grigera, and T. Strastsma, J. Phys. Chem. 91, 6269
�1987�.57 J. P. Ryckaert, G. Ciccotti, and H. J. C. Berendsen, J. Comput. Phys. 23,
327 �1977�.58 S. Plimpton, J. Comput. Phys. 117, 1 �1995�.59 R. W. Hockney and J. W. Eastwood, Computer Simulation Using Par-
ticles �Adam Hilger, New York, 1988�.60 D. T. Bowron, J. L. Finney, and A. K. Soper, J. Phys. Chem. B 102, 3551
�1998�.61 A. K. Soper, Chem. Phys. 258, 121 �2000�.62 A. Luzar and D. Chandler, Phys. Rev. Lett. 76, 928 �1996�.63 G. Klose, K. Arnold, G. Peinel, H. Binder, and K. Gawrisch, Colloids
Surf. 14, 21 �1985�.64 G. L. Jendrasiak and R. L. Smith, Chem. Phys. Lipids 131, 183 �2004�.65 J. Nagel and S. Tristam-Nagel, Biochim. Biophys. Acta 1469, 159
�2000�.66 S. Diaz, A. C. Amalfa, D. A. B. de Lopez, and E. A. Disalvo, Langmuir
15, 5179 �1999�.
145103-10 Foglia et al. J. Chem. Phys. 133, 145103 �2010�


