Embed Size (px)
Citation preview

Accepted Manuscript
On the time of minimum ionization in the F2 region
R.G. Ezquer, M.A. Cabrera, M. Mosert, S.M. Radicella, Y. Migoya Orué
PII: S0273-1177(08)00103-8
DOI: 10.1016/j.asr.2007.07.049
Reference: JASR 9418
To appear in: Advances in Space Research
Received Date: 18 April 2007
Revised Date: 25 June 2007
Accepted Date: 3 July 2007
Please cite this article as: Ezquer, R.G., Cabrera, M.A., Mosert, M., Radicella, S.M., Migoya Orué, Y., On the time
of minimum ionization in the F2 region, Advances in Space Research (2008), doi: 10.1016/j.asr.2007.07.049
This is a PDF file of an unedited manuscript that has been accepted for publication. As a service to our customers
we are providing this early version of the manuscript. The manuscript will undergo copyediting, typesetting, and
review of the resulting proof before it is published in its final form. Please note that during the production process
errors may be discovered which could affect the content, and all legal disclaimers that apply to the journal pertain.

ACCEPTED MANUSCRIPT
On the time of minimum ionization in the F2 region R. G. Ezquer 1,2,3, M. A. Cabrera 1,2, M. Mosert 3,4, S. M. Radicella 5, and Y. Migoya Orué 1 1GASuR, Facultad Regional Tucumán, Universidad Tecnológica Nacional, Rivadavia 1050, 4000 S.M.Tucumán, Argentina 2 Laboratorio de Ionósfera, Dto. de Física, Universidad Nacional de Tucumán, Independencia 1800, 4000 S. M. Tucumán, Argentina [E-mail: [email protected]] 3 CONICET, Argentina 4 CASLEO, Avda España 1512-Sur, 5400 San Juan, Argentina[E-mail: [email protected]] 5 ARPL, ICTP, Italy Abstract
Using measurements of the critical frequency of F2 region (foF2) the validity of the International Reference Ionosphere model to predict the time of minimum ionization is checked. Data obtained at different ionospheric stations have been considered, The CCIR and URSI options are used to model calculations. For CCIR option the results show that good predictions were obtained for about 40% of the considered cases. For the rest of the considered data, the model predicts the minimum at times earlier than that observed in the measurements. The percentages of good predictions obtained with URSI option are lower than those corresponding to CCIR one.
1 Introduction
Several models physical, empirical and semiempirical (e.g. Anderson, 1973; Barghausen et al., 1969; Bent et al.,1976; Llewellyn and Bent, 1973; Bilitza, 1990, 2000; Anderson et al., 1987) have been developed to predict ionospheric variables. One of the most used empirical models is the International Reference Ionosphere (IRI) (Bilitza, 1990, 2000). The IRI has undergone several years of critical checking and improving by the international science community. Comparison among IRI predictions and different ionospheric measurements as maximum electron density (NmF2) and its height (hmF2), electron density (N) profile, total electron content (TEC), electron and ion temperature have been done (Bilitza et al.,2000; Bhuyan et al., 2002; Ezquer et al., 2002, Figurski and Wielgosz, 2002; Leitinger et al., 2002; Adeniyi et al., 2003; Bradley et al., 2003; Medeiros et al., 2003, among others).
In previous works, Ezquer et al. (1996, 2003) used measurements of the critical frequencies of the ionospheric regions (foE, foF1 and foF2) and propagation parameter M(3000)F2 obtained at South American stations to check the validity of IRI model as predictor of those frequencies and hmF2. Ezquer et al. (1996) found good foE and foF1 modelled values. The degree of accuracy among experimental and calculated foF2 values was lower than those observed for the other frequencies, which is due to higher variability in the F2 region. The results obtained by Ezquer et al. (2003) suggest that, in general, the standard option of the model gives good hmF2 modelled values at South American latitudes. Few cases showed deviation between calculated and experimental hmF2 values greater than 15%. In the framework of IRI Task Force Activity meetings, studies on time of minimum foF2 predicted by IRI have been required. In this paper, in order to extend the IRI validation studies we compare the time of

ACCEPTED MANUSCRIPT
minimum in foF2 given by IRI with that observed at stations in the American sector, Japan, Philippines and Australia. 2 Data and results Data obtained at the American stations shown in Table 1, correspond to high (1958 and 1959) and low (1964 and 1965) solar activity.
Measurements obtained at stations placed at Japan, Philippines and Australia shown in Table 2, which correspond to 1965, 1966, 1975, 1976 and 1977 (low solar activity – LSA); and 1968, 1969 and 1970 (high solar activity - HSA), are also considered.
In this work, median is used as monthly value because it has the advantage of being less affected by large deviations in the value of foF2 that can occur during magnetic storms.
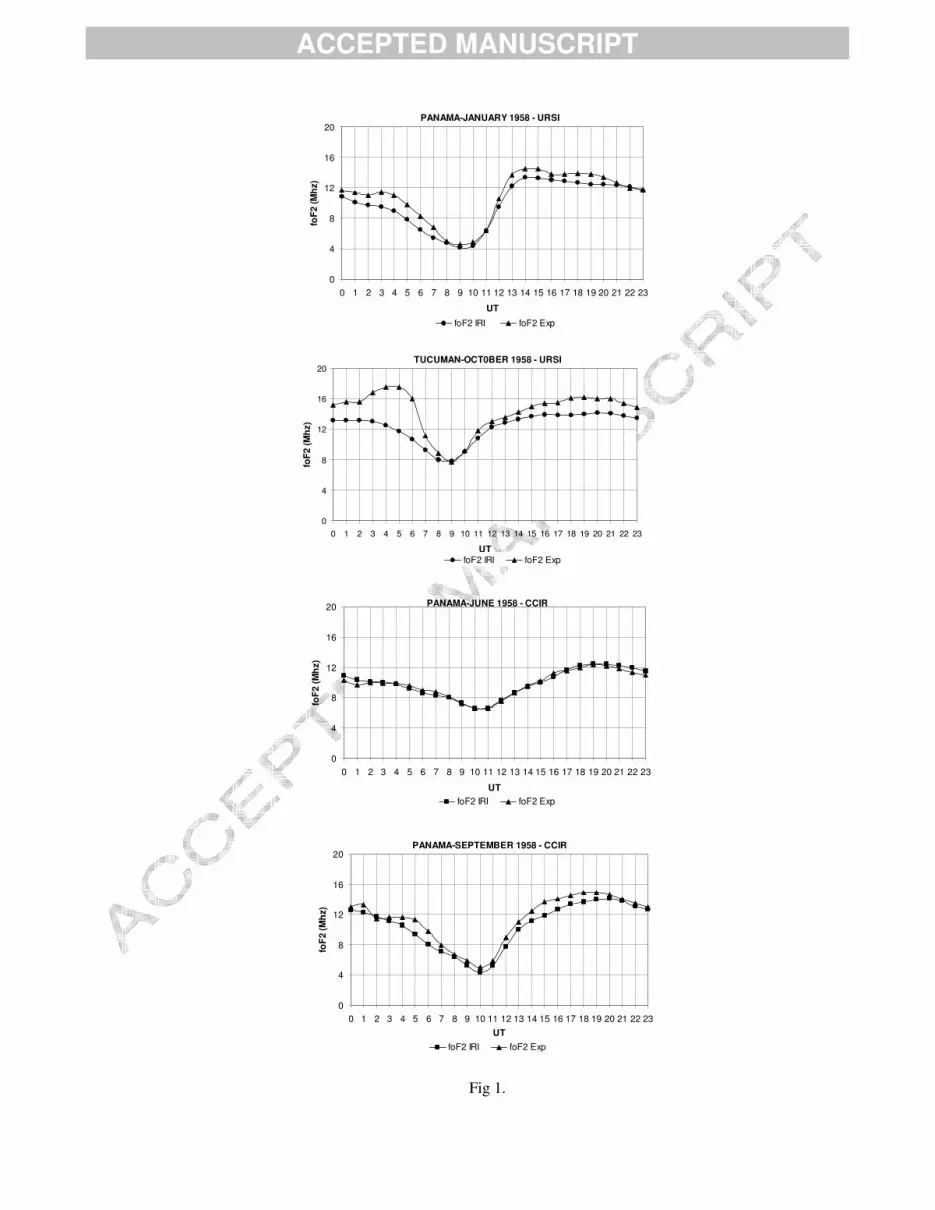
To obtain foF2 modelled values we used the CCIR and URSI options of IRI model. Figure 1 shows cases where good predictions of the time of minimum in foF2 value were observed at the
American sector. Sometimes the model predicts the minimum in foF2 at earlier times than those observed in the
measurements. Figures 2 and 3 show examples corresponding to the American sector for which the difference between predicted and observed time of minimum in foF2 is 1 and 2 hours, respectively.
Some of worst results are illustrated in figure 4 where is difficult to see the time of the minimum value of foF2.
We calculated the difference between predicted and observed time of minimum foF2 as follows: �t min = t min IRI – t min exp (1) where t min IRI is the time of minimum in foF2 given by the model and t min exp is that obtained from the measurements.
Table 3 shows the results for the American sector corresponding to the high solar activity year 1958. The white cells correspond to good model predictions. The results where the absolute value of difference between predicted and observed time of minimum in foF2 ranges from 0. 5 to 1 hour are shown in grey cells and those with values greater than 1 hour are shown in black cells. The dashed cells correspond to the cases without experimental data. For URSI option, it can be seen that the good predictions are more frequent for the northern stations. This table shows that better predictions are obtained with the CCIR option. The worst results correspond to the high latitude stations. In general, the model gives the minimum in foF2 at times earlier than that observed in the data.
Table 4 corresponds to American sector and the low solar activity year 1965. Few good predictions are observed with the URSI option.
Related to the other network, tables 5 and 6 show the results for LSA and HSA, respectively. Only Wakkanai shows �t min absolute values greater than 1,5 hour for few cases. Again, better predictions are obtained with CCIR option.
The results for all the considered cases are shown in figures 5 and 6. It can be seen that, for has, CCIR gives good predictions for 60% and 52% of the considered cases for the American and Asiatic-Australian networks, respectively, while URSI gives good predictions for 30% and 23% of the cases. For LSA these percentages are 38% and 39% for CCIR option and 11% and 23% for URSI option. These results show that the sunrise minimum in foF2 is often shifted by 1 or even 2 hours compared to the CCIR and URSI foF2 model; fewer such cases are seen with the CCIR model. A likely cause could be the use of a Sector Local Times instead of Solar Local Times for ionosonde data that were used in developing the CCIR and URSI maps. 3 Conclusions
A study on the validity of the International Reference Ionosphere model to predict the time of minimum ionization has been done.
Data obtained in the American sector, Japan, Philippines, and Australia have been considered. With CCIR option, the results show that good predictions were obtained for about 50% and 40% of the
considered cases for high and low solar activity, respectively. For the other cases, in general, the model

ACCEPTED MANUSCRIPT
predicts the minimum at times earlier than that observed in the data. The percentages of good predictions obtained with URSI option are lower than those corresponding to CCIR one.
Cases with �t min absolute values greater than 1 hour have been observed, particularly for high latitudes in the American sector.
In order to improve the performance of IRI model, additional studies considering other stations and conditions are needed. References Adeniyi, J. O., Bilitza, D., Radicella, S.M., et al., Equatorial F2-peak parameters in the IRI model, Adv. Space Res. 31,
3, 507-512, 2003. Anderson, D.N., A theoretical study of the ionospheric F-region equatorial anomaly, II, Results in the American and
Asian sectors, Planet. Space Sci., 21, 421-428, 1973. Anderson, D.N., Mendillo, M. and Hertniter B., A semiempirical low latitude ionospheric model. Radio Sci. 22, 292-
306, 1987. Barghausen, A.L., Finney, J.W., Proctor, L.L. et al., Predicting long-term operational parameters of high frequency sky-
wave telecommunication systems, ESSA Tech. Rept. ERL 110-ITS 78, Boulder, Colorado, 1969. Bent, R.B., Llewelyn, S.K., Nesterczuk, G., et al., The development of highly successful worldwide empirical
ionospheric model its use in certain areas of space communications and world-wide total electron content investigations. In: Goodman, J. (Ed.). Effect of the ionosphere on Space Systems and Communications. Springfield, Va, 13-28, 1976.
Bilitza, D., International Reference Ionosphere, Rep. NSSDC/WDC-A-R&S 90-22. National Space Science Data Center / World Data A for Rockets and Satellites, 43-77, 1990.
Bilitza, D., Radicella, S.M., Reinisch, B.W., et al., New B0 and B1 models for IRI, Adv. Space Res. 25, 1, 89-95, 2000.
Bradley, P., Ingesting a sporadic-E model to IRI, Adv. Space Res. 31, 3, 577-588, 2003. Bhuyan, P. K., Kakoty, P.K., Garg, S.C., et al., Subrahmanyam, Electron and ion temperature and electron density at +
10º magnetic latitudes from SROSS C2 measurements over India and comparison with the IRI, Adv. Space Res. 29, 6, 865-870, 2002.
Ezquer, R.G., Del V. Oviedo, R. and Jadur, C.A., Ionospheric predictions for South American latitudes, Radio Sci., 31, 381-388, 1996.
Ezquer, R.G., Cabrera, M.A., Mosert, M., et al., Comparison between measured electrón density at 600 km of altitude and IRI predictions, Adv. Space Res. , 29, 6, 883-886, 2002.
Ezquer, R.G., Scidá, L., Mansilla, G.A., et al., F2 region maximum electron density height predictions for South American latitudes, Radio Sci., 38, N° 4, 15.1 – 15.11, 2003.
Figurski, M. and Wielgosz, P., Intercomparison of TEC obtained from the IRI model to the one derived from GPS measurements, Adv. Space Res., 30, 11, 2563-2568, 2002.
Leitinger, R., Radicella, S.M., Hochegger, G., et al., Diffusive equilibrium models for the height region above the F2 peak, Adv. Space Res. 29, 6, 809-814, 2002.
Llewellyn, S.K. and Bent, R.B., Documentation and Description of the Bent ionospheric model, AFCRL-TR-73-0657, AD 772733, Air Force Cambridge Research Laboratory, Bedford, MA, 1973.
Medeiros R. T., Souza, J.R., Abdu, M.A., et al., Comparisons of IRI model and electron density data for the sub-equatorial station, Natal, Adv. Space Res. 31, 3, 557-561, 2003.

ACCEPTED MANUSCRIPT
Table 1. American Station list
Station Geog. La. Geog. Lo. Geom. La. Geom. Lo. Puerto Rico 18,50 292,90 29,20 3,00 Panamá 9,40 280,10 20,60 349,30 Bogotá 4,50 285,80 15,90 355,40 Talara -4,60 278,70 6,60 348,50 Chiclayo -6,80 280,20 4,40 350,00 Huancayo -12,00 284,70 -0,70 354,60 La Paz -16,50 291,90 -5,10 1,60 Natal -5,70 324,80 3,70 34,50 San Pablo -23,50 313,50 -13,00 21,90 Tucumán -26,90 294,60 -15,50 4,10 Buenos Aires -34,50 301,50 -23,30 10,10 Concepción -36,60 287,00 -25,20 357,20 Pt. Stanley -51,70 302,20 -40,50 9,80 Islas Argentinas. -65,25 295,73 -53,90 3,90
Table 2. Asiatic - Australian stations list
Station Geog. La. Geog. Lo. Geom. La. Geom. Lo. Wakkanai 45.39 141.68 35.33 206.45 Yamagawa 31.20 130.60 20.36 198.25 Manila 14.39 120.59 3.09 189.76 Vanimo -2.70 141.30 -12.53 211.57 Townsville -19.30 146.70 -28.39 219.28 Hobart -42.90 147.30 -51.61 224.92

ACCEPTED MANUSCRIPT
Table 3. �t min = t min IRI – t min exp, in hours. American sector. High solar activity year 1958.
URSI JAN FEB MAR APRIL MAY JUNE JULY AUG SEPT OCT NOV DEC
PT. RICO 1 0 0 0 -1 0 -1 0 0 1 1PANAMA 0 -1 0 -1 0 -1 0 -1 0 -1 -1 0BOGOTA 0 -1 -1 -1 -1 0 0 0 -1 -1 0 0TALARA -1 -1 -1 -1 -1 -1 -1 -1 -2 -1 -1CHICLAYO -1 -1 -1 -1 -1 -1 -1 -1 -1 -1 -1HUANCAYO -1 0 -1 -1 -1 -1 -2 -1 -1 -1 -1 -1LA PAZ -1 -1 -1 -1 -1 -1 -1 -1 -1 0 0 1NATAL 1 -1 0 -1 -1 -1 -0.5 0 0SAN PABLO -1TUCUMAN 0 0 -1 0 -1 -1 -1 -1 0 0 0BS.AS.CONCEPCION 0 1 0 -1 -1 -1 -2 -1.5 -1 0 0 0PT. STANLEY 1 -1 -2 -1.5 -2 -2 -2 -2 -1 0 0 0IS. ARGENTINAS -3 -1 -3 1 2 4 4 -1 1 -3 12 10
CCIR JAN FEB MAR APRIL MAY JUNE JULY AUG SEPT OCT NOV DEC
PT. RICO 1 0 0 0 -1 0 -0.5 0 0 1 1PANAMA 1 0 0 0 1 0 0 -1 0 0 0 1BOGOTA 1 0 0 0 0 0 0 0 0 -1 0 0TALARA -1 -1 0 0 0 -1 -1 -1 -1 0 0CHICLAYO 0 -1 -1 -1 0 0 -1 0 0 0 0HUANCAYO 0 0 0 0 0 0 -1 0 0 0 -1 0LA PAZ 0 0 -1 -1 0 0 0 0 -1 0 0 1NATAL -0.5 -0.5 1 -1 -1 -1 -1 0 0SAN PABLO 0TUCUMAN 0 0 -1 0 -1 -1 0 -1 0 0 0BS.AS.CONCEPCION 0 2 0 0 0 0 -2 -0.5 -1 0 0 0PT. STANLEY 0 0 -1 -2.5 -4 -4 -3 -4 -1 0 -1 -1IS. ARGENTINAS 5 -1 5 1 2 5 3 0 2 -2 0 8
Dashed cells: No data
Dashed cells: No data

ACCEPTED MANUSCRIPT
Table 4. �t min = t min IRI – t min exp, in hours. American sector. Low solar activity year 1965.
URSI JAN FEB MAR APRIL MAY JUNE JULY AUG SEPT OCT NOV DEC
PT. RICOPANAMABOGOTA -1 -1 -1 -1 -1 -1 -1 -1 -1 -1 1.5 -1TALARA -1 -1 -1.5 -1 -1 -0.5 -1 -1 -1.5 -1 -0.5 0CHICLAYOHUANCAYO -1 -1 -1 -1 -1 -2 -1 -1 -1 -1 -1 -1LA PAZ -1 0 -1 -1 -1 -0.5 -1 -1 -1.5NATALSAN PABLOTUCUMAN -1 -1.5 -1 -1 0 0 -0.5 0BS.AS.CONCEPCION 0 -1 -1 -1 -2 -2 -2 -1 0 0 -1PT. STANLEY 0 -0.5 -1 -2 -2.5 -3 -2.5 -2 -2 -1.5 0 0IS. ARGENTINAS -1 -12 -0.5 -1 -3 -3 -3 -3 -2 0 6 -3
CCIR JAN FEB MAR APRIL MAY JUNE JULY AUG SEPT OCT NOV DEC
PT. RICOPANAMABOGOTA -1 0 0 0 0 0 0 0 -1 -1 1.5 -1TALARA 0 0 -1 -0.5 -1 -0.5 -1 -1 -1 0 0.5 1CHICLAYOHUANCAYO -1 0 0 0 0 -1 -1 -0.5 0 -1 -1 -1LA PAZ 0 0 -1 -1 -0.5 1 0 -0.5 -1NATALSAN PABLOTUCUMAN -1 -1 -0.5 -1 0 0 0.5 0BS.AS.CONCEPCION 0 0 0 0 -1 -1 -1 0 0 0 -1PT. STANLEY -1 0 0 -3 -3.5 -4 -3 -3 0 -2 -1 0IS. ARGENTINAS -8 -12 -1 -1 -3 -1 -1 -4 -3 -1 -11 -5
Dashed cells: No data
Dashed cells: No data

ACCEPTED MANUSCRIPT
Table 5. �tmin = tmin IRI - tmin exp, in hours. Asiatic Australian sector. Low solar activity year 1966.
URSI WAKKANAI YAMAGAWA MANILA VANIMO TOWNSVILLE HOBARTJANUARY -2 0 0 -0.5 0 -0.5FEBRUARY -2 -1 0 0 0 -0.5MARCH -1 0 -1 0 -1APRIL -1 -1 -1 -1 -1MAY -1 -1 -1JUNE -1 -1JULY -1 -1 -1AUGUST -1 -1 -1 -1SEPTEMBER -1 -1 -1 -1 -0.5 -1OCTOBER -1 -1 -0.5 -1 -1 0NOVEMBER -1 0 -0.5 -1 -0.5 0DECEMBER -2 -1 -0.5 -0.5 0 0
CCIR WAKKANAI YAMAGAWA MANILA VANIMO TOWNSVILLE HOBARTJANUARY -1 0 0 -0.5 0 -0.5FEBRUARY -1 -1 0 0 0 -0.5MARCH -1 0 -0.5 0 -0.5APRIL -1 0 -1 0 -1MAY -1 0 -1JUNE 0 -1JULY -1 -1 -1AUGUST 0 -0.5 -1 -1SEPTEMBER 0 0 -1 -0.5 0.5 -0.5OCTOBER -1 0 -0.5 0 -0.5 0NOVEMBER -1 0 -0.5 0 0 0DECEMBER -2 -1 -0.5 0 0 -0.5
Dashed cells: No data
Dashed cells: No data

ACCEPTED MANUSCRIPT
Table 6. �t min = t min IRI – t min exp, in hours. Asiatic Australian sector. High solar activity year 1968.
URSI WAKKANAI YAMAGAWA MANILA VANIMO TOWNSVILLE HOBARTJANUARY -2 0 -0.5 -1 0FEBRUARY -1 0 -0.5 -1 0MARCH -1 0 0 -1 0 -0.5APRIL -1 0 0 -1 -1 -0.5MAY -1 0 0 -1 -0.5 -1JUNE 0 0 -1 -1 1 -1JULY -1 -0.5 -1 -1AUGUST -1 0 0 -1 0SEPTEMBER -1 0 -0.5 -1 -0.5 -0.5OCTOBER 1 -0.5 -0.5 -1.5 1 -0.5NOVEMBER -1 0 0 0 -0.5DECEMBER -2 1 -0.5 1 0 0
CCIR WAKKANAI YAMAGAWA MANILA VANIMO TOWNSVILLE HOBARTJANUARY -2 0 -0.5 0 0FEBRUARY 0 0 -0.5 0 0MARCH -1 0 0 0 0 -0.5APRIL 0 -0.5 0 0 0 -0.5MAY -1 0 0 -1 0.5 -1JUNE 0 0 0 -1 0 0JULY 0 0 -1 0AUGUST 0 0 0 -1 -1SEPTEMBER -1 0.5 0 -1 0.5 -0.5OCTOBER 1 0 0 -1 -0.5 -0.5NOVEMBER -1 0 0 0.5 0DECEMBER -2 1 0 1 0 -0.5
Dashed cells: No data
Dashed cells: No data

ACCEPTED MANUSCRIPT
FIGURES (Legends) Fig 1. Predicted and observed time of minimum foF2. American sector. Good predictions Fig 2. Predicted and observed time of minimum foF2. American sector. Weak predictions Fig 3. Predicted and observed time of minimum foF2. American sector. Bad predictions Fig 4. Predicted and observed time of minimum foF2. American sector. Worst cases Fig 5. Percentage of cases with good, weak and bad predictions. Topside: LSA, bottom side: HAS. American sector. All considered cases Fig 6. Percentage of cases with good, weak and bad predictions. Topside: LSA, bottom side: HAS. Asiatic Australian sector. All considered cases
ACCEPTED MANUSCRIPT
PANAMA-JANUARY 1958 - URSI
0
4
8
12
16
20
0 1 2 3 4 5 6 7 8 9 10 11 12 13 14 15 16 17 18 19 20 21 22 23
UTfo
F2 (M
hz)
foF2 IRI foF2 Exp
TUCUMAN-OCT0BER 1958 - URSI
0
4
8
12
16
20
0 1 2 3 4 5 6 7 8 9 10 11 12 13 14 15 16 17 18 19 20 21 22 23
UT
foF2
(Mhz
)
foF2 IRI foF2 Exp
PANAMA-JUNE 1958 - CCIR
0
4
8
12
16
20
0 1 2 3 4 5 6 7 8 9 10 11 12 13 14 15 16 17 18 19 20 21 22 23
UT
foF2
(Mh
z)
foF2 IRI foF2 Exp
PANAMA-SEPTEMBER 1958 - CCIR
0
4
8
12
16
20
0 1 2 3 4 5 6 7 8 9 10 11 12 13 14 15 16 17 18 19 20 21 22 23UT
foF
2 (M
hz)
foF2 IRI foF2 Exp
Fig 1.

ACCEPTED MANUSCRIPT
TUCUMAN-MAY 1958 - URSI
0
4
8
12
16
20
0 1 2 3 4 5 6 7 8 9 10 11 12 13 14 15 16 17 18 19 20 21 22 23
UTfo
F2
(Mh
z)foF2 IRI foF2 Exp
PANAMA-JANUARY 1958 - CCIR
0
4
8
12
16
20
0 1 2 3 4 5 6 7 8 9 10 11 12 13 14 15 16 17 18 19 20 21 22 23
UT
foF2
(Mh
z)
foF2 IRI foF2 Exp
NATAL - AUGUST 1958 - CCIR
0
4
8
12
16
20
0 1 2 3 4 5 6 7 8 9 10 11 12 13 14 15 16 17 18 19 20 21 22 23
UT
foF2
(Mhz
)
foF2 IRI foF2 Exp
TALARA-FEBRUARY 1958 - URSI
0
4
8
12
16
20
0 1 2 3 4 5 6 7 8 9 10 11 12 13 14 15 16 17 18 19 20 21 22 23
UT
foF2
(Mh
z)
f0F2 IRI f0F2 Exp
Fig 2.

ACCEPTED MANUSCRIPT
TALARA-OCTOBER 1958 - URSI
0
4
8
12
16
20
0 1 2 3 4 5 6 7 8 9 10 11 12 13 14 15 16 17 18 19 20 21 22 23
UT
foF
2 (M
hz)
foF2 IRI foF2 Exp
HUANCAYO-JULY 1958 - URSI
0
4
8
12
16
20
0 1 2 3 4 5 6 7 8 9 10 11 12 13 14 15 16 17 18 19 20 21 22 23
UT
foF2
(Mh
z)
foF2 IRI foF2 Exp
CONCEPCION-FEBRUARY 1958 - CCIR
0
4
8
12
16
20
0 1 2 3 4 5 6 7 8 9 10 11 12 13 14 15 16 17 18 19 20 21 22 23
UT
foF2
(Mhz
)
foF2 IRI foF2 Exp
CONCEPCION-JULY 1958 - CCIR
0
4
8
12
16
20
0 1 2 3 4 5 6 7 8 9 10 11 12 13 14 15 16 17 18 19 20 21 22 23
UT
foF2
(Mhz
)
foF2 IRI foF2 Exp
Fig 3.

ACCEPTED MANUSCRIPT
IS. ARGENTINAS - NOVEMBER 1958 - URSI
0
4
8
12
16
20
0 1 2 3 4 5 6 7 8 9 10 11 12 13 14 15 16 17 18 19 20 21 22 23
UTfo
F2 (M
hz)
foF2 IRI foF2 Exp
IS. ARGENTINAS - DECEMBER 1958 - URSI
0
4
8
12
16
20
0 1 2 3 4 5 6 7 8 9 10 11 12 13 14 15 16 17 18 19 20 21 22 23
UT
foF2
(Mhz
)
foF2 IRI foF2 Exp
PT. STANLEY - MAY 1958 - CCIR
0
4
8
12
16
20
0 1 2 3 4 5 6 7 8 9 10 11 12 13 14 15 16 17 18 19 20 21 22 23
UT
foF2
(Mh
z)
foF2 IRI foF2 Exp
PT. STANLEY - JUNE 1958 - CCIR
0
4
8
12
16
20
0 1 2 3 4 5 6 7 8 9 10 11 12 13 14 15 16 17 18 19 20 21 22 23
UT
foF
2 (M
hz)
foF2 IRI foF2 Exp
Fig 4.

ACCEPTED MANUSCRIPT
Fig 5.
CCIR
38%
47%
15%
Good Weak Bad
URSI11%
60%
29%
Good Weak Bad
American Sector. Low Solar Activity
American Sector. High Solar Activity
CCIR
60%30%
10%
Good Weak Bad
URSI
30%
58%
12%
Good Weak Bad

ACCEPTED MANUSCRIPT
Fig 6.
CCIR
39%
58%
3%
Good Weak Bad
URSI23%
62%
15%
Good Weak Bad
Asiatic Australian Sector. Low Solar Activity
CCIR
52%43%
5%
Good Weak Bad
URSI23%
69%
8%
Good Weak Bad
Asiatic Australian Sector. High Solar Activity