Embed Size (px)
Citation preview
Abstract. The theoretical and experimental foundations of so-called bubble nuclear fusion are reviewed. In the nuclear fusionprocess, a spherical cavitation cluster � 10ÿ2 m in diameter isproduced of spherical bubbles at the center of a cylindricalchamber filled with deuterated acetone using a focused acous-tic field having a resonant frequency of about 20 kHz. Theacoustically-forced bubbles effectuate volume oscillations withsharp collapses during the compression stage. At the final stagesof collapse, the bubble cluster emits 2.5 MeV DÿD fusionneutron pulses at a rate of � 2000 per second. The neutronyield is � 105 sÿ1. In parallel, tritium nuclei are produced atthe same yield. It is shown numerically that, for bubbles havingsufficient molecular mass, spherical shock waves develop in thecenter of the cluster and that these spherical shock waves(microshocks) produce converging shocks within the interiorbubbles, which focus energy on the centers of the bubbles.When these shock waves reflect from the centers of the bub-bles, extreme conditions of temperature (� 108 K) and density(� 104 kg mÿ3) arise in a (nano)spherical region (� 10ÿ7 m insize) that last for � 10ÿ12 s, during which time about ten DÿDfusion neutrons and tritium nuclei are produced in the region. Aparadoxical result in our experiments is that it is bubble cluster(not streamer) cavitation and the sufficiently high molecularmass of (and hence the low sound speed in) D-acetone
(C3D6O) vapor (as compared, for example, to deuteratedwater D2O) which are necessary conditions for the formationof convergent spherical microshock waves in central clusterbubbles. It is these waves that allow the energy to be suffi-ciently focused in the nanospherical regions near the bubblecenters for fusion events to occur. The criticism to which theconcept of `bubble fusion' has been subjected in the literature, inparticular, most recently in Uspekhi Fizicheskikh Nauk (Phy-sics ±Uspekhi) journal, is discussed.
1. Introduction
The focusing (i.e., cumulation) of energy by the sphericallysymmetrical convergent flow of an inviscid and incompres-sible fluid around a spherical cavity (bubble), when thepressure in it is constant, notably zero, is described by thefamous Rayleigh equation. E I Zababakhin (see monographs[1] and [2]) showed the influence of the viscosity andcompressibility of the external fluid, which lowers theintensity of cumulation. However, if the driving pressuredifference between that far away from the bubble and thatin the bubble is large enough, they do not prevent anunlimited value of pressure in some zone close to the bubbleinterface (see also the well-known book by Ya B Zel'dovichand Yu P Raizer [3]). The limitation on the pressure rise iscaused, first, by the gas (vapor) that always fills the bubbleand brakes the convergent fluid and, second, by growingdisturbances of the spherically symmetrical convergent flowand bubble distortion/break-up.
The strong compressibility of a substance needed for therealization of nuclear reactions by spherically symmetricalshock compression (i.e., implosion) of a spherical volumewith a diameter of� 1 m was extensively analyzed during thedevelopment of nuclear weapons. Later on, in the 1990s, suchfocusing of kinetic energy attracted attention in connectionwith paradoxes encountered in numerous experiments onbubble sonoluminescence [3±6]. In these experiments, tinybubbles measuring about 10 mm in diameter were subjected toperiodic compression and expansion using an acoustic field.At the end of implosive compression stage, very sharpcompression occurred, and the diameter of the bubbles veryquickly diminished to less than 1 mm. At this moment,
R I Nigmatulin P P Shirshov Institute of Oceanology,
Russian Academy of Sciences,
Nakhimovskii prosp. 36, 117997 Moscow, Russian Federation
E-mail: [email protected]
R T Lahey, Jr., R C Block Rensselaer Polytechnic Institute,
110 8th Street, Troy, New York 12180-3590, USA
E-mail: [email protected], [email protected]
R P Taleyarkhan Purdue University,
400 Central Drive, W. Lafaette, IN 47907-1290, USA
E-mail: [email protected]
C DWest 242 Joel Road, Oliver Springs, TN 37840, USA
E-mail: [email protected]
Received 30 December 2013, revised 24 March 2014
Uspekhi Fizicheskikh Nauk 184 (9) 947 ± 960 (2014)
DOI: 10.3367/UFNr.0184.201409b.0947
Translated by the authors; edited by A Radzig
FROM THE CURRENT LITERATURE PACS numbers: 28.52. ± s, 47.40.Nm, 52.50.Lp
On thermonuclear processes in cavitation bubbles
R I Nigmatulin, R T Lahey, Jr., R P Taleyarkhan, C D West, R C Block
DOI: 10.3367/UFNe.0184.201409b.0947
Contents
1. Introduction 8772. Analysis of experiments 8793. Analysis of some critical remarks on the experiments 8814. Theoretical analysis of the supercompression of vapor bubbles 8855. Analysis of some critical remarks on the theory 8886. Conclusion 889
References 889
Physics ±Uspekhi 57 (9) 877 ± 890 (2014) # 2014 Uspekhi Fizicheskikh Nauk, Russian Academy of Sciences
intensive light pulses of very short duration, sometimes only50 ps, were emitted.
Experimental investigations and numerical calculationshave shown that the temperature in the center of a bubblefilled with air or nitrogen may reach T� � 106 K. Inconnection with these estimations, the possibility of D�Dthermonuclear fusion in a bubble filled with deuterium gas,D2, or the vapor of heavy water, D2O, was postulated. It isimportant to note that an almost adiabatic bulk compressionof all the mass of the gas/vapor in the bubble can onlyproduce a temperature on the order of 5000 K. Never-theless, the high temperatures produced by shock wavecumulation (focusing) of energy near the center of the bubbleexplain why ultrashort sonoluminescent light flashes may beobserved [4±6].
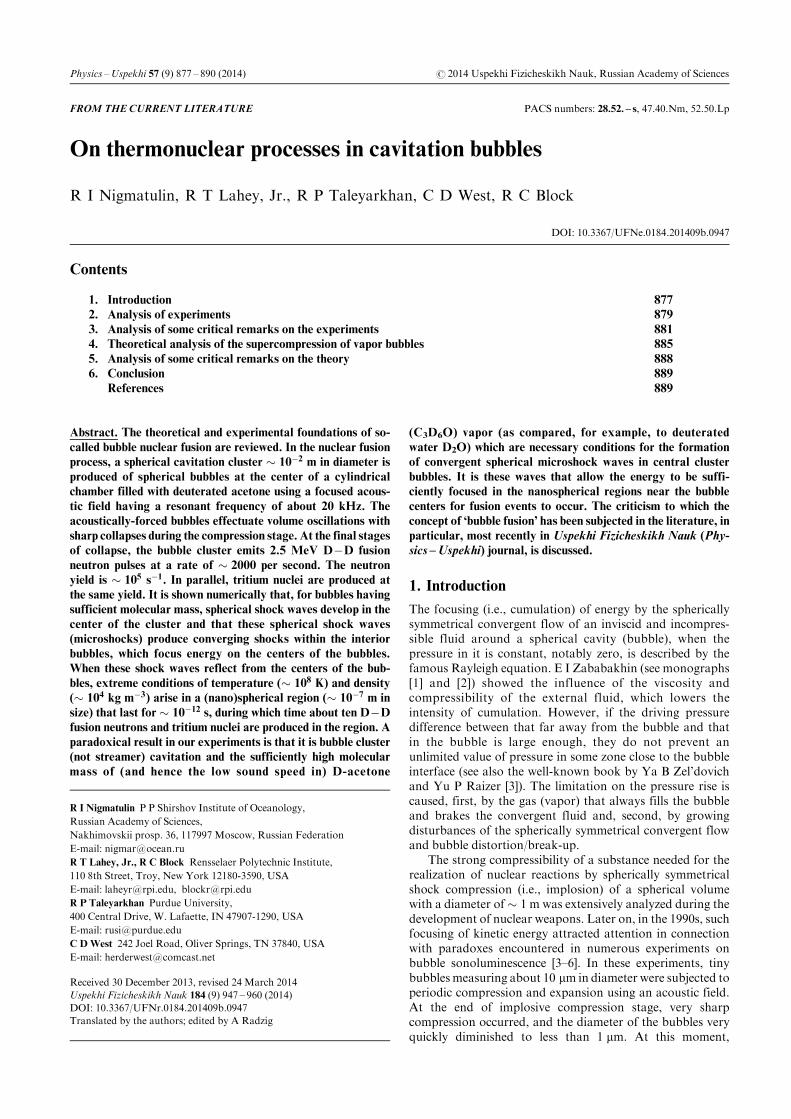
Figure 1 depicts a schematic of the supercompressionprocess. The sphere of radius R�t� corresponds to the bubbleinterface.When the interface (`piston') reaches a large enoughvelocity toward the center of the bubble, a convergingspherical shock, a wave of radius rf�t� (Fig. 1b), is initiated.Due to the focusing of the shock wave and its reflection fromthe bubble's center, a tiny spherical volume of radius r� isgenerated (Fig. 1c), having a completely ionized gas (plasma).This plasma has an extremely high temperature and densityover a very short time interval t�. Hydrocode calculations [7]have shown1 that the plasma in a tiny spherical volume(r < r� � 3 mm) during a time interval of t� � 50 ps has atemperature T > 105 K and density r � 104 kg mÿ3, andduring a still shorter time interval of t�� � 1 ps the localtemperature of the plasma may reach T > 106 K. It is alsoshown in Ref. [7] that the maximum temperature for a bubblehaving an initial size of � 10 mm and filled with deuterium(D2) gas or heavy water (D2O) vapor is less than for a bubblefilled with air or nitrogen, and thus under these conditionsthermonuclear reactions cannot be realized. Hence, theauthors of Ref. [7] concluded that D�D thermonuclearfusion cannot occur in sonoluminescence type experiments.
Nevertheless, the authors of the present paper decided toexplore how we can amplify the cumulation process inbubbles compared with that in sonoluminescence experi-ments, using other regime parameters of the process. First,other parameters of bubbly liquids which determine the sizesof the bubble and their content can be chosen. Second, it isnecessary to use a different experimental technique andobtain a more intensive acoustic field.
The fact that thermonuclear reactions can take placewithin collapsing vapor bubbles (a process called `bubblefusion') has been discussed in detail in a number of peer-reviewed archival publications [8±19], which represent over adecade of bubble fusion research findings. A detaileddescription in Russian was also presented in a smallcirculation edition [13]. Anyway, the original publicationconcerning the experimental realization of bubble fusionfollowed extensive debates and reviews in 2001 at the OakRidge National Laboratory (ORNL), where our first experi-
ments were conducted. As a consequence of those discussionsand reviews, ORNL management authorized the publicationof our experimental results. The seminal publicationappeared in Science [10] after this paper was subjected to avery stringent peer review process by this prestigious scientificjournal. Given the potential scientific importance of thiswork, it was accompanied by a special editorial fromDr. Kennedy, Editor-in-Chief of Science [10], who wroteabout the controversy surrounding our discovery, includingcalls and letters from those who, without any real scientificarguments, simply did not want our paper to be published.
After our Science paper appeared, our bubble fusionresults were presented and discussed at numerous technicalconferences and seminars on nuclear physics, explosionphysics, acoustics, and fluid dynamics. Nevertheless, agroup of determined opponents to our discovery decided touse journalists to discredit our findings instead of engagingin scientific discussions. For example, Nature News pub-lished a number of articles written by journalist E Reich [22],who wrote on various topics, which were highly critical ofthe lead author (Dr. Taleyarkhan2) without mentioning us,his coauthors, and with a total refusal to present alternative
2r�
+
a
R�t�
rf�t�
b
c
d
Figure 1. Schematic of bubble compression: (a) initial compression;
(b) shock wave formation: rf�t� is the front of the shock wave, and R�t� isthe radius of the bubble; (c) stage with extreme compressed plasma in the
central zone (with radius r�) of the bubble, where thermonuclear reactions
may occur, and (d) stage of expansion of the extreme zone.
1 We note that in Ref. [7] heat and mass exchange were taken into account
incorrectly (see Refs [8, 9]) during the expansion stage and the initial stage
of compression of the bubble. In a bubble � 10 mm in size during
expansion or compression, the temperature of the gas has time to follow
the constant temperature of the liquid (i.e., the process in the gas is
isothermal rather than adiabatic, as was assumed in work [7]). Moreover,
vapor from interfacial evaporation and condensation must also be taken
into account. All these corrections influenced the estimates for r�, t�,and T�. 2 This name was added in the English proof.
878 R I Nigmatulin, R T Lahey, Jr., R P Taleyarkhan, C DWest, R C Block Physics ±Uspekhi 57 (9)
points of view. Also, in the USA a congressman waspersuaded by some of our detractors to suggest that thisauthor may have falsified these experimental results. As aconsequence, several independent scientific commissions,one after another, examined the accusations and dismissedall of them as baseless attacks on the quality, performance,and accuracy of our bubble fusion experiments. Never-theless, still another review group found a reason to accuseDr. Taleyarkhan of `research misconduct', which consisted ofthe fact that he encouraged the inclusion as a coauthor ofpaper [20] of an undergraduate student whose contributionseemed to be insignificant. Because of these investigationsand charges (none of which showed that anything was wrongwith our bubble fusion results nor those of separate con-firmatory studies by two other teams [20, 26]), the precon-ceived opinions of many in the scientific community concern-ing bubble fusion became negative, which chilled furtherresearch in this area of technology.
This whole dreary story of problems has been carefullydocumented by S Krivit in New Energy Times [23].
The process of gas and vapor bubble collapse is attendedby a whole number of paradoxes, and it has potential fornuclear technologies. Recently, Physics±Uspekhi broke theperiod of doubt, formulated and published largely outside thescientific community, by publishing a letter to the Editors byGoverdovskii, Imshennik, and Smirnov [24]. The authors ofthis article criticized the neutron and tritium measurementsmade by us at Oak Ridge National Laboratory and presentedin our publications [10±12], as well as the separate bubblefusion experiments carried out by Xu and Butt [20] at PurdueUniversity. In addition, they concluded on the basis of arather primitive theoretical scheme that it is fundamentallyimpossible to achieve the conditions needed for significantnuclear fusion in an imploding vapor bubble.
It should be noted that similar critical statements wereconsidered and refuted more than once at seminars and in theresponses to reviewers of our papers. Nevertheless, negativeprejudices linger on, as evidenced by our critics repeating theirarguments but never commenting on our responses to theircriticism. Clearly, a careful scientific analysis of the interest-
ing and paradoxical physical phenomena which occur duringimplosive vapor bubble collapse and the possibility of bubblefusion, which has something in commonwith laser fusion, arerelevant. The analysis presented below takes into account thearguments of all our critics, past and present, and shows themto be baseless.
2. Analysis of experiments
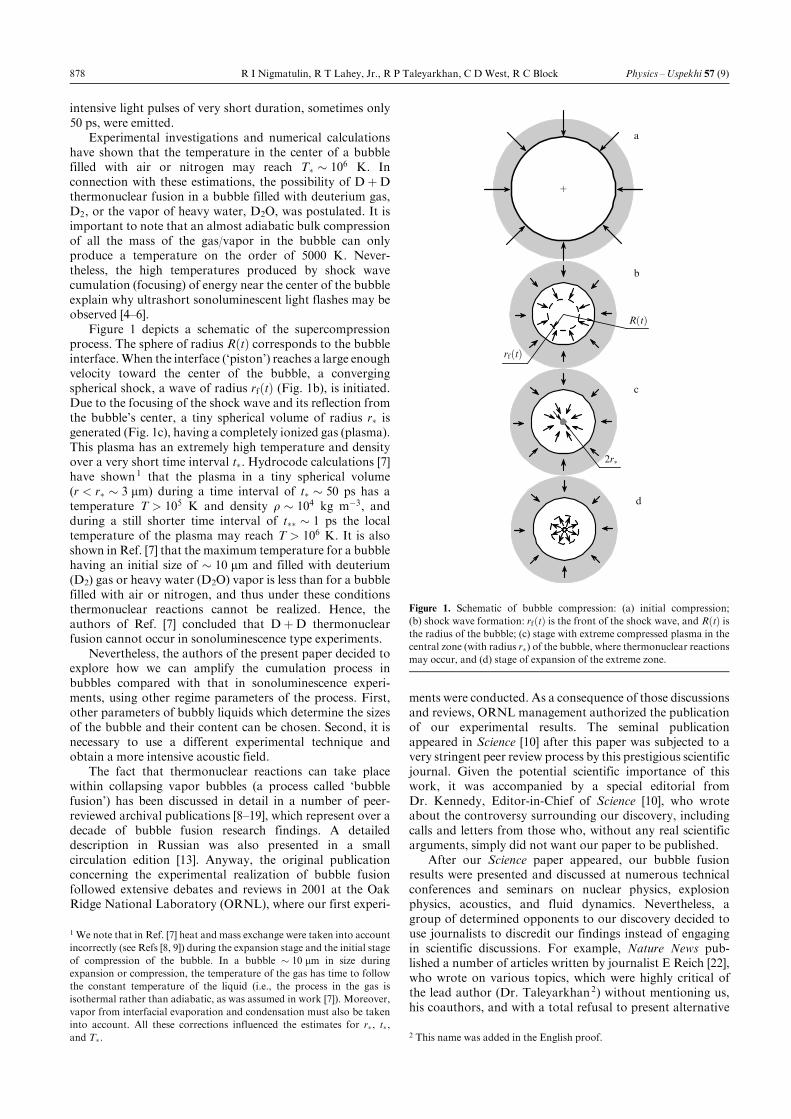
The publications in question [10±20] deal with experiments(Fig. 2) in which a cylindrical glass test chamber (6.5 cm indiameter and 20 cm high) was filled with chilled (about 0 �C),deuterated, and degassed acetone �C3D6O�, and containedan induced approximately spherical bubble cluster (� 1 cmin diameter) of relatively small vapor-filled cavitationbubbles, each having a maximum diameter of about 0.5 to0.8 mm. Use was made of an acoustic generator (AG) and apiezoelectric transducer (PZT) formed into a cylindrical ringand mounted on the outer surface of a cylindrical Pyrex glasschamber. The AG produced an approximately sphericalacoustic pressure field at one of the resonant acousticfrequencies ( fac � 19:3 kHz) of the D-acetone-filled testchamber, which corresponds to an acoustic cycle period off ÿ1ac � 52 ms.
An external source for generating primary neutrons(GPN) was used for the creation of a cavitation-inducedbubble cluster. Usually, it was an accelerator-driven pulsedneutron generator (PNG) emitting monoenergetic 14.1-MeVneutrons at a rate of Q1 � 5� 105 n/s at a repetition rate off1 � 200 Hz. In experiments conducted by another team [20],a PuÿBe continuously random isotopic neutron sourcedelivering an intensity of Q1 � 2� 106 n/s (at energies up to10 MeV) was used. Also, in order to avoid any externalneutron background concerns, instead of using externalneutrons to nucleate bubble clusters, the recoils from alphadecays from a dissolved uranium salt were used in separateself-nucleation experiments [17].
During GPN-nucleated experiments, the neutron emis-sion rates were measured utilizing a carefully calibrated5 cm� 5 cm NE-213 liquid scintillator detector system.
Scintillator usedin Refs [10, 11, 26]
Scintillator usedin Ref. [25]
Vacuum pump
Microphone (MP)
Piezoelectric transducer(PZT)
Generatorof primaryneutrons (GPN)
Flask élledwith D-acetone
Thermoinsulationor ice layer
Photomultiplier (PM)
O
Acoustic generator(AG)
Scintillator usedin Refs [17, 20]
NE-213
NE-213
PD
Figure 2. A schematic of the bubble fusion experiments [10±11, 17, 20, 26].
September 2014 On thermonuclear processes in cavitation bubbles 879
Sonoluminescence light emissions were also detected using aphotomultiplier (PM), and shocks on the flask wall weredetected making use of surface-mountedmicrophones (MPs).In addition, tritium concentration changes in samples of theacetone were measured with the aid of a Beckman liquidscintillator spectrometer [10±12].
For self-nucleated experiments [17] with cavitation byalpha-particles, besides the NE-213 scintillator, three inde-pendent neutron-gamma detectors were applied: an LiIdetector, multiple (passive) CR-39 track-edge detectors, andan NaI scintillation detector.
In most of the experiments, test chamber cooling wasaccomplished by housing the whole experimental setup in arefrigerated enclosure. However, the flask was surrounded insome experiments either by a plastic insulating sheet or icepacks. Also, in Fig. 2 it is shown that in some experiments [17,20] and measurements [25] the NE-213 scintillation detectorswere shielded from the test chamber by thermal insulationand ice packs, while in other experiments [10, 11, 26] thescintillators were not shielded.
In the present paper, eight modes of the experimentsperformed with the operation of the GPN and AG arediscussed. They are distinguished by three two-valuedcharacteristics:
(1) with bubble cluster cavitation or without cavitation(by using an AG frequency-phase shift approach);
(2) with either D-acetone/D-benzene or H-acetone/H-benzene in the acoustic chamber;
(3) with the liquid pool cooled to 0 �C or at roomtemperature (20 �C).
There were four modes with cluster cavitation and fourwithout cavitation.
Under the action of an induced ultrasonic pressure field,which had a frequency of approximately 20 kHz (or, moreprecisely, 19.3 kHz), the bubbles in the cluster underwentvolumetric oscillations with a sharp/implosive collapse at theend of the compression stage. At the moment of theirmaximum compression, when their radius decreased (by ourestimation) to about 20 mm, the bubbles emitted strongdivergent acoustic waves, which were detected by micro-phones on the external wall of the flask (see Fig. 2), andshort SL light flashes were also detected. Significantly, for oneand only one of these eight modes, namely
(1) with bubble cluster cavitation in chilled fluids,(2) with D-acetone/D-benzene,(3) with continuous test cell liquid pool cooling (� 0 �C),
scintillations due to secondary neutron emissions occurredwith an energy of 2.5 MeV. These neutron signals were timecorrelated with the sonoluminescence (SL) light flashesregistered by the PM, and the shocks on the flask wallregistered by the MP. At the same time, an accumulation oftritium occurred in the chilled D-acetone pool.
Measurement of 2.5-MeV fast neutrons and the corre-sponding tritium accumulation showed that D�D thermo-nuclear fusion had occurred [10].
In the external PNG neutron-induced tests, according toour measurements [10, 11] and the measurements taken byanother team [20], the frequency f2 of the neutron pulses andneutron productivity Q2 were respectively equal to
f2 � �2:3� 0:2� � 103 sÿ1 ;�2:1�
Q2 � �4� 1� � 105 n=s :
This means that Q2=f2 � 150ÿ200 neutrons were in eachpulse. At the same time, the generation of tritium nucleioccurred with the same productivity [12].
In self-nucleation experiments in which the bubble clusternucleation was initiated by alpha-recoil particles from adissolved uranium salt [17, 26], the cavitation bubble cloudformation rate was lower (� 5 per second versus 40 persecond), and, as expected, the D�D neutron emission ratewas also lower, namely
Q2 � 104 n=s : �2:2�
At room temperature (� 20 �C) in D-acetone, no experi-ments ever indicated neutron or tritium production. Ournumerical simulations [9] showed that a much larger mass ofvapor is evaporated in the cavitating bubbles at the higherliquid pool temperature; thus, for a fixed AG power, thislarger mass of vapor weakened the supercompression effects.
TheD�D fusion neutron emission rateQ2 wasmeasuredas the differenceDN2 in the number of scintillationsNc duringa fixed time interval Dt (Dt � 300 s) of operation with bubblecluster cavitation minus the number of scintillations N1
during the same time interval Dt of operation without bubblecluster cavitation:
Q2 � DN2
Z2Dt�DN2 � Nc ÿN1� ; �2:3�
where Z2 is the net efficiency of our neutron detection system.Notice that N1 includes the number of background scintilla-tions due to the external neutrons arrived from the GPN. Atypical intensity was N1=Dt � 500 n/s.
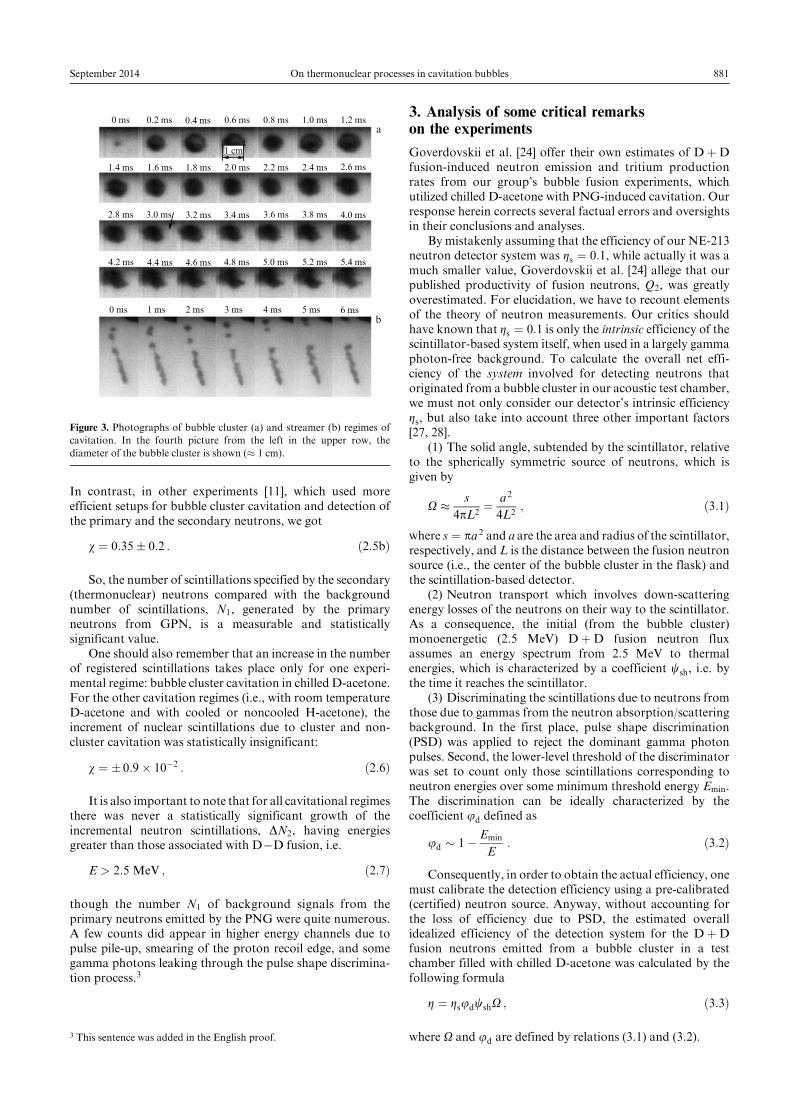
Later on, Xu and Butt [20] showed that after executingabout n � 50 acoustic oscillations a bubble cluster loses itsspherical shape and eventually disappears; therefore, theD�D fusion neutron emissions also terminate. A newgeneration of secondary neutrons commenced after theformation of a new spherical cluster [11]. Taking intoaccount the frequency f2 of neutron pulses [see Eqn (2.1)],we arrive at a bubble cluster formation frequencyfcl � f2=n � 40ÿ50 sÿ1.
If bubble cavitation takes place as bubbly streamers(Fig. 3b), rather than clusters, then there was never anysecondary neutron generation �DN2 � 0� because of theabsence of bubble cluster focusing of the acoustic pressurewaves [9, 16]. This is very important, and it should be notedthat an experimentalist needs some experience for nucleatinggood bubble clusters.
Moreover, the increment DN2 [see formula (2.3)] in theregistered number of scintillations having energyE that varieswithin the range
0:7 < E < 2:45 MeV �2:4�
in the flask with chilled D-acetone was given by
DN2 � wN1 : �2:5�
One has to bear in mind that GPN productivity was fixed:Q1 � 5� 105 n/s, and for the conditions of the ORNLexperiments [10] we got
w � 0:04 : �2:5a�
880 R I Nigmatulin, R T Lahey, Jr., R P Taleyarkhan, C DWest, R C Block Physics ±Uspekhi 57 (9)
In contrast, in other experiments [11], which used moreefficient setups for bubble cluster cavitation and detection ofthe primary and the secondary neutrons, we got
w � 0:35� 0:2 : �2:5b�
So, the number of scintillations specified by the secondary(thermonuclear) neutrons compared with the backgroundnumber of scintillations, N1, generated by the primaryneutrons from GPN, is a measurable and statisticallysignificant value.
One should also remember that an increase in the numberof registered scintillations takes place only for one experi-mental regime: bubble cluster cavitation in chilled D-acetone.For the other cavitation regimes (i.e., with room temperatureD-acetone and with cooled or noncooled H-acetone), theincrement of nuclear scintillations due to cluster and non-cluster cavitation was statistically insignificant:
w � � 0:9� 10ÿ2 : �2:6�
It is also important to note that for all cavitational regimesthere was never a statistically significant growth of theincremental neutron scintillations, DN2, having energiesgreater than those associated with DÿD fusion, i.e.
E > 2:5 MeV ; �2:7�
though the number N1 of background signals from theprimary neutrons emitted by the PNG were quite numerous.A few counts did appear in higher energy channels due topulse pile-up, smearing of the proton recoil edge, and somegamma photons leaking through the pulse shape discrimina-tion process.3
3. Analysis of some critical remarkson the experiments
Goverdovskii et al. [24] offer their own estimates of D�Dfusion-induced neutron emission and tritium productionrates from our group's bubble fusion experiments, whichutilized chilled D-acetone with PNG-induced cavitation. Ourresponse herein corrects several factual errors and oversightsin their conclusions and analyses.
By mistakenly assuming that the efficiency of our NE-213neutron detector system was Zs � 0:1, while actually it was amuch smaller value, Goverdovskii et al. [24] allege that ourpublished productivity of fusion neutrons, Q2, was greatlyoverestimated. For elucidation, we have to recount elementsof the theory of neutron measurements. Our critics shouldhave known that Zs � 0:1 is only the intrinsic efficiency of thescintillator-based system itself, when used in a largely gammaphoton-free background. To calculate the overall net effi-ciency of the system involved for detecting neutrons thatoriginated from a bubble cluster in our acoustic test chamber,we must not only consider our detector's intrinsic efficiencyZs, but also take into account three other important factors[27, 28].
(1) The solid angle, subtended by the scintillator, relativeto the spherically symmetric source of neutrons, which isgiven by
O � s
4pL2� a 2
4L2; �3:1�
where s � pa 2 and a are the area and radius of the scintillator,respectively, and L is the distance between the fusion neutronsource (i.e., the center of the bubble cluster in the flask) andthe scintillation-based detector.
(2) Neutron transport which involves down-scatteringenergy losses of the neutrons on their way to the scintillator.As a consequence, the initial (from the bubble cluster)monoenergetic (2.5 MeV) D�D fusion neutron fluxassumes an energy spectrum from 2.5 MeV to thermalenergies, which is characterized by a coefficient csh, i.e. bythe time it reaches the scintillator.
(3) Discriminating the scintillations due to neutrons fromthose due to gammas from the neutron absorption/scatteringbackground. In the first place, pulse shape discrimination(PSD) was applied to reject the dominant gamma photonpulses. Second, the lower-level threshold of the discriminatorwas set to count only those scintillations corresponding toneutron energies over some minimum threshold energy Emin.The discrimination can be ideally characterized by thecoefficient jd defined as
jd � 1ÿ Emin
E: �3:2�
Consequently, in order to obtain the actual efficiency, onemust calibrate the detection efficiency using a pre-calibrated(certified) neutron source. Anyway, without accounting forthe loss of efficiency due to PSD, the estimated overallidealized efficiency of the detection system for the D�Dfusion neutrons emitted from a bubble cluster in a testchamber filled with chilled D-acetone was calculated by thefollowing formula
Z � ZsjdcshO ; �3:3�
where O and jd are defined by relations (3.1) and (3.2).
0 ms 0.2 ms 0.4 ms 0.6 ms 0.8 ms 1.0 ms 1.2 ms
2.6 ms2.4 ms2.2 ms2.0 ms1.8 ms1.6 ms1.4 ms
2.8 ms 3.0 ms 3.2 ms 3.4 ms 3.6 ms 3.8 ms 4.0 ms
5.4 ms5.2 ms5.0 ms4.8 ms4.6 ms4.4 ms4.2 ms
0 ms 1 ms 2 ms 3 ms 4 ms 5 ms 6 ms
a
b
1 cm
Figure 3. Photographs of bubble cluster (a) and streamer (b) regimes of
cavitation. In the fourth picture from the left in the upper row, the
diameter of the bubble cluster is shown (� 1 cm).
3 This sentence was added in the English proof.
September 2014 On thermonuclear processes in cavitation bubbles 881
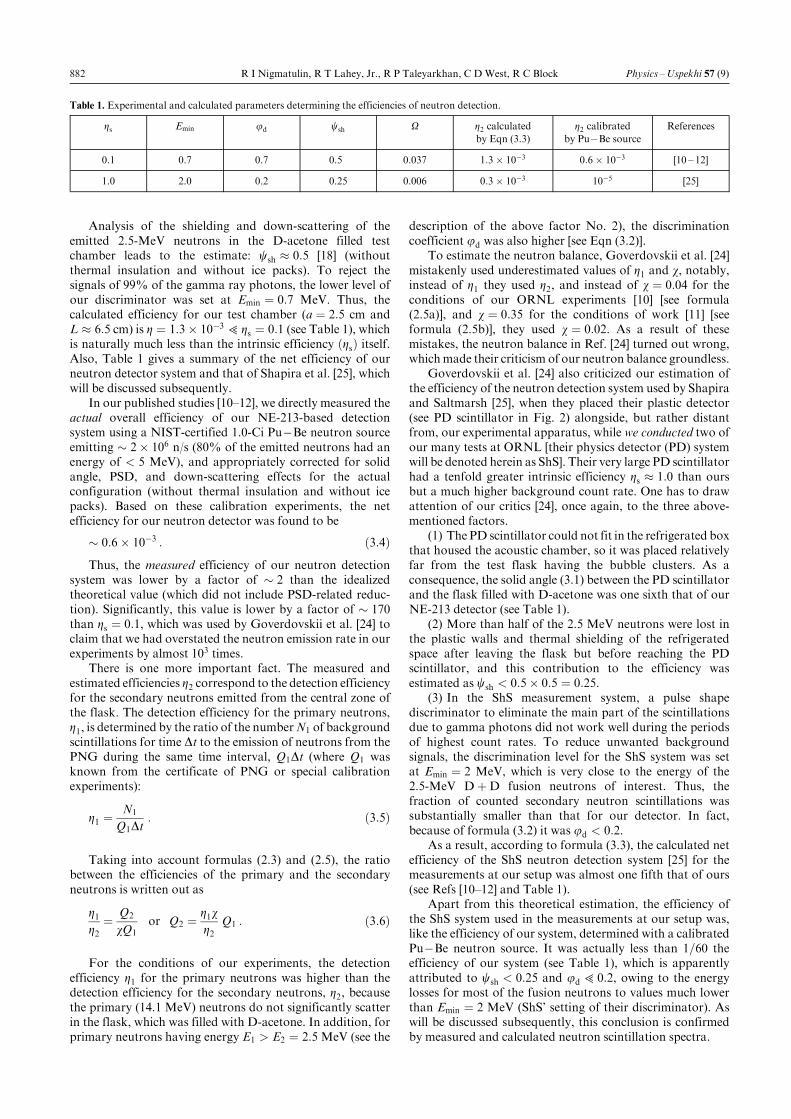
Analysis of the shielding and down-scattering of theemitted 2.5-MeV neutrons in the D-acetone filled testchamber leads to the estimate: csh � 0:5 [18] (withoutthermal insulation and without ice packs). To reject thesignals of 99% of the gamma ray photons, the lower level ofour discriminator was set at Emin � 0:7 MeV. Thus, thecalculated efficiency for our test chamber (a � 2:5 cm andL � 6:5 cm) is Z � 1:3� 10ÿ3 5 Zs � 0:1 (see Table 1), whichis naturally much less than the intrinsic efficiency �Zs� itself.Also, Table 1 gives a summary of the net efficiency of ourneutron detector system and that of Shapira et al. [25], whichwill be discussed subsequently.
In our published studies [10±12], we directly measured theactual overall efficiency of our NE-213-based detectionsystem using a NIST-certified 1.0-Ci PuÿBe neutron sourceemitting � 2� 106 n/s (80% of the emitted neutrons had anenergy of < 5 MeV), and appropriately corrected for solidangle, PSD, and down-scattering effects for the actualconfiguration (without thermal insulation and without icepacks). Based on these calibration experiments, the netefficiency for our neutron detector was found to be
� 0:6� 10ÿ3 : �3:4�Thus, the measured efficiency of our neutron detection
system was lower by a factor of � 2 than the idealizedtheoretical value (which did not include PSD-related reduc-tion). Significantly, this value is lower by a factor of � 170than Zs � 0:1, which was used by Goverdovskii et al. [24] toclaim that we had overstated the neutron emission rate in ourexperiments by almost 103 times.
There is one more important fact. The measured andestimated efficiencies Z2 correspond to the detection efficiencyfor the secondary neutrons emitted from the central zone ofthe flask. The detection efficiency for the primary neutrons,Z1, is determined by the ratio of the numberN1 of backgroundscintillations for time Dt to the emission of neutrons from thePNG during the same time interval, Q1Dt (where Q1 wasknown from the certificate of PNG or special calibrationexperiments):
Z1 �N1
Q1Dt: �3:5�
Taking into account formulas (2.3) and (2.5), the ratiobetween the efficiencies of the primary and the secondaryneutrons is written out as
Z1Z2� Q2
wQ1or Q2 � Z1w
Z2Q1 : �3:6�
For the conditions of our experiments, the detectionefficiency Z1 for the primary neutrons was higher than thedetection efficiency for the secondary neutrons, Z2, becausethe primary (14.1 MeV) neutrons do not significantly scatterin the flask, which was filled with D-acetone. In addition, forprimary neutrons having energy E1 > E2 � 2:5 MeV (see the
description of the above factor No. 2), the discriminationcoefficient jd was also higher [see Eqn (3.2)].
To estimate the neutron balance, Goverdovskii et al. [24]mistakenly used underestimated values of Z1 and w, notably,instead of Z1 they used Z2, and instead of w � 0:04 for theconditions of our ORNL experiments [10] [see formula(2.5a)], and w � 0:35 for the conditions of work [11] [seeformula (2.5b)], they used w � 0:02. As a result of thesemistakes, the neutron balance in Ref. [24] turned out wrong,whichmade their criticism of our neutron balance groundless.
Goverdovskii et al. [24] also criticized our estimation ofthe efficiency of the neutron detection system used by Shapiraand Saltmarsh [25], when they placed their plastic detector(see PD scintillator in Fig. 2) alongside, but rather distantfrom, our experimental apparatus, while we conducted two ofour many tests at ORNL [their physics detector (PD) systemwill be denoted herein as ShS]. Their very large PD scintillatorhad a tenfold greater intrinsic efficiency Zs � 1:0 than oursbut a much higher background count rate. One has to drawattention of our critics [24], once again, to the three above-mentioned factors.
(1) The PD scintillator could not fit in the refrigerated boxthat housed the acoustic chamber, so it was placed relativelyfar from the test flask having the bubble clusters. As aconsequence, the solid angle (3.1) between the PD scintillatorand the flask filled with D-acetone was one sixth that of ourNE-213 detector (see Table 1).
(2) More than half of the 2.5 MeV neutrons were lost inthe plastic walls and thermal shielding of the refrigeratedspace after leaving the flask but before reaching the PDscintillator, and this contribution to the efficiency wasestimated as csh < 0:5� 0:5 � 0:25.
(3) In the ShS measurement system, a pulse shapediscriminator to eliminate the main part of the scintillationsdue to gamma photons did not work well during the periodsof highest count rates. To reduce unwanted backgroundsignals, the discrimination level for the ShS system was setat Emin � 2 MeV, which is very close to the energy of the2.5-MeV D�D fusion neutrons of interest. Thus, thefraction of counted secondary neutron scintillations wassubstantially smaller than that for our detector. In fact,because of formula (3.2) it was jd < 0:2.
As a result, according to formula (3.3), the calculated netefficiency of the ShS neutron detection system [25] for themeasurements at our setup was almost one fifth that of ours(see Refs [10±12] and Table 1).
Apart from this theoretical estimation, the efficiency ofthe ShS system used in the measurements at our setup was,like the efficiency of our system, determined with a calibratedPuÿBe neutron source. It was actually less than 1=60 theefficiency of our system (see Table 1), which is apparentlyattributed to csh < 0:25 and jd 5 0:2, owing to the energylosses for most of the fusion neutrons to values much lowerthan Emin � 2 MeV (ShS' setting of their discriminator). Aswill be discussed subsequently, this conclusion is confirmedby measured and calculated neutron scintillation spectra.
Table 1. Experimental and calculated parameters determining the efficiencies of neutron detection.
Zs Emin jd csh O Z2 calculatedby Eqn (3.3)
Z2 calibratedby PuÿBe source
References
0.1 0.7 0.7 0.5 0.037 1:3� 10ÿ3 0:6� 10ÿ3 [10 ë 12]
1.0 2.0 0.2 0.25 0.006 0:3� 10ÿ3 10ÿ5 [25]
882 R I Nigmatulin, R T Lahey, Jr., R P Taleyarkhan, C DWest, R C Block Physics ±Uspekhi 57 (9)
Nevertheless, Shapira and Saltmarsh [25] did show astatistically significant increase in thermonuclear neutronemission DN2 (i.e., over 7 SD), but because they over-estimated the efficiency of their neutron detection system bythree orders of magnitude, they incorrectly concluded in theirreport that the production of D�D fusion neutrons,Q2, wasnegligible and also incompatible with our published tritiumemission rate [10].
In spite of our criticisms of their ShS detection systemanalysis, which were presented in various publications [10, 11,29] and at seminars and conferences where Shapira andSaltmarsh were present, they never answered our arguments,which are obvious to any nuclear measurement professional.
Goverdovskii et al. [24] expressed concerns that for thedata measured in Refs [11, 20] ``both original and differentialspectra produce more skepticism than optimism for con-fidence concerning the existence of the phenomenon inprinciple.'' This criticism is also completely unwarranted.They obviously did not consider our paper [18], where themeasured spectrum profiles were compared with experiment-specific predictions from the well-known and widely acceptedindustry standard neutron transport codes. To explain this,we need to give a brief account of the issue.
In addition to the overall neutron production DN2, wealso published in Refs [10±13, 15±20] the measured energy-dependent pulse height amplitudes A (i.e., the amplitudespectra). To determine such distributions, the ranges ofscintillation amplitudes for the primary neutrons from the
GPN and the secondary neutrons from the flask were dividedinto subranges (channels) of value A�i�. The range marked as
A�iÿ1� < A < A�i�1� �3:7�
is named the ith channel. For each such channel, the numberof scintillations N
�i�1 without bubble cavitation and the
number of scintillations N�i�c with bubble cluster cavitation
were measured. Their difference, namely
DN �i�2 � N �i�c ÿN�i�1 ; �3:8�
defines the number of neutron scintillations in the ith channel(i.e., with energies in the range of interest). Finally, for allchannels one has
DN2 �Xi
DN �i�2 : �3:9�
The measured scintillation spectra of secondary neutronsproduced due to bubble cluster cavitation under differentexperimental conditions are plotted in Figs 4±7 by thin solidlines.
In 2008, besides the measured spectra, our grouppublished the corresponding calculated neutron spectra for
1050
15
40
80
120
160
DN �i�2
20 25Number of channel (i)
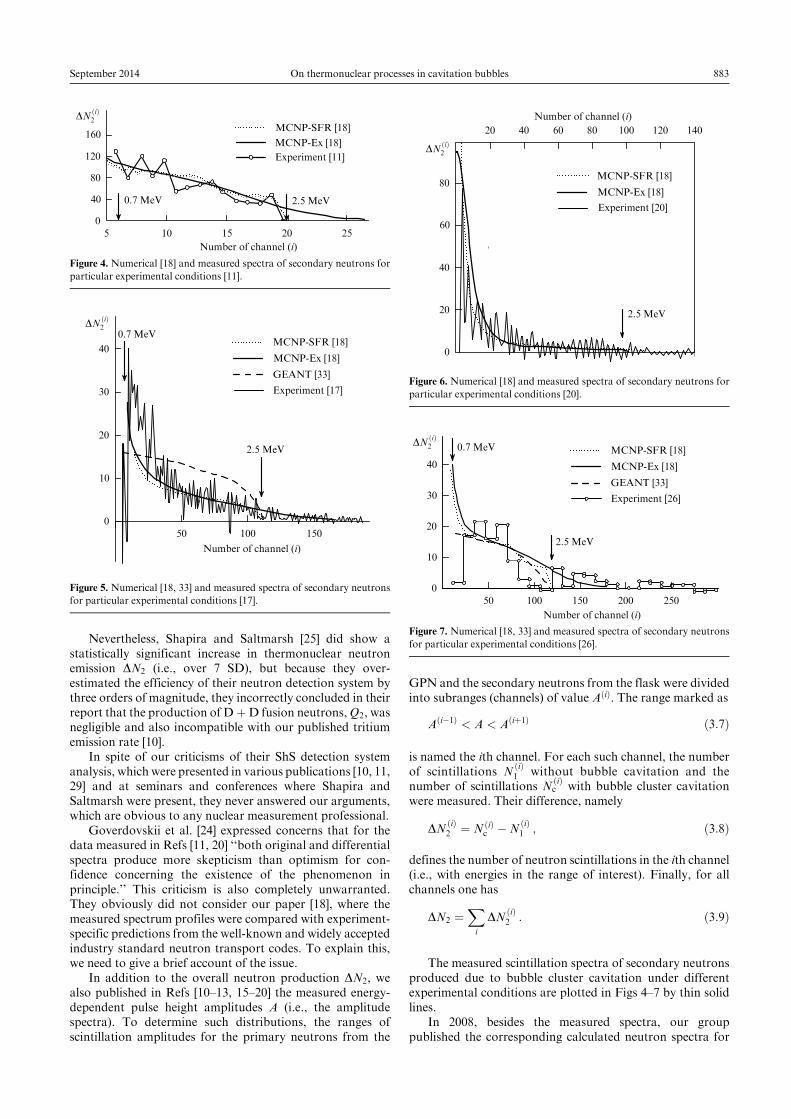
Experiment [11]
MCNP-Ex [18]
MCNP-SFR [18]
0.7 MeV 2.5 MeV
Figure 4. Numerical [18] and measured spectra of secondary neutrons for
particular experimental conditions [11].
500
10
20
30
40
150100
DN �i�2
Number of channel (i)
0.7 MeV
2.5 MeV
Experiment [17]
MCNP-Ex [18]
GEANT [33]
MCNP-SFR [18]
Figure 5. Numerical [18, 33] and measured spectra of secondary neutrons
for particular experimental conditions [17].
0
20
40
60
80
20 40 60 80 100 120 140
DN �i�2
Number of channel (i)
2.5 MeV
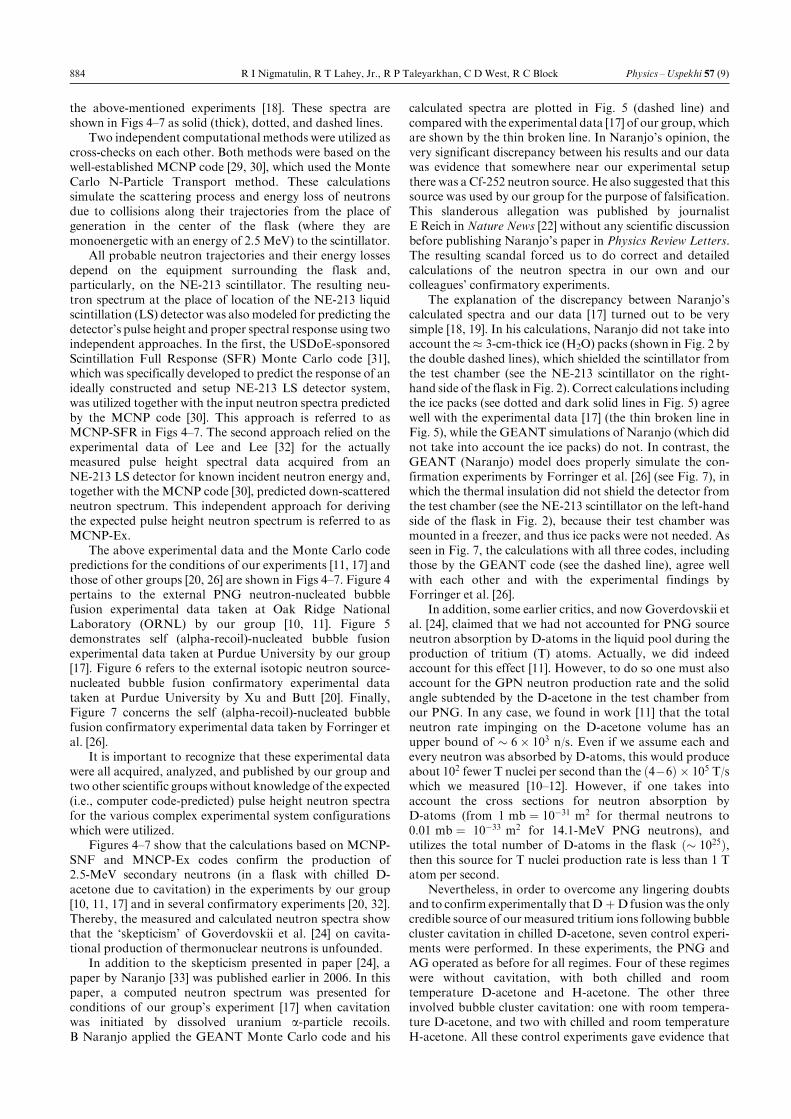
Experiment [20]
MCNP-Ex [18]
MCNP-SFR [18]
Figure 6. Numerical [18] and measured spectra of secondary neutrons for
particular experimental conditions [20].
DN �i�2
Number of channel (i)
0.7 MeV
2.5 MeV
100 150 200 250500
10
20
30
40
Experiment [26]
MCNP-Ex [18]
GEANT [33]
MCNP-SFR [18]
Figure 7. Numerical [18, 33] and measured spectra of secondary neutrons
for particular experimental conditions [26].
September 2014 On thermonuclear processes in cavitation bubbles 883
the above-mentioned experiments [18]. These spectra areshown in Figs 4±7 as solid (thick), dotted, and dashed lines.
Two independent computational methods were utilized ascross-checks on each other. Both methods were based on thewell-established MCNP code [29, 30], which used the MonteCarlo N-Particle Transport method. These calculationssimulate the scattering process and energy loss of neutronsdue to collisions along their trajectories from the place ofgeneration in the center of the flask (where they aremonoenergetic with an energy of 2.5 MeV) to the scintillator.
All probable neutron trajectories and their energy lossesdepend on the equipment surrounding the flask and,particularly, on the NE-213 scintillator. The resulting neu-tron spectrum at the place of location of the NE-213 liquidscintillation (LS) detector was alsomodeled for predicting thedetector's pulse height and proper spectral response using twoindependent approaches. In the first, the USDoE-sponsoredScintillation Full Response (SFR) Monte Carlo code [31],which was specifically developed to predict the response of anideally constructed and setup NE-213 LS detector system,was utilized together with the input neutron spectra predictedby the MCNP code [30]. This approach is referred to asMCNP-SFR in Figs 4±7. The second approach relied on theexperimental data of Lee and Lee [32] for the actuallymeasured pulse height spectral data acquired from anNE-213 LS detector for known incident neutron energy and,together with the MCNP code [30], predicted down-scatteredneutron spectrum. This independent approach for derivingthe expected pulse height neutron spectrum is referred to asMCNP-Ex.
The above experimental data and the Monte Carlo codepredictions for the conditions of our experiments [11, 17] andthose of other groups [20, 26] are shown in Figs 4±7. Figure 4pertains to the external PNG neutron-nucleated bubblefusion experimental data taken at Oak Ridge NationalLaboratory (ORNL) by our group [10, 11]. Figure 5demonstrates self (alpha-recoil)-nucleated bubble fusionexperimental data taken at Purdue University by our group[17]. Figure 6 refers to the external isotopic neutron source-nucleated bubble fusion confirmatory experimental datataken at Purdue University by Xu and Butt [20]. Finally,Figure 7 concerns the self (alpha-recoil)-nucleated bubblefusion confirmatory experimental data taken by Forringer etal. [26].
It is important to recognize that these experimental datawere all acquired, analyzed, and published by our group andtwo other scientific groupswithout knowledge of the expected(i.e., computer code-predicted) pulse height neutron spectrafor the various complex experimental system configurationswhich were utilized.
Figures 4±7 show that the calculations based on MCNP-SNF and MNCP-Ex codes confirm the production of2.5-MeV secondary neutrons (in a flask with chilled D-acetone due to cavitation) in the experiments by our group[10, 11, 17] and in several confirmatory experiments [20, 32].Thereby, the measured and calculated neutron spectra showthat the `skepticism' of Goverdovskii et al. [24] on cavita-tional production of thermonuclear neutrons is unfounded.
In addition to the skepticism presented in paper [24], apaper by Naranjo [33] was published earlier in 2006. In thispaper, a computed neutron spectrum was presented forconditions of our group's experiment [17] when cavitationwas initiated by dissolved uranium a-particle recoils.B Naranjo applied the GEANT Monte Carlo code and his
calculated spectra are plotted in Fig. 5 (dashed line) andcompared with the experimental data [17] of our group, whichare shown by the thin broken line. In Naranjo's opinion, thevery significant discrepancy between his results and our datawas evidence that somewhere near our experimental setupthere was a Cf-252 neutron source. He also suggested that thissource was used by our group for the purpose of falsification.This slanderous allegation was published by journalistE Reich inNature News [22] without any scientific discussionbefore publishing Naranjo's paper in Physics Review Letters.The resulting scandal forced us to do correct and detailedcalculations of the neutron spectra in our own and ourcolleagues' confirmatory experiments.
The explanation of the discrepancy between Naranjo'scalculated spectra and our data [17] turned out to be verysimple [18, 19]. In his calculations, Naranjo did not take intoaccount the� 3-cm-thick ice (H2O) packs (shown in Fig. 2 bythe double dashed lines), which shielded the scintillator fromthe test chamber (see the NE-213 scintillator on the right-hand side of the flask in Fig. 2). Correct calculations includingthe ice packs (see dotted and dark solid lines in Fig. 5) agreewell with the experimental data [17] (the thin broken line inFig. 5), while the GEANT simulations of Naranjo (which didnot take into account the ice packs) do not. In contrast, theGEANT (Naranjo) model does properly simulate the con-firmation experiments by Forringer et al. [26] (see Fig. 7), inwhich the thermal insulation did not shield the detector fromthe test chamber (see the NE-213 scintillator on the left-handside of the flask in Fig. 2), because their test chamber wasmounted in a freezer, and thus ice packs were not needed. Asseen in Fig. 7, the calculations with all three codes, includingthose by the GEANT code (see the dashed line), agree wellwith each other and with the experimental findings byForringer et al. [26].
In addition, some earlier critics, and nowGoverdovskii etal. [24], claimed that we had not accounted for PNG sourceneutron absorption by D-atoms in the liquid pool during theproduction of tritium (T) atoms. Actually, we did indeedaccount for this effect [11]. However, to do so one must alsoaccount for the GPN neutron production rate and the solidangle subtended by the D-acetone in the test chamber fromour PNG. In any case, we found in work [11] that the totalneutron rate impinging on the D-acetone volume has anupper bound of � 6� 103 n/s. Even if we assume each andevery neutron was absorbed by D-atoms, this would produceabout 102 fewer T nuclei per second than the �4ÿ6� � 105 T/swhich we measured [10±12]. However, if one takes intoaccount the cross sections for neutron absorption byD-atoms (from 1 mb � 10ÿ31 m2 for thermal neutrons to0.01 mb � 10ÿ33 m2 for 14.1-MeV PNG neutrons), andutilizes the total number of D-atoms in the flask �� 1025�,then this source for T nuclei production rate is less than 1 Tatom per second.
Nevertheless, in order to overcome any lingering doubtsand to confirm experimentally thatD�Dfusionwas the onlycredible source of ourmeasured tritium ions following bubblecluster cavitation in chilled D-acetone, seven control experi-ments were performed. In these experiments, the PNG andAG operated as before for all regimes. Four of these regimeswere without cavitation, with both chilled and roomtemperature D-acetone and H-acetone. The other threeinvolved bubble cluster cavitation: one with room tempera-ture D-acetone, and two with chilled and room temperatureH-acetone. All these control experiments gave evidence that
884 R I Nigmatulin, R T Lahey, Jr., R P Taleyarkhan, C DWest, R C Block Physics ±Uspekhi 57 (9)
there was no measurable T production by the D� n or anyother reaction (e.g., C13 � n and Li� n) in the glass flask.
Thus, these experiments clearly showed that the tritiumnuclei that were measured could only be produced by theD�D thermonuclear fusion reaction, in which both2.45-MeV neutrons and tritium ions are produced duringbubble cluster cavitation in chilled D-acetone.
4. Theoretical analysisof the supercompression of vapor bubbles
The process of the impact of relatively strong acoustic waveson a bubble cluster leading to the collapse of vapor bubbleswithin the cluster is a multiscale process with sharpening(blow-up). Along the process time and spatial scales, thescales of the physical parameters (velocity, density, pressure,and temperature) change by many orders of magnitude. Forexample, the time scale changes from 10ÿ5 s to 10ÿ12 s, and thespatial scale changes from 10ÿ2 m to 10ÿ8 m. Consequently,the physical mechanisms and governing equations change,too.
In particular, on the bubble cluster's spatial scale (10ÿ2 m)compression focusing takes place not in a gas but in a two-phase bubbly liquid. This process is described by continuummechanics equations [34, 35] with two pressures, where thepressures in the continuous liquid phase and in the gas withinthe dispersed bubbles are different. This difference in pressureinduces a liquid microflow around the bubbles in the bubblecluster, which, in turn, produces changes in the bubbles' size.During this stage, the compressibility of the liquid isnegligible, and the microflows are described by the Ray-leigh±Plesset equation (see, e.g., book [34]). Numericalsolutions of the conservation equations [9] expose a wavyprocess within the spherical bubble cluster and the inhomo-geneous density and pressure of the liquid within the cluster.In response to focusing the spherical wave within the bubblecluster, the pressure of the liquid around the bubbles in thecentral zone of the bubble cluster grows from 15 bar to� 200 bar during the compression stage, and its character-istic duration falls from tp � 20 ms to tp � 5 ms [9]. Inconsequence of this bubble cluster cumulation phenomenon,the pressure around the interior bubbles, which drives bubblecompression, turns out to be many times higher than on theperiphery of the cluster.
As a result, compression of the vapor in the individualbubbles (from 10ÿ3 m to 10ÿ4 m in size) takes place as ashockless compression, until a regime with a shock wave isrealized at spatial scales of � 10ÿ5 m near the centers of thebubbles. All these specific features have been analyzed andreported on previously [9, 13±16].
To illustrate the above-mentioned features, several figuresare presented for the implosive collapse mode of a vaporbubble in chilled D-acetone and in water (H2O). Theysummarize the most salient results that have been previouslypublished [9].
For the calculations of high-pressure physics, the Mie±GruÈ neizen equation of state [3, 34] was employed. Thisallows taking into account the internal energy and pressurecaused by intermolecular potential forces (i.e., the `coldenergy' and `cold pressure') in the liquid and stronglycompressed vapor phases. During the shock wave stage,compressibility of the liquid phase takes place, as doesdissociation and ionization of the vapor during a final stageof the bubble collapse.
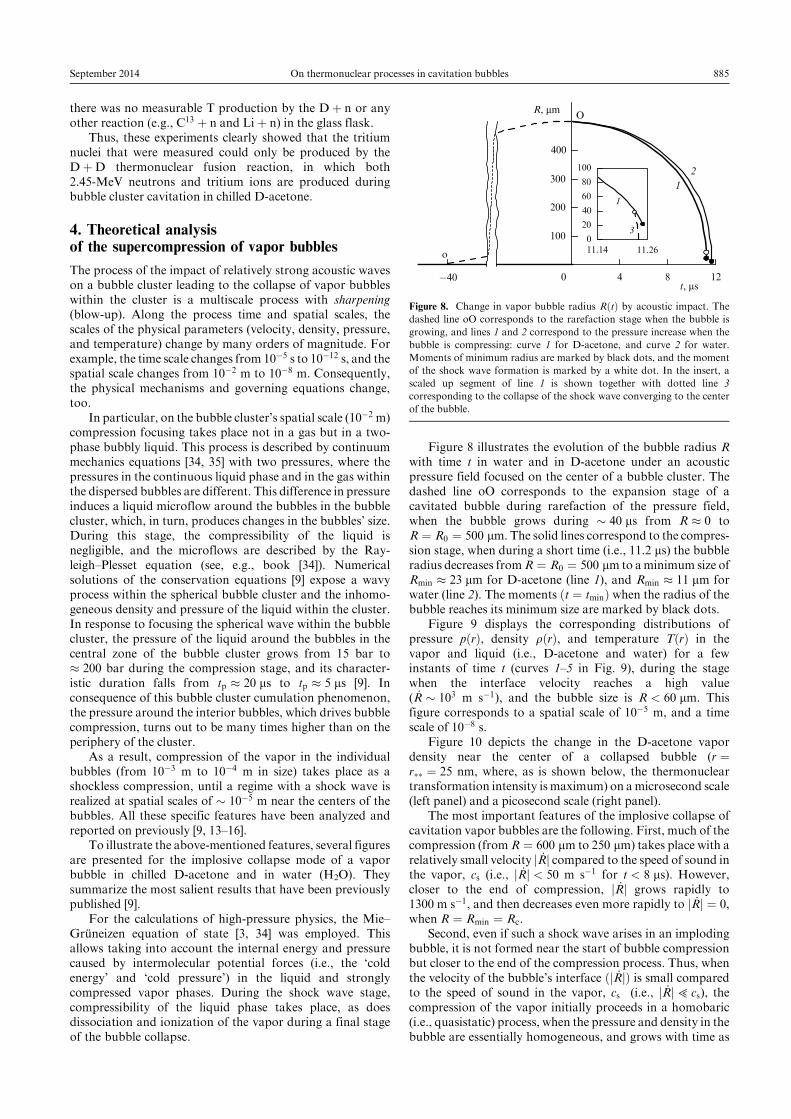
Figure 8 illustrates the evolution of the bubble radius Rwith time t in water and in D-acetone under an acousticpressure field focused on the center of a bubble cluster. Thedashed line oO corresponds to the expansion stage of acavitated bubble during rarefaction of the pressure field,when the bubble grows during � 40 ms from R � 0 toR � R0 � 500 mm. The solid lines correspond to the compres-sion stage, when during a short time (i.e., 11.2 ms) the bubbleradius decreases fromR � R0 � 500 mm to aminimum size ofRmin � 23 mm for D-acetone (line 1), and Rmin � 11 mm forwater (line 2). The moments �t � tmin� when the radius of thebubble reaches its minimum size are marked by black dots.
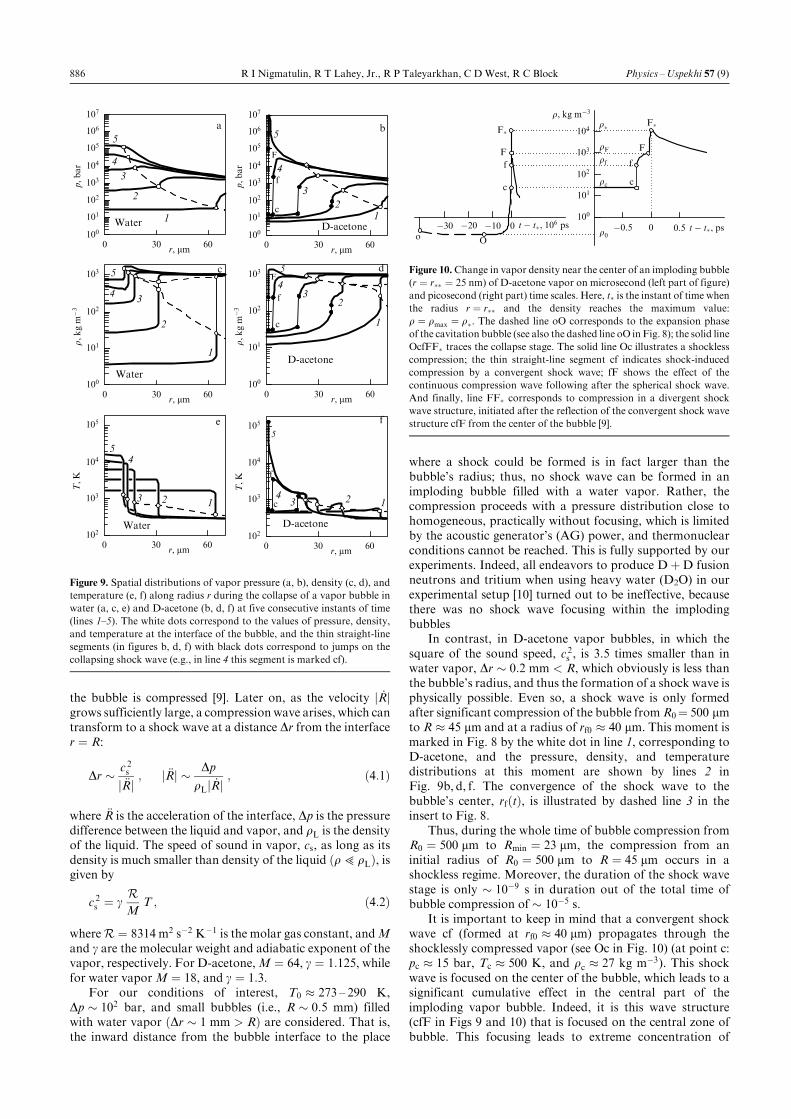
Figure 9 displays the corresponding distributions ofpressure p�r�, density r�r�, and temperature T�r� in thevapor and liquid (i.e., D-acetone and water) for a fewinstants of time t (curves 1±5 in Fig. 9), during the stagewhen the interface velocity reaches a high value( _R � 103 m sÿ1), and the bubble size is R < 60 mm. Thisfigure corresponds to a spatial scale of 10ÿ5 m, and a timescale of 10ÿ8 s.
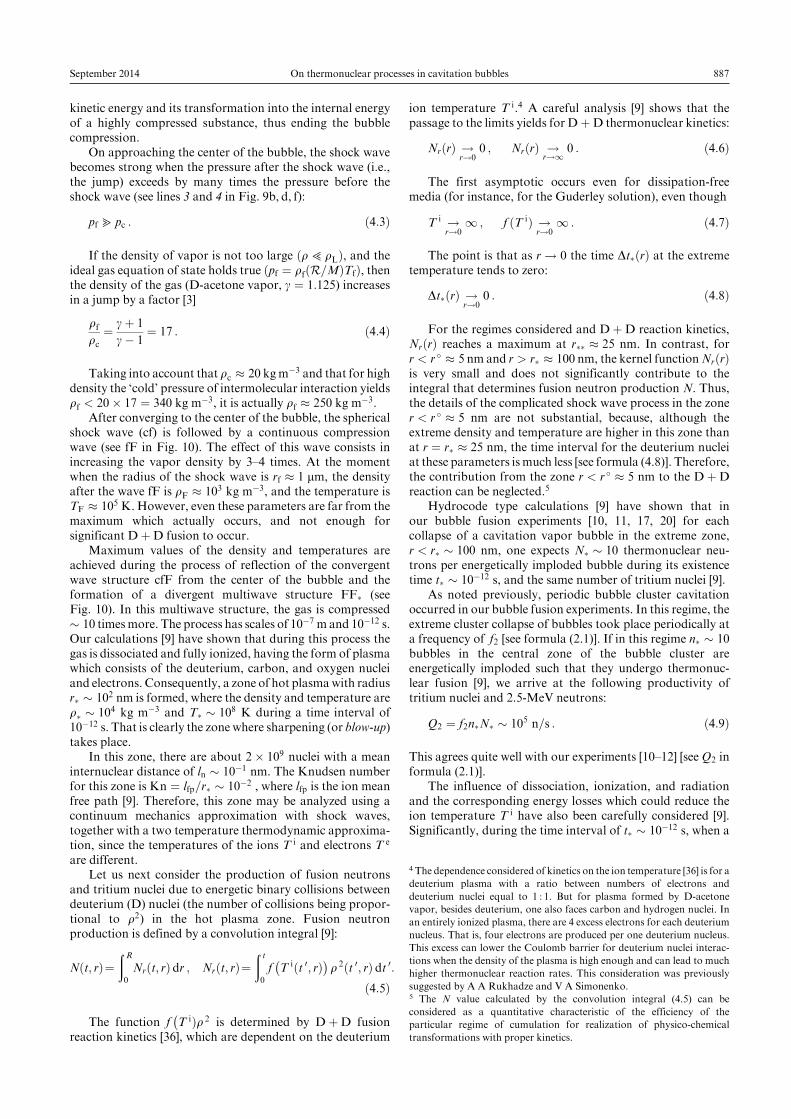
Figure 10 depicts the change in the D-acetone vapordensity near the center of a collapsed bubble (r �r�� � 25 nm, where, as is shown below, the thermonucleartransformation intensity is maximum) on amicrosecond scale(left panel) and a picosecond scale (right panel).
The most important features of the implosive collapse ofcavitation vapor bubbles are the following. First, much of thecompression (fromR � 600 mm to 250 mm) takes place with arelatively small velocity j _Rj compared to the speed of sound inthe vapor, cs (i.e., j _Rj < 50 m sÿ1 for t < 8 ms). However,closer to the end of compression, j _Rj grows rapidly to1300 m sÿ1, and then decreases even more rapidly to j _Rj � 0,when R � Rmin � Rc.
Second, even if such a shock wave arises in an implodingbubble, it is not formed near the start of bubble compressionbut closer to the end of the compression process. Thus, whenthe velocity of the bubble's interface �j _Rj� is small comparedto the speed of sound in the vapor, cs (i.e., j _Rj5 cs), thecompression of the vapor initially proceeds in a homobaric(i.e., quasistatic) process, when the pressure and density in thebubble are essentially homogeneous, and grows with time as
100
0ÿ40 4 8 12t, ms
011.14 11.26
20
80
100
60
40200
300
400
R, mm
1
1
3
2
o
O
Figure 8. Change in vapor bubble radius R�t� by acoustic impact. The
dashed line oO corresponds to the rarefaction stage when the bubble is
growing, and lines 1 and 2 correspond to the pressure increase when the
bubble is compressing: curve 1 for D-acetone, and curve 2 for water.
Moments of minimum radius are marked by black dots, and the moment
of the shock wave formation is marked by a white dot. In the insert, a
scaled up segment of line 1 is shown together with dotted line 3
corresponding to the collapse of the shock wave converging to the center
of the bubble.
September 2014 On thermonuclear processes in cavitation bubbles 885
the bubble is compressed [9]. Later on, as the velocity j _Rjgrows sufficiently large, a compressionwave arises, which cantransform to a shock wave at a distance Dr from the interfacer � R:
Dr � c 2sj �Rj ; j �Rj � Dp
rLj _Rj ; �4:1�
where �R is the acceleration of the interface, Dp is the pressuredifference between the liquid and vapor, and rL is the densityof the liquid. The speed of sound in vapor, cs, as long as itsdensity is much smaller than density of the liquid �r5 rL�, isgiven by
c 2s � gRM
T ; �4:2�
whereR � 8314 m2 sÿ2 Kÿ1 is the molar gas constant, andMand g are the molecular weight and adiabatic exponent of thevapor, respectively. For D-acetone,M � 64, g � 1:125, whilefor water vaporM � 18, and g � 1:3.
For our conditions of interest, T0 � 273 ± 290 K,Dp � 102 bar, and small bubbles (i.e., R � 0:5 mm) filledwith water vapor �Dr � 1 mm > R� are considered. That is,the inward distance from the bubble interface to the place
where a shock could be formed is in fact larger than thebubble's radius; thus, no shock wave can be formed in animploding bubble filled with a water vapor. Rather, thecompression proceeds with a pressure distribution close tohomogeneous, practically without focusing, which is limitedby the acoustic generator's (AG) power, and thermonuclearconditions cannot be reached. This is fully supported by ourexperiments. Indeed, all endeavors to produce D�D fusionneutrons and tritium when using heavy water (D2O) in ourexperimental setup [10] turned out to be ineffective, becausethere was no shock wave focusing within the implodingbubbles
In contrast, in D-acetone vapor bubbles, in which thesquare of the sound speed, c 2s , is 3.5 times smaller than inwater vapor, Dr � 0:2 mm < R, which obviously is less thanthe bubble's radius, and thus the formation of a shock wave isphysically possible. Even so, a shock wave is only formedafter significant compression of the bubble fromR0� 500 mmto R � 45 mm and at a radius of rf0 � 40 mm. This moment ismarked in Fig. 8 by the white dot in line 1, corresponding toD-acetone, and the pressure, density, and temperaturedistributions at this moment are shown by lines 2 inFig. 9b, d, f. The convergence of the shock wave to thebubble's center, rf�t�, is illustrated by dashed line 3 in theinsert to Fig. 8.
Thus, during the whole time of bubble compression fromR0 � 500 mm to Rmin � 23 mm, the compression from aninitial radius of R0 � 500 mm to R � 45 mm occurs in ashockless regime. Moreover, the duration of the shock wavestage is only � 10ÿ9 s in duration out of the total time ofbubble compression of � 10ÿ5 s.
It is important to keep in mind that a convergent shockwave cf (formed at rf0 � 40 mm) propagates through theshocklessly compressed vapor (see Oc in Fig. 10) (at point c:pc � 15 bar, Tc � 500 K, and rc � 27 kg mÿ3). This shockwave is focused on the center of the bubble, which leads to asignificant cumulative effect in the central part of theimploding vapor bubble. Indeed, it is this wave structure(cfF in Figs 9 and 10) that is focused on the central zone ofbubble. This focusing leads to extreme concentration of
c
1
2
34
5
300 60r, mm
r,kgmÿ3
103
102
101
100
d
1
23
4
5
f
f
F
F
c
c
r,kgmÿ3
103
102
101
100
300 60r, mm
a
1
2
3
4
5
107
106
105
104
103
102
101
100
p,b
ar
300 60r, mm
107
106
105
104
103
102
101
100p,b
ar
b
12
3
4
5
300 60r, mm
e
123
45
300 60r, mm
T,K
105
104
103
102
f
1234
5
f
c
T,K
105
104
103
102
300 60r, mm
Water
Water
Water
D-acetone
D-acetone
D-acetone
Figure 9. Spatial distributions of vapor pressure (a, b), density (c, d), and
temperature (e, f) along radius r during the collapse of a vapor bubble in
water (a, c, e) and D-acetone (b, d, f) at five consecutive instants of time
(lines 1±5). The white dots correspond to the values of pressure, density,
and temperature at the interface of the bubble, and the thin straight-line
segments (in figures b, d, f) with black dots correspond to jumps on the
collapsing shock wave (e.g., in line 4 this segment is marked cf).
ÿ30 ÿ20 ÿ10 0 tÿ t�, 106 ps
c
fF
F�
Ooÿ0.5r0
rc
r, kg mÿ3
rf
rF
r�
0 0.5 tÿ t�, ps
c
f
F
F�
100
101
102
104
103
Figure 10.Change in vapor density near the center of an imploding bubble
(r � r�� � 25 nm) of D-acetone vapor on microsecond (left part of figure)
and picosecond (right part) time scales. Here, t� is the instant of time when
the radius r � r�� and the density reaches the maximum value:
r � rmax � r�. The dashed line oO corresponds to the expansion phase
of the cavitation bubble (see also the dashed line oO in Fig. 8); the solid line
OcfFF� traces the collapse stage. The solid line Oc illustrates a shockless
compression; the thin straight-line segment cf indicates shock-induced
compression by a convergent shock wave; fF shows the effect of the
continuous compression wave following after the spherical shock wave.
And finally, line FF� corresponds to compression in a divergent shock
wave structure, initiated after the reflection of the convergent shock wave
structure cfF from the center of the bubble [9].
886 R I Nigmatulin, R T Lahey, Jr., R P Taleyarkhan, C DWest, R C Block Physics ±Uspekhi 57 (9)
kinetic energy and its transformation into the internal energyof a highly compressed substance, thus ending the bubblecompression.
On approaching the center of the bubble, the shock wavebecomes strong when the pressure after the shock wave (i.e.,the jump) exceeds by many times the pressure before theshock wave (see lines 3 and 4 in Fig. 9b, d, f):
pf 4 pc : �4:3�
If the density of vapor is not too large �r5 rL�, and theideal gas equation of state holds true �pf � rf�R=M�Tf�, thenthe density of the gas (D-acetone vapor, g � 1:125) increasesin a jump by a factor [3]
rfrc� g� 1
gÿ 1� 17 : �4:4�
Taking into account that rc � 20 kgmÿ3 and that for highdensity the `cold' pressure of intermolecular interaction yieldsrf < 20� 17 � 340 kg mÿ3, it is actually rf � 250 kg mÿ3.
After converging to the center of the bubble, the sphericalshock wave (cf) is followed by a continuous compressionwave (see fF in Fig. 10). The effect of this wave consists inincreasing the vapor density by 3±4 times. At the momentwhen the radius of the shock wave is rf � 1 mm, the densityafter the wave fF is rF � 103 kg mÿ3, and the temperature isTF � 105 K. However, even these parameters are far from themaximum which actually occurs, and not enough forsignificant D�D fusion to occur.
Maximum values of the density and temperatures areachieved during the process of reflection of the convergentwave structure cfF from the center of the bubble and theformation of a divergent multiwave structure FF� (seeFig. 10). In this multiwave structure, the gas is compressed� 10 timesmore. The process has scales of 10ÿ7 m and 10ÿ12 s.Our calculations [9] have shown that during this process thegas is dissociated and fully ionized, having the form of plasmawhich consists of the deuterium, carbon, and oxygen nucleiand electrons. Consequently, a zone of hot plasmawith radiusr� � 102 nm is formed, where the density and temperature arer� � 104 kg mÿ3 and T� � 108 K during a time interval of10ÿ12 s. That is clearly the zone where sharpening (or blow-up)takes place.
In this zone, there are about 2� 109 nuclei with a meaninternuclear distance of ln � 10ÿ1 nm. The Knudsen numberfor this zone is Kn � lfp=r� � 10ÿ2 , where lfp is the ion meanfree path [9]. Therefore, this zone may be analyzed using acontinuum mechanics approximation with shock waves,together with a two temperature thermodynamic approxima-tion, since the temperatures of the ions T i and electrons T e
are different.Let us next consider the production of fusion neutrons
and tritium nuclei due to energetic binary collisions betweendeuterium (D) nuclei (the number of collisions being propor-tional to r2) in the hot plasma zone. Fusion neutronproduction is defined by a convolution integral [9]:
N�t; r��� R
0
Nr�t; r� dr ; Nr�t; r��� t
0
fÿT i�t 0; r��r 2�t 0; r� dt 0:
�4:5�
The function fÿT i�r 2 is determined by D�D fusion
reaction kinetics [36], which are dependent on the deuterium
ion temperature T i.4 A careful analysis [9] shows that thepassage to the limits yields for D�D thermonuclear kinetics:
Nr�r� !r!0
0 ; Nr�r� !r!1 0 : �4:6�
The first asymptotic occurs even for dissipation-freemedia (for instance, for the Guderley solution), even though
T i !r!01 ; f �T i� !
r!01 : �4:7�
The point is that as r! 0 the time Dt��r� at the extremetemperature tends to zero:
Dt��r� !r!0
0 : �4:8�
For the regimes considered and D�D reaction kinetics,Nr�r� reaches a maximum at r�� � 25 nm. In contrast, forr < r � � 5 nm and r > r� � 100 nm, the kernel functionNr�r�is very small and does not significantly contribute to theintegral that determines fusion neutron production N. Thus,the details of the complicated shock wave process in the zoner < r � � 5 nm are not substantial, because, although theextreme density and temperature are higher in this zone thanat r � r� � 25 nm, the time interval for the deuterium nucleiat these parameters is much less [see formula (4.8)]. Therefore,the contribution from the zone r < r � � 5 nm to the D�Dreaction can be neglected.5
Hydrocode type calculations [9] have shown that inour bubble fusion experiments [10, 11, 17, 20] for eachcollapse of a cavitation vapor bubble in the extreme zone,r < r� � 100 nm, one expects N� � 10 thermonuclear neu-trons per energetically imploded bubble during its existencetime t� � 10ÿ12 s, and the same number of tritium nuclei [9].
As noted previously, periodic bubble cluster cavitationoccurred in our bubble fusion experiments. In this regime, theextreme cluster collapse of bubbles took place periodically ata frequency of f2 [see formula (2.1)]. If in this regime n� � 10bubbles in the central zone of the bubble cluster areenergetically imploded such that they undergo thermonuc-lear fusion [9], we arrive at the following productivity oftritium nuclei and 2.5-MeV neutrons:
Q2 � f2n�N� � 105 n=s : �4:9�
This agrees quite well with our experiments [10±12] [see Q2 informula (2.1)].
The influence of dissociation, ionization, and radiationand the corresponding energy losses which could reduce theion temperature T i have also been carefully considered [9].Significantly, during the time interval of t� � 10ÿ12 s, when a
4 The dependence considered of kinetics on the ion temperature [36] is for a
deuterium plasma with a ratio between numbers of electrons and
deuterium nuclei equal to 1 : 1. But for plasma formed by D-acetone
vapor, besides deuterium, one also faces carbon and hydrogen nuclei. In
an entirely ionized plasma, there are 4 excess electrons for each deuterium
nucleus. That is, four electrons are produced per one deuterium nucleus.
This excess can lower the Coulomb barrier for deuterium nuclei interac-
tions when the density of the plasma is high enough and can lead to much
higher thermonuclear reaction rates. This consideration was previously
suggested by A A Rukhadze and V A Simonenko.5 The N value calculated by the convolution integral (4.5) can be
considered as a quantitative characteristic of the efficiency of the
particular regime of cumulation for realization of physico-chemical
transformations with proper kinetics.
September 2014 On thermonuclear processes in cavitation bubbles 887
fusion parameter zone is formed and gas dissociation andionization occur, the electron temperature does not havesufficient time to noticeably approach the temperature ofthe ions. That is, the inequality
T e 5T i �4:10�
is satisfied.This ensures low energy losses due to the heating of
electrons and their radiation losses, and thus a low influenceof these losses on thermonuclear productivity Q2.
Finally, we note that the formation of vapor/plasmabubbles in a liquid by powerful laser pulses does not lookpromising for ultracompression due to two reasons. First,after the focused laser-induced `explosion' in the liquid themass of the gas is too large to be compressed by the acousticfield. Second, dissociation of the vapor immediately occursafter the laser `explosion'. This increases the speed of sound inthe gas/plasma dramatically and thus decreases shock wavecumulation.
5. Analysis of some critical remarkson the theory
The process of D-acetone vapor bubble collapse from aninitial radius of R0 � 500 mm to a minimum radius ofRmin � 23 mm passes through different scales with a distinctphysical content, namely:
1) wave compression and focusing in the bubble cluster(rcl � 1 cm);
2) shockless compression of vapor in the bubbles whentheir radius decreases from R0 � 500 mm to R � 45 mm intc � 10ÿ5 s;
3) shock wave structure formation at rf0 � 40 mm and itsconverging to the center of the bubble in ts � 10ÿ9 s;
4) reflection of this shock wave structure from the centerof the bubble with the formation of a `nano/pico' thermo-nuclear zone (r� � 102 nm, Dt� � 10ÿ12 s) where, due to allfour of these stages, the vapor density increases fromr0 � 0:25 kg mÿ3 to r� � 104 kg mÿ3.
In contrast, in the paper byGoverdovskii, Imshennik, andSmirnov [24], all this multiscale process is described by amodel describing one physical processÐ the convergence of aspherical shock wave to the center in vapor according to thewell-known Guderley's self-similar solution for a gas with anadiabatic exponent g � 5=3. The initial density of vapor wasassumed to be rc � r0 � 10 kg mÿ3 (but this value of densityis unsubstantiated), and it was assumed that a shock wave isformed at rf0 � 1 cm. This value is not substantiated, either.Following the power law in Guderley's solution, Goverdov-skii et al. [24] then calculated that the temperature reaches a`thermonuclear' value, T TF
f > 3� 106 K (why this tempera-ture is supposed to be thermonuclear is unsubstantiated;however, the time of stay is important, too) in a sphere ofradius rTFf � 0:4 mm. In their model, this zone contains107 nuclei (for rf � 40 kg mÿ3), with an energy of 0.3 keV,even if r0 � 10 kg mÿ3. It is certainly true that for theseparameters one would not expect any thermonuclear neu-trons. Moreover, an arbitrary assumed value of the initialradius of the shock wave rf0 � 1 cm is 25,000 times as great asthe shock wave radius rTFf � 0:4 mm, at which, by theirestimation, the thermonuclear temperature can be reached.This is the basis for the authors of paper [24] to state theunreality of such spherically symmetric cumulation, as the
shockwave radius should decrease 25,000-fold. Clearly such amodel is not realistic.
In any case, without arguing about the suitability ofGuderley's solution and the unreality of spherically sym-metric cumulation, it has been known for a long time that oneshock wave cannot produce sufficient compression for therealization of thermonuclear reactions, since one shock wavecompression (i.e., density increase) is limited by formula (4.4).For the accepted value of adiabatic exponent g � 5=3, it isobtained from formula (4.4) that shock wave compressioncan increase the density only fourfold (i.e., rf � 4r0). More-over, as noted previously, the primitive scheme based on aGuderley type implosion only is far from the multiscaleprocess which actually occurs in imploding vapor bubbles.
What previously described principal features of a collaps-ing vapor bubble did Goverdovskii et al. miss?
First, the adiabatic exponent of D-acetone vapor isg � 1:125, not 5=3, as assumed by Goverdovskii et al. [24].The value of g � 5=3 occurs only after full dissociation of theC3D6Omolecules into their corresponding 10 atoms (i.e., in arelaxation time of 10ÿ8 s after shock compression [9]).Therefore, an increase in vapor density, rf=rc, due to astrong shock wave is, according to formula (4.4), limited by17, not 4. But this is not the most important thing.
Second, the compression of the vapor before shock wavereflection from the bubble center occurs not only due to theconvergent shock wave but at first shocklessly (see the linefragment Oc in Fig. 10), then by shock `jump' (cf in Fig. 10),and again shocklessly (fF in Fig. 10). As a result, the densityof the vapor reaches at least the value of rF � 1000 kg mÿ3.
Third, as discussed previously above, maximum values ofthe density and temperature are reached as a result ofreflection of the convergent wave structure cfF from thebubble center and the formation of a plasma nanozone(radius r� � 100 nm). In this zone, the plasma has densityr� � 104 kg mÿ3 and temperature T� � 108 K during the timeinterval Dt� � 10ÿ12 s. Contrary to our critics' estimations[24], in this zone, in spite of its actual (small) size, there are not107 nuclei, but rather 2� 109 and the temperature is notabout 3� 106 K, but about 108 K.
As was shown above, it is this zone with extremeparameters where the thermonuclear reaction occurs.
Anyway, all these specific features were previouslydiscussed in detail in the open literature [9, 12±16, 19], butthey were apparently not taken into account by our critics.
Finally, one of the main obstacles to the formation ofnanofusion zones lies in the effect of distortions of sphericalsymmetry during the shock wave cumulative process. Wehave also considered this important issue, and have recentlypublished a detailed theoretical investigation based on two-and three-dimensional analyses [37].
This investigation showed that, in spite of developinginterfacial instabilities during spherically symmetric cumula-tion leading to the growth of the symmetry's perturbations,near-spherically symmetric supercompression of small vaporbubbles filled with vapor having a high enough molecularweight (i.e., low speed of sound) has essential resources forenergy cumulation due to the viscosity of the liquid, the highvapor density close to the bubble's interface, and the surfacetension at the interface. In fact, surface tension minimizes anyinitial nonspherical perturbations prior to the onset of thebubble compression process.
We have made numerical calculations taking into accountnonspherical microshock waves in the bubble during com-
888 R I Nigmatulin, R T Lahey, Jr., R P Taleyarkhan, C DWest, R C Block Physics ±Uspekhi 57 (9)
pression. These calculations showed that, for a well-orga-nized acoustical pressure field, only about 50% of the D�Dneutrons and tritium ions might be lost because of nonspher-ical effects.6 Nevertheless, this investigation needs moredetailed analysis and will be published separately.
The formation of the extreme microzones � 10 nm in sizeis not excluded, even after fragmentation of bubbles in thecenter of the cluster.
6. Conclusion
Certainly, our small-scale desk-top experiments involvingonly the acoustic forcing of the cavitation of vapor bubblesand their implosive collapse within the resulting bubbleclusters have not produced a fusion burn, but only thermo-nuclear `sparks'. Indeed, the experimental setup which weused cannot be considered as a thermonuclear reactor, whichcould produce net energy [16]. First, in our process, which hasa relatively weak neutron productivity, the fusion energyrelease by thermonuclear sparks is around 106 times theenergy needed (by the GPN and AG) for initiation of fusionsparks, and this fusion energy does not exert influence on thestate of this nanothermonuclear zone. Second, the processoccurs at low liquid temperatures (0 �C) only, and thus theenergy releases are of low thermodynamic value.
Nevertheless, about two orders of magnitude in thefusion energy release would be gained by using the D� Treaction instead; for example, instead of just usingD-acetone as the test fluid, using a mixture of D-acetoneand T-acetone �C3T6O� with mass concentration ratioM�C3D6O� :M�C3T6O� � 64:70. In the search for the otherfour orders of magnitude needed to break even, the followingareas appear to be promising for creating more completefusion burns, rather than just sparks.
(1) Use of a larger and more robust test chamber design.Our initial test apparatus was a 600-cm3 volume Pyrex glasstest chamber, with a 40-W acoustical generator (AG) coupledto a PZT and a commercially available pulsed neutrongenerator (PNG).
(2) Use of an optimized test liquid with a highermolecularweight and a larger content of D and T atoms, which wouldmake the first, shockless, stage of vapor compression moreeffective, so that supercompression could occur at higher pooltemperatures (> 100 �C).
Goverdovskii, Imshennik, and Smirnov [24] also wroteabout the prospects of traditional fusion programs for thesecond part of the 21st century. These programs are Tokamakprograms [International Thermonuclear Experimental Reac-tor (ITER) and the Demonstration Power Plant (DEMO)],and laser inertial confinement fusion programs. They lamentthe long period of waiting for results and question whetherthey (the `leading fusion experts') are in the right path. Inaddition, however, they also claim that `poorly educatedinventors and world-renowned scientists' come in largenumbers with `simple' recipes, and `leading fusion experts'have had to waste time analyzing these recipes. We note thatat least some of the `leading fusion experts' have beenconsidering these new ideas and prospects not in scientificcircles, but in the media and with government officials whenprotecting the financing of their own research programs. Thisdoes not favor the maintenance of a high scientific level by
some `leading fusion experts' or an optimization of fusionresearch study funding. In any event, the `leading fusionexperts' need to make their criticisms of the recipes of`poorly educated inventors and world-renowned scientists'at a much higher scientific level.
Many scientists and practising nuclear engineers believethat the expensive and decades-long research programs basedon tokamak and laser inertial-confinement fusion conceptsare not very likely to result in near-term industrial-scalefusion energy production. In contrast, bubbly liquids opennew avenues for use in industrial power systems, because thenear spherical focusing of energy by a dense (inertial) andviscous liquid is inherently much more stable than thefocusing of energy due to a vapor explosion initiated by anoptical supershort laser shock. In addition, power supply bysupershort laser shocks requires great amounts of energy andgiant apparatuses, and it is not effective for the super-compression of a gas.
Fortunately, bubbly liquids show potential in the searchfor nuclear fusion energy technology, which even our critics[24] admit.
References
1. Zababakhin E, Zababakhin I Unlimited Cumulation Phenomena
(Moscow: Nauka Publ., 1990); Translated from Russian: Zababa-
khin E I, Zababakhin I E Yavleniya Neogranichennoi Kumulyatsii
(Moscow: Nauka, 1988)
2. Zababakhin E I Some Problems of the Gasdynamics of Explosions
(Snezhinsk: RFNCÐ VNIITF Publ. House, 2001)
3. Zel'dovich Ya B, Raizer Yu P Physics of Shock Waves and High-
Temperature Hydrodynamic Phenomena (New York: Academic
Press, 1966 ± 1967); Translated from Russian: Fizika Udarnykh
Voln i Vysokotemperaturnykh Gidrodinamicheskikh Yavlenii (Mos-
cow: Fizmatlit, 2008)
4. Crum L A, Matula T J Science 276 1348 (1997)
5. Margulis M A Phys. Usp. 43 259 (2000); Usp. Fiz. Nauk 170 263
(2000)
6. Young F R Sonoluminescence (Boca Raton: CRC Press, 2005)
7. Moss W C et al. Phys. Lett. A 211 69 (1996)
8. Nigmatulin R I et al. Sonochemistry and Sonoluminescence (NATO
ASI Ser., Ser. C, Vol. 524, Eds L ACrum et al.) (Dordrecht: Kluwer
Acad. Publ., 1999)
9. Nigmatulin R I et al. Phys. Fluids 17 107106 (2005)
10. Taleyarkhan R P et al. Science 295 1868 (2002)
11. Taleyarkhan R P et al. Phys. Rev. E 69 036109 (2004)
12. Nigmatulin R I et al. J. Power Energy 218 345 (2004)
13. Nigmatulin R I et al. Vestn. Akad. Nauk Resp. Bashkortostan 7 (4)
(2002)
14. Nigmatulin R Nucl. Eng. Design 235 1079 (2005)
15. Taleyarkhan R P, Lahey R T, Jr., Nigmatulin R I Multiphase Sci.
Technol. 17 191 (2005)
16. Lahey R T, Jr. et al. Adv. Heat Transfer 39 1 (2006)
17. Taleyarkhan R P et al. Phys. Rev. Lett. 96 034301 (2006)
18. Taleyarkhan R P et al. Nucl. Eng. Design 238 2779 (2008)
19. TaleyarkhanRP, LaheyRT, Jr., Nigmatulin R I, inNuclear Energy
Encyclopedia: Science, Technology, and Applications (S BKrivit, J H
Lehr, T B Kingery) (Hoboken, N.J.: Wiley, 2011) Ch. 46, p. 553
20. Xu Y, Butt A Nucl. Eng. Design 235 1317 (2005)
21. Kennedy D Science 295 1793 (2002)
22. Reich E S Nature News March 8 (2006) doi:10.1038/news060306-2;
Nature News July 22 (2008) doi:10.1038/454379a; Nature News
August 29 (2008) doi:10.1038/news.2008.1069
23. Krivit SNewEnergyTimes July 18 (2013);NewEnergyTimes Jan. 20
(2014); http://www.bubblegate.com
24. Goverdovskii A A, Imshennik V S, Smirnov V P Phys. Usp. 56 423
(2013); Usp. Fiz. Nauk 183 445 (2013)
25. Shapira D, Saltmarsh M Phys. Rev. Lett. 89 104302 (2002)
26. Forringer E R, Robbins D, Martin J Trans. Am. Nucl. Soc. 95 736
(2006)6 This sentence was added in the English proof.
September 2014 On thermonuclear processes in cavitation bubbles 889
27. Abramov A I, Kazanskii Yu A, Matusevich E S Osnovy Eksperi-
mental'nykh Metodov Yadernoi Fiziki (Fundamentals of Experi-
mental Nuclear Physics Methods) (Moscow: Energoatomizdat,
1985)
28. Knoll GFRadiationDetection andMeasurement (NewYork:Wiley,
1989)
29. Taleyarkhan R P et al., arXiv:1307.3217
30. X-5 Monte Carlo Team ``MCNP'' LANL-UR-03-1987 (2003)
31. Dickens J K, ``SCINFUL'', ORNL-6462 (1988)
32. Lee J H, Lee C S Nucl. Instrum. Meth. Phys. Res. A 402 147 (1998)
33. Naranjo B Phys. Rev. Lett. 97 149403 (2006)
34. Nigmatulin R I Dynamics of Multiphase Media Vol. 1 (New York:
Hemisphere Publ. Corp., 1991); Translated fromRussian:Dinamika
Mnogofaznykh Sred Vol. 1 (Moscow: Nauka, 1987)
35. Kedrinskii V K Hydrodynamics of Explosions: Experiment and
Models (Berlin: Springer, 2005); Translated from Russian: Gidrodi-
namika Vzryva: Eksperiment i Modeli (Novosibirsk: Izd. SO RAN,
2000)
36. Bosch H-S, Hale G M Nucl. Fusion 32 611 (1992)
37. Nigmatulin R I et al. J. Appl. Mech. Tech. Phys. 55 444 (2014);
Priklad. Mekh. Tekh. Fiz. 55 (3) 82 (2014)
890 R I Nigmatulin, R T Lahey, Jr., R P Taleyarkhan, C DWest, R C Block Physics ±Uspekhi 57 (9)


