Embed Size (px)
Citation preview

LETTERdoi:10.1038/nature13611
Oncogene ablation-resistant pancreatic cancer cellsdepend on mitochondrial functionAndrea Viale1,2*, Piergiorgio Pettazzoni1,2*, Costas A. Lyssiotis3, Haoqiang Ying1, Nora Sanchez1,2, Matteo Marchesini1,2,Alessandro Carugo1,2,4, Tessa Green1,2, Sahil Seth5, Virginia Giuliani5, Maria Kost-Alimova5, Florian Muller1, Simona Colla1,Luigi Nezi1,2, Giannicola Genovese1, Angela K. Deem1, Avnish Kapoor1, Wantong Yao1,2, Emanuela Brunetto6, Ya’an Kang7,Min Yuan8, John M. Asara8, Y. Alan Wang1, Timothy P. Heffernan5, Alec C. Kimmelman9, Huamin Wang10, Jason B. Fleming7,Lewis C. Cantley3, Ronald A. DePinho11 & Giulio F. Draetta1,2
Pancreatic ductal adenocarcinoma (PDAC) is one of the deadliest can-cers in western countries, with a median survival of 6 months and anextremely low percentage of long-term surviving patients. KRAS mu-tations are known to be a driver event of PDAC1, but targeting mutantKRAS has proved challenging2. Targeting oncogene-driven signallingpathways is a clinically validated approach for several devastatingdiseases3,4. Still, despite marked tumour shrinkage, the frequency ofrelapse indicates that a fraction of tumour cells survives shut downof oncogenic signalling5,6. Here we explore the role of mutant KRASin PDAC maintenance using a recently developed inducible mousemodel of mutated Kras1 (KrasG12D, herein KRas) in a p53LoxP/WT back-ground. We demonstrate that a subpopulation of dormant tumourcells surviving oncogene ablation (surviving cells) and responsible fortumour relapse has features of cancer stem cells and relies on oxid-ative phosphorylation for survival. Transcriptomic and metabolicanalyses of surviving cells reveal prominent expression of genes gov-erning mitochondrial function, autophagy and lysosome activity,as well as a strong reliance on mitochondrial respiration and a de-creased dependence on glycolysis for cellular energetics. According-ly, surviving cells show high sensitivity to oxidative phosphorylationinhibitors, which can inhibit tumour recurrence. Our integrated ana-lyses illuminate a therapeutic strategy of combined targeting of theKRAS pathway and mitochondrial respiration to manage pancre-atic cancer.
Using our tetracycline-inducible KRas allele1, we controlled the expres-sion of KRas in a temporal and pancreas-specific manner. Upon doxycy-cline withdrawal, we observed regression of pancreatic tumours within2–3 weeks followed by relapse after 4–5 months, suggesting that a frac-tion of tumour cells survived oncogene ablation. To investigate the impactof KRas ablation in detail, we transplanted cells from primary tumourssubcutaneously into recipient mice fed with doxycycline. When tumoursreached a diameter of 1 cm, doxycycline was withdrawn and the lesionsrapidly and apparently completely regressed (Fig. 1a and Extended DataFig. 1a). However, analysis of residual scars detected epithelial remnantsembedded in fibrotic tissue (Fig. 1b and Extended Data Fig. 1b, c). Thisphenotype was confirmed in vitro using a three-dimensional culture sys-tem in which cells from primary lesions were grown as spheres in semi-solid medium. After doxycycline withdrawal (Extended Data Fig. 1d, e),tumour spheres underwent regression due to apoptosis (Extended DataFig. 1f), and only a small population of dormant cells survived (ExtendedData Fig. 1d, g). Notably, upon KRas re-activation, surviving cells (SCs)massively re-entered the cell cycle both in vitro and in vivo (Fig. 1c andExtended Data Fig. 1g, h) and rapidly reconstituted spheres and tumours,
suggesting that subpopulations of cells differently addicted to KRas co-exist in pancreatic tumours.
To assess the tumorigenic potential of SCs, we isolated KRas-expressingcells and SCs from tumour spheres (ex vitro) and tumours (ex vivo) andtransplanted them in limiting dilution into recipient mice. Surprisingly,SCs were highly enriched in tumour-initiating cells (TICs). Virtually allSCs ex vitro initiated tumours in mice (TIC frequency?1:5 versus 1:31in KRas-expressing cells; P , 0.001) (Fig. 1d and Extended Data Fig. 2a),and TIC frequency was similarly enriched in SCs ex vivo (1:10 versus 1:100in KRas-expressing cells) (Fig. 1d and Extended Data Fig. 2b). Then, toassess whether pharmacological ablation of oncogenic pathways couldmimic the genetic suppression of KRas, we treated tumour spheres de-rived from a KRas constitutive mouse model7 with a combination ofMek1 (AZD8330) and dual PI3K/mTOR (BEZ235) inhibitors (ExtendedData Fig. 2c). The treatment resulted in an enrichment of tumorigeniccells (TIC frequency 1:7 versus 1:47 for treated versus non-treated cells,respectively) (Fig. 1d and Extended Data Fig. 2d). Collectively, our datademonstrate that PDAC tumours are heterogeneous, and that a popu-lation of spherogenic and tumorigenic cells survives genetic and phar-macological ablation of oncogenic pathways.
To exclude the possibility that SCs represent a more aggressive sub-clone of tumour cells, we performed exome sequencing of tumour cellsduring cycles of KRas activation–inactivation–reactivation (ON–OFF–ON cycles) and evaluated changes in the allelic frequency of single nucle-otide variants (SNVs), a hallmark of clonal selection. Mutational profilesdid not show any significant modification in allelic frequencies beforeversus after ON–OFF–ON cycles (Fig. 1e and Extended Data Fig. 2e),demonstrating that tumours after KRas reactivation are geneticallyidentical to their primary counterparts. While these data formally excludegenetic clonal selection among SCs, epigenetically driven clonal selec-tion of a more aggressive subclone remains possible.
To characterize SCs further, we examined the expression of markersused to isolate cancer stem cells in human tumours8–10. We found thatdifferent subpopulations of tumour cells were differentially sensitive toKRas ablation; specifically, only CD1331 CD44high cells avoided under-going massive apoptosis (Fig. 1f and Extended Data Fig. 1i). Consequently,tumour remnants in vivo are strongly positive for stem cell markers(Fig. 1g, h and Extended Data Fig. 2f, g). Together, the tumorigenicityand immunophenotypic similarity between SCs and previously identi-fied human pancreatic cancer stem cells8–10 suggests that SCs may pos-sess cancer stem cell characteristics.
We next performed a transcriptomic analysis of cells isolated from tu-mour spheres. Gene set enrichment analysis (GSEA) revealed significant
*These authors contributed equally to this work.
1Department of Genomic Medicine, The University of Texas MD Anderson Cancer Center, Houston, Texas 77030, USA. 2Department of Molecular and Cellular Oncology, The University of Texas MDAnderson Cancer Center, Houston, Texas 77030, USA. 3Department of Medicine, Weill Cornell Medical College, New York, New York 10065, USA. 4Department of Experimental Oncology, European Instituteof Oncology, Milan 20139, Italy. 5Institute for Applied Cancer Science, The University of Texas MD Anderson Cancer Center, Houston, Texas 77030, USA. 6Pathology Unit, San Raffaele Scientific Institute,Milan 20132, Italy. 7Department of Surgical Oncology, The University of Texas MD Anderson Cancer Center, Houston, Texas 77030, USA. 8Department of Medicine, Division of Signal Transduction, BethIsrael Deaconess Medical Center, Boston, Massachusetts 02115, USA. 9Department of Radiation Oncology, Dana-Farber Cancer Institute, Boston, Massachusetts 02215, USA. 10Department of Pathology,The University of Texas MD Anderson Cancer Center, Houston, Texas 77030, USA. 11Department of Cancer Biology, The University of Texas MD Anderson Cancer Center, Houston, Texas 77030, USA.
0 0 M O N T H 2 0 1 4 | V O L 0 0 0 | N A T U R E | 1
Macmillan Publishers Limited. All rights reserved©2014

enrichment of genes involved in several metabolic pathways (for exam-ple, mitochondrial electron transport chain (ETC), lysosome activ-ity, autophagy, mitochondrial and peroxisomal b-oxidation) (Fig. 1iand Extended Data Fig. 3a–e), which suggested that SCs might haveincreased mitochondrial activity. Indeed, Ppargc1a (PGC1a), a key reg-ulator of mitochondrial biogenesis11, was increased at the messengerRNA and protein levels in SCs (Fig. 2a and Extended Data Fig. 4a), andwe detected PGC1a accumulation in the nuclei of SCs in vivo (Fig. 2c).Furthermore, SCs from tumour spheres stained intensely for MitoTrackerGreen, a marker of mitochondrial mass (Extended Data Fig. 4b). Thesedata were corroborated by increased expression of the mitochondrialmarker VDAC1 in SCs in vitro and in vivo (Fig. 2b, d).
We functionally validated our findings by measuring respiratory capac-ity. SCs had a fourfold increase in oxygen consumption rate (OCR) com-pared with KRas-expressing cells (118 versus 33 pmol min21, respectively;P 5 0.001) (Fig. 2e). Likewise, both in vivo and in vitro, mitochondriaof SCs that were either genetically or pharmacologically selected weremore hyperpolarized (Fig. 2f and Extended Data Fig. 4c–f) and gener-ated more reactive oxygen species (ROS) (Extended Data Fig. 4g, h), indi-cating a more active ETC. We also detected morphological differences inmitochondria using transmission electron microscopy (TEM) (Fig. 2g).Because transmembrane mitochondrial potential regulates the mitochon-drial permeability transition pore (lower potential 5 lower threshold forpore opening) and because cells positive for stem cell markers in KRas-expressing tumours have hyperpolarized mitochondria (Extended DataFig. 4i, j), the higher mitochondrial potential per se could explain why cellspositive for stem cell markers are less prone to KRas ablation-mediated
apoptosis. Altogether, our data suggest that altered metabolic and mito-chondrial functions are critical features of SCs.
SCs and KRas-expressing cells were next exposed to mitochondrialstressors. Treatment with oligomycin, a Fo-ATPase inhibitor of ComplexV, significantly reduced mitochondrial respiration in both populations(Extended Data Fig. 5a). Conversely, normalization to basal respira-tion revealed different effects of the uncoupler carbonyl cyanide-p-trifluoromethoxyphenylhydrazone (FCCP) (Extended Data Fig. 5b),indicating that the mitochondria of SCs function near their maximalrate and have minimal spare respiratory capacity. Despite similar over-all responses to Complex V inhibition, ATP levels of SCs were dramat-ically reduced upon oligomycin treatment compared to KRas-expressingcells (Fig. 2h), suggesting a deficit in energy compensatory mechanisms.Indeed, KRas-expressing cells exposed to oligomycin strongly upregu-lated their extracellular acidification rate (ECAR) and lactate produc-tion, a compensation that did not occur in SCs (Fig. 2i and ExtendedData Fig. 5c, e), confirming that SCs failed to increase glycolysis afteroxidative phosphorylation (OXPHOS) inhibition in a manner sufficientto rescue the defects in ATP production.
To assess comprehensively differences in metabolism, we performeda metabolomic analysis using a liquid chromatography coupled withtandem mass spectrometry (LC-MS/MS)-based platform1,12, revealingthat several metabolic pathways were deregulated in SCs (ExtendedData Fig. 5d). Consistent with the above findings, glycolytic intermedi-ates downstream of phospho-fructose kinase (PFK) were significantlyless abundant in SCs versus KRas-expressing cells (Fig. 2j). The impairedglycolysis of SCs was independently validated by measuring glucose
a KRas-expressingtumour
Tumour afterKRas ablation
b +KRas –KRas –KRas re-ON
CD
44 K
i67
DA
PI K
i67
c
Fre
quency o
f T
ICs
P < 0.01
Ex vitro Ex vivo Pharmacological
TIC frequency
+KRas 1:31
–KRas >>1:5
TIC frequency
+KRas 1:100
–KRas 1:10
TIC frequency
Ctrl 1:47
AZD+BEZ 1:7
d
Tumour 21.00
1.00
0.75
0.75
0.50
0.50
0.25
0.250
0
Tumour 11.00
1.00
0.75
0.75
0.50
0.50
0.25
0.250
0
Reference
e
Cells
(%
)
P = 0.01P = 0.02
CD133+ CD44high
80
60
40
20
0
CD133– CD44dim
Live Apo Nec
f
CD
133 C
D44
CD
133 C
D44
g
Ald
efluo
rA
ldefluo
r
h
–KRas
+KRas
NES 1.909
P < 0.001
q = 0.05
ETC
–KRas
+KRas
NES 1.992
P < 0.001
q = 0.02
Lysosome
–KRas
+KRas
NES 1.657
P = 0.01
q = 0.13
Autophagy
–KRas
+KRas
NES 1.803
P = 0.003
q = 0.06
β-Oxidation
–KRas
+KRas
NES 1.671
P < 0.001
q = 0.12
Peroxisomei
0
50
100
150
200
0.25
0.20
0.15
0.10
0.05
0
250
300
350
400
+KRas
–KRas
P = 0.01
Vo
lum
e (m
m3)
CD133-151 0 102 103 104 105
CD44
300
200
100
0
1051041031020
105
105
104
103
102
0
–90
105
104
103
102
0
–84
1041031020–105
–164
1051041031020–90
200
100
0
Co
un
t
CD44
Co
un
t
CD133
+K
Ras
–K
Ras
Re-O
N
Figure 1 | Cells surviving oncogene ablation are enriched in tumorigeniccells. a, Tumour volume before/after KRas ablation (1/2KRas) (n 5 6).b, Histology depicting tumour remnants (310). c, Immunofluorescence ofKRas-expressing tumour (1KRas), regressed tumour (2KRas) and regressedtumours 48 h after KRas re-activation (2KRas re-ON) for Ki67 (red), CD44(green) and 49,6-diamidino-2-phenylindole (DAPI; blue) (340). d, Limitingdilution transplantation, TIC frequency. Genetic model: 1KRas (black) versus–KRas (grey) ex vitro (n 5 4) or ex vivo (n 5 2). Pharmacologicaldownregulation: control (black) versus treated spheres (grey; AZD8330 plusBEZ235 (AZD1BEZ)) (n 5 2). Ctrl, control. e, Exome sequencing: allele
frequencies after KRas re-activation in SCs (Re-ON) versus KRas-expressingcells (Reference) at 40,383 and 44,182 SNVs for two independent tumours.f, Annexin V in spheres 1/2KRas with respect to CD44/CD133 expression.Percentage of live, apoptotic (Apo) and necrotic (Nec) cells are reported(n 5 3). g, Immunohistochemistry of 2KRas tumours for CD44 (blue) andCD133 (red) (320–40). h, Immunophenotyping of 1/2KRas tumoursfor CD44/CD133/aldefluor. i, GSEA of pathways enriched in 2KRas versus1KRas cells. Normalized enriched scores (NES) are reported. Data aremean 6 standard deviation (s.d.).
RESEARCH LETTER
2 | N A T U R E | V O L 0 0 0 | 0 0 M O N T H 2 0 1 4
Macmillan Publishers Limited. All rights reserved©2014

uptake and lactate production in vitro (Fig. 2k, l and Extended Data Fig. 6a)and in vivo (Extended Data Fig. 6b). The ratio between lactate and glu-cose in spent media supports this difference even more strongly (con-centration of lactate/concentration of glucose: KRas-expressing cells,16.9; SCs, 0.9). Importantly, SCs surviving pharmacological ablationof KRas showed a similar phenotype (Extended Data Fig. 6c, d).
We also detected a decreased abundance of metabolic intermediatesspecific to the tricarboxylic acid (TCA) cycle in SCs (Extended DataFig. 5f). We used carbon-13-labelled primary metabolic substrates totrace their contribution to central carbon metabolism. After 36 h label-ling, SCs relied less on glucose and glutamine and more on pyruvateand palmitate to generate TCA cycle intermediates and branching metab-olites (Fig. 2m and Extended Data Fig. 7e–h). This is consistent withreports describing the mutant KRas-mediated activation of anabolicglucose and glutamine metabolism in PDAC1,13–15. It is also worth not-ing that SCs had lower levels of high-energy metabolites (ExtendedData Fig. 5g) (compatible with less anabolic, dormant cells) and increasedtotal glutathione (Extended Data Figs 5g and 8h). Importantly, any effectof cell cycle fluctuations on metabolic processes was excluded by ourexperimental design, as comparisons were made between quiescent SCsand quiescent fully formed KRas-expressing spheres (Extended DataFig. 1g). In fact, we demonstrated that sphere formation is a dynamic andregulated process in which tumour cells expressing KRas exit the cellcycle when tumour spheres are fully formed. Thus, observed metabolicalterations can appropriately be attributed to an autonomous meta-bolic program.
The lower energy levels and a lack of energetic compensatory mech-anisms in response to mitochondrial stressors in SCs suggested that
treatment with OXPHOS inhibitors might impact their survival. As ex-pected, even a short, 24 h exposure to oligomycin completely abrogatedthe ability of SCs to reform tumour spheres upon KRas re-expression,whereas KRas-expressing cells were unaffected (Fig. 3a and ExtendedData Fig. 8a). Similar effects were observed with other OXPHOS inhi-bitors, although with less dramatic effects relative to Complex V inhibi-tors (Extended Data Fig. 8b). To determine whether OXPHOS inhibitionsynergized with KRas ablation in vivo, we induced tumour regressionfor 2 weeks via doxycycline withdrawal, treated mice with oligomycin(0.5 mg kg21 daily, intraperitoneal (i.p.)) or vehicle, and subsequentlyre-induced KRas and tumour relapse (Extended Data Fig. 8c–e). Whilemice treated with vehicle relapsed immediately (median survival 15 days,maximal survival 19 days), 25% of oligomycin-treated mice survived.60 days (P , 0.0001) (Fig. 3b and Extended Data Fig. 8f). Oligomycintreatment also strongly abrogated the spherogenic potential of SCs treatedwith AZD8330 plus BEZ235 independently of their p53 status (Fig. 3c).Because OXPHOS inhibitors induce ROS16 and SCs have elevated basalmitochondrial ROS levels (Extended Data Fig. 4g and Extended DataFig. 8g), we excluded the possibility that the observed synthetic lethalityof oligomycin was caused by oxidative stress (Extended Data Fig. 8h–k).
To explore the therapeutic potential of inhibiting OXPHOS in humantumours, we derived spheres from early passage patient-derived xenografts17.Similar to the mouse model, combination treatment with AZD8330 andBEZ235 for 1 week strongly decreased sphere formation (Extended DataFig. 9a–c), sparing cells endowed with spherogenic potential, increasedmitochondrial potential (Extended Data Fig. 9d) and, most importantly,unable to upregulate ECAR in response to OXPHOS inhibition (Fig. 3d).As with mouse cells, short exposure of human SCs to oligomycin
a
b
+K
Ras
–K
Ras
DAPI PGC1a CD44 PGC1ac
+K
Ras
–K
Ras
DAPI VDAC1 CD44 VDAC1d
e
Rela
tive m
ean o
f in
tensity (Δψ
m) P < 0.01
P < 0.01
+KRas
–KRas
+KRas –KRas –KRas+CCCP
+KRas –KRas –KRas+CCCP
Cell
co
unt
Cell
co
unt
f g
+K
Ras
–K
Ras
h i j
k l m
0
0.2
0.4
0.6
0.8
1.0
1.2
Glu
co
se
Glu
co
se
Glu
tam
ine
Glu
tam
ine
Palm
itate
Palm
itate
Pyru
vate
Pyru
vate
+ – + – + – + –
aK
G iso
top
om
ers
(fr
actio
n)
aKG M+0
aKG M+1
aKG M+2
aKG M+3
aKG M+4
aKG M+5
******** **
****
******
*P ≤ 0.05
**P ≤ 0.01
KRas
0
0.3
0.5
0.8
1.0
1.3
1.5G
6P
/G1P
/F6P
G6P
F6P
F(1
,6)B
P
DH
AP
Ga3P
G3P
(1,3
)BP
G
(2,3
)BP
G
3P
G
PE
P
Pyr
Lac
Ala
Rela
tive m
eta
bo
lite
–KRas
+KRas
*P = 0.03†P ≤ 0.01
†
†† † †
* **
*
*
0
20
40
60
80
100
120
140
160
180
+KRas
–KRas
Lacta
te (nm
ol h
–1 1
0–5 c
ells
)
P = 0.0001
0
20
40
60
80
100
120
+KRas
–KRas
Glu
co
se u
pta
ke (nm
ol h
–1 1
0–5 c
ells
)
P = 0.0004
0
10
20
30
40
50
60
70
80
90
100
5 10 15 20 25 30 35 40 45 50 55 60
+KRas
–KRas
P = 0.00005
EC
AR
(m
pH
min
–1)
Time (min)
Glucose Oligomycin2DG
0
0.5
1.0
1.5
2.0
2.5
3.0
3.5 100
80
60
40
20
0
100
80
60
40
20
0
–103 0 103 104 105
–103 0 103 104 105
0
20
40
60
80
100
120
140
160
+KRas
–KRas
Oxyg
en c
onsum
ptio
n (p
mo
l m
in–1)
P = 0.001
0
0.2
0.4
0.6
0.8
1.0
1.2
+KRas –KRas
Ctrl Oli
Rela
tive A
TP
level
KRas + – + –
KRas + – + –
VDAC1
VDAC1
Actin
Actin
Kras + – + – + –
PGC1a
No. 1 No. 2
No. 1 No. 2
No. 3 No. 4
No. 3
Actin
Figure 2 | Surviving cells have more activemitochondria and impaired glycolysis.a, b, Immunoblot of 1/2KRas cells derivedfrom independent tumours probed with PGC1a(a) and VDAC1 (b) antibodies. Numbers indicatedifferent independent tumours. c, d, In vivoimmunofluorescence for CD44 (green) and PGC1a(red) (c), and CD44 and VDAC1 (red) (d) in1/2KRas tumours (360). e, Oxygen consumptionof 1/2KRas cells (n 5 7). f, In vivo mitochondrialpotential of 1/2KRas tumours (n 5 3);representative flow cytometry of two tumours, ascontrol uncoupler CCCP was added to acquired2KRas. g, TEM micrographs representingmitochondrial morphology (325,000). h, ATPlevels of 1/2KRas cells in response to oligomycin(Oli) or dimethylsulphoxide (DMSO; Ctrl) (n 5 4).i, ECAR response of 1/2KRas cells to glucose,oligomycin and 2-deoxy-D-glucose (2DG) (n 5 4).j, Fold change of glycolytic intermediates in1/2KRas cells (n 5 4). Ala, alanine; BPG,bisphsphoglycerate; DHAP, dihydroxyacetonephosphate; F6P, fructose-6-phosphate; F(1,6)BP,fructose-1,6-bisphosphate; G6P, glucose-6-phosphate; G1P, glucose-1-phosphate;Ga3P, glyceraldehyde- 3-phosphate; G3P,glycerol-3-phosphate; Lac, lactate; PEP,phosphoenolpyruvate; 3PG, 3-phosphoglycerate;Pyr, pyruvate. k, l, Glucose uptake (k) and lactateproduction (l) of 1/2KRas cells (n 5 3).m, Isotopomer distribution for a-ketoglutarate(aKG) following steady-state tracing withuniformly carbon-13-labelled substrates (n 5 3).Data are mean 6 s.d.
LETTER RESEARCH
0 0 M O N T H 2 0 1 4 | V O L 0 0 0 | N A T U R E | 3
Macmillan Publishers Limited. All rights reserved©2014

dramatically decreased their spherogenic potential (Fig. 3e). Similarly,transient genetic downregulation of TFAM (a key regulator of mito-chondrial transcription18) and TUFM (a GTPase that delivers amino-acylated transfer RNAs to mitochondrial ribosomes19) decreased thespherogenic potential of human cells surviving combined AZD8330plus BEZ235 treatment (Extended Data Fig. 9e–h). Altogether, thesedata highlight mitochondrial respiration as an attractive, druggabletarget that may effectively eradicate SCs in PDAC.
The low energy state of SCs suggested that these cells may be experi-encing metabolic stress. We thus measured AMPK phosphorylation at
Thr 172, an established indicator of metabolic stress. Surprisingly, AMPKphosphorylation was lower in SCs versus KRas-expressing cells (Fig. 4a);however, marked induction of AMPK phosphorylation was observedspecifically in SCs upon oligomicyn treatment, stressing again the impor-tance of ETC activity for their energy production (Fig. 4b and ExtendedData Fig. 9i).
To elucidate further the metabolic mechanisms active in SCs, we inves-tigated other targets identified by transcriptomic analysis, including auto-phagy andb-oxidation. Autophagy and lysosome activity, two of the mostactivated pathways on the basis of GSEA (Fig. 1i), have an important
a b
c d e
0
0.2
0.4
0.6
0.8
1.0
1.2
1.4
+KRas –KRas
Ctrl
Oli
Rela
tive s
phere
num
ber
P < 0.01
–K
Ras
+K
Ras
Ctrl Oli
Per
cent
surv
ival
0 20 40
Time (days)
600
50
100
P < 0.0001
Ctrl (n = 12)
Oli (n = 23)
0
0.2
0.4
0.6
0.8
1.0
1.2
1.4
p53–/– p53–/–
AB
Ink4a/Arf–/– Ink4a/Arf–/–
AB
Ctrl Oli
!"
*
*
P < 0.01
Rela
tive s
phere
num
ber
0
5
10
15
20
25
30
35
40
45
50
5 10 15 20 25 30 35 40 45 50 55 60
Ctrl
AZD+BEZ
P < 0.01
GlucoseOligomycin
2DG
EC
AR
(m
pH
min
–1)
Time (min)
0
0.2
0.4
0.6
0.8
1.0
1.2
Ctrl ABZ+BEZ
Ctrl Oli
Rela
tive s
phere
num
ber
P < 0.01
Figure 3 | OXPHOS inhibition specificallytargets surviving cells. a, Effect of oligomycin(Oli) and DMSO (Ctrl) on spherogenic potential of1/2KRas cells (n 5 8); representative calceinstaining. b, Kaplan–Meier overall survival afterKRas reactivation in mice bearing regressedtumours treated for 2 weeks with oligomycin orvehicle. c, Effects of oligomycin and DMSO onspherogenic potential of cells treated (AB) or notwith AZD8330 plus BEZ235 in p532/2 andInk4a/Arf2/2 backgrounds (n 5 3). d, ECARresponse of human tumour spheres treated(AZD1BEZ) and untreated (Ctrl) to glucose,oligomycin and 2DG (n 5 3). e, Effect ofoligomycin and DMSO on spherogenic potential ofhuman treated and untreated tumour cells (n 5 3).Data are mean 6 s.d.
a b c
Cell
co
un
t
–KRas+Baf
–KRas
+KRas
Cell
co
un
t
–KRas+Baf
–KRas
+KRas
LC
3–G
FP
(m
ean
of
inte
nsity)
+KRas
–103 103 104 1050
–103 103 104 105 100 × 103 200 × 10300
–KRas–KRas+Baf
* *
*
*P = 0.01
d
+KRas
–KRas
P < 0.01
Rela
tive m
ean
of
inte
nsity (L
ipid
tox)
Cell
co
un
t
+KRas
–KRas
Cell
co
un
t
+KRas
–KRas
e
f Hoechst Lipidtox Hoechst Lysotracker Mergeg
OC
R
*
*
†
†
*P = 0.01
†P = 0.02
+KRas –KRas
+KRas –KRas
h
*P < 0.01
†P = 0.01
*
Rela
tive s
ph
ere
nu
mb
er
i
No. 1No. 1 No. 2
No. 1 No. 2No. 3+ – + –
– + + + – + –+– –
– – – –– –
No. 2
KRas
AMPK
pACC
Actin
pAMPK
pAMPK
Actin
OliKRas
Actin
LC3
KRas
0
0.2
0.4
0.6
0.8
1.0
1.2
0
0.5
1.0
1.5
2.00
100 × 103 200 × 10300
2.5
3.0
0
0.2
0.4
0.6
0.8
1.0
1.2
Ctrl
Baf
Eto
0
0.2
0.4
0.6
0.8
1.0
1.2
Ctrl
Baf
Eto
Figure 4 | Surviving cells are not in metabolic stress and activate autophagy.a, Immunoblot of Thr-172-phosphorylated and total AMPK, Ser-79-phospho-acetyl-coA-carboxylase (pACC) and b-actin in 1/2KRas cells fortwo independent tumours. b, Immunoblot of 2KRas cells treated or not witholigomycin (Oli) probed with anti-Thr-172-phospho-AMPK and b-actinantibodies for three independent tumours. c, Immunoblot of LC3 and b-actinin 1/2KRas cells for two independent tumours. d, Autophagic flux of1/2KRas cells stably expressing GFP–LC3. Bafilomycin treatment rescuesGFP (2KRas1Baf) (n 5 3); representative flow cytometry of two tumours.
e, Lipid droplet quantification in 1/2KRas cells (n 5 4); representative flowcytometry of two tumours. f, Fusion between lipid droplets (red arrowheads)and autophagosomes (green arrowheads) in 2KRas cells (TEM; 325,000).g, Confocal microscopy for lipid droplets (Lipidtox; red) and lysosomes(Lysotracker; green) in 2KRas spheres. Hoechst, blue. h, Oxygen consumptionof 1/2Kras cells pre-treated with bafilomycin (Baf), etomoxir (Eto) orvehicle (Ctrl) (n 5 4). i, Effect of bafilomycin and etomoxir on spherogenicpotential of 1/2Kras cells (n 5 6). Data are mean 6 s.d.
RESEARCH LETTER
4 | N A T U R E | V O L 0 0 0 | 0 0 M O N T H 2 0 1 4
Macmillan Publishers Limited. All rights reserved©2014

role in the metabolism of SCs. The autophagic marker microtubule-associated protein light-chain 3 (LC3) was abundantly expressed in SCs(Fig. 4c), and lysosomes and autophagosomes at various stages of evo-lution were abundant (Extended Data Fig. 10a). To investigate the acti-vation of autophagic flux, we transduced KRas-expressing tumour sphereswith LC3–green fluorescent protein (GFP) fusion protein. Cells stablyexpressing LC3–GFP were maintained in the presence or absence ofdoxycycline and subsequently analysed by flow cytometry. As shownin Fig. 4d, SCs had a dramatically reduced GFP signal (80%) comparedwith KRas-expressing cells, indicating that GFP was quenched uponautolysosome formation, as also confirmed by the treatment with bafi-lomycin, a vacuolar H1-ATPase inhibitor (Fig. 4d).
Upon TEM analysis, we observed increased content of cytoplasmiclipid droplets in SCs (Extended Data Fig. 10b) that we quantified withneutral lipid-specific dyes (Fig. 4e). Importantly, and unique to SCs, weobserved unambiguous evidence of microlipophagy20—the fusion of lipiddroplets with autophagosomes (Fig. 4f)—which we confirmed by dem-onstrating strong co-localization of lipid droplets and lysosomes uponstaining in SCs (Fig. 4g). Consistent with observations that SCs catabo-lize more endogenous protein and fatty acid, tracing metabolic experi-ments illustrate that more carbon in central metabolism is unaccountedfor from labelled substrates in SCs versus KRas-expressing cells (ExtendedData Fig. 7e–h). To determine whether autophagy and microlipophagymay represent a strategy for SCs to maintain their energetic balance21,22,we explored their contribution in maintaining mitochondrial activityby measuring OCR in cells pre-treated with autophagic andb-oxidationinhibitors. Neither inhibitor affected OCR in KRas-expressing cells,whereas treatment with either bafilomycin or etomoxir both markedlyreduced OCR in SCs (85% and 35%, respectively) (Fig. 4h). Importantly,both inhibitors also induced metabolic stress specifically in SCs (ExtendedData Fig. 9j, k) and dramatically affected both their spherogenic poten-tial (decrease of .90% and 39%, respectively; P # 0.01) (Fig. 4i) and sur-vival (Extended Data Fig. 9l). We therefore conclude that autophagy andmicrolipophagy are as critical as ETC activity for the survival of SCs.
We isolated and characterized tumour cells surviving the genetic andpharmacological ablation of oncogenic pathways, demonstrating thatthey have features of TICs and a distinct metabolic profile. Unlike highlyglycolytic tumour cells, which are dependent on lactate production toregenerate NAD1 to support continued glycolysis for their anabolic metab-olism (Warburg effect), SCs are less glycolytic and more dependent onmitochondrial respiration. Their dependence on OXPHOS for energyproduction is consistent with recent reports showing that both normaland leukaemic stem cells rely on mitochondrial respiration19,23–25. Impor-tantly, the strong dependence of ETC activity of SCs on autophagic andcatabolic processes makes them more resistant to nutrient deprivationand environmental stressors. However, their inability to increase compen-satory fluxes (namely, glycolysis) following OXPHOS inhibition confersextreme sensitivity to inhibition of mitochondrial function, which dra-matically impacts their spherogenic and tumorigenic potential. Our find-ings hold important implications for tumour treatment, paving the wayfor targeting OXPHOS in association with oncogenic pathway inhibi-tors to eradicate SCs and prevent tumour relapse in pancreatic cancer.
Online Content Methods, along with any additional Extended Data display itemsandSourceData, are available in the online version of the paper; references uniqueto these sections appear only in the online paper.
Received 3 May 2013; accepted 19 June 2014.
Published online 10 August 2014.
1. Ying, H. et al. Oncogenic Kras maintains pancreatic tumors through regulation ofanabolic glucose metabolism. Cell 149, 656–670 (2012).
2. Karnoub, A. E.& Weinberg,R. A.Rasoncogenes: split personalities.NatureRev.Mol.Cell Biol. 9, 517–531 (2008).
3. Kantarjian, H. et al. Hematologic and cytogenetic responses to imatinibmesylate in chronic myelogenous leukemia. N. Engl. J. Med. 346, 645–652(2002).
4. Flaherty, K. T. et al. Inhibition of mutated, activated BRAF in metastatic melanoma.N. Engl. J. Med. 363, 809–819 (2010).
5. Quintas-Cardama, A., Kantarjian, H. & Cortes, J. Imatinib and beyond—exploringthe full potential of targeted therapy for CML. Nature Rev. Clin. Oncol. 6, 535–543(2009).
6. Jang, S. & Atkins, M. B. Which drug, and when, for patients with BRAF-mutantmelanoma? Lancet Oncol. 14, e60–e69 (2013).
7. Bardeesy, N. et al. Both p16Ink4a and the p19Arf-p53 pathway constrainprogression of pancreatic adenocarcinoma in the mouse. Proc. Natl Acad. Sci. USA103, 5947–5952 (2006).
8. Hermann, P. C. et al. Distinct populations of cancer stem cells determine tumorgrowth and metastatic activity in human pancreatic cancer. Cell Stem Cell 1,313–323 (2007).
9. Li, C. et al. Identification of pancreatic cancer stem cells. Cancer Res. 67,1030–1037 (2007).
10. Kim, M. P. et al. ALDH activity selectively defines an enhanced tumor-initiating cellpopulation relative to CD133 expression in human pancreatic adenocarcinoma.PLoS ONE 6, e20636 (2011).
11. Fernandez-Marcos, P. J. & Auwerx, J. Regulation of PGC-1a, a nodal regulator ofmitochondrial biogenesis. Am. J. Clin. Nutr. 93, 884S–890S (2011).
12. Yuan, M., Breitkopf, S. B., Yang, X. & Asara, J. M. A positive/negative ion-switching,targeted mass spectrometry-based metabolomics platform for bodily fluids, cells,and fresh and fixed tissue. Nature Protocols 7, 872–881 (2012).
13. Gaglio, D. et al. Oncogenic K-Ras decouples glucose and glutamine metabolism tosupport cancer cell growth. Mol. Syst. Biol. 7, 523 (2011).
14. Son, J. et al. Glutamine supports pancreatic cancer growth through a KRAS-regulated metabolic pathway. Nature 496, 101–105 (2013).
15. Vizan, P. et al. K-ras codon-specific mutations produce distinctive metabolicphenotypes in NIH3T3 mice fibroblasts. Cancer Res. 65, 5512–5515 (2005).
16. Liu, Y. & Schubert, D. R. The specificity of neuroprotection by antioxidants.J. Biomed. Sci. 16, 98 (2009).
17. Kim,M.P.et al. Generationof orthotopicandheterotopic human pancreatic cancerxenografts in immunodeficient mice. Nature Protocols 4, 1670–1680 (2009).
18. Shi, Y. et al. Mammalian transcription factor A is a core component of themitochondrial transcription machinery. Proc. Natl Acad. Sci. USA 109,16510–16515 (2012).
19. Skrtic, M. et al. Inhibition of mitochondrial translation as a therapeutic strategy forhuman acute myeloid leukemia. Cancer Cell 20, 674–688 (2011).
20. Singh,R.etal.Autophagyregulates lipidmetabolism.Nature458,1131–1135(2009).21. Guo, J. Y. et al. Activated Ras requires autophagy to maintain oxidative metabolism
and tumorigenesis. Genes Dev. 25, 460–470 (2011).22. Yang, S. et al. Pancreatic cancers require autophagy for tumor growth. Genes Dev.
25, 717–729 (2011).23. Nakada, D., Saunders, T. L. & Morrison, S. J. Lkb1 regulates cell cycle and energy
metabolism in haematopoietic stem cells. Nature 468, 653–658 (2010).24. Lagadinou, E. D. et al. BCL-2 inhibition targets oxidative phosphorylation and
selectively eradicates quiescent human leukemia stem cells. Cell Stem Cell 12,329–341 (2013).
25. Samudio, I. et al. Pharmacologic inhibition of fatty acid oxidation sensitizes humanleukemia cells to apoptosis induction. J. Clin. Invest. 120, 142–156 (2010).
Acknowledgements We thank A. Divakaruni, J. Dunn, C. Smith, K. McGirr and D. Ferrickfor their support with the Seahorse Bioscience XF96 Analyser; T. Tieu for vector cloningand J. Kovacs for support with the YSI analyser; J. D. Lechleiter for the protocol tomeasure mitochondrial potential in vivo; H. Sandoval, C. Tacchetti, M. E. Di Francesco,J. Marszalek and P. Jones for discussions and suggestions; K. Dunner Jr and the HighResolution Electron Microscopy Facility at the MD Anderson Cancer Center (MDACC)for TEM (Cancer Center Core Grant CA16672); W. N. Hittelman and the Center forTargeted Therapy for confocal microscopy; the Dana-Farber Cancer InstituteMicroarray Core Facility for Affymetrix expression profiling and the MDACCSequencing and Microarray Facility (SMF) funded by National Cancer Institute (NCI)grant CA016672 (SMF) for exome sequencing; the MDACC Flow Cytometry andCellular Imaging Core Facility supported by grant NCI#P30CA16672 for flowcytometers and FACS; D. Jayanta for providing GFP–LC3 constructs; B. Perrazzona,U. Varadarajan and R. Dewan for lab management; and S. Jiang for assistance inmaintenance of mouse colonies. A.V. is thankful to A. Fantino, S. Rapi, V. Giuliani andP. Viale for their continuous support. This study was supported by grants from theHirshberg Foundation for Pancreatic Cancer Research to A.V., Harvard Stem CellInstitute to R.A.D. and A.V., Sheikh Ahmed Center for Pancreatic Cancer Research toG.F.D., T.P.H. and A.V., American Italian Cancer Foundation to G.F.D., National Institutesof Health (NIH) P01CA117969 to R.A.D., NIH/NCI P01CA120964 to J.M.A., The ViraghFamily Foundation to J.B.F.; C.A.L. is a Pancreatic Cancer Action Network-AACRPathway to Leadership Fellow.
Author Contributions A.V., P.G., R.A.D. and G.F.D. designed the studies, interpreted thedata and wrote the manuscript; A.V., P.G., H.Y., N.S., M.M., A.C., T.G. and V.G. performedthe experiments; C.A.L. was responsible for metabolomics and carbon-13 tracingexperiments; S.S. was responsible for CNV and bioinformatics analysis; M.K.-A, F.M.,S.C., L.N., G.G., A.K.D., A.K., W.Y., E.B., Y.K., T.P.H., A.C.K., H.W. and J.B.F. contributedessential reagents and resources; M.Y. and J.M.A. helped with the metabolomicsanalysis; F.M., Y.A.W. and L.C.C. assisted with data interpretation; A.K.D. edited themanuscript.
Author Information Complete transcriptomic profiles are available in the GeneExpression Omnibus under accession number GSE58307. Reprints and permissionsinformation is available at www.nature.com/reprints. The authors declare competingfinancial interests: details are available in the online version of the paper. Readers arewelcome to commenton the online version of the paper. Correspondence and requestsfor materials should be addressed to A.V. ([email protected]) orG.F.D. ([email protected]).
LETTER RESEARCH
0 0 M O N T H 2 0 1 4 | V O L 0 0 0 | N A T U R E | 5
Macmillan Publishers Limited. All rights reserved©2014

METHODSMice. The inducible tetO-LSL-KRasG12D, ROSA26-LSL-rtTA, p53LoxP/WT, p48-Cremouse model was generated as described1. After weaning, mice were fed doxycy-cline (2 g l21) in drinking water supplemented with sucrose (20 g l21) and monitoredfor tumour development. Constitutive LSL-KRasG12D, p53LoxP/LoxP, Pdx1-Cre andLSL-KRasG12D, Ink4a/ArfLoxP/LoxP, Pdx1-Cre mice were generated as previouslyreported7. All animals were kept in FVB/C57Bl6 mix or pure FVB backgrounds ina pathogen-free facility at the University of Texas MD Anderson Cancer Center(MDACC). All manipulations were performed under Institutional Animal Care andUse Committee (IACUC)-approved protocols.Antibodies, plasmids and chemical reagents. Primary antibodies used for flowcytometry, immunofluorescence, immunohistochemistry and immunoblotting were:CD44 (eBioscience, IM7), CD133 (eBioscience, 13A4; Abcam, 165118), phospho-p44/42 (Cell Signaling, D10), VDAC1 (Abcam, ab15895), PGC1a (Abcam, ab54481),BrdU (Abcam, ab82421), Ras (05-516, Millipore), LC3A/B (Cell Signaling, 4108),phospho-AMPKa (Thr 172) (Cell Signaling, 40H9), AMPKa (Cell Signaling, D63G4),TFAM (Cell Signaling, D5C8), TUFM (Abcam, ab175199),b-actin (sc-1615, SantaCruz). Plasmids: pBABEpuro GFP-LC3 (ref. 26) (Addgene plasmid 22405), pLKOTFAM shRNAs (TRCN0000016093, 59-CCGGCGTGAGTATATTGATCCAGAACTCGAGTTCTGGATCAATATACTCACGTTTTT-39; TRCN0000016095, 59-CCGGGTAAGTTCTTACCTTCGATTTCTCGAGAAATCGAAGGTAAGAACTTACTTTTT-39) and pLKO TUFM shRNAs (TRCN0000280863, 59-CCGGGCTCACCGAGTTTGGCTATAACTCGAGTTATAGCCAAACTCGGTGAGCTTTTTG-39; TRCN0000280864, 59-CCGGGAGGACCTGAAGTTCAACCTACTCGAGTAGGTTGAACTTCAGGTCCTCTTTTTG-39) (Sigma), Tet-inducible pLKOwas provided by the Institute for Applied Cancer Science at MDACC. Chemicalreagents: oligomycin A (Sigma), buthioninesulphoximine, (Sigma), 4-hydroxynonenal(Cayman Chemical),a-tocopherol (Sigma), N-acetylcysteine (Sigma), tetrakis (Cal-biochem), bafilomycin (Sigma), etomoxir (Sigma), dicyclohexylcarbodiimide (Sigma),venturicidin A (Sigma), rotenone (Seahorse), antimycin (Seahorse), doxycycline(Research Product International), AZD8330-AZD6244-BEZ235 (Selleckchem).Tumour culture. Patient-derived xenograft tumours were generated by transplant-ing subcutaneously in mice small tumour fragments isolated directly from surgicalspecimens according to Kim et al.17. Patient-derived samples were obtained fromconsented patients under an Institutional Review Board (IRB)-approved protocolLAB07-0854 chaired by J.B.F. Cells derived from early passage patient-derived xeno-graft tumours (F1–F2) and primary mouse tumours were kept in culture as spheresin semi-solid media for ,15–16 passages. Briefly, after explant, tumours were digestedat 37 uC for 1 h (Collagenase IV-Dispase 4 mg ml21; Invitrogen). Single-cell suspen-sions were plated in stem cell medium (SCM) MEBM (Lonza) supplemented with2 mM glutamine (Invitrogen), B27 (Invitrogen), 20 ng ml21 hEGF (PeproTech),20 ng ml21 hFGF (PeproTech), 5mg ml21 h-Insulin (Roche), 0.5mM hydrocorti-sone (Sigma), 100mMb-mercaptoethanol (Sigma), 4mg ml21 heparin (Sigma). Meth-ocult M3134 (StemCell Technologies) was added to SCM (final concentration 0.8%)to keep tumour cells growing as clonal spheres versus aggregates. Fully formed tumourspheres were collected and digested with 0.05% trypsin (Gibco) to single cells andre-plated in culture. KRas inducible system: for maintenance, tumour cells werekept in doxycycline (2 mg ml21). For experiments, cells were plated in the presenceor absence of doxycycline to select SCs. After 8 days in culture, tumour spheres orSCs were collected, washed and processed for experiments.In vitro treatments. For drug treatments, KRas-expressing spheres or survivingtumour cells after 8 days of doxycycline withdrawal were collected, washed, digestedwith trypsin and repeatedly counted (Countless, Invitrogen). Similar procedureswere used for spheres derived from human tumours and from the KRas constitu-tive mouse model except that surviving cells were selected by treating tumour sphereswith AZD8330 (10 nM) and BEZ235 (100 nM) for 1 week. Equal numbers of liveKRas-expressing cells and surviving tumour cells (AZD8330 plus BEZ235 treatedcells for the constitutive KRas and human tumours) were treated with oligomycin(200 nM for 24 h), venturicidin (500 nM for 24 h), DCCD (1mM for 24 h), bafilo-mycin (50 nM for 48 h) or etomoxir (100mM for 48 h). For OCR measurement andwestern-blot experiments, cells were treated with bafilomycin and etomoxir for 24and 6 h, respectively. To test the effects of ROS on spherogenic potential, cells weretreated with buthionine-sulphoximine (100mM) to deplete GSH or pre-treated witha-tocopherol (100mM), N-acetylcysteine (1 mM) or Mn-tetrakis (50mM) beforeoligomycin treatment. After drug wash out, treated cells were re-plated for 7 days(on doxycycline when using the KRas-inducible system). The number of tumourspheres (spherogenic potential) was quantified using ImageXpress Velos Laser Scan-ning Cytometer (Molecular Devices) upon calcein staining (Molecular Probes).Tumour transplantation, limiting dilution and in vivo treatments. Tumourcells isolated from in vivo tumours or from in vitro spheres were digested to singlecells (see earlier). Usually, 104–105 tumour cells were used for routine transplanta-tion, for transplantation in limiting dilution 103, 102 or 10 tumour cells were used.Tumour cells were suspended in SCM (see earlier) and Matrigel (BD Biosciences,
356231) (1:1 dilution) and injected subcutaneously into the flank of 6- to 8-week-old female immunodeficient mice (NCR-NU, Taconic). If cells were derived fromKRas-inducible tumours, mice were injected with doxycycline (3 mg kg21, i.p.) atthe time of transplantation and then fed with doxycycline in drinking water. Tumour-initiating cell (TIC) frequencies were determined by Poisson statistical analysis usingL-Calc software (StemCell Technologies). For BrdU incorporation experiments,mice were injected i.p. with 1 mg of BrdU 3 times (every 8 h) after 24 h or 48 h ofKRas reactivation before being killed. For in vivo oligomycin treatment, mice weretransplanted with tumour cells and fed with doxycycline in drinking water (1Dox)until tumours reached 1 cm in diameter. At that time, doxycycline was withdrawn(2Dox) and, after 2 weeks, when tumours were almost completely regressed, micewere injected with oligomycin (0.5 mg kg21, i.p.; Sigma) or vehicle, 5 days a week,for 2 weeks. After treatment, doxycycline was added back to drinking water and micewere monitored for tumour relapse. Genetically identical and age matched recipi-ent mice were used for transplantation experiments and were randomly allocatedfor treatment with oligomycin upon tumour regression. Experimenters were notblinded to the experimental groups in evaluating treatment outcome.
For pharmacological inhibition of KRas pathways using small molecule inhibi-tors, mice bearing tumours derived from the KRas constitutive system were treatedwith a combination of AZD6244 and BEZ235 (100 mg kg21 and 40 mg kg21 respec-tively, per oral gavage daily) for at least 7 days. Tumour volume was calculated usingthe formula: V 5 l2 3 L/2 (where l is length and L is width). All manipulations wereperformed under IACUC-approved protocols.Isolation of tumour cells. To isolate pure populations of tumour cells from trans-planted tumours, we took advantage of dim-high ubiquitous expression of CD44in pancreatic tumour cells (Extended Data Fig. 2f). Single-cell suspensions of digestedtumours were stained with anti-CD44 biotinylated antibody (eBioscience, IM7).Positive cells were then purified using Easy Sep Biotin Selection Kit (StemCell Tech-nologies) according to manufacturer’s instructions. Counterstaining of isolatedcells with anti-CD45 and CD31 antibodies and fluorochrome-conjugated strepta-vidin were used to check the purity by flowcytometry.shRNA expression and gene downregulation. shRNAs against TFAM (TRCN0000016093; TRCN0000016095) and TUFM (TRCN0000280863; TRCN0000280864)(Sigma) were cloned in a Tet-inducible pLKO vector provided by the Institute forApplied Cancer Science at MDACC (for sequences see also earlier). Human tumourspheres were transduced with viral particles and selected with puromycin. Uponselection, tumour spheres were treated or not with a combination of Mek/Pi3Kinhibitors (10 nM AZD83330 plus 100 nM BEZ235) for 1 week. On the second dayafter beginning the combination drug treatment, doxycycline was added to the cul-ture to induce shRNA expression and was maintained for 5 days. Then tumour cellswere collected, washed, and replated to evaluate their spherogenic potential. Down-regulation of the target was evaluated by western blot at 72 h after shRNA induction.Flow cytometry and cell sorting. Single cells isolated from tumours or sphereswere stained with primary antibodies after blocking with 10% BSA and 5% rat serum.Aldefluor (StemCell Technologies) and annexin V (eBioscience) staining were per-formed according to the manufacturer’s instructions. To study the cell cycle of tumourspheres, BrdU Flow Kit (BD Pharmingen) was used according to datasheet speci-fications. Mitochondrial potential in vitro was measured using MitoProbe DilC1(5)Assay Kit for Flow Cytometry (Molecular Probes) according to specifications, andCCCP treatment was used for controls. In vivo mitochondrial potential was evalu-ated according to Zheng et al.27. Briefly, mice bearing KRas-expressing or regressedtumours (inducible model or pharmacologically treated with AZD6244 plus BEZ235)were injected with 25 nmol kg21 of TMRE (Molecular Probes) as a tail vein bolus.After 1 h, mice were killed and tumours explanted, digested (as described earlier,adding 10% FBS to the digestion mix) and stained for CD44. Samples were kept onice and immediately acquired gating CD44-positive DAPI-negative cells. The sameapproach, timeline and staining were used to evaluate glucose uptake in vivo, inject-ing 25mmol kg21 2NBDG (Molecular Probes) as a tail vein bolus according to Ytohet al.28. For in vitro experiments, 2NBDG was used at a concentration of 10mM incomplete stem cell medium containing 2 mM glucose28. Cells were incubated for6 h then washed and analysed by flow cytometry. MitoTracker Green and Deep Red(Molecular Probes) were used to measure mitochondrial mass. ROS were evaluatedusing MitoSOX and CellROX (Molecular Probes) and induced by 4-hydroxynonenaltreatment (10mM) for positive controls. LipidTox deep red (Molecular Probes) wasused for quantifying lipid droplet content. All staining procedures were performedaccording to the manufacturer’s protocols. DAPI (Invitrogen) was used to stain DNAcontent or to exclude dead cells depending on the experiment. For measuring auto-phagic flux, KRas-expressing cells were transduced with pBABEPuro GFP-LC3 (ref. 26)and, upon selection, doxycycline was withdrawn for 8 days. Mean of fluorescenceof surviving and matched KRas-expressing cells was quantified and surviving tumourcells treated for 24 h with bafilomycin (50 nM) were used as a control. Gating strat-egies to exclude doublets and dead cells (DAPI) were always employed. After staining,
RESEARCH LETTER
Macmillan Publishers Limited. All rights reserved©2014

samples were acquired using a BD FACSCantoII flow cytometer or sorted usingBD Influx cell sorter. Data were analysed by BD FACSDiva or FlowJo (Tree Star).Immunohistochemistry and immunofluorescence. Tumour samples were fixedin 4% formaldehyde for 2 to 4 h on ice, moved in 70% ethanol for 12 h, and thenembedded in paraffin (Leica ASP300S). After cutting (Leica RM2235), baking anddeparaffinization, slides were treated with Citra-Plus Solution (BioGenex) accord-ing to specifications. For immunohistochemistry (IHC) staining, endogenous per-oxidases were inactivated by 3% hydrogen peroxide. Non-specific signals were blockedusing 3% BSA, 10% goat serum and 0.1% Triton. Tumour samples were stainedwith primary antibodies. For BrdU detection, samples were digested on slides for1 h at 37 uC with DNase I (300mg ml21) before staining. For IHC, ImmPress andImmPress-AP (Vector Lab) were used as secondary antibodies and Nova RED, VectorBLUE and DAB were used for detection (Vector Lab). Images were captured with aNikon DS-Fi1 digital camera using a wide-field Nikon EclipseCi microscope. Forimmunofluorescence, secondary antibodies conjugated with Alexa488 and 555 (Mole-cular Probes) were used. Images were captured with a Hamamatsu C11440 digitalcamera, using a wide-field Nikon EclipseNi microscope. LipidTox, Lysotracker,MitoTracker, CellRox and Hoechst 33342 (Molecular Probes) were used on livespheres and cells at the concentrations suggested by manufacturer’s protocols andimages were acquired using a Nikon high-speed multiphoton confocal microscopeA1 R MP.Immunoblotting. Protein lysates were resolved on 5–15% gradient polyacrylamideSDS gels and transferred onto PVDF membranes according to standard proce-dures. Membranes were incubated with indicated primary antibodies, washed, andprobed with HRP-conjugated secondary antibodies. The detection of bands wascarried out upon chemiluminescence reaction followed by film exposure. For theRas pull-down assay, the amount of active Ras was evaluated by detecting the frac-tion of Ras protein that co-precipitated with RAF kinase. Cell lysates from KRas-expressing cells and cells surviving KRas ablation were co-incubated with RAF-linkedagarose beads for 2 h. After incubation, beads were collected, washed and boiledfor 5 min in the presence of laemmli loading buffer supplemented with 10% 2-mercapthoethanol and ultimately loaded onto SDS–PAGE gels. The detection ofthe active fraction of RAS was carried out using standard western blot procedureswith anti-Ras antibody.Transmission electron microscopy. TEM was performed at the MDACC HighResolution Electron Microscopy Facility. Samples were fixed with a solution contain-ing 3% glutaraldehyde plus 2% paraformaldehyde in 0.1 M cacodylate buffer, pH 7.3,for 1 h. After fixation, the samples were washed and treated with 0.1% Millipore-filtered cacodylate buffered tannic acid, post-fixed with 1% buffered osmium tetrox-ide for 30 min, and stained en bloc with 1% Millipore-filtered uranyl acetate. Thesamples were dehydrated in increasing concentrations of ethanol, infiltrated andembedded in LX-112 medium. The samples were polymerized in a 60 uC oven for2 days. Ultrathin sections were cut in a Leica Ultracut microtome, stained with uranylacetate and lead citrate in a Leica EM Stainer and examined in a JEM 1010 trans-mission electron microscope (JEOL) at an accelerating voltage of 80 kV. Digitalimages were obtained using an AMT Imaging System (Advanced Microscopy Tech-niques Corp).DNA, RNA, cDNA and qPCR. DNA and RNA were extracted using DNeasy Bloodand Tissue Kit (Qiagen) and RNeasy Mini Kit (Qiagen) according to technicalspecifications. A mix of random hexamers and oligo(dT) were applied for cDNAsynthesis using SuperScript III First-Strand-Synthesis System (Invitrogen). For qPCR,10 ng of DNA or cDNA was amplified with EXPRESS SYBR GreenER qPCR Super-Mix (Invitrogen) using a Startagene Mx3005p thermal-cycler. Primers used for mito-chondrial and lipid metabolic gene amplification are shown in Extended DataFig. 10c. b-Actin (F-GACGGCCAGGTCATCACTAATTG, R-AGGAAGGCTGGAAAAGAGCC), 28S (F-TCATCAGACCCCAGAAAAGG, R-GATTCGGCAGGTGAGTTGTT) and b-microglobulin (F-ATTCACCCCACTGAGACTG, R-TGCTATTTCTTTCTGCGTGC) were used as house-keeping genes for normali-zation. Expression of genes involved in the ETC, mitochondria and autophagy wasevaluated using Qiagen commercial arrays: RT2 Profiler PCR Array Mouse Mito-chondrial Energy Metabolism, Mouse Mitochondria and Mouse Autophagy.Expression profiling and data analysis. Gene expression profiling was performedat the Dana-Farber Cancer Institute Microarray Core Facility. RNA isolated fromKRas-expressing and surviving tumour cells was hybridized on a Gene Chip MouseGenome 430 2.0 Array (Affymetrix). Raw data (CEL files) were pre-processed usinga robust multi-array analysis (RMA) and analysed with GSEA29 using SignallingPathways c2.cp.v3.0 and TFT c3.tft.v3.0 symbols gene sets.Exome sequencing. Two independent tumour spheres expressing KRas were col-lected, digested to single cells, and replated on two plates in the presence of doxy-cycline (ON Dox, 1KRas) for 1 week. Spheres from one plate were collected andsnap frozen for DNA extraction (Reference), while spheres from the other plate wereplated OFF doxyclycline (2KRas) for 1 week before re-addition of doxycycline tore-express KRas. After 1 week, reformed spheres were collected and snap frozen for
DNA extraction (Re-ON). Genomic DNA was extracted by phenol-chloroform andfurther purified from contamination on columns (Qiagen). The exonic DNA regionswere captured using Nimblegen SeqCap EZ Mouse Exome kit. The DNA sequencesrecovered were processed through a standard SNP calling pipeline. Reads werealigned using BWA following removal of duplicates, realignment and recalibration(using Broad’s Genome Analysis Toolkit or GATK). Further SNPs were called usingGATK’s Unified Genotyper and annotated using Annovar. For the analysis we con-sidered SNVs which were (1) called in both samples, and (2) had a minimum cov-erage of 200 in both, providing enough confidence to compare allelic frequenciesbetween the sample pairs. Roughly 12% (40,383/335,076) and 13% (44,182/339,398)of the common SNVs for tumour #2 and tumour #1, respectively, satisfied thecoverage threshold of 200.Metabolomics. For metabolomic analyses, surviving and KRas-expressing spheres(grown as described earlier), were collected after 8 days of culture when both KRas-expressing spheres and surviving tumour cells were confirmed to have exited the cellcycle (to avoid the confounding effects of proliferation on metabolism) (ExtendedData Fig. 1g). The day before collection, medium was changed and spheres re-platedin fresh medium. After 24 h, cells were collected by centrifugation, washed threetimes and samples were then immediately lysed in methanol:water (80:20) at dry-ice temperature. The quantity of the metabolite fraction analysed was adjusted tothe corresponding protein concentration calculated upon processing a parallel sam-ple. Metabolite fractions were processed and analysed by targeted LC-MS/MS viaselected reaction monitoring (SRM), as described1,12,14. Processed data were ana-lysed in Cluster 3.0 and TreeViewer. The analysis was performed on four indepen-dent tumours in biological triplicate.Carbon-13 metabolic tracing. Cells were prepared in a manner identical to thatfor routine metabolomic profiling (see earlier), except that media formulations wereadjusted to account for isotopically labelled substrates. Specifically, surviving andKRas-expressing cells were plated in RPMI medium (reconstituted with growthfactors) devoid of glucose, glutamine, pyruvate, palmitate and supplemented withone of the four carbon-13-labelled substrates where the remaining substrates wereunlabelled (glucose 10 mM, glutamine 2 mM, pyruvate 1 mM and palmitate 75mM).After 24 h of incubation with labelled substrates, cells were collected and replatedagain in fresh media supplemented with carbon-13-labelled substrates for another12 h to minimize the effects of cellular uptake on the concentration of differentsubstrates. After 36 total hours of labelling, samples were collected by centrifuga-tion and immediately lysed in methanol:water (80:20) at dry-ice temperature. Asfor metabolomics, the quantity of the metabolite fraction analysed was adjustedto the corresponding protein concentration from a sample processed in parallel.The analysis was performed for each of the four substrates on three independenttumours in biological triplicate. Data were collected and processed as above, asdescribed1,12,14.Oxygen consumption and glycolytic capacity. Tumour spheres and surviving cellswere digested to single cells and spun into XF96 Cell Culture Microplates (SeahorseBioscience) previously treated with Cell-Tak (BD Biosciences) immediately beforethe experiment. To measure OCR and the response to OXPHOS inhibition, weplated cells in complete stem cell medium (see earlier) prepared with MEBM lackingNaHCO3 (Lonza) and supplemented with 5 mM pyruvate (Sigma). Oligomycin,FCCP, antimycin and rotenone (XF Cell Mito Stress Test Kit, Seahorse Bioscience)were sequentially injected at a final concentration of 1mM. To measure ECAR, weplated tumour cells in base assay medium (D5030, Sigma) adjusted to pH 7.4. Glu-cose (10 mM final concentration, Sigma), oligomycin (1mM final concentration)and 2-deoxy-glucose (100 mM final concentration) were sequentially injected (XFGlycolysis Stress Test Kit, Seahorse Bioscience). Specifically for the experiment inExtended Data Fig. 5c, ECAR was measured in complete stem cell media to eval-uate the glycolytic reserve of tumour cells in a nutrient-rich environment. Oligo-mycin and 2DG were sequentially injected at a final concentration of 1mM and100 mM, respectively. Experiments were run using a XF96 analyser and raw datawere normalized to metabolically active cells, evaluated as Hoechst 33342 positive/propidium iodide negative, by an Operetta High-Content Imaging System (Perkin-Elmer) immediately after each experiment.Glucose uptake and lactate production. To measure glucose uptake, we used twodifferent approaches: by flow cytometry using the fluorescent glucose analogue2NBDG (see earlier) and by YSI 2950 Biochemistry Analyzer (YSI Life Sciences).For YSI, the same number of surviving cells and KRas-expressing cells was platedin triplicate in a 96-well plate in 200ml of complete stem cell medium. After 24 h,the medium was collected and glucose and lactate concentrations were evaluatedby YSI analyser, using unconditioned fresh medium as a reference. Lactate produc-tion in response to oligomycin treatment (200 nM) was independently measuredby Lactate Kit (Trinity Biotech) to directly evaluate the concentration of lactic acidin stem cell medium 6 to 12 h after tumour cell plating.ATP and glutathione assays. ATP production of tumour cells in response to 6 to12 h of oligomycin treatment (200 nM) was measured using Cell Titer Glo (Promega)
LETTER RESEARCH
Macmillan Publishers Limited. All rights reserved©2014

following the manufacturer’s instructions. For glutathione, cells were lysed by sonica-tion in 13 GSH MES buffer (Cayman Chemical) and debris was pelleted by high-speedcentrifugation. Samples were deproteinized by adding vol:vol of meta-phosphoricacid (1 mg ml21) followed by centrifugation and pH equilibration by the additionof triethanolamine. Glutathione content was evaluated through an enzymatic recy-cling method by using a commercially available kit (Cayman Chemical). PHERA-Star plus microplate reader (BMG Labtech) was used to measure luminescence andabsorbance.Statistical analysis. In vitro and in vivo data are presented as the mean 6 s.d. Statis-tical analyses were performed using a two-tailed Student’s t-test after the evaluationof variance. Results from survival experiments were analysed with a Gehan–Breslow–Wilcoxon test and expressed as Kaplan–Meier survival curves.
26. Fung, C., Lock, R., Gao, S., Salas, E. & Debnath, J. Induction of autophagy duringextracellular matrix detachment promotes cell survival. Mol. Biol. Cell 19,797–806 (2008).
27. Zheng, W., Talley Watts, L., Holstein, D. M., Wewer, J. & Lechleiter, J. D.P2Y1R-initiated, IP3R-dependent stimulation of astrocytemitochondrial metabolism reduces and partially reverses ischemicneuronal damage in mouse. J. Cereb. Blood Flow Metab. 33, 600–611(2013).
28. Itoh, Y., Abe, T., Takaoka, R. & Tanahashi, N. Fluorometric determination ofglucose utilization in neurons in vitro and in vivo. J. Cereb. Blood Flow Metab. 24,993–1003 (2004).
29. Subramanian, A. et al. Gene set enrichment analysis: a knowledge-basedapproach for interpreting genome-wide expression profiles. Proc. Natl Acad. Sci.USA 102, 15545–15550 (2005).
RESEARCH LETTER
Macmillan Publishers Limited. All rights reserved©2014

LETTER RESEARCH
Macmillan Publishers Limited. All rights reserved©2014

Extended Data Figure 1 | Oncogene ablation leads to tumour regressionin vitro and in vivo. a, In vivo experimental scheme. Tumour cells isolatedfrom primary tumours or tumour spheres were injected in nude mice fed withdoxycycline in drinking water (1Dox). When mice developed tumours,doxycycline was withdrawn (2Dox) and tumours underwent a completemacroscopic regression after 2–3 weeks (arrows indicate regressed tumours). Inresidual lesions few tumour cells remain quiescent for months and they canquickly reform tumours upon KRas reactivation (1Dox). b, Tumoursexpressing KRas (1KRas) and tumour remnants after regression (2KRas) arepositive for ductal epithelial marker CK19 (340). c, Tumours expressing KRas(1KRas) and epithelial remnants after tumour regression (2KRas) werestained for phosphorylated-p42/44 (pErk). No signal is detected in survivingcells (320). d, In vitro experimental scheme. After digestion to a single-cellsuspension, tumour cells isolated from primary tumours were plated in stemcell medium in presence of doxycycline (1Dox, 1KRas). Spherogenic cellsform tumour spheres (1KRas) that can be maintained by serial replating inpresence of doxycycline. Upon doxycycline withdrawal (2Dox) tumourspheres undergo involution and only a minority of cells survive the ablation ofKRas (SCs, 2KRas). SCs readily reform tumour spheres upon re-activation ofKRas (1Dox). e, The amount of active Ras in KRas-expressing cells (1KRas)and SCs (2KRas) was evaluated in three independent tumour spheres bydetecting the fraction of Ras protein that co-precipitates with Raf kinase. Total
lysates were probed with anti-phospho-p42/44 (pErk), total p42/44 (Erk)antibodies. f, Annexin V staining in tumour spheres after 3 days 1/2KRas(n 5 3). g, Sphere formation is a regulated process and tumour cells enterand exit cell cycle. BrdU incorporation (pulse of 3 h) was evaluated at differenttime points during sphere formation and regression. KRas-expressing fullyformed spheres (day (D)0 and 8) are quiescent. Upon sphere dissociationand replating (D0), spherogenic cells enter cell cycle (D1) and tumour cellscontinue to grow until day 3–4, when spheres reach their maximal S phase.Then tumour cells gradually exit the cell cycle and become quiescent (D8).After doxycycline withdrawal (2KRas), tumour spheres undergo involutionand surviving cells remain quiescent until KRas is re-expressed (2KRas 24 h1KRas) and spheres are reformed. Ruling out the effect of the cell cycle,transcriptomic and metabolomic characterizations were done, matchingquiescent surviving tumour cells to quiescent fully formed KRas-expressingspheres at D8 (n 5 3). h, Haematoxylin and eosin staining andimmunohistochemistry of regressed tumours after three 8 h pulses of BrdUshow that epithelial remnants in regressed tumours after KRas ablation(2KRas) are completely quiescent (left panels). Forty-eight hours after KRasreactivation (doxycycline i.p. injection) tumour cells re-enter massively the cellcycle (right panels). Red arrows indicate mitotic cells (320). i, Representativeannexin V staining with respect to CD133 and CD44 after 3 days of KRasablation, two independent tumours are represented. Data are mean 6 s.d.
RESEARCH LETTER
Macmillan Publishers Limited. All rights reserved©2014

LETTER RESEARCH
Macmillan Publishers Limited. All rights reserved©2014

Extended Data Figure 2 | Transplantation in limiting dilution andcharacterization of epithelial remnants. a–d, Transplantation in limitingdilution. Experiments, number of transplanted mice and percentage ofdeveloped tumour are shown. a, Limiting dilution experiments using tumourspheres (1KRas) and surviving cells (2KRas) (genetic model ex vitro).b, Limiting dilution experiments using cells isolated from KRas-expressing(1KRas) and regressed tumours (2KRas) (genetic model ex vivo). c, Toppanels, immunoblots of tumour spheres treated with different concentrationsof Mek1 (AZD8330) and dual PI3K/mTOR (BEZ235) inhibitors probed withanti-phospho-p42/44 (pErk), phospho-Akt (pAkt), pan-Ras (Ras) and b-actin(Act) antibodies. Bottom panels, effects of AZD8330 (AZD 0.01 mM) andBEZ235 (BEZ 0.1mM) treatment for 1 week on tumour sphere formation; somecells, as single cells or in small clusters, are able to survive the treatment (35).d, Limiting dilution experiments using cells surviving pharmacological
downregulation of oncogenic pathways (AZD1BEZ, combination ofAZD8330 and BEZ235) and control cells (CTRL). e, The plot shows thecumulative distribution of coverage at all the SNVs called by Unified Genotyper(across samples). f, CD44 is expressed during tumorigenesis in mice: nopositive cells are detected in normal pancreas (left panel), KRas-expressingtumours express high levels of CD44 (middle panel), epithelial remnants inregressed tumours maintain their positivity for CD44 (right panel) (310).g, Validation of CD133 (ab16518) in immunohistochemistry: this antibodydoes not recognize cells and ductal structures in normal pancreas (left panel), asmall population of cells is stained by ab16518 in KRas-expressing tumours(middle panel), epithelial remnants in regressed tumours are strongly positivefor CD133 (right panel) (310). At higher magnification (red boxes), it ispossible to appreciate the classical polarized pattern of CD133.
RESEARCH LETTER
Macmillan Publishers Limited. All rights reserved©2014

Extended Data Figure 3 | qPCR validation of pathways enriched insurviving cells. a–e, mRNA fold change in surviving cells normalized toKRas-expressing cells. a, Genes involved in ETC (n 5 5). b, Genes involved inthe biogenesis and function of mitochondria (Mitochondria) (n 5 5).
c, d, Genes encoding proteins of the autophagic molecular machinery and itskey regulators (n 5 5) (c) and b-oxidation (n 5 5) (d). e, mRNA fold changein cells surviving AZD8330 plus BEZ235 treatment (AZD1BEZ) versuscontrols (n 5 3). Data are mean 6 s.d.
LETTER RESEARCH
Macmillan Publishers Limited. All rights reserved©2014

RESEARCH LETTER
Macmillan Publishers Limited. All rights reserved©2014

Extended Data Figure 4 | Surviving cells have more active mitochondria.a, mRNA fold change of Ppargc1 genes in 2KRas versus 1KRas cells (n 5 5).b, Quantification of MitoTracker Green staining in 1KRas and 2KRas cells(n 5 3). c, Mitochondrial membrane potential (Dym) of 1KRas and 2KRascells (n 5 4); representative flow-cytometry analysis of two tumours.d, Immunoblot of two independent tumour spheres derived from differentgenetic backgrounds (Ink4a/Arf2/2 and p532/2) treated or not with AZD8330and BEZ235 (AZD1BEZ) for 7 days and probed with anti-VDAC1 (VDAC1)and b-actin (Actin) antibodies. e, Cells surviving AZD1BEZ treatment havehigher mitochondrial transmembrane potential (Dym) than untreated cells(CTRL) (n 5 3); representative flow-cytometry analysis is reported. f, Micebearing tumours have been treated (AZD1BEZ) or not (CTRL) with acombination of AZD6244 and BEZ235 for 1 week. Upon tail vein injection of abolus of TMRE, tumours were explanted and analysed by flow cytometry for
their mitochondrial potential (Dym) upon gating on CD441 DAPI2 cells(n 5 3). A representatie flow-cytometry analysis of two different tumours isreported, AB1CCCP samples represent reacquisition of AZD1BEZ samplesafter incubation with CCCP for 5 min. g, ROS production in 1KRas and2KRas cells (n 5 3); representative flow-cytometry analysis of two tumours.h, Live confocal imaging of SCs stained for mitochondria (MitoTracker Green),ROS (CellRox-Red) and DNA (Hoechst). The vast majority of signal generatedby ROS colocalizes with mitochondria. i, Immunoblot of Aldefluor/CD133double-positive and double-negative cells sorted from two independenttumours probed with anti-VDAC1 (VDAC1) and b-actin (Actin) antibodies.j, KRas-expressing cells positive for aldefluor (Ald1) and CD133 (CD1331)have higher mitochondrial transmembrane potential (Dym) than tumour cellsthat do not express the same markers (Ald2 and CD1332) (n 5 3); arepresentative flow-cytometry analysis is reported. Data are mean 6 s.d.
LETTER RESEARCH
Macmillan Publishers Limited. All rights reserved©2014
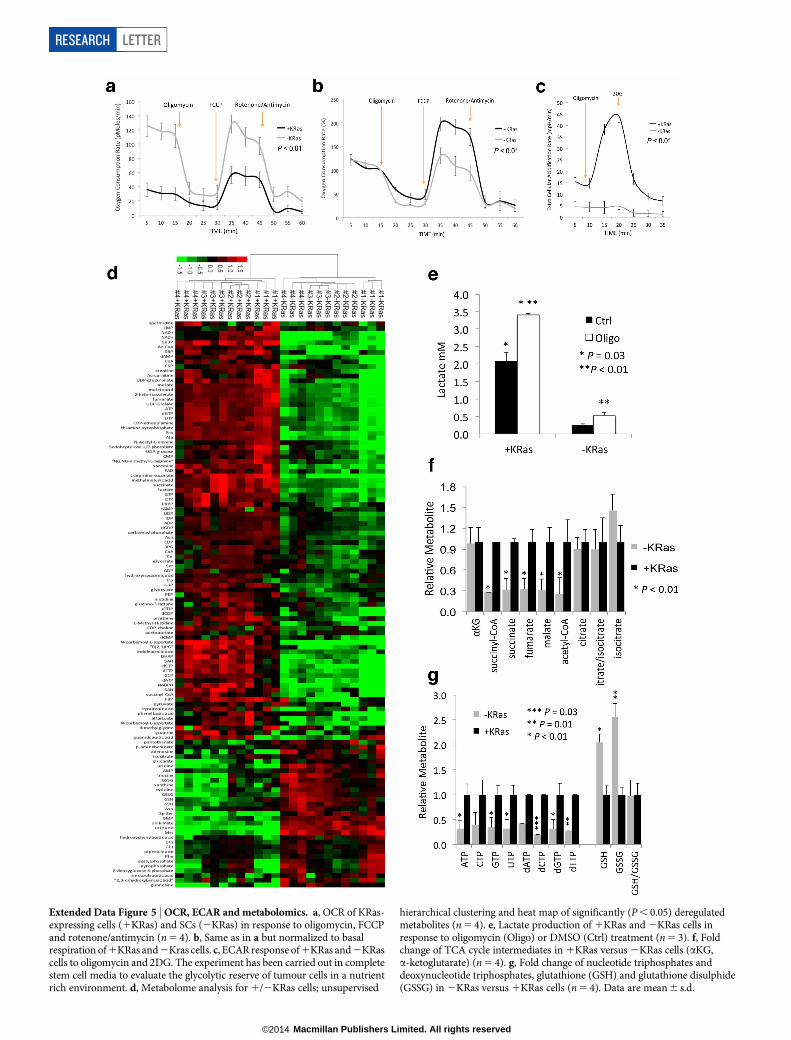
Extended Data Figure 5 | OCR, ECAR and metabolomics. a, OCR of KRas-expressing cells (1KRas) and SCs (2KRas) in response to oligomycin, FCCPand rotenone/antimycin (n 5 4). b, Same as in a but normalized to basalrespiration of 1KRas and 2Kras cells. c, ECAR response of 1KRas and 2KRascells to oligomycin and 2DG. The experiment has been carried out in completestem cell media to evaluate the glycolytic reserve of tumour cells in a nutrientrich environment. d, Metabolome analysis for 1/2KRas cells; unsupervised
hierarchical clustering and heat map of significantly (P , 0.05) deregulatedmetabolites (n 5 4). e, Lactate production of 1KRas and 2KRas cells inresponse to oligomycin (Oligo) or DMSO (Ctrl) treatment (n 5 3). f, Foldchange of TCA cycle intermediates in 1KRas versus 2KRas cells (aKG,a-ketoglutarate) (n 5 4). g, Fold change of nucleotide triphosphates anddeoxynucleotide triphosphates, glutathione (GSH) and glutathione disulphide(GSSG) in 2KRas versus 1KRas cells (n 5 4). Data are mean 6 s.d.
RESEARCH LETTER
Macmillan Publishers Limited. All rights reserved©2014

Extended Data Figure 6 | Surviving cells in vitro and in vivo have animpaired glucose uptake. a, KRas-expressing cells (1KRas) and SCs (2KRas)were incubated with 2NBDG (2-(N-(7-nitrobenz-2-oxa-1,3-diazol-4-yl)amino)-2-deoxyglucose) for 6 h then analysed by flow cytometry (n 5 3); arepresentative flow-cytometry analysis of spheres derived from two differenttumours is reported. b, Mice bearing KRas-expressing tumours (1KRas) and3-week regressed tumours (2KRas) were injected with a tail vein bolus of
2NBDG. After 1 h tumours were explanted and analysed by flow cytometryupon gating on CD441 DAPI2 cells (n 5 3); a representative flow-cytometryanalysis of two different tumours is reported. c, d, Tumour spheres derivedfrom different genetic backgrounds (Ink4a/Arf2/2 and p532/2) were treated(1AB) or not with AZD8330 and BEZ235 for 7 days then plated in fresh stemcell medium. After 24 h medium was collected and analysed by YSI analyser forglucose uptake (c) and lactate production (d) (n 5 3). Data are mean 6 s.d.
LETTER RESEARCH
Macmillan Publishers Limited. All rights reserved©2014
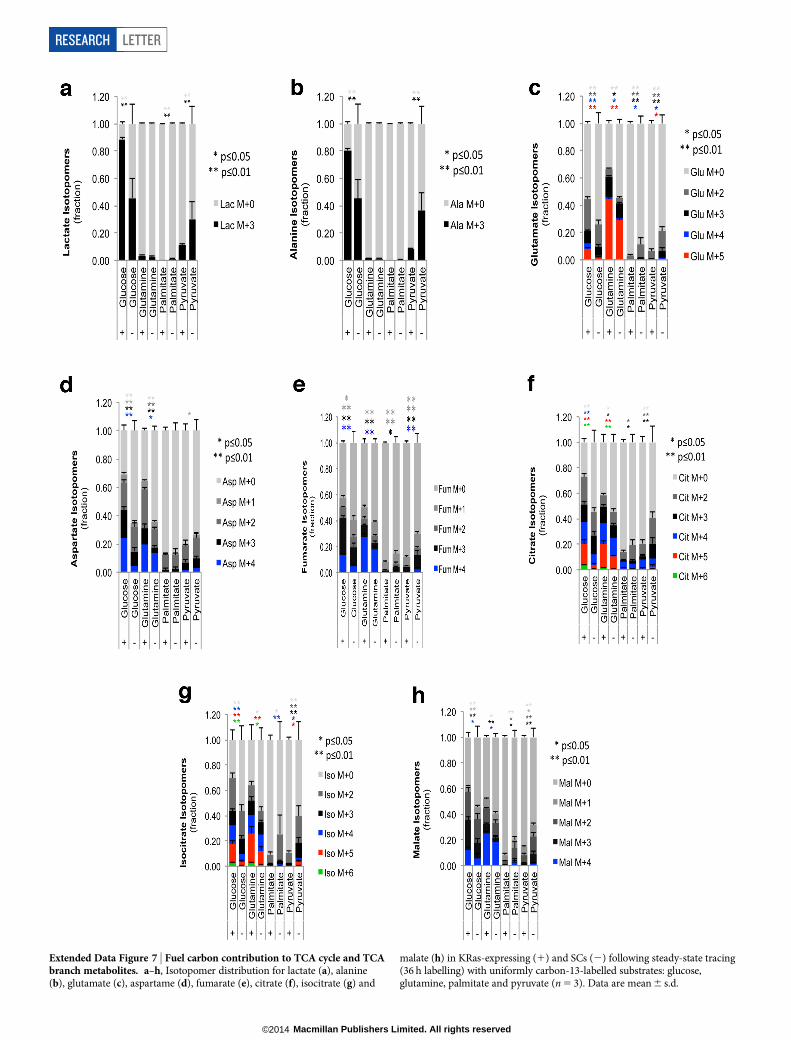
Extended Data Figure 7 | Fuel carbon contribution to TCA cycle and TCAbranch metabolites. a–h, Isotopomer distribution for lactate (a), alanine(b), glutamate (c), aspartame (d), fumarate (e), citrate (f), isocitrate (g) and
malate (h) in KRas-expressing (1) and SCs (2) following steady-state tracing(36 h labelling) with uniformly carbon-13-labelled substrates: glucose,glutamine, palmitate and pyruvate (n 5 3). Data are mean 6 s.d.
RESEARCH LETTER
Macmillan Publishers Limited. All rights reserved©2014

LETTER RESEARCH
Macmillan Publishers Limited. All rights reserved©2014

Extended Data Figure 8 | Differential sensitivity of tumour cells toOXPHOS inhibition. a, Annexin V staining of cells treated with oligomycin200 nM (Oli) for 24 h shows a significant decrease in viability in surviving cells(2KRas). By contrast, control cells expressing KRas (1KRas) are minimallyaffected (n 5 3); a representative flow-cytometry analysis is reported. b, Effectof oligomycin (Oli), dicyclohexylcarbodiimide (DCCD), veturicidin (Vent),rotenone (Rot), antimycin (Anti) and DMSO (Ctrl) on spherogenic potential ofKRas-expressing (1KRas) and SCs (2KRas) (n 5 4). c, In vivo treatmentexperimental scheme: mice were transplanted with tumour cells and fed withdoxycycline in drinking water (1KRas, 1Dox) until they developed tumours of1 cm in diameter. Then doxycycline was withdrawn (2KRas, 2Dox) and after2 weeks, when tumours were regressed, mice were treated with oligomycin(0.5 mg kg21, i.p.) or vehicle for 5 days a week, for 2 weeks. After treatment,KRas was re-induced (1Dox) and mice were monitored for tumour relapse.d, One dose of oligomycin (0.5 mg kg21, i.p.) is sufficient to increase lactateconcentration in plasma of treated mice after 4 h from injection. Oligo,oligomycin; Ctrl, vehicle. n 5 4. e, Tumour volume of KRas-expressing
tumours treated with either vehicle or oligomycin 0.5 mg kg21, 5 days a week,for 2 weeks. Treatment was started when tumours reached 5 mm of diameter (5mice per group). f, SCs after treatment with oligomycin show signs ofdegeneration and epithelial remnants change their morphology. Red arrowsindicate the presence of capillaries (red blood cells) indicating that regressedtumours are vascularized (340). g, Oligomycin (Oli) induces ROS productionin KRas-expressing cells (1KRas) and SCs (2KRas). Its effect is even strongerthan that of positive control 4-hydroxynonenal (hne) (n 5 3). h, Glutathionelevels in KRas-expressing cells (1KRas) and SCs (2KRas) before and afterbuthionine sulphoximine (BSO) treatment. Glutathione is increased in SCs andBSO treatment is effective in reducing its level (n 5 3). i, Effect of glutathionedepletion on spherogenic potential of KRas-expressing cells (1KRas) and SCs(2KRas) (n 5 3). j, ROS production in SCs after treatment with4-hydroxynonenal (hne) and oligomycin (oli) in the presence or absence ofantioxidants: a-tocopherol (vitE), N-acetylcysteine (nac) and tetrakis (Tet)(n 5 2). k, Effect of oligomycin on spherogenic potential of surviving cells pre-treated with antioxidants (n 5 4). Data are mean 6 s.d.
RESEARCH LETTER
Macmillan Publishers Limited. All rights reserved©2014

LETTER RESEARCH
Macmillan Publishers Limited. All rights reserved©2014

Extended Data Figure 9 | Effect of mitochondrial downregulation inhuman tumour spheres and metabolic stress mediated by inhibition ofautophagy. a, Effects of the combination of AZD8330 and BEZ235(AZD1BEZ) on human tumour spheres. Some cells, usually doublets, are ableto survive the treatment (35). b, Immunoblots of human tumour spherestreated or not with AZD1BEZ probed with anti-phospho-p42/44 (pErk), total-Erk (Erk), phospho-Akt (pAkt), Akt and b-actin (Actin) antibodies; twoindependent tumours are reported. c, Annexin V staining of treated(AZD1BEZ) and control (Ctrl) cells after 4 days of treatment (n 5 3).d, Mitochondrial transmembrane potential (Dym) of untreated (Ctrl) andtreated (AZD1BEZ) human spheres with AZD8330 and BEZ235 for 7 days(n 5 3); representative flow-cytometry analysis of two tumours. e–h, TFAMand TUFM were downregulated using two inducible short hairpin RNAs(shRNAs) each (TFAM: #93, #95; TUFM: #63, #64) in human spheresexpressing KRas (untreated) and cells surviving 1 week of treatment withAZD8330 and BEZ235 (AZD1BEZ); after 5 days of shRNA induction cells
were replated for evaluating their spherogenic capacity. e, Immunoblots oftumour spheres after 72 h of shRNA induction (1Dox) probed with anti-TFAM, TUFM and HSP90 antibodies. f, Representative calcein staining aftersphere replating. g, h, Effects of downregulation of TFAM and TUFM onspherogenic potential of untreated (g) and treated (h) cells; data represent theaverage of two independent human tumours. i, Immunoblot of KRas-expressing cells treated or not with oligomycin 200 nM (Oligo, 1/2) probedwith anti-Thr-172-phospho-AMPK and actin antibodies. j, k, Immunoblots of1KRas and 2KRas cells treated with etomoxir (Eto, 100mM for 6 h) (j) andbafilomycin (Baf, 50 nM for 24 h) (k) probed with anti-Thr-172-phospho-AMPK and vinculin antibodies. l, Annexin V staining of cells treated for 48 hwith bafilomycin 50 nM (Baf) and etomoxir 100mM (Eto) clearly shows asignificant decrease in viability of SCs (2KRas). Control cells expressing KRas(1KRas) are not affected (n 5 3); representative dot-plots are reported. Dataare mean 6 s.d.
RESEARCH LETTER
Macmillan Publishers Limited. All rights reserved©2014

Extended Data Figure 10 | Cells surviving oncogene ablation are engorgedwith autophagosomes and lysosomes and contain lipid droplets. a, SCs(2KRas) have a cytoplasm full of phagosomes and autophagosomes, a featureabsent in KRas-expressing cells (1KRas) (TEM; 37,500). b, SCs are
characterized by the presence of several lipid droplets (arrowheads) in thecytoplasm (TEM; 37,500). c, Primers used for amplification of mitochondrialand lipid metabolic genes.
LETTER RESEARCH
Macmillan Publishers Limited. All rights reserved©2014


