Embed Size (px)
Citation preview
Online Appendices
Does Virtual Advising Increase College Enrollment? Evidence from a Random
Assignment College Access Field Experiment
Meredith Phillips and Sarah Reber
i
Table of Contents Appendix A. Summary of Studies of College Access Interventions .............................................................. 1
Table A.1. Studies of College Access Programs .................................................................................... 5
References for Appendix A ..................................................................................................................... 14
Appendix B. Measures of Information and Support ................................................................................... 17
Appendix C. Additional Tables .................................................................................................................... 20
Table C.1. Characteristics of Recruited Schools and Recruitment Pool .............................................. 20
Table C.2. Balance Test for Analysis Sample ....................................................................................... 21
Table C.3. Balance Test for Follow-up Survey Respondents ............................................................... 23
Table C.4. Effects of Assignment to V-SOURCE on Additional Financial Aid Outcomes ..................... 25
Table C.5. Effects of Assignment to V-SOURCE on College Enrollment Outcomes, CSAC + NSC Data 25
Table C.6. Comparison of V-SOURCE Students to SOURCE Students ................................................. 26
Appendix D. Heterogeneous Treatment Effects by Demographic Characteristics ..................................... 27
Table D.1a. Characteristics of V-SOURCE Research Participants, by Gender ..................................... 30
Table D.1b. Effects of Assignment to V-SOURCE on Self-Reported Experiences Applying to College and for Financial Aid: Main Experience and Support Constructs, by Gender ..................................... 32
Table D.1c. Effects of Assignment to V-SOURCE on Self-Reported Milestone Completion, by Gender ............................................................................................................................................................ 33
Table D.1d. Effects of Assignment to V-SOURCE on Self-Reported College Application Outcomes, by Gender ................................................................................................................................................ 34
Table D.1e. Effects of Assignment to V-SOURCE on Self-Reported College Admissions Outcomes, by Gender ................................................................................................................................................ 35
Table D.1f. Effects of Assignment to V-SOURCE on College Enrollment Outcomes, by Gender ........ 36
Table D.1g. Effects of Assignment to V-SOURCE on College Persistence Outcomes, by Gender ....... 37
Table D.2a. Characteristics of V-SOURCE Research Participants, by Race/Ethnicity and Home Language ............................................................................................................................................. 38
Table D.2b. Effects of Assignment to V-SOURCE on Self-Reported Experiences Applying to College and for Financial Aid: Main Experience and Support Constructs, by Race/Ethnicity and Home Language ............................................................................................................................................. 40
Table D.2c. Effects of Assignment to V-SOURCE on Self-Reported Milestone Completion, by Race/Ethnicity and Home Language ................................................................................................... 41
Table D.2d. Effects of Assignment to V-SOURCE on Self-Reported College Application Outcomes, by Race/Ethnicity and Home Language ................................................................................................... 42
ii
Table D.2e. Effects of Assignment to V-SOURCE on Self-Reported College Admissions Outcomes, by Race/Ethnicity and Home Language ................................................................................................... 43
Table D.2f. Effects of Assignment to V-SOURCE on College Enrollment Outcomes, by Race/Ethnicity and Home Language ........................................................................................................................... 44
Table D.2g. Effects of Assignment to V-SOURCE on College Persistence Outcomes, by Race/Ethnicity and Home Language ........................................................................................................................... 45
Table D.3a. Characteristics of V-SOURCE Research Participants, by Parental Education ................... 46
Table D.3b. Effects of Assignment to V-SOURCE on Self-Reported Experiences Applying to College and for Financial Aid: Main Experience and Support Constructs, by Parental Education .................. 48
Table D.3c. Effects of Assignment to V-SOURCE on Self-Reported Milestone Completion, by Parental Education ............................................................................................................................................ 49
Table D.3d. Effects of Assignment to V-SOURCE on Self-Reported College Application Outcomes, by Parental Education .............................................................................................................................. 50
Table D.3e. Effects of Assignment to V-SOURCE on Self-Reported College Admissions Outcomes, by Parental Education .............................................................................................................................. 51
Table D.3f. Effects of Assignment to V-SOURCE on College Enrollment Outcomes, by Parental Education ............................................................................................................................................ 52
Table D.3g. Effects of Assignment to V-SOURCE on College Persistence Outcomes, by Parental Education ............................................................................................................................................ 53
Appendix E. Exploratory Analysis of Heterogeneous Treatment Effects .................................................... 54
Academic Achievement .......................................................................................................................... 54
Table E.1a. Characteristics of V-SOURCE Research Participants, by Self-Reported GPA .................... 55
Table E.1b. Effects of Assignment to V-SOURCE on Applications, Admissions, and Enrollment, by Self-Reported GPA .............................................................................................................................. 57
Alternative Sources of Support ............................................................................................................... 58
Table E.2a. Characteristics of V-SOURCE Research Participants, by Parent Will Help with Applications if Asked ........................................................................................................................... 59
Table E.2b. Effects of Assignment to V-SOURCE on Applications, Admissions, and Enrollment, by Parent Will Help with Applications if Asked........................................................................................ 61
Table E.3a. Characteristics of V-SOURCE Research Participants, by Sibling Will Help with Applications if Asked ........................................................................................................................... 62
Table E.3b. Effects of Assignment to V-SOURCE on Applications, Admissions, and Enrollment, by Sibling Will Help with Applications if Asked ........................................................................................ 64
Table E.4a. Characteristics of V-SOURCE Research Participants, by Teacher or Counselor Will Help with Applications if Asked ................................................................................................................... 65
Table E.4b. Effects of Assignment to V-SOURCE on Applications, Admissions, and Enrollment, by Teacher or Counselor Will Help with Applications if Asked ................................................................ 67
iii
Table E.5a. Characteristics of V-SOURCE Research Participants, by Ever Participated in College Access Program ................................................................................................................................... 68
Table E.5b. Effects of Assignment to V-SOURCE on Applications, Admissions, and Enrollment, by Ever Participated in College Access Program ...................................................................................... 70
Disorganization and Procrastination ....................................................................................................... 71
Table E.6a. Characteristics of V-SOURCE Research Participants, by Procrastinator Index ................. 71
Table E.6b. Effects of Assignment to V-SOURCE on Applications, Admissions, and Enrollment, by Procrastinator Index............................................................................................................................ 73
1
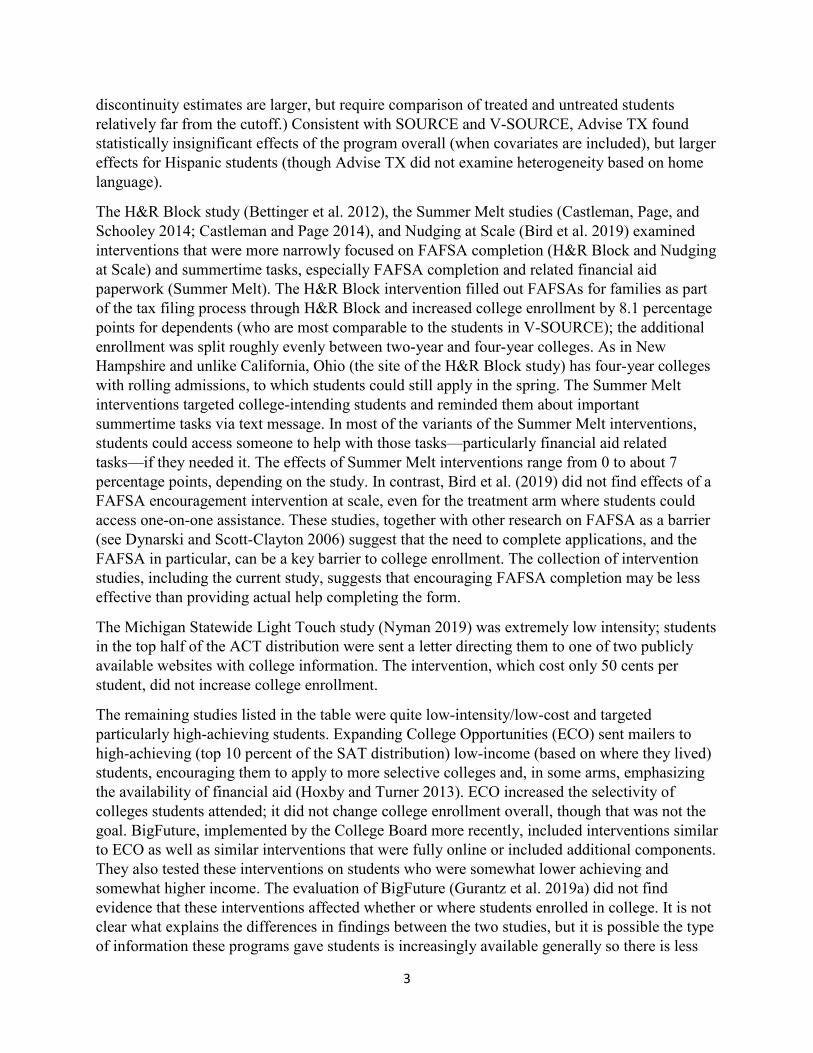
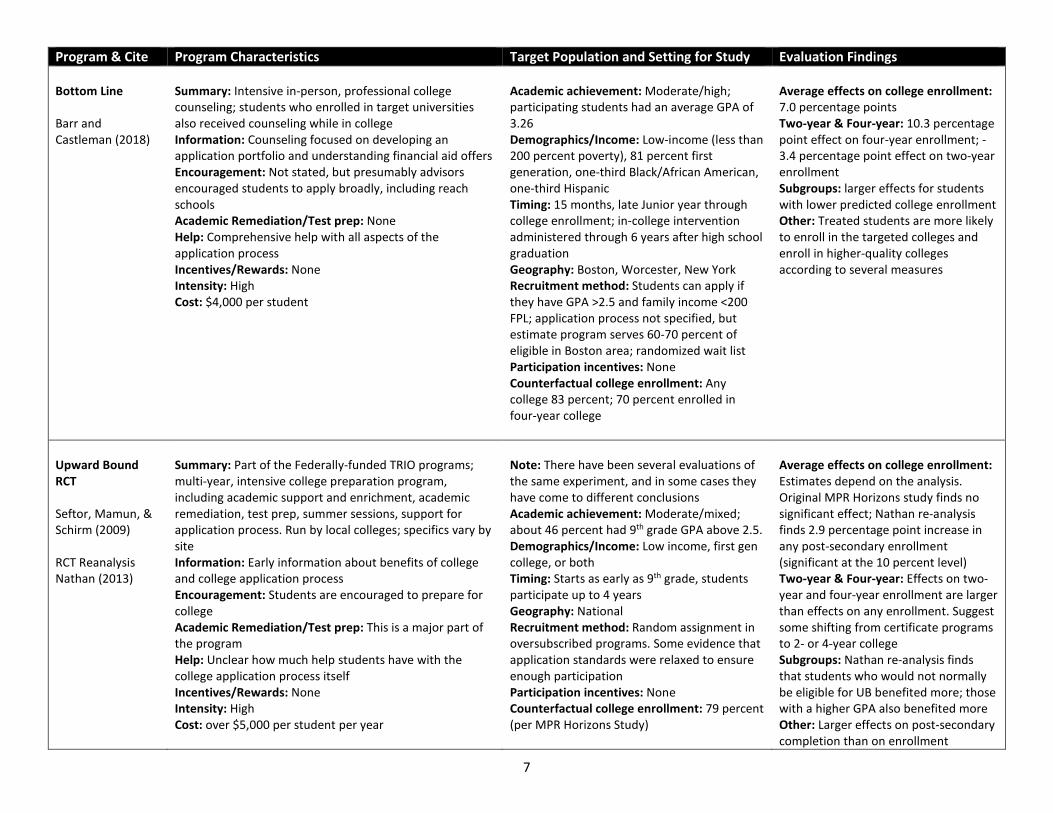
APPENDIX A. SUMMARY OF STUDIES OF COLLEGE ACCESS INTERVENTIONS This appendix summarizes existing experimental studies of college access programs as background for understanding the findings in the present study.1 Table A.1 describes studies that meet the following criteria: (1) the intervention addressed one or more aspects of the college and financial aid application process; we exclude studies of programs that provide financial aid/scholarships or change policies related to the college application process; (2) the study had an experimental design; and (3) the study examined the effect of the intervention on college enrollment. We include a few additional studies in which college selectivity, rather than college enrollment, was the outcome of interest.
The first column provides the name of the intervention and citation to the study. The second column describes key aspects of the intervention, the third column provides information about the population of students served, including the counterfactual college enrollment where available, and the timing and method of enrolling students in the study. The last column summarizes the key findings of the study.
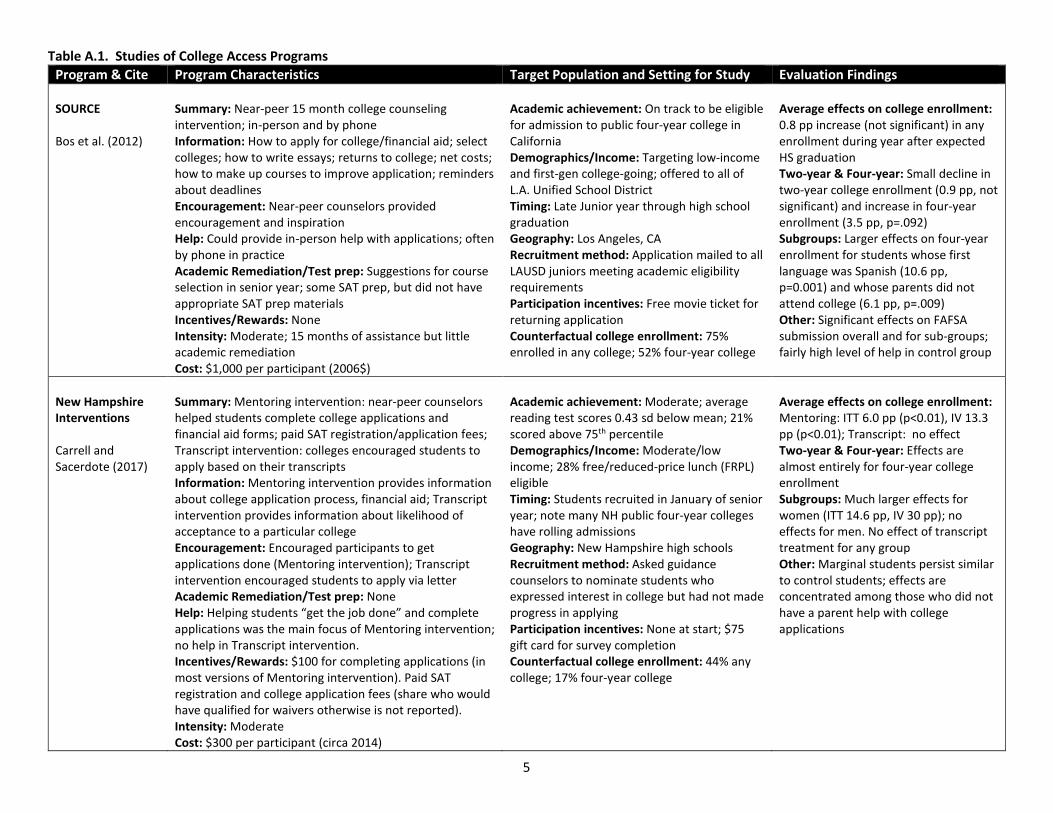
We order the studies roughly from most to least similar to V-SOURCE, though interventions have multiple dimensions so alternative orderings are possible. SOURCE (Bos et al. 2012) is the predecessor program to V-SOURCE, so most similar by design. It served a similar population and had a similar structure, except that V-SOURCE was fully virtual, whereas SOURCE included in-person advising. Like SOURCE, Carrell and Sacerdote’s (2017) New Hampshire (NH) Mentoring intervention provided in-person advising and focused on the college application process. This intervention assisted students whose counselors referred them to the program because they had expressed interest in attending college but had not taken steps to apply by January of senior year; the program focused on completing applications, covering all necessary fees, and paying a bonus for completing applications in some cases. The low four-year college enrollment rates in the control group of this study indicate that it targeted students who were unlikely to apply to college in the absence of the program. Note that this approach to targeting is only possible in a setting, such as New Hampshire, where public four-year colleges have rolling admissions.
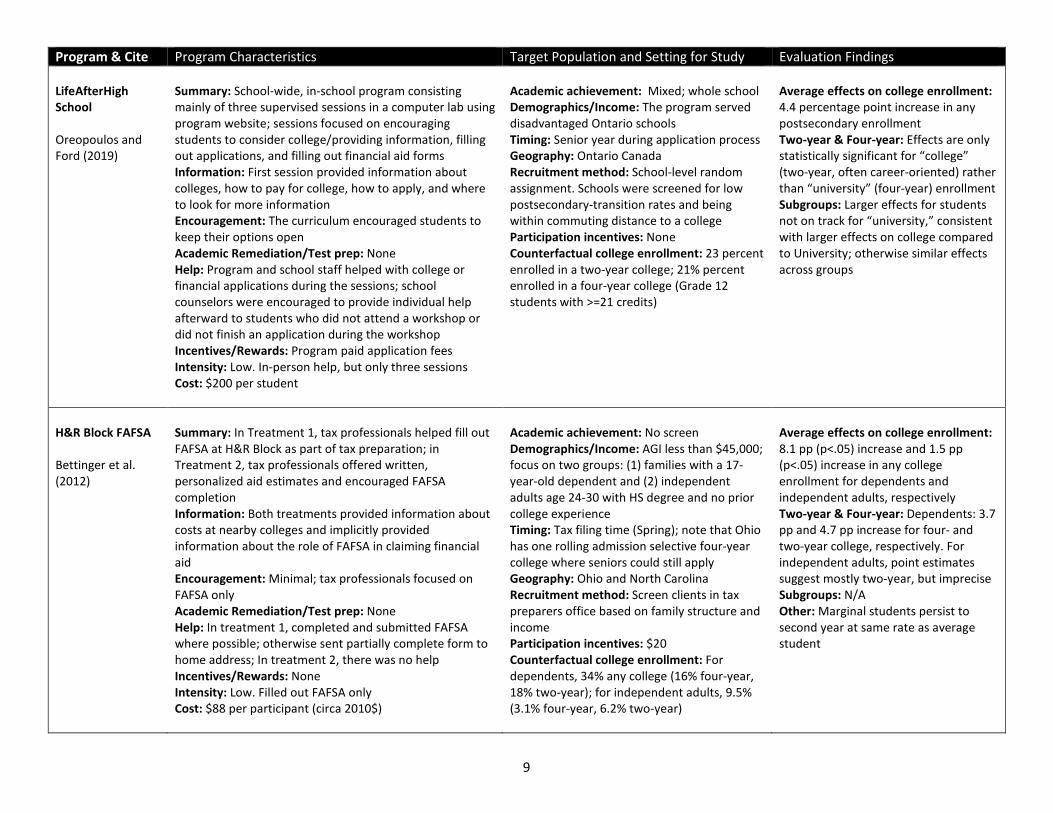
SOURCE increased four-year college enrollment by 3.5 percentage points on average, by 6 percentage points for students whose parents did not attend college, and by 11 percentage points for students whose first language was Spanish. NH Mentoring increased college enrollment by 6 percentage points on average, mostly on the four-year margin, with the effects concentrated entirely among women. Similar to NH Mentoring, LifeAfterHighSchool (Oreopoulos and Ford 2019) focused on getting students to submit applications. That program was offered school-wide in Ontario high schools with low college-transition rates. The program gave students information about college and opportunities to fill out applications during school time with the assistance of
1 We do not attempt a meta-analysis or systematic analysis because college access programs differ considerably from one another and from V-SOURCE on many dimensions, and experimental evaluations of college access programs are still relatively uncommon, so it is not yet possible to draw strong conclusions about the aspects of the interventions and the populations they serve that explain differences in effectiveness.
2
staff; the program also covered application fees. LifeAfterHighSchool increased two-year college enrollment by 4 to 5 percentage points on average.
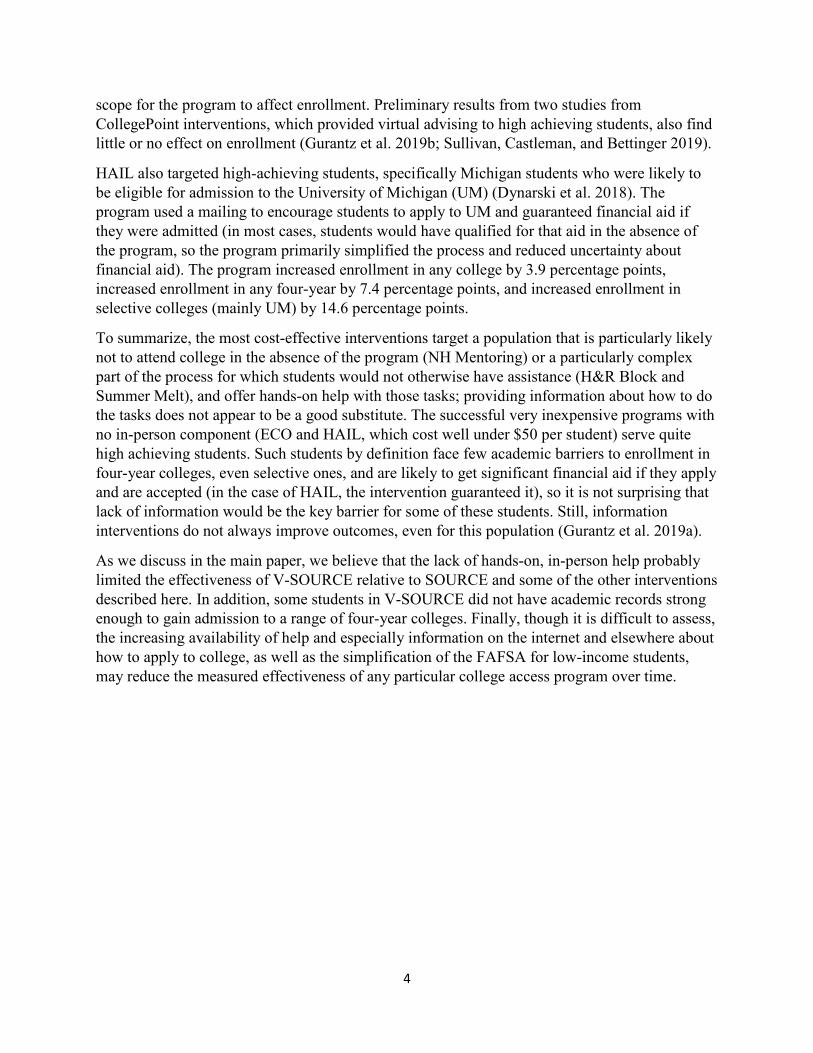
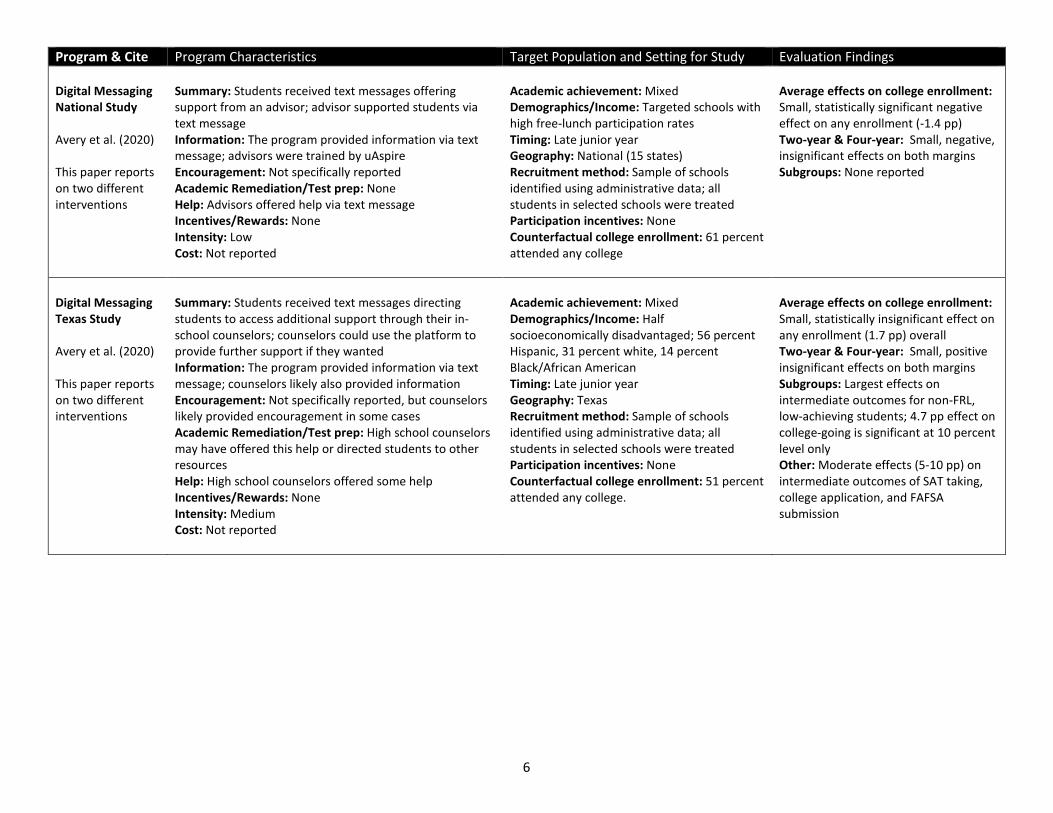
Avery et. al (2020) report on two interventions that, like V-SOURCE, made use of virtual technologies. In one intervention (the “national study”), treated students received a text message roughly monthly encouraging them to seek help with the college application process, while control group students received messages roughly every two months. Treated students were assigned to a trained advisor who could personalize follow-up texts to responses they received from students, while control group students received automated follow-up texts. The treatment had no effect on SAT taking or FAFSA completion, a small statistically significant negative effect on college enrollment overall, and no effect on four-year college enrollment. The second intervention (the “Texas study”) was school-based. Students in treated schools received text messages, ostensibly from their school counselor, encouraging them to complete steps in the college application process. In some cases, these messages were customized based on information about their progress in applying to college or for financial aid. When students responded to these messages, counselors saw these responses and could text back or encourage students to meet with them in person. The intensity of the program therefore depended on how much additional help the counselors provided. Counselors at control group schools had access to the texting platform but used it less. This intervention increased SAT taking (marginally significant), college application and FAFSA completion (by about 5 to 10 percentage points), but not college enrollment. The larger effects on intermediate outcomes suggest in-person support may be important, though as in V-SOURCE, improving completion of key college application steps did not translate to college enrollment.
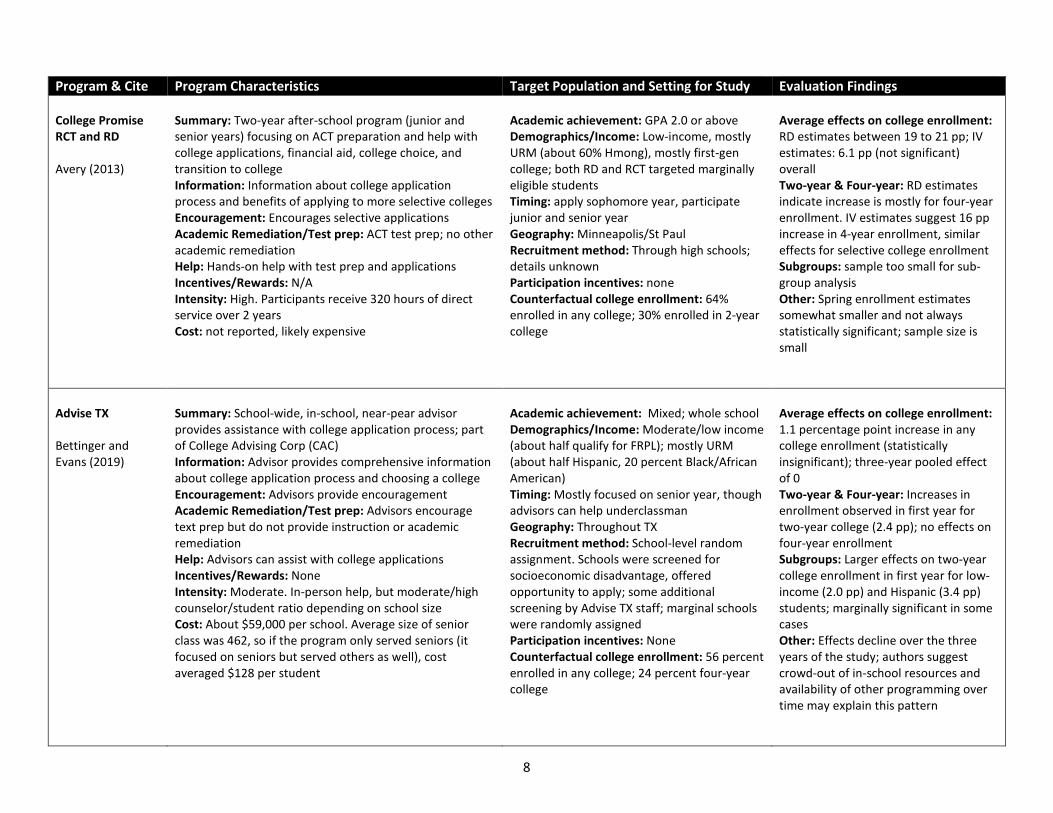
Bottom Line (Barr and Castleman 2018), Upward Bound (Seftor, Mamun, and Schirm 2009; Nathan 2013), and College Promise (Avery 2013) also provided in-person advising, but were more intensive in some ways than SOURCE, V-SOURCE, and the NH Mentoring intervention. Advise TX (Bettinger and Evans 2019) provided near-peer advising as well, but on a school-wide basis. Bottom Line provided a set of services similar to SOURCE, V-SOURCE and NH Mentoring, but was more intensive and expensive; that program also partnered with particular universities to which students were encouraged to apply and where students could receive additional services through the program if they enrolled. Bottom Line increased college enrollment by 7 percentage points and four-year college enrollment by 10 percentage points (Barr and Castleman 2018). Upward Bound typically enrolls students early in high school and provides instruction, tutoring, and college counseling services, making it more expensive than many other programs. Different analyses of a federally funded study of Upward Bound have come to differing conclusions about its effectiveness depending on how the analyses weight different sites and deal with missing data, which suggests underlying heterogeneity in treatment effects across sites. In the table, we summarize the most recent re-analysis (Nathan 2013), which found a 2.9 percentage point increase in post-secondary enrollment associated with Upward Bound Participation, relatively modest in light of the cost of the program. College Promise was also in person, but less intensive than Upward Bound; it focused on ACT preparation and ACT taking and encouraged students to apply to particular colleges affiliated with the program. The random-assignment study of College Promise suggests that it increased college enrollment, but the sample was small, so the effects were not statistically significant. (The regression
3
discontinuity estimates are larger, but require comparison of treated and untreated students relatively far from the cutoff.) Consistent with SOURCE and V-SOURCE, Advise TX found statistically insignificant effects of the program overall (when covariates are included), but larger effects for Hispanic students (though Advise TX did not examine heterogeneity based on home language).
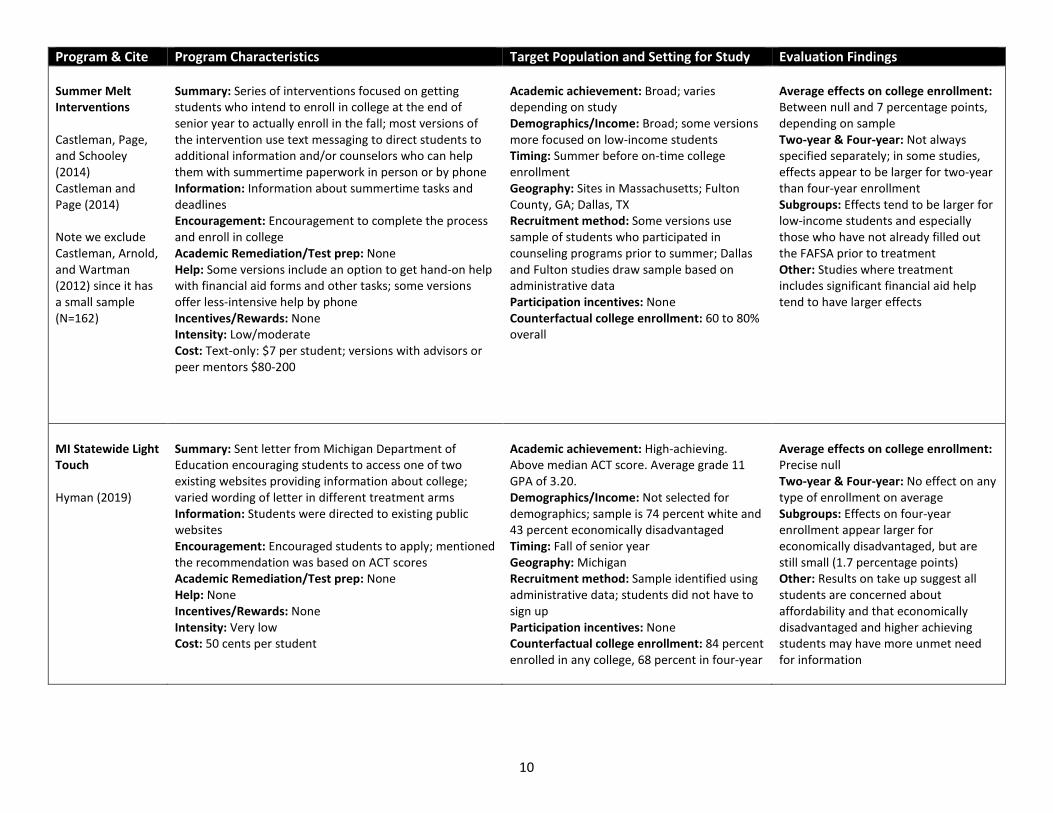
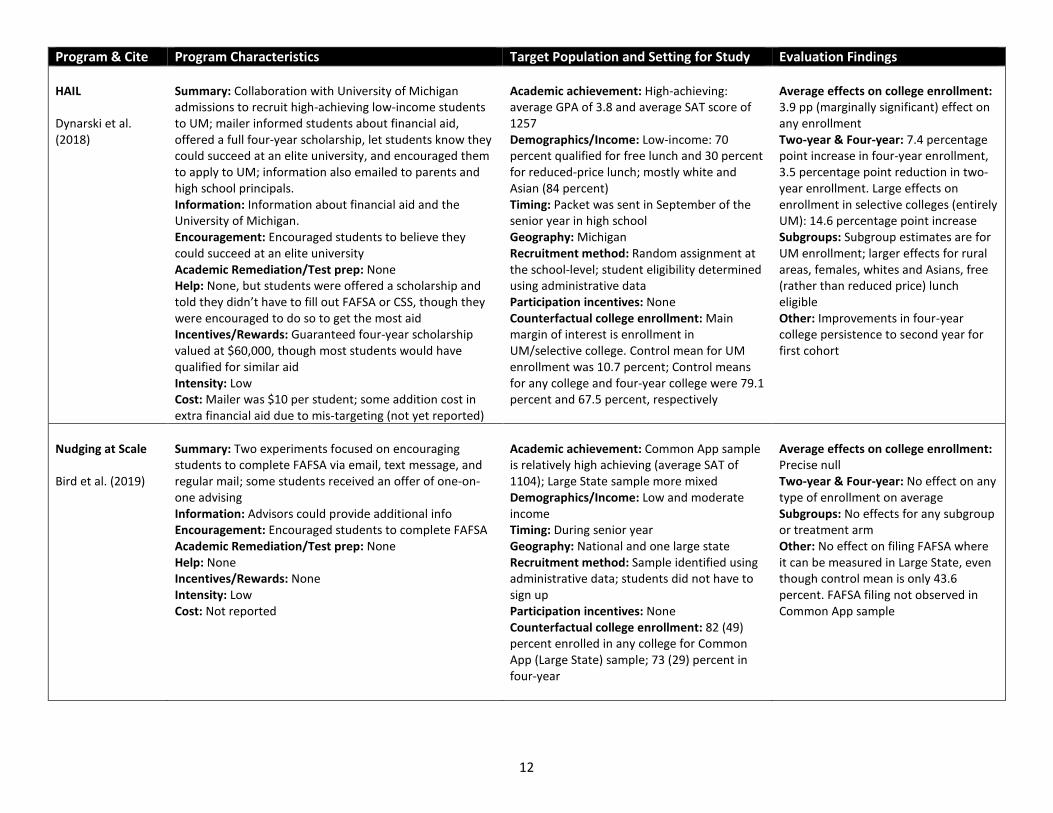
The H&R Block study (Bettinger et al. 2012), the Summer Melt studies (Castleman, Page, and Schooley 2014; Castleman and Page 2014), and Nudging at Scale (Bird et al. 2019) examined interventions that were more narrowly focused on FAFSA completion (H&R Block and Nudging at Scale) and summertime tasks, especially FAFSA completion and related financial aid paperwork (Summer Melt). The H&R Block intervention filled out FAFSAs for families as part of the tax filing process through H&R Block and increased college enrollment by 8.1 percentage points for dependents (who are most comparable to the students in V-SOURCE); the additional enrollment was split roughly evenly between two-year and four-year colleges. As in New Hampshire and unlike California, Ohio (the site of the H&R Block study) has four-year colleges with rolling admissions, to which students could still apply in the spring. The Summer Melt interventions targeted college-intending students and reminded them about important summertime tasks via text message. In most of the variants of the Summer Melt interventions, students could access someone to help with those tasks—particularly financial aid related tasks—if they needed it. The effects of Summer Melt interventions range from 0 to about 7 percentage points, depending on the study. In contrast, Bird et al. (2019) did not find effects of a FAFSA encouragement intervention at scale, even for the treatment arm where students could access one-on-one assistance. These studies, together with other research on FAFSA as a barrier (see Dynarski and Scott-Clayton 2006) suggest that the need to complete applications, and the FAFSA in particular, can be a key barrier to college enrollment. The collection of intervention studies, including the current study, suggests that encouraging FAFSA completion may be less effective than providing actual help completing the form.
The Michigan Statewide Light Touch study (Nyman 2019) was extremely low intensity; students in the top half of the ACT distribution were sent a letter directing them to one of two publicly available websites with college information. The intervention, which cost only 50 cents per student, did not increase college enrollment.
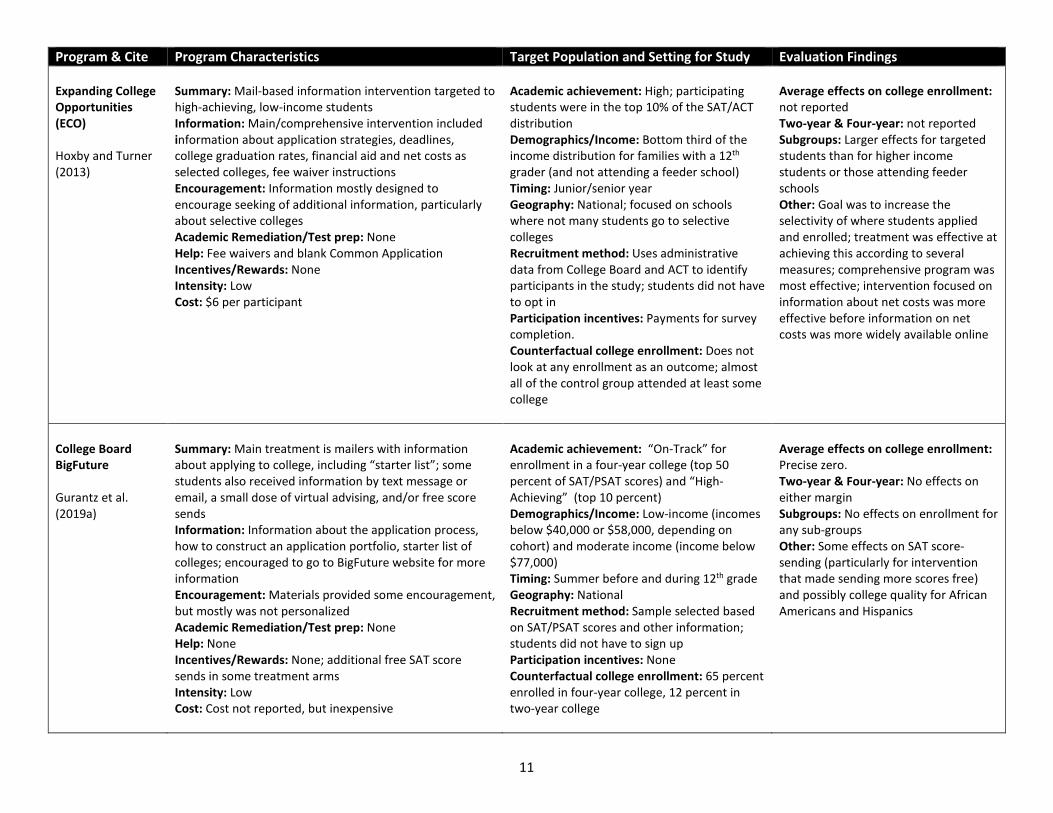
The remaining studies listed in the table were quite low-intensity/low-cost and targeted particularly high-achieving students. Expanding College Opportunities (ECO) sent mailers to high-achieving (top 10 percent of the SAT distribution) low-income (based on where they lived) students, encouraging them to apply to more selective colleges and, in some arms, emphasizing the availability of financial aid (Hoxby and Turner 2013). ECO increased the selectivity of colleges students attended; it did not change college enrollment overall, though that was not the goal. BigFuture, implemented by the College Board more recently, included interventions similar to ECO as well as similar interventions that were fully online or included additional components. They also tested these interventions on students who were somewhat lower achieving and somewhat higher income. The evaluation of BigFuture (Gurantz et al. 2019a) did not find evidence that these interventions affected whether or where students enrolled in college. It is not clear what explains the differences in findings between the two studies, but it is possible the type of information these programs gave students is increasingly available generally so there is less
4
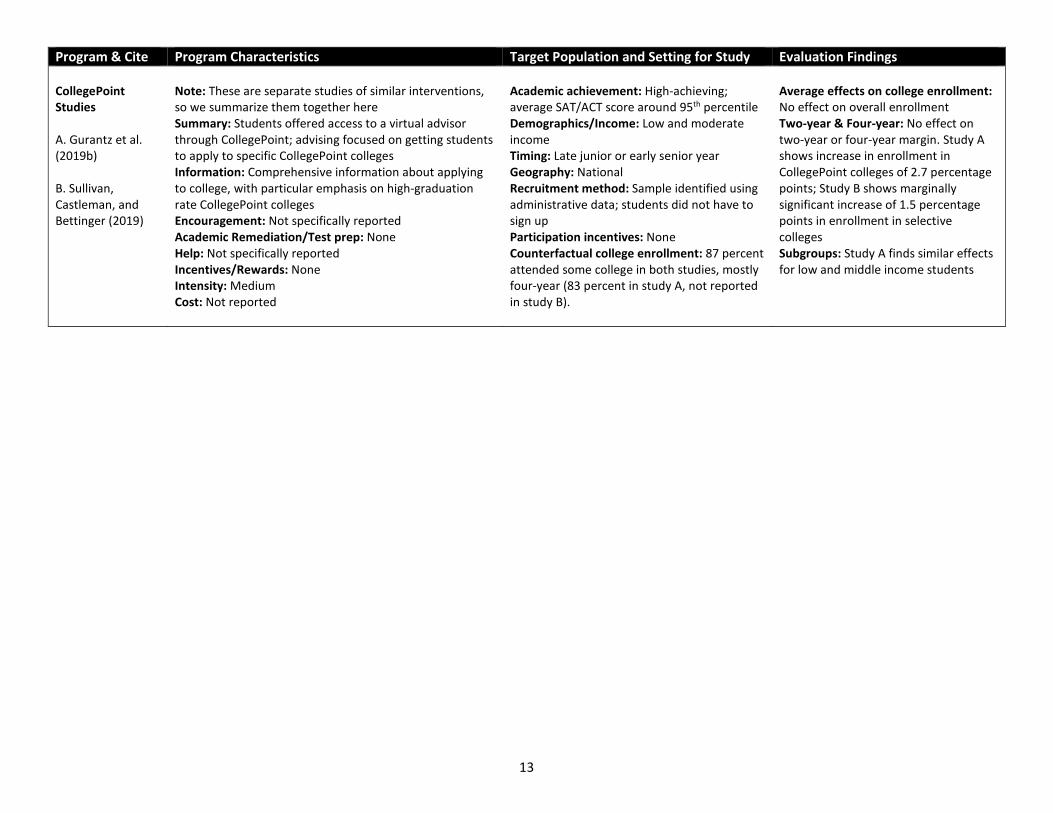
scope for the program to affect enrollment. Preliminary results from two studies from CollegePoint interventions, which provided virtual advising to high achieving students, also find little or no effect on enrollment (Gurantz et al. 2019b; Sullivan, Castleman, and Bettinger 2019).
HAIL also targeted high-achieving students, specifically Michigan students who were likely to be eligible for admission to the University of Michigan (UM) (Dynarski et al. 2018). The program used a mailing to encourage students to apply to UM and guaranteed financial aid if they were admitted (in most cases, students would have qualified for that aid in the absence of the program, so the program primarily simplified the process and reduced uncertainty about financial aid). The program increased enrollment in any college by 3.9 percentage points, increased enrollment in any four-year by 7.4 percentage points, and increased enrollment in selective colleges (mainly UM) by 14.6 percentage points.
To summarize, the most cost-effective interventions target a population that is particularly likely not to attend college in the absence of the program (NH Mentoring) or a particularly complex part of the process for which students would not otherwise have assistance (H&R Block and Summer Melt), and offer hands-on help with those tasks; providing information about how to do the tasks does not appear to be a good substitute. The successful very inexpensive programs with no in-person component (ECO and HAIL, which cost well under $50 per student) serve quite high achieving students. Such students by definition face few academic barriers to enrollment in four-year colleges, even selective ones, and are likely to get significant financial aid if they apply and are accepted (in the case of HAIL, the intervention guaranteed it), so it is not surprising that lack of information would be the key barrier for some of these students. Still, information interventions do not always improve outcomes, even for this population (Gurantz et al. 2019a).
As we discuss in the main paper, we believe that the lack of hands-on, in-person help probably limited the effectiveness of V-SOURCE relative to SOURCE and some of the other interventions described here. In addition, some students in V-SOURCE did not have academic records strong enough to gain admission to a range of four-year colleges. Finally, though it is difficult to assess, the increasing availability of help and especially information on the internet and elsewhere about how to apply to college, as well as the simplification of the FAFSA for low-income students, may reduce the measured effectiveness of any particular college access program over time.
5
Table A.1. Studies of College Access Programs Program & Cite Program Characteristics Target Population and Setting for Study Evaluation Findings SOURCE Bos et al. (2012)
Summary: Near-peer 15 month college counseling intervention; in-person and by phone Information: How to apply for college/financial aid; select colleges; how to write essays; returns to college; net costs; how to make up courses to improve application; reminders about deadlines Encouragement: Near-peer counselors provided encouragement and inspiration Help: Could provide in-person help with applications; often by phone in practice Academic Remediation/Test prep: Suggestions for course selection in senior year; some SAT prep, but did not have appropriate SAT prep materials Incentives/Rewards: None Intensity: Moderate; 15 months of assistance but little academic remediation Cost: $1,000 per participant (2006$)
Academic achievement: On track to be eligible for admission to public four-year college in California Demographics/Income: Targeting low-income and first-gen college-going; offered to all of L.A. Unified School District Timing: Late Junior year through high school graduation Geography: Los Angeles, CA Recruitment method: Application mailed to all LAUSD juniors meeting academic eligibility requirements Participation incentives: Free movie ticket for returning application Counterfactual college enrollment: 75% enrolled in any college; 52% four-year college
Average effects on college enrollment: 0.8 pp increase (not significant) in any enrollment during year after expected HS graduation Two-year & Four-year: Small decline in two-year college enrollment (0.9 pp, not significant) and increase in four-year enrollment (3.5 pp, p=.092) Subgroups: Larger effects on four-year enrollment for students whose first language was Spanish (10.6 pp, p=0.001) and whose parents did not attend college (6.1 pp, p=.009) Other: Significant effects on FAFSA submission overall and for sub-groups; fairly high level of help in control group
New Hampshire Interventions Carrell and Sacerdote (2017)
Summary: Mentoring intervention: near-peer counselors helped students complete college applications and financial aid forms; paid SAT registration/application fees; Transcript intervention: colleges encouraged students to apply based on their transcripts Information: Mentoring intervention provides information about college application process, financial aid; Transcript intervention provides information about likelihood of acceptance to a particular college Encouragement: Encouraged participants to get applications done (Mentoring intervention); Transcript intervention encouraged students to apply via letter Academic Remediation/Test prep: None Help: Helping students “get the job done” and complete applications was the main focus of Mentoring intervention; no help in Transcript intervention. Incentives/Rewards: $100 for completing applications (in most versions of Mentoring intervention). Paid SAT registration and college application fees (share who would have qualified for waivers otherwise is not reported). Intensity: Moderate Cost: $300 per participant (circa 2014)
Academic achievement: Moderate; average reading test scores 0.43 sd below mean; 21% scored above 75th percentile Demographics/Income: Moderate/low income; 28% free/reduced-price lunch (FRPL) eligible Timing: Students recruited in January of senior year; note many NH public four-year colleges have rolling admissions Geography: New Hampshire high schools Recruitment method: Asked guidance counselors to nominate students who expressed interest in college but had not made progress in applying Participation incentives: None at start; $75 gift card for survey completion Counterfactual college enrollment: 44% any college; 17% four-year college
Average effects on college enrollment: Mentoring: ITT 6.0 pp (p<0.01), IV 13.3 pp (p<0.01); Transcript: no effect Two-year & Four-year: Effects are almost entirely for four-year college enrollment Subgroups: Much larger effects for women (ITT 14.6 pp, IV 30 pp); no effects for men. No effect of transcript treatment for any group Other: Marginal students persist similar to control students; effects are concentrated among those who did not have a parent help with college applications
6
Program & Cite Program Characteristics Target Population and Setting for Study Evaluation Findings Digital Messaging National Study Avery et al. (2020) This paper reports on two different interventions
Summary: Students received text messages offering support from an advisor; advisor supported students via text message Information: The program provided information via text message; advisors were trained by uAspire Encouragement: Not specifically reported Academic Remediation/Test prep: None Help: Advisors offered help via text message Incentives/Rewards: None Intensity: Low Cost: Not reported
Academic achievement: Mixed Demographics/Income: Targeted schools with high free-lunch participation rates Timing: Late junior year Geography: National (15 states) Recruitment method: Sample of schools identified using administrative data; all students in selected schools were treated Participation incentives: None Counterfactual college enrollment: 61 percent attended any college
Average effects on college enrollment: Small, statistically significant negative effect on any enrollment (-1.4 pp) Two-year & Four-year: Small, negative, insignificant effects on both margins Subgroups: None reported
Digital Messaging Texas Study Avery et al. (2020) This paper reports on two different interventions
Summary: Students received text messages directing students to access additional support through their in-school counselors; counselors could use the platform to provide further support if they wanted Information: The program provided information via text message; counselors likely also provided information Encouragement: Not specifically reported, but counselors likely provided encouragement in some cases Academic Remediation/Test prep: High school counselors may have offered this help or directed students to other resources Help: High school counselors offered some help Incentives/Rewards: None Intensity: Medium Cost: Not reported
Academic achievement: Mixed Demographics/Income: Half socioeconomically disadvantaged; 56 percent Hispanic, 31 percent white, 14 percent Black/African American Timing: Late junior year Geography: Texas Recruitment method: Sample of schools identified using administrative data; all students in selected schools were treated Participation incentives: None Counterfactual college enrollment: 51 percent attended any college.
Average effects on college enrollment: Small, statistically insignificant effect on any enrollment (1.7 pp) overall Two-year & Four-year: Small, positive insignificant effects on both margins Subgroups: Largest effects on intermediate outcomes for non-FRL, low-achieving students; 4.7 pp effect on college-going is significant at 10 percent level only Other: Moderate effects (5-10 pp) on intermediate outcomes of SAT taking, college application, and FAFSA submission
7
Program & Cite Program Characteristics Target Population and Setting for Study Evaluation Findings Bottom Line Barr and Castleman (2018)
Summary: Intensive in-person, professional college counseling; students who enrolled in target universities also received counseling while in college Information: Counseling focused on developing an application portfolio and understanding financial aid offers Encouragement: Not stated, but presumably advisors encouraged students to apply broadly, including reach schools Academic Remediation/Test prep: None Help: Comprehensive help with all aspects of the application process Incentives/Rewards: None Intensity: High Cost: $4,000 per student
Academic achievement: Moderate/high; participating students had an average GPA of 3.26 Demographics/Income: Low-income (less than 200 percent poverty), 81 percent first generation, one-third Black/African American, one-third Hispanic Timing: 15 months, late Junior year through college enrollment; in-college intervention administered through 6 years after high school graduation Geography: Boston, Worcester, New York Recruitment method: Students can apply if they have GPA >2.5 and family income <200 FPL; application process not specified, but estimate program serves 60-70 percent of eligible in Boston area; randomized wait list Participation incentives: None Counterfactual college enrollment: Any college 83 percent; 70 percent enrolled in four-year college
Average effects on college enrollment: 7.0 percentage points Two-year & Four-year: 10.3 percentage point effect on four-year enrollment; -3.4 percentage point effect on two-year enrollment Subgroups: larger effects for students with lower predicted college enrollment Other: Treated students are more likely to enroll in the targeted colleges and enroll in higher-quality colleges according to several measures
Upward Bound RCT Seftor, Mamun, & Schirm (2009) RCT Reanalysis Nathan (2013)
Summary: Part of the Federally-funded TRIO programs; multi-year, intensive college preparation program, including academic support and enrichment, academic remediation, test prep, summer sessions, support for application process. Run by local colleges; specifics vary by site Information: Early information about benefits of college and college application process Encouragement: Students are encouraged to prepare for college Academic Remediation/Test prep: This is a major part of the program Help: Unclear how much help students have with the college application process itself Incentives/Rewards: None Intensity: High Cost: over $5,000 per student per year
Note: There have been several evaluations of the same experiment, and in some cases they have come to different conclusions Academic achievement: Moderate/mixed; about 46 percent had 9th grade GPA above 2.5. Demographics/Income: Low income, first gen college, or both Timing: Starts as early as 9th grade, students participate up to 4 years Geography: National Recruitment method: Random assignment in oversubscribed programs. Some evidence that application standards were relaxed to ensure enough participation Participation incentives: None Counterfactual college enrollment: 79 percent (per MPR Horizons Study)
Average effects on college enrollment: Estimates depend on the analysis. Original MPR Horizons study finds no significant effect; Nathan re-analysis finds 2.9 percentage point increase in any post-secondary enrollment (significant at the 10 percent level) Two-year & Four-year: Effects on two-year and four-year enrollment are larger than effects on any enrollment. Suggest some shifting from certificate programs to 2- or 4-year college Subgroups: Nathan re-analysis finds that students who would not normally be eligible for UB benefited more; those with a higher GPA also benefited more Other: Larger effects on post-secondary completion than on enrollment
8
Program & Cite Program Characteristics Target Population and Setting for Study Evaluation Findings College Promise RCT and RD Avery (2013)
Summary: Two-year after-school program (junior and senior years) focusing on ACT preparation and help with college applications, financial aid, college choice, and transition to college Information: Information about college application process and benefits of applying to more selective colleges Encouragement: Encourages selective applications Academic Remediation/Test prep: ACT test prep; no other academic remediation Help: Hands-on help with test prep and applications Incentives/Rewards: N/A Intensity: High. Participants receive 320 hours of direct service over 2 years Cost: not reported, likely expensive
Academic achievement: GPA 2.0 or above Demographics/Income: Low-income, mostly URM (about 60% Hmong), mostly first-gen college; both RD and RCT targeted marginally eligible students Timing: apply sophomore year, participate junior and senior year Geography: Minneapolis/St Paul Recruitment method: Through high schools; details unknown Participation incentives: none Counterfactual college enrollment: 64% enrolled in any college; 30% enrolled in 2-year college
Average effects on college enrollment: RD estimates between 19 to 21 pp; IV estimates: 6.1 pp (not significant) overall Two-year & Four-year: RD estimates indicate increase is mostly for four-year enrollment. IV estimates suggest 16 pp increase in 4-year enrollment, similar effects for selective college enrollment Subgroups: sample too small for sub-group analysis Other: Spring enrollment estimates somewhat smaller and not always statistically significant; sample size is small
Advise TX Bettinger and Evans (2019)
Summary: School-wide, in-school, near-pear advisor provides assistance with college application process; part of College Advising Corp (CAC) Information: Advisor provides comprehensive information about college application process and choosing a college Encouragement: Advisors provide encouragement Academic Remediation/Test prep: Advisors encourage text prep but do not provide instruction or academic remediation Help: Advisors can assist with college applications Incentives/Rewards: None Intensity: Moderate. In-person help, but moderate/high counselor/student ratio depending on school size Cost: About $59,000 per school. Average size of senior class was 462, so if the program only served seniors (it focused on seniors but served others as well), cost averaged $128 per student
Academic achievement: Mixed; whole school Demographics/Income: Moderate/low income (about half qualify for FRPL); mostly URM (about half Hispanic, 20 percent Black/African American) Timing: Mostly focused on senior year, though advisors can help underclassman Geography: Throughout TX Recruitment method: School-level random assignment. Schools were screened for socioeconomic disadvantage, offered opportunity to apply; some additional screening by Advise TX staff; marginal schools were randomly assigned Participation incentives: None Counterfactual college enrollment: 56 percent enrolled in any college; 24 percent four-year college
Average effects on college enrollment: 1.1 percentage point increase in any college enrollment (statistically insignificant); three-year pooled effect of 0 Two-year & Four-year: Increases in enrollment observed in first year for two-year college (2.4 pp); no effects on four-year enrollment Subgroups: Larger effects on two-year college enrollment in first year for low-income (2.0 pp) and Hispanic (3.4 pp) students; marginally significant in some cases Other: Effects decline over the three years of the study; authors suggest crowd-out of in-school resources and availability of other programming over time may explain this pattern
9
Program & Cite Program Characteristics Target Population and Setting for Study Evaluation Findings LifeAfterHigh School Oreopoulos and Ford (2019)
Summary: School-wide, in-school program consisting mainly of three supervised sessions in a computer lab using program website; sessions focused on encouraging students to consider college/providing information, filling out applications, and filling out financial aid forms Information: First session provided information about colleges, how to pay for college, how to apply, and where to look for more information Encouragement: The curriculum encouraged students to keep their options open Academic Remediation/Test prep: None Help: Program and school staff helped with college or financial applications during the sessions; school counselors were encouraged to provide individual help afterward to students who did not attend a workshop or did not finish an application during the workshop Incentives/Rewards: Program paid application fees Intensity: Low. In-person help, but only three sessions Cost: $200 per student
Academic achievement: Mixed; whole school Demographics/Income: The program served disadvantaged Ontario schools Timing: Senior year during application process Geography: Ontario Canada Recruitment method: School-level random assignment. Schools were screened for low postsecondary-transition rates and being within commuting distance to a college Participation incentives: None Counterfactual college enrollment: 23 percent enrolled in a two-year college; 21% percent enrolled in a four-year college (Grade 12 students with >=21 credits)
Average effects on college enrollment: 4.4 percentage point increase in any postsecondary enrollment Two-year & Four-year: Effects are only statistically significant for “college” (two-year, often career-oriented) rather than “university” (four-year) enrollment Subgroups: Larger effects for students not on track for “university,” consistent with larger effects on college compared to University; otherwise similar effects across groups
H&R Block FAFSA Bettinger et al. (2012)
Summary: In Treatment 1, tax professionals helped fill out FAFSA at H&R Block as part of tax preparation; in Treatment 2, tax professionals offered written, personalized aid estimates and encouraged FAFSA completion Information: Both treatments provided information about costs at nearby colleges and implicitly provided information about the role of FAFSA in claiming financial aid Encouragement: Minimal; tax professionals focused on FAFSA only Academic Remediation/Test prep: None Help: In treatment 1, completed and submitted FAFSA where possible; otherwise sent partially complete form to home address; In treatment 2, there was no help Incentives/Rewards: None Intensity: Low. Filled out FAFSA only Cost: $88 per participant (circa 2010$)
Academic achievement: No screen Demographics/Income: AGI less than $45,000; focus on two groups: (1) families with a 17- year-old dependent and (2) independent adults age 24-30 with HS degree and no prior college experience Timing: Tax filing time (Spring); note that Ohio has one rolling admission selective four-year college where seniors could still apply Geography: Ohio and North Carolina Recruitment method: Screen clients in tax preparers office based on family structure and income Participation incentives: $20 Counterfactual college enrollment: For dependents, 34% any college (16% four-year, 18% two-year); for independent adults, 9.5% (3.1% four-year, 6.2% two-year)
Average effects on college enrollment: 8.1 pp (p<.05) increase and 1.5 pp (p<.05) increase in any college enrollment for dependents and independent adults, respectively Two-year & Four-year: Dependents: 3.7 pp and 4.7 pp increase for four- and two-year college, respectively. For independent adults, point estimates suggest mostly two-year, but imprecise Subgroups: N/A Other: Marginal students persist to second year at same rate as average student
10
Program & Cite Program Characteristics Target Population and Setting for Study Evaluation Findings Summer Melt Interventions Castleman, Page, and Schooley (2014) Castleman and Page (2014) Note we exclude Castleman, Arnold, and Wartman (2012) since it has a small sample (N=162)
Summary: Series of interventions focused on getting students who intend to enroll in college at the end of senior year to actually enroll in the fall; most versions of the intervention use text messaging to direct students to additional information and/or counselors who can help them with summertime paperwork in person or by phone Information: Information about summertime tasks and deadlines Encouragement: Encouragement to complete the process and enroll in college Academic Remediation/Test prep: None Help: Some versions include an option to get hand-on help with financial aid forms and other tasks; some versions offer less-intensive help by phone Incentives/Rewards: None Intensity: Low/moderate Cost: Text-only: $7 per student; versions with advisors or peer mentors $80-200
Academic achievement: Broad; varies depending on study Demographics/Income: Broad; some versions more focused on low-income students Timing: Summer before on-time college enrollment Geography: Sites in Massachusetts; Fulton County, GA; Dallas, TX Recruitment method: Some versions use sample of students who participated in counseling programs prior to summer; Dallas and Fulton studies draw sample based on administrative data Participation incentives: None Counterfactual college enrollment: 60 to 80% overall
Average effects on college enrollment: Between null and 7 percentage points, depending on sample Two-year & Four-year: Not always specified separately; in some studies, effects appear to be larger for two-year than four-year enrollment Subgroups: Effects tend to be larger for low-income students and especially those who have not already filled out the FAFSA prior to treatment Other: Studies where treatment includes significant financial aid help tend to have larger effects
MI Statewide Light Touch Hyman (2019)
Summary: Sent letter from Michigan Department of Education encouraging students to access one of two existing websites providing information about college; varied wording of letter in different treatment arms Information: Students were directed to existing public websites Encouragement: Encouraged students to apply; mentioned the recommendation was based on ACT scores Academic Remediation/Test prep: None Help: None Incentives/Rewards: None Intensity: Very low Cost: 50 cents per student
Academic achievement: High-achieving. Above median ACT score. Average grade 11 GPA of 3.20. Demographics/Income: Not selected for demographics; sample is 74 percent white and 43 percent economically disadvantaged Timing: Fall of senior year Geography: Michigan Recruitment method: Sample identified using administrative data; students did not have to sign up Participation incentives: None Counterfactual college enrollment: 84 percent enrolled in any college, 68 percent in four-year
Average effects on college enrollment: Precise null Two-year & Four-year: No effect on any type of enrollment on average Subgroups: Effects on four-year enrollment appear larger for economically disadvantaged, but are still small (1.7 percentage points) Other: Results on take up suggest all students are concerned about affordability and that economically disadvantaged and higher achieving students may have more unmet need for information
11
Program & Cite Program Characteristics Target Population and Setting for Study Evaluation Findings Expanding College Opportunities (ECO) Hoxby and Turner (2013)
Summary: Mail-based information intervention targeted to high-achieving, low-income students Information: Main/comprehensive intervention included information about application strategies, deadlines, college graduation rates, financial aid and net costs as selected colleges, fee waiver instructions Encouragement: Information mostly designed to encourage seeking of additional information, particularly about selective colleges Academic Remediation/Test prep: None Help: Fee waivers and blank Common Application Incentives/Rewards: None Intensity: Low Cost: $6 per participant
Academic achievement: High; participating students were in the top 10% of the SAT/ACT distribution Demographics/Income: Bottom third of the income distribution for families with a 12th grader (and not attending a feeder school) Timing: Junior/senior year Geography: National; focused on schools where not many students go to selective colleges Recruitment method: Uses administrative data from College Board and ACT to identify participants in the study; students did not have to opt in Participation incentives: Payments for survey completion. Counterfactual college enrollment: Does not look at any enrollment as an outcome; almost all of the control group attended at least some college
Average effects on college enrollment: not reported Two-year & Four-year: not reported Subgroups: Larger effects for targeted students than for higher income students or those attending feeder schools Other: Goal was to increase the selectivity of where students applied and enrolled; treatment was effective at achieving this according to several measures; comprehensive program was most effective; intervention focused on information about net costs was more effective before information on net costs was more widely available online
College Board BigFuture Gurantz et al. (2019a)
Summary: Main treatment is mailers with information about applying to college, including “starter list”; some students also received information by text message or email, a small dose of virtual advising, and/or free score sends Information: Information about the application process, how to construct an application portfolio, starter list of colleges; encouraged to go to BigFuture website for more information Encouragement: Materials provided some encouragement, but mostly was not personalized Academic Remediation/Test prep: None Help: None Incentives/Rewards: None; additional free SAT score sends in some treatment arms Intensity: Low Cost: Cost not reported, but inexpensive
Academic achievement: “On-Track” for enrollment in a four-year college (top 50 percent of SAT/PSAT scores) and “High-Achieving” (top 10 percent) Demographics/Income: Low-income (incomes below $40,000 or $58,000, depending on cohort) and moderate income (income below $77,000) Timing: Summer before and during 12th grade Geography: National Recruitment method: Sample selected based on SAT/PSAT scores and other information; students did not have to sign up Participation incentives: None Counterfactual college enrollment: 65 percent enrolled in four-year college, 12 percent in two-year college
Average effects on college enrollment: Precise zero. Two-year & Four-year: No effects on either margin Subgroups: No effects on enrollment for any sub-groups Other: Some effects on SAT score-sending (particularly for intervention that made sending more scores free) and possibly college quality for African Americans and Hispanics
12
Program & Cite Program Characteristics Target Population and Setting for Study Evaluation Findings HAIL Dynarski et al. (2018)
Summary: Collaboration with University of Michigan admissions to recruit high-achieving low-income students to UM; mailer informed students about financial aid, offered a full four-year scholarship, let students know they could succeed at an elite university, and encouraged them to apply to UM; information also emailed to parents and high school principals. Information: Information about financial aid and the University of Michigan. Encouragement: Encouraged students to believe they could succeed at an elite university Academic Remediation/Test prep: None Help: None, but students were offered a scholarship and told they didn’t have to fill out FAFSA or CSS, though they were encouraged to do so to get the most aid Incentives/Rewards: Guaranteed four-year scholarship valued at $60,000, though most students would have qualified for similar aid Intensity: Low Cost: Mailer was $10 per student; some addition cost in extra financial aid due to mis-targeting (not yet reported)
Academic achievement: High-achieving: average GPA of 3.8 and average SAT score of 1257 Demographics/Income: Low-income: 70 percent qualified for free lunch and 30 percent for reduced-price lunch; mostly white and Asian (84 percent) Timing: Packet was sent in September of the senior year in high school Geography: Michigan Recruitment method: Random assignment at the school-level; student eligibility determined using administrative data Participation incentives: None Counterfactual college enrollment: Main margin of interest is enrollment in UM/selective college. Control mean for UM enrollment was 10.7 percent; Control means for any college and four-year college were 79.1 percent and 67.5 percent, respectively
Average effects on college enrollment: 3.9 pp (marginally significant) effect on any enrollment Two-year & Four-year: 7.4 percentage point increase in four-year enrollment, 3.5 percentage point reduction in two-year enrollment. Large effects on enrollment in selective colleges (entirely UM): 14.6 percentage point increase Subgroups: Subgroup estimates are for UM enrollment; larger effects for rural areas, females, whites and Asians, free (rather than reduced price) lunch eligible Other: Improvements in four-year college persistence to second year for first cohort
Nudging at Scale Bird et al. (2019)
Summary: Two experiments focused on encouraging students to complete FAFSA via email, text message, and regular mail; some students received an offer of one-on-one advising Information: Advisors could provide additional info Encouragement: Encouraged students to complete FAFSA Academic Remediation/Test prep: None Help: None Incentives/Rewards: None Intensity: Low Cost: Not reported
Academic achievement: Common App sample is relatively high achieving (average SAT of 1104); Large State sample more mixed Demographics/Income: Low and moderate income Timing: During senior year Geography: National and one large state Recruitment method: Sample identified using administrative data; students did not have to sign up Participation incentives: None Counterfactual college enrollment: 82 (49) percent enrolled in any college for Common App (Large State) sample; 73 (29) percent in four-year
Average effects on college enrollment: Precise null Two-year & Four-year: No effect on any type of enrollment on average Subgroups: No effects for any subgroup or treatment arm Other: No effect on filing FAFSA where it can be measured in Large State, even though control mean is only 43.6 percent. FAFSA filing not observed in Common App sample
13
Program & Cite Program Characteristics Target Population and Setting for Study Evaluation Findings CollegePoint Studies A. Gurantz et al. (2019b) B. Sullivan, Castleman, and Bettinger (2019)
Note: These are separate studies of similar interventions, so we summarize them together here Summary: Students offered access to a virtual advisor through CollegePoint; advising focused on getting students to apply to specific CollegePoint colleges Information: Comprehensive information about applying to college, with particular emphasis on high-graduation rate CollegePoint colleges Encouragement: Not specifically reported Academic Remediation/Test prep: None Help: Not specifically reported Incentives/Rewards: None Intensity: Medium Cost: Not reported
Academic achievement: High-achieving; average SAT/ACT score around 95th percentile Demographics/Income: Low and moderate income Timing: Late junior or early senior year Geography: National Recruitment method: Sample identified using administrative data; students did not have to sign up Participation incentives: None Counterfactual college enrollment: 87 percent attended some college in both studies, mostly four-year (83 percent in study A, not reported in study B).
Average effects on college enrollment: No effect on overall enrollment Two-year & Four-year: No effect on two-year or four-year margin. Study A shows increase in enrollment in CollegePoint colleges of 2.7 percentage points; Study B shows marginally significant increase of 1.5 percentage points in enrollment in selective colleges Subgroups: Study A finds similar effects for low and middle income students
14
References for Appendix A
Avery, Christopher. 2013. “Evaluation of the College Possible Program: Results from a
Randomized Controlled Trial.” NBER Working Paper 19562.
Avery, Christopher, Benjamin L. Castleman, Michael Hurwitz, Bridget T. Long, and Lindsay C.
Page. 2020. “Digital Messaging to Improve College Enrollment and Success.” NBER Working
Paper 27897.
Barr, Andrew, and Benjamin Castleman. 2018. “An Engine of Economic Opportunity: Intensive
Advising, College Success, and Social Mobility.”
(http://people.tamu.edu/~abarr/BL_shell_6_6_2018.pdf)
Bettinger, Eric P., and Brent J. Evans. 2019. “College Guidance for All: A Randomized
Experiment in Pre-College Advising.” Journal of Policy Analysis and Management 38 (3):
579–99.
Bettinger, Eric, Bridgette Terry Long, Philip Oreopoulos, and Lisa Sanbonmatsu. 2012. “The
Role of Application Assistance and Information in College Decisions: Results from the H&R
Block FAFSA Experiment.” The Quarterly Journal of Economics 127 (3):1205–42.
Bird, Kelli A., Benjamin L. Castleman, Jeffrey T. Denning, Joshua Goodman, Cait Lamberton,
and Kelly Ochs Rosinger. 2019. “Nudging at Scale: Experimental Evidence from FAFSA
Completion Campaigns.” Annenberg Institute at Brown University Working Paper.
Bos, Johannes M., Jacqueline Berman, Thomas J. Kane, and Fannie M. Tseng. 2012. “The
Impacts of SOURCE: A Program to Support College Enrollment through Near-Peer, Low-Cost
Student Advising.” Draft paper presented at the Association for Public Policy and
Management annual meeting.
Carrell, Scott, and Bruce Sacerdote. 2017. “Why do College-Going Interventions Work?”
15
American Economic Journal: Applied Economics 9 (3): 124–51.
Castleman, Benjamin L., Karen Arnold, and Katherine Lynk Wartman. 2012. “Stemming the
Tide of Summer Melt: An Experimental Study of the Effects of Post-High School Summer
Intervention on Low-Income Students’ College Enrollment.” Journal of Research on
Educational Effectiveness 5 (1): 1-17.
Castleman, Benjamin L., and Lindsay C. Page. 2014. Summer Melt: Supporting Low-Income
Students Through the Transition to College. Cambridge, MA: Harvard Education Press.
Castleman, Benjamin L., Lindsay C. Page, and Korynn Schooley. 2014. “The Forgotten
Summer: Does the Offer of College Counseling After High School Mitigate Summer Melt
among College-Intending, Low-Income High School Graduates?” Journal of Policy Analysis
and Management 33 (2): 320–44.
Dynarski, Susan, C. J. Libassi, Katherine Michelmore, and Stephanie Owen. 2018. “Closing the
Gap: The Effect of a Targeted, Tuition-Free Promise on College Choices of High-Achieving,
Low-Income Students.” NBER Working Paper 25349.
Gurantz, Oded, Jessica Howell, Mike Hurwitz, Cassandra Larson, Matea Pender, and Brooke
White. 2019a. “Realizing Your College Potential? Impacts of College Board’s RYCP
Campaign on Postsecondary Enrollment.” Annenberg Institute at Brown University Working
Paper.
Gurantz, Oded, Matea Pender, Zachary Mabel, Cassandra Larson, and Eric Bettinger. 2019b.
“Virtual Advising for High-Achieving High School Students.” Annenberg Institute at Brown
University Working Paper.
Hoxby, Caroline, and Sarah Turner. 2013. “Expanding College Opportunities for High-
Achieving, Low Income Students.” Stanford Institute for Economic Policy Research
Discussion Paper 12-014.
16
Hyman, Joshua. 2020. “Can Light-Touch College-Going Interventions Make a Difference?
Evidence from a Statewide Experiment in Michigan.” Journal of Policy Analysis and
Management 39 (1): 159–90.
Nathan, Alan. 2013. Does Upward Bound Have an Effect on Student Educational Outcomes? A
Reanalysis of the Horizons Randomized Controlled Trial Study. Dissertation, University of
Wisconsin, Madison.
Oreopoulos, Philip and Reuben Ford. 2019. “Keeping College Options Open: A Field
Experiment to Help All High School Seniors through the College Application Process:
Keeping College Options Open.” Journal of Policy Analysis and Management 38 (2): 426–54.
Seftor, Neil S., Arif Mamun, and Allen Schirm. 2009. The Impacts of Regular Upward Bound on
Postsecondary Outcomes Seven to Nine Years After Scheduled High School Graduation Final
Report. Mathematica Policy Research, Inc.
Sullivan, Zach, Benjamin L. Castleman, and Eric Bettinger. 2019. “College Advising at a
National Scale: Experimental Evidence from the CollegePoint Initiative.” Annenberg Institute
at Brown University Working Paper.
17
APPENDIX B. MEASURES OF INFORMATION AND SUPPORT This appendix describes how we constructed the measures of how much information and support students reported having during the college application process (Table 5 of the paper). We constructed three measures based on questions asked of both treatment and control students on the Follow-up Survey. For each of the measures, we standardized each item and averaged across all the items for that domain. We then re-standardized the index to have a mean of 0 and a standard deviation of 1 in the control group.
The “Sought Information” construct is based on responses to the following series of 14 questions. The answer options were categorical, and we assigned numerical values to them (in parentheses): Never (0), Once or twice (1.5), Three or four times (3.5), and Five or more times (5).
“Including the summer before your senior year and your senior year, about how often did you do the following things?”
1. Visited a college campus 2. Attended a college fair 3. Talked with the counselor at my school about financial aid or applying to college 4. Talked to my teacher(s) about financial aid or applying to college 5. Talked with someone from a college access program or organization about financial aid
or applying to college 6. Visited websites to learn about financial aid or applying to college 7. Read books or other printed information about financial aid or applying to college 8. Visited specific colleges' websites 9. Read brochures or booklets about specific colleges 10. Talked about a specific college with someone who attends (or attended) that college 11. Read printed, emailed, or text messaged information about college or financial aid
provided by a college access program or organization 12. Talked with someone my family paid to help me with the college application process 13. Talked with someone in my family about whether or where I should go to college 14. Talked with someone in my family about how much college costs or how I would pay for
college
The “Had Information” construct is based on responses to the following 21 questions (numeric values assigned to categorical responses in parentheses).
1. In general, how well-informed did you feel throughout the college application process and as you made your decisions about college? Very well-informed (5), Well-informed (4), Somewhat well-informed (3), A little well-informed (2), Not well-informed at all (1)
2. Thinking about both the summer before your senior year and your senior year, how true were the following things about you? Very true (5), Mostly true (4), Somewhat true (3), A little true (2), Not at all true (1)
a. I knew when SAT deadlines were coming up b. I knew when ACT deadlines were coming up c. I knew when college application deadlines were coming up
18
d. I knew how to find and fill out college applications e. I knew when financial aid application deadlines were coming up f. I knew how to find and fill out financial aid applications
3. Thinking about both the summer before your senior year and your senior year, how true were the following things about you? It was easy for me to get information about: Very true (5), Mostly true (4), Somewhat true (3), A little true (2), Not at all true (1)
a. How to improve my SAT score b. How to use a calculator for the SAT c. How to write a better SAT essay d. Which questions to skip on the SAT e. How to improve my GPA for college applications f. Non-academic ways to increase my chances of getting into a good college g. The colleges I would probably be able to get into h. Which colleges I should apply to i. How to find and fill out college applications j. How to write a good application essay k. How to find and fill out financial aid forms l. The scholarships I should apply for m. What my financial aid offers meant n. How to choose which college to attend
The “Had Support” construct is based on responses to the following 16 questions (numeric values assigned to categorical responses in parentheses).
Thinking about both the summer before your senior year and your senior year, how true were the following things about you? I had someone who: Very true (5), Mostly true (4), Somewhat true (3), A little true (2), Not at all true (1). On this set of questions, students had the option of answering “I did not need help with this.” If students selected that response, we excluded that item from the index for that student.
1. Kept me motivated to do the work needed to apply to college 2. Helped me sign up for the SAT 3. Helped me study for the SAT 4. Helped me decide which high school courses to take to meet college requirements 5. Helped me choose colleges to apply to 6. Encouraged me to apply to better colleges than I initially thought I would apply to 7. Helped me write/rewrite college application essays 8. Helped me fill out college applications 9. Helped me fill out financial aid forms 10. Helped me find and apply for scholarships 11. Reminded me to turn in college applications 12. Reminded me to turn in financial aid applications 13. Made sure I turned in college applications 14. Made sure I turned in financial aid applications 15. Helped me choose which college to enroll in

19
16. Helped me convince my parents to let me go to the college I wanted to go to
20
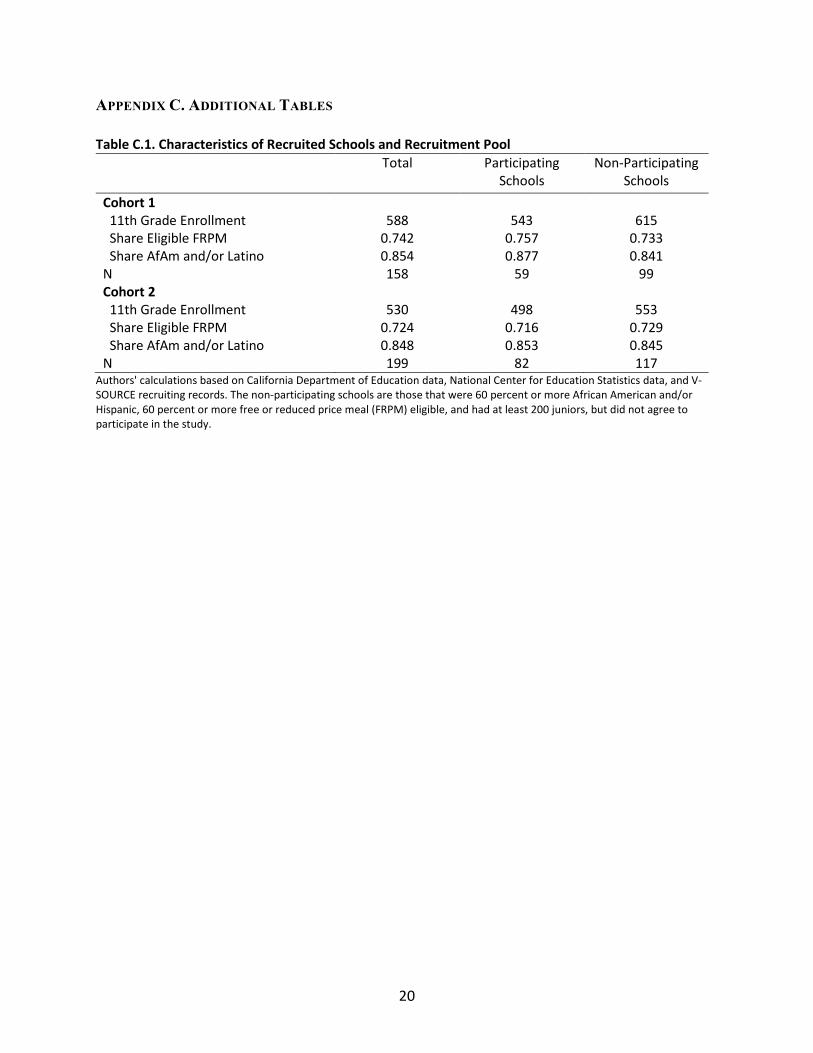
APPENDIX C. ADDITIONAL TABLES Table C.1. Characteristics of Recruited Schools and Recruitment Pool
Total Participating Schools
Non-Participating Schools
Cohort 1 11th Grade Enrollment 588 543 615 Share Eligible FRPM 0.742 0.757 0.733 Share AfAm and/or Latino 0.854 0.877 0.841 N 158 59 99 Cohort 2 11th Grade Enrollment 530 498 553 Share Eligible FRPM 0.724 0.716 0.729 Share AfAm and/or Latino 0.848 0.853 0.845 N 199 82 117
Authors' calculations based on California Department of Education data, National Center for Education Statistics data, and V-SOURCE recruiting records. The non-participating schools are those that were 60 percent or more African American and/or Hispanic, 60 percent or more free or reduced price meal (FRPM) eligible, and had at least 200 juniors, but did not agree to participate in the study.
21
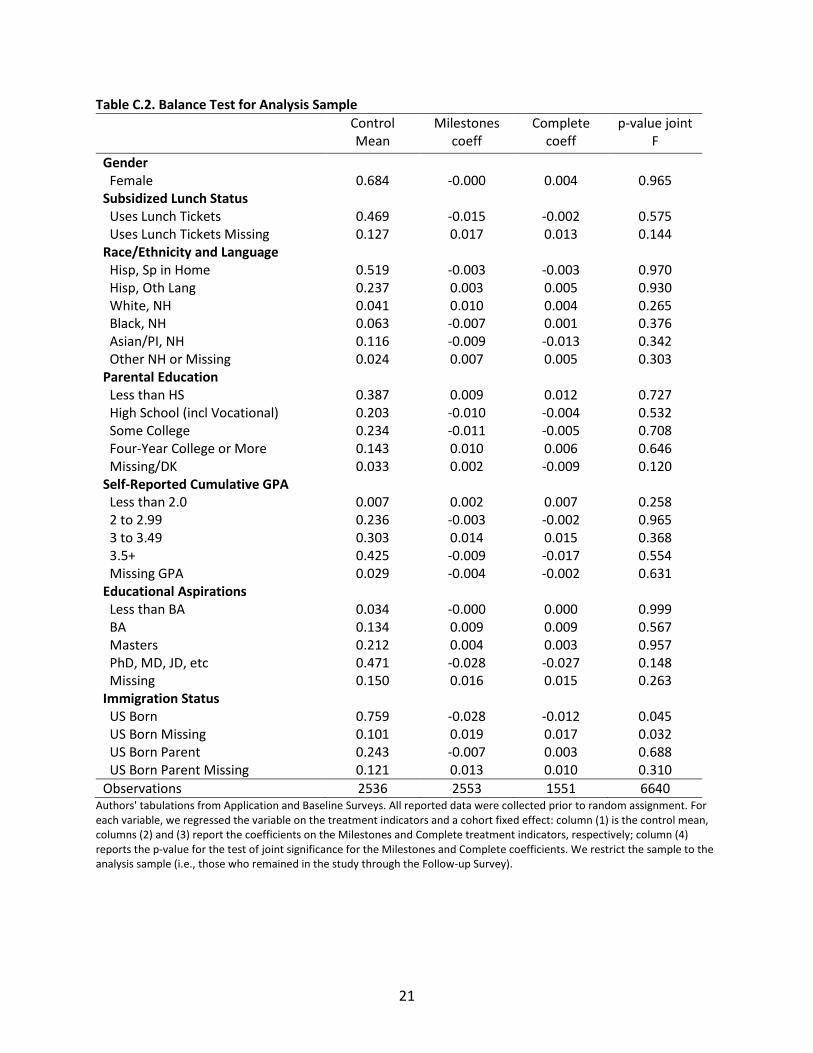
Table C.2. Balance Test for Analysis Sample Control
Mean Milestones
coeff Complete
coeff p-value joint
F
Gender Female 0.684 -0.000 0.004 0.965 Subsidized Lunch Status Uses Lunch Tickets 0.469 -0.015 -0.002 0.575 Uses Lunch Tickets Missing 0.127 0.017 0.013 0.144 Race/Ethnicity and Language Hisp, Sp in Home 0.519 -0.003 -0.003 0.970 Hisp, Oth Lang 0.237 0.003 0.005 0.930 White, NH 0.041 0.010 0.004 0.265 Black, NH 0.063 -0.007 0.001 0.376 Asian/PI, NH 0.116 -0.009 -0.013 0.342 Other NH or Missing 0.024 0.007 0.005 0.303 Parental Education Less than HS 0.387 0.009 0.012 0.727 High School (incl Vocational) 0.203 -0.010 -0.004 0.532 Some College 0.234 -0.011 -0.005 0.708 Four-Year College or More 0.143 0.010 0.006 0.646 Missing/DK 0.033 0.002 -0.009 0.120 Self-Reported Cumulative GPA Less than 2.0 0.007 0.002 0.007 0.258 2 to 2.99 0.236 -0.003 -0.002 0.965 3 to 3.49 0.303 0.014 0.015 0.368 3.5+ 0.425 -0.009 -0.017 0.554 Missing GPA 0.029 -0.004 -0.002 0.631 Educational Aspirations Less than BA 0.034 -0.000 0.000 0.999 BA 0.134 0.009 0.009 0.567 Masters 0.212 0.004 0.003 0.957 PhD, MD, JD, etc 0.471 -0.028 -0.027 0.148 Missing 0.150 0.016 0.015 0.263 Immigration Status US Born 0.759 -0.028 -0.012 0.045 US Born Missing 0.101 0.019 0.017 0.032 US Born Parent 0.243 -0.007 0.003 0.688 US Born Parent Missing 0.121 0.013 0.010 0.310 Observations 2536 2553 1551 6640
Authors' tabulations from Application and Baseline Surveys. All reported data were collected prior to random assignment. For each variable, we regressed the variable on the treatment indicators and a cohort fixed effect: column (1) is the control mean, columns (2) and (3) report the coefficients on the Milestones and Complete treatment indicators, respectively; column (4) reports the p-value for the test of joint significance for the Milestones and Complete coefficients. We restrict the sample to the analysis sample (i.e., those who remained in the study through the Follow-up Survey).
22
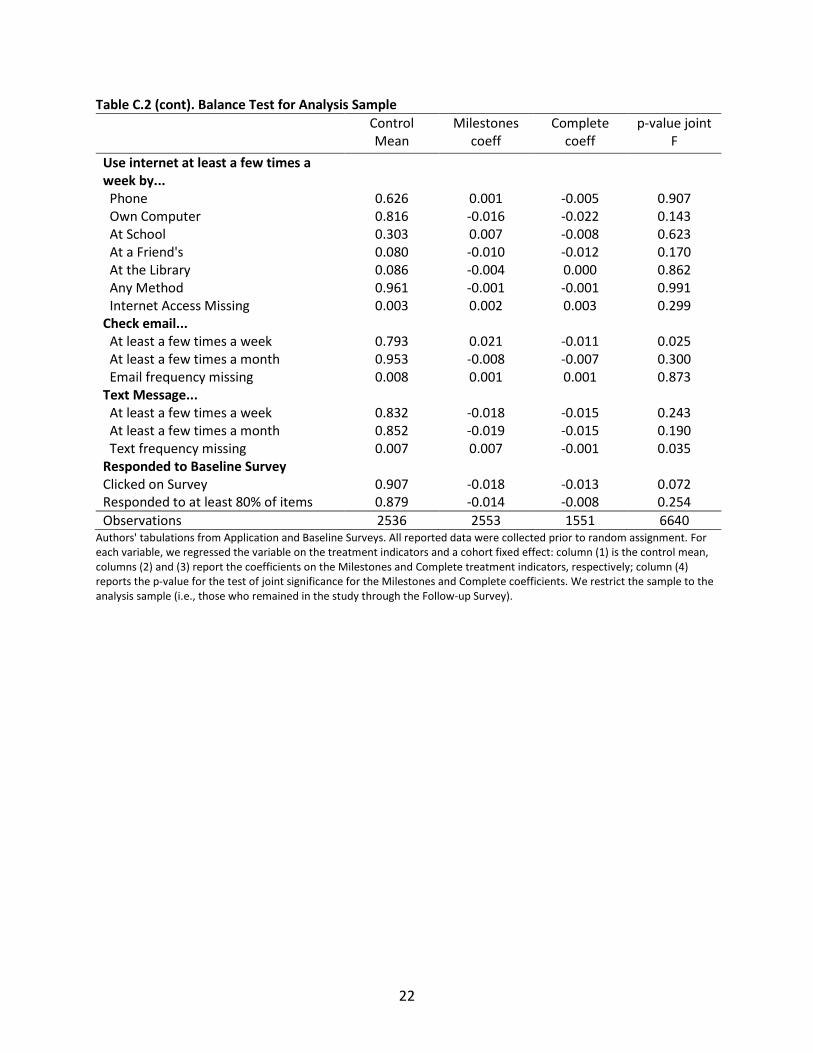
Table C.2 (cont). Balance Test for Analysis Sample Control
Mean Milestones
coeff Complete
coeff p-value joint
F
Use internet at least a few times a week by...
Phone 0.626 0.001 -0.005 0.907 Own Computer 0.816 -0.016 -0.022 0.143 At School 0.303 0.007 -0.008 0.623 At a Friend's 0.080 -0.010 -0.012 0.170 At the Library 0.086 -0.004 0.000 0.862 Any Method 0.961 -0.001 -0.001 0.991 Internet Access Missing 0.003 0.002 0.003 0.299 Check email... At least a few times a week 0.793 0.021 -0.011 0.025 At least a few times a month 0.953 -0.008 -0.007 0.300 Email frequency missing 0.008 0.001 0.001 0.873 Text Message... At least a few times a week 0.832 -0.018 -0.015 0.243 At least a few times a month 0.852 -0.019 -0.015 0.190 Text frequency missing 0.007 0.007 -0.001 0.035 Responded to Baseline Survey Clicked on Survey 0.907 -0.018 -0.013 0.072 Responded to at least 80% of items 0.879 -0.014 -0.008 0.254 Observations 2536 2553 1551 6640
Authors' tabulations from Application and Baseline Surveys. All reported data were collected prior to random assignment. For each variable, we regressed the variable on the treatment indicators and a cohort fixed effect: column (1) is the control mean, columns (2) and (3) report the coefficients on the Milestones and Complete treatment indicators, respectively; column (4) reports the p-value for the test of joint significance for the Milestones and Complete coefficients. We restrict the sample to the analysis sample (i.e., those who remained in the study through the Follow-up Survey).
23
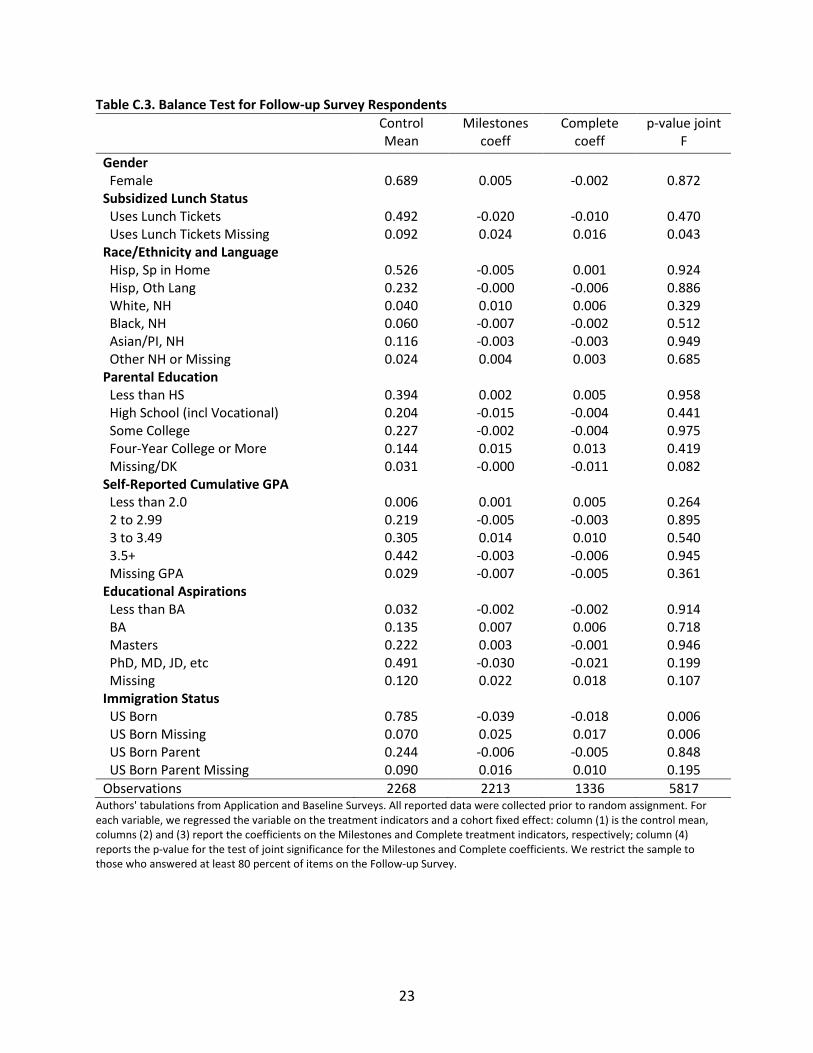
Table C.3. Balance Test for Follow-up Survey Respondents Control
Mean Milestones
coeff Complete
coeff p-value joint
F
Gender Female 0.689 0.005 -0.002 0.872 Subsidized Lunch Status Uses Lunch Tickets 0.492 -0.020 -0.010 0.470 Uses Lunch Tickets Missing 0.092 0.024 0.016 0.043 Race/Ethnicity and Language Hisp, Sp in Home 0.526 -0.005 0.001 0.924 Hisp, Oth Lang 0.232 -0.000 -0.006 0.886 White, NH 0.040 0.010 0.006 0.329 Black, NH 0.060 -0.007 -0.002 0.512 Asian/PI, NH 0.116 -0.003 -0.003 0.949 Other NH or Missing 0.024 0.004 0.003 0.685 Parental Education Less than HS 0.394 0.002 0.005 0.958 High School (incl Vocational) 0.204 -0.015 -0.004 0.441 Some College 0.227 -0.002 -0.004 0.975 Four-Year College or More 0.144 0.015 0.013 0.419 Missing/DK 0.031 -0.000 -0.011 0.082 Self-Reported Cumulative GPA Less than 2.0 0.006 0.001 0.005 0.264 2 to 2.99 0.219 -0.005 -0.003 0.895 3 to 3.49 0.305 0.014 0.010 0.540 3.5+ 0.442 -0.003 -0.006 0.945 Missing GPA 0.029 -0.007 -0.005 0.361 Educational Aspirations Less than BA 0.032 -0.002 -0.002 0.914 BA 0.135 0.007 0.006 0.718 Masters 0.222 0.003 -0.001 0.946 PhD, MD, JD, etc 0.491 -0.030 -0.021 0.199 Missing 0.120 0.022 0.018 0.107 Immigration Status US Born 0.785 -0.039 -0.018 0.006 US Born Missing 0.070 0.025 0.017 0.006 US Born Parent 0.244 -0.006 -0.005 0.848 US Born Parent Missing 0.090 0.016 0.010 0.195 Observations 2268 2213 1336 5817
Authors' tabulations from Application and Baseline Surveys. All reported data were collected prior to random assignment. For each variable, we regressed the variable on the treatment indicators and a cohort fixed effect: column (1) is the control mean, columns (2) and (3) report the coefficients on the Milestones and Complete treatment indicators, respectively; column (4) reports the p-value for the test of joint significance for the Milestones and Complete coefficients. We restrict the sample to those who answered at least 80 percent of items on the Follow-up Survey.
24
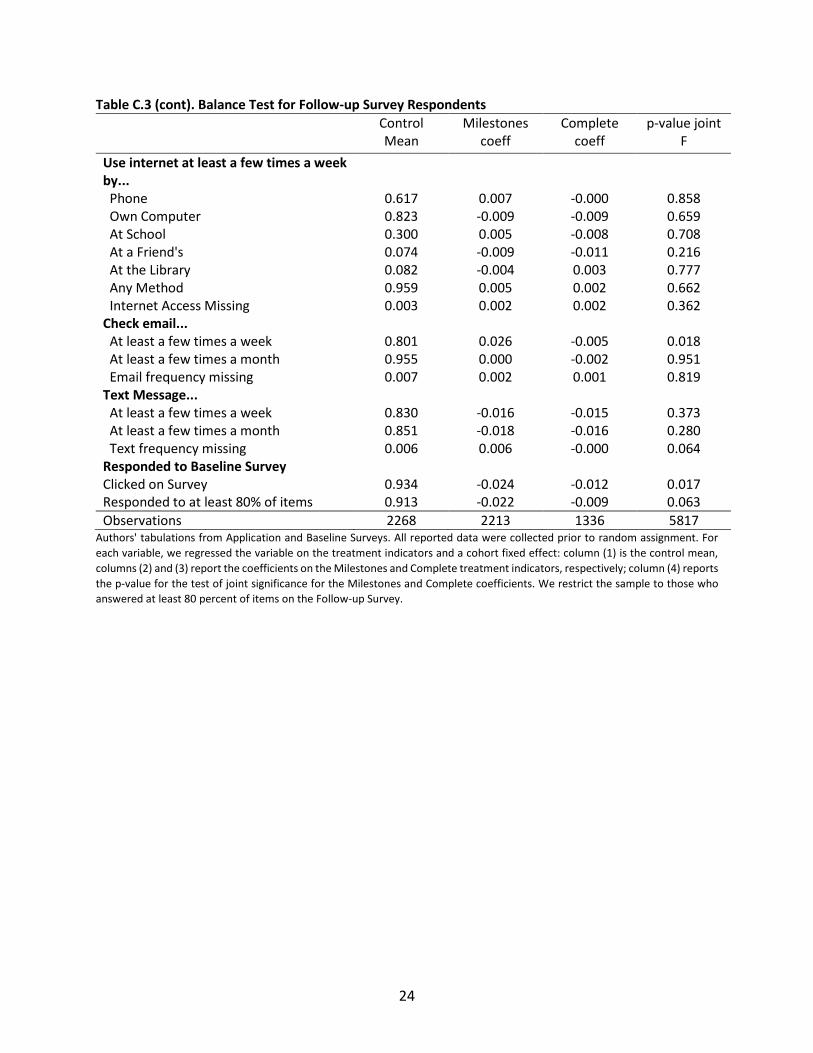
Table C.3 (cont). Balance Test for Follow-up Survey Respondents Control
Mean Milestones
coeff Complete
coeff p-value joint
F
Use internet at least a few times a week by...
Phone 0.617 0.007 -0.000 0.858 Own Computer 0.823 -0.009 -0.009 0.659 At School 0.300 0.005 -0.008 0.708 At a Friend's 0.074 -0.009 -0.011 0.216 At the Library 0.082 -0.004 0.003 0.777 Any Method 0.959 0.005 0.002 0.662 Internet Access Missing 0.003 0.002 0.002 0.362 Check email... At least a few times a week 0.801 0.026 -0.005 0.018 At least a few times a month 0.955 0.000 -0.002 0.951 Email frequency missing 0.007 0.002 0.001 0.819 Text Message... At least a few times a week 0.830 -0.016 -0.015 0.373 At least a few times a month 0.851 -0.018 -0.016 0.280 Text frequency missing 0.006 0.006 -0.000 0.064 Responded to Baseline Survey Clicked on Survey 0.934 -0.024 -0.012 0.017 Responded to at least 80% of items 0.913 -0.022 -0.009 0.063 Observations 2268 2213 1336 5817
Authors' tabulations from Application and Baseline Surveys. All reported data were collected prior to random assignment. For each variable, we regressed the variable on the treatment indicators and a cohort fixed effect: column (1) is the control mean, columns (2) and (3) report the coefficients on the Milestones and Complete treatment indicators, respectively; column (4) reports the p-value for the test of joint significance for the Milestones and Complete coefficients. We restrict the sample to those who answered at least 80 percent of items on the Follow-up Survey.
25
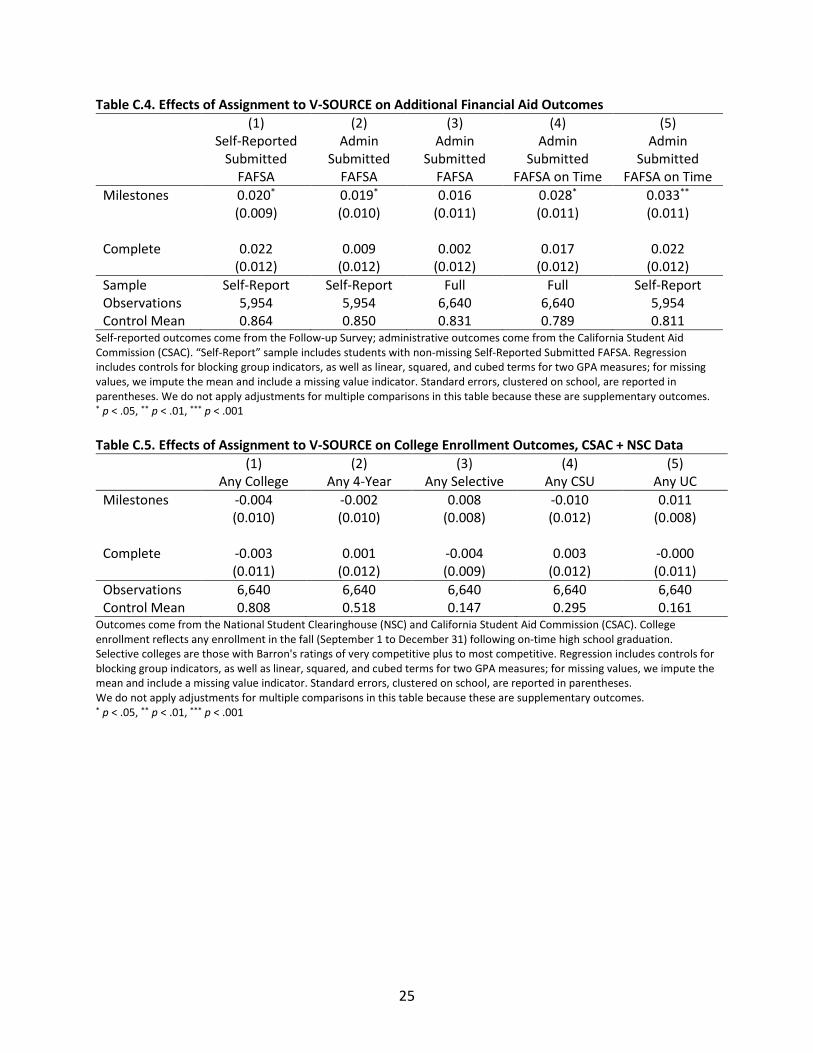
Table C.4. Effects of Assignment to V-SOURCE on Additional Financial Aid Outcomes (1) (2) (3) (4) (5) Self-Reported
Submitted FAFSA
Admin Submitted
FAFSA
Admin Submitted
FAFSA
Admin Submitted
FAFSA on Time
Admin Submitted
FAFSA on Time Milestones 0.020* 0.019* 0.016 0.028* 0.033** (0.009) (0.010) (0.011) (0.011) (0.011) Complete 0.022 0.009 0.002 0.017 0.022 (0.012) (0.012) (0.012) (0.012) (0.012) Sample Self-Report Self-Report Full Full Self-Report Observations 5,954 5,954 6,640 6,640 5,954 Control Mean 0.864 0.850 0.831 0.789 0.811
Self-reported outcomes come from the Follow-up Survey; administrative outcomes come from the California Student Aid Commission (CSAC). “Self-Report” sample includes students with non-missing Self-Reported Submitted FAFSA. Regression includes controls for blocking group indicators, as well as linear, squared, and cubed terms for two GPA measures; for missing values, we impute the mean and include a missing value indicator. Standard errors, clustered on school, are reported in parentheses. We do not apply adjustments for multiple comparisons in this table because these are supplementary outcomes. * p < .05, ** p < .01, *** p < .001 Table C.5. Effects of Assignment to V-SOURCE on College Enrollment Outcomes, CSAC + NSC Data
(1) (2) (3) (4) (5) Any College Any 4-Year Any Selective Any CSU Any UC Milestones -0.004 -0.002 0.008 -0.010 0.011 (0.010) (0.010) (0.008) (0.012) (0.008) Complete -0.003 0.001 -0.004 0.003 -0.000 (0.011) (0.012) (0.009) (0.012) (0.011) Observations 6,640 6,640 6,640 6,640 6,640 Control Mean 0.808 0.518 0.147 0.295 0.161
Outcomes come from the National Student Clearinghouse (NSC) and California Student Aid Commission (CSAC). College enrollment reflects any enrollment in the fall (September 1 to December 31) following on-time high school graduation. Selective colleges are those with Barron's ratings of very competitive plus to most competitive. Regression includes controls for blocking group indicators, as well as linear, squared, and cubed terms for two GPA measures; for missing values, we impute the mean and include a missing value indicator. Standard errors, clustered on school, are reported in parentheses. We do not apply adjustments for multiple comparisons in this table because these are supplementary outcomes. * p < .05, ** p < .01, *** p < .001
26
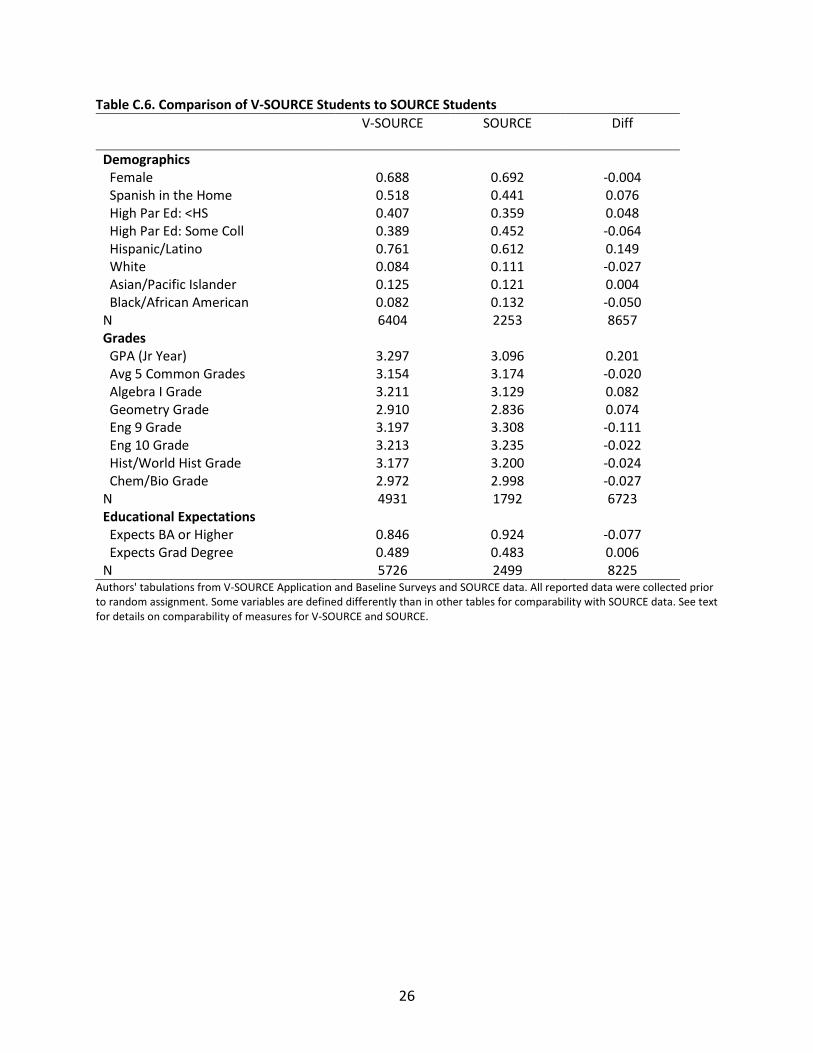
Table C.6. Comparison of V-SOURCE Students to SOURCE Students V-SOURCE SOURCE Diff Demographics Female 0.688 0.692 -0.004 Spanish in the Home 0.518 0.441 0.076 High Par Ed: <HS 0.407 0.359 0.048 High Par Ed: Some Coll 0.389 0.452 -0.064 Hispanic/Latino 0.761 0.612 0.149 White 0.084 0.111 -0.027 Asian/Pacific Islander 0.125 0.121 0.004 Black/African American 0.082 0.132 -0.050 N 6404 2253 8657 Grades GPA (Jr Year) 3.297 3.096 0.201 Avg 5 Common Grades 3.154 3.174 -0.020 Algebra I Grade 3.211 3.129 0.082 Geometry Grade 2.910 2.836 0.074 Eng 9 Grade 3.197 3.308 -0.111 Eng 10 Grade 3.213 3.235 -0.022 Hist/World Hist Grade 3.177 3.200 -0.024 Chem/Bio Grade 2.972 2.998 -0.027 N 4931 1792 6723 Educational Expectations Expects BA or Higher 0.846 0.924 -0.077 Expects Grad Degree 0.489 0.483 0.006 N 5726 2499 8225
Authors' tabulations from V-SOURCE Application and Baseline Surveys and SOURCE data. All reported data were collected prior to random assignment. Some variables are defined differently than in other tables for comparability with SOURCE data. See text for details on comparability of measures for V-SOURCE and SOURCE.
27
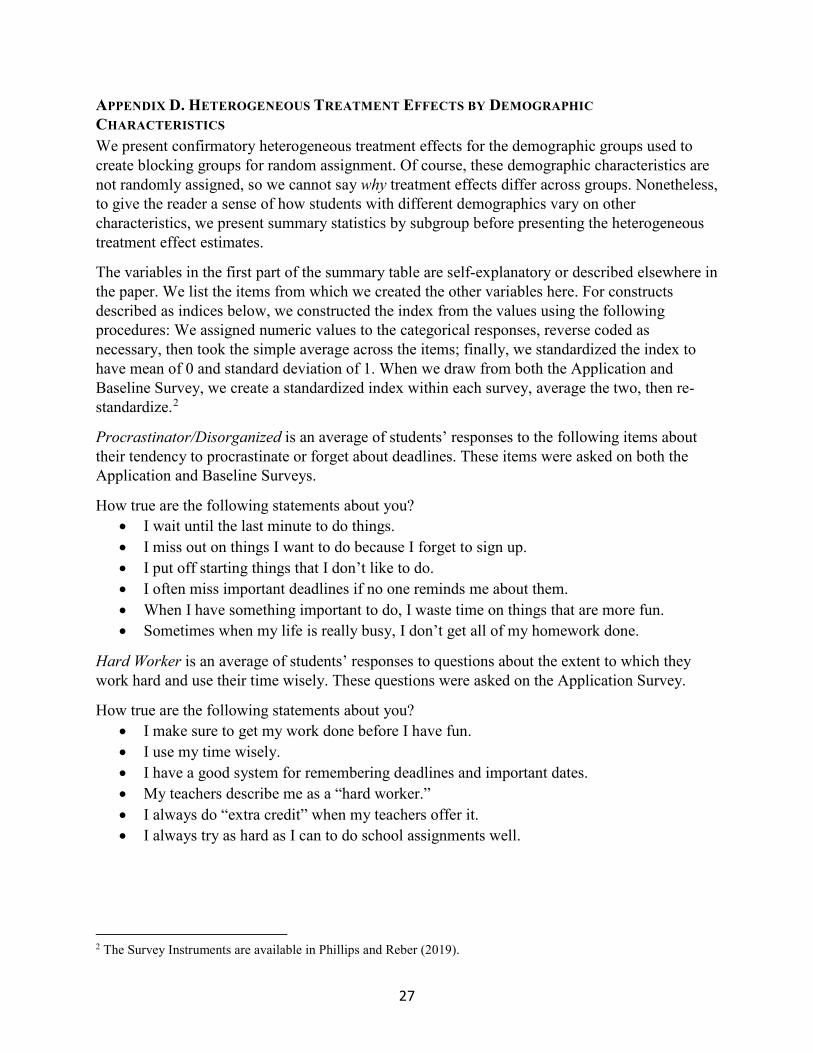
APPENDIX D. HETEROGENEOUS TREATMENT EFFECTS BY DEMOGRAPHIC CHARACTERISTICS We present confirmatory heterogeneous treatment effects for the demographic groups used to create blocking groups for random assignment. Of course, these demographic characteristics are not randomly assigned, so we cannot say why treatment effects differ across groups. Nonetheless, to give the reader a sense of how students with different demographics vary on other characteristics, we present summary statistics by subgroup before presenting the heterogeneous treatment effect estimates.
The variables in the first part of the summary table are self-explanatory or described elsewhere in the paper. We list the items from which we created the other variables here. For constructs described as indices below, we constructed the index from the values using the following procedures: We assigned numeric values to the categorical responses, reverse coded as necessary, then took the simple average across the items; finally, we standardized the index to have mean of 0 and standard deviation of 1. When we draw from both the Application and Baseline Survey, we create a standardized index within each survey, average the two, then re-standardize.2
Procrastinator/Disorganized is an average of students’ responses to the following items about their tendency to procrastinate or forget about deadlines. These items were asked on both the Application and Baseline Surveys.
How true are the following statements about you? • I wait until the last minute to do things. • I miss out on things I want to do because I forget to sign up. • I put off starting things that I don’t like to do. • I often miss important deadlines if no one reminds me about them. • When I have something important to do, I waste time on things that are more fun. • Sometimes when my life is really busy, I don’t get all of my homework done.
Hard Worker is an average of students’ responses to questions about the extent to which they work hard and use their time wisely. These questions were asked on the Application Survey.
How true are the following statements about you? • I make sure to get my work done before I have fun. • I use my time wisely. • I have a good system for remembering deadlines and important dates. • My teachers describe me as a “hard worker.” • I always do “extra credit” when my teachers offer it. • I always try as hard as I can to do school assignments well.
2 The Survey Instruments are available in Phillips and Reber (2019).
28
Internal Locus of Control is an index based on the Perlin Mastery Scale and indicates the extent to which students feel they have control over their lives. These were asked on the Baseline Survey.
How much do you agree or disagree with the following statements? • I have little control over the things that happen to me. • There is really no way I can solve some of the problems I have. • What happens to me in the future mostly depends on me. • There is little I can do to change many of the important things in my life. • I often feel helpless in dealing with the problems of life. • I can do just about anything I really set my mind to do. • Sometimes I feel that I'm being pushed around in life. • Becoming a success is a matter of hard work; luck has little or nothing to do with it.
Parents’ educational expectations for the student (Parents Expect <BA, Parents Expect BA, and Parents Expect >BA) are based on student reports of their parents’ (or guardians’) expectations on the Baseline Survey. We coded students to the highest level of education expected by either of their parents.
Teachers and Counselors Expect College is an index based on student reports of guidance counselor and teachers’ expectations on the Baseline Survey.
How true are the following statements about the adults at your school? • My guidance counselor(s) expect me to go to college. • Most of my teachers expect me to go to college.
The data on People Will Help with Application if Asked are binary variables coded from the Application Survey. Students were asked, “Thinking of the people in your life, which of the following people… will help you with college applications if you ask?”
Parent Will Remind Apps is a binary variable equal to 1 if students indicated on the Application survey that their parent “will remind you to turn in college applications?” Parent Will Make Sure Turn in Apps is equal to 1 if students indicated on that survey that their parent “will make sure you turn in college applications.”
School Support for Applying to College Index combines responses to several questions on the Application and Baseline survey asking students which people they can rely on for information and support during the college application process. This index uses the responses for teacher, counselor, and mentor from a program for the following items.
Thinking of the people in your life, which of the following people… • Have you talked to about where you might go to college? • Will help you with college applications if you ask? • Will remind you to turn in college applications? • Will make sure that you turn in college applications? • Have you talked to about preparing for the PSAT or SAT? (this item was on Baseline
only)
29
College Access Program Participation is a binary variable equal to 1 if students reported at baseline that they had participated in any of the following college access programs: Talent Search, Upward Bound, GEAR UP, AVID, or MESA.
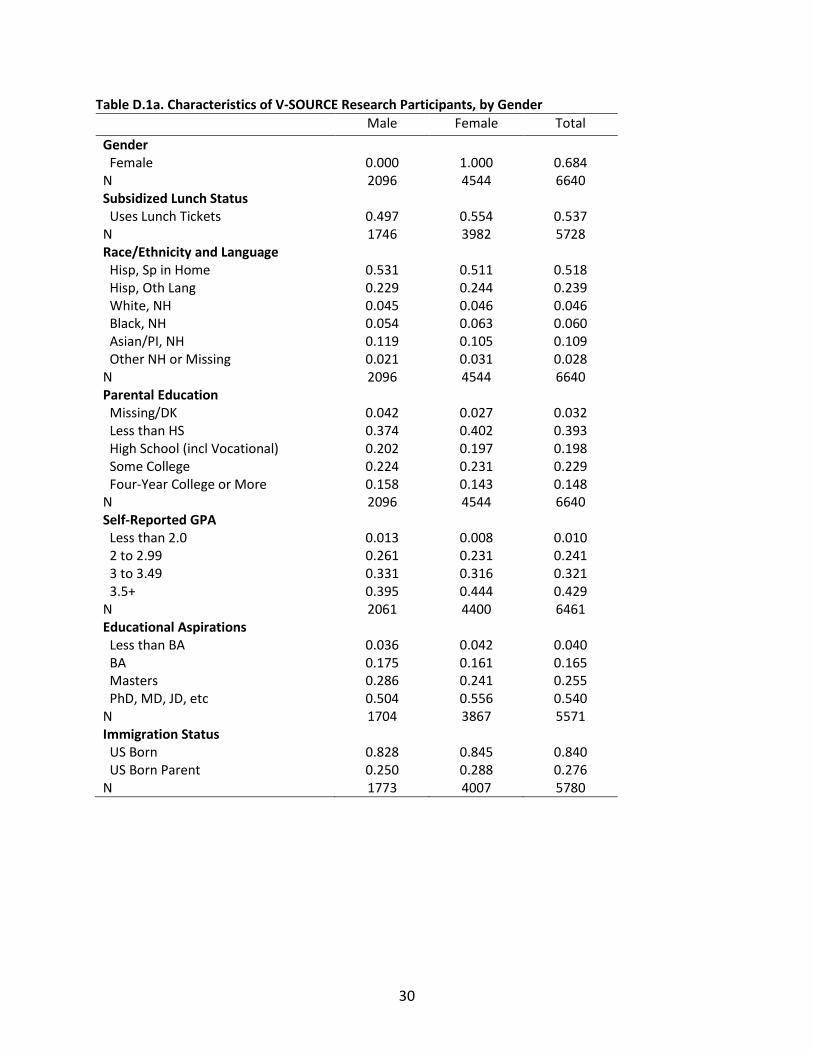
30
Table D.1a. Characteristics of V-SOURCE Research Participants, by Gender Male Female Total
Gender Female 0.000 1.000 0.684 N 2096 4544 6640 Subsidized Lunch Status Uses Lunch Tickets 0.497 0.554 0.537 N 1746 3982 5728 Race/Ethnicity and Language Hisp, Sp in Home 0.531 0.511 0.518 Hisp, Oth Lang 0.229 0.244 0.239 White, NH 0.045 0.046 0.046 Black, NH 0.054 0.063 0.060 Asian/PI, NH 0.119 0.105 0.109 Other NH or Missing 0.021 0.031 0.028 N 2096 4544 6640 Parental Education Missing/DK 0.042 0.027 0.032 Less than HS 0.374 0.402 0.393 High School (incl Vocational) 0.202 0.197 0.198 Some College 0.224 0.231 0.229 Four-Year College or More 0.158 0.143 0.148 N 2096 4544 6640 Self-Reported GPA Less than 2.0 0.013 0.008 0.010 2 to 2.99 0.261 0.231 0.241 3 to 3.49 0.331 0.316 0.321 3.5+ 0.395 0.444 0.429 N 2061 4400 6461 Educational Aspirations Less than BA 0.036 0.042 0.040 BA 0.175 0.161 0.165 Masters 0.286 0.241 0.255 PhD, MD, JD, etc 0.504 0.556 0.540 N 1704 3867 5571 Immigration Status US Born 0.828 0.845 0.840 US Born Parent 0.250 0.288 0.276 N 1773 4007 5780
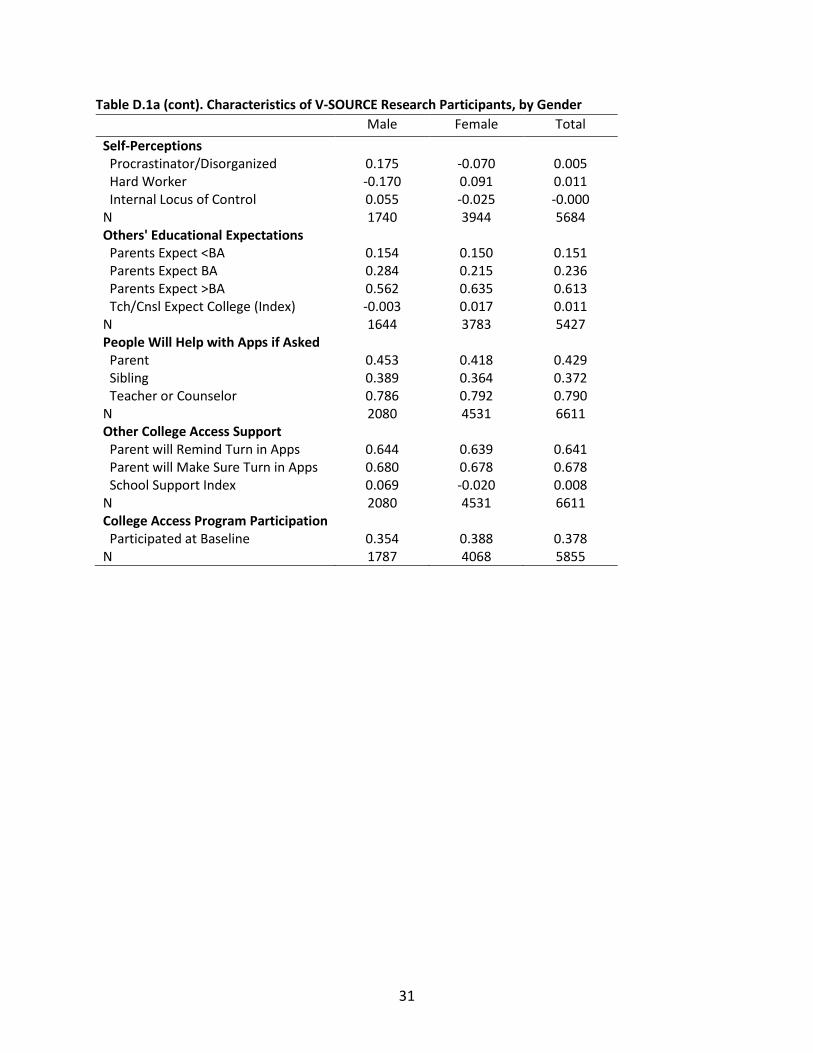
31
Table D.1a (cont). Characteristics of V-SOURCE Research Participants, by Gender Male Female Total
Self-Perceptions Procrastinator/Disorganized 0.175 -0.070 0.005 Hard Worker -0.170 0.091 0.011 Internal Locus of Control 0.055 -0.025 -0.000 N 1740 3944 5684 Others' Educational Expectations Parents Expect <BA 0.154 0.150 0.151 Parents Expect BA 0.284 0.215 0.236 Parents Expect >BA 0.562 0.635 0.613 Tch/Cnsl Expect College (Index) -0.003 0.017 0.011 N 1644 3783 5427 People Will Help with Apps if Asked Parent 0.453 0.418 0.429 Sibling 0.389 0.364 0.372 Teacher or Counselor 0.786 0.792 0.790 N 2080 4531 6611 Other College Access Support Parent will Remind Turn in Apps 0.644 0.639 0.641 Parent will Make Sure Turn in Apps 0.680 0.678 0.678 School Support Index 0.069 -0.020 0.008 N 2080 4531 6611 College Access Program Participation Participated at Baseline 0.354 0.388 0.378 N 1787 4068 5855
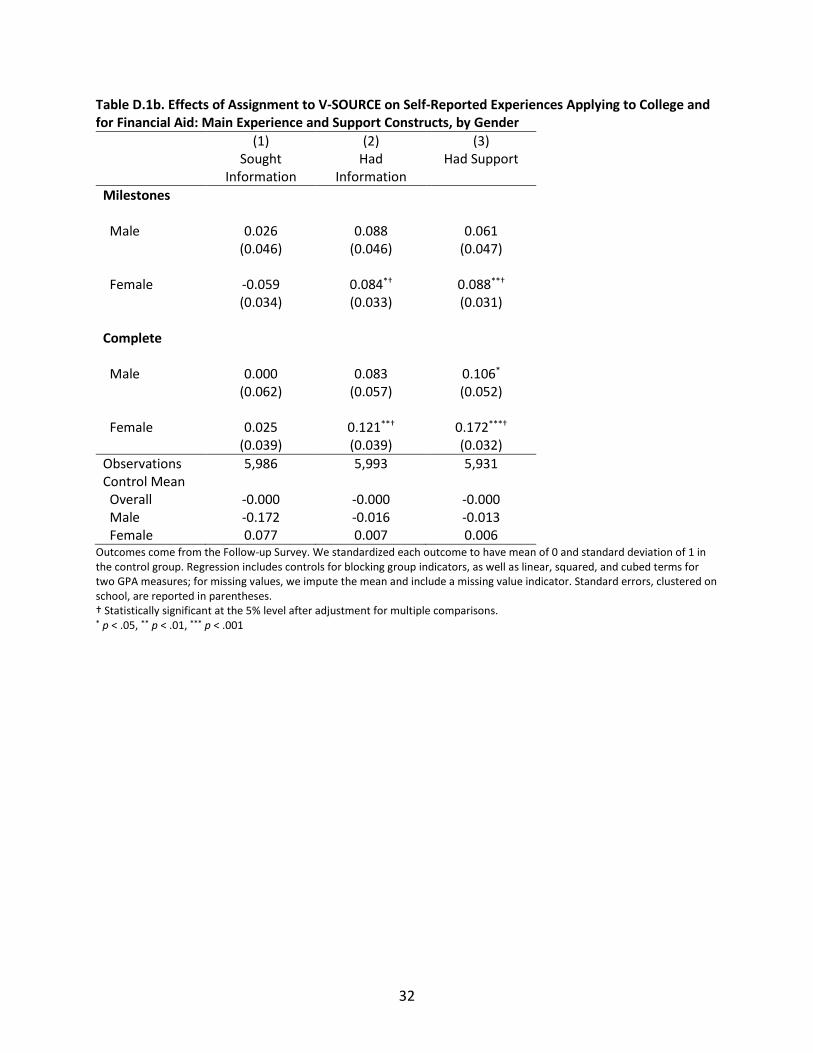
32
Table D.1b. Effects of Assignment to V-SOURCE on Self-Reported Experiences Applying to College and for Financial Aid: Main Experience and Support Constructs, by Gender
(1) (2) (3) Sought
Information Had
Information Had Support
Milestones Male 0.026 0.088 0.061 (0.046) (0.046) (0.047) Female -0.059 0.084*† 0.088**† (0.034) (0.033) (0.031) Complete Male 0.000 0.083 0.106* (0.062) (0.057) (0.052) Female 0.025 0.121**† 0.172***† (0.039) (0.039) (0.032) Observations 5,986 5,993 5,931 Control Mean Overall -0.000 -0.000 -0.000 Male -0.172 -0.016 -0.013 Female 0.077 0.007 0.006
Outcomes come from the Follow-up Survey. We standardized each outcome to have mean of 0 and standard deviation of 1 in the control group. Regression includes controls for blocking group indicators, as well as linear, squared, and cubed terms for two GPA measures; for missing values, we impute the mean and include a missing value indicator. Standard errors, clustered on school, are reported in parentheses. † Statistically significant at the 5% level after adjustment for multiple comparisons. * p < .05, ** p < .01, *** p < .001
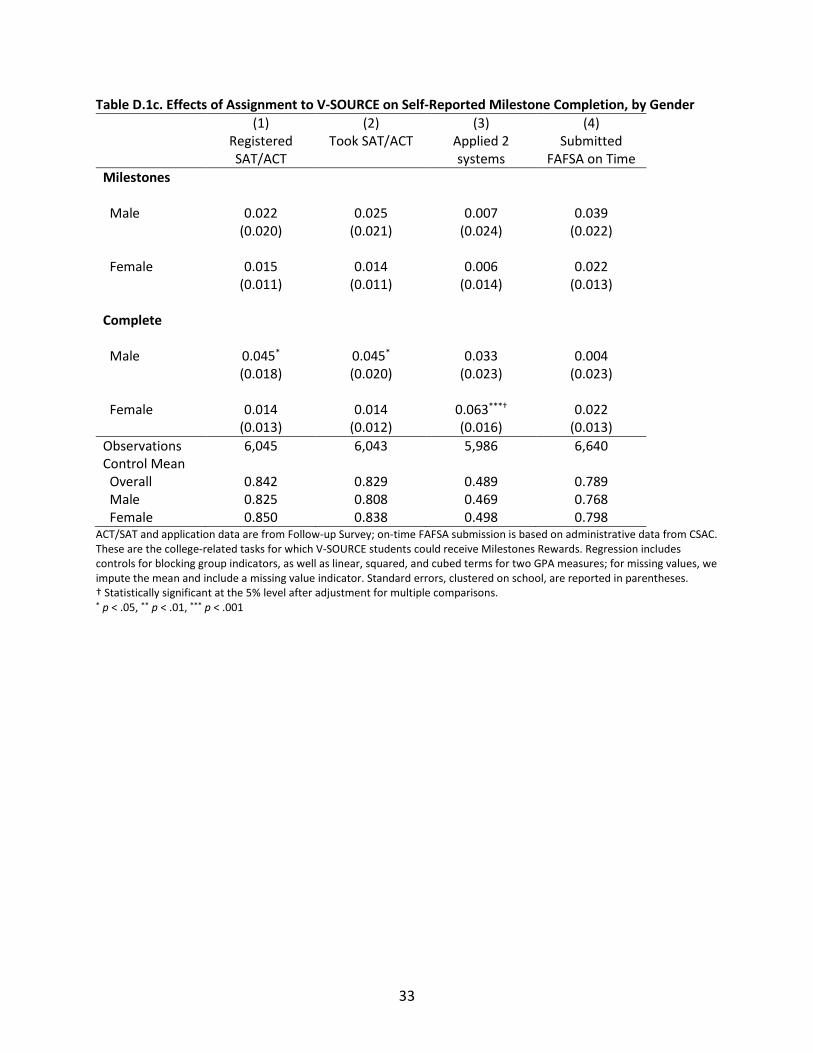
33
Table D.1c. Effects of Assignment to V-SOURCE on Self-Reported Milestone Completion, by Gender (1) (2) (3) (4) Registered
SAT/ACT Took SAT/ACT Applied 2
systems Submitted
FAFSA on Time Milestones Male 0.022 0.025 0.007 0.039 (0.020) (0.021) (0.024) (0.022) Female 0.015 0.014 0.006 0.022 (0.011) (0.011) (0.014) (0.013) Complete Male 0.045* 0.045* 0.033 0.004 (0.018) (0.020) (0.023) (0.023) Female 0.014 0.014 0.063***† 0.022 (0.013) (0.012) (0.016) (0.013) Observations 6,045 6,043 5,986 6,640 Control Mean Overall 0.842 0.829 0.489 0.789 Male 0.825 0.808 0.469 0.768 Female 0.850 0.838 0.498 0.798
ACT/SAT and application data are from Follow-up Survey; on-time FAFSA submission is based on administrative data from CSAC. These are the college-related tasks for which V-SOURCE students could receive Milestones Rewards. Regression includes controls for blocking group indicators, as well as linear, squared, and cubed terms for two GPA measures; for missing values, we impute the mean and include a missing value indicator. Standard errors, clustered on school, are reported in parentheses. † Statistically significant at the 5% level after adjustment for multiple comparisons. * p < .05, ** p < .01, *** p < .001
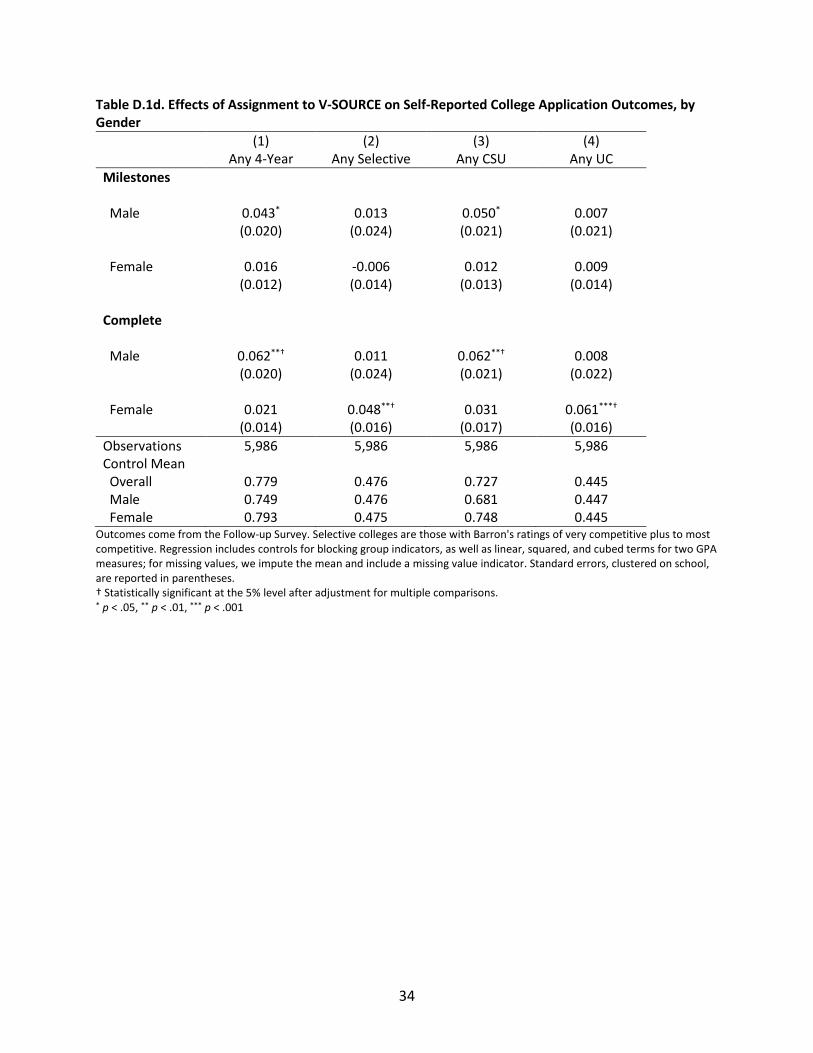
34
Table D.1d. Effects of Assignment to V-SOURCE on Self-Reported College Application Outcomes, by Gender
(1) (2) (3) (4) Any 4-Year Any Selective Any CSU Any UC Milestones Male 0.043* 0.013 0.050* 0.007 (0.020) (0.024) (0.021) (0.021) Female 0.016 -0.006 0.012 0.009 (0.012) (0.014) (0.013) (0.014) Complete Male 0.062**† 0.011 0.062**† 0.008 (0.020) (0.024) (0.021) (0.022) Female 0.021 0.048**† 0.031 0.061***† (0.014) (0.016) (0.017) (0.016) Observations 5,986 5,986 5,986 5,986 Control Mean Overall 0.779 0.476 0.727 0.445 Male 0.749 0.476 0.681 0.447 Female 0.793 0.475 0.748 0.445
Outcomes come from the Follow-up Survey. Selective colleges are those with Barron's ratings of very competitive plus to most competitive. Regression includes controls for blocking group indicators, as well as linear, squared, and cubed terms for two GPA measures; for missing values, we impute the mean and include a missing value indicator. Standard errors, clustered on school, are reported in parentheses. † Statistically significant at the 5% level after adjustment for multiple comparisons. * p < .05, ** p < .01, *** p < .001
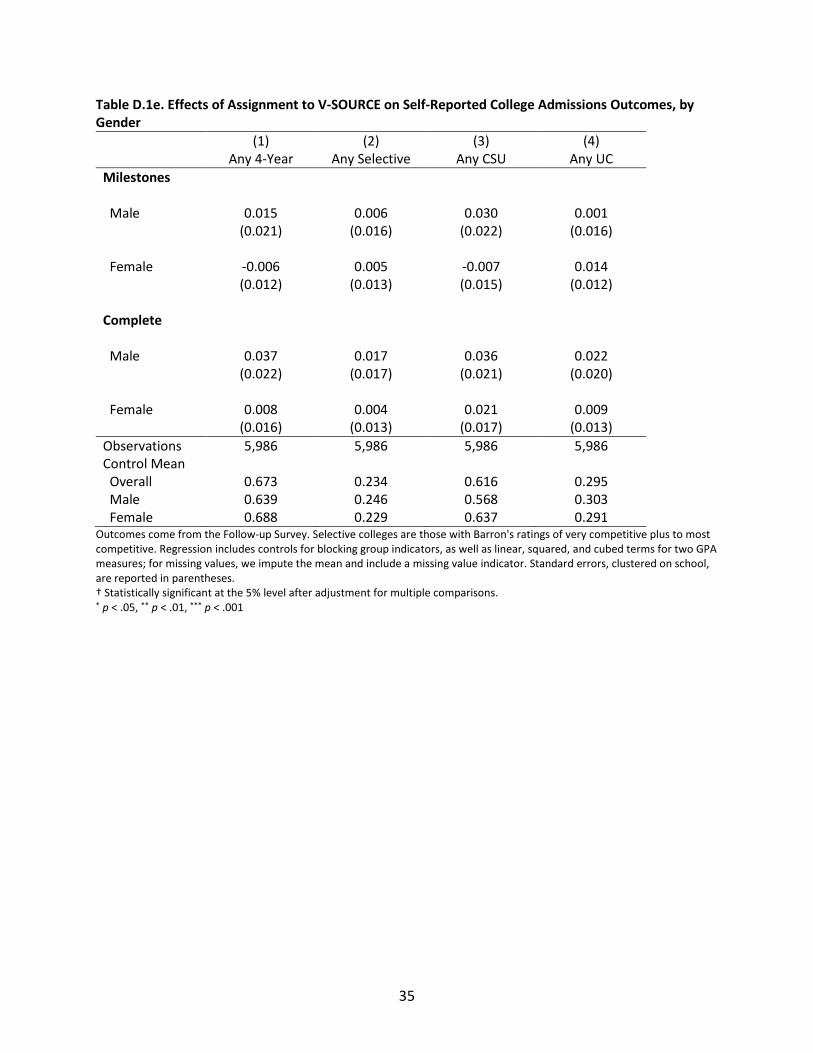
35
Table D.1e. Effects of Assignment to V-SOURCE on Self-Reported College Admissions Outcomes, by Gender
(1) (2) (3) (4) Any 4-Year Any Selective Any CSU Any UC Milestones Male 0.015 0.006 0.030 0.001 (0.021) (0.016) (0.022) (0.016) Female -0.006 0.005 -0.007 0.014 (0.012) (0.013) (0.015) (0.012) Complete Male 0.037 0.017 0.036 0.022 (0.022) (0.017) (0.021) (0.020) Female 0.008 0.004 0.021 0.009 (0.016) (0.013) (0.017) (0.013) Observations 5,986 5,986 5,986 5,986 Control Mean Overall 0.673 0.234 0.616 0.295 Male 0.639 0.246 0.568 0.303 Female 0.688 0.229 0.637 0.291
Outcomes come from the Follow-up Survey. Selective colleges are those with Barron's ratings of very competitive plus to most competitive. Regression includes controls for blocking group indicators, as well as linear, squared, and cubed terms for two GPA measures; for missing values, we impute the mean and include a missing value indicator. Standard errors, clustered on school, are reported in parentheses. † Statistically significant at the 5% level after adjustment for multiple comparisons. * p < .05, ** p < .01, *** p < .001
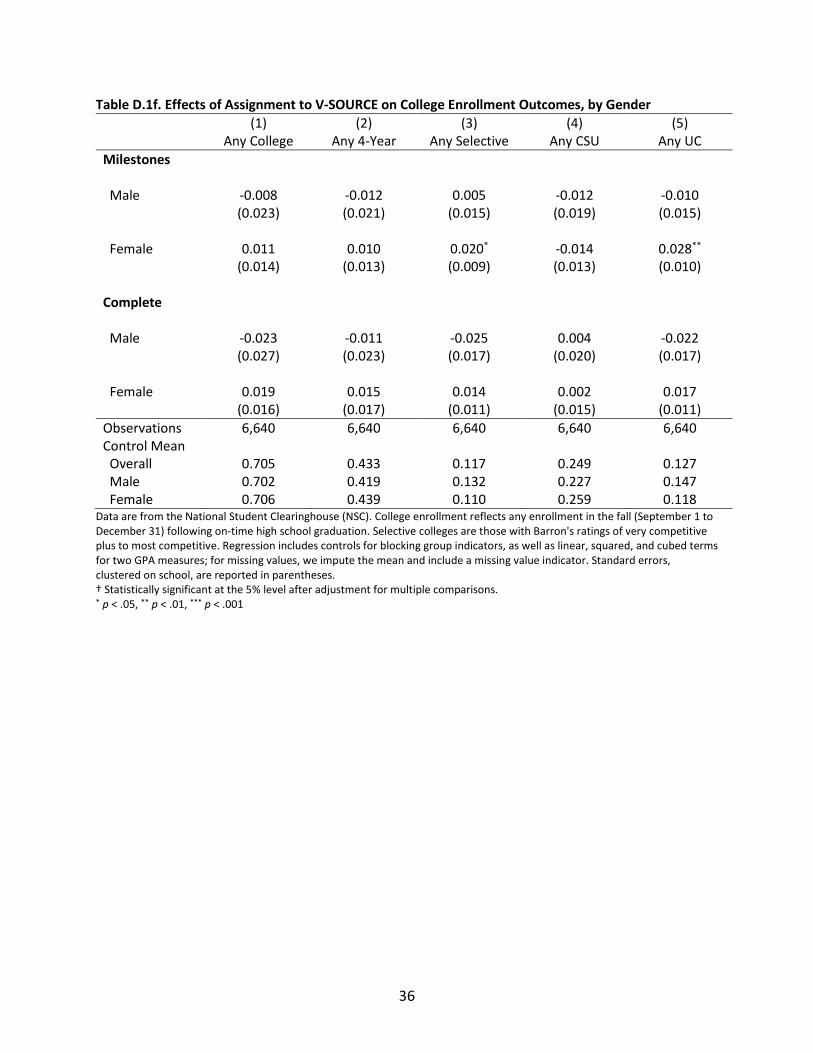
36
Table D.1f. Effects of Assignment to V-SOURCE on College Enrollment Outcomes, by Gender (1) (2) (3) (4) (5) Any College Any 4-Year Any Selective Any CSU Any UC Milestones Male -0.008 -0.012 0.005 -0.012 -0.010 (0.023) (0.021) (0.015) (0.019) (0.015) Female 0.011 0.010 0.020* -0.014 0.028** (0.014) (0.013) (0.009) (0.013) (0.010) Complete Male -0.023 -0.011 -0.025 0.004 -0.022 (0.027) (0.023) (0.017) (0.020) (0.017) Female 0.019 0.015 0.014 0.002 0.017 (0.016) (0.017) (0.011) (0.015) (0.011) Observations 6,640 6,640 6,640 6,640 6,640 Control Mean Overall 0.705 0.433 0.117 0.249 0.127 Male 0.702 0.419 0.132 0.227 0.147 Female 0.706 0.439 0.110 0.259 0.118
Data are from the National Student Clearinghouse (NSC). College enrollment reflects any enrollment in the fall (September 1 to December 31) following on-time high school graduation. Selective colleges are those with Barron's ratings of very competitive plus to most competitive. Regression includes controls for blocking group indicators, as well as linear, squared, and cubed terms for two GPA measures; for missing values, we impute the mean and include a missing value indicator. Standard errors, clustered on school, are reported in parentheses. † Statistically significant at the 5% level after adjustment for multiple comparisons. * p < .05, ** p < .01, *** p < .001

37
Table D.1g. Effects of Assignment to V-SOURCE on College Persistence Outcomes, by Gender (1) (2) (3) (4) (5) Any College Any 4-Year Any Selective Any CSU Any UC Milestones Male 0.001 -0.007 0.003 -0.009 -0.007 (0.024) (0.021) (0.014) (0.017) (0.015) Female 0.011 0.010 0.017* -0.011 0.026** (0.016) (0.014) (0.008) (0.014) (0.009) Complete Male -0.001 0.011 -0.021 0.019 -0.011 (0.027) (0.022) (0.016) (0.020) (0.016) Female 0.027 0.020 0.016 0.001 0.021 (0.017) (0.016) (0.011) (0.013) (0.011) Observations 6,640 6,640 6,640 6,640 6,640 Control Mean Overall 0.633 0.367 0.108 0.203 0.115 Male 0.615 0.352 0.122 0.181 0.132 Female 0.641 0.374 0.102 0.214 0.107
Data are from the National Student Clearinghouse (NSC). College enrollment reflects any enrollment in the fall (September 1 to December 31) following on-time high school graduation. Selective colleges are those with Barron's ratings of very competitive plus to most competitive. Regression includes controls for blocking group indicators, as well as linear, squared, and cubed terms for two GPA measures; for missing values, we impute the mean and include a missing value indicator. Standard errors, clustered on school, are reported in parentheses. † Statistically significant at the 5% level after adjustment for multiple comparisons. * p < .05, ** p < .01, *** p < .001
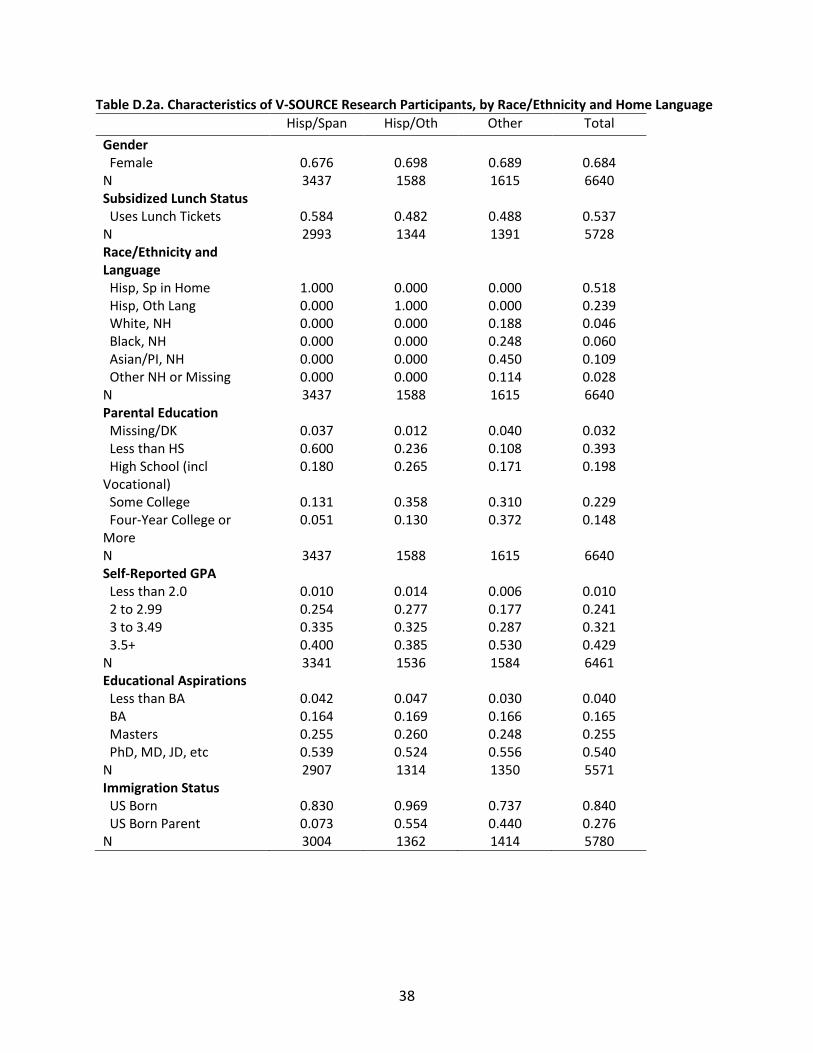
38
Table D.2a. Characteristics of V-SOURCE Research Participants, by Race/Ethnicity and Home Language Hisp/Span Hisp/Oth Other Total
Gender Female 0.676 0.698 0.689 0.684 N 3437 1588 1615 6640 Subsidized Lunch Status Uses Lunch Tickets 0.584 0.482 0.488 0.537 N 2993 1344 1391 5728 Race/Ethnicity and Language
Hisp, Sp in Home 1.000 0.000 0.000 0.518 Hisp, Oth Lang 0.000 1.000 0.000 0.239 White, NH 0.000 0.000 0.188 0.046 Black, NH 0.000 0.000 0.248 0.060 Asian/PI, NH 0.000 0.000 0.450 0.109 Other NH or Missing 0.000 0.000 0.114 0.028 N 3437 1588 1615 6640 Parental Education Missing/DK 0.037 0.012 0.040 0.032 Less than HS 0.600 0.236 0.108 0.393 High School (incl Vocational)
0.180 0.265 0.171 0.198
Some College 0.131 0.358 0.310 0.229 Four-Year College or More
0.051 0.130 0.372 0.148
N 3437 1588 1615 6640 Self-Reported GPA Less than 2.0 0.010 0.014 0.006 0.010 2 to 2.99 0.254 0.277 0.177 0.241 3 to 3.49 0.335 0.325 0.287 0.321 3.5+ 0.400 0.385 0.530 0.429 N 3341 1536 1584 6461 Educational Aspirations Less than BA 0.042 0.047 0.030 0.040 BA 0.164 0.169 0.166 0.165 Masters 0.255 0.260 0.248 0.255 PhD, MD, JD, etc 0.539 0.524 0.556 0.540 N 2907 1314 1350 5571 Immigration Status US Born 0.830 0.969 0.737 0.840 US Born Parent 0.073 0.554 0.440 0.276 N 3004 1362 1414 5780
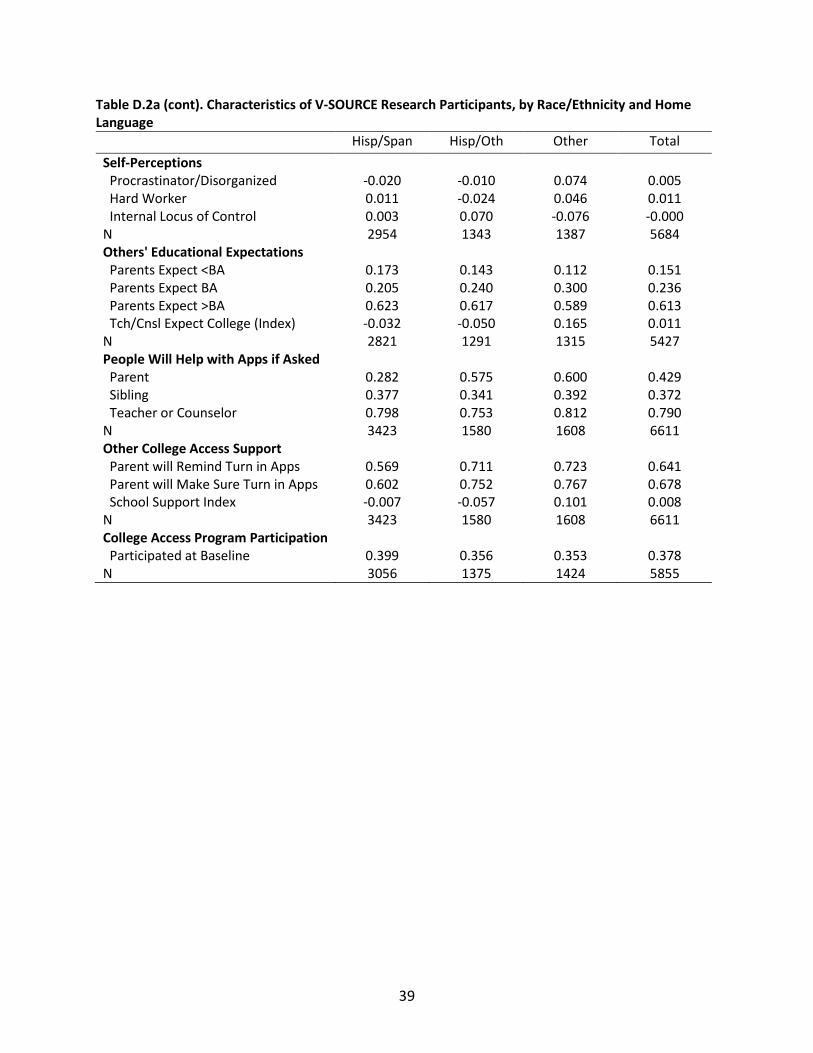
39
Table D.2a (cont). Characteristics of V-SOURCE Research Participants, by Race/Ethnicity and Home Language
Hisp/Span Hisp/Oth Other Total
Self-Perceptions Procrastinator/Disorganized -0.020 -0.010 0.074 0.005 Hard Worker 0.011 -0.024 0.046 0.011 Internal Locus of Control 0.003 0.070 -0.076 -0.000 N 2954 1343 1387 5684 Others' Educational Expectations Parents Expect <BA 0.173 0.143 0.112 0.151 Parents Expect BA 0.205 0.240 0.300 0.236 Parents Expect >BA 0.623 0.617 0.589 0.613 Tch/Cnsl Expect College (Index) -0.032 -0.050 0.165 0.011 N 2821 1291 1315 5427 People Will Help with Apps if Asked Parent 0.282 0.575 0.600 0.429 Sibling 0.377 0.341 0.392 0.372 Teacher or Counselor 0.798 0.753 0.812 0.790 N 3423 1580 1608 6611 Other College Access Support Parent will Remind Turn in Apps 0.569 0.711 0.723 0.641 Parent will Make Sure Turn in Apps 0.602 0.752 0.767 0.678 School Support Index -0.007 -0.057 0.101 0.008 N 3423 1580 1608 6611 College Access Program Participation Participated at Baseline 0.399 0.356 0.353 0.378 N 3056 1375 1424 5855
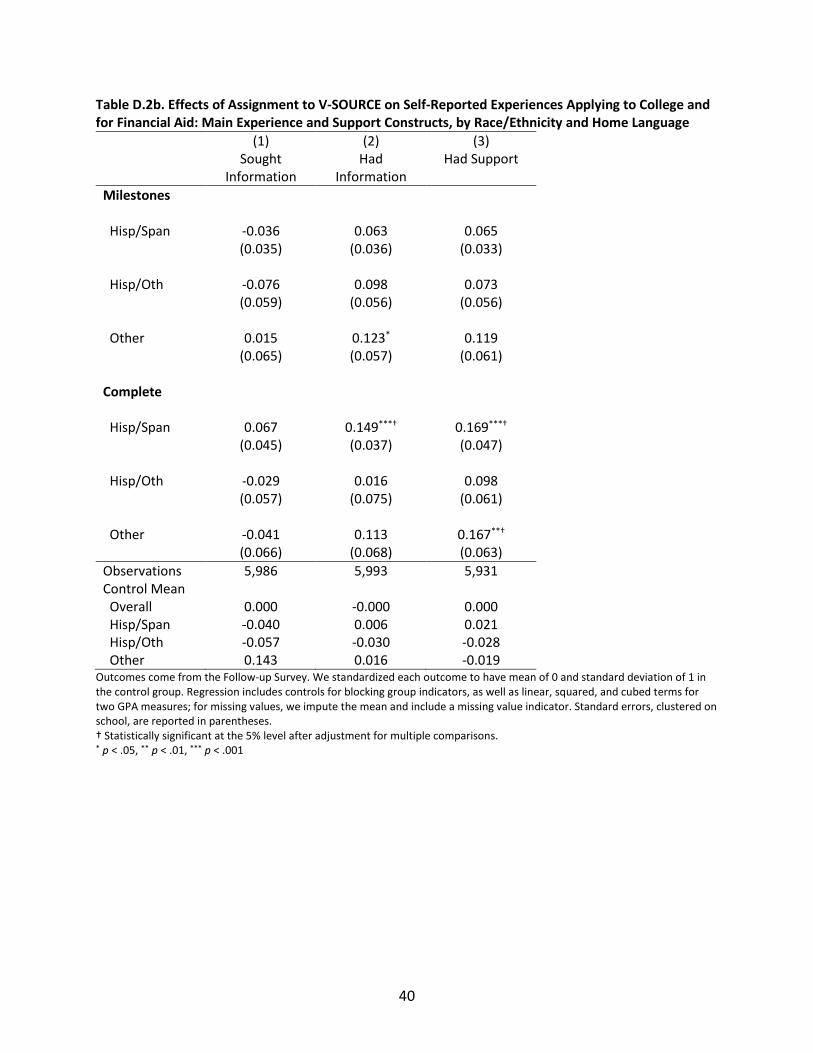
40
Table D.2b. Effects of Assignment to V-SOURCE on Self-Reported Experiences Applying to College and for Financial Aid: Main Experience and Support Constructs, by Race/Ethnicity and Home Language
(1) (2) (3) Sought
Information Had
Information Had Support
Milestones Hisp/Span -0.036 0.063 0.065 (0.035) (0.036) (0.033) Hisp/Oth -0.076 0.098 0.073 (0.059) (0.056) (0.056) Other 0.015 0.123* 0.119 (0.065) (0.057) (0.061) Complete Hisp/Span 0.067 0.149***† 0.169***† (0.045) (0.037) (0.047) Hisp/Oth -0.029 0.016 0.098 (0.057) (0.075) (0.061) Other -0.041 0.113 0.167**† (0.066) (0.068) (0.063) Observations 5,986 5,993 5,931 Control Mean Overall 0.000 -0.000 0.000 Hisp/Span -0.040 0.006 0.021 Hisp/Oth -0.057 -0.030 -0.028 Other 0.143 0.016 -0.019
Outcomes come from the Follow-up Survey. We standardized each outcome to have mean of 0 and standard deviation of 1 in the control group. Regression includes controls for blocking group indicators, as well as linear, squared, and cubed terms for two GPA measures; for missing values, we impute the mean and include a missing value indicator. Standard errors, clustered on school, are reported in parentheses. † Statistically significant at the 5% level after adjustment for multiple comparisons. * p < .05, ** p < .01, *** p < .001
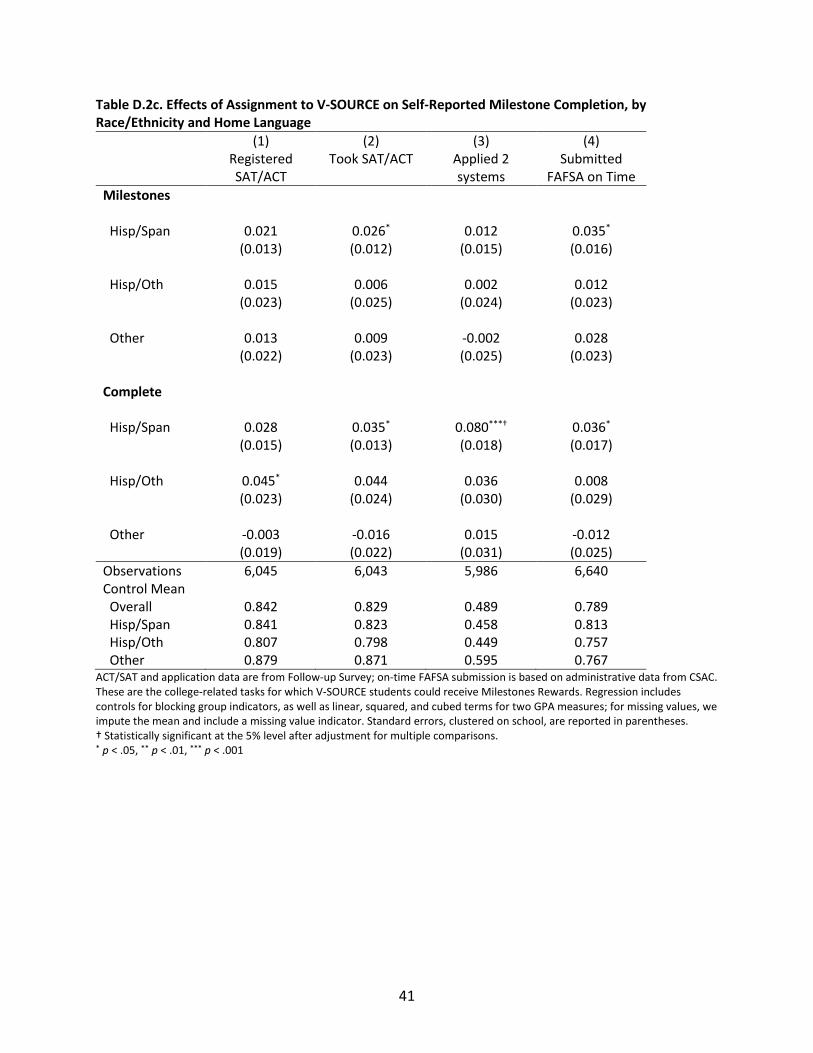
41
Table D.2c. Effects of Assignment to V-SOURCE on Self-Reported Milestone Completion, by Race/Ethnicity and Home Language
(1) (2) (3) (4) Registered
SAT/ACT Took SAT/ACT Applied 2
systems Submitted
FAFSA on Time Milestones Hisp/Span 0.021 0.026* 0.012 0.035* (0.013) (0.012) (0.015) (0.016) Hisp/Oth 0.015 0.006 0.002 0.012 (0.023) (0.025) (0.024) (0.023) Other 0.013 0.009 -0.002 0.028 (0.022) (0.023) (0.025) (0.023) Complete Hisp/Span 0.028 0.035* 0.080***† 0.036* (0.015) (0.013) (0.018) (0.017) Hisp/Oth 0.045* 0.044 0.036 0.008 (0.023) (0.024) (0.030) (0.029) Other -0.003 -0.016 0.015 -0.012 (0.019) (0.022) (0.031) (0.025) Observations 6,045 6,043 5,986 6,640 Control Mean Overall 0.842 0.829 0.489 0.789 Hisp/Span 0.841 0.823 0.458 0.813 Hisp/Oth 0.807 0.798 0.449 0.757 Other 0.879 0.871 0.595 0.767
ACT/SAT and application data are from Follow-up Survey; on-time FAFSA submission is based on administrative data from CSAC. These are the college-related tasks for which V-SOURCE students could receive Milestones Rewards. Regression includes controls for blocking group indicators, as well as linear, squared, and cubed terms for two GPA measures; for missing values, we impute the mean and include a missing value indicator. Standard errors, clustered on school, are reported in parentheses. † Statistically significant at the 5% level after adjustment for multiple comparisons. * p < .05, ** p < .01, *** p < .001
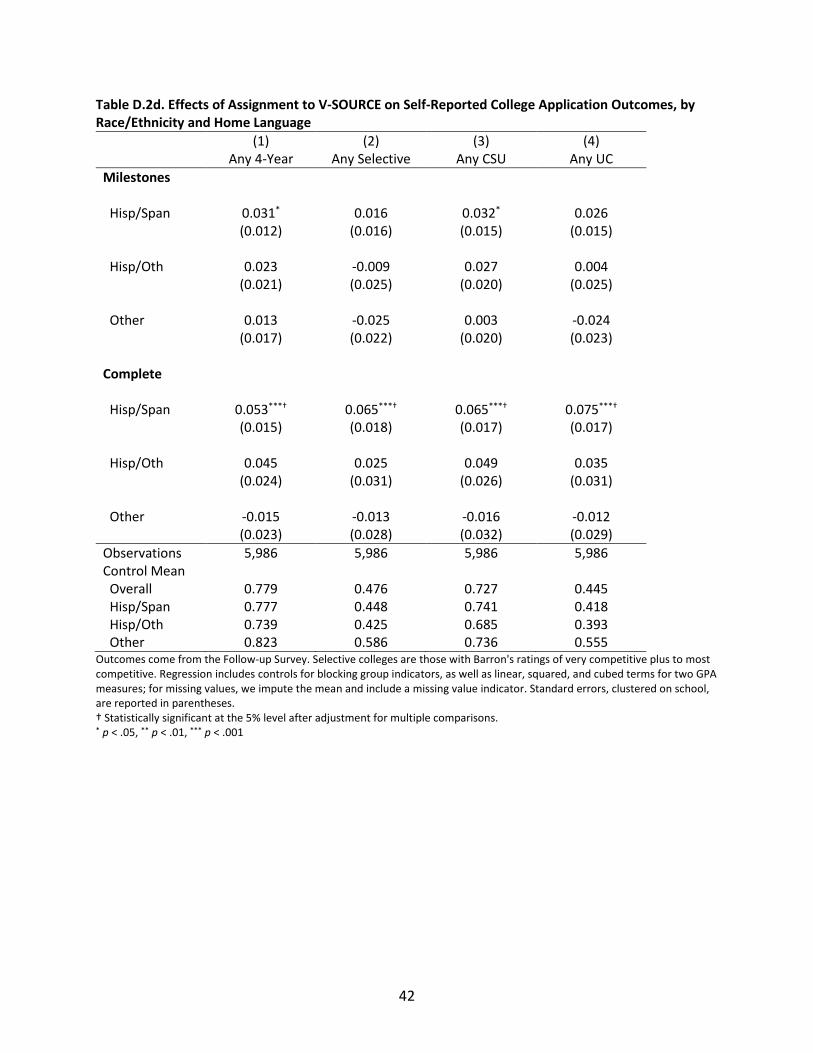
42
Table D.2d. Effects of Assignment to V-SOURCE on Self-Reported College Application Outcomes, by Race/Ethnicity and Home Language
(1) (2) (3) (4) Any 4-Year Any Selective Any CSU Any UC Milestones Hisp/Span 0.031* 0.016 0.032* 0.026 (0.012) (0.016) (0.015) (0.015) Hisp/Oth 0.023 -0.009 0.027 0.004 (0.021) (0.025) (0.020) (0.025) Other 0.013 -0.025 0.003 -0.024 (0.017) (0.022) (0.020) (0.023) Complete Hisp/Span 0.053***† 0.065***† 0.065***† 0.075***† (0.015) (0.018) (0.017) (0.017) Hisp/Oth 0.045 0.025 0.049 0.035 (0.024) (0.031) (0.026) (0.031) Other -0.015 -0.013 -0.016 -0.012 (0.023) (0.028) (0.032) (0.029) Observations 5,986 5,986 5,986 5,986 Control Mean Overall 0.779 0.476 0.727 0.445 Hisp/Span 0.777 0.448 0.741 0.418 Hisp/Oth 0.739 0.425 0.685 0.393 Other 0.823 0.586 0.736 0.555
Outcomes come from the Follow-up Survey. Selective colleges are those with Barron's ratings of very competitive plus to most competitive. Regression includes controls for blocking group indicators, as well as linear, squared, and cubed terms for two GPA measures; for missing values, we impute the mean and include a missing value indicator. Standard errors, clustered on school, are reported in parentheses. † Statistically significant at the 5% level after adjustment for multiple comparisons. * p < .05, ** p < .01, *** p < .001

43
Table D.2e. Effects of Assignment to V-SOURCE on Self-Reported College Admissions Outcomes, by Race/Ethnicity and Home Language
(1) (2) (3) (4) Any 4-Year Any Selective Any CSU Any UC Milestones Hisp/Span 0.015 0.014 0.014 0.028 (0.016) (0.016) (0.018) (0.015) Hisp/Oth -0.052* -0.022 -0.019 -0.007 (0.025) (0.017) (0.027) (0.016) Other 0.020 0.012 0.006 -0.014 (0.020) (0.020) (0.024) (0.020) Complete Hisp/Span 0.029 0.023 0.032 0.047** (0.021) (0.018) (0.022) (0.014) Hisp/Oth 0.023 -0.011 0.034 0.001 (0.029) (0.024) (0.031) (0.024) Other -0.011 -0.008 0.008 -0.049 (0.023) (0.022) (0.030) (0.028) Observations 5,986 5,986 5,986 5,986 Control Mean Overall 0.673 0.234 0.616 0.295 Hisp/Span 0.662 0.210 0.627 0.266 Hisp/Oth 0.644 0.207 0.574 0.253 Other 0.725 0.314 0.630 0.398
Outcomes come from the Follow-up Survey. Selective colleges are those with Barron's ratings of very competitive plus to most competitive. Regression includes controls for blocking group indicators, as well as linear, squared, and cubed terms for two GPA measures; for missing values, we impute the mean and include a missing value indicator. Standard errors, clustered on school, are reported in parentheses. † Statistically significant at the 5% level after adjustment for multiple comparisons. * p < .05, ** p < .01, *** p < .001
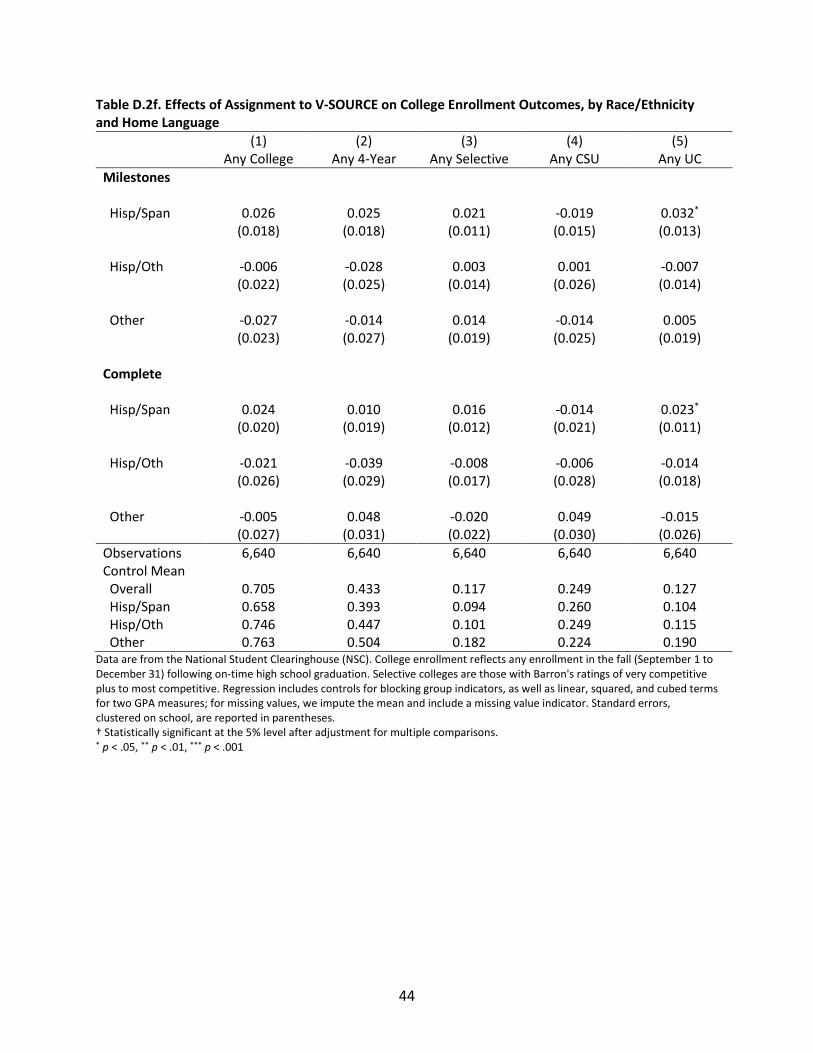
44
Table D.2f. Effects of Assignment to V-SOURCE on College Enrollment Outcomes, by Race/Ethnicity and Home Language
(1) (2) (3) (4) (5) Any College Any 4-Year Any Selective Any CSU Any UC Milestones Hisp/Span 0.026 0.025 0.021 -0.019 0.032* (0.018) (0.018) (0.011) (0.015) (0.013) Hisp/Oth -0.006 -0.028 0.003 0.001 -0.007 (0.022) (0.025) (0.014) (0.026) (0.014) Other -0.027 -0.014 0.014 -0.014 0.005 (0.023) (0.027) (0.019) (0.025) (0.019) Complete Hisp/Span 0.024 0.010 0.016 -0.014 0.023* (0.020) (0.019) (0.012) (0.021) (0.011) Hisp/Oth -0.021 -0.039 -0.008 -0.006 -0.014 (0.026) (0.029) (0.017) (0.028) (0.018) Other -0.005 0.048 -0.020 0.049 -0.015 (0.027) (0.031) (0.022) (0.030) (0.026) Observations 6,640 6,640 6,640 6,640 6,640 Control Mean Overall 0.705 0.433 0.117 0.249 0.127 Hisp/Span 0.658 0.393 0.094 0.260 0.104 Hisp/Oth 0.746 0.447 0.101 0.249 0.115 Other 0.763 0.504 0.182 0.224 0.190
Data are from the National Student Clearinghouse (NSC). College enrollment reflects any enrollment in the fall (September 1 to December 31) following on-time high school graduation. Selective colleges are those with Barron's ratings of very competitive plus to most competitive. Regression includes controls for blocking group indicators, as well as linear, squared, and cubed terms for two GPA measures; for missing values, we impute the mean and include a missing value indicator. Standard errors, clustered on school, are reported in parentheses. † Statistically significant at the 5% level after adjustment for multiple comparisons. * p < .05, ** p < .01, *** p < .001
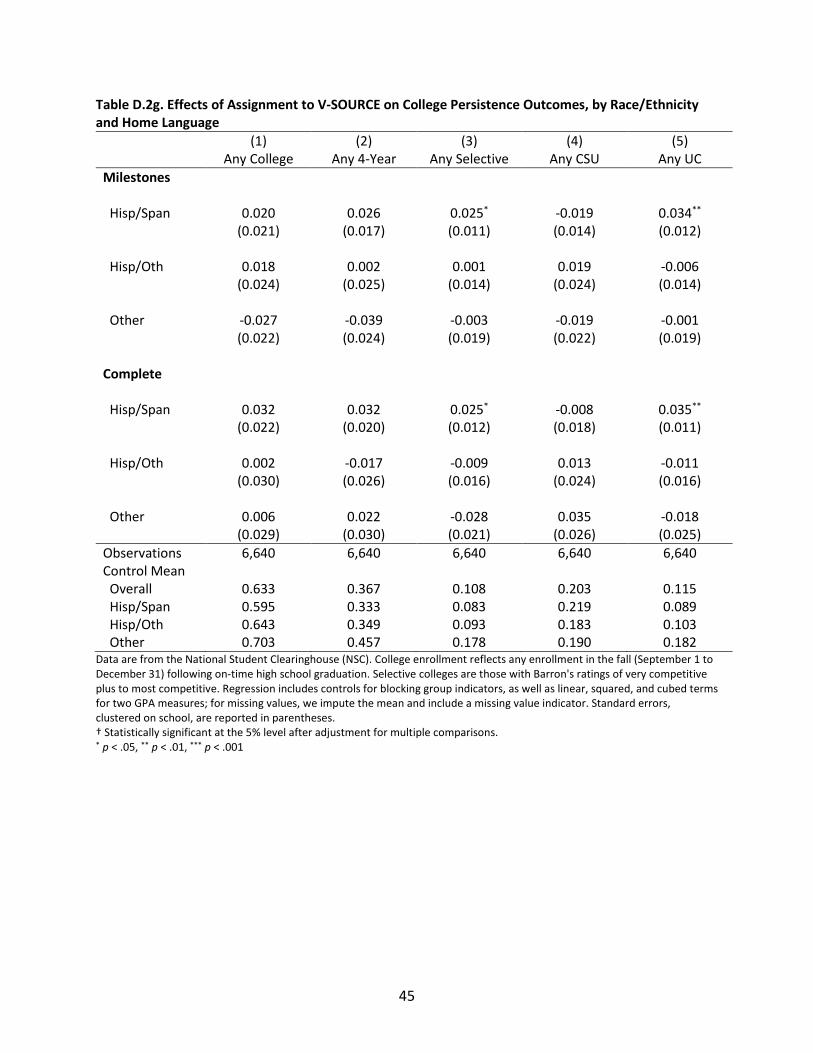
45
Table D.2g. Effects of Assignment to V-SOURCE on College Persistence Outcomes, by Race/Ethnicity and Home Language
(1) (2) (3) (4) (5) Any College Any 4-Year Any Selective Any CSU Any UC Milestones Hisp/Span 0.020 0.026 0.025* -0.019 0.034** (0.021) (0.017) (0.011) (0.014) (0.012) Hisp/Oth 0.018 0.002 0.001 0.019 -0.006 (0.024) (0.025) (0.014) (0.024) (0.014) Other -0.027 -0.039 -0.003 -0.019 -0.001 (0.022) (0.024) (0.019) (0.022) (0.019) Complete Hisp/Span 0.032 0.032 0.025* -0.008 0.035** (0.022) (0.020) (0.012) (0.018) (0.011) Hisp/Oth 0.002 -0.017 -0.009 0.013 -0.011 (0.030) (0.026) (0.016) (0.024) (0.016) Other 0.006 0.022 -0.028 0.035 -0.018 (0.029) (0.030) (0.021) (0.026) (0.025) Observations 6,640 6,640 6,640 6,640 6,640 Control Mean Overall 0.633 0.367 0.108 0.203 0.115 Hisp/Span 0.595 0.333 0.083 0.219 0.089 Hisp/Oth 0.643 0.349 0.093 0.183 0.103 Other 0.703 0.457 0.178 0.190 0.182
Data are from the National Student Clearinghouse (NSC). College enrollment reflects any enrollment in the fall (September 1 to December 31) following on-time high school graduation. Selective colleges are those with Barron's ratings of very competitive plus to most competitive. Regression includes controls for blocking group indicators, as well as linear, squared, and cubed terms for two GPA measures; for missing values, we impute the mean and include a missing value indicator. Standard errors, clustered on school, are reported in parentheses. † Statistically significant at the 5% level after adjustment for multiple comparisons. * p < .05, ** p < .01, *** p < .001
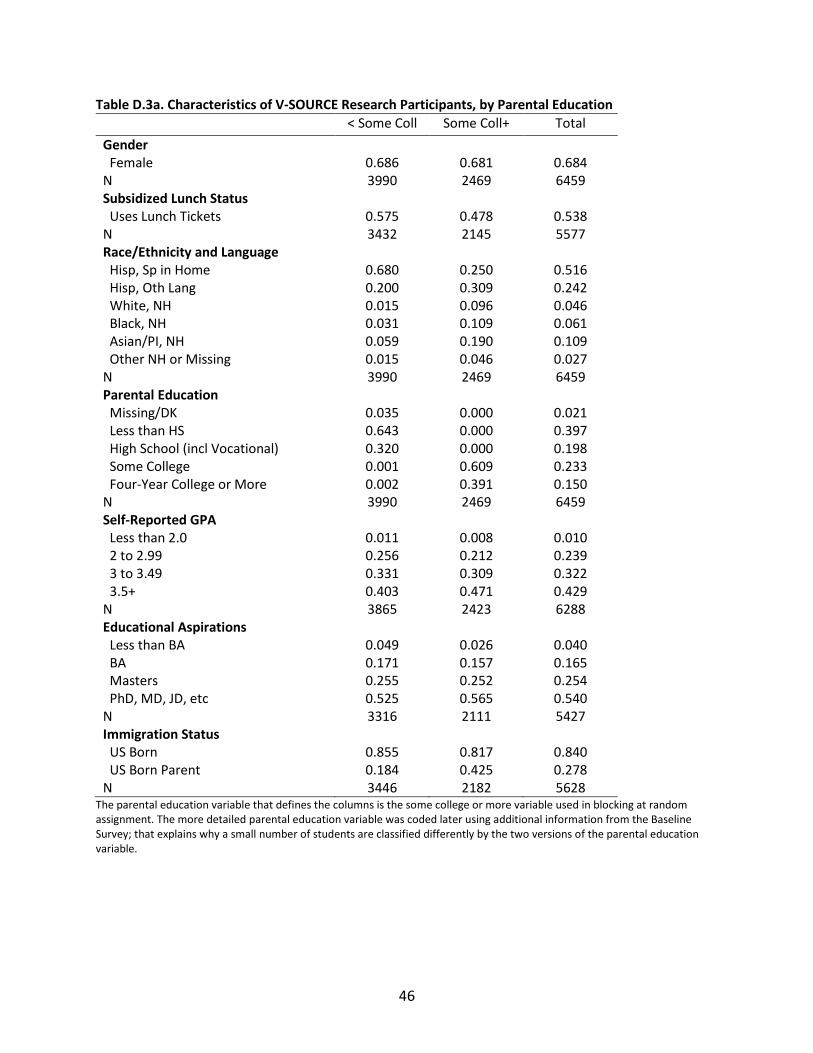
46
Table D.3a. Characteristics of V-SOURCE Research Participants, by Parental Education < Some Coll Some Coll+ Total
Gender Female 0.686 0.681 0.684 N 3990 2469 6459 Subsidized Lunch Status Uses Lunch Tickets 0.575 0.478 0.538 N 3432 2145 5577 Race/Ethnicity and Language Hisp, Sp in Home 0.680 0.250 0.516 Hisp, Oth Lang 0.200 0.309 0.242 White, NH 0.015 0.096 0.046 Black, NH 0.031 0.109 0.061 Asian/PI, NH 0.059 0.190 0.109 Other NH or Missing 0.015 0.046 0.027 N 3990 2469 6459 Parental Education Missing/DK 0.035 0.000 0.021 Less than HS 0.643 0.000 0.397 High School (incl Vocational) 0.320 0.000 0.198 Some College 0.001 0.609 0.233 Four-Year College or More 0.002 0.391 0.150 N 3990 2469 6459 Self-Reported GPA Less than 2.0 0.011 0.008 0.010 2 to 2.99 0.256 0.212 0.239 3 to 3.49 0.331 0.309 0.322 3.5+ 0.403 0.471 0.429 N 3865 2423 6288 Educational Aspirations Less than BA 0.049 0.026 0.040 BA 0.171 0.157 0.165 Masters 0.255 0.252 0.254 PhD, MD, JD, etc 0.525 0.565 0.540 N 3316 2111 5427 Immigration Status US Born 0.855 0.817 0.840 US Born Parent 0.184 0.425 0.278 N 3446 2182 5628
The parental education variable that defines the columns is the some college or more variable used in blocking at random assignment. The more detailed parental education variable was coded later using additional information from the Baseline Survey; that explains why a small number of students are classified differently by the two versions of the parental education variable.
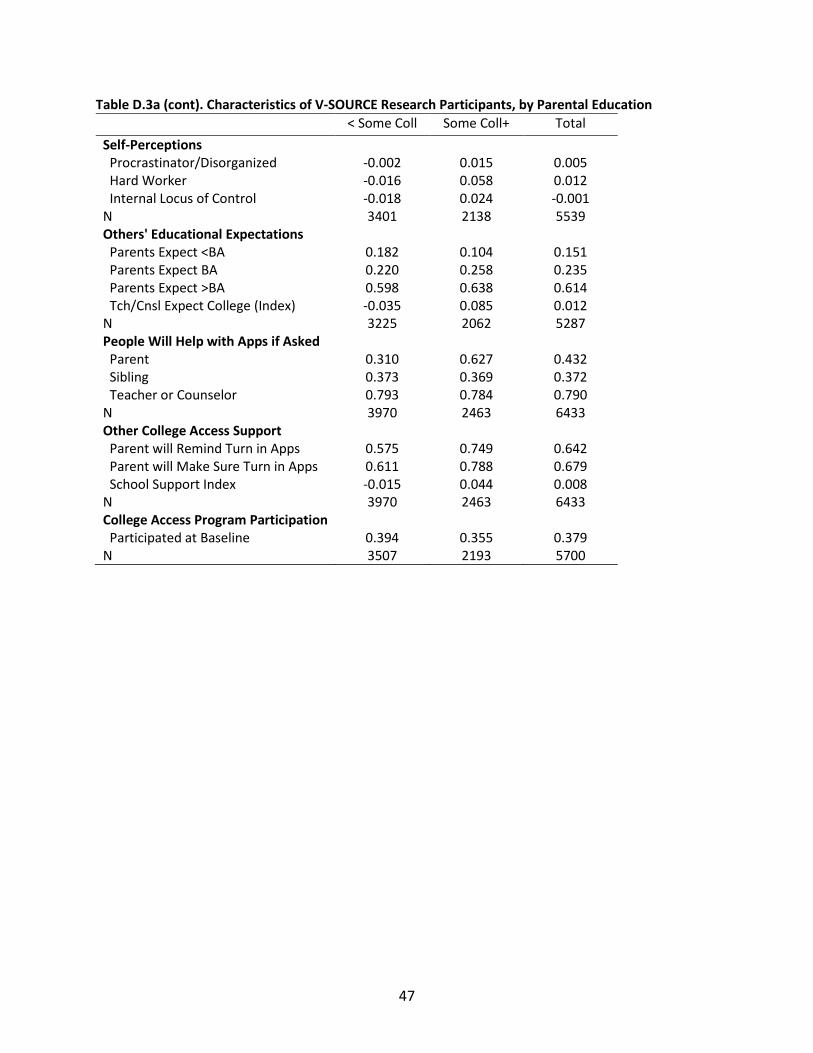
47
Table D.3a (cont). Characteristics of V-SOURCE Research Participants, by Parental Education < Some Coll Some Coll+ Total
Self-Perceptions Procrastinator/Disorganized -0.002 0.015 0.005 Hard Worker -0.016 0.058 0.012 Internal Locus of Control -0.018 0.024 -0.001 N 3401 2138 5539 Others' Educational Expectations Parents Expect <BA 0.182 0.104 0.151 Parents Expect BA 0.220 0.258 0.235 Parents Expect >BA 0.598 0.638 0.614 Tch/Cnsl Expect College (Index) -0.035 0.085 0.012 N 3225 2062 5287 People Will Help with Apps if Asked Parent 0.310 0.627 0.432 Sibling 0.373 0.369 0.372 Teacher or Counselor 0.793 0.784 0.790 N 3970 2463 6433 Other College Access Support Parent will Remind Turn in Apps 0.575 0.749 0.642 Parent will Make Sure Turn in Apps 0.611 0.788 0.679 School Support Index -0.015 0.044 0.008 N 3970 2463 6433 College Access Program Participation Participated at Baseline 0.394 0.355 0.379 N 3507 2193 5700
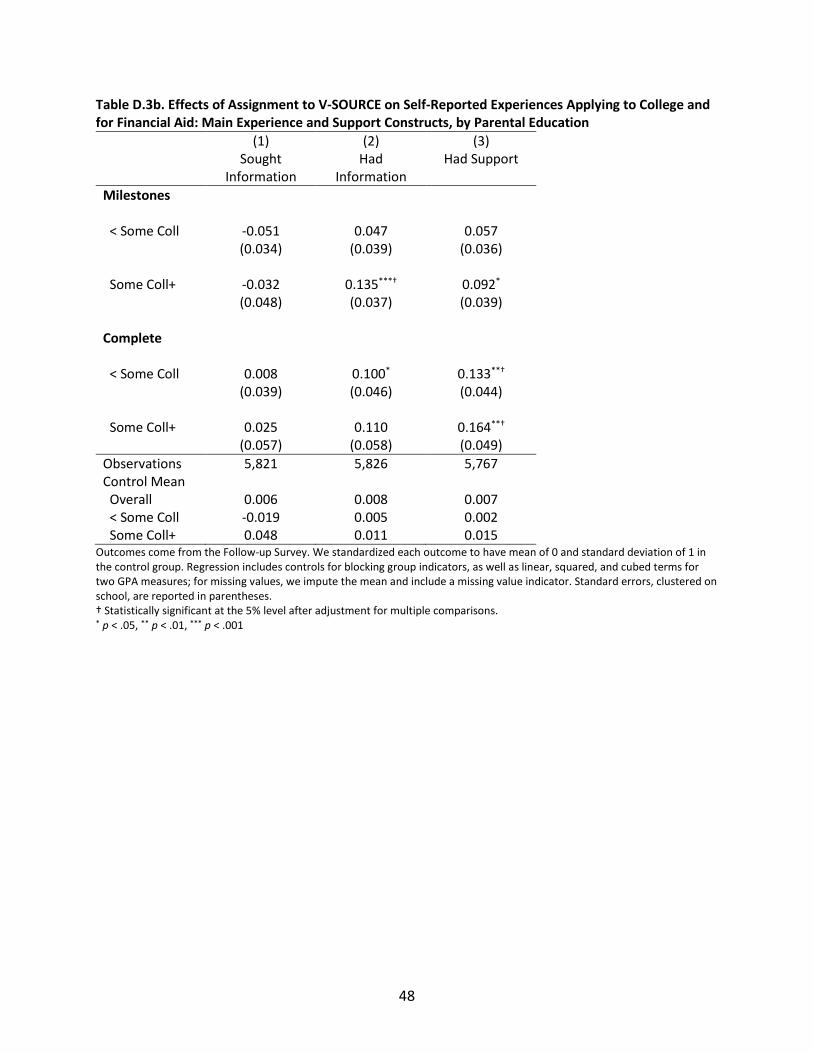
48
Table D.3b. Effects of Assignment to V-SOURCE on Self-Reported Experiences Applying to College and for Financial Aid: Main Experience and Support Constructs, by Parental Education
(1) (2) (3) Sought
Information Had
Information Had Support
Milestones < Some Coll -0.051 0.047 0.057 (0.034) (0.039) (0.036) Some Coll+ -0.032 0.135***† 0.092* (0.048) (0.037) (0.039) Complete < Some Coll 0.008 0.100* 0.133**† (0.039) (0.046) (0.044) Some Coll+ 0.025 0.110 0.164**† (0.057) (0.058) (0.049) Observations 5,821 5,826 5,767 Control Mean Overall 0.006 0.008 0.007 < Some Coll -0.019 0.005 0.002 Some Coll+ 0.048 0.011 0.015
Outcomes come from the Follow-up Survey. We standardized each outcome to have mean of 0 and standard deviation of 1 in the control group. Regression includes controls for blocking group indicators, as well as linear, squared, and cubed terms for two GPA measures; for missing values, we impute the mean and include a missing value indicator. Standard errors, clustered on school, are reported in parentheses. † Statistically significant at the 5% level after adjustment for multiple comparisons. * p < .05, ** p < .01, *** p < .001
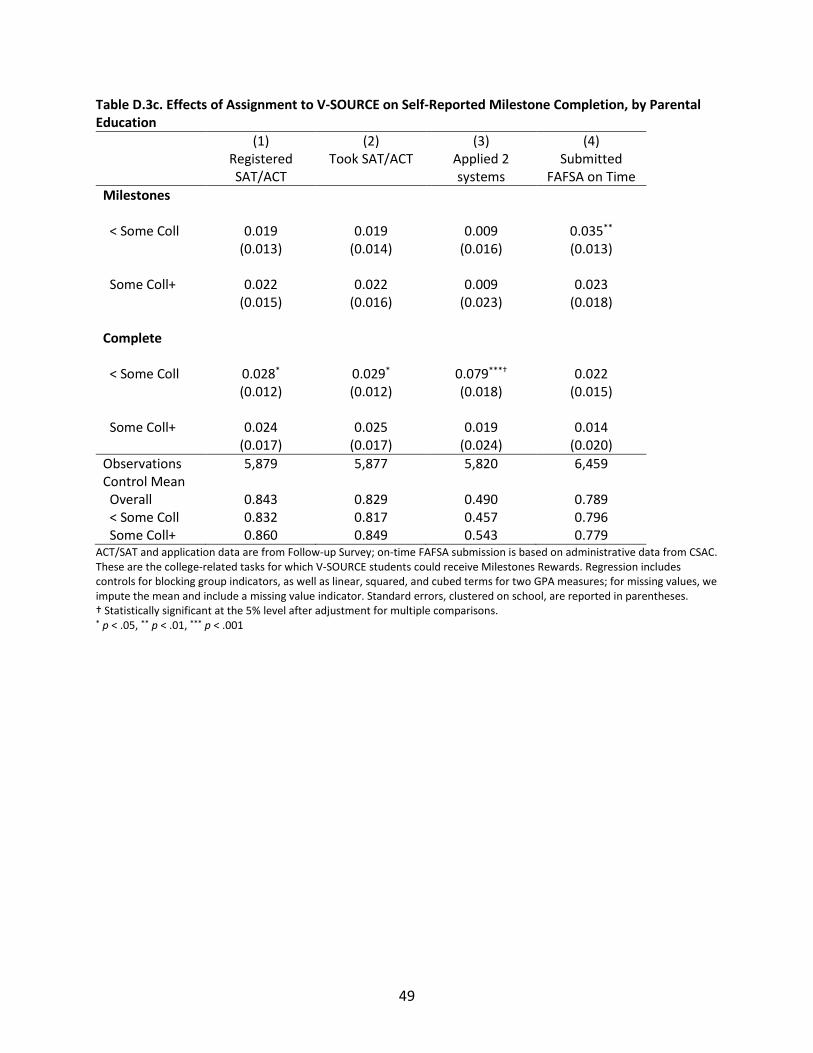
49
Table D.3c. Effects of Assignment to V-SOURCE on Self-Reported Milestone Completion, by Parental Education
(1) (2) (3) (4) Registered
SAT/ACT Took SAT/ACT Applied 2
systems Submitted
FAFSA on Time Milestones < Some Coll 0.019 0.019 0.009 0.035** (0.013) (0.014) (0.016) (0.013) Some Coll+ 0.022 0.022 0.009 0.023 (0.015) (0.016) (0.023) (0.018) Complete < Some Coll 0.028* 0.029* 0.079***† 0.022 (0.012) (0.012) (0.018) (0.015) Some Coll+ 0.024 0.025 0.019 0.014 (0.017) (0.017) (0.024) (0.020) Observations 5,879 5,877 5,820 6,459 Control Mean Overall 0.843 0.829 0.490 0.789 < Some Coll 0.832 0.817 0.457 0.796 Some Coll+ 0.860 0.849 0.543 0.779
ACT/SAT and application data are from Follow-up Survey; on-time FAFSA submission is based on administrative data from CSAC. These are the college-related tasks for which V-SOURCE students could receive Milestones Rewards. Regression includes controls for blocking group indicators, as well as linear, squared, and cubed terms for two GPA measures; for missing values, we impute the mean and include a missing value indicator. Standard errors, clustered on school, are reported in parentheses. † Statistically significant at the 5% level after adjustment for multiple comparisons. * p < .05, ** p < .01, *** p < .001

50
Table D.3d. Effects of Assignment to V-SOURCE on Self-Reported College Application Outcomes, by Parental Education
(1) (2) (3) (4) Any 4-Year Any Selective Any CSU Any UC Milestones < Some Coll 0.024 0.016 0.027 0.014 (0.014) (0.016) (0.015) (0.015) Some Coll+ 0.025 -0.022 0.016 0.002 (0.015) (0.019) (0.017) (0.020) Complete < Some Coll 0.036* 0.056***† 0.047**† 0.061***† (0.014) (0.016) (0.017) (0.015) Some Coll+ 0.037 0.009 0.033 0.023 (0.021) (0.023) (0.022) (0.023) Observations 5,820 5,820 5,820 5,820 Control Mean Overall 0.783 0.476 0.731 0.447 < Some Coll 0.766 0.439 0.728 0.421 Some Coll+ 0.809 0.537 0.735 0.489
Outcomes come from the Follow-up Survey. Selective colleges are those with Barron's ratings of very competitive plus to most competitive. Regression includes controls for blocking group indicators, as well as linear, squared, and cubed terms for two GPA measures; for missing values, we impute the mean and include a missing value indicator. Standard errors, clustered on school, are reported in parentheses. † Statistically significant at the 5% level after adjustment for multiple comparisons. * p < .05, ** p < .01, *** p < .001
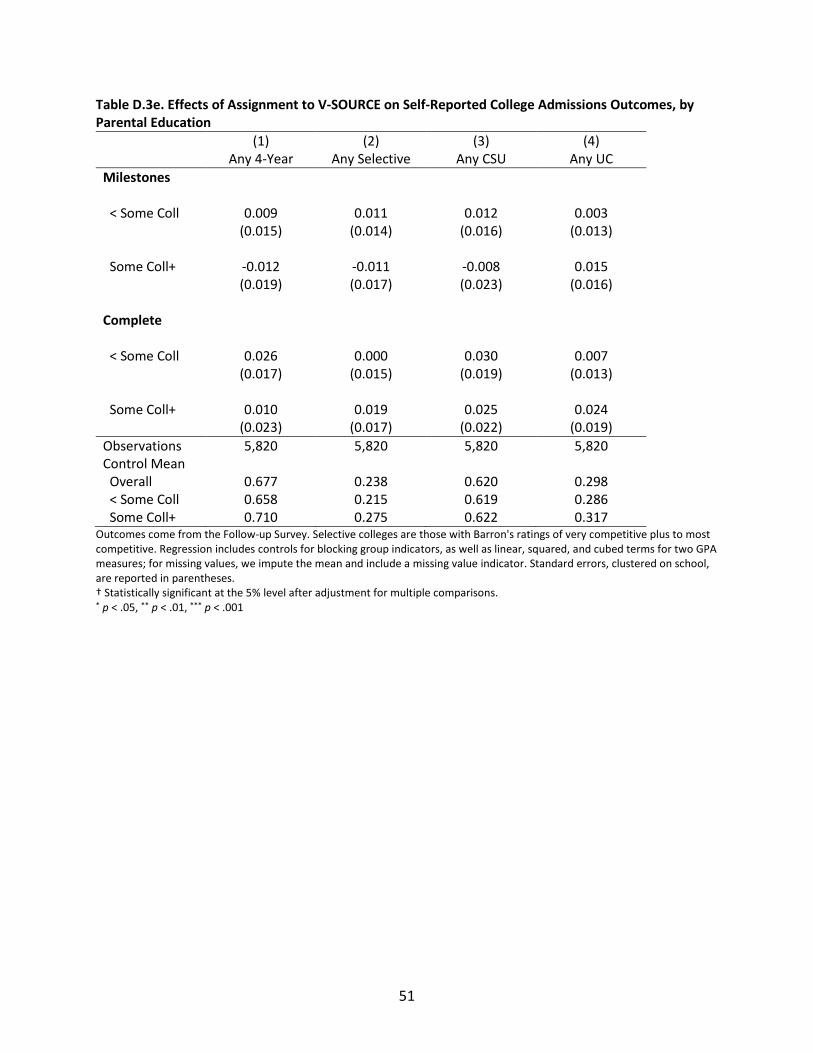
51
Table D.3e. Effects of Assignment to V-SOURCE on Self-Reported College Admissions Outcomes, by Parental Education
(1) (2) (3) (4) Any 4-Year Any Selective Any CSU Any UC Milestones < Some Coll 0.009 0.011 0.012 0.003 (0.015) (0.014) (0.016) (0.013) Some Coll+ -0.012 -0.011 -0.008 0.015 (0.019) (0.017) (0.023) (0.016) Complete < Some Coll 0.026 0.000 0.030 0.007 (0.017) (0.015) (0.019) (0.013) Some Coll+ 0.010 0.019 0.025 0.024 (0.023) (0.017) (0.022) (0.019) Observations 5,820 5,820 5,820 5,820 Control Mean Overall 0.677 0.238 0.620 0.298 < Some Coll 0.658 0.215 0.619 0.286 Some Coll+ 0.710 0.275 0.622 0.317
Outcomes come from the Follow-up Survey. Selective colleges are those with Barron's ratings of very competitive plus to most competitive. Regression includes controls for blocking group indicators, as well as linear, squared, and cubed terms for two GPA measures; for missing values, we impute the mean and include a missing value indicator. Standard errors, clustered on school, are reported in parentheses. † Statistically significant at the 5% level after adjustment for multiple comparisons. * p < .05, ** p < .01, *** p < .001
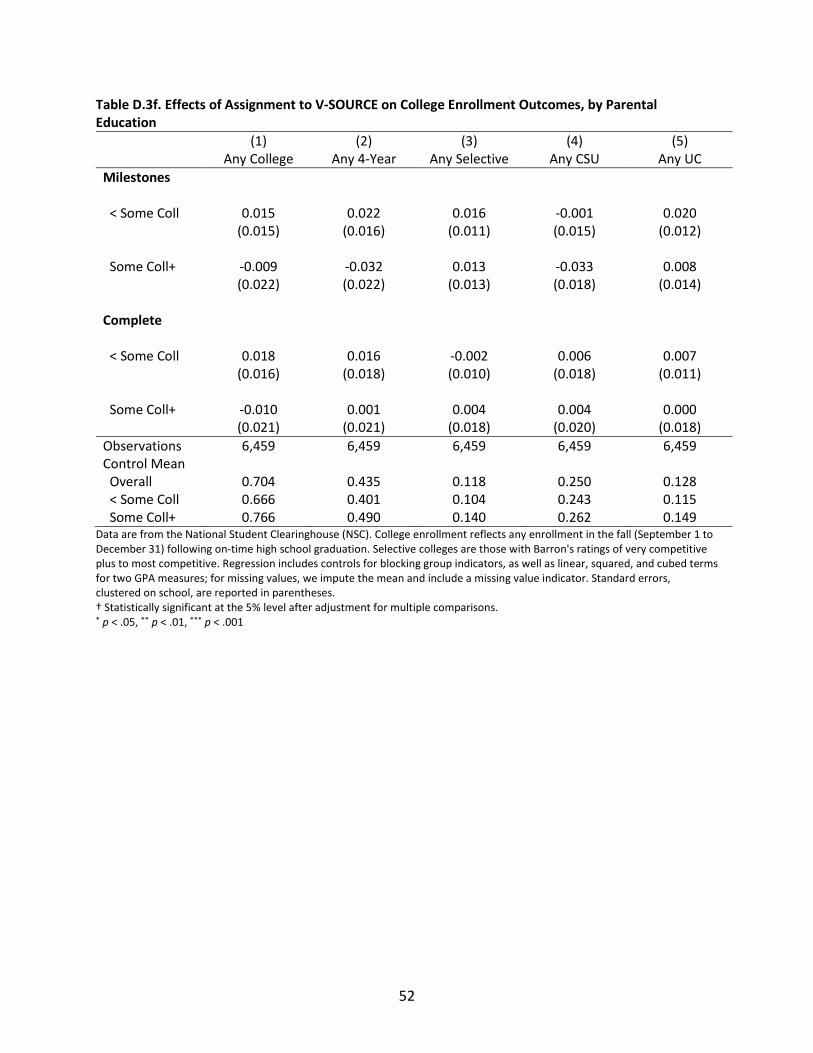
52
Table D.3f. Effects of Assignment to V-SOURCE on College Enrollment Outcomes, by Parental Education
(1) (2) (3) (4) (5) Any College Any 4-Year Any Selective Any CSU Any UC Milestones < Some Coll 0.015 0.022 0.016 -0.001 0.020 (0.015) (0.016) (0.011) (0.015) (0.012) Some Coll+ -0.009 -0.032 0.013 -0.033 0.008 (0.022) (0.022) (0.013) (0.018) (0.014) Complete < Some Coll 0.018 0.016 -0.002 0.006 0.007 (0.016) (0.018) (0.010) (0.018) (0.011) Some Coll+ -0.010 0.001 0.004 0.004 0.000 (0.021) (0.021) (0.018) (0.020) (0.018) Observations 6,459 6,459 6,459 6,459 6,459 Control Mean Overall 0.704 0.435 0.118 0.250 0.128 < Some Coll 0.666 0.401 0.104 0.243 0.115 Some Coll+ 0.766 0.490 0.140 0.262 0.149
Data are from the National Student Clearinghouse (NSC). College enrollment reflects any enrollment in the fall (September 1 to December 31) following on-time high school graduation. Selective colleges are those with Barron's ratings of very competitive plus to most competitive. Regression includes controls for blocking group indicators, as well as linear, squared, and cubed terms for two GPA measures; for missing values, we impute the mean and include a missing value indicator. Standard errors, clustered on school, are reported in parentheses. † Statistically significant at the 5% level after adjustment for multiple comparisons. * p < .05, ** p < .01, *** p < .001

53
Table D.3g. Effects of Assignment to V-SOURCE on College Persistence Outcomes, by Parental Education
(1) (2) (3) (4) (5) Any College Any 4-Year Any Selective Any CSU Any UC Milestones < Some Coll 0.002 0.017 0.013 -0.001 0.017 (0.016) (0.016) (0.011) (0.014) (0.011) Some Coll+ 0.020 -0.016 0.010 -0.022 0.013 (0.024) (0.021) (0.012) (0.017) (0.012) Complete < Some Coll 0.022 0.032 0.003 0.014 0.017 (0.018) (0.018) (0.010) (0.016) (0.011) Some Coll+ 0.018 0.007 0.004 0.004 0.000 (0.024) (0.019) (0.018) (0.018) (0.017) Observations 6,459 6,459 6,459 6,459 6,459 Control Mean Overall 0.632 0.367 0.109 0.204 0.115 < Some Coll 0.596 0.333 0.095 0.196 0.102 Some Coll+ 0.690 0.423 0.131 0.216 0.137
Data are from the National Student Clearinghouse (NSC). College enrollment reflects any enrollment in the fall (September 1 to December 31) following on-time high school graduation. Selective colleges are those with Barron's ratings of very competitive plus to most competitive. Regression includes controls for blocking group indicators, as well as linear, squared, and cubed terms for two GPA measures; for missing values, we impute the mean and include a missing value indicator. Standard errors, clustered on school, are reported in parentheses. † Statistically significant at the 5% level after adjustment for multiple comparisons. * p < .05, ** p < .01, *** p < .001
54
APPENDIX E. EXPLORATORY ANALYSIS OF HETEROGENEOUS TREATMENT EFFECTS In this appendix, we present heterogeneous treatment effect estimates by academic achievement, alternative sources of college access support, and students’ tendency to be disorganized and procrastinate. We show results only for application, admissions, and enrollment outcomes. As noted in the text, we generally do not have enough power to draw strong conclusions about differential treatment effects, but the patterns of coefficients across outcomes and subgroups provide some insight into whether the program operated as expected. As in Appendix D, we report summary statistics by sub-group before presenting the treatment effect estimates.
Academic Achievement
We use self-reported GPA from the Application Survey as our measure of academic achievement. Students were asked “If you had to apply to college today, what would your GPA be? Make your best guess if you’re not sure.” Self-reported GPA is likely subject to measurement error, either because students do not know their GPA or because it changed in relevant ways between when they reported it to us and when they applied to college. Still, self-reported GPA is highly predictive of whether and where students attend college and is also highly correlated with the GPA reported in California Student Aid Commission (CSAC) administrative data.3 We bin the data and drop students with a missing GPA or GPA less than 2.0 (2.7 and 1 percent of the sample, respectively).
3 The CSAC measure is the GPA calculated for purposes of CalGrant eligibility (which is somewhat different from the GPA UC and CSU calculate for purposes of admission). We do not use the CSAC GPA because it is measured after random assignment and also missing for many students. Among students for whom we have both measures, the correlation is 0.72.
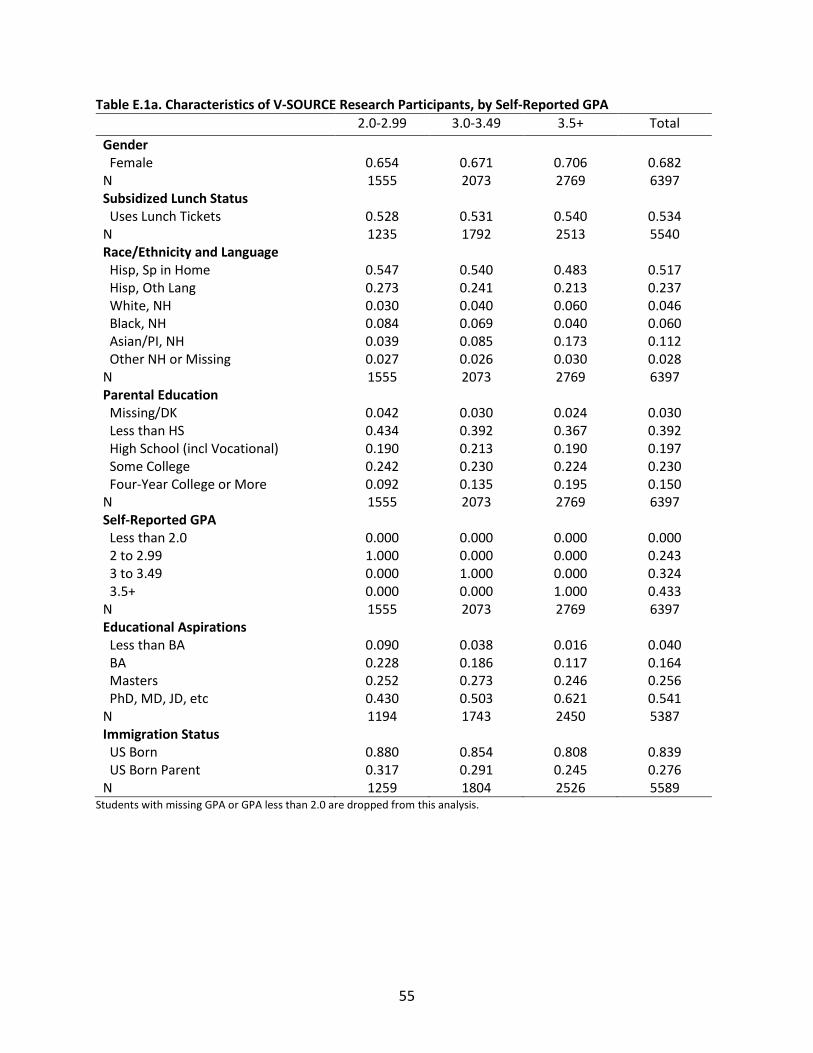
55
Table E.1a. Characteristics of V-SOURCE Research Participants, by Self-Reported GPA 2.0-2.99 3.0-3.49 3.5+ Total
Gender Female 0.654 0.671 0.706 0.682 N 1555 2073 2769 6397 Subsidized Lunch Status Uses Lunch Tickets 0.528 0.531 0.540 0.534 N 1235 1792 2513 5540 Race/Ethnicity and Language Hisp, Sp in Home 0.547 0.540 0.483 0.517 Hisp, Oth Lang 0.273 0.241 0.213 0.237 White, NH 0.030 0.040 0.060 0.046 Black, NH 0.084 0.069 0.040 0.060 Asian/PI, NH 0.039 0.085 0.173 0.112 Other NH or Missing 0.027 0.026 0.030 0.028 N 1555 2073 2769 6397 Parental Education Missing/DK 0.042 0.030 0.024 0.030 Less than HS 0.434 0.392 0.367 0.392 High School (incl Vocational) 0.190 0.213 0.190 0.197 Some College 0.242 0.230 0.224 0.230 Four-Year College or More 0.092 0.135 0.195 0.150 N 1555 2073 2769 6397 Self-Reported GPA Less than 2.0 0.000 0.000 0.000 0.000 2 to 2.99 1.000 0.000 0.000 0.243 3 to 3.49 0.000 1.000 0.000 0.324 3.5+ 0.000 0.000 1.000 0.433 N 1555 2073 2769 6397 Educational Aspirations Less than BA 0.090 0.038 0.016 0.040 BA 0.228 0.186 0.117 0.164 Masters 0.252 0.273 0.246 0.256 PhD, MD, JD, etc 0.430 0.503 0.621 0.541 N 1194 1743 2450 5387 Immigration Status US Born 0.880 0.854 0.808 0.839 US Born Parent 0.317 0.291 0.245 0.276 N 1259 1804 2526 5589
Students with missing GPA or GPA less than 2.0 are dropped from this analysis.
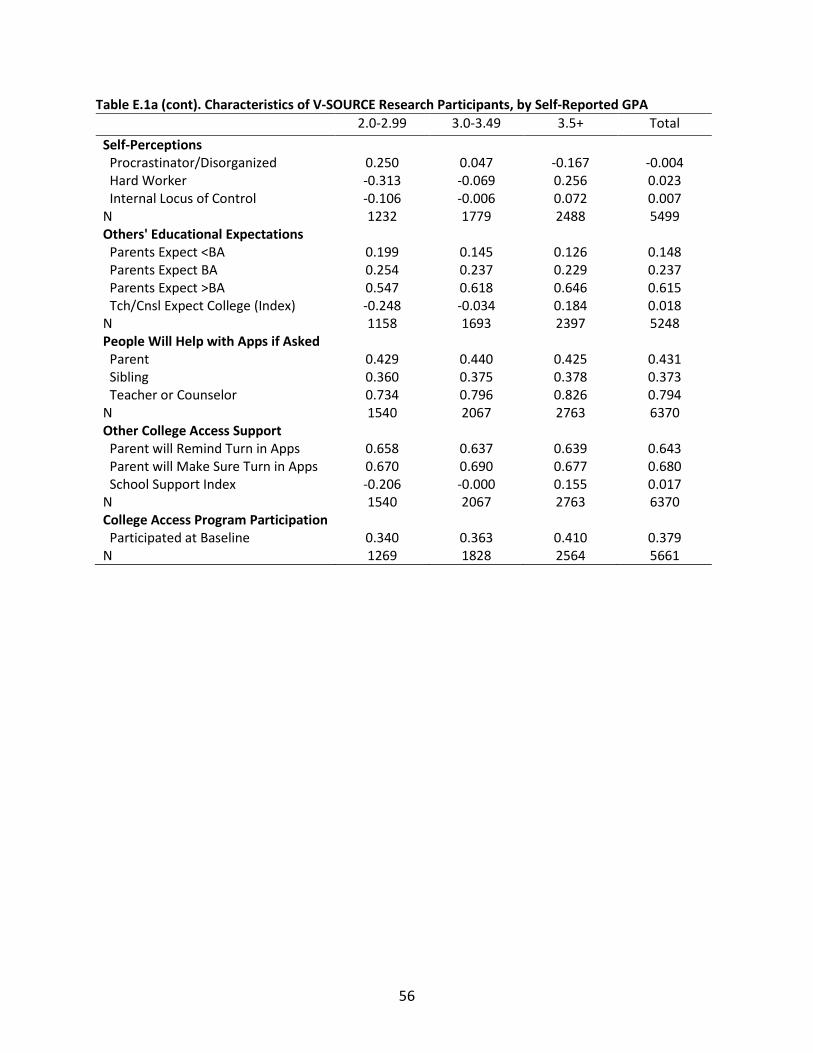
56
Table E.1a (cont). Characteristics of V-SOURCE Research Participants, by Self-Reported GPA 2.0-2.99 3.0-3.49 3.5+ Total
Self-Perceptions Procrastinator/Disorganized 0.250 0.047 -0.167 -0.004 Hard Worker -0.313 -0.069 0.256 0.023 Internal Locus of Control -0.106 -0.006 0.072 0.007 N 1232 1779 2488 5499 Others' Educational Expectations Parents Expect <BA 0.199 0.145 0.126 0.148 Parents Expect BA 0.254 0.237 0.229 0.237 Parents Expect >BA 0.547 0.618 0.646 0.615 Tch/Cnsl Expect College (Index) -0.248 -0.034 0.184 0.018 N 1158 1693 2397 5248 People Will Help with Apps if Asked Parent 0.429 0.440 0.425 0.431 Sibling 0.360 0.375 0.378 0.373 Teacher or Counselor 0.734 0.796 0.826 0.794 N 1540 2067 2763 6370 Other College Access Support Parent will Remind Turn in Apps 0.658 0.637 0.639 0.643 Parent will Make Sure Turn in Apps 0.670 0.690 0.677 0.680 School Support Index -0.206 -0.000 0.155 0.017 N 1540 2067 2763 6370 College Access Program Participation Participated at Baseline 0.340 0.363 0.410 0.379 N 1269 1828 2564 5661
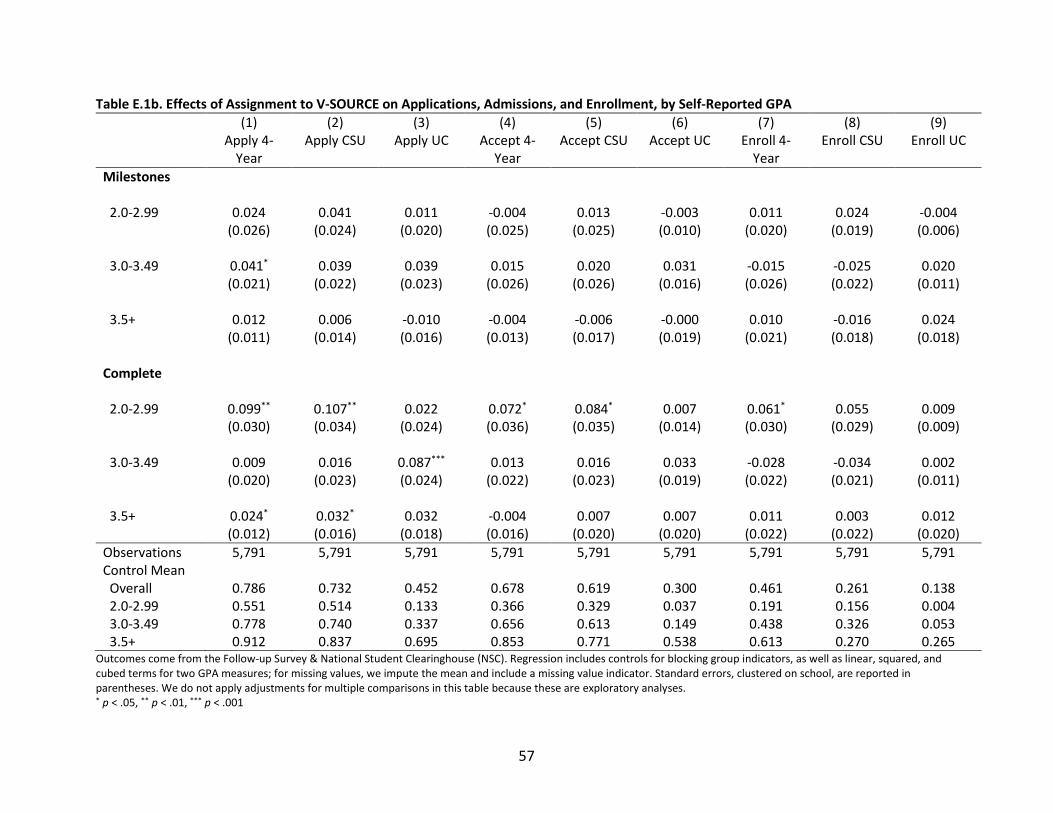
57
Table E.1b. Effects of Assignment to V-SOURCE on Applications, Admissions, and Enrollment, by Self-Reported GPA (1) (2) (3) (4) (5) (6) (7) (8) (9) Apply 4-
Year Apply CSU Apply UC Accept 4-
Year Accept CSU Accept UC Enroll 4-
Year Enroll CSU Enroll UC
Milestones 2.0-2.99 0.024 0.041 0.011 -0.004 0.013 -0.003 0.011 0.024 -0.004 (0.026) (0.024) (0.020) (0.025) (0.025) (0.010) (0.020) (0.019) (0.006) 3.0-3.49 0.041* 0.039 0.039 0.015 0.020 0.031 -0.015 -0.025 0.020 (0.021) (0.022) (0.023) (0.026) (0.026) (0.016) (0.026) (0.022) (0.011) 3.5+ 0.012 0.006 -0.010 -0.004 -0.006 -0.000 0.010 -0.016 0.024 (0.011) (0.014) (0.016) (0.013) (0.017) (0.019) (0.021) (0.018) (0.018) Complete 2.0-2.99 0.099** 0.107** 0.022 0.072* 0.084* 0.007 0.061* 0.055 0.009 (0.030) (0.034) (0.024) (0.036) (0.035) (0.014) (0.030) (0.029) (0.009) 3.0-3.49 0.009 0.016 0.087*** 0.013 0.016 0.033 -0.028 -0.034 0.002 (0.020) (0.023) (0.024) (0.022) (0.023) (0.019) (0.022) (0.021) (0.011) 3.5+ 0.024* 0.032* 0.032 -0.004 0.007 0.007 0.011 0.003 0.012 (0.012) (0.016) (0.018) (0.016) (0.020) (0.020) (0.022) (0.022) (0.020) Observations 5,791 5,791 5,791 5,791 5,791 5,791 5,791 5,791 5,791 Control Mean Overall 0.786 0.732 0.452 0.678 0.619 0.300 0.461 0.261 0.138 2.0-2.99 0.551 0.514 0.133 0.366 0.329 0.037 0.191 0.156 0.004 3.0-3.49 0.778 0.740 0.337 0.656 0.613 0.149 0.438 0.326 0.053 3.5+ 0.912 0.837 0.695 0.853 0.771 0.538 0.613 0.270 0.265
Outcomes come from the Follow-up Survey & National Student Clearinghouse (NSC). Regression includes controls for blocking group indicators, as well as linear, squared, and cubed terms for two GPA measures; for missing values, we impute the mean and include a missing value indicator. Standard errors, clustered on school, are reported in parentheses. We do not apply adjustments for multiple comparisons in this table because these are exploratory analyses. * p < .05, ** p < .01, *** p < .001
58
Alternative Sources of Support
We examine heterogeneity for four measures of alternative sources of college access support. The first three come from students’ responses to the following question: “Thinking of the people in your life, which of the following people will help you with college applications if you ask?” We created indicators for (1) parent will help, (2) brother or sister will help, and (3) teacher and/or school counselor will help.4 We also created an indicator equal to one if a student indicated on the Baseline that s/he had ever participated in any of the following programs: Talent Search, Upward Bound, GEAR UP, AVID (Advancement in Individual Determination), or MESA (Mathematics, Engineering, Science Achievement). We measured participation in other college access programs on the Baseline Survey (rather than the Application), which explains the smaller sample sizes for those analyses.
4 The full set of options for these questions also included “Other Relative,” “Family Friend,” “Friend,” and “Mentor (from a Program).” We could have combined these into a single measure of availability of alternative support overall, in the family, or at school, but we opted for the more-interpretable (and in the case of parental help, comparable to other studies) versions of these variables.
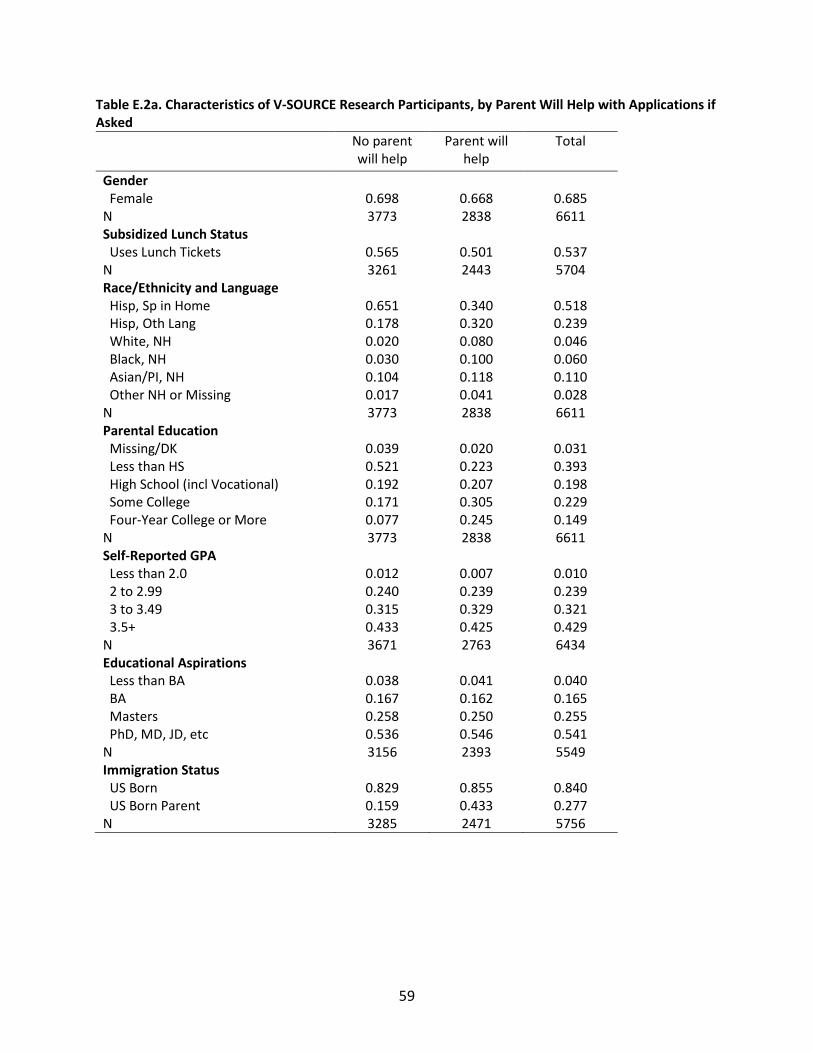
59
Table E.2a. Characteristics of V-SOURCE Research Participants, by Parent Will Help with Applications if Asked
No parent will help
Parent will help
Total
Gender Female 0.698 0.668 0.685 N 3773 2838 6611 Subsidized Lunch Status Uses Lunch Tickets 0.565 0.501 0.537 N 3261 2443 5704 Race/Ethnicity and Language Hisp, Sp in Home 0.651 0.340 0.518 Hisp, Oth Lang 0.178 0.320 0.239 White, NH 0.020 0.080 0.046 Black, NH 0.030 0.100 0.060 Asian/PI, NH 0.104 0.118 0.110 Other NH or Missing 0.017 0.041 0.028 N 3773 2838 6611 Parental Education Missing/DK 0.039 0.020 0.031 Less than HS 0.521 0.223 0.393 High School (incl Vocational) 0.192 0.207 0.198 Some College 0.171 0.305 0.229 Four-Year College or More 0.077 0.245 0.149 N 3773 2838 6611 Self-Reported GPA Less than 2.0 0.012 0.007 0.010 2 to 2.99 0.240 0.239 0.239 3 to 3.49 0.315 0.329 0.321 3.5+ 0.433 0.425 0.429 N 3671 2763 6434 Educational Aspirations Less than BA 0.038 0.041 0.040 BA 0.167 0.162 0.165 Masters 0.258 0.250 0.255 PhD, MD, JD, etc 0.536 0.546 0.541 N 3156 2393 5549 Immigration Status US Born 0.829 0.855 0.840 US Born Parent 0.159 0.433 0.277 N 3285 2471 5756

60
Table E.2a (cont). Characteristics of V-SOURCE Research Participants, by Parent Will Help with Applications if Asked
No parent will help
Parent will help
Total
Self-Perceptions Procrastinator/Disorganized 0.055 -0.062 0.004 Hard Worker -0.052 0.095 0.011 Internal Locus of Control -0.081 0.106 -0.000 N 3223 2438 5661 Others' Educational Expectations Parents Expect <BA 0.177 0.117 0.150 Parents Expect BA 0.229 0.246 0.236 Parents Expect >BA 0.594 0.638 0.613 Tch/Cnsl Expect College (Index) -0.018 0.050 0.012 N 3053 2351 5404 People Will Help with Apps if Asked Parent 0.000 1.000 0.429 Sibling 0.349 0.403 0.372 Teacher or Counselor 0.785 0.797 0.790 N 3773 2838 6611 Other College Access Support Parent will Remind Turn in Apps 0.447 0.898 0.641 Parent will Make Sure Turn in Apps 0.483 0.938 0.678 School Support Index -0.025 0.051 0.008 N 3773 2838 6611 College Access Program Participation Participated at Baseline 0.395 0.355 0.378 N 3335 2496 5831

61
Table E.2b. Effects of Assignment to V-SOURCE on Applications, Admissions, and Enrollment, by Parent Will Help with Applications if Asked (1) (2) (3) (4) (5) (6) (7) (8) (9) Apply 4-
Year Apply CSU Apply UC Accept 4-
Year Accept
CSU Accept UC Enroll 4-
Year Enroll CSU Enroll UC
Milestones No parent will help 0.032* 0.038* 0.026 0.005 0.009 0.015 0.020 -0.010 0.027* (0.014) (0.015) (0.016) (0.014) (0.017) (0.013) (0.020) (0.018) (0.013) Parent will help 0.017 0.005 -0.014 -0.006 -0.003 0.003 -0.026 -0.016 0.003 (0.017) (0.018) (0.018) (0.019) (0.021) (0.014) (0.020) (0.019) (0.012) Complete No parent will help 0.045** 0.065*** 0.067*** 0.024 0.033 0.018 -0.007 -0.013 0.014 (0.016) (0.018) (0.017) (0.019) (0.020) (0.014) (0.021) (0.020) (0.012) Parent will help 0.020 0.009 0.015 0.008 0.016 0.006 0.022 0.020 -0.004 (0.018) (0.020) (0.020) (0.024) (0.022) (0.016) (0.021) (0.020) (0.016) Observations 5,964 5,964 5,964 5,964 5,964 5,964 5,964 5,964 5,964 Control Mean Overall 0.780 0.728 0.447 0.673 0.617 0.296 0.459 0.261 0.137 No parent will help 0.800 0.749 0.468 0.700 0.650 0.329 0.469 0.271 0.146 Parent will help 0.752 0.699 0.417 0.637 0.571 0.250 0.445 0.248 0.124
Outcomes come from the Follow-up Survey & National Student Clearinghouse (NSC). Regression includes controls for blocking group indicators, as well as linear, squared, and cubed terms for two GPA measures; for missing values, we impute the mean and include a missing value indicator. Standard errors, clustered on school, are reported in parentheses. We do not apply adjustments for multiple comparisons in this table because these are exploratory analyses. * p < .05, ** p < .01, *** p < .001

62
Table E.3a. Characteristics of V-SOURCE Research Participants, by Sibling Will Help with Applications if Asked
No sibling will help
Sibling will help
Total
Gender Female 0.694 0.671 0.685 N 4150 2461 6611 Subsidized Lunch Status Uses Lunch Tickets 0.540 0.533 0.537 N 3556 2148 5704 Race/Ethnicity and Language Hisp, Sp in Home 0.513 0.525 0.518 Hisp, Oth Lang 0.251 0.219 0.239 White, NH 0.047 0.044 0.046 Black, NH 0.058 0.063 0.060 Asian/PI, NH 0.103 0.122 0.110 Other NH or Missing 0.028 0.027 0.028 N 4150 2461 6611 Parental Education Missing/DK 0.030 0.032 0.031 Less than HS 0.390 0.398 0.393 High School (incl Vocational) 0.200 0.196 0.198 Some College 0.232 0.224 0.229 Four-Year College or More 0.148 0.150 0.149 N 4150 2461 6611 Self-Reported GPA Less than 2.0 0.010 0.010 0.010 2 to 2.99 0.244 0.231 0.239 3 to 3.49 0.320 0.323 0.321 3.5+ 0.426 0.435 0.429 N 4035 2399 6434 Educational Aspirations Less than BA 0.043 0.034 0.040 BA 0.160 0.173 0.165 Masters 0.249 0.265 0.255 PhD, MD, JD, etc 0.548 0.529 0.541 N 3466 2083 5549 Immigration Status US Born 0.819 0.874 0.840 US Born Parent 0.300 0.238 0.277 N 3578 2178 5756
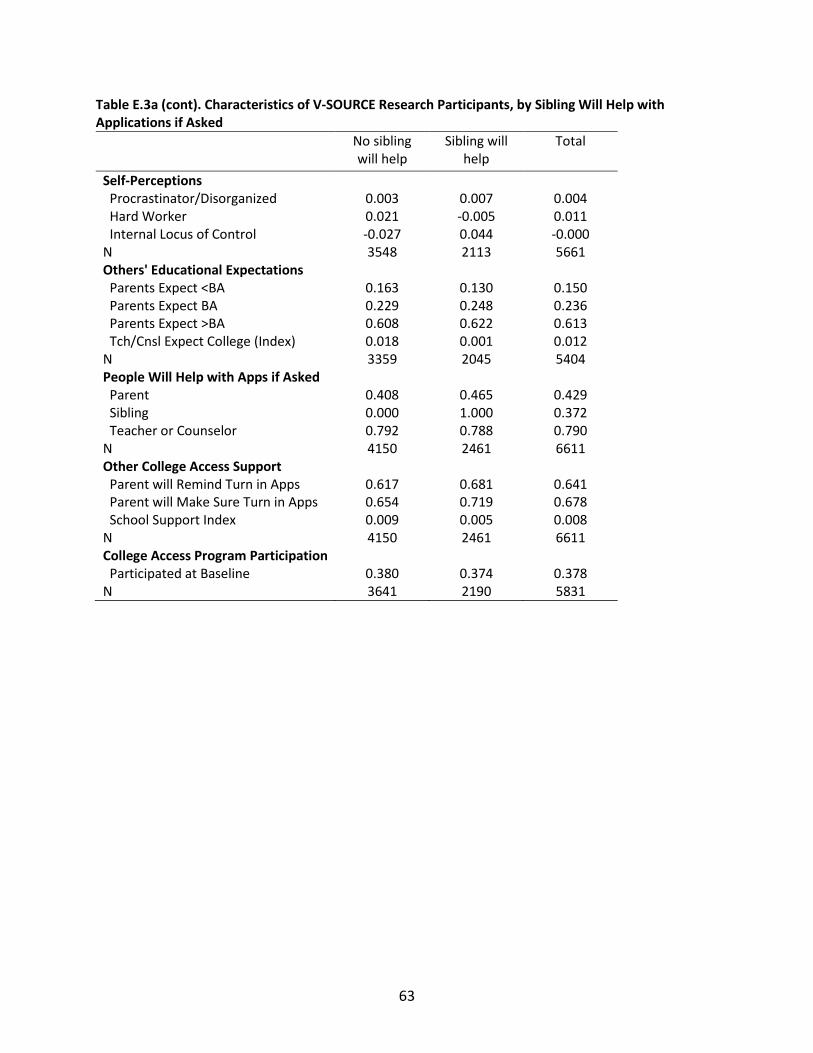
63
Table E.3a (cont). Characteristics of V-SOURCE Research Participants, by Sibling Will Help with Applications if Asked
No sibling will help
Sibling will help
Total
Self-Perceptions Procrastinator/Disorganized 0.003 0.007 0.004 Hard Worker 0.021 -0.005 0.011 Internal Locus of Control -0.027 0.044 -0.000 N 3548 2113 5661 Others' Educational Expectations Parents Expect <BA 0.163 0.130 0.150 Parents Expect BA 0.229 0.248 0.236 Parents Expect >BA 0.608 0.622 0.613 Tch/Cnsl Expect College (Index) 0.018 0.001 0.012 N 3359 2045 5404 People Will Help with Apps if Asked Parent 0.408 0.465 0.429 Sibling 0.000 1.000 0.372 Teacher or Counselor 0.792 0.788 0.790 N 4150 2461 6611 Other College Access Support Parent will Remind Turn in Apps 0.617 0.681 0.641 Parent will Make Sure Turn in Apps 0.654 0.719 0.678 School Support Index 0.009 0.005 0.008 N 4150 2461 6611 College Access Program Participation Participated at Baseline 0.380 0.374 0.378 N 3641 2190 5831
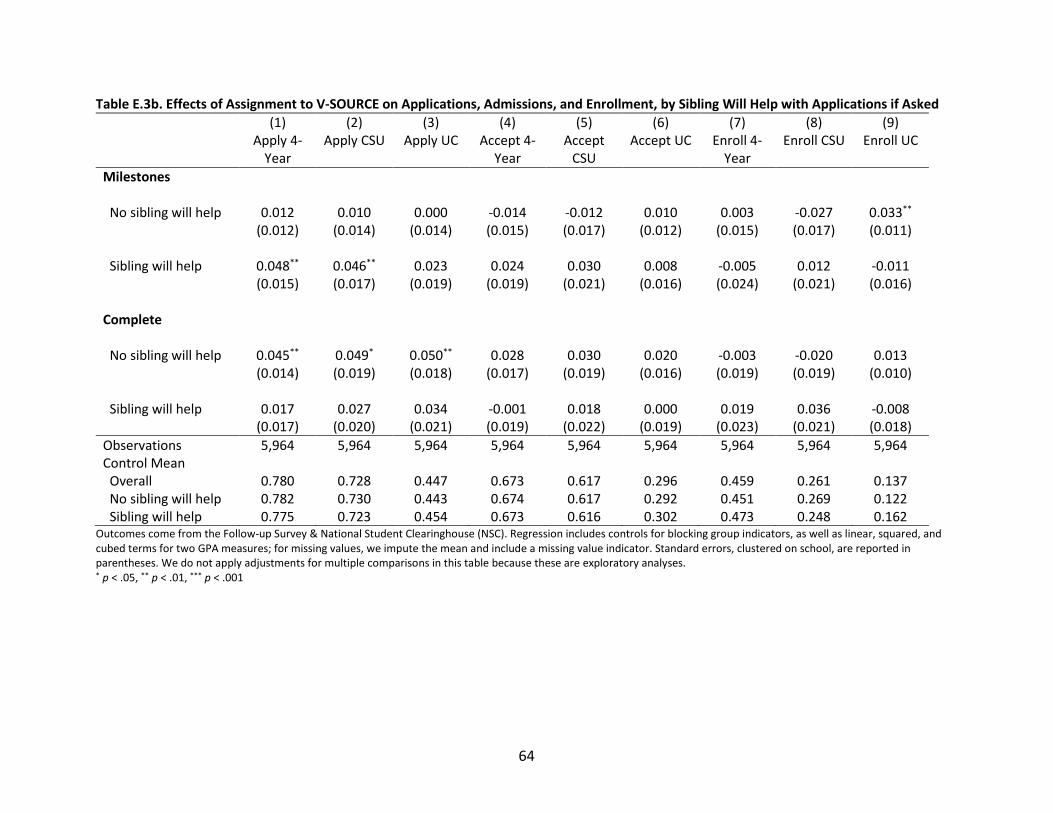
64
Table E.3b. Effects of Assignment to V-SOURCE on Applications, Admissions, and Enrollment, by Sibling Will Help with Applications if Asked (1) (2) (3) (4) (5) (6) (7) (8) (9) Apply 4-
Year Apply CSU Apply UC Accept 4-
Year Accept
CSU Accept UC Enroll 4-
Year Enroll CSU Enroll UC
Milestones No sibling will help 0.012 0.010 0.000 -0.014 -0.012 0.010 0.003 -0.027 0.033** (0.012) (0.014) (0.014) (0.015) (0.017) (0.012) (0.015) (0.017) (0.011) Sibling will help 0.048** 0.046** 0.023 0.024 0.030 0.008 -0.005 0.012 -0.011 (0.015) (0.017) (0.019) (0.019) (0.021) (0.016) (0.024) (0.021) (0.016) Complete No sibling will help 0.045** 0.049* 0.050** 0.028 0.030 0.020 -0.003 -0.020 0.013 (0.014) (0.019) (0.018) (0.017) (0.019) (0.016) (0.019) (0.019) (0.010) Sibling will help 0.017 0.027 0.034 -0.001 0.018 0.000 0.019 0.036 -0.008 (0.017) (0.020) (0.021) (0.019) (0.022) (0.019) (0.023) (0.021) (0.018) Observations 5,964 5,964 5,964 5,964 5,964 5,964 5,964 5,964 5,964 Control Mean Overall 0.780 0.728 0.447 0.673 0.617 0.296 0.459 0.261 0.137 No sibling will help 0.782 0.730 0.443 0.674 0.617 0.292 0.451 0.269 0.122 Sibling will help 0.775 0.723 0.454 0.673 0.616 0.302 0.473 0.248 0.162
Outcomes come from the Follow-up Survey & National Student Clearinghouse (NSC). Regression includes controls for blocking group indicators, as well as linear, squared, and cubed terms for two GPA measures; for missing values, we impute the mean and include a missing value indicator. Standard errors, clustered on school, are reported in parentheses. We do not apply adjustments for multiple comparisons in this table because these are exploratory analyses. * p < .05, ** p < .01, *** p < .001
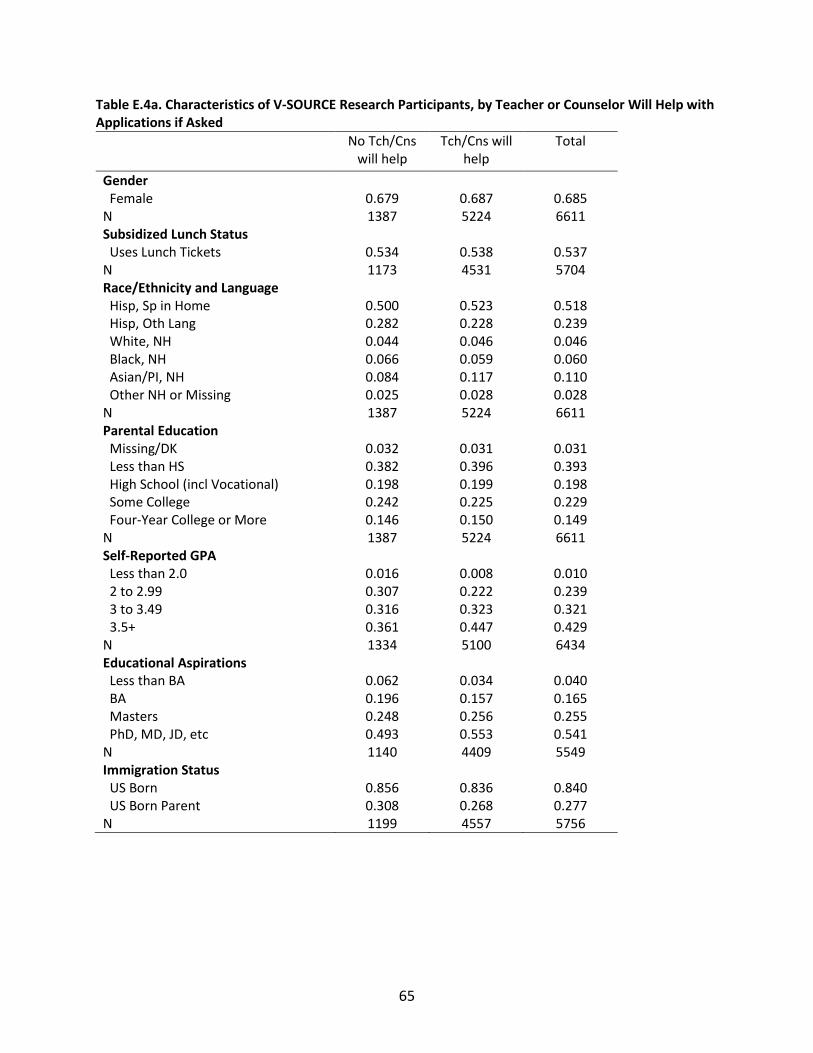
65
Table E.4a. Characteristics of V-SOURCE Research Participants, by Teacher or Counselor Will Help with Applications if Asked
No Tch/Cns will help
Tch/Cns will help
Total
Gender Female 0.679 0.687 0.685 N 1387 5224 6611 Subsidized Lunch Status Uses Lunch Tickets 0.534 0.538 0.537 N 1173 4531 5704 Race/Ethnicity and Language Hisp, Sp in Home 0.500 0.523 0.518 Hisp, Oth Lang 0.282 0.228 0.239 White, NH 0.044 0.046 0.046 Black, NH 0.066 0.059 0.060 Asian/PI, NH 0.084 0.117 0.110 Other NH or Missing 0.025 0.028 0.028 N 1387 5224 6611 Parental Education Missing/DK 0.032 0.031 0.031 Less than HS 0.382 0.396 0.393 High School (incl Vocational) 0.198 0.199 0.198 Some College 0.242 0.225 0.229 Four-Year College or More 0.146 0.150 0.149 N 1387 5224 6611 Self-Reported GPA Less than 2.0 0.016 0.008 0.010 2 to 2.99 0.307 0.222 0.239 3 to 3.49 0.316 0.323 0.321 3.5+ 0.361 0.447 0.429 N 1334 5100 6434 Educational Aspirations Less than BA 0.062 0.034 0.040 BA 0.196 0.157 0.165 Masters 0.248 0.256 0.255 PhD, MD, JD, etc 0.493 0.553 0.541 N 1140 4409 5549 Immigration Status US Born 0.856 0.836 0.840 US Born Parent 0.308 0.268 0.277 N 1199 4557 5756
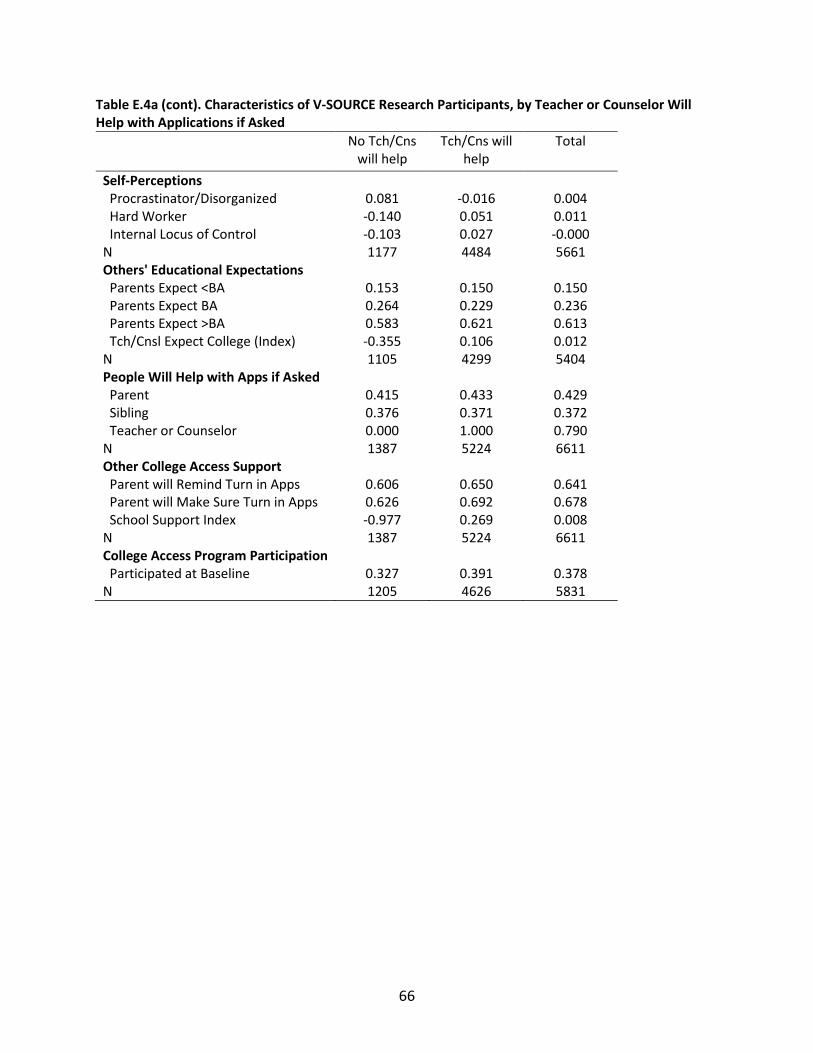
66
Table E.4a (cont). Characteristics of V-SOURCE Research Participants, by Teacher or Counselor Will Help with Applications if Asked
No Tch/Cns will help
Tch/Cns will help
Total
Self-Perceptions Procrastinator/Disorganized 0.081 -0.016 0.004 Hard Worker -0.140 0.051 0.011 Internal Locus of Control -0.103 0.027 -0.000 N 1177 4484 5661 Others' Educational Expectations Parents Expect <BA 0.153 0.150 0.150 Parents Expect BA 0.264 0.229 0.236 Parents Expect >BA 0.583 0.621 0.613 Tch/Cnsl Expect College (Index) -0.355 0.106 0.012 N 1105 4299 5404 People Will Help with Apps if Asked Parent 0.415 0.433 0.429 Sibling 0.376 0.371 0.372 Teacher or Counselor 0.000 1.000 0.790 N 1387 5224 6611 Other College Access Support Parent will Remind Turn in Apps 0.606 0.650 0.641 Parent will Make Sure Turn in Apps 0.626 0.692 0.678 School Support Index -0.977 0.269 0.008 N 1387 5224 6611 College Access Program Participation Participated at Baseline 0.327 0.391 0.378 N 1205 4626 5831
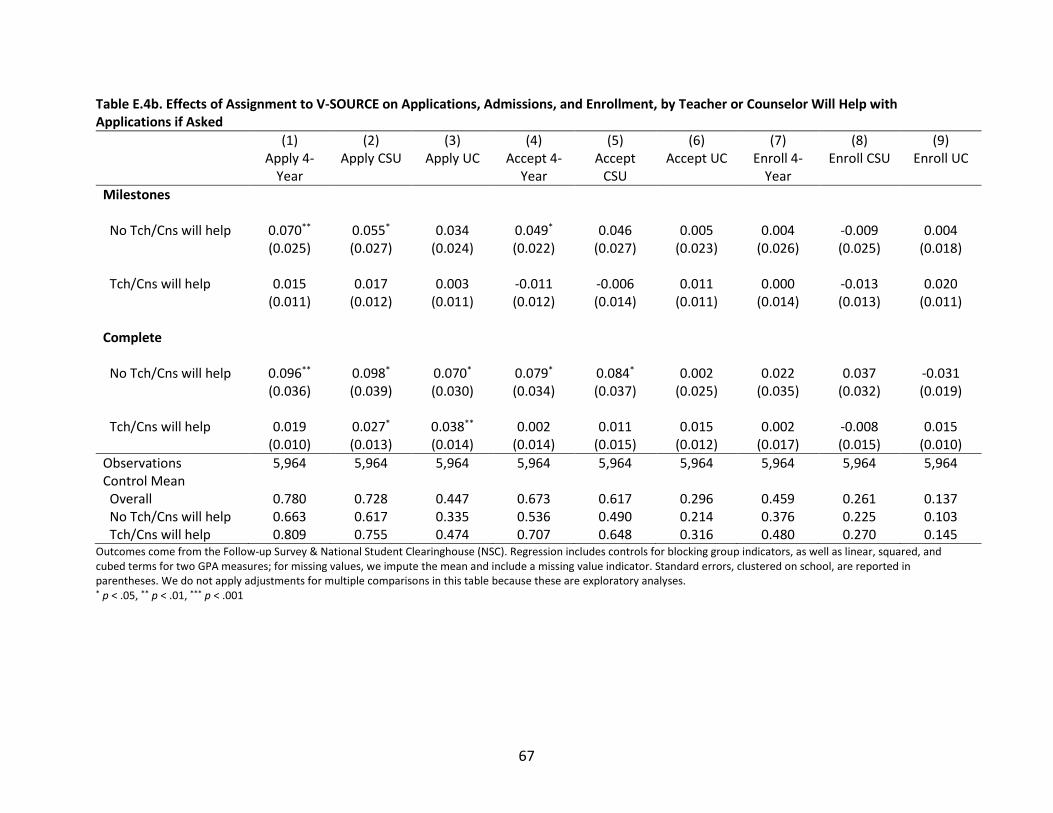
67
Table E.4b. Effects of Assignment to V-SOURCE on Applications, Admissions, and Enrollment, by Teacher or Counselor Will Help with Applications if Asked
(1) (2) (3) (4) (5) (6) (7) (8) (9) Apply 4-
Year Apply CSU Apply UC Accept 4-
Year Accept
CSU Accept UC Enroll 4-
Year Enroll CSU Enroll UC
Milestones No Tch/Cns will help 0.070** 0.055* 0.034 0.049* 0.046 0.005 0.004 -0.009 0.004 (0.025) (0.027) (0.024) (0.022) (0.027) (0.023) (0.026) (0.025) (0.018) Tch/Cns will help 0.015 0.017 0.003 -0.011 -0.006 0.011 0.000 -0.013 0.020 (0.011) (0.012) (0.011) (0.012) (0.014) (0.011) (0.014) (0.013) (0.011) Complete No Tch/Cns will help 0.096** 0.098* 0.070* 0.079* 0.084* 0.002 0.022 0.037 -0.031 (0.036) (0.039) (0.030) (0.034) (0.037) (0.025) (0.035) (0.032) (0.019) Tch/Cns will help 0.019 0.027* 0.038** 0.002 0.011 0.015 0.002 -0.008 0.015 (0.010) (0.013) (0.014) (0.014) (0.015) (0.012) (0.017) (0.015) (0.010) Observations 5,964 5,964 5,964 5,964 5,964 5,964 5,964 5,964 5,964 Control Mean Overall 0.780 0.728 0.447 0.673 0.617 0.296 0.459 0.261 0.137 No Tch/Cns will help 0.663 0.617 0.335 0.536 0.490 0.214 0.376 0.225 0.103 Tch/Cns will help 0.809 0.755 0.474 0.707 0.648 0.316 0.480 0.270 0.145
Outcomes come from the Follow-up Survey & National Student Clearinghouse (NSC). Regression includes controls for blocking group indicators, as well as linear, squared, and cubed terms for two GPA measures; for missing values, we impute the mean and include a missing value indicator. Standard errors, clustered on school, are reported in parentheses. We do not apply adjustments for multiple comparisons in this table because these are exploratory analyses. * p < .05, ** p < .01, *** p < .001
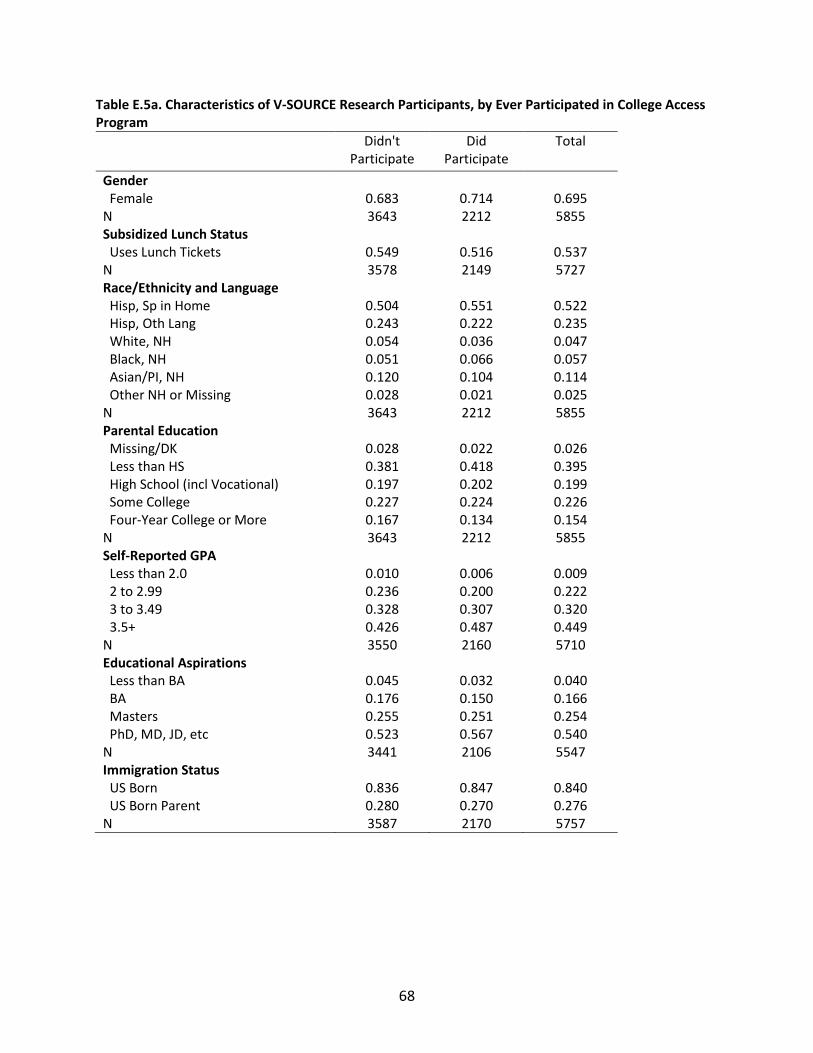
68
Table E.5a. Characteristics of V-SOURCE Research Participants, by Ever Participated in College Access Program
Didn't Participate
Did Participate
Total
Gender Female 0.683 0.714 0.695 N 3643 2212 5855 Subsidized Lunch Status Uses Lunch Tickets 0.549 0.516 0.537 N 3578 2149 5727 Race/Ethnicity and Language Hisp, Sp in Home 0.504 0.551 0.522 Hisp, Oth Lang 0.243 0.222 0.235 White, NH 0.054 0.036 0.047 Black, NH 0.051 0.066 0.057 Asian/PI, NH 0.120 0.104 0.114 Other NH or Missing 0.028 0.021 0.025 N 3643 2212 5855 Parental Education Missing/DK 0.028 0.022 0.026 Less than HS 0.381 0.418 0.395 High School (incl Vocational) 0.197 0.202 0.199 Some College 0.227 0.224 0.226 Four-Year College or More 0.167 0.134 0.154 N 3643 2212 5855 Self-Reported GPA Less than 2.0 0.010 0.006 0.009 2 to 2.99 0.236 0.200 0.222 3 to 3.49 0.328 0.307 0.320 3.5+ 0.426 0.487 0.449 N 3550 2160 5710 Educational Aspirations Less than BA 0.045 0.032 0.040 BA 0.176 0.150 0.166 Masters 0.255 0.251 0.254 PhD, MD, JD, etc 0.523 0.567 0.540 N 3441 2106 5547 Immigration Status US Born 0.836 0.847 0.840 US Born Parent 0.280 0.270 0.276 N 3587 2170 5757

69
Table E.5a (cont). Characteristics of V-SOURCE Research Participants, by Ever Participated in College Access Program
Didn't Participate
Did Participate
Total
Self-Perceptions Procrastinator/Disorganized 0.000 0.017 0.006 Hard Worker -0.035 0.086 0.011 Internal Locus of Control 0.003 -0.008 -0.001 N 3530 2144 5674 Others' Educational Expectations Parents Expect <BA 0.149 0.154 0.151 Parents Expect BA 0.246 0.219 0.236 Parents Expect >BA 0.605 0.626 0.613 Tch/Cnsl Expect College (Index) -0.029 0.079 0.012 N 3380 2046 5426 People Will Help with Apps if Asked Parent 0.444 0.402 0.428 Sibling 0.378 0.372 0.376 Teacher or Counselor 0.776 0.821 0.793 N 3628 2203 5831 Other College Access Support Parent will Remind Turn in Apps 0.658 0.616 0.642 Parent will Make Sure Turn in Apps 0.694 0.654 0.679 School Support Index -0.126 0.235 0.010 N 3628 2203 5831 College Access Program Participation Participated at Baseline 0.000 1.000 0.378 N 3643 2212 5855
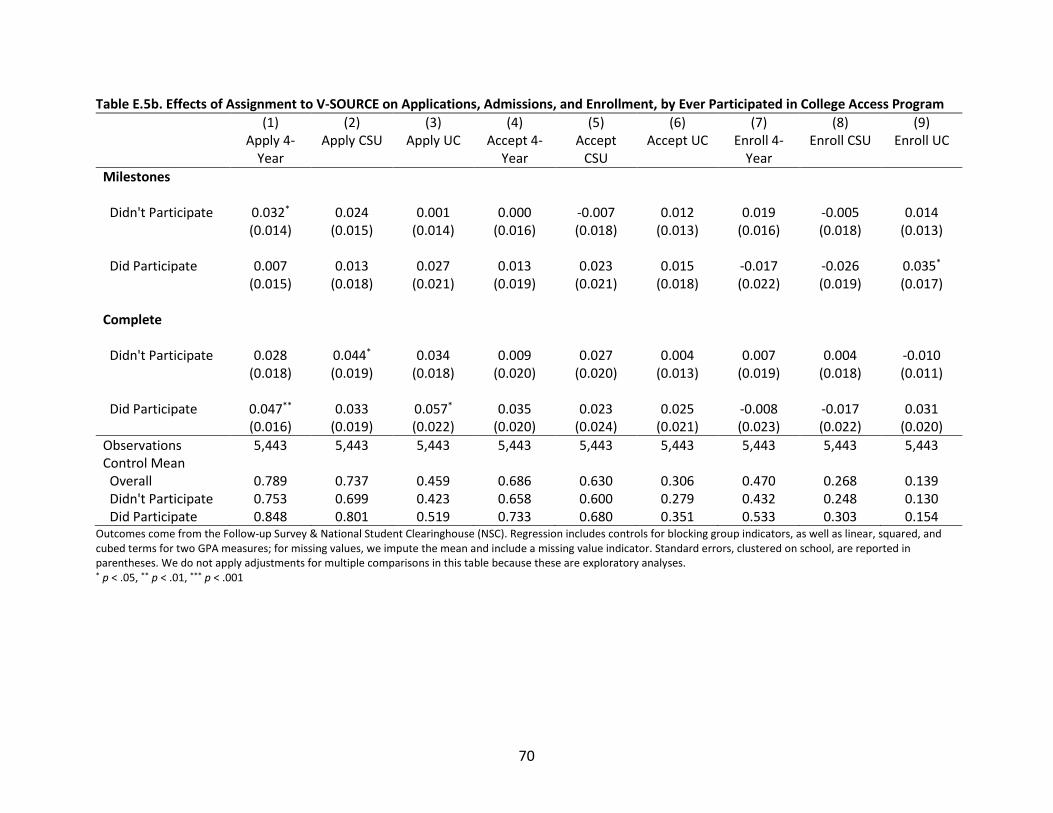
70
Table E.5b. Effects of Assignment to V-SOURCE on Applications, Admissions, and Enrollment, by Ever Participated in College Access Program (1) (2) (3) (4) (5) (6) (7) (8) (9) Apply 4-
Year Apply CSU Apply UC Accept 4-
Year Accept
CSU Accept UC Enroll 4-
Year Enroll CSU Enroll UC
Milestones Didn't Participate 0.032* 0.024 0.001 0.000 -0.007 0.012 0.019 -0.005 0.014 (0.014) (0.015) (0.014) (0.016) (0.018) (0.013) (0.016) (0.018) (0.013) Did Participate 0.007 0.013 0.027 0.013 0.023 0.015 -0.017 -0.026 0.035* (0.015) (0.018) (0.021) (0.019) (0.021) (0.018) (0.022) (0.019) (0.017) Complete Didn't Participate 0.028 0.044* 0.034 0.009 0.027 0.004 0.007 0.004 -0.010 (0.018) (0.019) (0.018) (0.020) (0.020) (0.013) (0.019) (0.018) (0.011) Did Participate 0.047** 0.033 0.057* 0.035 0.023 0.025 -0.008 -0.017 0.031 (0.016) (0.019) (0.022) (0.020) (0.024) (0.021) (0.023) (0.022) (0.020) Observations 5,443 5,443 5,443 5,443 5,443 5,443 5,443 5,443 5,443 Control Mean Overall 0.789 0.737 0.459 0.686 0.630 0.306 0.470 0.268 0.139 Didn't Participate 0.753 0.699 0.423 0.658 0.600 0.279 0.432 0.248 0.130 Did Participate 0.848 0.801 0.519 0.733 0.680 0.351 0.533 0.303 0.154
Outcomes come from the Follow-up Survey & National Student Clearinghouse (NSC). Regression includes controls for blocking group indicators, as well as linear, squared, and cubed terms for two GPA measures; for missing values, we impute the mean and include a missing value indicator. Standard errors, clustered on school, are reported in parentheses. We do not apply adjustments for multiple comparisons in this table because these are exploratory analyses. * p < .05, ** p < .01, *** p < .001
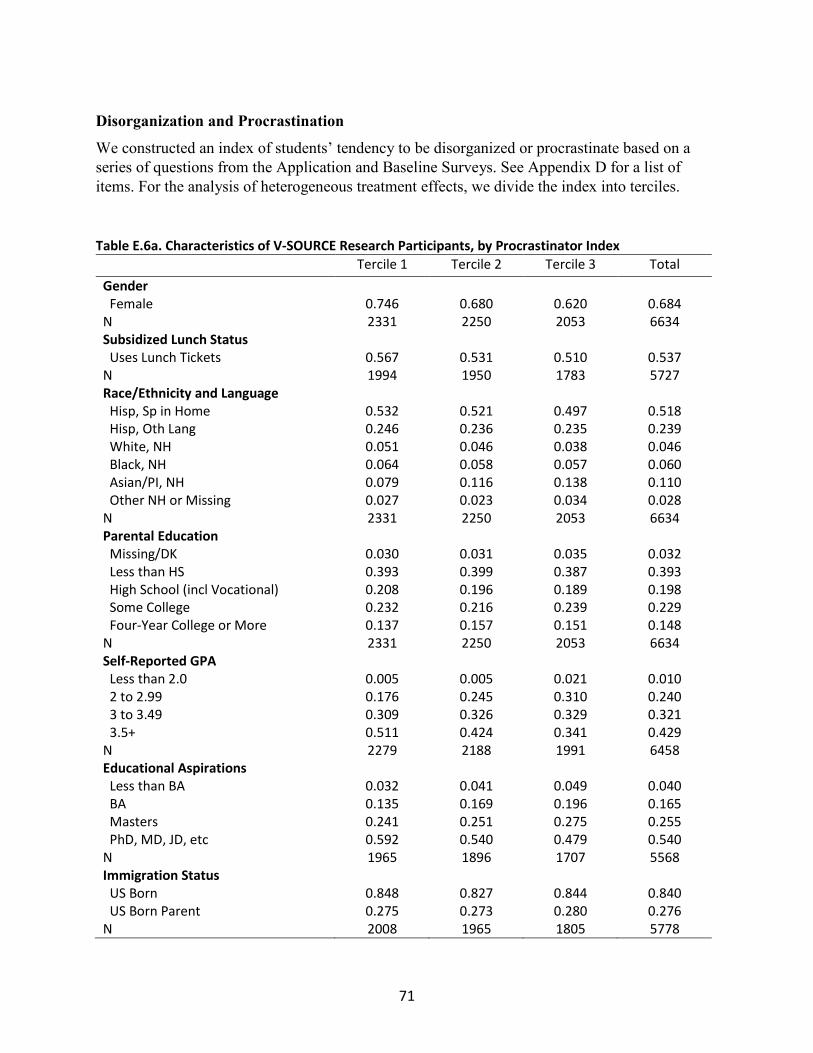
71
Disorganization and Procrastination
We constructed an index of students’ tendency to be disorganized or procrastinate based on a series of questions from the Application and Baseline Surveys. See Appendix D for a list of items. For the analysis of heterogeneous treatment effects, we divide the index into terciles.
Table E.6a. Characteristics of V-SOURCE Research Participants, by Procrastinator Index Tercile 1 Tercile 2 Tercile 3 Total
Gender Female 0.746 0.680 0.620 0.684 N 2331 2250 2053 6634 Subsidized Lunch Status Uses Lunch Tickets 0.567 0.531 0.510 0.537 N 1994 1950 1783 5727 Race/Ethnicity and Language Hisp, Sp in Home 0.532 0.521 0.497 0.518 Hisp, Oth Lang 0.246 0.236 0.235 0.239 White, NH 0.051 0.046 0.038 0.046 Black, NH 0.064 0.058 0.057 0.060 Asian/PI, NH 0.079 0.116 0.138 0.110 Other NH or Missing 0.027 0.023 0.034 0.028 N 2331 2250 2053 6634 Parental Education Missing/DK 0.030 0.031 0.035 0.032 Less than HS 0.393 0.399 0.387 0.393 High School (incl Vocational) 0.208 0.196 0.189 0.198 Some College 0.232 0.216 0.239 0.229 Four-Year College or More 0.137 0.157 0.151 0.148 N 2331 2250 2053 6634 Self-Reported GPA Less than 2.0 0.005 0.005 0.021 0.010 2 to 2.99 0.176 0.245 0.310 0.240 3 to 3.49 0.309 0.326 0.329 0.321 3.5+ 0.511 0.424 0.341 0.429 N 2279 2188 1991 6458 Educational Aspirations Less than BA 0.032 0.041 0.049 0.040 BA 0.135 0.169 0.196 0.165 Masters 0.241 0.251 0.275 0.255 PhD, MD, JD, etc 0.592 0.540 0.479 0.540 N 1965 1896 1707 5568 Immigration Status US Born 0.848 0.827 0.844 0.840 US Born Parent 0.275 0.273 0.280 0.276 N 2008 1965 1805 5778
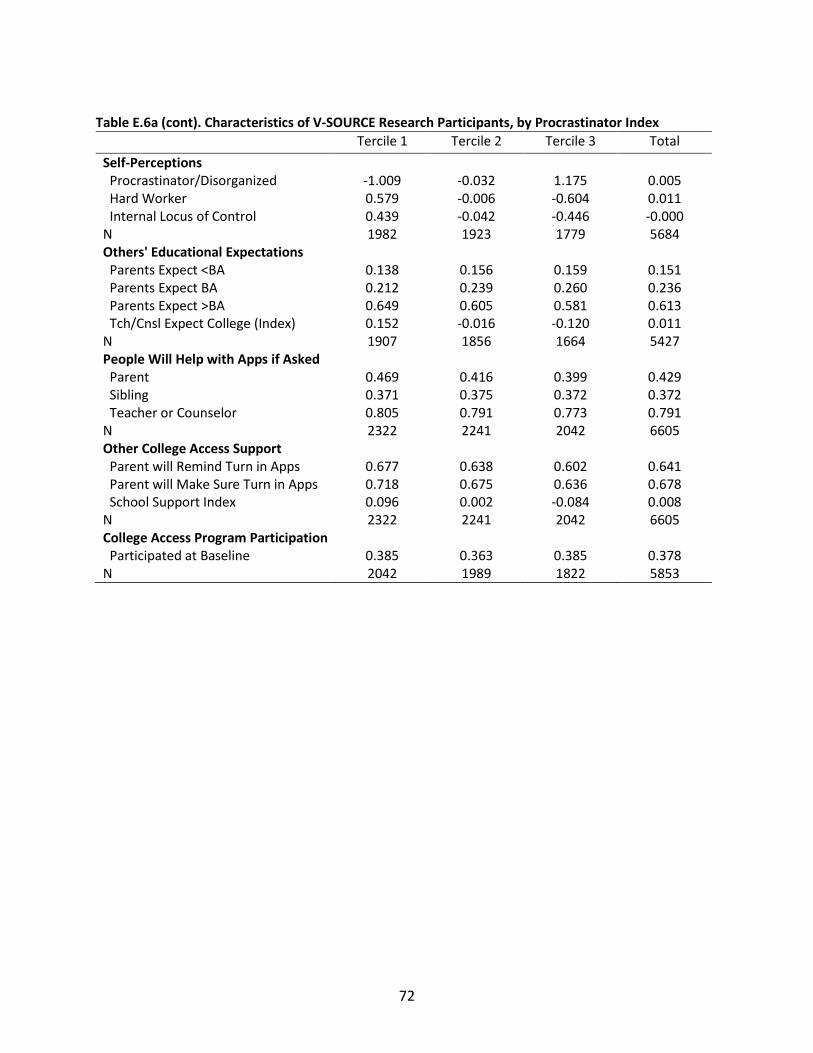
72
Table E.6a (cont). Characteristics of V-SOURCE Research Participants, by Procrastinator Index
Tercile 1 Tercile 2 Tercile 3 Total
Self-Perceptions Procrastinator/Disorganized -1.009 -0.032 1.175 0.005 Hard Worker 0.579 -0.006 -0.604 0.011 Internal Locus of Control 0.439 -0.042 -0.446 -0.000 N 1982 1923 1779 5684 Others' Educational Expectations Parents Expect <BA 0.138 0.156 0.159 0.151 Parents Expect BA 0.212 0.239 0.260 0.236 Parents Expect >BA 0.649 0.605 0.581 0.613 Tch/Cnsl Expect College (Index) 0.152 -0.016 -0.120 0.011 N 1907 1856 1664 5427 People Will Help with Apps if Asked Parent 0.469 0.416 0.399 0.429 Sibling 0.371 0.375 0.372 0.372 Teacher or Counselor 0.805 0.791 0.773 0.791 N 2322 2241 2042 6605 Other College Access Support Parent will Remind Turn in Apps 0.677 0.638 0.602 0.641 Parent will Make Sure Turn in Apps 0.718 0.675 0.636 0.678 School Support Index 0.096 0.002 -0.084 0.008 N 2322 2241 2042 6605 College Access Program Participation Participated at Baseline 0.385 0.363 0.385 0.378 N 2042 1989 1822 5853
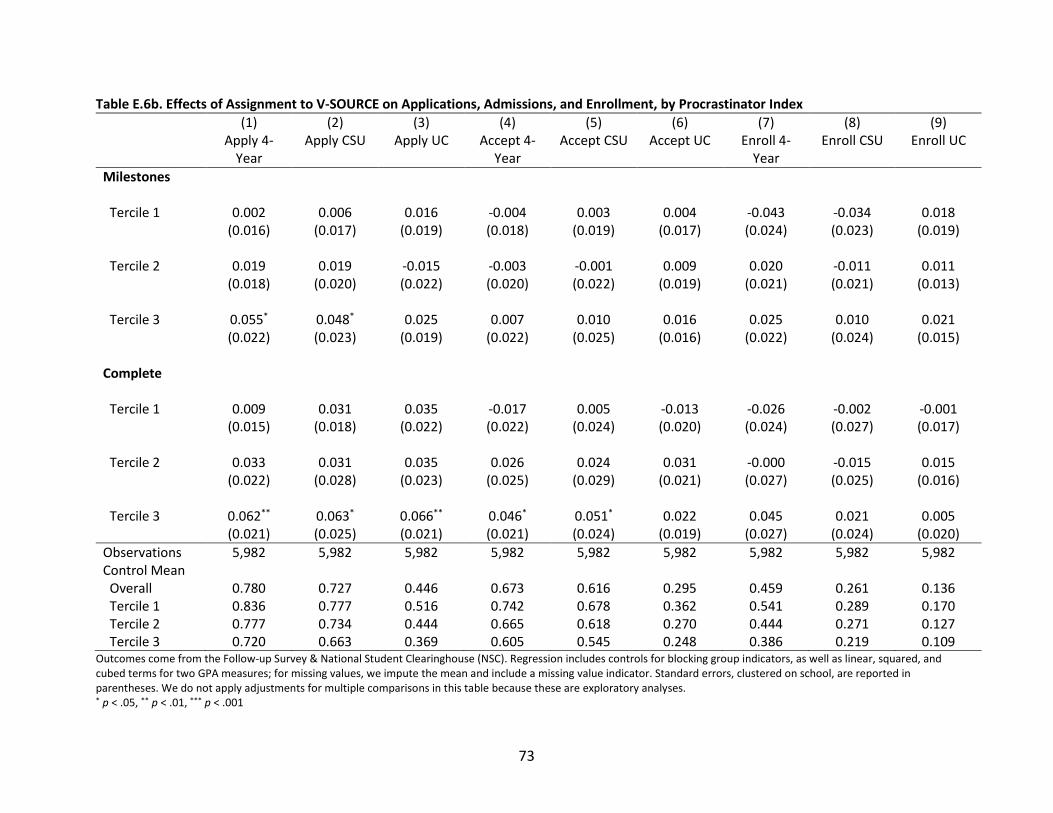
73
Table E.6b. Effects of Assignment to V-SOURCE on Applications, Admissions, and Enrollment, by Procrastinator Index (1) (2) (3) (4) (5) (6) (7) (8) (9) Apply 4-
Year Apply CSU Apply UC Accept 4-
Year Accept CSU Accept UC Enroll 4-
Year Enroll CSU Enroll UC
Milestones Tercile 1 0.002 0.006 0.016 -0.004 0.003 0.004 -0.043 -0.034 0.018 (0.016) (0.017) (0.019) (0.018) (0.019) (0.017) (0.024) (0.023) (0.019) Tercile 2 0.019 0.019 -0.015 -0.003 -0.001 0.009 0.020 -0.011 0.011 (0.018) (0.020) (0.022) (0.020) (0.022) (0.019) (0.021) (0.021) (0.013) Tercile 3 0.055* 0.048* 0.025 0.007 0.010 0.016 0.025 0.010 0.021 (0.022) (0.023) (0.019) (0.022) (0.025) (0.016) (0.022) (0.024) (0.015) Complete Tercile 1 0.009 0.031 0.035 -0.017 0.005 -0.013 -0.026 -0.002 -0.001 (0.015) (0.018) (0.022) (0.022) (0.024) (0.020) (0.024) (0.027) (0.017) Tercile 2 0.033 0.031 0.035 0.026 0.024 0.031 -0.000 -0.015 0.015 (0.022) (0.028) (0.023) (0.025) (0.029) (0.021) (0.027) (0.025) (0.016) Tercile 3 0.062** 0.063* 0.066** 0.046* 0.051* 0.022 0.045 0.021 0.005 (0.021) (0.025) (0.021) (0.021) (0.024) (0.019) (0.027) (0.024) (0.020) Observations 5,982 5,982 5,982 5,982 5,982 5,982 5,982 5,982 5,982 Control Mean Overall 0.780 0.727 0.446 0.673 0.616 0.295 0.459 0.261 0.136 Tercile 1 0.836 0.777 0.516 0.742 0.678 0.362 0.541 0.289 0.170 Tercile 2 0.777 0.734 0.444 0.665 0.618 0.270 0.444 0.271 0.127 Tercile 3 0.720 0.663 0.369 0.605 0.545 0.248 0.386 0.219 0.109
Outcomes come from the Follow-up Survey & National Student Clearinghouse (NSC). Regression includes controls for blocking group indicators, as well as linear, squared, and cubed terms for two GPA measures; for missing values, we impute the mean and include a missing value indicator. Standard errors, clustered on school, are reported in parentheses. We do not apply adjustments for multiple comparisons in this table because these are exploratory analyses. * p < .05, ** p < .01, *** p < .001