Embed Size (px)
Citation preview

Opposite changes in leaf dark respiration and soluble sugarswith drought in two Mediterranean oaks
JesúsRodríguez-CalcerradaA,B,OulaShahinA,MaríadelCarmendelReyAandSergeRambalA
ACentre of Functional and Evolutionary Ecology, CNRS 1919 Route de Mende, 34293,Montpellier Cedex 5, France.
BCorresponding author. Emails: [email protected]; [email protected]
Abstract. The decline in net photosynthetic CO2 uptake (An) caused by drought could reduce the availability of solublesugars and thus limit leaf dark respiration (Rd). We investigated the response of leaf gas exchange and nonstructuralcarbohydrates to drought by stoppingwatering to 2-year-old plants ofQuercus ilexL. andQuercus pubescensWilld. grownin large pots. An declined with increasing water deficit more rapidly than Rd, and Rd declined slightly more steeply inQ. ilexthan in Q. pubescens. Soluble sugars increased in drought-treated plants relative to control well watered plants, and theopposite patternwas found for starch. After rewatering, Rd returned to pre-drought rateswithin 2 days andAnwithin 1week.Soluble sugars tended to recover pre-drought values after rewatering but continued to be significantly higher in drought-treated than control plants of Q. pubescens, for which the increase in the concentration of soluble sugars had been higher.These results suggest that the relative production of soluble sugars is upregulated when An is limited, and that solublesugars do not control respiratory rates in response to and recovery from water deficit. Rather, we suggest that the decline inRd contributes to drought tolerance by reducing the consumption of soluble sugars, which play an important role asosmoprotectants during water deficit stress.
Additional keywords: carbon depletion, ecological strategy, temperature sensitivity, water stress.
Received 1 June 2011, accepted 13 September 2011, published online 14 November 2011
Introduction
The regulation of leaf photosynthetic CO2 uptake (An) and darkrespiratoryCO2 release (Rd) in response to shifting environmentalconditions is an important aspect of plants’ physiologicalecology. As they need to maintain a positive carbon balance tosurvive, the response of An and Rd to the onset and relief of watershortage could have important consequences for plant fitnessunder drought conditions (Grubb 1998; McDowell et al. 2008;Adams et al. 2009; McDowell 2011). If this were so, at least forsmall plants (see Millard and Grelet 2010), the response of An
and Rd to the onset and relief of water shortage should differbetween species according to their ability to cope with droughtand to succeed in dry regions.
Broadly, drought-avoiding species shut the stomata atrelatively high water potentials to avoid water loss, whereasdrought-tolerant species are able to maintain relatively highvalues of stomatal conductance and An at low water potentials(Levitt 1972). The response of Rd is not so straightforward. Rd
generally declines as plant water deficit increases (Galmés et al.2007 and references therein; Atkin and Macherel 2009 andreferences therein), but there are some exceptions that are notapparently linked to the methodology employed or the ecologyof the species (e.g. Flexas et al. 2005; Slot et al. 2008). Thereduction of Rd caused by water deficit is thought to contribute
to surviving summer drought in Mediterranean-type climates(Grubb 1998). Under the hypothesis that carbon starvationhas exerted a selective pressure to reduce Rd during droughtperiods, one should expect a higher downregulation of Rd indrought-resistant than in drought-sensitive species, and indrought-avoiding species, which are more prone to sufferfrom carbon starvation due to a strong stomatal control ofwater loss (McDowell et al. 2008), than in drought-tolerantspecies. However, comparative studies have not found anyclear relationship between the degree or strategy of a species’drought-resistance and the effect of water deficit on Rd (Galméset al. 2007; Piper 2011). There are multiple processes thatdepend on the supply of respiratory energy (e.g. proteinsynthesis, maintenance of solute gradients) whose sensitivityto water shortage may differ between species, even those withsimilar ecological characteristics. Moreover, besides Rd, othermechanisms determine the extent of carbon use, and thus thecarbon pool size under drought (Sala et al. 2010; Piper 2011).
The extent of recovery of An and Rd after drought depends,in part, on the severity of previous stress. Plants that havebeen exposed to severe water deficits can take long time inrecovering normal rates of leaf gas exchange after rehydration;the stomata remain closed for some time even if the leaveshave completely rehydrated (Gallé and Feller 2007), and the
CSIRO PUBLISHING
Functional Plant Biologyhttp://dx.doi.org/10.1071/FP11135
Journal compilation � CSIRO 2011 www.publish.csiro.au/journals/fpb

photosynthetic apparatus is often damaged and restricts An
temporarily or definitely (Flexas et al. 2004; Chaves et al.2009 and references therein). The response of Rd is even morevariable. Rd can remain unchanged, recover to or even surpasspre-stress levels once the water shortage ends (Galmés et al.2007; Atkin andMacherel 2009).When drought is so intense thatthe photosynthetic apparatus becomes damaged, rates of Rd
can exceed pre-stress values due to extra repair costs afterstress relief, as occurs after ozone exposure (Amthor 1988).The extent to which plants reopen their stomata and restoretheir photosynthetic and respiratory capacities after droughtends will depend on their efficiency in re-establishing a normalmetabolic activity. These responses may be adaptive in enablingindividuals to take advantage of small windows of favourableconditions in dry habitats. Thus the recovery of An and Rd maydepend on the ecology of the species and particular related traitssuch as leaf structure (Chaves andOliveira 2004) or leaf life-span(Galmés et al. 2007).
In Mediterranean-type ecosystems, trees are exposed toparallel increases in temperature and soil water deficit duringthe summer months. Because long-term exposure of plantsto increased temperatures causes a reduction in the rate ofrespiration at a common measuring temperature (e.g. Atkinet al. 2005; Ow et al. 2010), and a similar effect is oftenobserved in response to water deficit, it is probable that thesummer decline of respiration in Mediterranean-typeecosystems is underpinned by both heat (thermal acclimation)and drought (drought acclimation). Recent works aimed atseparating the contribution of temperature and water deficiton leaf respiration point towards this possibility, with summerdrought accentuating the seasonal downward shift in Rd causedby increasing temperatures (Crous et al. 2011; Rodríguez-Calcerrada et al. 2011). The decline in the concentration ofsoluble sugars, energy demand or even respiratory capacitythat mediate thermal acclimation also seems to be involved inthe reduction of Rd by water deficit (Atkin et al. 2005; Atkin andMacherel 2009).Again, froman evolutionary point of view, sincethe reduction of Rd in response to heat and drought helps plants tokeep a positive carbon balance, one might expect a higher degreeof thermal and drought acclimation in typical Mediterranean,more drought-resistant species than in sub-Mediterranean ones.
The first objective of the present work is to compare theresponse of leaf gas exchange and related biochemical traits todrought in two sympatric oak species with a marked stomatalcontrol of water loss and tolerance of leaf dehydration: Quercusilex L., an evergreen tree, and Quercus pubescens Willd., a lessdrought-resistant deciduous tree that co-occurs with but is lessfrequent thanQ. ilex in semiaridMediterranean sites (Quézel andMédail 2003). We hypothesised that Rd would decrease withincreasing water deficit, and that the decline of Rdwould be fasterin Q. ilex than in Q. pubescens. We also hypothesised that Rd
would recover after water shortage relief, and that the extent ofrecovery would depend on the intensity and tolerance of previouswater stress. Our second objective was to quantify the relativeimportance of temperature and water deficit on the long-termtemporal variation of Rd. We hypothesised that both factorswould contribute in gearing down Rd, and that the extent ofdecline (i.e. thermal and drought acclimation) would be higher inQ. ilex than in Q. pubescens.
Materials and methodsPlant material and experimental design
Seeds of Quercus pubescens Willd. and Quercus ilex L. takenfrom severalmother trees in a forest standwere sown in 14-L pots(80 cm in depth)filledwith 10%sieved natural soil, 30%sand and60% loam homogeneously mixed. All seeds were of similar,median size and had recently germinated at the time of sowing.Seedlings were regularly watered to field capacity until the firstcohort of leaves was fully developed. Then they were randomlyassigned to either a control group (plants regularly watered tofield capacity; soil water content �0.36 cm3 H2O cm–3 soil), amild drought group (withholding watering until soil moisturewas �50% of field capacity; stomatal conductance (gs)<125mmolm–2 s–1) or a severe drought group (�37.5% offield capacity; gs <50mmolm–2 s–1). These treatments wereapplied until the end of the vegetative period, when all potswere rewatered to field capacity in order to simulate the typicalautumn rain that follows Mediterranean summer drought.Treatments were randomly assigned to four complete blocks,with plants of Q. pubescens and Q. ilex placed alternately withineach treatment. Thepotswere placedoutdoors beneath a 3-mhighrainout shelter with open lateral sides and a transparent roof thatallowed natural ventilation and irradiance.
In the second year, seedlings were also kept watered tofield capacity until the first cohort of leaves was fullydeveloped (constant leaf lamina size and mass per unit area;data not shown). Then each plant was again subjected to regularwatering or water withholding, as in the first year. Measurementswere made in this second year in plants from the control(hereafter C) and severe drought (hereafter D) groups. Fiveseedlings of Q. pubescens and Q. ilex from each treatmentwere selected for measuring different physiological,morphological and chemical leaf traits along the course of adrought cycle, which comprised almost 2 months fromwithholding irrigation to rewatering.
Water statusWe measured water potential before dawn (Ypd) in one leaf perplantwith a pressure chamber (PMS InstrumentCo.,Albany,OR,USA), generally once per week. These leaves were dried at 70�Cfor 48 h and stored for subsequent chemical analyses (petiolesexcluded; see below). The ratio of leaf dry mass to leaf area(LMA) was also calculated.
Gas exchange
Net photosynthetic CO2 uptake (An), gs and dark respiratory CO2
release (Rd) were measured at ambient air temperature (typically24–26�C), relative humidity (typically 35–65%) and CO2
concentration (380 ppm, using the 6400-01 CO2 mixer; Li-Cor) using a gas-exchange analyser system (Li-6400, Li-CorInc., Lincoln, NE, USA). Measurements were made once a weekover the course of the drought cycle, typically within 1 day butoccasionally in 2 days (e.g. if temperatures rose too fast duringthe day). An and gs were measured at saturating irradiance(1500mmolm–2 s–1) using the light source of the Li-6400 leafchamber. We waited for gs (and An) to show constant readings,which took 2–20min depending on previous sunlight conditionsfor plants. Rd was measured after ~30min of dark adaptation to
B Functional Plant Biology J. Rodríguez-Calcerrada et al.

avoidpotential increases inCO2 release causedby light.Given theimportance of measuring Rd at a leaf temperature similar to therest of the plant (Atkin et al. 2000), Rd was measured at differenttimes of the day, usually in the early morning, when all leaveswere at 24–26�C (R25). We checked leaf temperature with aninfrared thermometer (Optris Mini Sight, Micro-Epsilon,Germany) before enclosing it in the chamber. We then usedthe Li-6400 temperature control system to maintain the sametemperature inside the chamber. Measurements were the averageof 10 logs, occasionally 20 in the case of Rd. All rates of gasexchange were corrected by the actual leaf surface enclosedwithin the 6-cm2 chamber.
Short-term temperature sensitivity and thermal-and drought-acclimation of leaf dark respiration
In addition to weekly values of Rd at or near 25�C (R25), wemeasured Rd at different times of the night and day (at theprevailing ambient air temperatures) to estimate the short-termtemperature sensitivity of Rd (as in Atkin et al. 2000; Zaragoza-Castells et al. 2008). Measurements were made before stoppingwatering and when plants were severely stressed. The short-term temperature sensitivity of Rd (Q10) was calculated for eachplant as:
Q10 ¼ e10k ;
where k is the slope of the regression line fitted to ln Rd versustemperature data (Atkin et al. 2005).
Since plants were grown under natural temperature conditionsbut with controlled watering, we could estimate the relativecontribution of temperature and water status (Ypd) on the shiftof Rd that took place over the course of the experiment. First, wecompared the change inR25 that tookplacebetween thebeginningand end of the drought cycle in C plants (change in temperature(DT) �7�C, DYpd � 0.05MPa; Fig. 1) and D plants (DT � 7�C,DYpd� 2.5MPa). Second, we compared the temporal change inRd estimated at the mean temperature of each period (Ramb) in Cand D plants. To calculate Ramb, we used the equation:
Ramb ¼ R0Q10eTamb10ð Þ;
whereR0 is the rate ofRd at 0�Cestimated from the regression linefitted to logRdversus temperature data andTamb is the temperatureof each respective period (i.e. the mean temperature over the5 days precedingmeasurements). Then we calculated an index ofacclimation for C and D plants – similar to that proposed byLoveys et al. (2003) for thermal acclimation – as:
Ia ¼ Rambbeg:
Ramb end;
where Ramb beg. and Ramb end are the rates of Ramb at the beginningand end of the drought cycle, respectively.
Air temperature was continuously measured in the centre ofthe rainout shelter at 1.5m height.
Chlorophyll fluorescence
We estimated the dark-adapted maximum quantum yield of PSIIbefore dawn (Fv/Fm= (Fm –Fo)/Fm) to assess the functionality ofPSII (Rosenqvist andvanKooten2003). In the equations,Fo is the
minimum yield of chlorophyll a fluorescence and Fm is themaximum yield obtained during a pulse of saturating light.Measurements could not be made on Q. pubescens.
Foliar concentration of nitrogen and totalnonstructural carbohydrates
The concentration of nitrogen was measured with an elementalanalyzer (Flash EA1112 Series, Thermo Finnigan, Milan, Italy).The concentration of total nonstructural carbohydrates wasmeasured using a gas chromatograph-mass spectrometer(GC-MS, Shimadzu QP2010plus, Kyoto, Japan). Sugars wereextracted from 25mg of powdered leaf samples followingthe protocol of Göttlicher et al. (2006), and 25mL of the driedsupernatant was derivatised according to Fiehn (2006). The driedpellet resulting from removing soluble sugars was incubated at60�C with 3 U of amyloglucosidase from Rhizopus sp. (Sigma,Munich, Germany) in 20mM sodium acetate buffer (pH= 4.8) tomeasure the concentration of starch. Hydrolysis was stopped bydegradation of the enzyme at 100�C for 10min in a water bath.Final quantification on the GC-MS was performed relative tointernal and external standards. Sugars were identified by their
–4.5
–4.0
–3.5
–3.0
–2.5
–2.0
–1.5
–1.0
–0.5
0.0
Ψp
d(M
Pa)
***
***
***
***
*
***
****
***
(b)
10
12
14
16
18
20
22
24
26
28
30
14/6 22/6 30/6 8/7 16/7 24/7 1/8 9/8
Air
tem
pera
ture
(°C
)
(a)
†‡ † ‡
Fig. 1. (a) Mean daily air temperature during the study period. (b) Predawnleaf water potential in plants of Q. pubescens (circles) and Q. ilex (squares)regularly watered (C; filled symbols) and subject to water cessation andrewatering (D; open symbols) during the studyperiod.Downward andupwardarrows mark watering cessation and rewatering, respectively. Asterisksindicate a significant difference between C and D plants: *, P< 0.05;**, P< 0.01; ***, P< 0.001. Data are means� 1 s.e. † and z indicate thedates when the diel temperature response of leaf Rd was measured inQ. pubescens and Q. ilex, respectively.
Respiration during and after drought Functional Plant Biology C

retention times and the identification was further verified bycomparison of their mass spectral data with the mass spectrallibrary (National Institutes of Standards and Technology 2005).
Statistical analyses
We compared themeans of C andD treatments for each samplingdate using t-tests, orWelch tests when the variances of treatmentswere unequal. Due to the different incidence of water deficit oneach species after withholding water, only one species wasmeasured on some dates (see Fig. 1b), which prevented testingthe effects of treatment, species and date in the same analysis.General linear models were used to test for a potential change inthe relationship between leaf traits andYpd between species, withspecies as themainfixedeffect,Ypd as the regressor effect, and theinteraction between species andYpd as a crossed effect (Table 1).Further, t-tests were also used to compare Q10 means betweenspecies. Prior to all tests, some variables were log10-transformedto improve normality or make the relationship with Ypd linear.The number of replicates per treatment was five for all variables,but three observations of gs were deleted, due to abnormally lowvalues, and one of R25 : An for being negative (due to net CO2
emission at saturating light). The statistical significance level wasset at 5%, although some trends significant at a 10% level werementioned.We used Statistica 7.1 (StatSoft, Tulsa, OK,USA) foranalyses.
Results
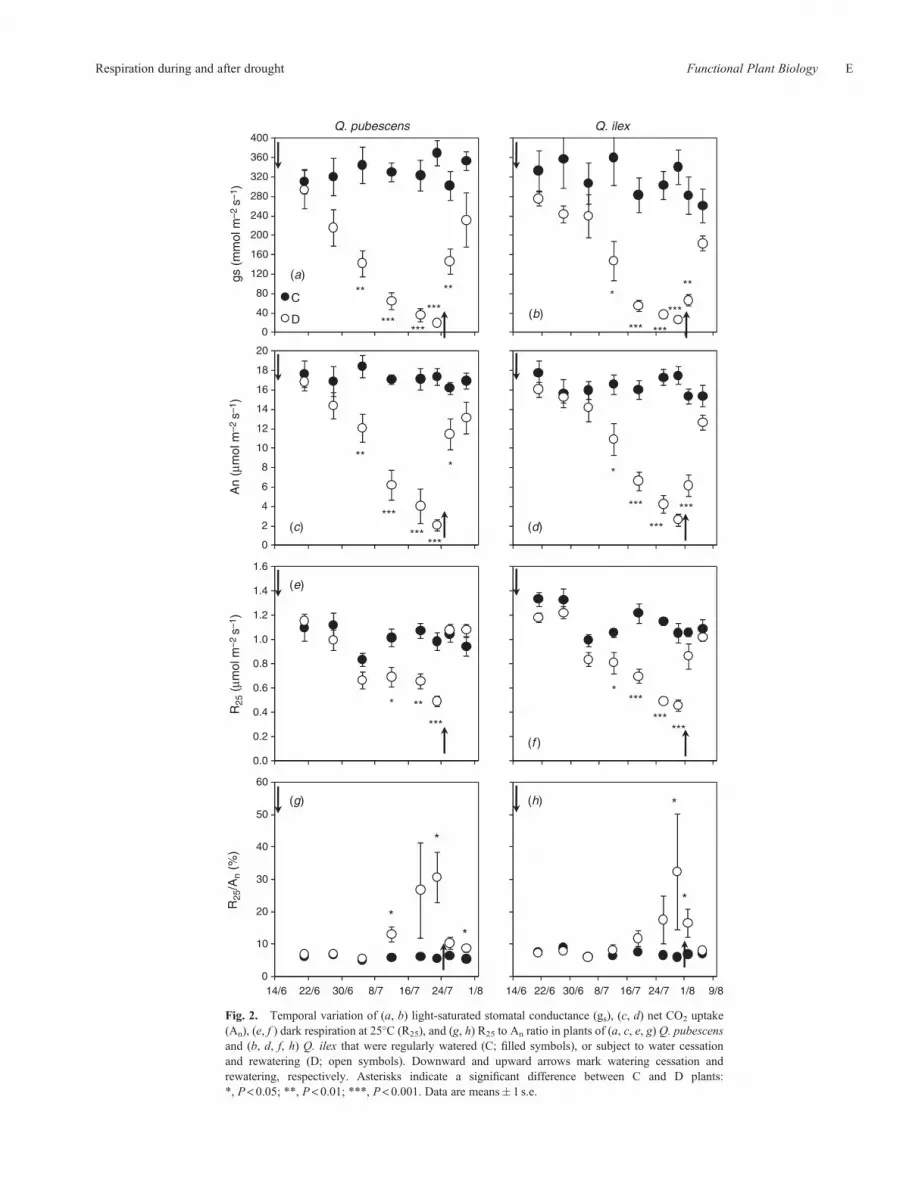
Predawn leaf water potential (Ypd) declined in D plants after westopped irrigation, more rapidly in Q. pubescens than in Q. ilex,and recovered to values of C plants after rewatering (Fig. 1b). Thepattern ofYpd over timewasmirrored by gas exchange variables:
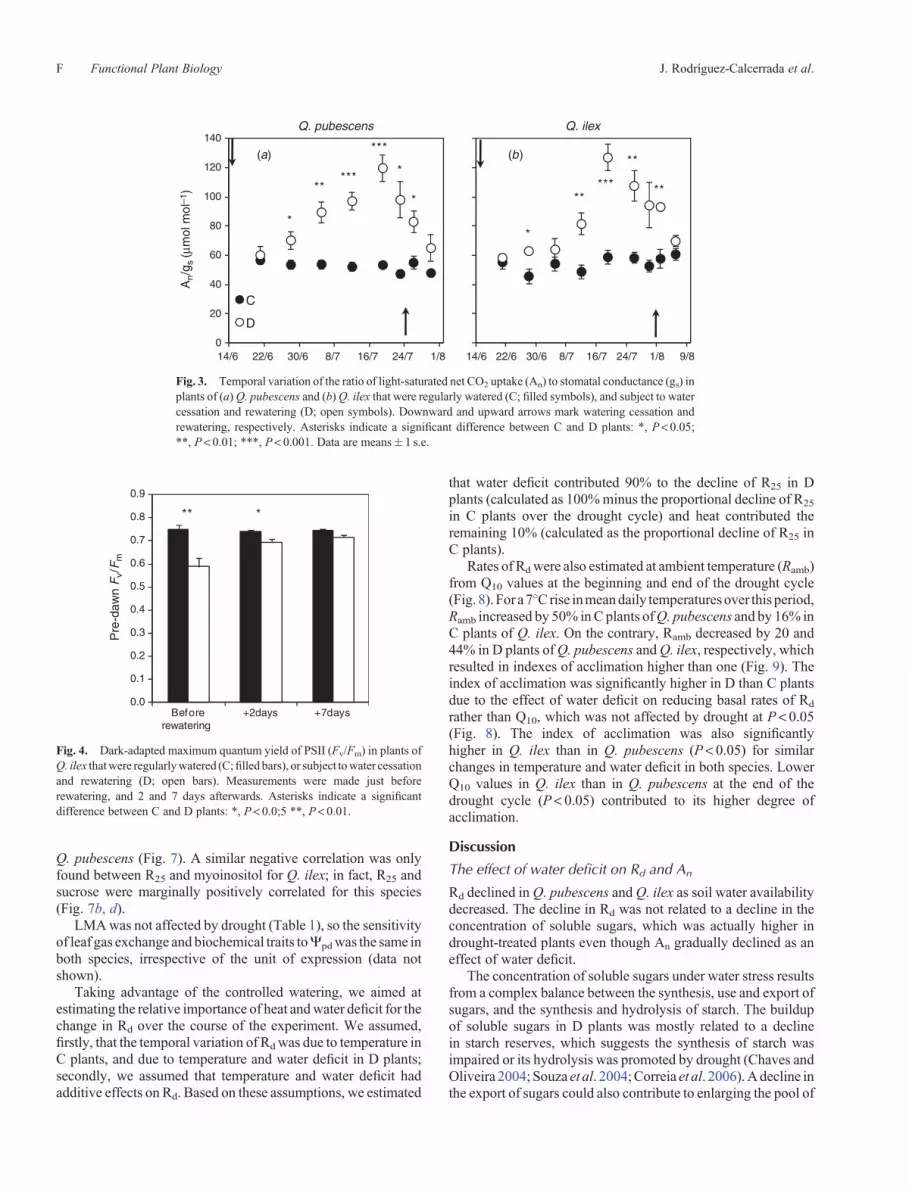
gs,An, andRd declined inDplants andwere significantly differentfrom C plants by the third to fourth week after withholdingwater (Fig. 2a–f ). After rewatering, in spite of the severewater deficit that plants experienced, gs and An reached pre-drought values in only 1 week. The recovery of Rd was evenfaster, with Rd recovering to pre-drought values only two daysafter rewatering (Fig. 2). The ratio of R25 toAn – alsomeasured at25�C – increased abruptly in D plants when water stress wassevere (Ypd < –2MPa); it declined upon rewatering and wasalmost the same than in C plants (Fig. 2g, h). The ratio of An
to gs increased soon after withholding water until water stresswas severe; it then started to decrease and continued decreasingafter rewatering (Fig. 3). The parameter Fv/Fm was significantlylower in D plants of Q. ilex at the end of the drought cycle, butattainedvalues similar to those ofCplants 1week after rewatering(Fig. 4).
Leaf nitrogen concentration (N)was not significantly differentbetween C and D plants on any date. However, there was a trendfor N to be higher in D plants (Fig. 5a, b) probably in relationwith an acclimation response to first-year drought that led to 27%lower leaf area in the second year in D compared to C plants.The concentration of soluble sugars increased significantly in Dplants once irrigation stopped, more markedly in Q. pubescensthan in Q. ilex (Fig. 5c, d). Maximum differences relative to Cplants were found just before rewatering, after which solublesugars tended to recover to pre-drought values. Myoinositol wasthe soluble sugar that showed the highest increase over thedrought period, from 7 to 23mg g–1 in Q. pubescens and from4 to 16mg g–1 inQ. ilex. Starch, on the other hand, declined afterirrigation stopped and was significantly lower in D plants than inC plants before rewatering (Fig. 5e, f ). Overall, in C plants, theconcentration of soluble sugars was the same in both species(53 vs 52mg g–1), but starch was higher in the leaves ofQ. pubescens (39 vs 10mg g–1).
We plotted some of the above variables againstYpd to see theeffect of water stress on leaf physiology and biochemistry moreclearly (Fig. 6). As deduced from the time-series figures, thedecline in Ypd after withholding water was accompanied by asteep decline in An and a more gentle decline in R25 (Fig. 6a, b).The decline in An was of similar magnitude and shape in the twospecies, but that of R25 was slightly steeper in Q. ilex than inQ. pubescens (Table 1 – note the significant Ypd� Speciesinteraction). In spite of the lower reduction of R25 compared toAn caused by water stress, the pool of total nonstructuralcarbohydrates (TNC) remained unchanged (Table 1). Actually,the concentration of soluble sugars increased inQ. pubescens andmarginally significantly (P< 0.10) in Q. ilex (Fig. 6c) as waterstress increased. The opposite pattern was found for theconcentration of starch, which decreased abruptly for a smallchange in Ypd in both species (Fig. 6d). As a consequence,the contribution of soluble sugars to the pool of TNC rose toalmost 100% as soon as plants experienced incipient waterstress (Fig. 6e). The concentration of sucrose and hexoses(glucose + fructose) increased significantly in Q. pubescens butnot inQ. ilex, forwhichonlymyoinositol exhibited a clear trendofincreasing with decreasing Ypd, similar to that in Q. pubescens(Fig. 6f–h).
As an effect of drought, therefore, R25 and both pooledand individual sugars exhibited a negative correlation for
Table 1. F-tests and associated P-values (*, P < 0.05; **, P < 0.01;***, P< 0.001) from general linear models testing the main effect ofspecies (Q. ilex and Q. pubescens), the regressor effect of predawn leafwater potential (Ypd), and the interaction effect between species andYpd
Response variables were: leaf mass per unit area (LMA), light-saturatednet CO2 uptake (An), light-saturated stomatal conductance (gs), darkrespiration at 258C (R25), the ratio of An to gs, ratio of R25 to An, and theconcentrations of nitrogen, total pool of nonstructural carbohydrates (TNC),starch, soluble sugars (SS), sucrose, hexoses (fructose + glucose) andmyoinositol. Note that some response variables were log10-transformed tolinearise the relationship withYpd (see Fig. 6). Observations after rewatering
were excluded from analyses
Species (S) Ypd S�Ypd
LMA 99.53*** 0.98 0.15Log10 An 0.55 340.32*** 0.85Log10 gs 1.39 335.29*** 1.48Log10 R25 1.29 147.29*** 5.37*An : gs 0.59 8.83** 0.67Log10 R25 : An 0.05 85.38*** 0.01N 23.13*** 0.58 0.82TNC 0.88 0.35 0.78Log10 (Starch + 1) 0.26 19.44*** 0.08SS 0.02 32.69*** 7.44*Sucrose 1.5 2.78 11.57**Hexoses 0.17 18.34*** 6.71*Myoinositol 0.59 70.33*** 0.53
D Functional Plant Biology J. Rodríguez-Calcerrada et al.
0.0
0.2
0.4
0.6
0.8
1.0
1.2
1.4
1.6
* **
***
****
******
(e)
(f )
14/6 22/6 30/6 8/7 16/7 24/7 1/8 9/80
10
20
30
40
50
60
14/6 22/6 30/6 8/7 16/7 24/7 1/8
*
*
*
(h)(g) *
*
0
2
4
6
8
10
12
14
16
18
20
***
******
*
***
***
***
(c) (d)
***
0
40
80
120
160
200
240
280
320
360
400
R25
(μm
ol m
–2 s
–1)
R25
/An
(%)
An
(μm
ol m
–2 s
–1)
gs (
mm
ol m
–2 s
–1)
C
D
Q. pubescens Q. ilex
**
******
***
** *
*** ***
***
**(a)
(b)
Fig. 2. Temporal variation of (a, b) light-saturated stomatal conductance (gs), (c, d) net CO2 uptake(An), (e, f ) dark respiration at 25�C (R25), and (g, h) R25 to An ratio in plants of (a, c, e, g) Q. pubescensand (b, d, f, h) Q. ilex that were regularly watered (C; filled symbols), or subject to water cessationand rewatering (D; open symbols). Downward and upward arrows mark watering cessation andrewatering, respectively. Asterisks indicate a significant difference between C and D plants:*, P< 0.05; **, P< 0.01; ***, P< 0.001. Data are means� 1 s.e.
Respiration during and after drought Functional Plant Biology E
Q. pubescens (Fig. 7). A similar negative correlation was onlyfound between R25 and myoinositol for Q. ilex; in fact, R25 andsucrose were marginally positively correlated for this species(Fig. 7b, d).
LMAwas not affected by drought (Table 1), so the sensitivityof leaf gas exchange and biochemical traits toYpdwas the same inboth species, irrespective of the unit of expression (data notshown).
Taking advantage of the controlled watering, we aimed atestimating the relative importance of heat andwater deficit for thechange in Rd over the course of the experiment. We assumed,firstly, that the temporal variation of Rdwas due to temperature inC plants, and due to temperature and water deficit in D plants;secondly, we assumed that temperature and water deficit hadadditive effects on Rd. Based on these assumptions, we estimated
that water deficit contributed 90% to the decline of R25 in Dplants (calculated as 100%minus the proportional decline of R25
in C plants over the drought cycle) and heat contributed theremaining 10% (calculated as the proportional decline of R25 inC plants).
Rates of Rdwere also estimated at ambient temperature (Ramb)from Q10 values at the beginning and end of the drought cycle(Fig. 8). For a7�Crise inmeandaily temperatures over this period,Ramb increased by 50% inC plants ofQ. pubescens and by 16% inC plants of Q. ilex. On the contrary, Ramb decreased by 20 and44% in D plants ofQ. pubescens andQ. ilex, respectively, whichresulted in indexes of acclimation higher than one (Fig. 9). Theindex of acclimation was significantly higher in D than C plantsdue to the effect of water deficit on reducing basal rates of Rd
rather than Q10, which was not affected by drought at P < 0.05(Fig. 8). The index of acclimation was also significantlyhigher in Q. ilex than in Q. pubescens (P < 0.05) for similarchanges in temperature and water deficit in both species. LowerQ10 values in Q. ilex than in Q. pubescens at the end of thedrought cycle (P < 0.05) contributed to its higher degree ofacclimation.
Discussion
The effect of water deficit on Rd and An
Rd declined in Q. pubescens and Q. ilex as soil water availabilitydecreased. The decline in Rd was not related to a decline in theconcentration of soluble sugars, which was actually higher indrought-treated plants even though An gradually declined as aneffect of water deficit.
The concentration of soluble sugars under water stress resultsfrom a complex balance between the synthesis, use and export ofsugars, and the synthesis and hydrolysis of starch. The buildupof soluble sugars in D plants was mostly related to a declinein starch reserves, which suggests the synthesis of starch wasimpaired or its hydrolysis was promoted by drought (Chaves andOliveira 2004; Souza et al. 2004;Correia et al. 2006).Adecline inthe export of sugars could also contribute to enlarging the pool of
14/6 22/6 30/6 8/7 16/7 24/7 1/8 9/80
20
40
60
80
100
120
140
14/6 22/6 30/6 8/7 16/7 24/7 1/8
An/
g s (μ
mol
mol
–1)
C
D
*
***** *
*
***
*
*****
**
**
Q. pubescens Q. ilex
(a) (b)
Fig. 3. Temporal variation of the ratio of light-saturated net CO2 uptake (An) to stomatal conductance (gs) inplants of (a)Q. pubescens and (b)Q. ilex that were regularly watered (C; filled symbols), and subject to watercessation and rewatering (D; open symbols). Downward and upward arrows mark watering cessation andrewatering, respectively. Asterisks indicate a significant difference between C and D plants: *, P< 0.05;**, P< 0.01; ***, P< 0.001. Data are means� 1 s.e.
0.0
0.1
0.2
0.3
0.4
0.5
0.6
0.7
0.8
0.9
Beforerewatering
+2days
Pre
-daw
n F
v/F
m
** *
+7days
Fig. 4. Dark-adapted maximum quantum yield of PSII (Fv/Fm) in plants ofQ. ilex thatwere regularlywatered (C;filled bars), or subject towater cessationand rewatering (D; open bars). Measurements were made just beforerewatering, and 2 and 7 days afterwards. Asterisks indicate a significantdifference between C and D plants: *, P< 0.0;5 **, P< 0.01.
F Functional Plant Biology J. Rodríguez-Calcerrada et al.

soluble sugars in leaves of D plants (Sala et al. 2010; McDowell2011). Here, sucrose – a major component of the sugarsloaded into the phloem for export (Giaquinta 1983) –
exhibited an opposite pattern in Q. ilex and Q. pubescens inresponse to drought (Fig. 6f ). Whether such a pattern reflects alower drought sensitivity of phloem sucrose loading in Q. ilexcould be clarified by a complete metabolite profile. Finally, wenote that the decline in Rd contributed to tolerance ofwater deficitby decreasing the use of soluble sugars, which play a role in
osmotic adjustment and protection against photodamage, andpolyols, such as myoinositol, in particular (Griffin et al. 2004).
If the availability of soluble sugars was not a limiting factorfor Rd, what did cause the decline in Rd in drought-treated plantsof Q. pubescens and Q. ilex? Flexas et al. (2005) and Atkinand Macherel (2009) suggested that the main factor limiting Rd
in plants subjected to drought is a restriction of adenylates. In ourstudy, well watered plants of Q. ilex and Q. pubescens – twospecies with an intermittent shoot growth pattern – produced at
6
8
10
12
14
16
18
20
22
24
N (
mg
g–1 )
C
D
(b)(a)
Q. pubescens Q. ilex
20
40
60
80
100
120
SS
(mg
g–1 )
(d )(c)
**
***
***
*
14/6 22/6 30/6 8/7 16/7 24/7 1/8 9/8
0
15
30
45
60
75
90
14/6 22/6 30/6 8/7 16/7 24/7 1/8
Sta
rch
(mg
g–
1 )
(e)
**
*
(f )
Fig. 5. Concentration of (a, b) soluble sugars (SS), (c, d) starch and (e, f ) nitrogen over time in plants of(a, c, e) Q. pubescens and (b, d, f ) Q. ilex that were regularly watered (C; filled symbols), or subject towater cessation and rewatering (D; open symbols). Downward and upward arrows mark watering stopand rewatering, respectively. Asterisks indicate a significant difference between C and D plants: *, P< 0.05;**, P< 0.01; ***, P< 0.001. Data are means� 1 s.e.
Respiration during and after drought Functional Plant Biology G

R ² = 0.77***
R ² = 0.70***
0.0
0.2
0.4
0.6
0.8
1.0
1.2
1.4
1.6
R25
(μm
ol m
–2
s–1 )
R ² = 0.86***
R ² = 0.90***
–1
5
10
15
20
An
(μm
ol m
–2
s–1 )
0
20
40
60
80
100
Sta
rch
(mg
g–1 )
R ² = 0.57***
R ² = 0.46**
(d )
R ² = 0.25
R ² = 0.74***
0
25
50
75
100
125
150
SS
(m
g g–
1 )
(a)
(c)
0
25
50
75
100
SS
/TN
C (%
) R ² = 0.85***
R ² = 0.59***
R ² = 0.13
R ² = 0.48**
0
10
20
30
40
50
Su
cros
e (m
g g–
1 )
(e)
(f )
R ² = 0.12
R ² = 0.63***
0
10
20
30
40
50
60
–6–4–20
Hex
oses
(mg
g–1 )
Ψpd (MPa) Ψpd (MPa)
(g)
R ² = 0.81***
R ² = 0.72***
0
10
20
30
40
50
–6–4–20
Myo
-inos
itol (
mg
g–1 )
(h)
(b)
Fig. 6. Relationship between predawn leaf water potential (Ypd) and (a) light-saturated net CO2 uptake (An),(b) dark respiration (R25), (c) soluble sugars (SS), (d) starch, (e) the proportion of soluble sugars in the pool ofnonstructural carbohydrates (SS : TNC), (f) sucrose, (g) hexoses (fructose + glucose) and (h)myoinositol inplantsofQ. pubescens (circles, continuous lines) andQ. ilex (squares, dashed lines) thatwere subject towater cessation.Observations after rewatering have not been included. The proportion of variance explained by R25 and thesignificance of the linear or nonlinear model (**, P< 0.01; ***, P< 0.001) are noted by each line.
H Functional Plant Biology J. Rodríguez-Calcerrada et al.

R ² = 0.09
R ² = 0.62***
0
25
50
75
100
125
150
SS
(m
g g–
1 )
R ² = 0.26
R ² = 0.32*
0
10
20
30
40
50
Su
cros
e (m
g g–
1 )R ² = 0.13
R ² = 0.53**
0
10
20
30
40
50
0 4 8 12 16 20
Hex
oses
(mg
g–1 )
R25 (nmol g–1s–1)
R ² = 0.50**
R ² = 0.50**
0
10
20
30
40
50
0 4 8 12 16 20
Myo
-inos
itol (
mg
g–1 )
R25 (nmol g–1s–1)
(a) (b)
(c) (d )
Fig. 7. Relationship between dark respiration at 25�C (R25) and (a) the concentration of soluble sugars (SS),(b) sucrose, (c) hexoses (fructose + glucose) (d) and myoinositol in plants ofQ. pubescens (circles, continuouslines) andQ. ilex (squares, dashed lines) subject towater cessation.Observations after rewatering have not beenincluded. The proportion of variance explained by R25 and the significance of the linear model (*, P< 0.05;**, P< 0.01; ***, P< 0.001) are noted by each line. Representing R25 in the x-axis and sugars in the y-axisstresses the idea that respiration is not limited by the lack of SS following drought – as one might expect after areduction in An – but, rather, that as respiration declines with increasing drought, the pool of SS that remainsavailable for other metabolic processes increases. However, the correlation between these variables could alsorespond to an opposite, independent impact of drought on themetabolism of carbohydrates and respiration (seediscussion).
C
D
0.0
0.5
1.0
1.5
2.0
2.5
3.0
Beggining
Q10
Q. pubescens Q. ilex
(a) (b)
End Beggining End
Fig.8. Short-termtemperature sensitivityofdark respiration (Q10) inplantsof (a)Q.pubescensand (b)Q. ilexregularlywatered (C;filled bars) and subject towater cessation (D; open bars). Curves showing the response ofQ10 to diel changes in temperature were obtained at the beginning and end of the drought cycle. Data aremeans� 1 s.e.
Respiration during and after drought Functional Plant Biology I

least one shoot flush during the course of the drought cycle, butnone of the drought-treated plants started a new flush of growthonce irrigation stopped. The drought-induced reduction of plantgrowth could translate into a reduction of Rd in fully developedleaves, for example, via reduced sucrose loading into the phloemand ATP demand. Contrary to this argument, if the availabilityof ADP had restricted the Rd of drought-treated plants, the effectwould have been temperature-dependent (higher at highertemperature measurements; Atkin et al. 2005) and would havecaused a decline in Q10 relative to control plants, which was notthe case.
An alternative explanation is that the respiratory capacity ofleaves was affected by drought. As occurs with photosyntheticproteins, mitochondrial proteins could be damaged by droughtstress (Taylor et al. 2002; Atkin and Macherel 2009) and thiscould result in a decline in the base rates of Rd. If this were so, weshould interpret the recovery of respiratory rates after rewateringas being indicative of a rapid capacity of leaves to restore thenormal activity of mitochondria, which may be important forrecovering photosynthetic functionality after stress alleviation(see below).
Dark respiration of fully expanded leaves at a setmeasurement temperature usually decreases through summerin Mediterranean-type forests (Zaragoza-Castells et al. 2008;Rodríguez-Calcerrada et al. 2011). Separating heat anddrought effects on Rd in these forests demands experimentsunder controlled or semicontrolled conditions. In our study,plants were grown outdoors under controlled watering andwith natural fluctuations of temperature. Upon a moderate risein temperature and a severe decline in soil water availability,thermal acclimation of Rd contributed 10% of the downwardshift in R25 through summer, with drought contributing theremaining 90%. Although this study was made on pottedplants, and we could not ensure heat and drought had additiveeffects on Rd, our results are informative of what happens inMediterranean-type climates during summer,where (1) soilwateravailability decreases in parallel to increasing temperatures and(2) water stress progresses slowly and is often severe.
The response to heat and drought differed slightly betweenspecies.Grubb (1998) suggested that thedecline in the rate ofCO2
release by respiration in response to drought could be adaptiveand form part of an ecological strategy typical of the sclerophyllsof arid regions to cope with water shortage. Consistent withthis hypothesis, acclimation to heat and drought over the courseof the experiment was higher in Q. ilex than in Q. pubescens, asub-Mediterranean species that prefers wetter sites than Q. ilex(Larcher 1960;Quézel andMédail 2003). Since the concentrationof starch was lower in the leaves ofQ. ilex under unlimited waterconditions, it is possible that the necessity of downregulating Rd
was higher in this species than in Q. pubescens. Nonetheless, aswe have discussed above, it is not clear whether the sensitivity ofRd to drought reflects a downregulation of the mitochondrialactivity or metabolic damage. Further, given the complexregulation of the carbon metabolism in response to waterdeficit, it is difficult to quantify how much the steeper declineof Rd in D plants of Q. ilex contributed to maintaining theTNC pool and keeping a positive carbon balance relative toQ. pubescens.
The hypothesis that drought-resistant species exhibit higherdownregulation of Rd than drought-sensitive species should beextended to more contrasting species. Seedlings of both Q. ilexand Q. pubescens demonstrated great resistance to drought, atleast at the leaf level. They showed (1) a rapid decline in gs after asmall drop inYpd, which helps to prevent excessively low waterpotentials, (2) increasingly efficient water use down to –2MPaYpd, and iii) a rapid recovery of gas exchange from severe waterdeficit (see below). The higher avoidance ofwater stress inQ. ilex(Fig. 1b) was due to a lower rate of cuticular transpiration, asobserved by Larcher (1960) in a comparative study, rather thanany differential stomatal behaviour. The response of leaf gasexchange to drought, in summary, does not seem to be the mainfactor behind the higher capacity of Q. ilex to grow in semiaridsites (Damesin et al. 1998).
The effect of rewatering on Rd and An
Plants recovered pre-drought values of An 1 week afterrewatering. Several factors contributed to the rapid recovery ofAn. First, the recovery of gs alleviated the restriction of An
imposed by stomata closure. Gallé and Feller (2007) and Galléet al. (2007) reported proportionally higher increases inAn thangsfollowing rewatering of drought-treated plants ofFagus sylvaticaL. and Q. pubescens, and interpreted this pattern as a strategyto increase water use efficiency during subsequent periods ofwater shortage. Here, we observed the same result, but only for abrief period, suggesting the occurrence of no major stomatallimitations to photosynthesis after drought. A second factor thatcontributed to the recovery of An after rewatering was therecovery of the functionality of PSII. The declines in theintrinsic water use efficiency (Fig. 3) and maximum quantumyield of PSII (Fv/Fm; Fig. 4) at the end of the drought cycleindicate that water deficit was so intense that it impaired thenormal functioning of the photosynthetic metabolism (Flexaset al. 2004). Drought-induced reductions in An could acceleratethe formation of reactive oxygen species and cause photodamageto PSII (or inhibit its repair; see Takahashi and Murata 2008).However, thedecline inFv/Fmwas transient, andFv/Fmrecovered
0.0
0.4
0.8
1.2
1.6
2.0
Q. pubescens
Inde
x of
Rd
accl
imat
ion
C
D
***
***
Q. ilex
Fig. 9. Index of acclimation in plants ofQ. pubescens andQ. ilex that wererregularly watered (C; filled bars), or subject to water cessation (D; open bars).The index is similar to that proposed by Loveys et al. (2003), with increasingvalues indicating a higher degree of acclimation. Asterisks indicate asignificant difference between C and D plants; ***, P< 0.05.
J Functional Plant Biology J. Rodríguez-Calcerrada et al.

progressivelywithin theweek of rewatering. In fact, a third factorthat could be involved in the recovery of An after rewatering wasthe recovery of Rd itself, which preceded that of An and possiblyhelped the recovery of the photosynthetic metabolism bycontributing to the synthesis of new photosynthetic proteins(Kirschbaum 1988). Since protein turnover accounts for aconsiderable proportion of the respiratory costs (Bouma et al.1994), we expected that recovery from photodamage wouldlead to higher rates of respiration upon rewatering due to extrarepair costs derived from the synthesis of PSII proteins (e.g. D1protein). However, drought-stressed plants exhibited rates of Rd
similar to control plants upon rewatering. Seemingly, a largerfraction of respiratory energy was allocated to the repair of PSIIin damaged plants, although the overall Rd was not affected.
The response of leaf gas exchange and chemical traits torewatering was rather similar in Q. ilex and Q. pubescens, atleastwithin theweek that followed rewatering.OnlyAn recoveredfaster inQ. pubescens, which is perhaps related to its shorter leaflife span – and thus a greater need thanQ. ilex to take advantage ofperiods of adequate soil water content.
Conclusion
Drought causes a decline in Rd that is not linked to a decrease insugar availability. Rather, drought promotes an increase in thefoliar concentration of soluble sugars, despite decreasing netCO2 assimilation, which partly comes from the breakdownor impaired synthesis of starch, and the depression in Rd itself.Large comparative physiological and molecular studies areneeded to understand species-specific responses of Rd andnonstructural carbohydrates to water stress.
Acknowledgements
We thank Bruno Buatois (Plate-Forme d’Analyse Chimique – Centred’Ecologie Fonctionnelle et Evolutive), Richard Joffre and Carsten Jaegerfor valuable assistance in chemical analyses. We also thank Alain Rocheteaufor programming the temperature data logger, and personnel from the Terraind’Expériences – CEFE, particularly David Degueldre, for helping take careof plants.
References
Adams HD, Guardiola-Claramonte M, Barron-Gafford GA, Villegas JC,Breshears DD, Zou CB, Troch PA, Huxman TE (2009) Temperaturesensitivity of drought-induced tree mortality portends increased regionaldie-off under global-change-type drought. Proceedings of the NationalAcademy of Sciences of the United States of America 106, 7063–7066.doi:10.1073/pnas.0901438106
Amthor JS (1988) Growth and maintenance respiration in leaves of bean(Phaseolus vulgaris L.) exposed to ozone in open-top chambers in thefield. New Phytologist 110, 319–325. doi:10.1111/j.1469-8137.1988.tb00268.x
Atkin OK, Holly C, Ball MC (2000) Acclimation of snow gum (Eucalyptuspauciflora) leaf respiration to seasonal and diurnal variations intemperature: the importance of changes in the capacity andtemperature sensitivity of respiration. Plant Cell and Environment 23,15–26.
Atkin OK, Macherel D (2009) The crucial role of plant mitochondria inorchestrating drought tolerance. Annals of Botany 103, 581–597.doi:10.1093/aob/mcn094
Atkin OK, Bruhn D, Tjoelker MG (2005) Response of plant respiration tochanges in temperature: mechanisms and consequences of variations inQ10 values and acclimation. In ‘Plant respiration. Fromcell to ecosystem’.(Eds H Lambers, M Ribas-Carbo) pp. 95–135. (Springer: Dordrecht)
Bouma TJ, De Visser R, Jansse JHJA, De Kock MJ, Van Leeuwen PH,Lambers H (1994) Respiratory energy requirements and rate of proteinturnover in vivo determined by the use of an inhibitor of protein synthesisand a probe to assess its effect. Physiologia Plantarum 92, 585–594.doi:10.1111/j.1399-3054.1994.tb03027.x
Chaves MM, Oliveira MM (2004) Mechanisms underlying plant resilienceto water deficits: prospects for water-saving agriculture. Journal ofExperimental Botany 55, 2365–2384. doi:10.1093/jxb/erh269
Chaves MM, Flexas J, Pinheiro C (2009) Photosynthesis under drought andsalt stress: regulation mechanisms from whole plant to cell. Annals ofBotany 103, 551–560. doi:10.1093/aob/mcn125
Correia MJ, Osório ML, Osório J, Barrote I, Martins M, David MM (2006)Influence of transient shade periods on the effects of drought onphotosynthesis, carbohydrate accumulation and lipid peroxidation insunflower leaves. Environmental and Experimental Botany 58, 75–84.doi:10.1016/j.envexpbot.2005.06.015
Crous KY, Zaragoza-Castells J, Löw M, Ellsworth DS, Tissue DT, TjoelkerMG, Barton CVM, Gimeno TE, Atkin OK (2011) Seasonal acclimationof leaf respiration in Eucalyptus saligna trees: impacts of elevatedatmospheric CO2 conditions and summer drought. Global ChangeBiology 17, 1560–1576. doi:10.1111/j.1365-2486.2010.02325.x
Damesin C, Rambal S, Joffre R (1998) Co-occurrence of trees with differentleaf habit: a functional approach onMediterranean oaks.ActaOecologica19, 195–204. doi:10.1016/S1146-609X(98)80024-6
Fiehn O (2006) Metabolite profiling in Arabidopsis. Methods in MolecularBiology (Clifton, N.J.) 323, 439–447.
Flexas J, Bota J, Cifre J, Escalona JM,Galmés J, Gulías J, LefiE-K,Martínez-CañellasSF,MorenoMT,Ribas-CarbóM,RieraD,SampolB,MedranoH(2004) Understanding down-regulation of photosynthesis under waterstress: future prospects and searching for physiological tools for irrigationmanagement. The Annals of Applied Biology 144, 273–283. doi:10.1111/j.1744-7348.2004.tb00343.x
Flexas J, Galmés J, Ribas-Carbó M, Medrano H 2005. The effects of waterstress on plant respiration. In ‘Plant respiration. From cell to ecosystem’.(Eds H Lambers, M Ribas-Carbo) pp. 85–94. (Springer: Dordrecht)
Gallé A, Feller U (2007) Changes of photosynthetic traits in beech saplings(Fagus sylvatica) under severe drought stress and during recovery.Physiologia Plantarum 131, 412–421. doi:10.1111/j.1399-3054.2007.00972.x
Gallé A, Haldimann P, Feller U (2007) Photosynthetic performance andwater relations in young pubescent oak (Quercus pubescens) trees duringdrought stress and recovery.NewPhytologist 174, 799–810. doi:10.1111/j.1469-8137.2007.02047.x
Galmés J, Ribas-Carbó M, Medrano H, Flexas J (2007) Response ofleaf respiration to water stress in Mediterranean species with differentgrowth forms. Journal of Arid Environments 68, 206–222. doi:10.1016/j.jaridenv.2006.05.005
Giaquinta RT (1983) Phloem loading of sucrose. Annual Review of PlantPhysiology 34, 347–387. doi:10.1146/annurev.pp.34.060183.002023
Göttlicher S, Knohl A,WanekW, BuchmannN, Richter A (2006) Short-termchanges in carbon isotope composition of soluble carbohydrates andstarch: from canopy leaves to the root system. Rapid Communicationsin Mass Spectrometry 20, 653–660. doi:10.1002/rcm.2352
Griffin JJ, Ranney TG, Pharr DM (2004) Heat and drought influencephotosynthesis, water relations, and soluble carbohydrates of twoecotypes of redbud (Cercis canadensis). Journal of the AmericanSociety for Horticultural Science 129, 497–502.
Grubb PJ (1998) A reassessment of the strategies of plants which cope withshortages of resources. Perspectives in Plant Ecology, Evolution andSystematics 1, 3–31. doi:10.1078/1433-8319-00049
Respiration during and after drought Functional Plant Biology K

Kirschbaum MUF (1988) Recovery of photosynthesis from water stressin Eucalyptus pauciflora – a process in two stages. Plant, Cell &Environment 11, 685–694. doi:10.1111/j.1365-3040.1988.tb01151.x
Larcher W (1960) Transpiration and photosynthesis of detached leaves andshoots of Quercus pubescens and Quercus ilex during desiccation understandard conditions. Bulletin of the Research Council of Israel 8D,213–224.
Levitt J (1972) ‘Response of plants to environmental stresses.’ (AcademicPress: New York)
Loveys BR, Atkinson LJ, Sherlock DJ, Roberts RL, Fitter AH, Atkin OK(2003) Thermal acclimation of leaf and root respiration: an investigationcomparing inherently fast- and slow-growing plant species. GlobalChange Biology 9, 895–910. doi:10.1046/j.1365-2486.2003.00611.x
McDowell NG (2011) Mechanisms linking drought, hydraulics, carbonmetabolism, and vegetation mortality. Plant Physiology 155,1051–1059. doi:10.1104/pp.110.170704
McDowell N, PockmanWT,AllenCD,BreshearsDD,CobbN,Kolb T, PlautJ, Sperry J,West A,WilliamsDG,Yepez EA (2008)Mechanisms of plantsurvival and mortality during drought: why do some plants survive whileothers succumb to drought?New Phytologist 178, 719–739. doi:10.1111/j.1469-8137.2008.02436.x
Millard P, Grelet G-A (2010) Nitrogen storage and remobilization by trees:ecophysiological relevance in a changing world. Tree Physiology 30,1083–1095. doi:10.1093/treephys/tpq042
National Institute of Standards Technology (2005) PC version of the NIST/EPA/NIH Mass Spectra Database. (National Institute of StandardsTechnology: Gaithersburg, MD)
OwLF,WhiteheadD,WalcroftAS,TurnbullMH(2010)Seasonalvariation infoliar carbon exchange inPinus radiata andPopulusdeltoides: respirationacclimates fully to changes in temperature but photosynthesis does not.Global Change Biology 16, 288–302. doi:10.1111/j.1365-2486.2009.01892.x
Piper FI (2011) Drought induces opposite changes in the concentration ofnon-structural carbohydrates of two evergreen Nothofagus species ofdifferential drought resistance. Annals of Forest Science. doi:10.1007/s13595-011-0030-1
Quézel P, Médail F (2003) ‘Écologie et biogéographie des forêts du bassinméditerranéen.’ (Elsevier: Paris)
Rodríguez-Calcerrada J, Jaeger C, Limousin JM, Ourcival JM, Joffre R,Rambal S (2011) Leaf CO2 efflux is attenuated by acclimation ofrespiration to heat and drought in a Mediterranean tree. FunctionalEcology doi:10.1111/j.1365-2435.2011.01862.x
Rosenqvist E, van Kooten O (2003) Chlorophyll fluorescence: a generaldescription and nomenclature. In ‘Practical applications of chlorophyllfluorescence in plant biology’. (Eds JR De Ell, PMA Toivonen)pp. 31–77. (Kluwer Academic Publishers: Dordrecht, The Netherlands)
SalaA,PiperF,HochG(2010)Physiologicalmechanismsofdrought-inducedtreemortality are far from being resolved.NewPhytologist 186, 274–281.doi:10.1111/j.1469-8137.2009.03167.x
Slot M, Zaragoza-Castells J, Atkin OK (2008) Transient shade and droughthave divergent impacts on the temperature sensitivity of dark respirationin leaves of Geum urbanum. Functional Plant Biology 35, 1135–1146.doi:10.1071/FP08113
Souza RP, Machado EC, Silva JAB, Lagôa AMMA, Silveira JAG (2004)Photosynthetic gas exchange, chlorophyll fluorescence and someassociated metabolic changes in cowpea (Vigna unguiculata) duringwater stress and recovery. Environmental and Experimental Botany 51,45–56. doi:10.1016/S0098-8472(03)00059-5
Takahashi T, Murata N (2008) How do environmental stresses acceleratephotoinhibition? Trends in Plant Science 13, 178–182. doi:10.1016/j.tplants.2008.01.005
Taylor NL, Day DA, Millar AH (2002) Environmental stress causesoxidative damage of plant mitochondria leading to inhibition ofglycine decarboxylase. The Journal of Biological Chemistry 277,42 663–42 668. doi:10.1074/jbc.M204761200
Zaragoza-Castells J, Sánchez-Gómez D, Hartley IP, Matesanz S, ValladaresF, Lloyd J, Atkin OK (2008) Climate-dependent variations in leafrespiration in a dry-land, low productivity Mediterranean forest: theimportance of acclimation in both high-light and shaded habitats.Functional Ecology 22, 172–184.
L Functional Plant Biology J. Rodríguez-Calcerrada et al.
www.publish.csiro.au/journals/fpb


