Embed Size (px)
Citation preview

This content has been downloaded from IOPscience. Please scroll down to see the full text.
Download details:
IP Address: 210.211.125.25
This content was downloaded on 12/10/2013 at 19:36
Please note that terms and conditions apply.
Optical fibre laser velocimetry: a review
View the table of contents for this issue, or go to the journal homepage for more
2012 Meas. Sci. Technol. 23 032001
(http://iopscience.iop.org/0957-0233/23/3/032001)
Home Search Collections Journals About Contact us My IOPscience

IOP PUBLISHING MEASUREMENT SCIENCE AND TECHNOLOGY
Meas. Sci. Technol. 23 (2012) 032001 (32pp) doi:10.1088/0957-0233/23/3/032001
TOPICAL REVIEW
Optical fibre laser velocimetry: a reviewThomas O H Charrett, Stephen W James and Ralph P Tatam
Department of Engineering Photonics, School of Engineering, Cranfield University, Cranfield,Bedfordshire, MK43 0AL, UK
E-mail: [email protected]
Received 13 June 2011, in final form 27 July 2011Published 23 January 2012Online at stacks.iop.org/MST/23/032001
AbstractThe applications of optical fibre technology to laser velocimetry are diverse and often criticalto their successful implementation, particularly in harsh environments. Applications rangefrom the use of optical fibres for beam delivery and scattered light collection, aiding theminiaturization of instrument probes, to the use of imaging fibre bundles for imaging the flowfield in planar velocimetry systems. Optical fibre techniques have also been used in signalprocessing, for example fibre frequency shifters, and optical fibre devices such as amplifiersand lasers have been exploited. This paper will review the use of optical fibres in point-wiselaser velocimetry techniques such as laser Doppler velocimetry and laser transit anemometry,as well as in planar measurement techniques such as particle imaging velocimetry and planarDoppler velocimetry.
Keywords: optical fibre, laser Doppler velocimetry (LDV), laser Doppler anemometry(LDA), laser transit anemometry (LTA), laser-two-focus (L2F), planar Doppler velocimetry(PDV), Doppler global velocimetry (DGV), particle imaging velocimetry (PIV)
(Some figures in this article are in colour only in the electronic version)
1. Introduction
Optical fibres are thin, flexible, transparent filaments madeof either glass or plastics that act as waveguides, or lightpipes, to transmit light between the two ends of the fibre.The process of guiding light was first described by DanielColladon in his 1842 article ‘On the reflections of a ray oflight inside a parabolic liquid stream’ [1]. However it wasnot until the 1960/1970s with the theoretical work by Kao[2], for which he jointly won the Nobel Prize in Physics in2009 [3], and the development of fused silica optical fibres atCorning Glass [4], that the commercial application of opticalfibres for communications was realized. Since then there hasbeen much interest in the use of optical fibres for a widerange of sensing applications including the measurement ofpressure, temperature, strain and chemical species [5–7] andfor laser velocimetry, which is the subject of this review. Laservelocimetry was first demonstrated shortly after the inventionof the laser and quickly became popular for non-intrusiveflow measurement. Optical fibres are incorporated in laservelocimetry instrumentation for a number of reasons. They
may be used simply as a light pipe, to deliver the illuminatinglight to the region of interest within the flow and/or tocollect the scattered light and deliver it to the detectors. Inthis role they are a key enabling technology, allowing thelaser source and detectors to be remote from the often harshmeasurement environment and also allowing the constructionof more compact, robust and light-weight probe heads, whichcan be traversed easily to map out the flow field. They canalso be included for signal processing, for example fibre phaseand frequency shifters, fibre amplifiers and as light sources(fibre lasers). More recently, with the development of planarand volume laser velocimetry techniques, optical fibres havebeen employed in imaging applications (via coherent arraysof optical fibres) and for the delivery of the high power laserbeams required by these techniques.
This review will start by summarizing some of thekey properties of optical fibres (section 2), which will befollowed by an overview of the operating principles employedby different laser velocimetry techniques (section 3). Theremainder of the review is composed of an overview, examplesand discussion of how optical fibres have been applied to the
0957-0233/12/032001+32$33.00 1 © 2012 IOP Publishing Ltd Printed in the UK & the USA

Meas. Sci. Technol. 23 (2012) 032001 Topical Review
Figure 1. Optical fibre types. Shading represents areas of higherrefractive index.
different techniques. Other reviews, such as [8, 9], cover moregeneral aspects of laser velocimetry that are not specificallyrelated to the applications of optical fibres.
2. Properties of optical fibre
An optical fibre consists of a transparent core surrounded by alayer of transparent cladding material with a refractive indexlower than that of the core, together with further buffer or jacketcoatings that protect the fibre during handling and deployment.Fibres can be characterized by their material properties andstructure, with the main classifications based upon the numberof possible light paths or modes guided by the fibre (single-mode or multimode fibres), the transition from core to cladding(stepped index or graded index (GRIN)) and the polarizationproperties, as shown in figure 1.
Although optical fibres can vary in diameter from a fewtens of microns to millimetres, those typically used in laservelocimetry are made from silica and have cladding diametersof 80–125 μm and can be of either single-mode or multimodetype, figure 1. Single-mode optical fibre typically has a corediameter of 5–10 μm and a cladding radius of ∼65 μm. An
ideal single-mode fibre will preserve the coherence, phase andpolarization of the optical wave. However, when single-modefibres are bent or twisted birefringence is induced, resultingin a concomitant change in the polarization state of the lightpropagating in the fibre [10]. Highly birefringent (Hi-Bi) fibreis an important variation of single-mode fibre where the fibreis manufactured to include a level of intrinsic birefringence,usually linear birefringence, which is sufficiently high suchthat external perturbation of the fibre, via for example bending,does not modify the birefringent properties of the fibre.Birefringence in this type of fibre is introduced either via thegeometry of the core and/or cladding or by including stressapplying parts in the cladding. Stress elements, typically rodsof a different glass, are positioned on either side of the fibrecore to induce a strong birefringence in the fibre, and hencethis fibre is referred to as highly birefringent or Hi-Bi fibre.Two common Hi-Bi fibre types (Panda and bow-tie) are shownin figure 1. If the polarization of the light coupled into the fibreis aligned with one of the birefringent eigenmodes, then thepropagating state of polarization will be preserved, and hencethis fibre is sometimes also known as polarization maintaining(PM) fibre.
In contrast, multimode optical fibres have core diametersof >50 μm and support a large number of propagating modes.The larger core diameter provides a larger cross-sectionalarea for collecting light than is available from single-modefibres. As such the alignment requirements when couplinglight into a multimode fibre are less stringent than that forsingle-mode fibres. However, as a large number of propagatingmodes can be supported by the fibre, the coherence, phase andpolarization of the light will no longer be preserved.
Optical fibres are also classified by the properties of thecore–cladding interface. In step-index fibres, the change inrefractive index between the core and cladding materials isabrupt, whereas in GRIN fibres the refractive index graduallydecreases from the centre of the core. This offers the advantagethat the modal dispersion is reduced in comparison with step-index fibre [11]. Other types of specialist fibre also exist usingdifferent materials and configurations for the core or cladding,such as photonic crystal [12], liquid core fibres [13], multi-core fibres and non-circular cores [11]. These have only beenused in a small number of examples of fibre optic velocimetryto date and will be described in more detail within the specificexamples presented below.
2.1. Power handling
There are several major limitations on the delivery of opticalpower to the measurement volume using optical fibres. Whencontinuous wave (CW) laser powers of above a few hundredmilliwatts and short wavelengths (488–532 nm) are coupledinto fibre cores, the transmitted power will slowly deteriorate.This phenomenon is associated with germania in the core, usedto raise the effective refractive index of the fibre, interactingwith the incident laser power to form colour centres [14]and is thought to be due to absorption in the ∼240–260 nmregion, and is therefore associated with two photon processesat the pump wavelengths used. This effect can be partially
2

Meas. Sci. Technol. 23 (2012) 032001 Topical Review
(a) (b) (c)
Figure 2. Types of imaging fibre bundles [26]; CCD camera views of bundle end faces, under white-light transmission. (a) Wound bundle;the fibres (10 μm diameter, 8 μm cores) are arranged in 5 × 5 multi-fibre blocks. (b) Fused bundle with a fibre core diameter ofapproximately 3 μm. (c) Leached fibre bundle constructed with 10.6 μm diameter fibres with 8 μm cores.
reversed by subsequent illumination of the fibre at the samewavelength, but the original attenuation characteristics willnot be regained [14]. Optical fibres with very low levelsof germania dopant (e.g. Fujikura [15] Panda Hi-Bi fibre,with <1% germania content) allow CW powers of severalwatts to be efficiently transmitted over short lengths of fibre(10–20 m). This photorefractive induced loss has not beenreported for operation at longer wavelengths (600 nm–1.3 μm)and is not expected.
A second limitation on power transmission is the onsetof nonlinear stimulated scattering processes in the fibre, inparticular stimulated Brillouin scattering (SBS) [16]. SBS isa nonlinear interaction that can be considered as the inputbeam creating a travelling acoustic wave in the fibre viaelectrostriction—the high electric field intensity modulatingthe refractive index. This results in a scattered wavepropagating back along the fibre with an optical frequencylower than the input wave when the input power is above acertain threshold. The frequency shift of the backscatteredSBS wave lies in the range of ∼12–35 GHz for inputwavelengths of ∼1.5 μm–500 nm.
SBS is a particularly important effect when the linewidthof the source is less than the SBS gain linewidth, asis the situation found for argon-ion lasers using an intracavity etalon to achieve single longitudinal mode operation(∼3 MHz linewidth), for high power semiconductor laserdiodes (∼10 MHz linewidth), and frequency-doubled diodepumped YAG lasers (∼1 kHz linewidth).
As an example an 800 m length of single-mode fibre withan attenuation of 27.4 dB km−1 will have a threshold powerof 20 mW at 514.5 nm [17]. If the power coupled into thefibre is 110 mW, then approximately 41% will be convertedinto backscattered light. The threshold power is inverselyproportional to the interaction length, so shorter fibre lengthswill have larger thresholds. For the above example, a 25 mlength of fibre will have a threshold of 150 mW and a 10 mlength will have a threshold of 350 mW. The onset of SBScan be prevented by decreasing the Brillouin gain coefficient(by for example lowering the germania concentration in thefibre) or by increasing the core diameter to reduce the powerdensity [17]. Although SBS is a problem for the delivery ofthe high power beams typically required for laser velocimetryit has some applications for fibre frequency shifters, as will bediscussed in section 4.4.
The high peak powers output from the pulsed lasers usedfor some planar velocimetry techniques can cause optical
damage to the delivery fibres. Common damage modes [18]include damage to the input surface of the fibre when the focusof the laser beam is positioned too close to the interface, andlinear fractures along the outer surface of core that are typically5–25 mm from the input face. At 532 nm, pulse energies of upto 14 mJ can be delivered using large core diameter multimodefibres [19]; however higher powers can be transmitted usinghollow fibres [20, 21] or fibre arrays [22].
2.2. Imaging fibre bundles
Coherent bundles of optical fibres, consisting of thousandsto hundreds of thousands of fibres, can be used to relayimage planes over distances of several metres and are used forimaging applications such as medical endoscopy and industrialremote sensing [23], as well as in planar laser velocimetrytechniques such as planar Doppler velocimetry (PDV) [24] andparticle imaging velocimetry (PIV) [25], which are discussedin sections 6 and 8 respectively. The imaging characteristicsare determined by the bundle structure and manufacturingmethod, with the imaging resolution limited by the discretefibre pixilation and cross-talk between fibres [26]. Thereare three main types of imaging bundles: wound, fusedand leached. Wound imaging bundles [23], figure 2(a), areproduced by winding a multi-fibre one layer at a time on adrum and laminating the desired number of layers together.The final bundle consists of multi-fibres that are bound togetheronly at the input and output ends, and are separate in-between.This allows more flexibility in the bundle format and allowsmultiple branches to be combined at one end [24], with typicalminimum bend radii of 50–150 mm depending upon the multi-fibres used in the construction [23]. In fused bundles [27],figure 2(b), the matrix of cores and claddings is fused solidalong the entire length. These bundles typically have corediameters of a few micrometres, but are much less flexible,with a minimum bend radius of ∼150–300 mm for bundlediameters of 1.25–2.8 mm [27]. Leached image bundles [23],figure 2(c), are constructed from fused multi-fibre rods withan acid resistant glass cladding and a secondary acid solublecladding which acts as a bonding agent. The stacks of rodsare drawn and cut to size. The bundle is then subjected to anacid bath to remove the secondary cladding between individualfibres, except at the protected ends, making the resultant bundleextremely flexible.
3

Meas. Sci. Technol. 23 (2012) 032001 Topical Review
Figure 3. Overview of laser velocimetry techniques employing optical fibres.
3. Principles of laser velocimetry
There are two physical principles that can be used to determinevelocity using optical techniques, as shown in figure 3:measurement of the Doppler frequency shift imposed onlight scattered from a moving particle and time-of-flightmeasurement, where the transit time between two points, orthe distance travelled in a known time interval, is used todetermine the velocity of the scattering particle.
For the purposes of this review, techniques that rely onmeasuring the Doppler shift can be further subdivided intobranches (figure 2); laser Doppler velocimetry (LDV) [28–30],other fibre interferometric approaches [32–34] and wavelengthfiltering-based techniques [24, 35, 36]. The latter rely upona frequency-to-intensity transducer to encode the Dopplerfrequency shift into a change in measured signal intensitysuch as in PDV [35] where an absorption line of moleculariodine is used. As the Doppler shift is vectorial in nature, asingle measurement channel measures a velocity componentthat is defined by the illumination and collection geometry ofthe optical system. As a result there has been considerableinterest in multi-component velocity measurement systems,with the use of optical fibres facilitating the development ofcompact systems that combine techniques that can measuredifferent components of the velocity using a common opticalaccess.
There is a large body of work relating to laser velocimetryin general and it would be impractical to include everything inthis review. Therefore, only laser velocimetry techniques thatrely significantly on the use of optical fibres are included inthe following sections. Other reviews relating to more generalaspects of laser velocimetry are referenced within the textwhere appropriate.
Figure 4. Geometry for determining the Doppler shift imposed onlight scattered from a moving particle.
3.1. Doppler velocimetry
Velocity measurements based upon the Doppler principle relyon the measurement of the Doppler frequency shift imposedupon light scattered from an illuminating laser beam byseeding particles entrained within the flow, or by the particlesof the flow themselves. The Doppler frequency shift dependsupon the wavelength of the illuminating light and the geometryof the system, which defines the component of velocity that ismeasured. This is referred to as the sensitivity vector andis defined as the bisector of the illuminating and viewingdirections, as is shown in figure 4.
The Doppler frequency shift is given by
fD = 1
2π(ks − ki ) · V , (3.1)
where ks and ki are the wave vectors of the scattered andincident beams respectively, and V is the velocity of the flow.For the geometry illustrated in figure 4, this yields
fD = 2
λcos
(θ
2
)|V | cos(β), (3.2)
where λ is the wavelength of the illuminating light, θ is theangle between the illumination and collection directions, and
4

Meas. Sci. Technol. 23 (2012) 032001 Topical Review
|V | cos(β) is the velocity component parallel to the bisectorof the illumination and collection directions.
Depending upon the optical configuration used, thetypical Doppler frequency shifts lie in the range fromhundreds of kilohertz to megahertz per metre per secondwith applications spanning a range of flow systems, fromblood flow (10−3 m s−1) to supersonic flows (>1000 m s−1).The Doppler frequency shift is thus very much smaller thanthe optical frequency and for the majority of flow systemsdirect measurement is not practical. In LDV the frequencyshift is measured using heterodyne detection [28–30], eitherby mixing the scattered light with a reference beam on aphotodetector to yield a signal oscillating at the frequencydifference between the beams, as is done in the reference beamanemometer [28], or by mixing the light scattered from twoillumination beams, as in the Doppler difference technique[29, 30]. Alternatively, the Doppler shift can be measuredusing a filter that acts as a frequency-to-intensity transducer,such as an iodine vapour cell [24, 35, 36]. For high speed flows(>100 m s−1) the frequency shift may be measured directly ona Fabry–Perot interferometer [37]. The operating principles oftechniques that measure the Doppler frequency shift and theuse of optical fibres in these techniques are discussed in thefollowing sections.
3.2. Time-of-flight methods
Velocity measurement techniques using the time-of-flightmethod measure a particle’s time-of-flight between two knownpositions to determine the velocity. This can be done at asingle location in the flow field, as in laser-two-focus (L2F)velocimetry [38–41], where a particle’s transit time betweentwo beams is measured, or at multiple locations using PIVand particle tracking velocimetry [42], where the motion ofparticles or groups of particles between the recording of twoconsecutive images with a known time separation is used todetermine the velocity. Recently volumetric measurementshave been demonstrated by various techniques using PIV [43].
4. Laser Doppler velocimetry
Laser Doppler velocimetry (LDV) [28–30] is a well establishedflow measurement technique that is capable of providing highquality, high-spatial resolution data over a range of flowconditions. The technique replies upon the measurement of theDoppler frequency shift of light scattered from an illuminatinglaser beam by particles entrained within the flow. There aretwo main optical configurations, reference beam LDV andDoppler difference LDV.
4.1. Reference beam LDV
The principles of reference beam LDV, the first reported laseranemometry configuration [28], are illustrated in figure 5.A single beam illuminates the flow and the scattered lightis collected at an angle θ with respect to the illuminationdirection. This is then mixed with a reference beam (localoscillator), derived from the same laser source, on the surface
Figure 5. Reference beam LDV arrangement.
of a photodetector, to give an electrical signal oscillating atthe beat frequency. The beat frequency, given by equation(3.2), is then a measure of the velocity component parallel tothe sensitivity vector of the system. Working in backscatterallows the measurement of the velocity component along theaxis of the instrument.
While the reference beam LDV configuration was usedto measure flow velocities in real engineering applications,and formed the basis of the first three-component LDVinstrumentation [44], it suffers from a number of limitationswhich hinder its practical implementation. These include thedependence of the measured frequency shift upon the viewingdirection, poor signal to noise characteristics due to a mismatchin the ratio of signal to reference beam powers, stringentalignment conditions such as requiring alignment of the signaland reference beams to better than a few minutes of arc, anda limited collection aperture due to coherence considerations[45]. Optical fibres allow many of these limitations to beovercome as well as offering the capability for flexible deliveryand collection of light in otherwise inaccessible regions.The use of optical fibres in reference beam LDV systems isdiscussed further in section 4.3 below.
4.2. Doppler difference LDV
The reference beam geometry was largely abandoned withthe development of the Doppler difference technique [29, 30],shown in figure 6. In the Doppler difference technique, twomutually coherent beams are crossed at their beam waists in theflow. Scattered light collected in any direction will thus containcomponents which have experienced different Doppler shiftsby virtue of the different illumination directions of the twobeams. The Doppler frequency shifts, fD1 and fD2, imposedon light scattered from the two beams are given by
fD1 = 1
2π(ks1 − ki1) · V , (4.1)
fD2 = 1
2π(ks2 − ki2) · V . (4.2)
Considering the superposition of these two waves on aphotodetector, the beat frequency is given by
f ∗D = |fD2 − fD1| =
∣∣∣∣∣V
2π
(ks2 − ki2 − ks1 + ki1
)∣∣∣∣∣ . (4.3)
5

Meas. Sci. Technol. 23 (2012) 032001 Topical Review
Figure 6. Doppler difference LDV arrangement.
For the configuration illustrated in figure 6, the measuredfrequency can be written as
f ∗D = V
λ(ki1 − ki2) = 2|V | cos(β)
λsin
(θ
2
). (4.4)
An alternative interpretation of the principles of Dopplerdifference LDV considers particles travelling through theinterference fringes that are formed at the beam intersection,with the crossing beams forming an interference pattern witha fringe spacing, �, given by
� = λ
2 sin(
θ2
) . (4.5)
When a particle travels through the intersection region at anangle, β, to the normal of the fringe planes, the scattered lightsignal will be amplitude modulated at frequency
f ∗D = |V | cos(β)
�= 2|V | cos(β)
λsin
(θ
2
). (4.6)
The key features of the Doppler difference configuration incomparison to the reference beam configuration can then besummarized as follows.
• The measured frequency is independent of the observationdirection, and is dependent only upon the geometry of theinterfering beams.
(b)(a)
Figure 7. (a) Typical Doppler signal produced by a particle travelling through the measurement volume. (b) The effect of imposing afrequency offset on one of the beams—the dashed line shows the case with no bias applied and the solid line shows the case with afrequency bias.
• Alignment and beam ratio requirements are transferred tothe illumination section of the system, where they maybe more easily satisfied and optimized. The alignmentof two beam waists is critical with misalignment causingthe fringe spacing to vary throughout the measurementvolume leading to a broadening of the measured frequencyspectrum [31].
• Large collection apertures may be employed withoutbroadening the spectrum of the signal.
• The scaling factor, governed by the illumination geometry,allows the measurement of high speed flows usingconventional signal processors.
• The dimensions of the measurement region created in theDoppler difference system are generally much smallerthan that of reference beam geometry in which themeasurement volume is defined by the Rayleigh rangeof the focused beam. For Doppler difference systemsthe measurement volume takes the form of an ellipsoidwith the dimensions normally defined in terms of the 1/e2
contours of the intersecting Gaussian beams.
It should be noted that the heterodyning process for bothLDV configurations gives the absolute frequency differenceonly—it does not indicate whether the Doppler shift is an up-shift or downshift and hence the measured velocity contains adirectional ambiguity. While in some situations the mean flowdirection may be known, in many applications the direction ofthe flow is one of the unknowns. To overcome this issue, afrequency bias can be applied to one of the beams such thatthe measured Doppler frequency is no longer an even functionof velocity. A typical Doppler signal produced by a singleparticle passing through the measurement volume is shown infigure 7(a) and the effect of the frequency bias is indicated byfigure 7(b).
This frequency bias may be achieved using an acousto-optic frequency shifter or Bragg cell. Alternatively itcan be achieved via nonlinear optical processes such asSBS or pseudo-heterodyning techniques borrowed frominterferometric signal processing schemes. In addition toallowing the direction of the flow to be established, frequencyshifting techniques allow higher resolutions at small Doppler
6

Meas. Sci. Technol. 23 (2012) 032001 Topical Review
frequencies, by shifting the measurement from dc to a higherfrequency. An alternative technique is to synthesize aheterodyne carrier by changing the phase of the interferometerin a controlled manner or modulation of the wavelength andusing a path length imbalanced interferometer. Differentapproaches to directional discrimination in fibre optic LDVsystems are discussed further in section 5.4.
Optical fibres can be included in LDV instrumentation todeliver illuminating light, improve the beam quality, collectscattered light and deliver it to the detectors, to undertakeoptical processing of the signal and to implement directionaldiscrimination techniques. The fibres may also be used toperform some of the signal processing and de-multiplexing formulti-component/multi-point configurations. The followingsections review the uses of optical fibres in LDV systems.
4.3. Beam delivery/collection
The use of optical fibres for beam delivery and scatteredlight collection allows the laser source and detectors to beremote from the often harsh environment surrounding theflow region and allows the construction of a compact, robustand light-weight probe head, which can easily be traversedto map out the flow field. Beam delivery systems used inLDV instrumentation should preserve the coherence and phaseof the laser light, requiring the use of single-mode opticalfibres. The interfering beams should also have the same stateof polarization to optimize the signal to noise ratio (SNR),which in some systems necessitates the use of Hi-Bi fibres.The optical fibres also perform a spatial filtering operation,producing high quality beams in the measurement volume.
Receiving fibres can be multimode for Doppler differenceLDV systems, since it is only intensity information that isrequired. However, reference beam LDV systems combine thereceived light interferometrically with a reference beam andhence, for this configuration, single-mode or Hi-Bi single-mode fibre is employed. When using multimode fibresfor beam collection, care must be taken in the choice offibre to ensure that dispersion effects in the fibre do notbroaden the Doppler spectrum. For the short lengths of fibretypically used (∼10–20 m) step-index fibre of 50–100 μm corediameter is suitable for the bandwidth of the signal processors(<150 MHz).
Fibre reference beam systems. The development of thefirst fibre optic-based LDV configuration was driven by therequirement for making blood flow measurements in vivo[46, 47] and the ability to use optical fibres to facilitateflexible delivery and collection of light. The experimentalconfiguration used by Dyot [47] is shown in figure 8. Theoutput from a He–Ne laser passes through a hole in a mirrorand is launched into a multimode optical fibre (a GRIN fibrewith a numerical aperture of 0.15 and diameter ∼125 μm)which illuminates the flow. The scattered light populatesall of the modes in the multimode fibre, producing a largediameter beam, and the reference beam is derived from lightreflected from the cleaved end of the fibre, automaticallyaligning the signal and reference beams. Light backscattered
Figure 8. Diagram of the operating principle of the fibre opticDoppler anemometer reported by Dyot [47].
Figure 9. Schematic of a polarization-based optical fibre referencebeam LDV system. [50].
from particles in the flow is collected by the fibre. Althoughdue to the numerical aperture of the fibre and the attenuationof the scattered light by absorption and secondary scattering,only light scattered from particles within a few tens of corediameters from the fibre end will be collected. For highlycoherent sources the returned signal is from particles <1 mmfrom the fibre end. As the optical cavity is formed between theend of the fibre and the particle in the flow, this configurationhas the advantages of down lead insensitivity, removing issuesassociated with the inability of multimode fibre to maintainthe polarization of the propagating modes. The small fibrediameter, ∼125 μm, does not significantly obstruct the flow.However, there is a stagnation region of several fibre diametersaround the fibre end in which particles are travelling muchslower than in the free stream flow.
To improve the light efficiency of the configuration shownin figure 8, Nishihara et al [50] used PM single-mode fibre, asillustrated in figure 9. This allowed the use of a polarizingbeam splitter in place of the trepanned mirror (figure 8).The tip of the fibre is terminated with a GRIN rod lens andquarter-waveplate so that light backscattered from the flow andlaunched into the fibre has undergone a double pass through thequarter-waveplate. Light scattered from the outer surface ofthe waveplate is used as the reference beam and is also rotatedby 90◦. Thus the reference and signal beams propagate backalong the fibre in the orthogonal eigenaxis to the illuminatinglight and are reflected by the polarizing beam splitter andmonitored on a photodetector.
7

Meas. Sci. Technol. 23 (2012) 032001 Topical Review
Figure 10. Diagram of the low coherent fibre optic Doppler anemometry system using a heterodyne approach described by Meggittet al [48].
In all of these implementations the reference beam isderived from the 4% Fresnel reflection from a cleaved fibre endor another optical surface. This considerably eases alignmentissues, and provides common mode rejection; however, itdoes suffer from significant limitations—the working distancefor such devices is limited to half the coherence lengthof the source and the incorporation of Bragg cells fordirectional discrimination is only possible for low coherenceimplementations. Also there is no way to adjust the powerratio of the signal and reference beams to optimize the signalto noise performance of the heterodyne signal.
To overcome the limitations on working distance,approaches borrowed from white light interferometry maybe used to process the return reference beam systems thatuse a Fresnel interferometer formed between the end of thefibre and the scattering particle. The configuration shown infigure 10 uses a low coherence length (lc) source, typically withlc < 200 μm, to illuminate the flow [48]. The source couldbe an edge emitting light emitting diode, super-luminescentdiode or multimode laser diode. A receiving interferometerwith a path length imbalance set to be equal to the distancefrom the fibre end to the desired measurement volume in theflow is used (2L in figure 10). In this example a Bragg cell isused both as a beam splitter and a frequency shifter to recoverthe flow direction. Extending the range of operation of suchconfigurations may be achieved using GRIN rod lens [49] tocollimate the output from the fibre, illuminate the flow andcollect and couple the backscattered light down the fibre. Thereference beam is again derived from the 4% Fresnel reflectionfrom the fibre end.
Figure 11. Fibre optic reference beam anemometer with directionaldiscrimination [51].
An alternative reference beam LDV scheme that allowsdetermination of the direction of the flow is shown in figure 11.Here the reference beam is derived using a beam splitter and ispassed through a Bragg cell to give directional discrimination.The signal beam is launched into single-mode optical fibreand the scattered light is returned through the same fibre. It isthen mixed with the frequency shifted reference beam on anavalanche photodiode [51].
Figure 12 shows a polarization-based fibre optic referencebeam LDV configuration [52]. Here the output from a laserdiode is split into signal and reference beams using a polarizingbeam splitter and a half-waveplate to control the split ratio andthus optimizing the SNR. The signal beam is then coupledinto arm A of a polarization splitting coupler (PSC) which isthe fibre optic analogue of a polarizing beam splitter. Thebeam propagates through the PSC along the TE axis, passesthrough a quarter-waveplate and illuminates the flow. Lightscattered from the measurement volume makes a second pass
8

Meas. Sci. Technol. 23 (2012) 032001 Topical Review
Figure 12. Polarization-based fibre optic reference beamanemometer [52].
through the quarter-waveplate before being re-coupled into theorthogonal TM axis of the fibre and is thus coupled into outputarm B of the PSC. The reference beam is coupled into the Yarm of the PSC along the TE axis and propagates into outputarm B of the PSC. The output of this arm now consists ofthe orthogonally polarized signal and reference beams whichare processed using a Mach–Zehnder interferometer. Thebeam is collimated and split with the reference beam passingthrough a Bragg cell to provide directional discriminationbefore being recombined on an avalanche photodiode. Thesignal beam passes through a half-waveplate to ensure thatthe polarization state is matched to the reference beamwhen mixed at the beam splitter. The optical signalprocessing is now performed entirely in the receiving Mach–Zehnder interferometer, leading to improved mechanicalstability [53].
Alignment requirements for such a configuration could beeased via the use of all-fibre components in the Mach–Zehnderinterferometer, or by using an integrated optical circuit asreported by Toda et al [54] and Pradel et al [55].
Byrne et al [56] demonstrated a fibre-based referencebeam system, shown in figure 13, using a fibre Bragg grating(FBG) inscribed in the core of the single-mode fibre close tothe distal end as the source of the reference beam. An FBGis a periodic modulation of the refractive index of the coreof an optical fibre that acts as a wavelength selective mirror.The ratio of light in the signal and reference beams can becontrolled by tuning the source laser, in this instance a laserdiode, or by temperature tuning the grating period to vary thereflectivity of the grating at the laser source’s wavelength.
Environmental acoustic noise will cause perturbation ofthe fibre propagation constants and introduce phase noise tothe signal, a source of spectral broadening in fibre-based LDVconfigurations that lack common mode rejection. Howeverthe environmental contribution to the broadening of the signalis found to be significant only at low mean velocities andtransit time broadening is the dominant contribution as themean velocity increases [57]. For a system with fibre leads10 m long in an environment with an acoustic noise level of
Figure 13. Reference beam anemometer using a FBG [56].
Figure 14. Single transmitting fibre Doppler difference anemometer[59].
100 dB this effect only becomes significant below a meanvelocity of 1 m s−1 [57].
Optical fibre Doppler difference systems. Optical fibreDoppler difference LDV systems can be split into twobroad categories: fibre linked instruments in which a singletransmitting fibre is used to connect the laser to the instrumenthead [58–60] and dual-fibre instruments in which a separateoptical fibre is used for each beam [61]. A number ofdifferent configurations have been reported using both single-mode optical fibre [59–61] and PM optical fibre [58, 62].In the first category the probe head contains the bulk opticsnecessary to derive and condition the two beams and performany directional discrimination such as frequency shifting.Figure 14 shows a typical implementation, as described byJackson et al [59]. Here a single-mode fibre is used todeliver the illumination beam to the probe head, where the twobeams are split and conditioned using bulk optic components.Bragg cells impose a frequency shift between the beams fordirectional discrimination. A miniaturized, single deliveryfibre approach was reported by Czarske [60] using the −1stand +1st diffraction orders of a diffraction grating to producetwo beams from a single-mode delivery fibre. Scattered lightis collected by the same lens used to focus the beams, deflectedby a wedge and coupled into a multimode fibre that was gluedto the delivery fibre.
A dual-fibre approach does not require beam-splittingcomponents or modulators in the probe head and as suchthe probe head of such an instrument can be simple andcompact. Figure 15 shows a typical dual beam setup such
9

Meas. Sci. Technol. 23 (2012) 032001 Topical Review
Figure 15. Dual transmitting fibre Doppler difference anemometer[61].
(a)
(b)
Figure 16. Dual-core optical fibre Doppler difference probes [62].
as that reported by Sasaki et al [61]. The use of a Hi-Bi fibrelink for the beam delivery ensures that the polarization statesof the interfering beams is maintained giving high visibilityfringes in the measurement volume.
Khotiaintsev et al [62] reported the use of a dual-core fibreto further miniaturize the dimensions of a Doppler differenceLDV probe head for use in biomedical applications such ameasuring blood flow in capillaries. The twin core fibreused had a cladding diameter of 125 μm with the two cores25 μm apart. The two cores had a slightly elliptical cross-section to induce geometrical birefringence and thereforeallow the preservation of the linear polarization state of thelight propagating along them. The authors reported twodifferent probe configurations. The first, shown in figure 16(a),splits the output from the laser into two beams and launchesthem into different cores of the dual-core fibre. A GRIN rodlens was used to collimate the outputs from the fibre. As thecores were located on either side of the optical axis of the GRINlens, the outputs propagated at equal and opposite angles to theoptical axis, such that the emerging beams intersected to form ameasurement volume. There are several disadvantages to thisconfiguration, including the complexity of the optical systemused for the coupling of light into the two individual cores ofthe fibre. Also, for long fibre lengths the differential phasemodulation of light propagating along the two cores becomesvery large, resulting in the instability of the interference fringepattern within the measurement volume. A second probe
Figure 17. The intersection volume and interference volume of twocrossing multimode laser beams. The lines indicate the 1/e2 bordersof the laser beams and the interference volume. Here 2w0 is thebeam waist diameter, 2az is the length of the interference volume,2lz is the length of the beam intersection volume and 2lx is the widthof the interference volume. Taken from Buttner and Czarske [64].
design, designed to overcome these difficulties, is shown infigure 16(b) [62]. Here the light is coupled into only one ofthe cores and a directional coupler is fabricated near the distalend of the fibre to couple approximately 50% of the light intothe second core. A spherical lens is used to collimate andintersect the two beams and is manufactured by melting thefibre tip. As the two beams are formed near the end of thefibre, no significant phase difference between the two beamsis accumulated in this short distance. A similar approach usingtwo-core photonic crystal fibre and launching into both coreshas also been reported [63]. The use of photonic crystal fibreswas proposed as an alternative to conventional dual-core fibresas it should in principle be easier and cheaper to manufacturedual- or multi-core fibres.
Multimode fibres have also been used for beam deliveryin Doppler difference LDV systems, as they allow thetransfer of significantly higher optical powers and require lessalignment than single-mode fibre. However the multimodefibre reduces the degree of spatial coherence, causing signaldegradation. Buttner and Czarske [64, 65] propose a Dopplerdifference system that uses the reduced spatial coherenceto limit the measurement volume to only the portion ofthe beam intersection where the two beams are coherent.This can reduce significantly the length of the measurementvolume along the axis of the optical system. They report ameasurement volume < 584 μm by 40 μm for a multimodefibre system in comparison with typical measurement volumedimensions of 250 μm by 4 mm for a single-mode fibre system.
4.4. Directional discrimination
Bragg cells. A Bragg cell, or acousto-optic modulator(AOM), can be used to achieve the optical frequency shiftrequired to facilitate the determination of the direction of theflow. In this device, figure 18, a travelling acoustic wave setsup alternate regions of high and low density in the crystal,causing a periodic variation in the refractive index that actsas a moving diffraction grating that travels inside the crystalat the acoustic wave velocity. This moving grating imposes a
10

Meas. Sci. Technol. 23 (2012) 032001 Topical Review
Figure 18. Schematic of a Bragg cell.
Doppler frequency shift on the diffracted optical beam. Braggcells typically produce frequency shifts in the range of ten tohundreds of MHz; however lower frequencies can be achievedby using two Bragg cells with a slight frequency difference.For example, two Bragg cells operating at 80 and 81 MHz willresult in a carrier at 1 MHz. Higher frequency shifts can beachieved by using multiple devices or multiple passes througha single device.
Bragg cells are used extensively [48, 51, 52, 59, 61] inlaser Doppler systems as they can operate with high powerlasers (e.g. argon-ion lasers) and over a wide range of opticalwavelengths (∼400 nm–1.5 μm). Optical fibres have beencombined with Bragg cells, together with the necessary microoptics and fibre-pigtailed units to satisfy the requirements forvery high optomechanical stability between the fibre and theBragg cell. In such devices, shown in figure 19, the linearlypolarized output from a birefringent fibre is collimated andcoupled into the Bragg cell. The shifted and unshifted beamsat the output of the Bragg cell are coupled into two separatebirefringent optical fibres with coupling efficiencies of around60%.
In-fibre frequency shifters. In-fibre frequency shifterswould offer great potential for application in LDV byfurther decreasing the losses and reducing the power andoptomechanical stability requirements. However, to the bestof our knowledge, there is limited use of these devices inreported implementations of LDV. Here, only fibre frequencyshifters that could be applied to LDV are included and a moregeneral discussion of optical fibre frequency shifters can befound in [66].
Optical fibre frequency shifters operate by scattering theinput optical beam using an acoustic wave travelling along theoptical fibre, and can be divided into two classes, extrinsicand intrinsic, based upon the method used to generate theacoustic wave. In extrinsic devices the travelling acousticwave is generated externally to the fibre and coupled to it bya transducer, whereas in intrinsic devices the acoustic wave isgenerated internally within the optical fibre.
Extrinsic fibre frequency shifters consist of an optical fibrecapable of supporting two orthogonal propagation modes in its
unperturbed state and a means of coupling an external acousticwave into it. The travelling acoustic wave inside the fibrecauses light to be coupled from one propagation mode to anorthogonal mode, and results in an optical frequency shiftin this coupled light. The modes coupled between can beorthogonal in terms of polarization [67, 68] or spatial profile[69, 70] or coupling can occur between fibre cores in dual-core fibre [71]. A fibre frequency shifter technique that hasthe potential to achieve higher frequency operation is basedon a null coupler [70]. In these devices two fibres withdifferent propagation constants are fused to form a taperedcoupler. As the fibre propagation constants are mismatched,none of the optical power input into one fibre is coupled intothe other unless a travelling acoustic wave causes a resonantcoupling between the fundamental and second mode of thecoupler waist. This results in a frequency shift if the beatlength of the two modes matches the acoustic wavelength. Adevice with a 10.8 MHz frequency shift at 633 nm has beendemonstrated [70] and is attractive for fibre optic LDV as noother components are required. The power requirements arelow (<1 mW) and the magnitude of the frequency shift can,in principle, be varied by the design of the coupler waist.
Intrinsic fibre frequency shifters are based on thegeneration of SBS within the optical fibre [72]. SBS arisesfrom scattering of the input optical beam from acoustic wavesgenerated via electrostriction within the fibre. The pumplight is scattered from the resulting moving diffraction gratingproducing a backscattered wave that is downshifted in opticalfrequency from the input beam. This frequency shift is givenby
fSBS = 2nVa
λp
, (4.7)
where λp is the pump/input optical wavelength, Va is theacoustic velocity and n is the effective refractive index ofthe propagating mode. Typical SBS frequencies are of theorder of tens of GHz (e.g. 13 GHz at 1300 nm [73], 22 GHzat 800 nm [74], 27 GHz at 632.8 nm [75] and 34 GHz at514.5 nm [76]) and the linewidth is inversely proportionalto the pump wavelength and is typically 100–150 MHz fora 514.5 nm pump. This frequency shift is generally toohigh for direct electronic detection; however a low frequencycarrier can be produced by mixing two SBS signals of slightlydifferent frequencies generated by using an optical fibre withdifferent effective refractive index to generate each frequency.This has been achieved by using two 500 m fibre reels offibre [77] generating a beat frequency of ∼750 MHz and alinewidth of ∼1 MHz. The beat frequency can be tuned bychanging the temperature of one fibre so as to change theeffective index and thus its SBS frequency shift, resulting in asensitivity of ∼4 MHz ◦C−1. Alternatively, the beat frequencycan be generated by mixing the SBS signals from the twopolarization eigenmodes of a single Hi-Bi fibre. Duffy andTatam [17] reported a system using a single length of 800 mof birefringent fibre to produce a frequency shift of ∼10 MHz.Both of these approaches require long lengths of fibre andhave power requirements of tens to hundreds of milliwatts. Analternative approach using optical fibre ring resonators [75, 78]
11

Meas. Sci. Technol. 23 (2012) 032001 Topical Review
Figure 19. Photograph of a fibre-pigtailed Bragg cell.
has been used to reduce the fibre lengths to tens of metres andthe power requirements to tens to hundreds of μW. However,ring resonator systems do not produce sufficient output powerfor many LDV applications, typically being limited to a fewtens of milliwatts.
A Doppler difference LDV system using SBS frequencyshifting has been reported by Tobben et al [79] and is shownin figure 20. The pump laser, a 100 mW Nd:YAG MISER(monolilthic isolated single-frequency end-pumped ring laser),operating at 1319 nm is coupled into two fibre coils, eachapproximately 20 km long. The two different fibres usedgenerated 10 mW at the SBS frequency with a frequencydifference of ∼18 MHz and a stochastic jitter with a bandwidthof ∼10 MHz. To remove this jitter from the demodulatedsignal, part of the SBS signal is used as a reference signal.This reference signal is divided and used to produce quadraturecomponents (sine and cosine) which are both mixed withthe measurement signal. This method eliminates the effectof large SBS frequency fluctuations and enables directionaldiscrimination.
Pseudo-heterodyne processing. An alternative approach toachieving directional discrimination is pseudo-heterodyneprocessing, in which a heterodyne carrier is synthesized
Figure 20. Schematic of the LDV system using SBS frequency shifters [79]. Here P is the pump laser power and S1 and S2 are the powersof the backscattered stimulated Brillouin light for the two fibres which are combined to form the measurement volume. APD: avalanchephotodiode.
(a)
(b)
Figure 21. Fibre optic Doppler difference LDV implementationsusing (a) a fibre wrapped PZM and (b) a frequency modulated laserdiode to perform pseudo-heterodyning.
by either modulating the phase of the interferometer ormodulating the wavelength of the source in combination witha path length imbalanced interferometer. Figure 21 showstypical fibre implementations of Doppler difference LDVsystems employing pseudo-heterodyne signal processing.Figure 21(a) shows how an optical fibre wrapped around apiezoelectric modulator (PZM) can be used to change the phasewithin the interferometer [80], whereas figure 21(b) uses afrequency modulated laser diode together with an optical pathlength imbalance within the interferometer [81].
12

Meas. Sci. Technol. 23 (2012) 032001 Topical Review
(a)
(b)
(c)
Figure 22. Pseudo-heterodyne processing using either phase orwavelength modulation. (a) The serrodyne (saw-tooth) modulationapplied, (b) the resulting interferometric fringes and (c) thebandpass filtered version of (b).
The process is illustrated in figure 22, in which (a) showsthe serrodyne (saw-tooth) modulation that is applied to eitherthe phase of the interferometer or to the injection current ofa laser diode to induce a change in the emission wavelength.This demonstrates where the term pseudo-heterodyne comesfrom, that is, there is not a continuous change in the phaseand the flyback at the end of the ramp will cause the fringesto move in the opposite direction rapidly. Figures 22(b) and(c) show the resulting interferometric fringes before and afterthe application of a bandpass filter that is used to remove thehigher harmonics associated with the ramp flyback.
A fibre wrapped PZM has been employed in LDV [81],although it was restricted to low velocities by the response ofthe PZM, which limited the achievable carrier frequency to∼200 kHz. The use of the wavelength modulation capabilitiesof laser diodes, together with a path length imbalancedinterferometer allows much higher carrier frequencies to begenerated. The phase difference, �φ, between the two pathsof an interferometer is given by
�φ = 2π�L�v
c, (4.8)
where �L is the path length imbalance, �v is the opticalfrequency shift and c is the free space velocity of light.The output wavelength can be varied slowly by changing thetemperature of the diode or rapidly by modulating the injectioncurrent. Application of a ramp modulation signal to theinjection current produces an associated linear variation in theoptical frequency [82]. The technique has been used for LDVmeasurements [83, 84] and, as laser diodes can be modulatedat much higher frequencies than PZMs, carrier frequenciesof >100 MHz have been reported. However, a limitation
Figure 23. Schematic diagram of the twin-fibre junction used byPlamann et al [85] to provide directional discrimination in a fibreLDV system.
of this technique is the associated intensity modulation thataccompanies injection current modulation of a laser diode. Tominimize this effect the optical frequency change can be keptsmall, <5–10 GHz which implies a path length imbalance ofseveral centimetres to achieve a 2π phase shift. This will limitthe intensity variation to only a few per cent but increase phasenoise in the interferometer.
Other directional discrimination techniques. Plamann et al[85] report a novel approach to directional discriminationthat uses the optical imaging relation between the positionof the scattering particle in the measuring volume and thecorresponding imaged position on a dual-core collecting fibre.In this setup a specially constructed fibre with two semicircularcores (figure 23) is used to collect the scattered light, with thesignal being sent to two photodetectors. Depending on theposition of the scattering particle in the measurement volume,a stronger or weaker signal is observed on either photodetector,thus revealing the position of the particle in the volume at thatinstance. The direction of the particles’ motion can then befound by analysing the signals from the two detectors.
Fibre coupled integrated optical devices for directionaldiscrimination for use with LDV have also been reported byseveral groups [54, 55, 86]. Frequency shifting or phasemodulation can be achieved by a number of different principlesincluding the electro-optic effect [87], piezoelectric effect[88], carrier injection and depletion [89], surface acousticwave modulation [90] and thermo-optic modulation [91]. Arecent example [86] reports a silicon-on-insulator frequencyshifter chip using the thermo-optic phase modulation togetherwith serrodyne modulation. The frequency shifter was fibrecoupled for use with an LDV system designed for bloodflow measurements and provided a 1 kHz frequency shift at1550 nm. These devices can also be used to divide andcombine light in the same component.
Buttner and Czarske [65, 92] described a methodof directional discrimination without any frequency-shiftelements. In this approach, quadrature-homodyne laserDoppler anemometry (LDA), two interference fringe systemsare generated which are shifted by one-fourth of the commonfringe spacing. The resulting signal when a particle crossed themeasurement volume is two superimposed fringe bursts with adirectional dependent phase shift of π/2 between them. Thesecan be physically separated by various techniques includingtime multiplexing using alternate pulses for each fringe system,
13

Meas. Sci. Technol. 23 (2012) 032001 Topical Review
Figure 24. Multi-point optical fibre LDV using fibre multi-branches [93].
frequency multiplexing using different carrier frequencies forthe two fringe systems, polarization multiplexing where thefringe systems are separated by orthogonal polarization statesor wavelength multiplexing using dichroic mirrors. In thistechnique fibre optic links were used to combine the output ofthe two lasers.
4.5. Multi-point LDV
The mapping of an entire flow using LDV can be time-consuming and therefore costly in large scale facilitiessuch as wind tunnel testing. The flexibility of fibre opticimplementations can be used to overcome this by allowingsimultaneous measurements at several positions. One suchsystem is shown in figure 24 [93]. Here the outputs from twomultimode fibres were split into six beams at the fibre multi-branch. The outputs were collimated using GRIN lenses andarranged to form an array of six discrete Doppler differencechannels. A collection lens imaged the scattered light ontoan array of receiving multimode fibres. An alternativearrangement that more easily allows higher numbers of
Figure 25. Spatially multiplexed LDV system using wavelength modulation pseudo-heterodyning [96].
measurement channels is to form a linear measurement volumeby crossing two light sheets [94, 95]. The scattered light canthen be imaged onto an array of receiving fibres. Hachigaet al [94] report 96 channel measurements with measurementvolumes of around 800 × 120 × 10π μm3; although thelimited number of available signal processor channels meantthat in this demonstration only 16 channels could be measuredsimultaneously. More recently, Ishida et al [95] reported amicro LDV system for blood flow velocity imaging, with32 channels and a spatial resolution of 125 × 100 ×100 μm3.
A spatial multiplexing system using wavelengthmodulation-based pseudo-heterodyning has also been reported[96]. In this system, shown in figure 25, the multiplexingis achieved by using a different carrier frequency for eachmeasurement channel. This is done by modulating thewavelength of a common laser source and having differentpath length imbalances for each channel.
4.6. Multi-component LDV
The use of optical fibre technology has been the key inthe design and implementation of LDV instrumentationcapable of measuring multiple components of the velocityof the flow, allowing flexible beam delivery and collectionand the construction of compact probe heads. A largenumber of configurations have been proposed, and commercialinstrumentation developed [97, 98], that are capable ofcharacterizing 2D and 3D flow fields. Figure 26 shows variousLDV probe beam configurations for single-component, 2Dand 3D measurements. To fully characterize these flowsrequires at least two (2D flows) or three (3D flows) measuredvelocity components. Ideally, for 3D flow measurements,the measurement channels should be arranged to directlymeasure the orthogonal components of the flow velocity using
14

Meas. Sci. Technol. 23 (2012) 032001 Topical Review
three independent probe heads. This situation is often foundin wind tunnel applications with unrestricted optical access.However, in other applications such as in turbo machinery,optical access may be limited, requiring the use of fewerprobes or even a single probe head for both the illuminationand collection of the scattered light. This results in measuredvelocity components that are inclined with respect to theCartesian coordinate system, with each measured velocitycomponent containing information on all three orthogonalvelocity components. A matrix transformation is then requiredto recover the orthogonal velocity components.
Multiple velocity components can be measured usinga single channel sequentially, adjusting the experimentalarrangement between each measurement to access a differentvelocity component. The orthogonal velocity components canthen be calculated using a suitable matrix transformation.This is the case for the 1D-LDV probes shown infigures 26(a) and (b), where multiple velocity componentscan be measured by rotating the probe head and hence theoptical axis of the instrument [99, 100]. Alternatively, multiplescattering/collection angles can be used simultaneously for3D measurements. Three independent 1D-LDV probe headscan be used, with the measurement volumes aligned to becoincident in the flow. Alternatively, a two-headed approachcan be adopted using a 1D-LDV probe and a 2D-LDV probe.Finally three-component measurements can be made using asingle 3D-LDV probe head. Probe heads capable of measuringtwo components are shown in figures 26(c) and (d) andthose capable of measuring three components are shown infigures 26(e), (f ) and (g) with the individual measurementchannels distinguished by using multiple detectors [101]or by multiplexing using wavelength [102–104], frequency[105–107], polarization [108–110] or time [111–114]. Inthe 3D reference beam probe shown in figure 26(e) theillumination is provided externally to the receiver probe [101]so additional optical access is required. However in the otherprobe beam configurations, figures 26(a)–(d), (f ) and (g),the illumination and scattered light collection is performedusing the same probe. This can either be through separatetransmitter and receiver optics as shown in figure 26(b) or bycollecting scattered light using the same lens used to form themeasurement volumes. The scattered light is then typicallycoupled into a multimode fibre for delivery to the detector(s).
Wavelength multiplexing. In wavelength divisionmultiplexed (WDM) systems, distinct optical frequenciesare employed and light scattered from different channels canthen be separated using wavelength selective optics [103].In general, PM fibre is used to deliver the light to a probehead, to ensure optimum fringe visibility is maintained inthe measurement volume. The 2D-LDV probe head shownin figure 26(c) consists of two illumination beams (beams 1and 2) of the same wavelength that form a Doppler differenceLDV channel to measure the y component of the flow velocity.The second wavelength is used for beams 3 and 4 to forma second channel that is sensitive to the x component ofthe flow. In commercially available LDV instrumentation[103, 104], the measurement channels are generally
(a) (b)
(c) (d)
(e)
(g)
( f )
Figure 26. LDV probe head configurations: (a) 1D Dopplerdifference LDV probe, (b) 1D μLDV probe [99, 100], (c) 2D fourbeam LDV probe, (d) 2D three beam probe using polarizationdiscrimination [110], (e) 3D reference beam LDV receiver probe[101], (f ) 3D five beam LDV probe [102] and (g) five beam, hybridDoppler difference and reference beam 3D-LDV probe [115, 116].
distinguished using wavelength, typically using the three linesthat can be generated from the output of an argon-ion laser(458, 488 and 514.5 nm) and PM fibre is employed for thebeam delivery.
Wavelength multiplexing is commonly used in 3D-LDVsystems and there are two main commercially availableconfigurations. The first is a two-headed system consistingof a 1D-LDV probe, figure 26(a), and a 2D-LDV probe,
15
Meas. Sci. Technol. 23 (2012) 032001 Topical Review
(a) (b)
Figure 27. (a) Example of a 3D fibre optic LDV system; (b) the system in use measuring the air flow field around a ship model in a windtunnel. Photos courtesy of Dantec Dynamics/University of Bristol, UK [98, 138].
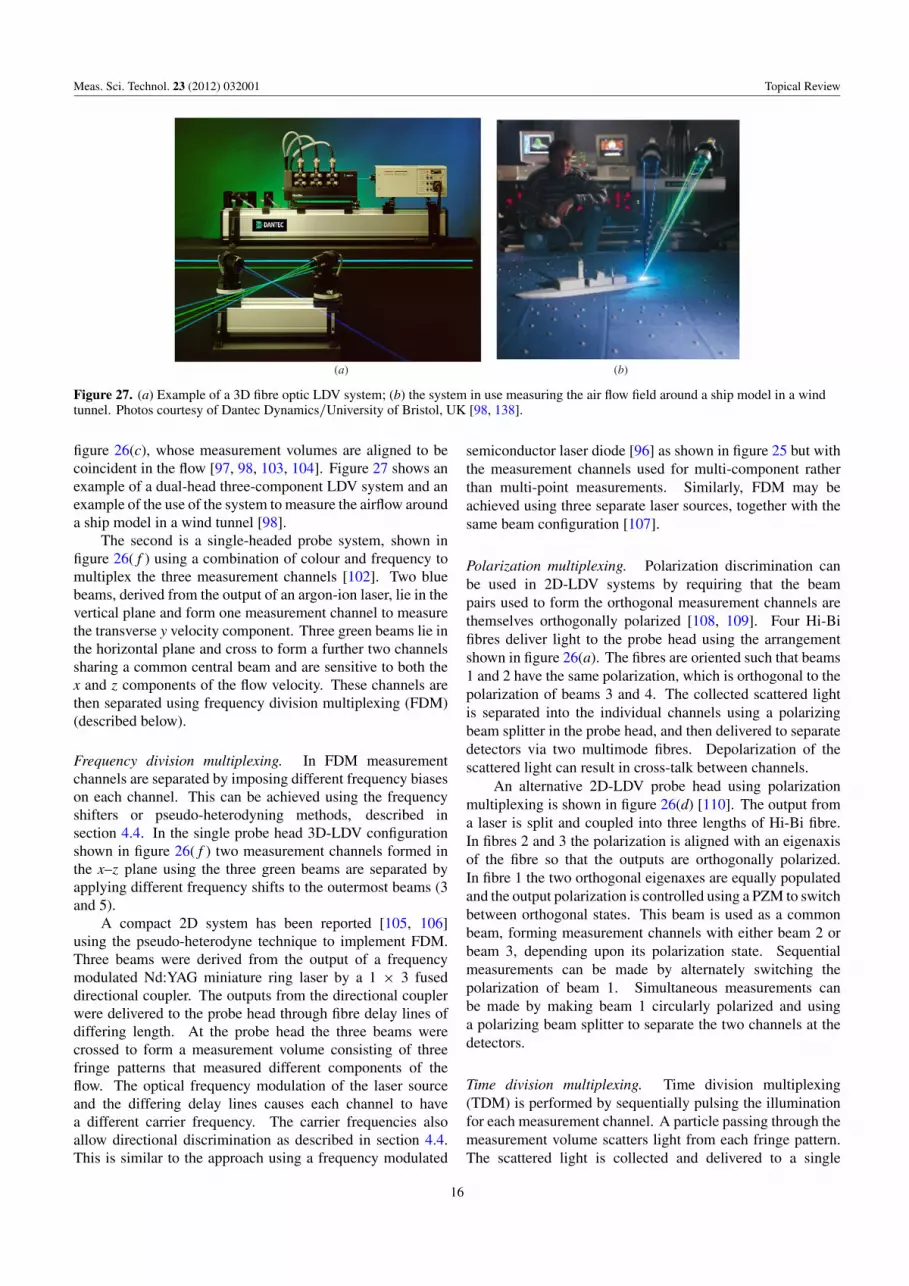
figure 26(c), whose measurement volumes are aligned to becoincident in the flow [97, 98, 103, 104]. Figure 27 shows anexample of a dual-head three-component LDV system and anexample of the use of the system to measure the airflow arounda ship model in a wind tunnel [98].
The second is a single-headed probe system, shown infigure 26(f ) using a combination of colour and frequency tomultiplex the three measurement channels [102]. Two bluebeams, derived from the output of an argon-ion laser, lie in thevertical plane and form one measurement channel to measurethe transverse y velocity component. Three green beams lie inthe horizontal plane and cross to form a further two channelssharing a common central beam and are sensitive to both thex and z components of the flow velocity. These channels arethen separated using frequency division multiplexing (FDM)(described below).
Frequency division multiplexing. In FDM measurementchannels are separated by imposing different frequency biaseson each channel. This can be achieved using the frequencyshifters or pseudo-heterodyning methods, described insection 4.4. In the single probe head 3D-LDV configurationshown in figure 26(f ) two measurement channels formed inthe x–z plane using the three green beams are separated byapplying different frequency shifts to the outermost beams (3and 5).
A compact 2D system has been reported [105, 106]using the pseudo-heterodyne technique to implement FDM.Three beams were derived from the output of a frequencymodulated Nd:YAG miniature ring laser by a 1 × 3 fuseddirectional coupler. The outputs from the directional couplerwere delivered to the probe head through fibre delay lines ofdiffering length. At the probe head the three beams werecrossed to form a measurement volume consisting of threefringe patterns that measured different components of theflow. The optical frequency modulation of the laser sourceand the differing delay lines causes each channel to havea different carrier frequency. The carrier frequencies alsoallow directional discrimination as described in section 4.4.This is similar to the approach using a frequency modulated
semiconductor laser diode [96] as shown in figure 25 but withthe measurement channels used for multi-component ratherthan multi-point measurements. Similarly, FDM may beachieved using three separate laser sources, together with thesame beam configuration [107].
Polarization multiplexing. Polarization discrimination canbe used in 2D-LDV systems by requiring that the beampairs used to form the orthogonal measurement channels arethemselves orthogonally polarized [108, 109]. Four Hi-Bifibres deliver light to the probe head using the arrangementshown in figure 26(a). The fibres are oriented such that beams1 and 2 have the same polarization, which is orthogonal to thepolarization of beams 3 and 4. The collected scattered lightis separated into the individual channels using a polarizingbeam splitter in the probe head, and then delivered to separatedetectors via two multimode fibres. Depolarization of thescattered light can result in cross-talk between channels.
An alternative 2D-LDV probe head using polarizationmultiplexing is shown in figure 26(d) [110]. The output froma laser is split and coupled into three lengths of Hi-Bi fibre.In fibres 2 and 3 the polarization is aligned with an eigenaxisof the fibre so that the outputs are orthogonally polarized.In fibre 1 the two orthogonal eigenaxes are equally populatedand the output polarization is controlled using a PZM to switchbetween orthogonal states. This beam is used as a commonbeam, forming measurement channels with either beam 2 orbeam 3, depending upon its polarization state. Sequentialmeasurements can be made by alternately switching thepolarization of beam 1. Simultaneous measurements canbe made by making beam 1 circularly polarized and usinga polarizing beam splitter to separate the two channels at thedetectors.
Time division multiplexing. Time division multiplexing(TDM) is performed by sequentially pulsing the illuminationfor each measurement channel. A particle passing through themeasurement volume scatters light from each fringe pattern.The scattered light is collected and delivered to a single
16

Meas. Sci. Technol. 23 (2012) 032001 Topical Review
Figure 28. Fibre optic-based TDM 3D-LDV system [113].
detector. This gives a train of interleaved pulses from whichthe individual channels can be separated by taking everythird pulse (for a three-component system) from the pulsetrain. A 2D-LDV system employing TDM was reportedby Carbonaro [111], using a mechanically chopped argon-ion laser configuration in which each channel was maskedin turn. This scheme was limited to measuring low Dopplerfrequencies due to the limited speed of the mechanical chopper.Laser diodes are ideally suited to TDM LDV as they allow highfrequency modulation. In a straight forward configuration, aseparate laser diode, power supply and temperature controllerwould be required for the illumination of each measurementchannel, with each channel electronically synchronized [112].However, the use of optical fibres allows a 3D system tobe constructed using a single source and detector [113], asshown in figure 28. The output from the laser diode isdivided into three measurement channels using polarization-preserving couplers to maintain the polarization state of theoutput beams and ensure maximum fringe visibility. The laserdiode was pulsed and fibre delay lines were used to ensure thateach pulse from the source diode emerged from each channel inturn, and that these pulses were regularly spaced. A multimodeoptical fibre was then used to collect the scattered light anddeliver it to the detector. The length of fibre used to delay thepulses depends on the repetition rate required, which is itselfdependent on the maximum Doppler frequency the system isexpected to measure. In the 2D system presented in [113]the diode was modulated at 33.3 MHz with a duty cycle of20% giving 6 ns pulses with a 30 ns cycle. From the Nyquistlimit, the modulation frequency needs to be at least twice theexpected maximum Doppler frequency, and therefore with afringe separation of 5 μm, the maximum flow rate that canbe measured is ∼80 m s−1. The arm measuring the secondchannel contained an additional 2.2 m of fibre to give a pulseseparation of 10.5 ns on the detector.
Resagk et al [114] implemented TDM using a fibre-pigtailed laser diode and fibre-coupled integrated opticaldevice in a three beam 2D-LDV probe similar to that shown infigure 26(d). The integrated optical device, a Y-fed balancedbridge modulator, allowed the intensities in beams 2 and 3 tobe modulated by a control voltage, whilst beam 1 acted as acommon beam for both measurement channels. By switchingthe output from one beam to the other, orthogonal velocitycomponents could be measured.
Hybrid Doppler difference and reference beam 3D-LDVprobe. The matrix transformation used to convert from thenon-orthogonal velocity components measured by a single-probe 3D-LDV system to the orthogonal velocity componentscan result in large errors in the calculated velocities. Inan attempt to overcome this, a hybrid Doppler differenceand reference beam 3D-LDV probe configuration has beenreported [115, 116]. The probe configuration, shown infigure 26(g), consists of two Doppler difference channels(beams 1 & 2 and 3 & 4) which measure the x and ycomponents directly, and a single reference beam channelwhich is predominantly sensitive to the z component.
In the implementation [116] shown in figure 29(a), WDMwas used to separate the three measurement channels. Threelaser diodes each operating at slightly different wavelengthsaround 800 nm where used for illumination and theiroutputs coupled into PM fibre. The two Doppler differencechannels incorporated fibre-pigtailed frequency shifters toallow directional discrimination and also acted as beamsplitters. The reference beam channel incorporated a variablesplit ratio polarization-preserving directional coupler, set sothat 95% of the power was guided to the probe head, and theremaining 5% was used as the reference beam. At the probehead, shown in figure 30, the fibre outputs were collimatedusing GRIN lenses and focused to a measurement volume. A
17

Meas. Sci. Technol. 23 (2012) 032001 Topical Review
(a) (b)
Figure 29. (a) Schematic of five beam, hybrid Doppler difference and reference beam 3D-LDV system after [115, 116]. (b) Cross-sectionthrough the hybrid probe. LD = laser diode, FPBC = fibre-pigtailed Bragg cell, VPPC = variable split ratio polarization-preservingcoupler, PM fibre = polarization maintaining fibre, BC = Bragg cell, IF = interference filter, APD = avalanche photodiode.
(a) (b)
Figure 30. Photographs of the hybrid Doppler difference and reference beam 3D-LDV probe [115, 116].
portion of the scattered light was coupled into a PM fibre bya bi-focal lens and mixed with the frequency shifted referencebeam giving the on-axis measurement. The remainder ofthe scattered light was coupled into a multimode fibre, theoutput of which was incident upon a diffraction grating whichwas used to de-multiplex the Doppler difference channels’wavelengths onto two avalanche photodiodes.
The matrix condition number can be used as a figure ofmerit to determine the performance of the transformation tothe orthogonal velocity components and a major advantage ofthe hybrid probe is that the condition number is consistentlyless than that of other configurations, particularly for higherprobe f-numbers [116].
4.7. LDV systems employing optical fibre amplifiers and fibrelasers
Optical fibre amplifiers have been used to improve the SNRin LDV systems [117–120], by either amplifying the laser
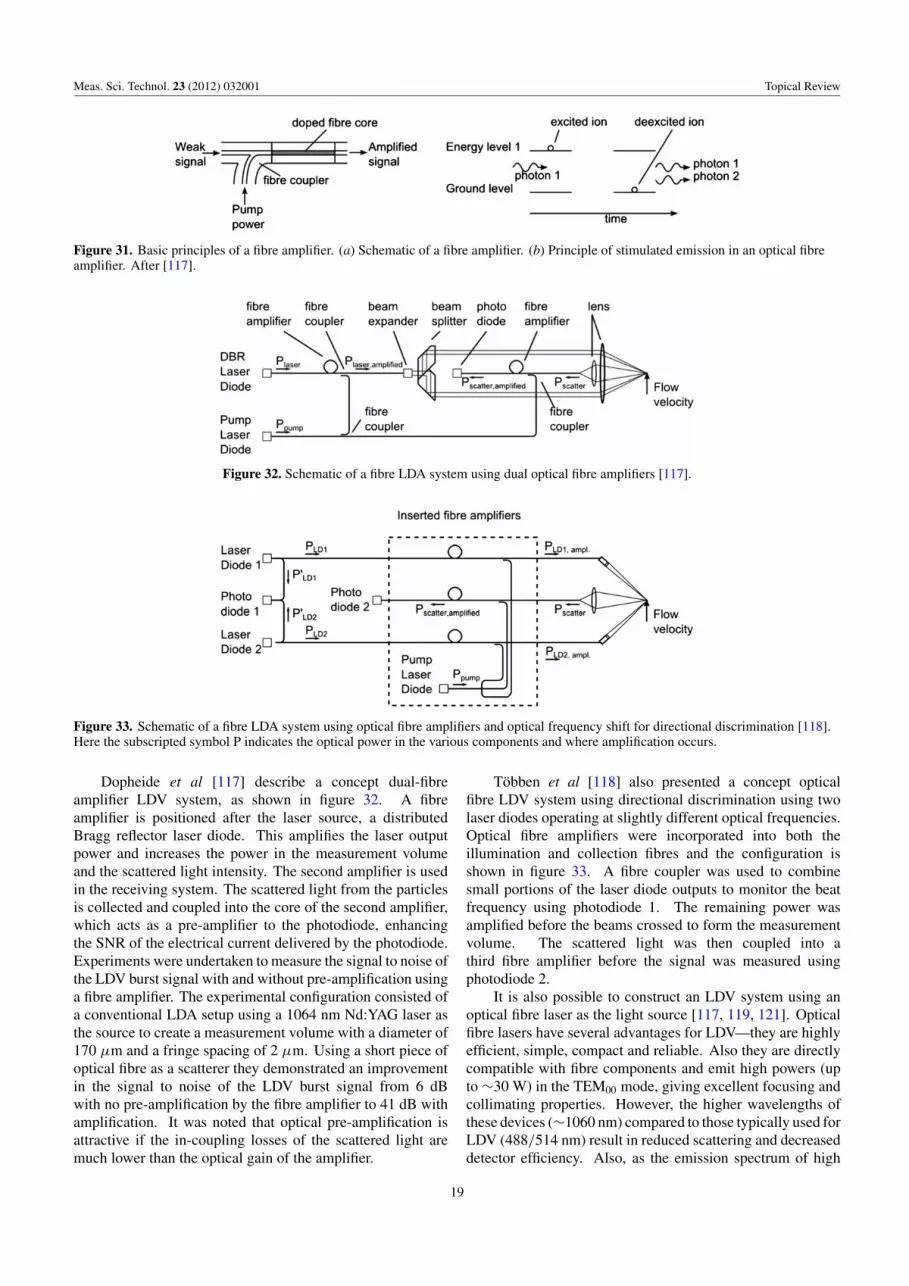
source, therefore increasing the power in the measurementvolume, or by amplifying the received light prior to detectionby a photodetector. Detailed descriptions of fibre amplifiertechnology can be found elsewhere [121]. The basic principleis shown in figure 31(a). The fibre amplifier consists of apump laser diode, a fibre coupler and a short length of fibrethat is doped with a rare earth ion such as neodymium. Thedoped fibre provides the active medium where the ions areexcited to higher energy levels via the pump light. Theamplification occurs via stimulated emission as illustratedin figure 31(b), with an incident photon depleting the upperenergy level of an excited ion, releasing a second photon withthe same frequency, phase and polarization. This then startsan avalanche process with further stimulated emission. Themost common fibre amplifiers are those doped with erbium,which amplifies light between 1520 and 1560 nm; there arealso amplifiers using neodymium and praseodymium dopingthat operate at around 1300 nm [121].
18
Meas. Sci. Technol. 23 (2012) 032001 Topical Review
Figure 31. Basic principles of a fibre amplifier. (a) Schematic of a fibre amplifier. (b) Principle of stimulated emission in an optical fibreamplifier. After [117].
Figure 32. Schematic of a fibre LDA system using dual optical fibre amplifiers [117].
Figure 33. Schematic of a fibre LDA system using optical fibre amplifiers and optical frequency shift for directional discrimination [118].Here the subscripted symbol P indicates the optical power in the various components and where amplification occurs.
Dopheide et al [117] describe a concept dual-fibreamplifier LDV system, as shown in figure 32. A fibreamplifier is positioned after the laser source, a distributedBragg reflector laser diode. This amplifies the laser outputpower and increases the power in the measurement volumeand the scattered light intensity. The second amplifier is usedin the receiving system. The scattered light from the particlesis collected and coupled into the core of the second amplifier,which acts as a pre-amplifier to the photodiode, enhancingthe SNR of the electrical current delivered by the photodiode.Experiments were undertaken to measure the signal to noise ofthe LDV burst signal with and without pre-amplification usinga fibre amplifier. The experimental configuration consisted ofa conventional LDA setup using a 1064 nm Nd:YAG laser asthe source to create a measurement volume with a diameter of170 μm and a fringe spacing of 2 μm. Using a short piece ofoptical fibre as a scatterer they demonstrated an improvementin the signal to noise of the LDV burst signal from 6 dBwith no pre-amplification by the fibre amplifier to 41 dB withamplification. It was noted that optical pre-amplification isattractive if the in-coupling losses of the scattered light aremuch lower than the optical gain of the amplifier.
Tobben et al [118] also presented a concept opticalfibre LDV system using directional discrimination using twolaser diodes operating at slightly different optical frequencies.Optical fibre amplifiers were incorporated into both theillumination and collection fibres and the configuration isshown in figure 33. A fibre coupler was used to combinesmall portions of the laser diode outputs to monitor the beatfrequency using photodiode 1. The remaining power wasamplified before the beams crossed to form the measurementvolume. The scattered light was then coupled into athird fibre amplifier before the signal was measured usingphotodiode 2.
It is also possible to construct an LDV system using anoptical fibre laser as the light source [117, 119, 121]. Opticalfibre lasers have several advantages for LDV—they are highlyefficient, simple, compact and reliable. Also they are directlycompatible with fibre components and emit high powers (upto ∼30 W) in the TEM00 mode, giving excellent focusing andcollimating properties. However, the higher wavelengths ofthese devices (∼1060 nm) compared to those typically used forLDV (488/514 nm) result in reduced scattering and decreaseddetector efficiency. Also, as the emission spectrum of high
19

Meas. Sci. Technol. 23 (2012) 032001 Topical Review
Figure 34. Schematic of the fibre Bragg grating Fabry–Perot (FBG-FP) velocimeter [32]. FBG = fibre Bragg grating, PM fibre =polarization maintaining fibre, SM fibre = single-mode fibre, PBS = polarizing beam splitter, PMT = photomultiplier tube.
power fibre lasers has a bandwidth of up to 10 nm, conventionalbeam splitters will produce measurement volume fringes withpoor visibility due to chromatic aberration [117]. Czarskeet al [119] proposed using a diffraction grating as a beamsplitter. The ±1 diffraction orders have the same opticalpath length such that the fringe patterns corresponding tothe different wavelengths in the output of the fibre laser willhave the same phase and superimpose coincidentally. Thiswas later extended to include directional discrimination [120]by including an AOM and combining the zero- and first-order output beams. Again different wavelengths will havethe same optical path length; however a frequency shift willhave been applied between the two beams enabling directionaldiscrimination.
5. All-fibre interferometric velocimeters
Several interferometric schemes for measuring the Dopplershift that use all-fibre configurations have been reported.These can be thought of as operating as frequency-to-intensitytransducers such that the Doppler shift, and hence flowvelocity, can be found directly from measurement of the signalintensity. Alternatively, interferometric processing schemescan be used to measure phase shifts, which can then be relatedto the velocity. The use of fibre interferometers allows longpath length imbalances that would otherwise be impractical,along with an ability to adjust the velocity sensitivity and rangeof the instrument.
5.1. FBG Fabry–Perot Doppler velocimeter
Chehura et al [32] reported a fibre-based LDV system usinga fibre Bragg grating Fabry–Perot (FBG-FP) interferometricfilter, shown in figure 34. An argon-ion laser was used
for illumination and light was both delivered and collectedfrom the probe head via Hi-Bi optical fibre deployed suchthat the state of polarization of the propagating beam waspreserved. A fibre coupler splits this light into two single-mode optical fibres. In one arm two FBGs, of approximately40% reflectivity and physically separated by 63 mm, werefabricated to produce a Fabry–Perot filter. If the illuminatinglaser wavelength is tuned to coincide with the slope of theFabry–Perot transmission filter function, then the Dopplershift of the scattered light can be determined from the changein transmitted intensity falling on the photomultiplier tube(PMTsig). A reference signal is required to normalize thesignal and this is derived from the output of the secondarm. As an alternative to tuning the laser wavelength, thetransfer function of the filter itself can be tuned by strainingthe fibre using the translation stages mounted either side ofthe FBGs. The system initially suffered from problems withthe stability of the interferometer, so both laser wavelength andinterferometric phase locking systems were implemented. Thelaser wavelength was stabilized using an iodine absorption lineand the interferometer phase was stabilized using a choppedreference beam derived from the laser output. To separatethis locking signal from the scattered flow signal, polarizationstate controllers were used to control the polarization of thetwo beams entering the FBG-FP and reference arm. Polarizingbeam splitters were then used to split the phase locking signaland reference on to two photomultiplier tubes (PMTlock,ref andPMTlock,sig) the signals from which were fed back onto oneof the translation stages to vary the filter transmission. Thesystem was characterized over a velocity range of ±42 m s−1
with a resolution of 0.2 m s−1 reported.
20
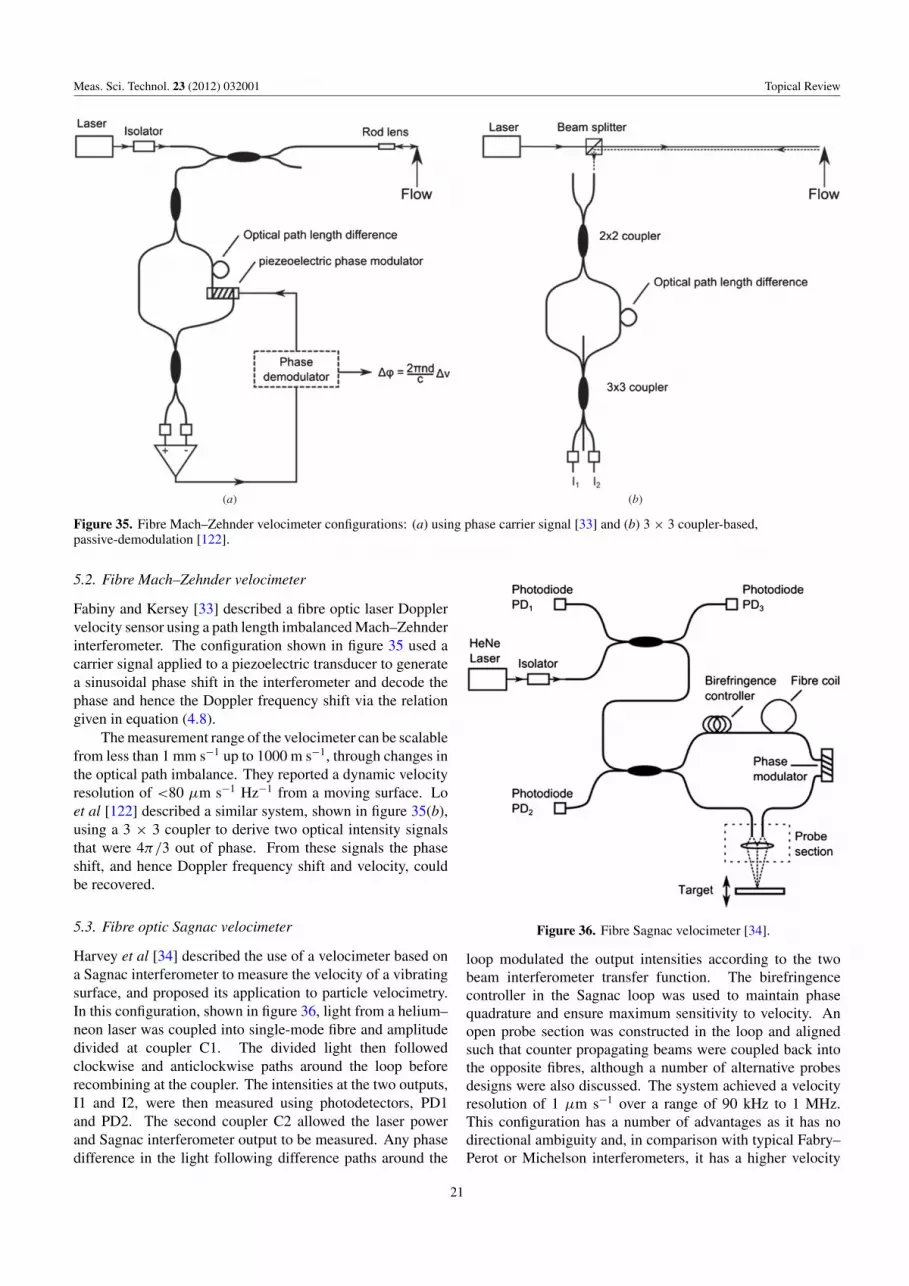
Meas. Sci. Technol. 23 (2012) 032001 Topical Review
(a) (b)
Figure 35. Fibre Mach–Zehnder velocimeter configurations: (a) using phase carrier signal [33] and (b) 3 × 3 coupler-based,passive-demodulation [122].
5.2. Fibre Mach–Zehnder velocimeter
Fabiny and Kersey [33] described a fibre optic laser Dopplervelocity sensor using a path length imbalanced Mach–Zehnderinterferometer. The configuration shown in figure 35 used acarrier signal applied to a piezoelectric transducer to generatea sinusoidal phase shift in the interferometer and decode thephase and hence the Doppler frequency shift via the relationgiven in equation (4.8).
The measurement range of the velocimeter can be scalablefrom less than 1 mm s−1 up to 1000 m s−1, through changes inthe optical path imbalance. They reported a dynamic velocityresolution of <80 μm s−1 Hz−1 from a moving surface. Loet al [122] described a similar system, shown in figure 35(b),using a 3 × 3 coupler to derive two optical intensity signalsthat were 4π/3 out of phase. From these signals the phaseshift, and hence Doppler frequency shift and velocity, couldbe recovered.
5.3. Fibre optic Sagnac velocimeter
Harvey et al [34] described the use of a velocimeter based ona Sagnac interferometer to measure the velocity of a vibratingsurface, and proposed its application to particle velocimetry.In this configuration, shown in figure 36, light from a helium–neon laser was coupled into single-mode fibre and amplitudedivided at coupler C1. The divided light then followedclockwise and anticlockwise paths around the loop beforerecombining at the coupler. The intensities at the two outputs,I1 and I2, were then measured using photodetectors, PD1and PD2. The second coupler C2 allowed the laser powerand Sagnac interferometer output to be measured. Any phasedifference in the light following difference paths around the
Figure 36. Fibre Sagnac velocimeter [34].
loop modulated the output intensities according to the twobeam interferometer transfer function. The birefringencecontroller in the Sagnac loop was used to maintain phasequadrature and ensure maximum sensitivity to velocity. Anopen probe section was constructed in the loop and alignedsuch that counter propagating beams were coupled back intothe opposite fibres, although a number of alternative probesdesigns were also discussed. The system achieved a velocityresolution of 1 μm s−1 over a range of 90 kHz to 1 MHz.This configuration has a number of advantages as it has nodirectional ambiguity and, in comparison with typical Fabry–Perot or Michelson interferometers, it has a higher velocity
21

Meas. Sci. Technol. 23 (2012) 032001 Topical Review
Figure 37. Operating principle of PDV. Here ν0 is the incident laserfrequency, ν1 is the optical frequency of the Doppler shiftedscattered light, T0 and T1 are the filter transmissions at thesefrequencies.
resolution and does not require a narrow linewidth source.Tselikov and Blake [123] also report an optical fibre Sagnacinterferometric flow meter using Fresnel drag, and PhotonControl Inc. have recently (2008) filed a patent [124] for afibre-based optical flow meter using a Sagnac interferometerfor measuring fluid flow through a pipe, although it is unclearif this is currently a commercial product.
6. Filter-based Doppler velocimetry/PDV
Filter-based velocimetry techniques determine the flowvelocity via measurement of the Doppler frequency shiftimposed on the scattered light, by converting this frequencyshift into an intensity variation. The filter used canbe interferometric [125–127] or an atomic or molecularabsorption filter [24, 35, 128, 129]. Although some workhas been done using focused beams for illumination andmaking single point measurements [130], the main advantageof using an optical filter over other methods is the abilityto measure multiple points simultaneously. This can beachieved by illuminating the flow with a light sheet andimaging the filtered light onto an array detector such as a CCDcamera. Techniques employing this approach are commonlytermed PDV [24, 35, 125], or Doppler global velocimetry(DGV) [127–129].
The general operating principle is shown in figure 37. Thelaser frequency is usually required to lie on a point midwayup one side of the filter’s transfer function (figure 37, pointT0). This can be achieved by either tuning the laser source oradjusting the filter itself. Light scattered from the flow willhave been Doppler shifted and hence, depending upon the signof the Doppler shift, the power transmitted by the filter willeither increase or decrease (figure 37, point T1). Directionaldiscrimination is thus inherent to this approach. A secondunfiltered reference image is usually required to account forscattering variations due to regions of low or high seeding andis used to normalize the signal.
Heterodyne Doppler velocimeters, such as reference beamand Doppler difference LDV, are limited in velocity range bythe large frequency shifts associated with higher velocitiesand these approaches are also generally limited to single point
measurements. In comparison, filter-based techniques, suchas PDV, are generally better suited to higher velocities as itis the gradient of the transfer function which dictates boththe velocity range and resolution. As with other Dopplertechniques, three velocity components must be measuredto provide a 3D flow velocity measurement via a matrixtransformation similar to that used in 3D LDV. In PDV this canbe achieved using multiple light sheets and a single cameraas in the system by Roehle and Willert [128], shown infigure 38(a), or alternatively using multiple views of a singlelight sheet.
Optical fibres are used in PDV systems to provide flexibleillumination beam delivery. Multimode fibres are often usedto deliver the output of CW lasers to light sheet forming optics[24, 128]. In the 3D-PDV configuration shown in figure 38(a),the output from an argon-ion laser was switched between threemultimode fibres using an optomechanical switch. Thesedelivered the light sequentially to each of the three light sheetgenerators. The detector head imaged the flow at 90◦ to thesheet and recorded images under each illumination condition.In this way the three time-averaged velocity components canbe acquired sequentially and the 3D velocity at each pixelrecovered.
A further use of optical fibres in PDV is the use ofimaging fibre bundles to port images from the flow to thedetector head. Imaging fibre bundles can be used to provideflexible imaging, as reported by Willert et al [129], who useda fibre-bundle endoscope to make PDV measurements in anengine exhaust flow. A more significant advantage of thisapproach was proposed by Nobes et al [24] who used imagingfibre bundles to enable multiple velocity components to bemeasured simultaneously using only a single illumination lightsheet and single detector head. This configuration is shownin figure 38(b). An imaging fibre bundle consisting of fourchannels joined at the detector head end and separate at theother (shown in figure 39) was used to port multiple views ofa single light sheet to the detector head. Three of the fibre-bundle channels were used to image the light sheet to measurethe flow velocity and the fourth arm was used to measurethe optical frequency of each laser pulse. The fourth armcould be used to provide an additional measurement channel toprovide redundant data in the matrix transformation and henceimprove the uncertainty in the calculated 3D velocity [131]. Aphotograph of the four-channel imaging fibre bundle is shownin figure 39. This is a wound-type imaging fibre bundle witheach channel consisting of 500 × 600 fibres constructed bystacking 50 μm ‘multi-fibre’ blocks, as shown in figure 40,consisting of 5 × 5 arrays of fibres with 8 μm cores at 10 μmcentres [23]. Figure 41(a) shows four views of a rotatingdisc recorded using the bundles in a single camera image;the multi-fibre block structure can be seen in the expandedregion shown in figure 41(b). Here an imaging Mach–Zehnderinterferometer was used as the filter [125] and the intensityfringe pattern of the interferometer is visible across the imageand the dark spots are due to broken fibres in the array.
Without the use of optical fibres, 3D-PDV measurementswould be restrictively complex, requiring either multipledetector heads (each with two cameras and a gas cell)
22

Meas. Sci. Technol. 23 (2012) 032001 Topical Review
(a) (b)
Figure 38. 3D-PDV configurations (a) using multiple light sheets, (b) using multiple observation directions and imaging fibrebundles [24, 128].
Figure 39. Photograph showing the imaging fibre bundles used in [24]. (Left) The entry faces of the four-channel bundle without imaginglenses and (right) the combined exit face of the four channels.
or bulk optics to deliver multiple light sheets. Similarlythe addition of a fourth measurement channel to reducemeasurement uncertainty would also be expensive andcomplex to implement.
The imaging fibre bundle approach has since been adoptedby several of the groups involved in PDV instrumentation andmeasurements [36, 132] and has been used in the EuropeanTransonic Windtunnel at Koln, Germany [36]. Examplesof the use of imaging fibre bundles in Doppler velocimetrysystems are shown in figure 42, here the flexibility thatthey allow is demonstrated; in figure 42(a) the imaging
fibre bundles are used together with borescopes to enableinternal measurements within a gas turbine compressor and infigure 42(b) fibre-bundled coupled lenses are embedded in thewalls of a windtunnel.
7. Laser transit anemometry/L2F velocimetry
The laser transit anemometer (LTA) or L2F anemometer[38–40] relies on the timing of the passage of a seeding particlebetween two tightly focused beams in the flow region. Thebeam diameters are typically around 10 μm with a spacing of
23

Meas. Sci. Technol. 23 (2012) 032001 Topical Review
Figure 40. The structure of one multi-fibre section of thebundle [23].
0.5 mm between beams. As a particle crosses the beams twopulses of light are recorded by the detector and the velocitycan be calculated from the known separation of the beams andthe time interval between the pulses.
The sequential pulses will be obtained only if the planecontaining the two beams is aligned with the flow direction.Thus to determine the flow angle the LTA system has to berotated until sequential pulses are obtained. Using this method,the flow angle can be determined with a resolution of ±0.5◦
[41]. In turbulent flows, different particles passing throughthe beams may cause incorrect sequential pulses; althoughin general the separation of such pulses will be randomlydistributed and the peak in the distribution will correspond tothe real measurement [41].
As the particles can cross beams in either order dependingupon the direction of the flow, knowledge of the order inwhich the beams are crossed is required if the flow directionis to be found. This can be achieved by detecting the lightfrom each beam separately using illumination beams with
(b)(a)
Figure 41. Example image captured using the multi-branch imaging fibre bundles and Mach–Zehnder imaging interferometer [125].
different polarizations or wavelengths together with polarizersor wavelength filters placed in front of the detectors.
LTA has several favourable attributes; as it does notrely upon heterodyning, there are no temporal coherencerequirements for the source, allowing the use of high power,multi-longitudinal mode laser diodes. The use of tightlyfocused beams allows signals to be obtained from smallseeding particles, which follow high speed flows morefaithfully. Finally the short measurement volume allowsmeasurements to be made near surfaces, where the lightscattered from the solid surface would introduce significantsignal to noise problems for LDV configurations [39].
7.1. Fibre optic implementations
LTA requires the use of highly focused beams with well defined(typically Gaussian) and stable intensity distributions to formthe measurement volume. This would be satisfied by theuse of single-mode fibres for beam delivery. Polarizationpreservation is not necessarily required, unless polarizationdiscrimination of the received light is being employed togive directional information. Receiving fibres however canbe multimode since it is only intensity information that isrequired.
Figure 43 shows an example of a fibre optic laser transitanemometer [38]. The output from the laser source is coupledinto two single-mode PM fibres. The distal ends are positionedside by side in the probe head and rotated to align theireigenaxes. The optical system produces a measurementvolume consisting of two parallel beams with focused beamwaists of 14 μm, separated by 320 μm. Scattered light is thencollected via the same lens and coupled into two 50 μm coremultimode fibres and guided to detectors. The configurationallows the use of polarization or wavelength discrimination bythe inclusion of appropriate optics and sources.
A 2D fibre optic laser transit anemometer was developedby Schodl and Foster [40] and commercialized by PolytechGmbH using a set of parallel beams with differing spacing.Any two beams can be selected to provide the start and stopsignals for the LTA measurement and this use of variable beam
24

Meas. Sci. Technol. 23 (2012) 032001 Topical Review
(a)
(b)
Figure 42. Applications of imaging fibre bundles in Dopplervelocimetry. (a) Imaging fibre bundles coupled to borescopes formeasurements within a gas turbine compressor. (b) Photograph ofthe 2.4 m wide European Transonic windtunnel test section with thetop wall removed. The fibre bundled coupled lenses are embeddedin the walls (views 1 and 3 visible) and the highlighted rectanglegives the approximate position of the imaged area [36].
separation allows measurements to be made in highly turbulentflows [40]. The system is then rotated in the flow to adjust thebeams’ plane to be parallel to the flow direction and allow 2Dmeasurements.
In this system shown in figure 44, multiple wavelengthswere used to both generate and select the beams required. Theoutput from a multi-line argon-ion laser was launched into asingle-mode fibre for delivery to the probe head, the output ofwhich was then collimated and separated into different coloursusing a dispersing prism. The five beams were then focusedto produce a set of parallel beam with differing spacing inthe measurement volume. Backscattered light was collimatedand passed back through the prism to recombine the coloursbefore being launched into multimode fibre for delivery to thedetector unit, figure 44(b). Here the beam was again split
Figure 43. A fibre optic laser transmit anemometer [38].
into constituent colours using a second dispersing prism andlaunched into a set of optical fibres which guided the light toa switching unit that allowed the start and stop colours to beselected.
A 3D version is also described [40], also commercializedby Polytec, which uses an axial displacement of the beam waistto introduce sensitivity to the on-axis velocity component.This is illustrated in figure 45, where the shaded regions withinthe beams indicate the region within which particles can bedetected. When the velocity contains a component that isaligned with the optical axis of the probe head, the effectivelength of the probe volume, and hence the measurement rate(I), will vary. The system with a positive axial displacementbetween the start and stop beam waists, shown in figure 45(a),will be most sensitive if the flow is at angle γ A; likewise thesystem with a negative axial displacement, figure 45(b), willbe most sensitive if the flow angle is β = γ B (= −γ A). Infigure 45(c) the measurement rate is shown as a function ofthe flow angle for both positive and negative displacementsystems. By making measurements with both displacementsand normalizing using the difference of measurement rates (IAand IB) over the sum, the flow angle can be found as long as theflow angle β does not exceed ±45◦. This system is typicallycapable of measuring velocities in the range 0–3000 m s−1 forflow turbulences of up to 30% [133].
This can be achieved using the chromatic aberrationof the focusing lens to produce an axial displacement ofthe beam waists of the different coloured beams and byrotating the probe 180◦, between measuring IA and IB .Alternatively, the measurements can be made simultaneouslyusing chromatic aberration of the focusing lens and acombination of wavelength and polarization discrimination,as shown in figure 46. Here the combined blue and greenlines of an argon-ion laser are split into two orthogonal
25

Meas. Sci. Technol. 23 (2012) 032001 Topical Review
(a) (b)
Figure 44. 2D laser transit anemometer using multiple wavelengths [40]: (a) the probe multi-wavelength probe head, (b) the colourseparation and detector unit.
(a)
(b)
(c)
Figure 45. Operating principle of 3D laser transit anemometer asdescribed in [40]. (a), (b) Probe volume configurations with positiveand negative displacement. (c) Measurement rate versus flow anglefor these configurations.
polarized beams using a Wollaston prism, producing thebeam focus configuration shown in the inset by virtue ofthe chromatic aberration. A second Wollaston prism is used
to separate the scattered light from the two beams which isthen launched into two multimode fibres and delivered to twocolour separation and detector units, similar to those shown infigure 44(b).
7.2. Other time-of-flight probes
A combined L2F and molecular filter-based instrument wasreported by Roehle et al [134]. This configuration, shown infigure 47, used a L2F probe to measure the two componentsof the flow vector in the plane normal to the optical axis andthe Doppler shift from scattered light to determine the axialcomponent. Light from an argon-ion laser was coupled intosingle-mode fibre and delivered to the probe head, where it wascollimated and split into three beams by a colour dispersingprism. Backscattered light was collected, recombined by theprism and coupled into a multimode fibre for delivery to acolour separation and detection unit similar to that shown infigure 44(b). The 488 and 496 nm signals were used for theL2F start/stop beams while the 514 nm light was coupled intomultimode fibre and carried to the Doppler analysing unit.Half of the light pulse scattered from the particle was passedthrough an iodine cell, which was used as a frequency-to-intensity filter as described in section 6. The other half wassent through a long multimode fibre that acted as an opticaldelay line and provided a reference. Both pulses were thendetected using a single photodetector and the Doppler shiftand hence axial velocity could then be found from the ratioof light transmitted through the iodine cell to the referencesignal provided by the optical delay line. This techniquehas the advantage of reduced optical access requirements[134], needing only around 11◦ solid angle of accesscompared to around 20–25◦ for the 3D-L2F system describedin [40].
Louge et al [135] describe an optical fibre time-of-flightprobe designed to undertake measurements in dense gas–solidsuspensions such as fluidized beds and pneumatic transport.
26

Meas. Sci. Technol. 23 (2012) 032001 Topical Review
Figure 46. 3D laser transit anemometer using combination wavelength and polarization discrimination [40].
Figure 47. 3D combined L2F and molecular filter-based velocimeter [134].
In these applications, optical techniques are restricted tomeasurement depths of only a few particle diameters dueto light attenuation; hence the application of an optical fibreprobe allowed the disruption caused by probe intrusion to beminimized. In this work they combined the measurementof tracer particle phosphorescence with a specially designedprobe consisting of a central illumination fibre and surroundingdetection fibres, each of which formed a measurement channel.As a specially coated particle crosses the illumination beam itwill be excited, the phosphorescence glow will then persist fora short time afterwards (typically ∼2 ms), long enough to bedetected as it passes in front of one of the surrounding detectionfibres (step index, 200 μm core diameter) that are located1.5 mm away from the probe’s centre line. The particle’sspeed can then be found from the time delay of the detectedsignal and the direction ascertained from the receivingfibre/measurement channel. This probe was demonstratedin the velocity range of 0.4–1.6 m s−1.
8. Particle imaging velocimetry
PIV [42] is a time-of-flight technique that measures particledisplacement between sequential pulses of an illuminatinglight sheet and may be considered to be the planar analogueof LTA. Sequential images of particles entrained withinthe flow are captured for each pulse of the source andare compared using a variety of techniques to determine thedistance moved by each particle. Using this information, alongwith knowledge of the time elapsed between images, it ispossible to calculate the velocity.
The uses of optical fibres for PIV are limited mainly tothe delivery and formation of the illuminating light sheet. Forlow speed flows, such as liquid flows (<1 m s−1), typicalinter-pulse times can be of the order ∼10 ms [42] and a CWlaser can be used as a source and pulsed using a Bragg cellor Pockels cell. In this case single-mode optical fibre can beused to deliver the illumination. However for higher speedflows, such as transonic flows (∼500 m s−1) faster inter-
27

Meas. Sci. Technol. 23 (2012) 032001 Topical Review
(a) (b)
Figure 48. Fibre delivery system for high power pulsed lasers (a) using a circular fibre bundle consisting of 19 fibres, each with a corediameter of 200 μm, and a top-hat light intensity distribution for launching [22], and (b) using a custom diffractive optical element to matchthe intensity distribution to a linear fibre array [136].
pulse times of the order of μs are needed [42] requiring theuse of pulsed lasers such as frequency-doubled Nd:YAG toachieve sufficient optical power in the measurement volume.These lasers have higher instantaneous power levels whichcan damage optical fibre. Anderson et al [19] investigatedthe use of fibre optic beam delivery for such a system andrecommend suitable large-core all-silica multimode fibres withcore diameters of 400, 600 and 1000 μm for pulse energiesof 7, 9 and 14 mJ respectively. They also suggested thatthe speckle induced intensity fluctuations that are present inthe output intensity distribution can be reduced by using theinter-modal dispersion of the fibre either using longer lengthsof fibre (∼30 m) or shorter lengths and larger fibre launchnumerical apertures (∼7 m, 26 mrad).
Hand et al [22] report a fibre beam delivery and light sheetformation system using the arrangement of fibres shown infigure 48(a). Light from the laser was coupled into a fibrebundle consisting of 19 fibres, each with a core diameterof 200 μm. At the input end, the fibres are configured toform a circular cross-section, whilst at the output they arearranged linearly to form the light sheet without the need foradditional optics. In this work they use a diffractive opticalelement to condition the beam before the light is coupled intothe fibre and to reduce the possibility of beam self-focusingeffects that lead to fibre damage. This system was found to becapable of delivering pulses of more than 20 mJ at 532 nm,although the resulting sheet quality was not as good as thatof a conventional light sheet. Later work by the same group[136] used a diffractive optical element to divide the beam intomultiple distinct spots, each of which could be coupled intoone of the fibres within a linear array, as shown in figure 48(b).This increased the launch efficiency over the circular bundlearrangement in [22], which used a large top-hat distribution toilluminate all of the fibres and where light falling on the gapsbetween the fibre cores will be lost. Hollow core fibres havealso been applied to PIV beam delivery [136]. The fibres weredemonstrated for 13 mJ, 8 ns pulses from a frequency-doubled(532 nm) Nd:YAG laser, and showed light sheet quality similarto that obtained with conventional bulk optic beam delivery.
There has also been some recent work on the use ofimaging fibre bundles in PIV. Tani et al [25, 137] reportthe development of a ‘fibre scope’ PIV system using a
hexagonally packed bundle with 30 000 fibres. Howevertheir use presents several problems that limit the accuracyobtainable. Due to the use of image correlation methods inPIV to determine the displacement, the orderly structure ofthe fibre bundle itself will contribute to the correlation. Itwas found that this strongly dominated the signal producedby the particles. The fibre cladding introduced field-of-view obstructions that resulted in incorrect correspondencebetween particle images and erroneous velocity vectors whenusing particle tracking algorithms, and the error in sub-pixelinterpolation of the particle positions increased due to thelimited spatial resolution imposed by the diameter of the fibres.The last two effects could be overcome by applying a streak-searching methodology to the particle tracking algorithm [25].
9. Conclusions
The uses of optical fibre technology in laser velocimetry arediverse and often critical to the successful implementationof laser velocimetry in the often harsh measurementenvironments. The use of fibres for beam delivery andscattered light collection enables measurements to be madein environments that would otherwise not be possible dueto limited optical access or environmental conditions suchas vibration, temperature and pressure. This is especiallytrue for point measurement techniques such as LDV andLTA where, without optical fibres, the instrumentation wouldrequire complex arrangements of optics to deliver and collectlight, introducing all the associated difficulties with alignment,ease of use and flexibility. In particular multi-point or multi-component measurements would be prohibitively complex.PDV measurements would also be impractical for manysituations without the use of optical fibres. Three-componentmeasurements using multiple light sheets are made easierand more flexible with the use of multimode fibres for beamdelivery. PDV measurement configurations using multipleviews of a single light sheet would require multiple imagingdetector heads, each consisting of two cameras, an iodine celland associated controllers. This is prohibitively expensive andcomplex, especially in the positioning of the detector headsat appropriate angles. However the introduction of imaging
28

Meas. Sci. Technol. 23 (2012) 032001 Topical Review
fibre bundles [24] has lowered the cost and complexity—only a single detector head is required—and enabled moreflexibility and optimization in the viewing configurations used[131]. The use of optical fibre for beam delivery also has thepotential to allow for more flexible PIV systems. Althoughfibre delivery has not been widely adopted for PIV, due, in themain, to the power handling limitations of the conventionalfibres and high peak powers of the lasers typically used, it maywell allow successful application of the technique in difficultcircumstances.
Fibres also allow the miniaturization of instrumentation,for example LDV, as both the optical signal processingand probe sections can be reduced in size, extending theapplicability of LDV. Indeed, LDV probes consisting of asingle fibre have been demonstrated [62]. As part of thistrend many conventional components used in the LDV systemcan be replaced with optical fibre components, reducing thecomplexity of the system and easing alignment requirements.Fibre components have not been widely exploited in LDV butwhich could find more widespread use include the fibre laser,frequency shifters and amplifiers.
The fibres themselves also enable optical processing suchas pseudo-heterodyning [96] or TDM [113] for multi-point ormulti-component measurements where the fibres allow opticaldelays that would be impractical in bulk optics to be easilyintroduced.
Acknowledgments
This work was partially supported by a grant fromthe Engineering and Physical Sciences Research Council(EPSRC), UK. The authors would like to thank Dr Helen Fordfor the images of the fibre imaging bundles.
References
[1] Colladon D 1842 On the reflections of a ray of light inside aparabolic liquid stream Comptes Rendus 15 800–2
[2] Kao K C and Hockman G A 1966 Dielectric fiber surfacewaveguides for optical frequencies IEE Proc.,Optoelectron. 133 1151–8
[3] 2009 The Nobel Prize in Physics 2009 Nobelprize.orghttp://nobelprize.org/nobel_prizes/physics/laureates/2009/index.html
[4] Keck D B and Schultz P C 1973 US Patent 3711262[5] Grattan K T V and Meggitt B T 1998 Optical Fiber Sensor
Technology: Vol. 2. Devices and Technology (London:Chapman and Hall)
[6] Lee B 2003 Review of the present status of optical fibersensors Opt. Fiber Technol. 9 57–79
[7] James S W and Tatam R P 2003 Optical fibre long periodgrating sensors: characteristics and application Meas. Sci.Technol. 14 R49–61
[8] Tropea C 1995 Laser Doppler anemometry: recentdevelopments and future challenges Meas. Sci. Technol.6 605–19
[9] Coupland J M 2000 Laser Doppler and pulsed laservelocimetry in fluid mechanics Top. Appl. Phys. 77 373–412
[10] Ulrich R, Rashleigh S C and Eickhoff W 1980 Bendinginduced birefringence in single-mode fibre Opt. Lett. 5 173
[11] Mendez A and Morse T F 2007 Specialty Optical FibersHandbook (New York: Academic) ISBN-10: 012369406X
[12] Knight J C 2003 Photonic crystal fibres Nature 424 847–51[13] Payne D N and Gambling W A 1972 New low-loss
liquid-core fibre waveguide Electron. Lett. 8 374–6[14] Poyntz-Wright L J, Fermann M E and Russell P S J 1988
Non-linear transmission and colour centre dynamics ingemanosilicate fibre at 420–540 nm Opt. Lett.13 1023–5
[15] Fujikure Europe Ltd 2011 website, accessed Marchhttp://www.fujikura.co.uk/fibre_optics/index.html
[16] Smith R G 1972 Optical power handling capacity of low lossoptical fibres as determined by stimulated Raman andBrillouin scattering Appl. Opt. 11 2489–94
[17] Duffy C J and Tatam R P 1993 An optical frequency shifterbased on stimulated Brillouin scattering in birefringentoptical fiber Appl. Opt. 32 5966–72
[18] Allison S W, Gillies G T, Magnuson D W and Pagano T S1985 Pulsed laser damage to optical fibers Appl. Opt.24 3140–5
[19] Anderson D J, Morgan R D, McCluskey D R, Jones J D C,Easson W J and Greated C A 1995 An optical fibredelivery system for pulsed laser particle imagevelocimetry Meas. Sci. Technol. 6 809–14
[20] Matsuura Y, Hanamoto K, Sato S and Miyagi M 1998Hollow-fiber delivery of high-power pulsed Nd:YAG laserlight Opt. Lett. 23 1858–60
[21] Matsuura Y, Tsuchiuchi A, Noguchi H and Miyagi M 2007Hollow fiber optics with improved durability forhigh-peak-power pulses of Q-switched Nd:YAG lasersAppl. Opt. 46 1279–82
[22] Hand D P, Entwistle J D, Maier R R J, Kuhn A, Greated C Aand Jones J D C 1999 Fibre optic beam delivery system forhigh peak power laser PIV illumination Meas. Sci.Technol. 10 239–45
[23] Schott A G 2011 website, accessed http://www.schott.com[24] Nobes D S, Ford H D and Tatam R P 2004 Instantaneous,
three-component planar Doppler velocimetry usingimaging fibre bundles Exp. Fluids 36 3–10
[25] Tani N, Kondo H, Mori M, Hishida K and Maeda M 2002Development of fiberscope PIV system by controllingdiode laser illumination Exp. Fluids 33 752–8
[26] Ford H D and Tatam R P 2011 Characterisation of opticalfibre imaging bundles for swept-source OCT Appl. Opt.50 627–40
[27] Fujikure Europe Ltd 2011 website, accessed Mayhttp://www.fujikura.co.uk/fibre_optics/products/speciality_fibre/image_fibre.html
[28] Yeh Y and Cummings H Z 1964 Localised fluid flowmeasurements with a He–Ne spectrometer Appl. Phys.Lett. 4 176–8
[29] Penny C M 1969 Differential Doppler velocity measurementsIEEE J. Quantum Electron. 5 318
[30] Vom-Stein H D and Pfeifer H J 1969 A Doppler differencemethod for velocity measurements Metrologia 5 59–61
[31] Hanson S 1973 Broadening of the measured frequencyspectrum in a differential laser anemometer due tointerference plane gradients J. Phys. D: Appl. Phys.6 164–71
[32] Chehura E, Ye C-C and Tatam R P 2003 In-line laser Dopplervelocimeter using fibre-optic Bragg grating interferometricfilters Meas. Sci. Technol. 14 724–73
[33] Fabiny L and Kersey A D 1997 Interferometric fiber-opticDoppler velocimeter with high-dynamic range IEEEPhotonics Technol. Lett. 9 1
[34] Harvey D, McBride R, Barton J S and Jones J D C 1992 Avelocimeter based on the fibre optic Sagnac interferometerMeas. Sci. Technol. 3 1077
[35] Elliott G S and Beutner T J 1999 Molecular filter basedplanar Doppler velocimetry Prog. Aerosp. Sci.35 799–845
29

Meas. Sci. Technol. 23 (2012) 032001 Topical Review
[36] Willert C, Stockhausen G, Beversdorff M, Klinner J,Lempereur C, Barricau P, Quest J and Jansen U 2005Application of Doppler global velocimetry in cryogenicwind tunnels Exp. Fluids 39 420–43
[37] Jackson D A and Paul D M 1970 Measurement of hypersonicvelocities and turbulence by direct spectral analysis ofDoppler shifted laser light Phys. Lett. A 32 77–8
[38] Thompson D H 1968 A tracer particle fluid velocity meterincorporating a laser J. Phys. E: Sci. Instrum. 1 929–32
[39] Pannell C N, Midgley J H, Jones J D C and Jackson D A1988 Fibre-optic transit velocimetry using laser diodesources Electron. Lett. 24 525–6
[40] Schodl R and Foster W 1989 A new multicolour laser twofocus velocimeter for 3-dimensional flow analysis Int.Congress on Instrumentation in Aerospace SimulationFacilities, ICIASF’89 pp 142–51
[41] Kost F and Kapteij C 1997 Application of laser-two-focusvelocimetry to transonic turbine flows 7th Int. Conf. onLaser Anemometry–Advances and Applications(University of Karlsruhe, Germany, 8–11 September 1997)
[42] Raffel M, Willert C E, Wereley S T and Kompenhans J 2007Particle Image Velocimetry: a Practical Guide (Berlin:Springer) ISBN: 978-3-540-72307-3
[43] Elsinga G E, Wieneke B, Scarano F and Schroder A 2008Tomographic 3D-PIV and applications in particle imagevelocimetry Top. Appl. Phys. 112 103–25
[44] Huffacker R M 1970 Doppler detection system for gasvelocity measurements Appl. Opt. 9 1026–8
[45] Drain L E 1980 The Laser Doppler Technique (Chichester:Wiley) ISBN: 0471276278
[46] Tanaka T and Benedek G B 1975 Measurement of thevelocity of blood flow (in-vivo) using a fibre optic catheterand optical mixing spectroscopy Appl. Opt. 14 189–96
[47] Dyot R B 1978 Fibre optic Doppler anemometer Microw.Opt. Acoust. 2 13–8
[48] Meggitt B T, Boyle W J O, Grattan K T V, Palmer A Wand Ning Y N 1990 Fibre optic anemometry using anoptical delay cavity technique Proc. SPIE 1314 321–9
[49] Kyuma K, Tai S, Hamanaka K and Nunoshita M 1981 LaserDoppler velocimeter with a novel optical fibre probe Appl.Opt. 20 2424–7
[50] Nishihara H, Matsumoto K and Koyama J 1984 Use of a laserdiode and an optical fibre for a compact laser Dopplervelocimeter Opt. Lett. 9 62–4
[51] Nishihara H, Koyama J, Hoki N, Kajiya F, Muramoto Tand Hironaga K 1984 Optical fibre laser Dopplervelocimeter for pulsatile blood flows Laser Anemometry inFluid Mechanics ed R J Adrain, D F G Durao, F Durst,H Mishina and J H Whitelaw (Lisbon: Loadan) pp 335–45
[52] James S W, Lockey R A, Egan D and Tatam R P 1995 Fibreoptic based reference beam laser Doppler velocimeter Opt.Commun. 119 460–4
[53] Egan D A, James S W and Tatam R P 1997 A polarisationbased optical fibre vibrometer Meas. Sci. Technol. 8 343
[54] Toda H, Haruna M and Nishihara H 1987 Optical Integratedcircuit for a fiber laser Doppler velocimeter J. LightwaveTechnol. 5 901–5
[55] Pradel T, Rasch A, Rothhardt M, Tropea C, Varro Wand Weber H 1993 Use of integrated optical devices inlaser Doppler anemometry Proc. Sensor 93 Congress(Nurnberg, 12–14 October 1993)
[56] Byrne G D, James S W and Tatam R P 2001 A Bragg gratingbased fibre optic reference beam laser Doppleranemometer Meas. Sci. Technol. 12 909–13
[57] Pannell C N, Jones J D C and Jackson D A 1994 The effect ofenvironmental acoustic noise on optical-fibre basedvelocity and vibration sensors Meas. Sci. Technol. 5 412–7
[58] Knuhtsen J, Olldag E and Buchave P 1982 Fibre optic laserDoppler anemometer with Bragg frequency shift utilising
polarisation based single mode fibre J. Phys. E: Sci.Instrum. 15 1888–91
[59] Jackson D A, Jones J D C and Chan R K Y 1984 A highpower fibre optic laser Doppler velocimeter J. Phys. E:Sci. Instrum. 17 977–80
[60] Czarske J 2001 A miniaturized dual-fibre laser Dopplersensor Meas. Sci. Technol. 12 1191–8
[61] Sasaki O, Sato T, Abe T, Miuguchi T and Niwayama M 1980Follow up-type laser Doppler velocimeter usingsingle-mode optical fibres Appl. Opt. 19 1306–8
[62] Khotiaintsev S N, Svirid V and Glebova L 1996 LaserDoppler velocimeter miniature differential probe forbiomedical applications Proc. SPIE 2928 158
[63] MacPherson W N, Jones D C, Mangan B J, Knight J Cand Russell P S J 2003 Two-core photonic crystal fibre forDoppler difference velocimetry Opt. Commun.223 375–80
[64] Buttner L and Czarske J 2001 A multimode-fibrelaser-Doppler anemometer for highly spatially resolvedvelocity measurements using low-coherence light Meas.Sci. Technol. 12 1891
[65] Buttner L and Czarske J 2002 Multimode fibre laser Doppleranemometer with directional discrimination and highspatial resolution for the investigation of turbulentboundary layer 11th Int. Symp. on Appl. of LaserTechniques to Fluid Mechanics (Lisbon, Portugal, 8–11July 2002) paper_21_3
[66] Tatam R P 1995 Optical fiber modulation techniques forsingle mode fiber sensors Optical Fiber SensorTechnology: Fundamentals ed K T V Grattan andB T Meggitt (London: Chapman and Hall) pp 223–67
[67] Risk W P, Youngquist R C, Kino G S and Shaw H J 1984Acousto-optic frequency shifter for single-mode fibresOpt. Lett. 9 309–11
[68] Pannell C N, Tatam R P, Jones J D C and Jackson D A 1988A fibre optic frequency shifter utilising travelling flexurewaves in birefringent fibres J. Inst. Electron. Radio Eng.S8 S92–8
[69] Kim B Y, Blake J N, Engan H E and Shaw H J 1986 All-fiberacousto-optic frequency shifter Opt. Lett. 11 389–91
[70] Birks T A, Farrell S G, Russell P S J and Pannell C N 1994Four-port fiber frequency shifter with a null taper couplerOpt. Lett. 19 1964–6
[71] Sabert H, Dong L and Russell P S J 1992 Versatileacousto-optical flexural wave-modulator, filter andfrequency shifter in dual-core fiber Int. J. Optoelectron.7 189–94
[72] Cotter D 1983 Stimulated Brillouin scattering in monomodeoptical fibre J. Opt. Commun. 4 10–9
[73] Cotter D 1982 Observation of stimulated Brillouin scatteringin low loss silica fibre at 1.3 μm Electron. Lett.18 445–96
[74] Bayvel P and Giles I P 1989 Linewidth narrowing insemiconductor laser pumped all-fibre Brillouin ring laserElectron. Lett. 25 260–2
[75] Khan O S and Tatam R P 1993 Fiber optic frequency shifterbased on stimulated Brillouin scattering in a birefringentfiber ring resonator Opt. Commun. 103 161–8
[76] Labudde P, Anliker P and Weber H P 1980 Transmission ofnarrow band high power laser radiation through opticalfibre Opt. Commun. 32 385–90
[77] Culverhouse D O, Farahi F, Pannell C N and Jackson D A1989 Stimulated Brillouin scattering: a means to realise atunable microwave generator or distributed temperaturesensor Electron. Lett. 25 915–6
[78] Kalli K, Culverhouse D O and Jackson D A 1991 Fiberfrequency shifter based on generation of stimulatedBrillouin scattering in high-finesse ring resonators Opt.Lett. 16 1538–40
30

Meas. Sci. Technol. 23 (2012) 032001 Topical Review
[79] Tobben H, Muller H and Dopheide D 1994 Brillouinfrequency shift LDA Proc. 7th Int. Symp. on Applicationsof Laser Techniques to Fluid Mechanics (Lisbon) pp 14.2.1
[80] Chan R K Y, Jones J D C and Jackson D A 1985 A compactall optical fibre Doppler difference laser velocimeter Opt.Acta 32 241–6
[81] Jones J D C, Chan R K Y and Jackson D A 1986 Design offibre optic systems for Doppler difference laservelocimetry Laser Anemometry in Fluid Mechanics IIed R J Adrain, D F G Durao, F Durst, H Mishina andJ H Whitelaw (Lisbon: Loadan) pp 69–83
[82] Dandridge A and Goldberg L 1982 Current inducedfrequency modulation in diode lasers Electron. Lett.18 302–3
[83] Jones J D C, Jackson D A, Corke M and Kersey A D 1984Solid state and fibre optic laser Doppler velocimeters Opt.Lasers Eng. 5 127–39
[84] Jones J D C, Corke M, Kersey A D and Jackson D A 1982Miniature solid-state laser Doppler velocimeter Electron.Lett. 18 967–8
[85] Plamann K, Zellmerz H, Czarske J and Tunnermannz A 1998Directional discrimination in laser Doppler anemometry(LDA) without frequency shifting using twinned opticalfibres in the receiving optics Meas. Sci. Technol. 9 1840–6
[86] Li Y, Meersman S and Baets R 2010 Optical frequencyshifter on SOI using thermo-optic serrodyne modulationGroup IV Photonics Conf. (Beijing, China 2010) p P1.4
[87] Izutsu M, Shikama S and Sueta T 1981 Integrated opticalSSB modulator/frequency shifter IEEE J. QuantumElectron. 17 2225–7
[88] Johnson L and Cox C 1988 Serrodyne optical frequencytranslation with high sideband suppression J. LightwaveTechnol. 6 109–12
[89] Green W M, Rooks M J, Sekaric L and Vlasov Y A 2007Ultra-compact, low RF power, 10 Gb/s siliconMach–Zehnder modulator Opt. Express 15 17106–13
[90] Duhring M B and Sigmund O 2009 Improving theacousto-optical interaction in a Mach–Zehnderinterferometer J. Appl. Phys. 105 8
[91] Pruessner M W, Stievater T H, Ferraro M S and RabinovichW S 2007 Thermo-optic tuning and switching in SOIwaveguide Fabry–Perot microcavities Opt. Express15 7557–63
[92] Buttner L and Czarske J 2003 Passive directionaldiscrimination in laser-Doppler anemometry by thetwo-wavelength quadrature homodyne technique Appl.Opt. 42 3843–52
[93] Nakatani N, Maegwa A, Izumi T, Yamada T and Sakabe T1986 Advancing multi-point optical fiberLDV’s—vorticity measurement and some new opticalsystems Laser Anemometry in Fluid Mechanics IIed R J Adrain, D F G Durao, F Durst, H Mishina andJ H Whitelaw (Lisbon: Loadan) pp 3–18
[94] Hachiga T, Furuichi N, Mimatsu J, Hishida K and Kumada M1998 Development of a multi-point LDV by usingsemiconductor laser with FFT-based multi-channel signalprocessing Exp. Fluids 24 70–6
[95] Ishida H, Andoh T, Akiguchi S, Shirakawa H, Kobayashi D,Kuraishi Y and Hachiga T 2010 Blood flow velocityimaging of malignant melanoma by micro multipoint laserDoppler velocimetry Appl. Phys. Lett. 97 103702
[96] Kato S, Ichikaura T and Ito H 1996 Multipoint sensing laserDoppler velocimetry based on laser diode frequencymodulation 11th Optical Fibre Sensors Conf., OFS-11(Sapporo, Japan) pp 606–9
[97] TSI Inc. 3-component LDV system 2011 product website,accessed February http://www.tsi.com/en-1033/categories/laser_doppler_velocimetry/2254/ldv_system_3-component.aspx
[98] Dantec Dynamics 2011 Laser Doppler anemometry (LDA)products website, accessed Februaryhttp://www.dantecdynamics.com/Default.aspx?ID=653
[99] Ahmed N A, Elder R L, Forster C P and Jones J D C 1990Miniature laser anemometer for 3D measurements Meas.Sci. Technol. 1 272–6
[100] Ahmed N A, Hamid S, Elder R L, Forster C P, Tatam R Pand Jones J D C 1992 Fibre optic laser anemometry forturbomachinery applications Opt. Lasers Eng. 16 193–205
[101] Huffacker R M 1970 Doppler detection system for gasvelocity measurements Appl. Opt. 9 1026–8
[102] Stauter R C 1993 Measurement of the three dimensional tipregion flow in an axial compressor J. Turbomach. 115 468
[103] Grant G R and Orloff K L 1973 Two-color dual-beambackscatter laser Doppler velocimeter Appl. Opt.12 2913–6
[104] Yanta W J 1979 A three dimensional laser Dopplervelocimeter for use in wind tunnels ICASF Record p 294
[105] Czarske J W and Muller H 1996 Two component directionallaser Doppler anemometer based on a frequencymodulated Nd:YAG ring laser and fibre delay lines Proc.8th Int. Symp. on Applications of Laser Techniques toFluid Mechanics (Lisbon) pp 34.2.1–6
[106] Czarske J W and Muller H 1996 Two-dimensional directionalfiber-optic laser Doppler anemometer based onheterodyning by means of a chirp frequency modulatedNd:YAG miniature ring laser Opt. Commun. 132 421–6
[107] Muller H, Wang H and Dopheide D 1996 Fibre opticalmulticomponent LDA system using the optical frequencydifference of powerful DBR laser diodes Proc. 8th Int.Symp. on Applications of Laser Techniques to FluidMechanics (Lisbon) pp 34.3.1–4
[108] Nakatani N, Tokita M and Yamada T 1984 LDV usingpolarisation preserving optical fibres for simultaneousmeasurement of two velocity components Appl. Opt.23 1686–7
[109] Nakatani N, Tokita M, Izumi T and Yamada Y 1985 Dopplervelocimetry using polarisation-preserving optical fibres forsimultaneous multidimensional velocity components Rev.Sci. Instrum. 56 2025–9
[110] Pannell C N, Tatam R P, Jones J D C and Jackson D A 1988Two-dimensional fibre-optic laser velocimetry usingpolarisation state control J. Phys. E: Sci. Instrum.21 103–7
[111] Carbonaro M 1984 Conception and design of a new type ofthree component laser Doppler velocimeter Von KarmanInstitute Technical Memorandum
[112] Dopheide D, Rinker M and Strunck V 1993 High frequencypulsed laser diode application in multi-component laserDoppler anemometry Opt. Lasers Eng. 18 135–43
[113] Lockey R A and Tatam R P 1994 High frequencypulsed-diode laser anemometry Proc SPIE 2341 102
[114] Resagk C, Schellenberger U, Grabow J, Tropea Cand Stieglmeier M 1995 Two-component LDA usingoptical multiplexing Meas. Sci. Technol. 6 674
[115] James S W, Lockey R A, Egan D, Tatam R P and Elder R L1996 3d fibre optic laser Doppler velocimetry Proc. 8thInt. Symp. on Applications of Laser Techniques to FluidMechanics (Lisbon) pp 28.2.1–6
[116] James S W, Tatam R P and Elder R L 1997 Designconsiderations for a 3d fibre optic laser Dopplervelocimeter for turbomachinery applications Rev. Sci.Instrum. 68 3241–6
[117] Dopheide D, Tobben H, Strunck V, Grosche G and Muller H1999 Realization of high performance LDA-systems usingoptical amplifiers, high power semiconductor lasers andoptical fiber lasers J. Vis. 2 281–92
[118] Tobben H, Muller H and Dopheide D 1998 Power andsensitivity improvement of LDA-systems by fiber
31

Meas. Sci. Technol. 23 (2012) 032001 Topical Review
amplifiers Selected papers of 8th Int. Symp. on Applicationof Laser Techniques to Fluid Mechanics 1996(Springer-Verlag) pp 3–10
[119] Czarske J W, Plamann K, Zellmer H, Tunnermann Aand Muller H 1997 Achromatic laser Doppler anemometrybased on diode-pumped fiber lasers and diffraction gratingbeam splitters Optical Fiber Sensors (OFS) (Williamsburg,VA, 28 October 1997) paper OWC5
[120] Czarske J W, Zellmer H and Welling H 1999 Directionalachromatic heterodyne fiber laser Doppler anemometerOpt. Commun. 160 268–72
[121] France P W 1991 Optical Fibre Lasers and Amplifiers(Glasgow: Blackie) ISBN: 0849377161
[122] Lo Y L, Sirkis J S and Fourney W L 1997 In-fiber Dopplervelocimeter for velocity measurements of moving surfacesExp. Mech. 37 328–32
[123] Tselikov A and Blake J 1998 Sagnac-interferometer-basedFresnel flow probe Appl. Opt. 37 6690–4
[124] Photon Control Inc.Melnyk I 2008 Fibre optic flow sensingdevice and method US Patent No 7466399
[125] Lu Z-H, Charrett T O H and Tatam R P 2009Three-component planar velocity measurements usingMach–Zehnder interferometric filter-based planar Dopplervelocimetry (MZI-PDV) Meas. Sci. Technol.20 034019
[126] Seiler F and Oertel H 1985 Visualization of velocity fieldswith Doppler pictures Proc. 3rd Int. Symp. on FlowVisualization pp 454–9
[127] Landolt A and Rosgen T 2006 Global Doppler frequency shiftdetection with near-resonant interferometry 13th Int Symp.on Applications of Laser Techniques to Fluid Mechanics(Lisbon, Portugal, 26–29 June 2006) paper_21_7
[128] Roehle I and Willert C E 2001 Extension of Doppler globalvelocimetry to periodic flows Meas. Sci. Technol.12 420–31
[129] Willert C, Blumcke E, Beversdorff M and Unger W 2000Application of phase averaging Doppler globalvelocimetry to engine exhaust flows Int. Symp. onApplications of Laser Techniques to Fluid Mechanics(Lisbon, Portugal)
[130] Crafton J, Messersmith N and Sullivan J P 1998 FilteredDoppler velocimeter—development of a point system 36thAerospace Sciences Meeting and Exhibit (Reno, NV, 12–15January 1998) AIAA-1998-509
[131] Charrett T O H, Nobes D S and Tatam R P 2007 Investigationinto the selection of viewing configurations forthree-component planar Doppler velocimetrymeasurements Appl. Opt. 46 4102
[132] Meyers J F, Lee J W, Fletcher M T, Cavone A Aand Viramontes J A G 2006 Supersonic flow fieldinvestigations using a fiber-optic based Doppler globalvelocimeter 13th Int. Symp. on Applications of LaserTechniques to Fluid Mechanics (Lisbon, Portugal, 26–29June 2006) paper_21_1
[133] DLR Institute of Propulsion Technology 2011 website,accessed Februaryhttp://www.dlr.de/at/en/desktopdefault.aspx/tabid-1522/
[134] Roehle I, Karpinsky G and Schodl R 19993-component-Doppler-laser-2-focus: a new kind of threecomponent velocimeter 18th Int. Congress onInstrumentation in Aerospace Simulation Facilities(ICIASF 99) (Toulouse, 14–17 June 1999) 13/1–13/9DOI:10.1109/ICIASF.1999.827152
[135] Louge M Y, Iyer S A, Giannelis E P, Lischer D J and ChangH 1991 Optical fiber measurements of particle velocityusing laser-induced phosphorescence Appl. Opt.30 1976–81
[136] Stephens T J, Haste M J, Parry J P, Towers D P, Matsuura Y,Shi W Y, Miyagi M and Hand D P 2005 Hollow-corewaveguides for particle image velocimetry Meas. Sci.Technol. 16 1119–2
[137] Tani N, Mori M, Hishida K and Maeda M 2000 Developmentof fiber bundle-image-guided PIV Proc. 10th Int. Symp. onApplication of Laser Technology to Fluid Mechanics(Lisbon, Portugal, 10–13 July 2000) pp 1–10
[138] Swales C, Rickards J, Crompton M, Terry N and Breeze G1996 Three component LDA study of the flow fieldsurrounding the helicopter landing pad of a frigate 8th Int.Symp. on Applications of Laser Techniques to FluidMechanics (Lisbon, Portugal)
32


