Embed Size (px)
Citation preview


THE CICERONE FARMS:
COMING TO CONCLUSIONS?
SYMPOSIUM 2006
Proceedings
Edited by J.M. Scott
The Cicerone Project Inc. Compare Measure Learn Adopt

The Cicerone Project – May 2006 Symposium ii
ISBN 1 86389 995 2 Printing: University of New England, Printery Layout: Craig Birchall, University of New England Cover design: Mesh Solutions Citation: The Cicerone Farms: Coming to Conclusions? Proceedings of 2006
Symposium. Edited by J.M. Scott. Publisher: The Cicerone Project Inc. (Mr. Terry Coventry, Chairman) and the Centre for
Sustainable Farming Systems, University of New England Copyright: © The Cicerone Project Inc.

The Cicerone Project – May 2006 Symposium iii
CONTENTS
Foreword ................................................................................................................................. iv Editor’s Acknowledgements ................................................................................................... v Botanical composition changes on the Cicerone Farm over six years ................................ 1
Libuseng Shakhane A, Col Mulcahy B, Jim Scott A and Amber Morrow C Balancing the Management of Pastures and Livestock for Sustainability ......................... 8
Libuseng Shakhane A, Jim Scotta, Colin LordC, Geoff HinchB and Col Mulcahy D Realising Production Potential from Merino Enterprises – which production system? The Cicerone Project, Chiswick, Uralla, NSW..................................................... 14
Michael Lollback A, Sue Hatcher B, and Clare Edwards C, A Producer’s Perspective I ................................................................................................... 23
Phillip Dutton A Producer’s Perspective II.................................................................................................. 24
Mark Waters Cicerone farm manager’s perspective ................................................................................. 25
Justin Hoad Soil Fertility and Long term Fertiliser Management on the Cicerone Farmlets ............. 27
Guppy, C.N.A Intensive Rotational Grazing And It’s Role As A Tool For Barber’s Pole Worm Control In The New England ............................................................................................... 31
Colvin, A.F.AB, Walkden-Brown, S.W.BA Optimisation of pasture improvement................................................................................. 39
Karl BehrendtA, Oscar CachoA , and James ScottB Economic outcomes from the 3 farmlets ............................................................................. 42
Fiona Scott Assessing the sustainability of the three Cicerone farmlets over time.............................. 46
Jim ScottA and Andrew AlfordB Comparison of the growth rates of various cross bred meat sheep .................................. 52
Caroline Gaden and Justin Hoad Improving the diagnosis of virulent footrot: development of a DNA test using the intA gene ................................................................................................................................. 58
Brian F. Cheetham and Margaret E. Katz Appendix 1. Cicerone Farmlet Guidelines ......................................................................... 61 Appendix 2. Cumulative grazing days on each farmlet over time ................................... 63 Appendix 3. Summary of 2006 survey of Members .......................................................... 64 Appendix 4. Summary Evaluation of Symposium (May 11, 2006) .................................. 66
The Cicerone Project – May 2006 Symposium iv
FOREWORD These Proceedings of the Symposium "The Cicerone Farms: Coming to Conclusions?" represent a significant milestone for the Cicerone Project in this, its ‘harvest’ year for the project. The papers comprise the written papers of the talks given at the symposium held on May 11, 2006 as well as several other papers on topics related to Cicerone’s past activities. The papers are attempts by the authors to ‘come to conclusions’ about the investigations that have been carried out on the central learning farm over the past 6 years. Some of these ‘conclusions’ are still works in progress as several of their authors are still completing postgraduate theses. The content of this symposium continues along the pathway set by Cicerone’s motto:
Compare Measure Learn Adopt Importantly, with these proceedings, we have finalised the written papers after the symposium, so that we could also include the all important pre- and post-symposium information gathered from our members and those attending this symposium. It is the Board’s hope that this project might find a way to continue on - to experience a longer run of seasons, including some ‘good’ ones - so that we might get to see some more ‘conclusions’ drawn at some time in the future, especially as sustainability and profitability are long-term issues for grazing enterprises. We wish to acknowledge:
• Australian Wool Innovation for their generous funding from 1998 to 2006 • CSIRO for the lease of the land and other support • University of New England for support of a postgraduate and the various inputs from
the Centre for Sustainable Farming Systems • NSW Department of Primary Industries for their support of a postgraduate student
and extension support • Betty Hall Pty Ltd and TAFE for their advice and assistance • The Sheep CRC for the support of two postgraduates and • Elders Wool for their professional input.
We trust that you will enjoy reading our 2nd symposium proceedings.
Terry Coventry Chairman of the Cicerone Board

The Cicerone Project – May 2006 Symposium v
EDITOR’S ACKNOWLEDGEMENTS Once again, our sincere thanks to all those who helped bring these proceedings together. The support of the Board is once again much appreciated. The symposium has been co-convened by the Cicerone Project Inc. and the University of New England’s Centre for Sustainable Farming Systems. The efforts of the referees from the Centre – Chris Guppy, Keith Hutchinson, Kathy King, John Stanley, and Peter Lockwood are much appreciated. The assistance provided by Craig Birchall in formatting the Proceedings was invaluable as was the editing assistance of Joan Henley. In addition, special mention must be made of the supply of complex datasets to many of the authors by Dion Gallagher and Colin Lord of the University of New England’s Relational Database Unit. Of course, this Proceedings would not have been possible without the generous time devoted to the task of writing these informative papers by the many authors - and especially the 4 postgraduates who have worked so hard on this project – Libuseng Shakhane, Alison Colvin, Karl Behrendt and Fiona Scott – we thank them sincerely. The valuable contribution of Ms. Clare Edwards, Cicerone Board member representing NSW Department of Primary Industries, especially in designing and analysing the surveys reproduced in Appendices 3 and 4 is also gratefully acknowledged. Finally, yet again (!), my thanks to the staff of the University of New England’s Printery who have helped us create a quality printed document in a timely way for the benefit of all readers.
Jim Scott Editor

The Cicerone Project – May 2006 Symposium 1
BOTANICAL COMPOSITION CHANGES ON THE CICERONE FARM OVER SIX YEARS LIBUSENG SHAKHANE A, COL MULCAHY B, JIM SCOTT A AND AMBER MORROW C A School of Rural Science and Agriculture and Centre for Sustainable Farming Systems, University of
New England, NSW, 2351 B Consultant, Armidale C School of Rural Science and Agriculture, University of New England, NSW, 2351
SUMMARY The degradation of grazing areas in temperate regions of New South Wales, Australia is linked inextricably to the decline in deep-rooted fertiliser responsive perennial pastures. Due to the high costs of farm inputs associated with re-establishing pastures, grazing management is an important management tool to maintain high production of these perennials over the long-term. Botanical composition, within the Cicerone farmlets on the Northern Tablelands of NSW, was measured each year from autumn 2000 to late summer 2006. The BOTANAL procedure was used to quantify the changes in pasture species composition in response to different farmlet management practices and seasonal variation. As a consequence of the extensive sowing of pastures since 2000, the high input system (farmlet A) consistently registered a higher percentage of sown, fertiliser-responsive perennials than the moderate input systems (farmlets B and C). There was however clear evidence that the content of these perennials (Festuca elatoir, Phalaris aquatica, Lolium perenne, and Dactylis glomerata) declined across the 3 farmlets from 2000 to 2006. There is an indication from these findings that for a period of six years, these perennials were replaced by less productive species (Themeda australis, Poa sieberiana, Paspalum dilatatum, and Cyperus spp) particularly on farmlets B and C, and an increasing content of the low feed value and short-lived perennial (Eleusine tristachya) on farmlet A. The decline in these deep-rooted fertiliser-responsive perennials was more strongly marked on farmlet B whilst the result on farmlet C was intermediate. Conversely, while the percentage of native perennials on farmlet A was relatively low, these natives substantially increased on farmlet C and especially on farmlet B. The percentage of legumes remained low across the 3 farmlets over the past 6 years except in early 2006 when an increase in the legume content of pastures on farmlet A was recorded.
INTRODUCTION Changing the botanical composition of pastures on any grazing property is one of the most fundamental ways in which livestock productivity can be enhanced. However, the cost of establishing sown pastures and maintaining them over sufficiently long periods to justify the costs of establishment remains a great challenge. This paper provides an update of the results presented by Scott et al (2005) in Cicerone’s 1st symposium.
METHODS AND MATERIALS The farmlet treatments are provided in Appendix 1 of this proceedings. In brief, the BOTANAL procedure was used to assess botanical composition over consistent diagonal transects across each paddock of each farmlet. One of the authors (Col Mulcahy) was involved in all assessments, thus ensuring consistency to the application of the methodology. The reader is referred to previous paper by Scott et al (2005) for more details of the methodology used.

The Cicerone Project – May 2006 Symposium 2
RESULTS The botanical composition over six years has been summarised into five major classes of pasture species (Figure 1). Also shown in Figure 1 are the years when various paddocks have been sown on each of the farmlets. Figure 1(a) shows a relatively stable population of sown grasses and introduced grasses with a minor but increasing percentage of legumes and chicory. There has also been a gradual increase in the proportion of native grasses but a corresponding decline in the weedy species which are mostly comprised of broadleaf weeds. Figure 1(b) shows the changes over time in the same five categories for farmlet B. There is a relatively lower proportion of sown and introduced grasses and a minor component of legumes. The predominant group of plants represented is that of native grasses which have increased dramatically from early 2000 to comprise approximately 50% of the pasture’s sward some six years later. The proportion of weedy species on this farmlet has remained relatively low over time. For farmlet C, Figure 1(c) again shows a lower but relatively stable proportion of sown grasses with a stable proportion of introduced grasses and again a minor component of legumes. The increase in native grasses is intermediate between farmlets A and B and, once again, weedy species are a relatively minor component over time. Figure 2 shows the changes in the average legume percentage across farmlets over the past three years showing that the growth of legumes is relatively episodic and most pronounced on farmlet A with intermediate amounts on farmlet B and least on farmlet C. Of particular note are the relatively large amounts of legume produced in autumn 2003 and spring 2005 which were both favourable growing seasons in terms of soil moisture and temperature. It is notable that the average legume percentage across each of the farmlets has to date never risen above 10%. Nevertheless, there are large and significant differences in legume percentage between farmlets and especially between farmlet A and the other two farmlets.

The Cicerone Project – May 2006 Symposium 3
(a)
0%
20%
40%
60%
80%
100%
Jan-00
Jan-01
Jan-02
Jan-03
Jan-04
Jan-05
Jan-06
Bota
nica
l Com
posi
tion
SownGrasses Legumes Chicory IntroducedGrasses NativeGrasses WeedySpecies
A3, A
4, A
5
A6 A1, A
2
A5, A
6
A1
(b)
0%
20%
40%
60%
80%
100%
Jan-00
Jan-01
Jan-02
Jan-03
Jan-04
Jan-05
Jan-06
Bot
anic
al C
ompo
sitio
n
SownGrasses Legumes IntroducedGrasses NativeGrasses WeedySpecies (c)
0%
20%
40%
60%
80%
100%
Jan-00
Jan-01
Jan-02
Jan-03
Jan-04
Jan-05
Jan-06
Bot
anic
al C
ompo
sitio
n
SownGrasses Legumes IntroducedGrasses NativeGrasses WeedySpecies Figure 1. Botanical composition summarised as 5 classes (sown grasses, legumes,
introduced grasses, native grasses and weedy species) from February 2000 to February 2006.

The Cicerone Project – May 2006 Symposium 4
0
2
4
6
8
10
Dec-20
02
Mar-20
03
Jun-2
003
Sep-2
003
Dec-2003
Mar-2004
Jun-2
004
Sep-200
4
Dec-20
04
Mar-20
05
Jun-2
005
Sep-2005
Dec-2
005
Mar-2006
Jun-2
006
Legu
me
%
Average AAverage BAverage C
Figure 2. Changes in average legume percentage 2002 -2006.
Figure 3 shows the average pasture growth rate for each of the farmlets which again shows the episodic and seasonal nature of growth with only one period of pronounced high growth occurring in the spring and early summer of 2005, especially on farmlet A. It is clear that there have been extended periods with little detectable growth over the past three years during which growth has been assessed.
0
20
40
60
80
Dec-2
002
Mar-20
03
Jun-2
003
Sep-200
3
Dec-2
003
Mar-200
4
Jun-2
004
Sep-200
4
Dec-200
4
Mar-20
05
Jun-2
005
Sep-2005
Dec-20
05
Mar-20
06
Jun-2
006
Gro
wth
rate
(kg/
ha/d
)
Average AAverage BAverage C
Figure 3. Average growth rate for farm A, B & C 2002 - 2006.
Details of some of the contrasts in botanical composition within each of the farmlets is shown in Figure 4. The figure contrasts example paddocks representing the best and the worst of each of the farmlets to present the reader with some understanding of the individual species which are contributing to the various classes over time. These data form a rich source of information for future investigation together with other data to explore the ‘cause and effect’ relationships influencing botanical composition changes. Farmlet A Paddock A6 in Figure 4, was sown in 2000 to a so-called “high performance” pasture based on Italian ryegrass. Following the loss of that pasture in 2002, in its second year, it was resown in autumn 2003 to a long-term perennial pasture (tall fescue, phalaris and white clover). It is clear that there is currently a major proportion of sown species. However, relatively little legume and other species existed in that paddock in early 2006. In contrast, Figure 4(b) shows paddock A8 which has not been resown within the past several decades. It commenced in early 2000 with a high proportion of phalaris and tall fescue which have been maintained in

The Cicerone Project – May 2006 Symposium 5
the pastures but which have decreased substantially over the last three years. Correspondingly, over the same time there has been a marked increase in species such as goose grass, blown grass, Microlaena and Yorkshire fog. Farmlet B Figure 4(c) shows a relatively high persistence of sown grasses but with increasing prevalence of native grasses such as Microlaena, tussocky poa and red grass. Figure 4(d) shows one of the poorest botanical compositions on farmlet B where there remains very little original sown grasses and there has been a corresponding dramatic increase in level of native grasses including tussocky poa, kangaroo grass, blown grass and red grass. In this case Yorkshire Fog has declined from about 20% of the pasture to a minor proportion over the past six years. Farmlet C Figure 4(e) shows one of the better examples of farmlet C paddocks (paddock C16) where there has been quite good retention of the original phalaris. There has also been an increasing proportion of Microlaena and red grass and in recent times of Vulpia. In contrast, one of the worst paddocks of farmlet C (paddock C7) retains little original sown grasses and this paddock has experienced large increases in the percentage of Parramatta grass and Yorkshire fog together with a slight increase in Vulpia over the past year.
DISCUSSION It is clear that there have been major changes in botanical composition between the farmlets over the past six years. The most dramatic changes have been due to the relatively frequent pasture sowing on farmlet A which has enabled the maintenance of relatively high levels of species which are considered to be desirable for animal production (sown grasses, introduced grasses, legumes and chicory) but this has been at a great cost. It is noteworthy that this farmlet has not yet achieved the original goal of 100% of the farmlet being occupied by desirable species. In fact, in late summer of each year some 30 – 40% of the feed on offer still consists of species of lesser digestibility, namely native grasses and weedy species. In stark contrast, the sown grasses on farmlet B have been in decline up until early 2004 but have increased slightly since then due in part to the resowing of one paddock with desirable perennial species. The effects of patch grazing have been observed, especially on farmlet B where it is obvious that animals tend to utilise parts of paddocks much more than other parts of paddocks. This is leading to considerable shifts in botanical composition within paddocks from those species which are extremely grazing tolerant such as broadleaf weeds in the sheep camps through to areas of paddocks with high herbage masses of native grasses which are relatively mature. The low proportion of legumes across all farmlets has been a notable feature especially on farmlets B and C. The variation in legume percentage over the various seasons shown in Figure 2 indicates the potential for legume growth to be greater on farmlet A but it would appear that the generally dry seasons over the past six years have greatly constrained the ability of legumes to become established and maintained in these grass dominant pastures. Statistical analysis of the botanical composition data has shown that the loss of sown grasses tends to be associated with the rise of warm season species such as the native grasses and introduced short-lived perennial grasses such as goose grass (Eleusine tristachya). We suggest that the loss of desirable species has been linked to excessive grazing pressure and, possibly in the case of farmlets B and C, to relatively low levels of soil phosphorus and sulphur. It is likely also that the levels of supplementary feeding which have been high in recent years may have contributed to pasture degradation by providing animals with sufficient protein to be able to digest otherwise relatively indigestible pasture material.

The Cicerone Project – May 2006 Symposium 6
One of best One of worst (a) Paddock A6 (b) Paddock A8
0%
20%
40%
60%
80%
100%
Jan-00
Jan-01
Jan-02
Jan-03
Jan-04
Jan-05
Jan-06
Bota
nica
l Com
posi
tion
Phalaris aquatica Festuca elatior Lolium perenne Trifolium repensEleusine tristachya Paspalum dilatatum Anthoxanthum odoratum Bromus sppAgrostis avenacea Bothriochloa macra Cyperus spp Sporobolus elongatusElymus scaber Holcus lanatus Weeds Other Vulpia sppPanicum gilvum Chloris truncata
Fescue
Yorkshire Fog
Blown Grass
Italian ryegrass Crab/Goose Grass
0%
20%
40%
60%
80%
100%
Jan-00
Jan-01
Jan-02
Jan-03
Jan-04
Jan-05
Jan-06
Bot
anic
al C
ompo
sitio
n
Phalaris aquatica Festuca elatior Lolium perenne Trifolium repens Eleusine tristachyaAnthoxanthum odoratum Paspalum dilatatum Bromus spp Agrostis avenacea Microlaena stipoidesBothriochloa macra Stipa scabra Eragrostis spp Cyperus spp Danthonia sppC4 grasses Elymus scaber Cynodon dactylon Digitaria sanguinalis Holcus lanatusWeeds Other Panicum gilvum Vulpia spp Cirsium vulgare Setaria spp
Phalaris
Fescue
Crab/Goose Grass
Blown Grass
Microlaena
Yorskshire Fog
(c) Paddock B1 (d) Paddock B5
0%
20%
40%
60%
80%
100%
Jan-00
Jan-01
Jan-02
Jan-03
Jan-04
Jan-05
Jan-06
Bot
anic
al C
ompo
sitio
n
Festuca elatior Phalaris aquatica Lolium perenne Trifolium repens Paspalum dilatatumEleusine tristachya Bromus spp Avena fatua Anthoxanthum odoratum Microlaena stipoidesPoa sieberana Bothriochloa macra C4 grasses Danthonia spp Cynodon dactylonCyperus spp Sporobolus elongatus Agrostis avenacea Themeda australis Eragrostis sppStipa scabra Holcus lanatus Weeds Other Cirsium vulgare Vulpia sppAristida ramosa Juncus spp
Fescue
Poa
Paspalum
Red Grass
Microlaena
YSFog
0%
20%
40%
60%
80%
100%
Jan-00
Jan-01
Jan-02
Jan-03
Jan-04
Jan-05
Jan-06
Bot
anic
al C
ompo
sitio
n
Phalaris aquatica Festuca elatior Lolium perenne Trifolium repens Anthoxanthum odoratumPaspalum dilatatum Bromus spp Poa sieberana Themeda australis Bothriochloa macraAgrostis avenacea Sorghum leiocladum Sporobolus elongatus Eragrostis spp Cyperus sppC4 grasses Danthonia spp Elymus scaber Cynodon dactylon Eulalia aureaHolcus lanatus Vulpia spp Weeds Other Cirsium vulgare Aristida ramosaPanicum gilvum Juncus spp
Kanagroo Grass
Sweet Vernal
YSFog
Red Grass
Ph l i
Poa
Blown Grass
(e) Paddock C16 (f) Paddock C7
0%
20%
40%
60%
80%
100%
Jan-00
Jan-01
Jan-02
Jan-03
Jan-04
Jan-05
Jan-06
Bot
anic
al C
ompo
sitio
n
Phalaris aquatica Festuca elatior Lolium perenne Trifolium repens Paspalum dilatatumAnthoxanthum odoratum Eleusine tristachya Bromus spp Avena fatua Microlaena stipoidesPoa sieberana Bothriochloa macra Elymus scaber Sporobolus elongatus Cynodon dactylonCyperus spp Danthonia spp Eragrostis spp Stipa scabra Agrostis avenaceaDichelachne micrantha Deyeuxia spp Vulpia spp Holcus lanatus Panicum gilvumWeeds Other
Phalaris
Microlaena
Red Grass
Perennial Ryegrass Paspalum
VulpiaWheat Grass
Fescue
0%
20%
40%
60%
80%
100%
Jan-00
Jan-01
Jan-02
Jan-03
Jan-04
Jan-05
Jan-06
Bot
anic
al C
ompo
sitio
n
Phalaris aquatica Festuca elatior Lolium perenne Trifolium repens Paspalum dilatatumAnthoxanthum odoratum Eleusine tristachya Bromus spp Bothriochloa macra Sporobolus elongatusAgrostis avenacea Cyperus spp Eragrostis spp Elymus scaber Microlaena stipoidesDanthonia spp Cynodon dactylon C4 grasses Holcus lanatus Vulpia sppWeeds Other Panicum gilvum
Yorkshire fog (Holcus lanatus)
Slender Rat's Tail / Parramatta Grass
Paspalum
Vulpia
Figure 4. Examples of contrasting botanical compositions within farmlets.
We suggest that it is important for desirable pasture species to be maintained in grazed swards and that in future changes should be made to grazing management and stocking rates to ensure that undue pressure is not applied to those pastures. More attention should be paid to the levels of herbage mass remaining and the levels of stock being carried so that high levels of supplementary feeding can be avoided, thereby lessening the pressure on the desirable species. We recommend that changes to the grazing guidelines be made to ensure that grazing occurs

The Cicerone Project – May 2006 Symposium 7
within the PROGRAZE benchmarks (as was originally intended but has not been sufficiently applied) and that groundcover of at least 70% is maintained at all times. The apparent increase in the desirable species within farmlets B and C over the past year are perhaps an indication that favourable seasons such as occurred in late 2005 can have a positive impact on botanical composition. In contrast, in spite of the good season, perhaps due to excessive stock numbers on farmlet A at that time, there seems to have been continued pressure on the persistence of desirable species. Given more favourable seasons and changes to management, we hypothesise that is should be feasible to maintain the desirable pasture species for periods of ten years or more. It is clear in the case of many of the paddocks of farmlets B and C and paddocks A7 and A8 of farmlet A, that original sown species can persist over periods of more than two decades. Achieving that on more paddocks remains a challenge for the future management of the Cicerone farmlets.
ACKNOWLEDGEMENTS The support of Australian Wool Innovation for project support funds and the support of the University of New England for a postgraduate studentship are gratefully acknowledged. The authors would like to acknowledge the Cicerone Project for providing access to the study site and the experimental animals. Some of the data used in this study were provided by the Farm Manager, Justin Hoad and the Executive Officer, Caroline Gaden.
REFERENCES Gibson, RS and Bosch, OJH (1996). Indicator species for the interpretation of vegetation condition in
the St Bathans area, Central Otago, New Zealand, New Zealand Journal of Ecology 20, 163-71.
Scott JM, Mulcahy C and Shakhane LM (2005) Botanical composition changes over time and pasture persistence, in Proceedings of Cicerone 2005 Symposium, The Cicerone Farms: Under the Microscope, Ed. JM Scott, The Cicerone Project Inc, Chiswick NSW and the Centre for Sustainable Farming Systems, University of New England, NSW is gratefully acknowledged.

The Cicerone Project – May 2006 Symposium 8
BALANCING THE MANAGEMENT OF PASTURES AND LIVESTOCK FOR SUSTAINABILITY LIBUSENG SHAKHANE A, JIM SCOTTA, COLIN LORDC, GEOFF HINCHB AND COL MULCAHY D
A School of Rural Science and Agriculture and Centre for Sustainable Farming Systems, University of New England, NSW, 2351.
B School of Rural Science and Agriculture, University of New England, NSW, 2351 C Relational Database Unit, University of New England, Armidale, NSW 2351 D Consultant, Armidale
ABSTRACT The management of livestock on pastures is commonly attempted using PROGRAZE principles which are based largely on achieving a balance between herbage mass and quality. In spite of the guidelines adopted by the Cicerone Project for the tactical grazing on farmlets A and B, this was not generally adhered to, due to the difficulty in timely assessment of the measurements made. There are marked differences between the farmlets in both pasture supply and animal demand. Animal demand was assessed with the aid of the GrazFeed Decision Support Tool which is designed to help graziers to assess the feeding value of pastures and the need for the supplementary feeding of different classes of grazing animals. Metabolisable energy calculation was considered in this study as a decision tool to assist a more systematic and appropriate approach to matching the energy requirements of livestock with the energy concentration that can be supplied by the pasture. The ME net balance between pasture supply and animal demand was calculated and compared amongst three farmlets which all had different grazing management and input levels. The net ‘balance’ between pasture supply and demand for ME indicates some periods of feed surpluses and other periods of feed shortages across the three farmlets, with the high input system (farmlet A) occasionally reaching more negative balances than the moderate input systems (farmlets B and C) with their lower stocking rates. It is suggested that, with further development of this approach, grazing management could be improved using regular and timely assessments of the energy balance between supply and demand.
INTRODUCTION The changes in pasture supply to grazing animals commonly varies with seasonal and episodic climatic conditions as well as the pasture species, soil fertility and grazing management. In contrast, although animal requirements vary with reproduction, growth, etc. these requirements remain somewhat predictable during the year. Successful farm management systems therefore require an ability to balance a somewhat predictable demand of the grazing animals with relatively unpredictable changes in seasonal herbage supply. Matching such conflicting needs, when comparing different management systems which vary in terms of grazing management, soil fertility status, and sowing of new pastures, has presented a challenge to both farm management and researchers on the Cicerone farmlets. This study sought to provide a means to integrate the nutritional requirements of different classes of grazing animals with the capacity of the seasonal pasture to supply such nutrients. This was attempted through ‘flexible rotational grazing’ based on the availability of green herbage and animal requirements for farmlets A and B (i.e. Prograze principles), while following intensive rotational grazing with short grazing and long rest periods for farmlet C.
The Cicerone Project – May 2006 Symposium 9
METHODS AND MATERIALS The study site The study was conducted on three 50 ha the farmlets operated by the Cicerone Project at CSIRO’s Chiswick property located 17 km south of Armidale, NSW. The area is located at latitude 30° 31′ S and longitude 151° 39′ E. A description of the farmlets has been given by Scott (2003).
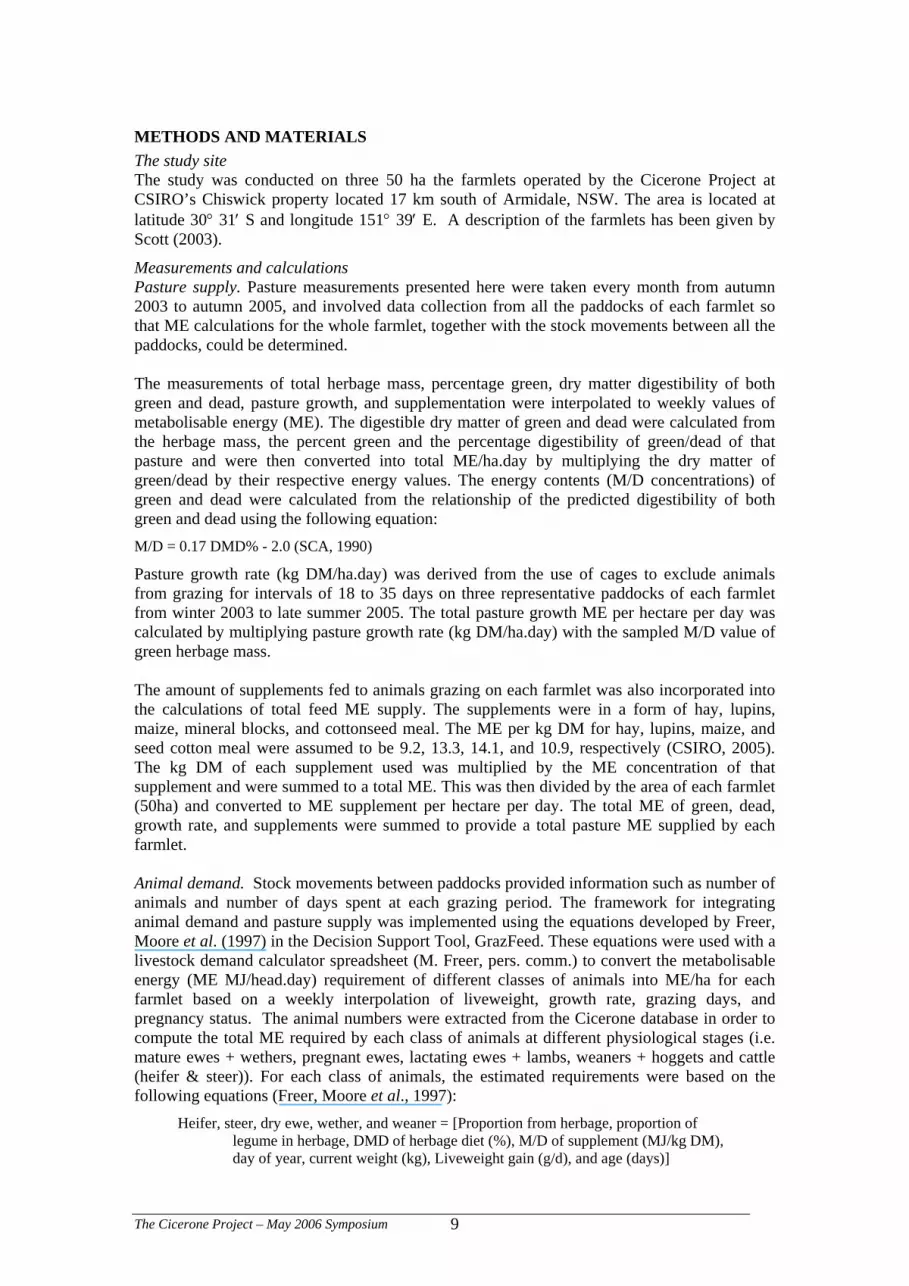
Measurements and calculations Pasture supply. Pasture measurements presented here were taken every month from autumn 2003 to autumn 2005, and involved data collection from all the paddocks of each farmlet so that ME calculations for the whole farmlet, together with the stock movements between all the paddocks, could be determined. The measurements of total herbage mass, percentage green, dry matter digestibility of both green and dead, pasture growth, and supplementation were interpolated to weekly values of metabolisable energy (ME). The digestible dry matter of green and dead were calculated from the herbage mass, the percent green and the percentage digestibility of green/dead of that pasture and were then converted into total ME/ha.day by multiplying the dry matter of green/dead by their respective energy values. The energy contents (M/D concentrations) of green and dead were calculated from the relationship of the predicted digestibility of both green and dead using the following equation: M/D = 0.17 DMD% - 2.0 (SCA, 1990)
Pasture growth rate (kg DM/ha.day) was derived from the use of cages to exclude animals from grazing for intervals of 18 to 35 days on three representative paddocks of each farmlet from winter 2003 to late summer 2005. The total pasture growth ME per hectare per day was calculated by multiplying pasture growth rate (kg DM/ha.day) with the sampled M/D value of green herbage mass. The amount of supplements fed to animals grazing on each farmlet was also incorporated into the calculations of total feed ME supply. The supplements were in a form of hay, lupins, maize, mineral blocks, and cottonseed meal. The ME per kg DM for hay, lupins, maize, and seed cotton meal were assumed to be 9.2, 13.3, 14.1, and 10.9, respectively (CSIRO, 2005). The kg DM of each supplement used was multiplied by the ME concentration of that supplement and were summed to a total ME. This was then divided by the area of each farmlet (50ha) and converted to ME supplement per hectare per day. The total ME of green, dead, growth rate, and supplements were summed to provide a total pasture ME supplied by each farmlet. Animal demand. Stock movements between paddocks provided information such as number of animals and number of days spent at each grazing period. The framework for integrating animal demand and pasture supply was implemented using the equations developed by Freer, Moore et al. (1997) in the Decision Support Tool, GrazFeed. These equations were used with a livestock demand calculator spreadsheet (M. Freer, pers. comm.) to convert the metabolisable energy (ME MJ/head.day) requirement of different classes of animals into ME/ha for each farmlet based on a weekly interpolation of liveweight, growth rate, grazing days, and pregnancy status. The animal numbers were extracted from the Cicerone database in order to compute the total ME required by each class of animals at different physiological stages (i.e. mature ewes + wethers, pregnant ewes, lactating ewes + lambs, weaners + hoggets and cattle (heifer & steer)). For each class of animals, the estimated requirements were based on the following equations (Freer, Moore et al., 1997):
Heifer, steer, dry ewe, wether, and weaner = [Proportion from herbage, proportion of legume in herbage, DMD of herbage diet (%), M/D of supplement (MJ/kg DM), day of year, current weight (kg), Liveweight gain (g/d), and age (days)]
The Cicerone Project – May 2006 Symposium 10
Pregnant ewe = [Proportion from herbage, proportion of legume in herbage, DMD of herbage diet (%), M/D of supplement (MJ/kg DM), day of year, current weight (kg), liveweight gain (g/d), age (days), days of gestation, and number of foetuses]
Lactating ewe = [Proportion from herbage, proportion of legume in herbage, DMD of herbage diet (%), M/D of supplement (MJ/kg DM), day of year, current weight (kg), Liveweight gain (g/d), age (days), day of lactation, number of lambs, weight of each lamb (kg), mature weight of lamb (kg), weight gain by each lamb (g/d), and proportion of lamb ME from milk]
Estimates of the proportion of diet herbage contributed to by the legume fraction were used together with estimates of the quality of herbage on offer either as DMD% or as M/D which was calculated from a weighted average of green/dead digestibility. Values for the increase in ME needs due to grazing was estimated as the percentage increase in the maintenance requirement accounting for the additional energy cost of grazing which varies between 5-20% depending on the distance walked by the animals and the slope of the paddocks (M. Freer pers. comm.). In the case of the Cicerone farmlets, 5% increase for grazing was used across the three farmlets as the terrain of the farmlet paddocks was relatively flat and the animal movement was generally between adjacent paddocks Net ME balance. The net balance between pasture supply and animal demand was then compared between the three farmlet systems by deducting the ME demand for all animal classes from the ME supplied by the pasture (growth rateME +supplementME); this provided the net surplus/deficit on each farmlet system on a weekly basis.
RESULTS Pasture ME Throughout the seasons, the M/D concentration and percentage digestibility for both green and dead were significantly (p<0.0001) higher on farmlet A than on B and C. On the other hand, the pastures on farmlet C demonstrated significantly (p<0.0001) higher M/D value than the pastures on B, and these differences were consistent throughout the sampling time. Similar to pasture dry matter digestibility, the M/D concentration of the pasture on offer followed seasonal trend with the highest concentration recorded in spring and the lowest in winter. The 2003 spring demonstrated significantly higher M/D values than the 2004 spring. Supplement ME In 2000, similar supplementation was given across the farmlets from mid-winter (early pregnancy) through spring (lambing/lactating). During the same period in 2002, more supplementation was given on farmlets A and B than on C. Compared to other years, less supplementation was given during the major responsive period (from pregnancy through lambing/lactating) in 2003, which confirms that there was more available feed-on-offer across the farmlets in 2003 compared to other years. On the other hand, there was a dramatic increase in supplementation during the period of late pregnancy in 2004 when higher supplement levels were given on farmlet A compared to B and C. Generally, the high supplementation that occurred in 2004 was associated with the low pasture growth rate and less available green herbage mass. Animal ME It is well known that intake is influenced primarily by the amount and quality of the pasture the animals are able to consume. While the M/D value of both the pasture on offer and of the ingested diet by livestock grazing under the high input system (farmlet A) was significantly higher compared to those under moderate input systems (farmlets B and C), it was interesting to observe lower diet intake of animals grazing on farmlet A than on farmlets B and C.

The Cicerone Project – May 2006 Symposium 11
The net ME balance The total ME requirement of the different classes of animals was higher on farmlet A, reflecting the higher numbers and average liveweight of the animals on this farmlet compared to farmlets B and C. While the energy requirement of weaners, wethers and cattle increased progressively with increase in liveweight, the energy requirement of ewes markedly increased during pregnancy and lambing/lactation (spring-summer). The net balance between pasture supply and animal demand on the three farmlets indicates several periods of surplus and deficit. There were more periods of feed shortages (negative balance) on farmlet A compared to farmlets B and C, reflecting the high stocking rates and the high demand of these animals with high growth and reproduction rates; this negative balance was more marked during autumn and winter (Figure 1).
DISCUSSION The net ME balance The differences in pasture production between the farmlets confirmed that farmlet A had a significantly higher content of deep-rooted sown pastures, green herbage mass, dry matter digestibility and energy content of pastures compared to farmlets B and C. These differences suggest the influence of both input levels (soil fertility status and sowing of new pastures) and grazing management (stocking rate and grazing period). Nevertheless, the ME demand of all classes of livestock was much higher on farmlet A reflecting its higher stocking rate, growth and reproduction rates and hence was more negative at times suggesting that its pastures have indeed been subjected to more intense pressure than the other farmlets. The net negative balance between pasture supply and animal requirements that occurred in some periods across the three farmlets indicates that periods of feed shortage occurred particularly during the periods of high demand of ewes at pregnancy (autumn/winter) and lambing/lactation (spring). These results have confirmed that balancing the nutrient needs of the animals with the forage supply is a significant challenge because the quality and availability of different forages vary throughout the year, while the nutrient requirements vary considerably between individual animals at different times during their life cycle. In addition animal numbers and their nutritional needs fluctuate widely over the year. This study has enabled the assembly of the supply and demand ME data after the fact. Ideally, these data could be processed in a timely way so that the calculated balances could be used to stocking rate and paddock movement decisions in real time. Regular monitoring of animal performance such as growth rate of lambs, liveweight gains, and fat score of the ewes allows an understanding of animal performance to be developed. Also, frequent and timely assessment of the metabolisable energy of the seasonal herbage on offer to supply the required nutrients can enable an appropriate compromise between supply and demand. From regular calculations of the pasture M/D concentration (MJ ME/kg DM) and the required metabolisable energy (MJ ME/head/day) under different management practices of the Cicerone farmlets, any negative trend of each system’s match between supply and demand could be predicted in a timely way.

The Cicerone Project – May 2006 Symposium 12
Farmlet A Farmlet B Farmlet C
(a)
0
5000
10000
15000
20000
25000He
rbag
e (M
E/ha
)
Green_MEDead_ME
(b)
0
5000
10000
15000
20000
25000
Her
bage
(ME
/ha)
Green_MEDead_ME
(c)
0
5000
10000
15000
20000
25000
Her
bage
(ME/
ha)
Green_ME
Dead_ME
(d)
0
500
1000
1500
2000
2500
Past
ure
supp
ly (M
E/ha
)
Supplement_MEGrowth_ME
(e)
0
500
1000
1500
2000
2500
Pas
ture
sup
ply
(ME
/ha)
Supplement_MEGrowth_ME
(f)
0
500
1000
1500
2000
2500
Pas
ture
sup
ply
(ME/
ha)
Supplement_MEGrowth_ME
0
500
1000
1500
2000
Apr-03
Jun-0
3Aug
-03Oct-
03Dec-0
3Feb
-04Apr-
04Ju
n-04
Aug-04
Oct-04
Dec-04
Feb-05
Ani
mal
dem
and
.
(ME
/ha)
mature-ewes+wethers pregnant-eweslactating-ewes+lambs weaners+hoggetscattle
0
500
1000
1500
2000
Apr-03
Jun-0
3Aug
-03Oct-
03Dec-0
3Feb
-04Apr-
04Ju
n-04
Aug-04
Oct-04
Dec-04
Feb-0
5
Ani
mal
dem
and
.
(ME
/ha)
mature-ewes+wethers pregnant-eweslactating-ewes+lambs weaners+hoggetscattle
0
500
1000
1500
2000
Apr-03
Jun-0
3Aug
-03Oct-
03Dec-0
3Feb
-04Apr-
04Ju
n-04
Aug-0
4Oct-
04Dec-0
4Feb
-05
Ani
mal
dem
and
.
(ME
/ha)
mature-ewes+wethers pregnant-eweslactating-ewes+lambs weaners+hoggetscattle
(j)
-200-100
0
100200300400
500600
Apr-03
Jun-0
3Aug
-03Oct-
03Dec-0
3Feb
-04Apr-
04Ju
n-04
Aug-04
Oct-04
Dec-04
Feb-05
Net
Bal
ance
(ME
/ha)
(k)
-200
-1000
100
200
300400
500
600
Apr-03
Jun-0
3Aug
-03Oct-
03Dec-0
3Feb
-04Apr-
04Ju
n-04
Aug-04
Oct-04
Dec-04
Feb-05
Net
Bal
ance
(ME
/ha)
(l)
-200-100
0100200300400500600
Apr-03
Jun-0
3Aug
-03Oct-
03Dec-0
3Feb
-04Apr-
04Ju
n-04
Aug-04
Oct-04
Dec-04
Feb-05
Net
Bal
ance
(ME
/ha)
Figure 1. Metabolisable energy per ha over a 24 month period (May 2003-April2005) on Farmlets A, B and C showing herbage on offer (a-c), growth (d-f), demand (g-i) and net balance (growth-demand) (j-l).

The Cicerone Project – May 2006 Symposium 13
With timely forage assessment, planned stock flow information and adequate knowledge of seasonal influence, the amount of forage required to support livestock could be calculated and compared to the amount and quality of forage available. At best, animal numbers (stocking rate) and more importantly daily dry matter intake of managed animals should be regulated to harvest the current season’s forage production without damaging future pasture growth and quality. Further, the choice of management system, either flexible or intensive rotational grazing has a greater influence on both pasture and animal production than just increasing fertiliser application or sowing of new pasture species per se. ACKNOWLEDGEMENTS The Cicerone Project is gratefully acknowledged for allowing access to the study site and the experimental animals. A study such as this would not have been possible without the financial support from Australian Wool Innovation. Also the support of the University of New England for a postgraduate studentship is gratefully acknowledged. The authors would like to acknowledge the Cicerone Project for providing access to the study site and the experimental animals. Some of the data used in this study were provided by the Farm Manager, Justin Hoad and the Executive Officer, Caroline Gaden. The guidance and spreadsheets provided by Dr. Mike Freer of CSIRO Plant Industry is gratefully acknowledged.
REFERENCES CSIRO (2005). GrazFeed-managing the nutrition of sheep and cattle. CSIRO Australia, Victoria.
Freer M., Moore AD and Donnelly JR. (1997) GrazPlan: Decision support systems for Australian grazing enterprises. II. The animal biology model for feed intake, production and reproduction and the GrazFeed DSS, Agricultural Systems 54, 77-126.
SCA (1990) Feeding standards for Australia livestock. Ruminants, CSIRO, Australia, Melbourne.
Scott JM (2003) Measuring whole-farm sustainability and profitability at a credible scale. In 'Agriculture for the Australian Environment: Proceedings of the Fenner Conference on the Environment.' (Eds BP Wilson and A Curtis) pp. 291-298. (Charles Sturt University.)

The Cicerone Project – May 2006 Symposium 14
REALISING PRODUCTION POTENTIAL FROM MERINO ENTERPRISES – WHICH PRODUCTION SYSTEM? THE CICERONE PROJECT, CHISWICK, URALLA, NSW. MICHAEL LOLLBACK A, SUE HATCHER B, AND CLARE EDWARDS C, A District Livestock Officer (Sheep and Wool), NSW DPI, Tamworth B Senior Research Scientist, NSW DPI, Orange. C Extension Agronomist, NSW DPI, Armidale.
INTRODUCTION The aim of this paper is to provide an overview of the performance of the three farmlets in the Cicerone Project for a range of major production parameters and performance indicators. These farmlets have been subjected to different management systems which have delivered varying performances in production levels. The Cicerone farmlets are located at the CSIRO Chiswick Research Centre mid way between Uralla and Armidale on the New England Tablelands. When the farmlets were originally set up careful planning and design ensured that the farmlets contained near identical areas of similar soil types and topography. The prior fertiliser history of each paddock was also considered in allocating land areas to each farmlet. The location of the farmlets in close proximity to each other also ensures that each experiences the same climatic conditions. The Merino flock that is used to stock the farmlets is based on the same genotype ensuring that the sheep run on each farmlet are of equal genetic merit. Consequently the production differences between the farmlets are due to the different management systems. The variation in the production performance also reflects the degree to which each system has realised the genetic potential of the sheep.
THE CICERONE FARMLETS The Cicerone farmlets (A, B & C) are each 54 Ha. The management regime on farmlet B (control treatment) mimics the production system of many New England properties. It is based on a low input system with 8-10 paddocks and has a target stocking rate of 7.5dse/ha. Target soil phosphorus level is 20 mg/kg (bicarbonate extract) and 6.5mg/kg sulphur and uses a flexible grazing management system based on Prograze principles (i.e. the use of pasture assessment to assist sheep movement and supplementary feeding decisions). Farmlet A has the same number of paddocks as farmlet B but has a target stocking rate of 15dse/ha. It is a high input system with a target of 100% sown pastures and soil fertility levels of 60mg/kg phosphorus and 10 mg/kg sulphur. The grazing management system is the same as for farmlet B. Farm C has the same target soil nutrient levels as B but is subjected to an intensive rotational grazing management system involving short graze and long rest periods. The system initially involved 16 paddocks which was increased to 33 to increase the length of rest periods. It has a target stocking rate of 15dse/ha.
PRODUCTION PARAMETERS The production parameters that will be discussed are:
1. Stocking rate 2. Greasy wool production per hectare 3. Adult ewe wool production per head (GFW and FD) 4. Hogget wool production at first shearing (12 months).

The Cicerone Project – May 2006 Symposium 15
5. Adult ewe body weight 6. Adult ewe fat scores 7. Ewe weight and fat score at first joining (18 months) 8. Conception rates (scanning results) 9. Lamb marking and weaning percentages
Stocking rate The target stocking rate and the actual stocking rates for each farmlet are presented in Table 1. These calculations include all sheep and cattle that were run on each farmlet over the years 2001 to 2006.
Table 1. Average annual stocking rate (DSE/ha) on the Cicerone Farmlets 2001-2006.
Farm Target Stocking Rate
Actual Stocking Rate (5 yr Ave.)
Actual Stocking Rate (6 yr Ave.)
A 15 11.8 12.2
B 7.5 9.2 9.4
C 15 8.9 9.1
Greasy wool production per hectare The average amount of greasy wool produced per hectare per year is presented in Figure 1 for the years 2000 to 2005.
0
5
10
15
20
25
30
35
2001 2002 2003 2004 2005
Woo
l pro
duce
d/ha
(kg)
ABC
Figure 1. Greasy wool production (kg) per hectare per year 2000 - 2005 Source: Andrew
Alford pers. comm.
Wool production per head (greasy fleece weight and fibre diameter) The average wool production per head for the years 2001 to 2005 is presented in Figure 2. The average GFW of all ewes in farmlet A and farmlet B was 3.1 kg while those in farmlet C cut 2.8 kg. There was no difference between farmlets A & B but farmlet C ewes cut significantly less wool than the other two farmlets.

The Cicerone Project – May 2006 Symposium 16
Ewes - Greasy fleece weight
0.0
0.5
1.0
1.5
2.0
2.5
3.0
3.5
4.0
4.5
A 2001 A 2002 A 2003 A 2004 A 2005 B 2001 B 2002 B 2003 B 2004 B 2005 C 2001 C 2002 C 2003 C 2004 C 2005
Farm Year
GFW
(kg)
Average GFW (kg): Farm A - 3.1 a Farm B - 3.1 a Farm C - 2.8 b
Figure 2. Average wool production (GFW) per head.
The annual average fibre diameter for the adult ewes is presented in Figure 3 and the analysis indicates that there is a significant difference between farmlet A (18.8 µm) and farmlets B & C (18.6 and 18.5 µm respectively).
Ewes - Fibre diameter
16.5
17.0
17.5
18.0
18.5
19.0
19.5
20.0
A 2001 A 2002 A 2003 A 2004 A 2005 B 2001 B 2002 B 2003 B 2004 B 2005 C 2001 C 2002 C 2003 C 2004 C 2005
Farm Year
Fibr
e di
amet
er (u
m
Average FD (µm): Farm A - 18.8 a Farm B - 18.6 b Farm C - 18.5 b
Figure 3. Average adult ewe fibre diameter 2001-2005
Hogget wool production (GFW and FD) The greasy fleece weight of hogget ewes (11 months old) from farms A & B were similar (2.0 and 1.9 kg respectively) and significantly higher than farmlet C hoggets (1.7 kg).
Hoggets - Greasy fleece weight
0.0
0.5
1.0
1.5
2.0
2.5
3.0
A 2001 A 2002 A 2003 A 2004 A 2005 B 2001 B 2002 B 2003 B 2004 B 2005 C 2001 C 2002 C 2003 C 2004 C 2005
Farm Year
GFW
(kg)
Average GFW (kg): Farm A - 2.0 a Farm B - 1.9 b Farm C - 1.7 c
Figure 4. Average greasy fleece weight of hogget ewes.

The Cicerone Project – May 2006 Symposium 17
The average fibre diameter of ewes at their first shearing (11 months of age) from farmlet A was 17.2 µm, farmlet B 17.0 µm and farmlet C 16.8 µm (Figure 5) There was no significant difference between farmlets B and C in hogget average fibre diameter, ewe hoggets from these two farmlets grew wool that was significantly finer than farmlet A.
Hogget - Fibre diameter
14.5
15.0
15.5
16.0
16.5
17.0
17.5
18.0
18.5
19.0
A 2001 A 2002 A 2003 A 2004 A 2005 B 2001 B 2002 B 2003 B 2004 B 2005 C 2001 C 2002 C 2003 C 2004 C 2005
Farm Year
Fibr
e di
amet
er (u
m
Average FD (µm): Farm A - 17.2 a Farm B - 17.0 b Farm C - 16.8 b
Figure 5. Average hogget fibre diameter 2001 to 2005.
Ewe body weight performance Figure 6 presents body weight profiles for adult ewes based on bodyweights recorded at weaning (December), joining (April), pregnancy scanning (July i.e. day 90-100 of pregnancy) which is also immediately prior to the pre lambing shearing. The graph indicates that in each management system weaning is the lowest bodyweight point but the animals gain weight during the period from weaning to joining. The actual bodyweight attained by joining time varies between farmlets with farmlet A performing better than B & C in most years. The combination of pre lambing shearing and the demands of late pregnancy and lactation result in significant weight loss in all systems in the late pregnancy and early lactation period. The extent of weight loss varies between years/seasons and management systems.
Ewe Bodyweights
30
35
40
45
50
55
60
Nov-00
Jan-0
1
Mar-01
May-01
Jul-0
1
Sep-01
Nov-01
Jan-0
2
Mar-02
May-02
Jul-0
2
Sep-02
Nov-02
Jan-0
3
Mar-03
May-03
Jul-0
3
Sep-03
Nov-03
Jan-0
4
Mar-04
May-04
Jul-0
4
Sep-04
Nov-04
Jan-0
5
Mar-05
May-05
Jul-0
5
Sep-05
Nov-05
Jan-0
6
Date
Bod
ywei
ght (
kg)
Farm A Farm B Farm C
* *********** * *************** ******
Figure 6. Adult ewe bodyweights on the Cicerone Farms 2000 – 2006.
Adult ewe fat scores Figure 7 displays the fat score profiles based on scores recorded at weaning, joining and pregnancy scanning (day 90-100 of pregnancy). In each system ewes reach the lowest fat score at weaning time but are able to recover fat score by joining. The major issue for each system is the degree of fat score recovery during the weaning to joining period and the systems ability to

The Cicerone Project – May 2006 Symposium 18
maintain adequate fat scores throughout early and mid pregnancy and the critical last 50-60 days of late pregnancy and early lactation.
Ewe Fat Score
1.0
1.5
2.0
2.5
3.0
3.5
Nov-00
Jan-0
1
Mar-01
May-01
Jul-0
1
Sep-01
Nov-01
Jan-0
2
Mar-02
May-02
Jul-0
2
Sep-02
Nov-02
Jan-0
3
Mar-03
May-03
Jul-0
3
Sep-03
Nov-03
Jan-0
4
Mar-04
May-04
Jul-0
4
Sep-04
Nov-04
Jan-0
5
Mar-05
May-05
Jul-0
5
Sep-05
Nov-05
Jan-0
6
Date
Fat s
core
Farm A Farm B Farm C
* * ** * *** ****** ***Joining
Preg.scanWeaning
Figure 7. Adult ewe fat scores
To ensure adequate nutrition of both the ewe and the developing lamb, fat score targets or profiles have been developed using data from the National Lifetime Wool Project. The target fat score profile for the New England Tablelands production system is presented in Figure 8.
1.0
1.5
2.0
2.5
3.0
3.5
4.0
4.5
5.0
-60
-30
joining 30 60 70 90 12
0
lambing 18
020
021
0
weaning 27
030
0
Fat s
core
Figure 8. Recommended fat score profile for Merino breeding enterprises on the New
England Tablelands (autumn joining/spring lambing).
To obtain a measure of the ability of each management system to provide adequate nutrition for the breeding ewe the fat score profiles of the Cicerone farmlets for single and twin bearing ewes (2003-2005) are benchmarked to the profiles developed in the Lifetime Wool Project (Figure 9). The consequences of not achieving these targets or profiles can be significant for both the performance of the ewes and their progeny (Hatcher et al. 2006).
Scanning
Shearing

The Cicerone Project – May 2006 Symposium 19
1.0
1.5
2.0
2.5
3.0
3.5
4.0
4.5
5.0
-60 -30joi
ning 30 60 70 90 12
0
lambin
g18
020
021
0
weanin
g27
030
0
Fat S
core
Farm A Farm B Farm C
Lifetime Wool Target Fat Score Profile
a)
1.0
1.5
2.0
2.5
3.0
3.5
4.0
4.5
5.0
-60 -30joi
ning 30 60 70 90 12
0
lambin
g18
020
021
0
weanin
g27
030
0
Fat S
core
Farm A Farm B Farm C
Lifetime Wool Target Fat Score Profile
b)
Figure 9. Fat score profiles for a) single and b) twin bearing ewes on the Cicerone
farmlets (2003-2005).
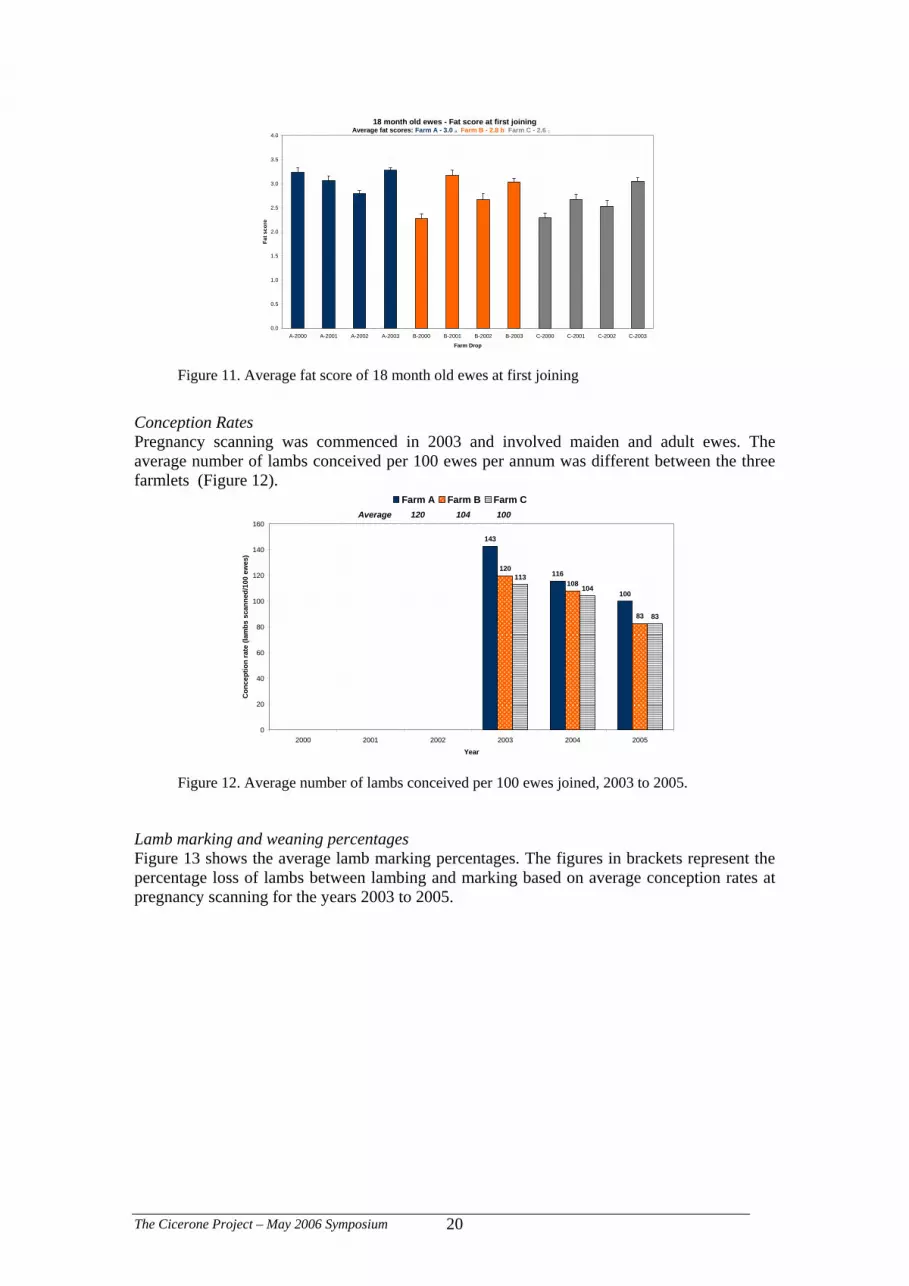
Ewe weight and fat score at first joining (18 months) Figure 10 shows the average bodyweight of 18 month old ewes for farmlets A & B is higher and significantly different to farmlet C.
18 month old ewes - Bodyweight at first joining
0
10
20
30
40
50
60
A-2000 A-2001 A-2002 A-2003 B-2000 B-2001 B-2002 B-2003 C-2000 C-2001 C-2002 C-2003
Farm Drop
Bod
ywei
ght (
kg)
Average weights: Farm A - 45.0 kg a Farm B - 43.0 kg b Farm C - 40.1 kg c
Figure 10. The average bodyweight of 18 month old ewes at first joining
Similarly ewes from Farms A and B were significantly fatter than ewes from farmlet C (Figure 11).
The Cicerone Project – May 2006 Symposium 20
18 month old ewes - Fat score at first joining
0.0
0.5
1.0
1.5
2.0
2.5
3.0
3.5
4.0
A-2000 A-2001 A-2002 A-2003 B-2000 B-2001 B-2002 B-2003 C-2000 C-2001 C-2002 C-2003
Farm Drop
Fat s
core
Average fat scores: Farm A - 3.0 a Farm B - 2.8 b Farm C - 2.6 c
Figure 11. Average fat score of 18 month old ewes at first joining
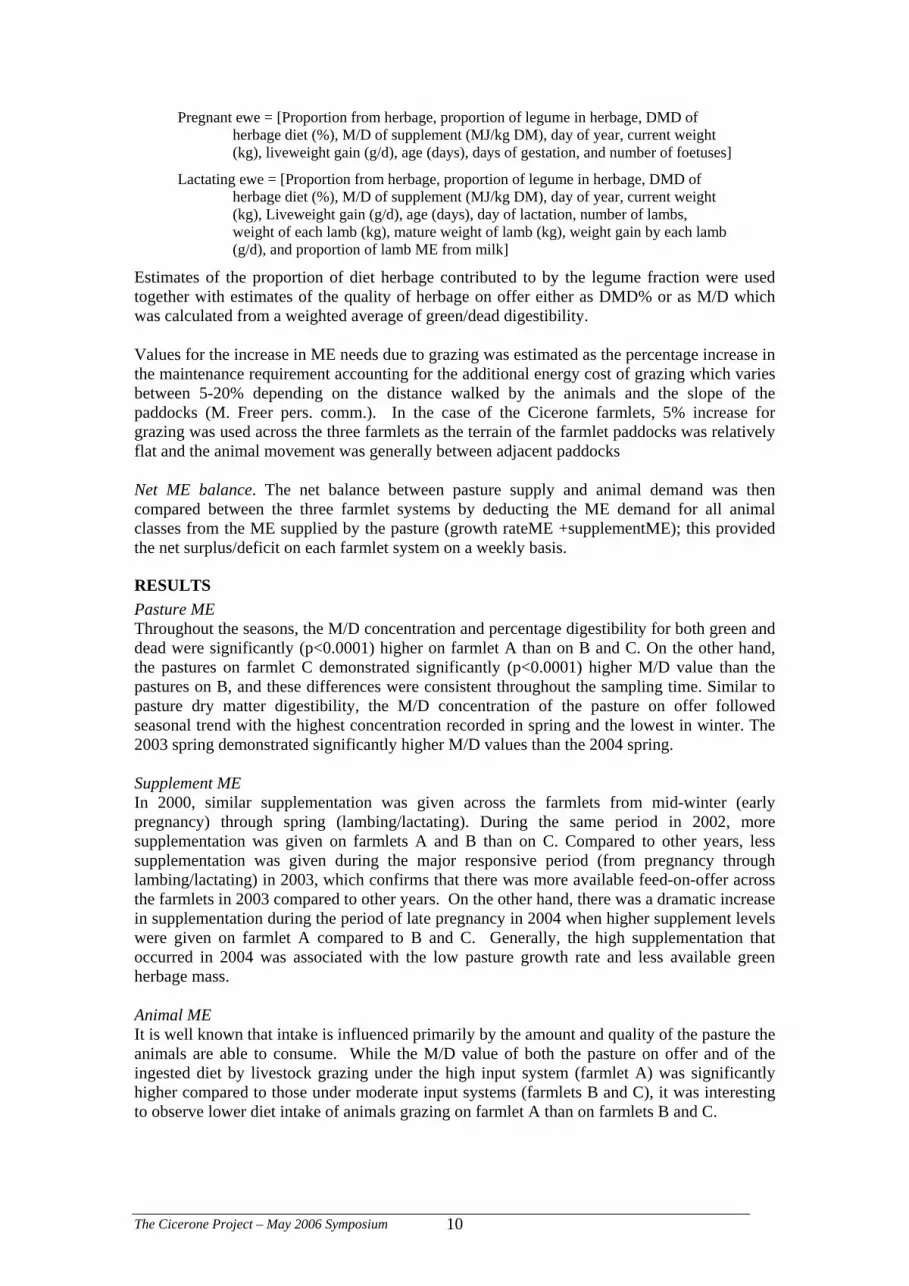
Conception Rates Pregnancy scanning was commenced in 2003 and involved maiden and adult ewes. The average number of lambs conceived per 100 ewes per annum was different between the three farmlets (Figure 12).
143
116
100
120
108
83
113104
83
0
20
40
60
80
100
120
140
160
2000 2001 2002 2003 2004 2005
Year
Con
cept
ion
rate
(lam
bs s
cann
ed/1
00 e
wes
)
Farm A Farm B Farm C Average 120 104 100
Figure 12. Average number of lambs conceived per 100 ewes joined, 2003 to 2005.
Lamb marking and weaning percentages Figure 13 shows the average lamb marking percentages. The figures in brackets represent the percentage loss of lambs between lambing and marking based on average conception rates at pregnancy scanning for the years 2003 to 2005.

The Cicerone Project – May 2006 Symposium 21
55
90
64
8185
73
56
84
74
92 90
69
48
82
63
77
84
64
0
10
20
30
40
50
60
70
80
90
100
2000 2001 2002 2003 2004 2005
Year
Mar
king
%
Farm A Farm B Farm C Average 79 (39.9) 82 (20.0) 74 (25.0)
Figure 13. Average annual lamb marking percentage.
Weaning Percentages Figure 14 shows the average annual weaning percentages. The figures in brackets are the average percentage loss of lambs between marking and weaning.
55
89
64
7982
66
56
83
74
92
85
65
48
82
63
77
84
63
0
10
20
30
40
50
60
70
80
90
100
2000 2001 2002 2003 2004 2005
Year
Wea
ning
%
Farm A Farm B Farm C Average 72 (-7 ) 76 (-6) 70 (-4)
Figure 14. Average annual weaning percentages for farmlets A, B and C.
PRELIMINARY ECONOMIC OUTCOMES FROM THE CICERONE FARMLETS A project to analyse the economic outcomes from the three farmlets is in progress (F. Scott 2006 pers. comm.) and results will be published later this year. The project will cover the individual farmlet results including production outcomes, key profit drivers, income, costs and gross margins. The key profit drivers include stocking rate, stock trading income (sheep and cattle), wool income and variable costs. The individual farmlet results will also be scaled up and modelled on a commercial scale farm of 920 hectares. Gross margins and cash flow details will be analysed for this model. The model involves an owner operator so the labour costs associated with the Cicerone farmlets will be removed. Casual labour as required and allowances of $51,000 for overhead costs and $48,000 for owner operator labour are included in the model (Alford et al. 2003). As part of the pasture improvement program it is assumed that farmlet A purchases a direct drill in year 1 for $25,000 and that spraying and sowing is carried out by the owner operator. On farmlets B and C the owner operator carries out the spraying but pasture sowing is done on a contract basis.

The Cicerone Project – May 2006 Symposium 22
CONCLUSION This paper has attempted to highlight and discuss some production parameter differences between the Cicerone farmlets . The information presented also explains some of the reasons behind the differences. Issues associated with sustainability need to be examined in far more detail before a decision can be made about the long-term success of the production systems used on each of the farmlets . The economic analysis when it is published will provide essential insights into the financial performance of the production systems used on each farm. The combination of production, economic and sustainability data will enable producers to assess the appropriateness of a range of features of the production systems to their properties and business goals.
REFERENCES Alford AR, Griffith G and Davies L (2003) Livestock Farming Systems in the Northern Tablelands of
NSW: An Economic Analysis, Economic Research report 12, NSW Agriculture, Orange.
Alford AR, Griffith G and Cacho O (2004) A Northern Tablelands Whole-Farm Linear Program for Economic Evaluation of New Technologies at the Farm Level, Economic Research report 13, NSW Agriculture, Armidale
Hatcher S, Edwards C, Graham P, Johnson P, Lollback M, Martin S, Mason J and Thornberry K (2006) Lifetime wool - implementing the guidelines in NSW Merino flocks, in Proceedings of Cicerone 2006 Symposium: The Cicerone Farms – Coming to Conclusions, Ed. JM Scott, The Cicerone Project, Chiswick NSW
Scott JM. Ed (2005) Proceedings of Cicerone 2005 Symposium: The Cicerone Farms: Under the Microscope, Ed. JM Scott, The Cicerone Project Inc, Chiswick NSW and the Centre for Sustainable Farming Systems, University of New England NSW
Scott F (2006) Economic Outcomes from the Three Farmlets, in Proceedings of Cicerone 2006 Symposium: The Cicerone Farms – Coming to Conclusions, Ed. JM Scott, The Cicerone Project, Chiswick NSW

The Cicerone Project – May 2006 Symposium 23
A PRODUCER’S PERSPECTIVE I PHILLIP DUTTON (Producer Board Member) “Goomallee”, Uralla, NSW, 2358. Phillip Dutton explained his long-term position as a board member of Cicerone and his involvement in his family farm, “Goomallee”.
WHAT HAVE I LEARNED FROM CICERONE? I have not adopted any farmlet system as a whole but rather, have used snippets of information that have come from any and all of the farmlets over time. Some of the information I have learned from the Cicerone Project includes:
• Worm Control. To rotate stock rather than set stock which leads to fewer use of drenches, less opportunities for drench resistance and cleaner pastures.
• Off-shears Treatment. Use of cover combs and/or rugging, hosing down or weight losses etc.
• Footrot Research. The development of a new DNA test for virulent or benign footrot infections. This has been one of the most important outcomes of the Cicerone Project.
• Sustainability. Farm A is thus far economically unviable trying to improve its pastures so quickly with such high levels of investment. On farmlet B the pastures tend to be unsustainable as we are losing the most valuable species over time. On farmlet C, the pastures seem to be holding quite well but the stock have not been benefiting. Cicerone is in the early stages of helping us to understand the sustainability of whole farms.
• Mulesing Days. The extent of the mulesing operation and the rate of healing and the skin type of sheep have produced some very interesting findings. For example
Having a local research facility is of great value as we often hear messages such as, “when the autumn break occurs” from down South! In Northern New South Wales we very rarely have a valuable autumn break and hence many of the messages from southern research can be seen as irrelevant to our local district. Over the years we have all heard the criticisms about how the three farmlets are run. No-one runs their property like anyone else; they are all different, and Cicerone is no exception. No-one has yet run the perfect farm; we are still learning and will continue to do so. At least with Cicerone, everything that is done is measured and recorded so when things do turn out right or don’t turn out right we can try to analyse the information to suggest changes and ways to improve the management of our farms. The farm manager and Board try to run the farmlets as a commercial concern using best industry practice principles and up-to-date research data. The results achieved by Cicerone are there for all to see, warts and all, so it can be used as a solid benchmark to compare our own operations against. One of the main things I get out of Cicerone is at the seminars and the field days. The speakers are thought-provoking and even if I don’t directly use their information, I start thinking things over and see things from a different perspective. Cicerone is a great place for farmers to get away from our own little patch and see what is happening elsewhere.

The Cicerone Project – May 2006 Symposium 24
A PRODUCER’S PERSPECTIVE II MARK WATERS (Producer Board Member) “Riverton” Grafton Rd., Armidale, NSW 2350 It is interesting to have farmer led ideas to trial three different farm types, side-by-side. To see how they compare to each other, under the same conditions. It is interesting to see how, and by how much, they have altered. It is enlightening to have data that shows that farms are productive, to show that others are more profitable and to witness any mistakes that may have been made. Using regular measurements, we know which paddocks are most productive and can target their use. We can target inputs of seed and fertiliser to those in most need. The trials have revealed sound information as to which farm type has the best worm control. Some lessons learned: Farm A
• too much sown pasture established too quickly (costly) • too few paddocks and the operation was too rigid as it lacked flexibility.
Farm B • selective grazing with long graze periods has led to the pasture losing its introduced
grasses. This may lead to environmental concerns in future. Farm C
• Too long a rest period led to low animal performance; shortening the rest period has improved animal performance.
• The way the project was set up (so that the farms were as equal as possible) has meant that stock need to be walked too much between paddocks.
A range of issues were able to be studied on producers’ initiatives.
• Off-shears shearing trial • Footrot research • Mulesing trials • Farm planning • Pasture and soils • Wool marketing
But, the best has come from producers who gave their time and thoughts to question, to learn, to interpret, to adopt and be prepared to come back for more.

The Cicerone Project – May 2006 Symposium 25
CICERONE FARM MANAGER’S PERSPECTIVE JUSTIN HOAD Farm Manager, The Cicerone Project Inc. I have been managing the Cicerone farmlets since July 2000. In that six year period I have been in a position to possibly learn more than any one else. The following points are my observations and interpretations of the ABC farmlets. Farmlet B was run to represent typical district practice. It has achieved reasonable stock performance, average gross margins and a good short term cash flow. The management is the easiest of the three farmlets. It has low inputs of capital and labour and is low risk. These are probably the reasons that many wool producers choose this approach. The risk, as I see it, is that long term sustainability and profitability are not clear. Over our short six year trial there has been a marked decline in the desirable pasture species, with apparent transfer of nutrients to the camps and considerable Barber’s Pole worm burdens. All of these problems are related to the low stock density grazing and long grazing periods, allowing a high degree of selective grazing by the stock. These effects may lead to unsustainable drenching programs and stocking rates may have to be reduced. If the trial was given another five years, these effects may manifest themselves into measurable outcomes. Farmlet A was run to push the boundaries of an improved pasture/high inputs and high stocking rates/production outputs system. This farmlet has achieved 1 ½ times the stocking rates of the B & C farmlets. Most paddocks have been resown on the farmlet A in that six year period, by up to 20 % of the area sown in any one year. This was shown to be over-optimistic in dry years and exposed the farmlet to higher risk. Having said that, all of the pastures sown since 2001 had a satisfactory establishment, but have been put under too much subsequent grazing pressure from sheep. Most aspects of stock production on farmlet A were improved compared to the B & C farmlets. The costs were substantial, with high capital applications of fertilizer, sowing costs and paddocks out of production during sowing. With the run of below average seasons, these costs proved overwhelming and despite high gross margins the cash flow was severely negative. If the trial were to run longer through some better seasons and higher commodity prices this farmlet is poised to take most advantage. The risks associated with this approach are high. Possible soil erosion, when bare ground is exposed during sowing, is perhaps the biggest long-term risk. Due to high stocking rates and high pasture utilization, there has been minimal plant litter laid down on the soil surface to protect it from raindrop impact or to improve organic carbon levels and microbial activity. Unfortunately, Cicerone has not yet been funded to measure any of these effects. We only have the surrogate measure of ground cover. To date, all farmlets have been managed to retain over 70% ground cover. Farmlet C uses a high stock density, grazing management technique. There are many commercial names or techniques with similar ideas of mob stocking to achieve short grazing periods and long rest periods. Every manager would have a slightly different set of values and ideals which affect the way they make decisions on which combination of stock to use and triggers they use to decide on the graze and rest periods and stocking rates. Farmlet C started with 16 paddocks, increased to 33 and now has 40 paddocks with further subdivision using temporary electric fences periodically used. This increase in paddock number has improved the grazing management and the stock performance. Rest periods are

The Cicerone Project – May 2006 Symposium 26
based on plant recovery with the aim of letting the perennial grasses recover to their potential from that growth period. Rest periods have varied from 60 days during fast growth periods, e.g. spring, to 200 days during droughts. These are rather on the long side, allowing new plants to establish but lowering pasture digestibility and subsequent stock performance. This pulse grazing, then rest and recovery, has retained the desirable pasture species better than the A & B farmlets. Farmlet A has managed to increase and maintain higher proportion of desirable species, but only by regular sowing new pastures. This long rest has also to some extent broken the Barber’s Pole life cycle reducing the reliance on drenches. The high stock density has caused much trampling of pasture, creating a litter layer on the soil of lodged plants. The short-term effects of these improvements have not led to economic gain. This treatment needs to continue to ascertain the long-term effects on sustainability, stocking rates and profitability. I would surmise that improving the soil health by increasing the amount of perennial pastures and reducing the reliance on chemicals should lead to a higher net worth for farmers.
DISCUSSION I do not think that farmers would or should take any one of these treatments as an ‘off the shelf’ management technique; rather, they need to be trialed separately for a longer period to show the outcomes of the manager’s actions and inputs. The farmlets have started to show some trends, but have probably raised more questions than provided answers. Long-term profitability and sustainability outcomes cannot be measured in six dry years. More environmental measures need to be taken to ascertain the effects of the farmlet treatments both on and off farm.

The Cicerone Project – May 2006 Symposium 27
SOIL FERTILITY AND LONG TERM FERTILISER MANAGEMENT ON THE CICERONE FARMLETS GUPPY, C.N.A A Centre for Sustainable Farming Systems, School of Rural Science and Agriculture, University of New
England, NSW, 2351
TAKE HOME MESSAGES • All farmlets have reached their target soil fertility levels and strategic fertiliser
applications need to be maintained • Farmlets B and C are operating at a P deficit and soil fertility is unlikely to be
sustainable over time • There is a low risk of environmentally damaging nutrient losses but further
assessment is critical.
SUMMARY The Cicerone Project includes a study of 3 farmlets each with management systems contrasting in inputs (levels of fertilisers and pastures) and grazing management. Farmlet A has soil fertility targets of 60 mg/kg phosphorus (Colwell P) and 10 mg/kg sulfur (KCl40 S), whilst farmlets B and C have targets of 20 mg/kg P and 6.5 mg/kg S. All three farmlets have been managed successfully to meet these targets, although there is a decline in soil P levels, and hence pasture responsiveness, over the last two seasons. Other indices of soil fertility are within acceptable limits for plant growth. Assessment of the Cicerone project farmlets using a newly developed Farm Nutrient Loss index revealed the risk of environmental loss of nutrients to be low however further research is necessary to ground truth and measure if this is in fact the case. Keywords: Colwell P, available S, fertiliser management
INTRODUCTION The Cicerone Project farm is located at “Chiswick” CSIRO, some 18 km south of Armidale NSW (lat: S 30.52, long: E 151.67). The project aims to compare three farmlets with respect to economic and environmental sustainability. Prior to the establishment of the three farmlets (50 ha each), soil testing was undertaken to identify and allocate plots based on similarity of soil drainage characteristics, slope and starting fertility to ensure statistical validity. The paddocks allocated to farmlet A were placed under a high input/high stocking rate management strategy; those allocated to farmlet B were placed under a medium input/moderate stocking rate strategy; and farmlet C was placed under a medium input/moderate stocking rate/intensive rotational grazing management regime. Relative uniformity prior to application of management strategies was achieved. The purpose of this paper is to summarise the changes in soil fertility over time and gain some understanding of the sustainability of each farmlet with respect to soil fertility. Further comment will be made on the production and environmental implications of the soil test information.
MATERIALS AND METHODS Soil fertility management can be found in the previous Cicerone symposium publication and the reader is referred to it for details. The aim of this paper is to demonstrate trends in soil fertility status over time. Graphical presentations therefore focus on means and standard errors of each factor at each sampling date and have been updated to include the latest soil test results. The Cicerone database was used to determine and calculate the average grazing pressure (DSE/ha) for each farmlet for sustainability calculations. It should be noted that grazing pressure increased over the life of the project, ranging from 8-9 DSE/ha initially, to over 16 DSE/ha by the end on farmlet A.

The Cicerone Project – May 2006 Symposium 28
RESULTS AND DISCUSSION Changes in soil P and S status Target fertility levels were generally met in 3 out of the 5 years that soil sampling was undertaken (excepting farmlet A in 2001 as significant P fertilisation was required to raise the Colwell P level to near 60 mg/kg) (Figure 1). The exception to this consistent control of soil fertility occurred in 2003 when all three farmlets experienced spikes in Colwell P and KCl40 S levels before returning to near target levels. These spikes are associated with P and S mineralisation following soil sampling after significant rainfall, as discussed in the previous Symposium proceedings. Removing the spiked samples from consideration shows that whilst P management is adequate with fertility at or near target levels, KCl40 S levels in all three farmlets are slowly decreasing.
Figure 1: Mean (±SE) Colwell P and KCl40 S levels (mg/kg) from establishment of high
input farmlet A (▲), moderate input farmlet B (●) and moderate input farmlet C (■) over five years at Cicerone on the New England tablelands. Target fertility levels for farmlet A (60 P and 10 S), and farmlets B and C (20 P and 6.5 S) indicated on graphs with dotted lines.
Sustainability To quantify the sustainability of soil fertility targets on the Cicerone farmlets, a comparison was made of the grazing pressure and P fertiliser application to each farmlet to get a working nutrient balance (Table 1). Maintenance P was determined using the known values for keeping soil fertility P levels constant on the NE Tablelands (1.1 kg P/DSE/ha/yr) (M. Duncan and G. Blair, pers. comm.).
Table 1. Calculated phosphorus balance for each farmlet over the past 5 years.
Average DSE/ha (d)
Maintenance P (kg)
P applied (kg/ha)
Difference
Farmlet A 11.1 73 97 +24
Farmlet B 8.4 56 24 -32
Farmlet C 8.4 56 20 -36
Over the life of the Cicerone project, farmlets B and C have been operating at a P deficit equivalent to approximately 400 kg superphosphate. In contrast, farmlet A has P in the soil ‘bank’ and should therefore have increased its base soil fertility levels. Comparison of these results with measured P levels demonstrates the increase in P concentration on farmlet A, and the slow, but increasingly precipitous decline in soil P levels on farmlets B and C (Figure 1). Soil tests indicated that the major differences between the farmlets were evident mainly in surface P levels, hence it is reasonable to assume that these P levels will drive soil fertility status and be reflected in pasture response when the season breaks, (and the universally
Year
2000 2001 2002 2003 2004 2005 2006 2007
Col
wel
l P (m
g/kg
)
0
20
40
60
80
100
Farmlet AFarmlet BFarmlet C
Year
2000 2001 2002 2003 2004 2005 2006 2007
KCl 4
0 su
lfur (
mg/
kg)
0
5
10
15
20
25
Farmlet AFarmlet BFarmlet C

The Cicerone Project – May 2006 Symposium 29
limiting nutrient (water) is supplied). Where soil fertility levels were long-established, the growth rate of pastures in response to the seasonal break in late 2005 was significantly different (Figure 2). Pastures in farmlets B and C grew at little more than half the rate of pasture on farmlet A. This result implies that soil P levels on farmlets B and C are sub-optimal and would respond more vigorously if more P was supplied.
Figure 2: Growth rate (kg/ha/d) of ungrazed pastures from each of the high input farmlet A (▲), moderate input farmlet B (●) and moderate input farmlet C (■) over six years at the Cicerone farms on the Northern Tablelands (Shakhane and Scott, pers. comm.).
Does this tally with district experience? Two surveys by Clare Edwards and Mick Duncan (2000;2002) of the soil fertility status of Tablelands soils concluded that roughly 90% of soil in this district was P responsive; defined as having a surface P level of <20 mg/kg when extracted with a Bray test. Converting this Bray value to a Colwell value for comparison, roughly corresponds to a Colwell P level between 35-40 mg/kg (Kemp et al., 1985). Hence, the muted pasture responses observed on farmlets B and C are more than likely caused by lower P in the soil, and the growth rate in farmlet A is the maximal response that could be obtained (as farmlet A is well above this threshold of 35-40 mg/kg of P). Management of P and S levels has been the main soil fertility focus of the Cicerone project because of its known importance to the healthy establishment of legumes in pastures. It is difficult to establish healthy grass-legume swards where P and S levels are low. Without healthy legumes in the system, nitrogen fixation and hence N transfer to the grasses in pastures is severely hampered and water use efficiency of the grazing system is reduced. Healthy P and S levels in pastures will drive organic matter cycling in the soil, as higher carbon inputs will be achieved from healthy pastures than from degraded pastures. Were Cicerone to be continued, further research may focus on measuring and comparing the organic matter cycling in each of the farmlets; quantifying both changes in soil C levels, and changes in water use efficiency in each of the systems established. Inherent to the Cicerone project’s goals to identify the best economic and environmentally sustainable conditions for wool production in the New England, some estimate of the environmental risk of agricultural production is important. In 2004, the Cicerone farmlets were examined as a test site using the Better Fertiliser Decisions (BFD) Farm Nutrient Loss Index (FNLI) being developed by Andrew Smith and Alice Melland of the Victorian Department of Primary Industries. Enough data was collected to fill most of the categories in this new index for producers to allow conclusions to be drawn on environmental risk arising from the different nutrient management strategies. Encouragingly for the Cicerone project, even farmlet A, with high nutrient input, intensive pasture renovation and management and high stocking rates was considered a low environmental risk. Significant opportunities exist to
0
20
40
60
80
Dec-20
02
Mar-20
03
Jun-2
003
Sep-20
03
Dec-20
03
Mar-20
04
Jun-2
004
Sep-20
04
Dec-20
04
Mar-20
05
Jun-2
005
Sep-20
05
Dec-20
05
Mar-20
06
Jun-2
006
Gro
wth
rate
(kg/
ha/d
)
Average AAverage BAverage C

The Cicerone Project – May 2006 Symposium 30
confirm the preliminary results of this index through monitoring of phosphorus and nitrogen loads in the catchment into which the farmlets drain. In conclusion, it is possible to manage soil fertility to meet targets and to monitor changes in soil fertility over time. From a soil fertility perspective however, successful management of Farmlet A will continue to provide the soil fertility base to sustain high pasture growth rates, while Farmlets B and C will increasingly senesce. Other measures of sustainability need to be collected and collated to examine these findings from the perspective of the whole farm system.
ACKNOWLEDGMENTS Thanks go to Mr. Justin Hoad, the farm manager of the Cicerone Project farmlets for collection of the soil samples and maintenance of the records of fertiliser management and the database team for successfully compiling a complex dataset. The Cicerone Project is supported by Australian Wool Innovation.
REFERENCES Blair GJ, Chinoim N, Lefroy RDB, Anderson GC, and Crocker GJ (1991) A soil sulphur test for
pastures and crops, Australian Journal of Soil Research 29, 619-626
Colwell JD. (1963) The estimation of the phosphorus fertiliser requirements of wheat in southern New South Wales by soil analysis, Aust. J. Exp. Agric. Anim. Husb. 3, 190-197
Edwards C and Duncan M (2000) A review of 700 soil samples collected in the Armidale district between 1989-1999, in Proc. 15th Ann. Conf. Grassland Soc. NSW, 108-109
Edwards C and Duncan M. (2002) Extension activities improve producer awareness of soil health, in Proc. 17th Ann. Conf. Grassland Soc. NSW, 48-49
Kemp DR, McDonald WJ and Murison RD (1985) Temporal variation in the results of soil phosphate analyses, Aust. J. Exp. Agric. 25, 881-885
Email: [email protected]

The Cicerone Project – May 2006 Symposium 31
INTENSIVE ROTATIONAL GRAZING AND IT’S ROLE AS A TOOL FOR BARBER’S POLE WORM CONTROL IN THE NEW ENGLAND COLVIN, A.F.AB, WALKDEN-BROWN, S.W.BA A Sheep Industry CRC B Centre for Animal Health and Welfare, School of Rural Science and Agriculture, University of New
England, Armidale, NSW, 2351.
SUMMARY Sheep on Farmlet C – Intensive Rotational Grazing (IRG):
• have lower faecal worm egg counts than A and B in all classes of sheep • have a lower percentage of Barber’s Pole Worm (Haemonchus contortus) • are exposed to lower numbers of larvae on pasture • have lower resistance to worms • have no discernable production losses attributable to worms
The reduction in faecal worm egg counts is due to interruption of the nematode lifecycle in its free-living stages and is not due to better host resistance or resilience on Farmlet C. Intensive rotational grazing works in 2 ways:
• Preventing autoinfection by removing sheep from pasture before they re-infect themselves (short grazing periods).
• Presenting a low number of infective larvae available on pasture for ingestion by sheep (long rest periods).
Farmlet C seems to be more effective against Barber’s Pole worm than against the other major worm species. This is likely, due to the specific climatic conditions required by Barber’s Pole worm eggs to hatch and develop into infective larvae. Other major worm species such as Black scour worm (Trichostrongylus spp.) and Small brown stomach worm (Teladorsagia circumcincta) have much hardier eggs which can survive longer in the absence of optimal moisture and temperature conditions.
INTRODUCTION Studies in Fiji on Haemonchus contortus (Barber’s pole worm) in goats demonstrated that IRG was extremely successful in reducing infections in goats (Banks et al. 1990). H contortus was not found in detectable numbers after 5-13 weeks depending on time of year in this humid tropical environment. Earlier studies in the New England region using relatively slow rotational grazing showed that it was no more successful than set stocking for controlling worms (Roe et al. 1959); Gibson, 1965). Indeed, infective larvae have been shown to survive for over 12 months in Armidale (Southcott et al. 1976). Analysis of routine faecal worm egg count (WEC), monitoring data on the Cicerone project, suggested that the intensive rotational grazing system used on farmlet C markedly reduced WEC relative to that seen on farmlets A and B (Healey et al. 2004). A more detailed study into the underlying reasons for this result was initiated in 2004 and the preliminary results presented at the 2005 “Cicerone Farms Under the Microscope Symposium” (Healey et al. 2005). The present paper updates these findings.
MATERIALS AND METHODS This paper covers three experiments which were partially reported upon at the May 2005 symposium as well as a fourth experiment which has not been reported before. All the work was carried out on the Cicerone Project Inc. Farmlets located at CSIRO, 18km south of Armidale, NSW. For detailed descriptions of each farmlet and their management see Scott et al. (2004).

The Cicerone Project – May 2006 Symposium 32
Experiment 1. Extended study of faecal worm egg count (WEC) The first study was a year-long study of WEC on the 3 farmlets. Twenty ewes, lambs and hoggets were selected randomly from each farmlet in November 2003 (total n=180). These sheep were ear tagged for identification and were subsequently sampled monthly for faecal worm egg count (WEC), body weight and condition score. The sheep ran with their unselected flock mates, within classes on each farmlet. Experiment 2. Fixed larval challenge A fixed larval challenge was carried out in spring 2004 and summer 2005. The spring challenge involved twenty 2003-drop hoggets on each farmlet. These sheep were drenched with a double dose of bezimidazole (BZ), levamisole (LEV) and rametin (RAM). Seven days later they were infected with 8,000 Hc and 12,000 Trichostrongylus colubriformis (Tc) larvae. Body weights, faecal samples and blood were taken on days 0, 21 and 35. Faecal samples and body weights were also taken on day 28. Blood samples were analysed for cell differentiation and counts and WEC was determined using the modified McMaster technique. Second stage summer, autumn and winter challenges involved 2004 drop lambs just weaned. These sheep were drenched with a double dose of LEV and BZ. Seven days later they were given 4,000 Hc larvae and 8,000 Tc larvae. Sampling was as for the spring challenge, but blood samples were taken at all time points. Experiment 3. Pasture larval contamination-tracer study Thirty-three 2003-drop wethers were used as tracers in winter and spring 2004, and 2004 born wethers used in summer and autumn 2005 to determine the level of larval contamination of pastures. The tracers were drenched with double dose of BZ, LEV, RAM and 7 days later 3-4 tracers were put out with each mob on the 3 farmlets. The tracers grazed for 2 weeks with their allocated mobs at which point they were removed to a periphery paddock and WEC determined on days 28 and 35 after introduction, after which they were drenched. This was repeated in summer and autumn 2005 with 2004 drop wether lambs. Experiment 4. Cost of worms on animal production This study ran from August 2004 to July 2005 and aimed to measure the cost of gastrointestinal nematode infection on sheep production and whether the costs, if any, differed between farmlets. Twenty sheep from each farmlet born in September 2003, already part of Experiment 1 and conventionally managed were compared to 14 ‘worm-free’ sheep of the same age on each farmlet. The ‘worm-free’ sheep were selected at random from each farmlet and given a primer drench of BZ, LEV and RAM along with a slow release BZ capsule and an injection of long acting moxidectin every 70-80 days. The ‘worm-free’ sheep were run with their normal mobs on their respective farmlets and monitored monthly for WEC, liveweight and, from April to July, fat score. All sheep (both conventionally managed and worm-free) had a mid-side sample of wool taken 1 week prior to shearing in July 2005.
STATISTICAL ANALYSIS Faecal worm egg count data were transformed using Log (WEC+1) in experiment 1 and a cubed-root transformation in experiments 2 and 3. Linear mixed models were fitted in all studies, least squared means with standard errors are presented for non-transformed data and least squared means with 95% confidence intervals are presented for WEC data. A significance level of P<0.05 was used.
RESULTS Graze and rest periods for farmlet C were significantly different from farmlets A and B with significantly shorter graze periods and significantly longer rest periods from November 2003 to October 2005 (Figure 1).

The Cicerone Project – May 2006 Symposium 33
Figure 1: Mean (±SEM) graze (white) and rest periods (black) for each farmlet. Columns not sharing a common letter are significantly different (p<0.05).
1. Longitudinal WEC study Farmlet A and B sheep had significantly higher mean WEC than farmlet C averaged over the 2 year experimental period (546 (389 to 713), 582 (414 to 763) and 304 (200 to 414) eggs/g, respectively, P<0.0001). The mean H. contortus WEC was higher on farmlet B than farmlet A which was higher than farmlet C (204 (161 to 250), 148 (112 to 187) and 82 (65 top 101) eggs/g, P<0.0001). Farmlet A had the highest mean Trichostrongylus spp. WEC followed by farmlet C then B (4 (3 to 5), 3 (3 to 4), 2 (2 to 3) eggs/g, Figure 2, P<0.001).
Figure 2: Mean faecal worm egg counts for ewes (a), hoggets (b) and lambs (c) over the
experimental period (Nov 2003 - Oct 2005). Faecal worm egg count is divided into total egg count (white), Haemonchus contortus egg count (grey) and Trichostrongylus spp. egg count (black). Anthelmintic treatments are indicated by arrows; short acting (black), moxidectin (white), quarantine (Q), joining (J) and weaning (W) anthelmintic treatments. The latter 3 treatments are fixed across all farmlets.

The Cicerone Project – May 2006 Symposium 34
The proportion of H. contortus on farmlet C was lower than farmlet A and B (59.5, 76.3 and 79.7%, respectively, P<0.05) and the proportion of Trichostrongylus spp. was higher on farmlet C than the other 2 farmlets (27.9, 20.8 and 14.3%, P<0.05, Table 1). The proportion of Teladorsagia spp. was not significantly different. However, numerically, there was a higher proportion on farmlet C than A and B (Table 1).
Table 1: Raw proportions of nematode species found on each farmlet averaged over 2 years.
Nematode Species Common Name Farmlet A (%) Farmlet B (%) Farmlet C (%) Haemonchus contortus Barber’s Pole worm 76.3 79.7 59.5 Trichostrongylus spp. Black Scour worm 20.8 14.3 27.9 Teladorsagia spp. Ostertagia 2.2 2.1 8.6 Oesophagostomum spp. Large Bowel worm 0.5 3.9 3.9 Cooperia spp. Cooperia 0.2 0.0 0.1
There were fewer anthelmintic treatments (Table 2) and a longer interval between anthelmintic treatments on farmlet C with treatment intervals over twice the length on farmlet C than on farmlets A and B (148, 70 and 70 days, Figure 3).
Table 2: Number of anthelmintic treatments given per farmlet and class from November 2003 to October 2005, fixed treatments include those given at joining, weaning and quaratine/shearing, other treatments given for worm control based on faecal worm egg counts.
Farmlet A Farmlet B Farmlet C Class Fixed Other Total Fixed Other Total Fixed Other Total Ewes 6 3 9 6 3 9 4 1 5 Hoggets 4 4 8 4 4 8 3 2 5 Lambs 4 7 11 4 6 10 3 2 5
Figure 3: Mean (±SEM) interval between anthelmintic treatments for each farmlet
2. Fixed Larval Challenge In spring and summer farmlet C sheep had significantly higher mean WEC following a fixed dose of infective larvae than farmlets A and B (P<0.0001, Figure 4). In autumn farmlet C had higher WEC than farmlet B but not farmlet A, while in winter farmlet B had significantly higher WEC than farmlet A. The value of WEC for farmlet C was intermediate.

The Cicerone Project – May 2006 Symposium 35
0
1000
2000
3000
4000
5000
6000
7000
8000
9000
10000
Spring (Nov 04) Summer (Jan 05) Autumn (May 05) Winter (June 05)
Season
Bac
ktra
nsfo
rmed
WEC
(egg
s/g)
Farmlet A
Farmlet B
Farmlet C
Figure 4: Back transformed mean (±SEM) faecal worm egg counts per farmlet for each of
the fixed larval challenges conducted in four seasons. Columns within seasons not sharing a common letter are significantly different (p<0.05).
3. Pasture larval contamination- Tracer study. During winter (2004), spring (2004) and summer (2005) tracers run with farmlet C sheep had significantly lower WEC than the tracers run on farmlets A and B (P<0.01, Figure 5). There was no difference between farmlets in autumn (P~0.9).
Figure 5: Back transformed mean (±SEM) faecal worm egg counts of tracer sheep by
farmlet and season. Columns within seasons not sharing a common letter are significantly different (p<0.05)
4. Cost of worm infestation on animal production There was a significant effect of worm infection on the mean fibre diameter profile (MFD) of Farmlet A sheep. with worm-free sheep having significantly higher MFD than conventionally managed sheep for most of the year (Figure 6). There was no significant difference in MFD between conventionally managed sheep and worm-free sheep on farmlets B and C (Figure 6). The WEC of conventionally managed sheep is also presented in Figure 6. There were significant WEC values on farmlet A throughout with the MFD of the two treatments diverging from September 2004. Farmlet B sheep had very high WEC from October to December 2004 which do not translate into differences in MFD. Farmlet C sheep had generally low WEC throughout the year.
0
500
1000
1500
2000
2500
3000
Winter '04 Spring '04 Summer '05 Autumn '05
Season
Bac
ktra
nsfo
rmed
WEC
(egg
s/g)
Farmlet AFarmlet BFarmlet C
a a
b a a
b
a
b
c
a
b
c
a a
b
b ab a
a
b
ab

The Cicerone Project – May 2006 Symposium 36
(a) (b) (c)
Figure 6: a) Mean fibre diameter profile for worm-free sheep (o) and conventionally managed sheep (*); b) Haemonchus contortus worm egg counts per farmlet; c) Trichostrongylus spp. worm egg counts per farmlet. Data for mean fibre diameter profile taken from .
On farmlets A and B worm-free sheep had significantly higher fat scores and liveweights (Figure 7) as well as higher fleece weights and pregnancy rates (Figure 8) than conventionally managed sheep. There was no difference between worm-free sheep and conventionally managed sheep on farmlet C for any measured production trait.
Figure 7: a) Fat score for worm-free sheep (o) and conventionally managed sheep (*); b)
Liveweights for worm-free sheep (o) and conventionally managed sheep (*) over the experimental period.

The Cicerone Project – May 2006 Symposium 37
(a) (b)
Figure 8: (a) Mean fleece weight for worm-free sheep (grey) and conventionally managed sheep (black) per farmlet. (b) Pregnancy rates for worm-free sheep (grey) and conventionally managed sheep (black) per farmlet, different letters indicate a significant difference within farmlet.
A partial budget was performed for each farmlet to measure the difference in returns between conventionally managed sheep and worm-free sheep. Worm-free sheep had an economic advantage on farmlets A and B ($97/ha and $58/ha respectively) but not C (-$10/ha).
DISCUSSION WEC on farmlet C were consistently lower throughout the year in all classes of sheep. For farmlet C there was a lower proportion of H. contortus and higher proportion of Trichostrongylus spp. The fixed challenge study tested the host phases of the disease and showed that the sheep on farmlet C were more susceptible to infection than those on A or B as shown by significantly higher WEC only when rotations were maintained on C. In autumn when rainfall was scarce, and the rotations on farmlet C had changed (graze period became longer and rest periods became shorter). Farmlet C sheep used in the study also had a significant infection in February 2005 of around 1000 eggs/g giving them a greater exposure to worms than was seen previously in spring and summer. Greater exposure to worms leads to a better development of immunity to subsequent infections. The winter fixed challenge was confounded by nutritional amendment. Farmlet A sheep received a high protein, high energy supplementary feed and farmlet B and C sheep received a high protein supplementary feed. Nutrition has a profound effect on the ability of sheep to fight infection, studies have shown sheep with both high energy and high protein diets are more resistant and resilient to worm infections. The tracer study has showed conclusively that tracers on farmlet C had lower WEC which indicates a lower rate of pasture larval contamination and larval uptake on farmlet C. This means that the higher susceptibility to infection seen in the farmlet C sheep after fixed challenge is most likely to be due to insufficient exposure to larvae resulting in reduced development of an immune response to infection. The superior worm control on farmlet C meant that there were no discernable production losses on that farmlet due to worm infection. However, farmlets A and B were affected by worm infection through lower liveweights, lower fat scores, lower fleece weights and lower pregnancy rates than worm-free sheep run on the same farmlet. This suggests that sheep on farms that are similar to farmlets A and B may benefit from additional worm control strategies. The results of these studies have lead us to conclude that the lower WECs on farmlet C are due to lower levels of pasture contamination with infective larvae on this farmlet and are not due to better host immunity. The changes observed are almost certainly attributable to the application of intensive rotational grazing which breaks the lifecycle of the worm in 2 ways:

The Cicerone Project – May 2006 Symposium 38
1. Through reduction in auto-infection (sheep picking up larvae hatched from eggs they
have deposited) – SHORT GRAZE PERIODS 2. Through reduced level on pasture contamination when sheep return to graze – LONG
REST PERIODS Intensive rotational grazing in this cool temperate environment seems to be mainly effective against H. contortus and not the other main parasitic nematode species.
ACKNOWLEDGEMENTS We thank Dr Betty Hall and Professor Jim Scott for their role in initiating these more detailed studies and Mrs Caroline Gaden for assistance with project coordination. Thanks also to Dr Malcolm Knox for his advice and input into studies 2 and 3 in particular. For practical assistance with the work our thanks go to Justin Hoad, Neil Baillie, Michael Raue and John Gorham. Alison Healey is supported by an Australian Sheep Industry CRC scholarship with operating support from Australian Wool Innovation Pty Ltd.
REFERENCES Banks DJD, Singh R, Barger IA, Pratap B, Le Jambre LF (1990) Development and survival of infective
larvae of Haemonchus contortus and Trichostrongylus colubriformis on pasture in a tropical environment, International Journal for Parasitology 20, 155-160.
Healey AF, Hall E, Gaden CA, Scott JM, Walkden-Brown SW (2004) Intensive rotational grazing reduces nematode faecal egg counts in sheep on the Cicerone Project, in Animal Production in Australia, Melbourne pp. 85-88. CSIRO Publishing
Healey AF, Walkden-Brown SW, Scott JM (2005) Dissecting the effects of intensive rotational grazing on worm egg counts in sheep on the Cicerone Project, in Proceedings of Cicerone 2005 Symposium: Cicerone under the Microscope, Ed. JM Scott, The Cicerone Project Inc, Chiswick NSW and the Centre for Sustainable Farming Systems, University of New England, NSW
Roe R, Southcott WH, Turner HN (1959) Grazing management of native pastures in the New England region of New South Wales. 1. Pasture and sheep production with special reference to systems of grazing and internal parasites, Australian Journal of Agricultural Research 10, 530-554.
Scott JM, Gaden CA, Shakhane L, Healey AF (2004) Holding a measuring stick up to the Cicerone farmlets: how are they shaping up?, Grasslands.
Southcott WH, Major GW, Barger IA (1976) Seasonal pasture contamination and availability of nematodes for grazing sheep, Australian Journal of Agricultural Research 27, 277-286.

The Cicerone Project – May 2006 Symposium 39
OPTIMISATION OF PASTURE IMPROVEMENT KARL BEHRENDTA, OSCAR CACHOA , AND JAMES SCOTTB
A School of Economics, University of New England, Armidale, NSW 2351, Australia. B Centre for Sustainable Farming Systems, University of New England, Armidale NSW 2351, Australia. Email: [email protected]
SUMMARY • The risks of sowing a new pasture have little impact on the profitability of sowing a
permanent pasture across a range of stocking rates • Sowing perennial pastures does increase gross margins and reduce risk, as long as
stocking rates don't increase too much and the sown pastures species persist. • The sequence of years, in terms of gross margins achieved, following the
establishment of a pasture influences profit and the optimal replacement time for the sown pasture.
• High stocking rates on new sown pastures increases short term profits, but also decreases pasture persistence and increases economic risk. The net result is reduced long term profit, more risk and less persistent pastures.
• Due to the need for rapid differentiation between Farmlets A (sown species & high soil fertility) and B (some sown species & moderate soil fertility), Farmlet A has been operating inefficiently.
• To optimise Farmlet A's management and profitability in the future, the previously sown pastures must be managed for persistence.
SOWING SUCCESS - ITS IMPACT ON PROFIT Based on GrassGro modelling calibrated by the data from the Cicerone Project Farmlets A and B, in 90% of seasons the possible risks of sowing a new pasture have little impact on the profitability of sowing a permanent pasture. Average gross margins are used in Table 1 at different stocking rates to show the impact of sowing success (time to first grazing) on the profitability (or Net Present Value) of sowing a pasture.
Table 1: Net Present Value ($/hectare) as affected by sowing success and stocking rate
Average time to first grazing
Post-establishment Stocking Rate (Merino ewes/ha)
3.8 6 8 10 64 weeks $364 $570 $408 -$11 22 Weeks $505 $771 $636 $224 20 weeks $510 $778 $644 $232
SOWN PASTURES: MAKING THEM EARN THEIR KEEP The successful sowing of a pasture is only part of the story. How hard pastures are made to work once established interacts strongly with their persistence, their potential for generating dollar returns and the associated production and financial risk.

The Cicerone Project – May 2006 Symposium 40
$0
$100
$200
$300
$400
$500
$600
3.8 -unimproved
3.8 6 - Farmlet A 8 10
Stocking Rate (Merino Ewes/ha)
Gro
ss M
argi
n ($
/ha)
sown pastures
Increasing risk
Figure 1: Gross margins at different post establishment stocking rates with error bars
(showing one standard deviation from the mean).
Figure 1 indicates that there is an expected increase in gross margin per hectare with increasing post-establishment stocking rates. There is also increasing risk (or variations in the returns) from the higher stocking rates. The results from this suggests Farmlet B will on average (a combination of 3.8 merino ewes/ha on both unimproved and sown pastures) be less profitable than Farmlet A, but with similar levels of risk. Table 2 shows how climatic risk, through its influence on sowing success and gross margins over the life of a sown pasture, determines the profitability (Net Present Value) of establishing an improved pasture at various post establishment stocking rates. This represents the maximum profit that can be reached over an infinite planning period, which means that pastures are only replaced when long term profit over successive pasture sowing-degradation cycles is maximised. The optimum post-establishment stocking rate is in the vicinity of 6 merino ewes per hectare (11.9 DSE/ha), but this will also depend on the level of risk a producer is willing to accept. Table 2 also shows the average proportion of sown species still remaining in the established pasture at the optimal replacement time. Although there is little difference between the higher stocking rates, it indicates that if the profits from increasing post-establishment stocking rates are high enough, it may be more profitable to replace degrading pastures more frequently and at much higher proportions of sown species than is usually done in practice. This issue requires considerably more in-depth research as the generalised rates of pasture degradation used in this study do not adequately describe the sometimes dramatic influence climate and grazing management can have on the persistence and production of sown species.
Table 2: Influence of post-establishment stocking rate on maximum average profit (NPV) from sowing pastures and the average proportion of sown species in the pasture at the optimal replacement time.
Post Establishment Stocking Rate (Merino Ewes/ha)
Measures at optimal replacement time
3.8 6 8 10 Average Profit (Net Present Value - $/ha) $552 $847 $695 $186 Risk (Standard Deviation - $/ha) $69 $136 $260 $366 Average Proportion of sown species 30% 50% 47% 45%

The Cicerone Project – May 2006 Symposium 41
IS THERE TOO MUCH OF GOOD THING WHEN IT COMES TO PASTURE IMPROVEMENT?
Farmlet A has undergone high rates of pasture improvement over the last 6 years. In the vicinity of 20% of the farmlet was sown to improved species per annum from 2000 to 2004. Figure 2 demonstrates the trade-offs between profit and risk for different combinations of management strategies, that is, a 'post-establishment stocking rate' (SR) and 'pasture improvement rate' (PIR) combination.
The frontier, shown graphically by a solid line, defines the combinations of risk (standard deviation of NPV) and profits (NPV) under different choices of SR and PIR where management is efficient. Management combinations that are not on the frontier have higher levels of risk and lower profit (i.e. are stochastically inefficient). Figure 2 shows that if Farmlet A reduced its PIR from 20% per annum to around 4% per annum it would operate on the risk-efficient frontier. This would then allow a fair comparison between the farmlets at a similar level of stochastic efficiency. The Cicerone Board's decision to quickly modify the pasture composition on Farmlet A over an unusually and perhaps un-realistic short period has meant that Farmlet A has suffered financially relative to Farmlet B. Also, over the past 6 years, the farmlets have experienced below average rainfall. Thus, economic comparisons between the two systems should be made with care.
$0
$500
$1,000
$1,500
$2,000
$2,500
$3,000
$30 $40 $50 $60 $70 $80 $90 $100Risk (Standard deviation of NPV $/ha)
Ave
rage
Pro
fit ($
NPV
/ha)
Risk Efficient Farmlet A (6 Merino ewes/ha & 4% PIR)
Farmlet B(3.8 Merino ewes/ha & 2% PIR)
Farmlet A - current(6 Merino ewes/ha & 20% PIR)
Risk Averse region
Risk indifferent
region
Risk Efficient Frontier
Figure 2: Risk-efficient frontier for a self replacing Merino ewe flock specified in terms of
post-establishment stocking rate and pasture improvement rate (SR, PIR%). Average Profit represents expected NPV with Risk being the standard deviation of the NPV.
FUTURE RESEARCH WORK TO DEVELOP MORE CONCLUSIONS • Describe the relationship between pasture persistence and climate, soil fertility and
grazing management more accurately. • Develop a method that defines the optimal development path for a grazing business
when technologies interact and risk is taken into account.
ACKNOWLEDGMENTS Our thanks go to the members, team and board of the Cicerone Project for making data available, in particular the contribution of Libuseng Shakhane, Caroline Gaden, Dion Gallagher and Colin Lord. Karl Behrendt is supported by an Australian Sheep Industry CRC/AWI scholarship and the Cicerone Project is supported by Australian Wool Innovation.

The Cicerone Project – May 2006 Symposium 42
ECONOMIC OUTCOMES FROM THE 3 FARMLETS FIONA SCOTT NSW DPI, Tamworth, M.Ec. student, University of New England, Armidale NSW In my research, to be completed in 2006, a representative farm approach is used to interpret the results of the Cicerone grazing trial at a commercial scale. The results will enable growers to compare the three systems at the level of a commercial farm scale thus enabling them to judge the findings within a realistic context. As observed in previous economics research, farm enterprise (i.e. gross margin) and whole farm business analyses are both needed for a complete farm business report (Ronan and Cleary 2000). Costs of production information is useful as is the comparison of technical production parameters and enterprise gross margins within each Cicerone Project farmlet. However, in order to translate the results from the Cicerone project farmlets to information that is useful for growers at the whole farm scale, a whole-farm business analysis is also needed. As shown in Figure 1, wool production from farmlet A responded significantly in spite of mostly below average rainfall conditions over the past 5 years. Rainfall was insufficient to permit fodder conservation (silage) until late 2005 when excellent growth permitted 9 tonnes DM/ha of silage to be harvested on farmlet A. All farmlets experienced wool price reductions; this was partly due to external wool market conditions.
Wool production per hectare
-
5
10
15
20
25
30
35
00-01 01-02 02-03 03-04 04-05
kg/h
a
Farm A Farm B Farm C
Wool $/kg
$-$2$4$6$8
$10$12$14$16
00-01 01-02 02-03 03-04 04-05
Woo
l $/k
g
Farm A Farm B Farm C
Figure 1: Average annual wool production and wool price - farmlet scale
The gross margins for the three 54ha scale farmlets for the five financial years 2000-01, 2001-02, 2002-03, 2003-04 and 2004-05 were calculated from database records. These do not include the costs of pasture improvement, fertiliser and fencing but do include animal health, supplementary feed and labour costs. There was a great deal of variability in the annual farm gross margins at the 54 ha scale, as shown in Figure 2.

The Cicerone Project – May 2006 Symposium 43
-
2,000
4,000
6,000
8,000
10,000
12,000
14,000
16,000
18,000
20,000
00-01 01-02 02-03 03-04 04-05
$
Farm AFarm BFarm C
Figure 2: Annual gross margin for 54 ha farmlets (A, B and C).
$-
$10,000
$20,000
$30,000
$40,000
$50,000
$60,000
00-01 01-02 02-03 03-04 04-05
Farm AFarm BFarm C
Figure 3: Cumulative gross margins for 54 ha farmlets (A, B and C).
The cumulative gross margin (Figure 3) has been greater for, farm A since 2002-03. The trials were then scaled up to a commercial scale of 920 hectares, and gross margins and whole farm cash flows prepared for that size. In order to multiply from the 54 hectare Cicerone farmlet scale to the 920 hectare commercial scale, a multiplication factor of 17 was applied to livestock numbers, health and supplementary feeds costs. There were some exceptions to this to avoid potential scale errors. Shearing and crutching were costed at $5.45 per head for ewes, weaners and hoggets and $8.53 per head for rams using costs from the 2005 NSW Department of Primary Industries (NSW DPI) sheep gross margin budget for 19-micron merino ewes (NSW-DPI 2005). Mulesing and marking was costed at $1.40 per head. Records were not available for the details of wool selling and livestock selling costs. Without being able to ascertain if the Cicerone farmlets had higher costs for livestock and wool selling due to its relatively small scale, those costs were also derived from the 2005 NSW DPI sheep gross margin budget for 19-micron merino ewes. The reason for doing this is that if the Cicerone shearing, selling and marketing costs were different due to its small scale, then this scaling error would be carried over into the commercial scale farm if simple multiplication was applied and the error magnified. In the scaling up process, Cicerone labour costs were removed, and an assumption was made that a permanent operator would be running the farm, with the addition of casual labour when needed. The cost of this casual labour was calculated using a simple linear model (Alford et. al. 2004) and added when appropriate into the whole farm cash flow. Overhead costs were

The Cicerone Project – May 2006 Symposium 44
taken from a published source to provide an estimate based on realistic data (Alford et al. 2003). Farm overheads were assumed to be $51,000; this figure includes administration, electricity, insurance, fuel & oil, repairs and maintenance. A conservative allowance of $48,000 was made for operator labour. In addition, an assumption was made for farmlet A that a direct drill was purchased for $25,000 in year 1 for pasture sowing. It was assumed that the farmer would do their own spraying and pasture sowing on farmlet A, and their own spraying but contract pasture sowing on farmlets B and C. A farm paddock design was drawn up for a hypothetical farmlet C, to calculate the amount of fencing required for paddock subdivision. Farmlet C required 23km of 3-wire electric fencing, plus watering points, gates, piping and troughs, at an estimated cost of $66,700 in year 1 (including labour). The resultant commercial scale cash flow results (Figure 4) show that farmlet A is still in a negative cash flow state at the end of the 2004-05 financial year, whilst farmlets B and C were positive. Large dips and peaks in the cash flows have partly been due to shearing in August, but especially to livestock trading (mostly cattle).
End of month closing balance: Commercial scale 920ha
-$600,000
-$500,000
-$400,000
-$300,000
-$200,000
-$100,000
$-
$100,000
$200,000
$300,000
$400,000
$500,000
$600,000
Jul-2
000
Sep-20
00
Nov-20
00
Jan-2
001
Mar-20
01
May-20
01
Jul-2
001
Sep-20
01
Nov-20
01
Jan-2
002
Mar-20
02
May-20
02
Jul-2
002
Sep-20
02
Nov-20
02
Jan-2
003
Mar-20
03
May-20
03
Jul-2
003
Sep-20
03
Nov-20
03
Jan-2
004
Mar-20
04
May-20
04
Jul-2
004
Sep-20
04
Nov-20
04
Jan-2
005
Mar-20
05
May-20
05
Farm A Farm B Farm C Figure 4: Preliminary commercial scale cash flow results for farmlets A, B and C from
July 2000 to July 2006.
The results for farmlet A are mainly due to a high level of expenditure on pastures in below average rainfall years, as well as large expenditure on supplementary feed, in order to keep the farm stocking rate at levels required by the Cicerone management committee. As Figure 1 shows, wool production had begun to respond to the higher input system of farmlet A, but the system was limited by low rainfall. The large cash-flow peak and trough pattern which all 3 farms follow is the results of livestock purchases and sales at the same time. A comparison of the main expenditures assists in assessing the differences between the farmlet results at the commercial scale (Table 1).

The Cicerone Project – May 2006 Symposium 45
Table 1: Comparison of key total income and cost figures, 2000-01 to 2004-05.
Category farmlet A farmlet B farmlet C Wool income 1,062,874 864,107 794,973 Sheep trading income 445,219 301,063 259,997 Cattle income 1,061,818 910,362 957,220 Total income 2,569,911 2,075,532 2,012,189 Selected costs Sheep purchases 315,632 103,606 86,550 Shearing & wool selling 234,126 183,692 168,854 Cattle purchases 652,145 575,815 611,105 Livestock selling costs 112,270 90,804 88,737 Supplementary feed 214,833 140,819 147,637 Animal health (drench, vaccines) 62,889 87,209 66,200 Capital (machinery, fencing) 25,000 - 66,733 Pasture (seed, fertiliser) 573,959 99,819 84,849 Interest charges at 10% 90,600 162 1,986 Overheads and family drawings 363,000 363,000 363,000
At a commercial scale, farmlet A expenditure on pasture was much higher than for farmlet B or C. Livestock purchase costs (and associated income levels and variable costs) were higher for farmlet A due to the higher stocking rate targets. But trying to maintain high livestock numbers in dry years also led to high supplementary feed costs for farmlet A. High expenditure levels which kept cash flow in the negative also resulted in $90,600 in overdraft interest costs over the 5 years (at an average rate of 10%). In conclusion, the high potential production from farmlet A has not occurred to date, probably due to the below average rainfall during the 5-year span of the analysis. Farmlet A has the potential for higher fodder conservation in order to maintain its higher stocking rates in dry times but low rainfall has prevented this until late 2005. A continuation of the experiment would offer the opportunity to measure the different responses of the systems to higher rainfall years, particularly in order to asses the economic impacts of higher production potential on farmlet A. References Alford AR Griffith GR and Cacho OJ (2004) A Northern Tablelands Whole-Farm Linear Program for
Economic Evaluation of New Technologies at the Farm-Level, Economic Research Report 13, NSW Agriculture, Armidale.
Alford AR Griffith GR and Davies L (2003) Livestock Farming Systems in the Northern Tablelands of NSW: An Economic Analysis, Economic Research Report 12, NSW Agriculture, Orange.
NSW-DPI (2005) 2005 NSW Sheep Gross Margin Budgets, NSW DPI.
Ronan G and Cleary G (2000) Best practice benchmarking in Australian agriculture: Issues and challenges.
The Cicerone Project – May 2006 Symposium 46
ASSESSING THE SUSTAINABILITY OF THE THREE CICERONE FARMLETS OVER TIME JIM SCOTTA AND ANDREW ALFORDB
A School of Rural Science and Agriculture and Centre for Sustainable Farming Systems, University of New England, NSW, 2351
B Beef Centre, NSW Department of Primary Industries, Armidale, NSW, 2350
INTRODUCTION The principle aims of the farmlet investigations within the Cicerone Project have been to investigate the sustainability and profitability of three different whole farm management systems. These systems are explained briefly in Appendix 1. The goal of farming in a sustainable fashion has been, and continues to be a great challenge for the farming community. The importance of the sustainability of agricultural systems is acknowledged broadly within Australia amongst government and industry groups. Williams (2001) has emphasised the need for future research in agriculture to be undertaken through a farming systems framework within a broader ecological ecosystem. Scott (2003) has suggested that farm system comparisons need to be made at a ‘credible’ scale. Sustainable development has been defined as “development that meets the needs of the present without compromising the ability of future generations to meet their own needs” (WCED, 1987). However this definition is not of practical benefit for farmers or scientists from which to develop new agricultural practices (Conway, 1993). A continuum essentially exists in the definition of sustainability from a narrow ecological definition through to a broad economic view with various degrees of compromise between these two extremes. Within Australian agricultural systems, the sustainability of grazing systems has only become a major focus in the last two decades (Kemp, Michalk and Virgona, 2000). Recently there has been an effort to examine the sustainability of pasture systems in the higher rainfall temperate regions of Australia (Mason and Kay, 2000; Scott et al., 2000). Sustainability in this context is the continued productivity of the pasture resource (Kemp, Michalk and Virgona, 2000). Barlow et al. (2003) have suggested a range of impacts on primary resources such as water, nutrients, soil health and on-site flora and fauna that need to be assessed if sustainability is to be adequately understood. We agree that sustainability needs to be assessed over a range of criteria. It is also vital that it be assessed over time as it is implied in the definition. Figure 1 below suggests six main criteria which need to be satisfied in order to satisfactorily strive for sustainability. These criteria relate to the climate, soil, crops/livestock, management, financial and stewardship of the environment. In this paper, we will attempt to assemble data representing the various components of sustainable farming for the three Cicerone farmlets and present a matrix showing the degree to which each of these farmlets has achieved these goals.

The Cicerone Project – May 2006 Symposium 47
Optimise returns - accumulate net worth sufficient for family
Manage complexity by focusing on key drivers
Harvest energy and protein (grain, pasture and livestock)
Minimise erosion and leakage/losses of nitrogen and water
Stew
ards
hip
of th
e en
viro
nmen
t
Optimise climatic opportunities/manage climatic risks
Financial
Management
Climate
Soil
Crops/livestock
Figure 1. Diagram showing simplified dependencies between climate, soil, crop,
livestock, management and financial layers of sustainability and the outcomes which need to be achieved in sustainable farming enterprises (Scott, 2006).
METHODS This paper utilises a wide array of data sourced from colleagues studying the Cicerone farmlets. The reader is referred to the other papers in this proceedings in order to learn of the methodologies used across these studies.
RESULTS Figure 2 (a) and (b) shows the changes in soil nutrient status for phosphorus and sulphur respectively. There has been a marked increase in soil phosphorus and sulphur level on farmlet A compared to farmlets B and C although over the past two years the differences have diminished largely due to lower fertiliser inputs over this period. A consequence of higher phosphorus and sulphur levels can be an increase in legume content, thereby leading to greater capture of nitrogen through nitrogen fixation. Figure 2 (c) shows the episodic presence of legumes over the last three years with the levels of legume on farmlet A being clearly greater than those on farmlets B and C. It is notable that farmlet C has had a consistent low level of legume over the past three years. The changes over the past six years in botanical composition, ground cover and herbage mass can be seen in Figure 2 (d), (e) and (f) respectively. Farmlet A has been able to maintain a higher level of desirable botanical composition than the other farmlets largely through resowing of 6 of the 8 paddocks over that period, two of which were re-sown twice following the failure of short-term ryegrass pastures. Farmlet C has maintained a higher level of desirable botanical composition compared to farmlet B. Ground cover has been greater than the minimum recommended level of 70% over almost all of the past three years. The ground cover on farmlets B and C has tended to be higher than that of farmlet A; it is suggested that this is likely to be due to the higher digestibility and higher stock numbers on farmlet A enabling greater intake of herbage mass. The balance between the green herbage mass and the PROGRAZE benchmarks for breeding ewes is shown in Figure 2 (f). This shows there to be a substantial deficit in late winter and early spring of each of the past three years. It is clear that there are many months where there farmlets have been grazed below the critical benchmark of 500 kg of green herbage mass per hectare, especially during winter and also on farmlet A in 2005. It is thus clear that the aim of managing farmlets A and B within PROGRAZE benchmarks has not been achieved over the winter months.

The Cicerone Project – May 2006 Symposium 48
(a) Soil phosphorus (b) Soil sulfur
0
20
40
60
80
2001 2002 2003 2004 2005 2006
ppm
(Col
wel
l)
ABC
0
5
10
15
20
25
2001 2002 2003 2004 2005 2006
Soil
sulfu
r (pp
m K
Cl)
ABC
(c) Percent legume (d) Percent ‘desirable’ species
0
2
4
6
8
10
2003 2004 2005 2006
%
ABC
0
10
20
30
40
50
60
70
80
Dec-00
Dec-01
Dec-02
Dec-03
Dec-04
Dec-05
Bot
anic
al c
ompo
sitio
n (%
)
Farmlet AFarmlet BFarmlet C
(e) Percent ground cover (f) Green herbage mass and benchmarks
0102030405060708090
100
2003 2004 2005 2006
%
ABC
0
400
800
1200
1600
2000
2400
2800
3200
Apr
-200
3
Jun-
2003
Aug
-200
3
Oct
-200
3
Dec
-200
3
Feb-
2004
Apr
-200
4
Jun-
2004
Aug
-200
4
Oct
-200
4
Dec
-200
4
Feb-
2005
Apr
-200
5
Jun-
2005
Aug
-200
5
Oct
-200
5
Dec
-200
5
Feb-
2006
kg G
reen
DM
/ha
Prograze (ewes) A B C Prograze benchmark
(g) Percent lambing (h) Wool cut/head
0
10
20
30
40
50
60
70
80
90
100
2003 2004 2005 2006
(%)
ABC
0
0.5
1
1.5
2
2.5
3
3.5
4
4.5
2001 2002 2003 2004 2005 2006
Woo
l cut
(kg
GFW
/hd)
ABC
(i) Cumulative carrying capacity (j) Wool cut per hectare
0
5000
10000
15000
20000
25000
Jul-0
0
Jan-0
1Ju
l-01
Jan-0
2Ju
l-02
Jan-0
3Ju
l-03
Jan-0
4Ju
l-04
Jan-0
5Ju
l-05
Jan-0
6
Cum
ulat
ive
DSE
-day
s pe
r ha
.
Farmlet AFarmlet BFarmlet C
0
5
10
15
20
25
30
2001 2002 2003 2004 2005 2006
Woo
l (kg
GFW
/ha)
ABC
Figure 2. Comparison of farmlets A, B and C for various soil, pasture and livestock characteristics from 2000 to 2005.

The Cicerone Project – May 2006 Symposium 49
The status of the livestock in terms of productivity and reproduction are shown in Figure 2 and Figure 3. Figure 2 (g) shows a somewhat greater lambing percentage in 2005 on farmlet A compared to B and C and substantially greater wool production per hectare (Figure 2 (j)) on farmlet A compared to farmlets B and C, due principally to the higher stock numbers on farmlet A. The carrying capacity of the farmlets is shown in Figure 2 (i), indicating there have been substantial increases in stocking rate on farmlet A compared to farmlets B and C since 2002. The wool production per head has tended to be higher on farmlets A and B than on farmlet C as shown in Figure 2 (h). Figure 3 (a) shows the growth of weaners over the past five years, which has been more rapid on farmlets A and B over the first three of these years compared to farmlet C. In the latter two years, 2004 and 2005, management changes were made to decrease the rest period on farmlet C and this brought the weaner performance of farmlet C to be closer to the other two farmlets. (a) Weaner/hogget liveweight per head (b) Beef liveweight gain per hectare
0
10
20
30
40
50
60
2000 2001 2002 2003 2004 2005
Live
wei
ght (
kg/h
d)
ABC
0
20
40
60
80
100
120
2002 2003 2004 2005
kg (l
w) /
ha
ABC
(c) Supplement fed per day (megajoules) (d) Gross margin per farmlet
0
1000
2000
3000
4000
Jul-0
0Ju
l-01
Jul-0
2Ju
l-03
Jul-0
4Ju
l-05
Sup
plem
ent f
ed (M
E/d
ay)
A B C
-
2,000
4,000
6,000
8,000
10,000
12,000
14,000
16,000
18,000
20,000
00-01 01-02 02-03 03-04 04-05
$
Farm AFarm BFarm C
(e) Predicted cumulative cash flow (920 ha)
-$600,000
-$500,000
-$400,000
-$300,000
-$200,000
-$100,000
$-
$100,000
$200,000
$300,000
$400,000
$500,000
Jul-2000
Oct-2000
Jan-2001
Apr-2001
Jul-2001
Oct-2001
Jan-2002
Apr-2002
Jul-2002
Oct-2002
Jan-2003
Apr-2003
Jul-2003
Oct-2003
Jan-2004
Apr-2004
Jul-2004
Oct-2004
Jan-2005
Apr-2005
Farm A Farm B Farm C
Figure 3. Comparison of farmlets A, B and C for various livestock and economic characteristics from 2000 to 2005.
Figure 3 (b) shows the overall production of beef per farmlet over the past four years. In all years, farmlet A has been able to support higher beef production per hectare than the other two farmlets. Figure 3 (c) shows the level of supplementary feed supplied to animals over the past

The Cicerone Project – May 2006 Symposium 50
five years showing the seasonal fluctuations and a much increased rate of supplementary feeding on farmlet A in both 2004 and 2005 compared to the other two farmlets. The financial status of the farmlets is shown in Figure 3 (d) and (e). The gross margin per farmlet has tended to be higher over two of the four years on farmlet A but otherwise is relatively similar between farmlets and years. Figure 3 (e) shows the cumulative cash flow when the gross margin figures have been scaled up to represent the figures of a typical full sized grazing property found in this region of 920 hectares in size. This figure shows farmlet B and C being quite similar in magnitude but farmlet A shows a steep decline relative to the other farmlets in financial status as it has incurred substantial costs in pasture sowing and on supplementary feeding over time. Table 1 below shows a matrix of the relative sustainability of the three farmlet systems where each of the criteria have been ranked at levels of 1 to 3 relative to the others. The matrix includes criteria for sustainability scores due to the environmental factors of runoff, erosion, changes to hydrology, leaching and salinity; however, to date none of these criteria have been measured and hence no assessment can be made at this stage. However, the sum of all the other ranked criteria show that overall, farmlet A has accumulated a lower ranking and therefore can, in the opinion of the authors, be suggested to be more ‘sustainable’ than farmlets B and C with relatively little difference between the latter two. Of course, the validity of this accumulation of rankings is open to question; many observers would no doubt argue that different weightings should be applied to these criteria and, in the case of farmers, especially to the financial viability criteria.
Table 1. Estimate of the relative sustainability of each farmlet system.
Characteristic: Farmlet A Farmlet B Farmlet C Is profitable over the long-term 3 1 2 Low need for supplementary feed 3 2 1 High animal production (per hectare) 1 2 3 High animal performance (per head) 1 2 3 Good animal health 2 3 1 Adequate critical soil nutrients 1 2 2 Sufficient green herbage mass at all times 2 2 2 Causes no significant detriment to the pastures 1 3 2 Rapid pasture growth 1 2 2 Sufficient legume to enhance nitrogen cycle 1 2 2 Fertiliser-responsive, deep rooted perennial grasses
1 3 2
Run-off, erosion, hydrology, leaching, salinity ? ? ? Sustainability score (best possible score = 11) 17 24 22
From the above summary table it is clear that no final assessment of sustainability can be arrived at without measurements of the important environmental criteria upon which sustainability depends. We recommend that further studies be conducted to enable the various criteria of potential damage to the natural capital, particularly of the soil, to be assessed over time and over variable seasons in order to enable a more adequate assessment of the sustainability of these systems to be developed.
ACKNOWLEDGEMENTS We wish to gratefully acknowledge the data, analysis and willingness to the information made available from across all studies to date on the Cicerone farmlets.

The Cicerone Project – May 2006 Symposium 51
The support of Australian Wool Innovation, the University of New England and of NSW Department of Primary Industries is gratefully acknowledged.
REFERENCES Barlow, R., Ellis, N.J.S. and Mason, W.K. (2003). A practical framework to evaluate and report
combined natural resource and production outcomes of agricultural research to livestock producers. Australian Journal of Experimental Agriculture, 43, pp. 745-754.
Conway, G.R. (1987). The Properties of Agroecosystems. Agricultural Systems, 24 (2), pp. 95-117.
Mason, W.K. and Kay, G. (2000). Temperate Pasture Sustainability Key Program: an overview. Australian Journal of Experimental Agriculture, 40 (2), pp. 121.123.
Scott J.M. (2003) Measuring whole-farm sustainability and profitability at a credible scale. In 'Agriculture for the Australian Environment: Proceedings of the Fenner Conference on the Environment.' (Eds BP Wilson and A Curtis) pp. 291-298. (Charles Sturt University.)
Scott, J.M. (2006). Can there be a Magic Pudding? Towards an understanding of viable farms. Inaugural lecture. University of New England. 42 pp.
Scott, J.M.; Hutchinson, K.J.; King, K.; Chen, W.; McLeod, M.; Blair, G.J.; White; A.; Wilkinson, D.; Lefroy, R.D.B.; Cresswell, H.; Daniel, H.; Harris, C.; MacLeod, D.A.; Blair, N. and Chamberlain, G. (2000). Quantifying the sustainability of grazed pastures on the Northern Tablelands of New South Wales. Australian Journal of Experimental Agriculture, 40 ( ), pp. 257-265.
Williams, J. (2001). Farming without harming – can we do it? (Part 2). Agricultural Science, 14 (2), pp. 37-40.
World Commission on Environment and Development (1987). Our Common Future. Oxford University Press, Oxford.

The Cicerone Project – May 2006 Symposium 52
COMPARISON OF THE GROWTH RATES OF VARIOUS CROSS BRED MEAT SHEEP CAROLINE GADEN AND JUSTIN HOAD The Cicerone Project Inc, Armidale The late 1990s brought a number of new breeds of sheep into Australia, offering sheep producers the possibility of income diversification into sheep-meat production. The South African sheep were imported mainly to Western Australia and Queensland where research trials showed promising results, particularly in the drier areas. This trial, suggested by some members of The Cicerone Project, was to look at the growth rates of these breeds crossed with local Merino sheep and see if they were suitable for income diversification in this area.
METHOD Macquarie Artificial Breeders inseminated 250 Merino ewes with semen on 3 May, 2000 from 9 different sires representing 5 breeds of South African Meat breeds of sheep. Sires used were Afrikaner (0231-99), Damara (867 and 5-75) and White Dorper (Blue 220 and Blue 305) the fat tailed breeds, and Dohne Merino (98-067 and 98-069) and South African Meat Merino (SAMM) (Hillcrest 132 and 133), two dual-purpose wool/meat breeds. Border Leicester rams were used as back up for the AI program and they ran with the ewes from 22 May to 7 July. The ewes were run on paddocks external to the main Cicerone farmlet paddocks (Big Ridge). The pasture was not of high quality and superphosphate had not been used for several years. The ewes were given supplementary feed of lupins starting at 250 grams per head per week from 28 April and building to 1050 grams per head per week in the week prior to lambing. For two weeks over lambing, the ewes were separated into plots according to sire lines. Approximately 45 lambs of each South African breed were born in late September and most lambs had their birth weights taken. After the two weeks, the ewes and their lambs were again boxed together as one mob and any Border Leicester lambs were then born. No birth weights were recorded for the Border Leicester lambs (around 60) arriving two weeks after the others. Lambs were marked on 7 November 2000, when all lambs were ear tagged, all males were castrated and the Dohne, SAMM and Border Leicesters were all tail docked. All lambs were treated with Click to help prevent any post-marking fly strike. Lambs were weaned on 28 December 2000 and given 5ml MaxiPro with iodine and 2ml of Weaner Guard. Wool lambs received 16 ml Click at this time. On 15 March 2001 lambs were drenched with 8ml Rametin and Nemadet and on 8 June they received 10 ml Seponver. All lambs were checked for fly strike at each weighing, especially the fat-tailed breeds with their long tails. After weaning the lambs were deliberately run on unimproved pasture as their home environment of South Africa is very harsh. All lambs were weighed at four to six week intervals until July 2001 and an average weight calculated for each breed at each time. We looked for any fleece contamination on ten ewes with brown Damara lambs. The method used was a direct count of fibres as suggested by Queensland Department of Primary

The Cicerone Project – May 2006 Symposium 53
Industries. Ewes were placed in a tipping cradle and examined at eight different sites on their right side using a magnifying glass and a wire grid with an area of 10cm by 10 cm at each site.
RESULTS Birth. The AI was done on 3 May 2000. There was some variation in birth time, with the Dorpers being the first lambs to arrive from 25 September, 3 days before the others, then there was a rush of Damaras (28 Sep) followed by the Dohne (30 Sep) and SAM Merinos (30 Sep). The Afrikaner were scattered throughout the week. Generally, the Afrikaner were the smallest and ‘finest boned’ of the lambs born, suggesting they would be easiest for lambing. They had a strong survival instinct in contrast to the larger Dohne and SAM merino lambs that tender to suffer higher mortality. The birth of four of the bigger lambs had to be assisted: a 6kg Dohne, a 6 kg SAMM and a 5.8kg Dorper and another large unweighed SAMM. The Afrikaners were white lambs with no colour whilst the White Dorpers had some coloured (light grey) patches on the body. The Damaras were generally dark brown or had patches of dark brown and the Dohne and SAMM looked like the merino lambs they were.
3.2
3.84.1
4.3
3.9
0
0.5
1
1.5
2
2.5
3
3.5
4
4.5
5
Afrikaner Damara White Dorper Dohne Merino SAMM
Breed
Ave
rage
wei
ght i
n kg
Figure 1 Average birth weight of 5 breeds of cross-bred meat sheep (average of males and
females).
Fibre contamination When the sheep were brought into the yards for lamb marking, ten ewes with yellow ear tags were inspected for signs of fleece contamination from their brown Damara lambs. Any hair fibres found were counted (See Table 1). Some contaminating hairs were found on the surface of the ewe fleece, but they were white, not the expected dark brown of the lambs. At a subsequent examination at weaning (in December) we found no contamination. From this small study we cannot say that contamination of the ewe fleece with the brown hair of their Damara lambs was a problem pre-weaning. Ewes were sold at weaning so no further possible contamination of their fleeces was studied. Lambs were examined at each weighing and the non-wool breeds certainly shed some fibres which would be a contamination issue. It was interesting that the very dark brown colour of the Damara cross lambs faded considerably as they grew older.

The Cicerone Project – May 2006 Symposium 54
Table 1. Visual assessment of ewe fleeces for contamination. Number of contaminating hairs in whole grid area found at each site.
Behaviour. Initially the small Afrikaner lambs managed to find any holes there were in fences between the plots leading to some not finding their way back to their mother. The behaviour of the Border Leicesters was noted to be the ‘wildest’ at weighing time. The Afrikaners were observed to be the most ‘gentle’ in the weighing crate. Fly strike The wool breeds, the Dohne and SAMM lambs were treated with 16 ml of Click in early January. The non-wool sheep were not treated at this time. All lambs were checked for fly strike as they went through the weighing crate. The undocked tails of the fat-tailed breeds were of particular interest, however these tails have no hair or wool underneath, much like the underneath of a horse’s tail and there were no problems with fly strike. Growth rates Figure 2 shows the average weights of the lambs throughout the year. It can be seen that the smaller, finer boned Afrikaner lambs remained the smallest throughout. The Damara growth rates were also among the lowest. The White Dorper lambs initially had the best growth rates but, by July, both the Dohnes and SAMMs had topped them. Despite being a couple of weeks younger, the Border Leicesters eventually outperformed the imported breeds.
Date Ewe Site 1 Site 2 Site 3 Site 4 Site 5 Site 6 Site 7 Site 8 neck wither back hip shoulder middle
side rump belly
7-Nov Y138 12 9 7 2 0 2 4 2 Y241 2 9 2 1 0 0 6 5 Y131 4 3 1 2 5 2 0 1 Y99 2 2 0 0 1 2 0 0 Y54 1 0 0 1 0 1 2 0 Y167 1 0 1 5 1 4 3 2 Y004 0 0 0 0 0 1 1 0 Y151 2 2 0 5 2 1 7 1 Y100 0 2 2 2 1 3 5 0 Y66 0 4 0 1 5 1 0 2 28-Dec Y 055 0 0 0 0 0 0 0 0 Y 101 0 0 0 0 0 0 0 0 Y 123 0 0 0 0 0 0 0 0 Y 138 0 0 0 0 0 0 0 0 Y 168 0 0 0 0 0 0 0 0

The Cicerone Project – May 2006 Symposium 55
0.0
5.0
10.0
15.0
20.0
25.0
30.0
35.0
40.0
Birth Marking Dec wt Weaning Feb wt March wt May wt June wt July weight
Weighing dates
Wei
ght i
n kg
AfrikanerDamaraWhite DorperDohne MerinoSAMMBorder Leicester
Figure 2 Average weights of 5 breeds of cross-bred meat sheep over time.
Figure 3 shows the average daily weight gains of the combined lot of lambs and it shows an important result of this trial. The daily weight gains were close to 160 grams per day In late May, the lambs were started on a supplement of lupins with 400 grams per head per week initially and increasing to 873 grams per head per week by 27 July when the top 50 Border Leicesters were sold. Over the next few weeks the remainder of the animals were sold, some went to studs as far away as Dubbo, some went to local schools to continue with the growth rate comparison, and some went to the district sale yards. Figure 3 shows the average daily weight gains of the combined lots of lambs and it shows an important result of this trial. The daily weight gains were close to 160 grams per day prior to weaning, but weaning was a real set back to the lambs with daily weight gains dropping to half that figure and it took several weeks before their growth rate started to improve again.

The Cicerone Project – May 2006 Symposium 56
0.0
20.0
40.0
60.0
80.0
100.0
120.0
140.0
160.0
Nov- Dec Dec- W ean Wean - Feb Feb - Mar Mar - May May - June June- July
Weighing date
Gra
ms
Series1
Figure 3 Average daily weight gain of six breeds of merino cross lambs
FLEECE CHARACTERISTICS OF THE DOHNE AND SAM MERINO LAMBS Prior to their sale in August, side samples were taken from the fleeces of the Dohne and SAMM lambs. The results showed an average micron of 21.2 for the SAMM (range 18.9 to 25) and an average micron of 18.6 for the Dohne merino (range 16.9 to 21). As the maternal ewe flock had averaged 21 micron, it seems the two Dohne sires had the more beneficial effect of reducing the wool micron in these lambs. As the Afrikaner, Damara and White Dorpers are grown for meat, not wool, and generations after the first cross are not shorn but shed their fleeces, we did not do any fleece measurements on these breeds.
CONCLUSION The lambs were deliberately run on unimproved pasture as their home environment of South Africa is very harsh. The lambs did not do as well as we expected from results obtained in Western Australia and Queensland. In the New England environment, the Border Leicester lambs proved to have the best growth rates but with all the crosses we needed to supplement the unimproved pasture with lupins to finish the sheep for selling. We encountered some opposition from a number of local producers and wool classers for running the trial. The Afrikaner, Damara and Dorper breeds were greeted with great suspicion on their media reputation alone, whether or not people had even seen them. The problem of wool contamination has become an issue of increasing political importance. There is not a ready meat market in this area for these breeds of lambs, there is no boat trade to the Middle East and there are no meat buyers who buy for the ethnic market in the Sydney or Brisbane. Local producers would have to think through all the consequences of running the Afrikaner, Damara and Dorper breeds in this traditional fine-wool producing district. The set back in growth rate at weaning was evident over all the breeds. This suggests that producers of all sheep should pay particular attention to the pasture onto which lambs are to be weaned. They may also need to consider supplementary feeding at this time to help lambs maintain good growth rates.

The Cicerone Project – May 2006 Symposium 57
ACKNOWLEDGMENTS We would like to thank the following people for their encouragement, help and advice: Dan Cloonan, Queensland DPI, Longreach; Bronte Gardner, Ida Vale, Kojonup WA, breeder of Afrikaner sire; Matthew Young, Agriculture Western Australia, Geraldton.
REFERENCES: Agriculture WA http://www.agric.wa.gov/ for a number of papers and pastoral memos.
Anon. “Why breed Damara sheep?”, http://benet.net.au/~brandis/sandhurst/why.html
Campbell, Q, “DNAfrica Pty Ltd, moving genetics across the globe”, http://196.25.15/
Kleeman DO, Quigley SP, Bright R and Scott Q (2000) Survival and growth of Damara, Dorper, Dorset, Rambouillet, South African meat Merino First Cross lambs in Semi Arid Queensland, in Proceedings of the 9th Congress of Asian –Australasian Association of Animal Production Societies and 23rd Biennial Conference of the ASAP, July 3-7 2000, University of NSW, Sydney
Queensland DPI, Research Schedule for Fibre Studies 2000
Rose M, Bright RL, Quigley SP and Kleeman DO (2000) Fibre Transfer in Merino Ewes mated with Damara, Merino or Dorper rams in Central Western Queensland, in Proceedings of the 9th Congress of Asian –Australasian Association of Animal Production Societies and 23rd Biennial Conference of the ASAP, July 3-7 2000, University of NSW, Sydney
Savage L (2001) Dark Fibre disaster, The Land, 2001
Thatcher L (1999) New lamb breeds widen genetic pool. Australian Farm Journal Wool. March
Woodgate K (2000) South African breeds target dual purpose market, Farming Ahead March, 99

The Cicerone Project – May 2006 Symposium 58
IMPROVING THE DIAGNOSIS OF VIRULENT FOOTROT: DEVELOPMENT OF A DNA TEST USING THE INTA GENE BRIAN F. CHEETHAM AND MARGARET E. KATZ Molecular and Cellular Biology, the University of New England, Armidale, NSW, 2351
BACKGROUND Footrot is caused by infection of the hooves of sheep with the bacterium Dichelobacter nodosus. Different strains of this bacterium cause disease of different severity, ranging from mild (benign) to severe (virulent). However, in the early stages of the disease, or under poor environmental conditions such as low moisture or extreme cold or heat, it is difficult to distinguish benign footrot from virulent footrot on the basis of symptoms. Laboratory tests have been developed to aid in the diagnosis of virulent footrot. In NSW, the most commonly used laboratory test is the gelatin gel test, which classifies isolates of D. nodosus as stable or unstable. Some isolates give an intermediate result in this test, and are classified as equivocal. Stable isolates are considered to be capable of causing virulent footrot, while unstable isolates are associated with benign footrot.
IDENTIFICATION OF GENES ASSOCIATED WITH VIRULENCE We began our research at the University of New England in 1991, with the aim of identifying and characterising genes from D. nodosus which were associated with virulence. This was a continuation of one aspect of research initiated at Monash University by Julian Rood, with funding from the Australian Wool Board. By comparative analysis of different strains of D. nodosus, we identified a series of genes which were found in some strains but absent from others. Some of these genes were found preferentially in virulent strains (Katz et al., 1994; Cheetham et al., 1995; Bloomfield et al., 1997; Whittle et al., 1999).
GEL STABLE, FIELD BENIGN STRAINS OF D. NODOSUS After discussions with John McFarlane and Geoffrey Green from the Armidale Rural Lands Protection Board, we became aware that there were a number of properties in the New England region with strains of D. nodosus which appeared to cause only benign footrot, but were stable in the gelatin gel test. This was an issue of concern to many wool producers, as the stable result in the gelatin gel test was likely to result in the property being placed into quarantine. With the help of Graham Bailey from the NSW Department of Primary Industries, we obtained isolates from properties with gel stable, field benign footrot. We found that the intA gene was present in all D. nodosus isolates we tested that caused virulent footrot, but was absent from all D. nodosus isolates which were gel stable, but caused only benign footrot.
THE FIRST CICERONE FOOTROT TRIAL – URALLA, 1999 The Cicerone Group was successful in obtaining Woolmark funds under the PIRD scheme to investigate gel stable, field benign footrot in New England. Betty Hall and Caroline Gaden were instrumental in setting up the first trial to compare the expression of a number of gel stable and unstable isolates under similar conditions when footrot expression was likely to occur in the New England. This trial was conducted on the Cicerone farmlets in Uralla, where groups of sheep infected with different strains of D. nodosus were grazed in adjacent one hectare plots. Swabs were collected prior to, and at the conclusion of the trial, and used to obtain isolates for gelatin gel testing and DNA testing for the presence of the intA gene. This trial confirmed that there were strains of D. nodosus which were stable, but caused only benign footrot, even under favourable conditions for footrot expression. In addition, the trial confirmed that the gel stable, field benign strains lacked the intA gene, while gel stable, field virulent strains contained the intA gene.

The Cicerone Project – May 2006 Symposium 59
THE SECOND CICERONE FOOTROT TRIAL – TOOGONG, 2000 The purpose of the second trial was to show that the gel stable isolates of D. nodosus which did not cause virulent footrot in the New England would behave in a similar manner when taken out of the New England environment into an environment more favourable to the expression of footrot. Three groups of sheep infected with gel stable, field benign strains from the first trial were taken to Toogong, in the Molong RLPB. These were compared with sheep infected with an unstable strain from the first trial, and a local virulent strain. Again, the gel stable field benign strains did not cause virulent footrot, even though conditions at the beginning of the trial were highly favourable for footrot expression. DNA testing confirmed that the gel stable, field benign strains lacked the intA gene, while the virulent strain contained intA. The results from both trials were presented at the Australian Sheep Veterinary Association conference in 2001 (Hall et al., 2001).
LARGE SCALE TESTING FOR THE PRESENCE OF THE INTA GENE The two footrot trials demonstrated that gel stable field benign strains existed, and that the intA test could be used to distinguish them from gel stable field virulent strains. However, it was necessary to confirm this result on a large scale by testing hundreds of isolates of D. nodosus from sheep from a large number of properties with gel stable benign or virulent footrot. Substantial funding was obtained from Australian Wool Innovation in 2002 for a two year project to carry out this work. With the assistance of Graham Bailey and John Seaman of NSW DPI, 595 isolates of D. nodosus were obtained from 124 properties carrying sheep with footrot. The results of intA testing on these isolates showed that intA was not detected in any samples from 91.3% of properties with gel stable benign footrot, while intA was detected in at least one sample from 92.1% of properties with virulent footrot. These results support the use of the intA test as an adjunct to the gelatin gel test for the diagnosis of virulent footrot (Cheetham et al., 2006).
FUTURE DIRECTIONS We have obtained further funding from Australian Wool Innovation for the accreditation and commercialisation of the intA test, which is in progress. We have so far carried out technology transfer to ensure that the test can be carried out by NSW DPI at Orange, and by the National Footrot Reference Laboratory in Albany, Western Australia. We are also testing isolates from Victoria and South Australia, to determine whether the intA test is useful in footrot diagnosis in these states.
ACKNOWLEDGEMENTS We thank J. Druitt and M. Sutherland for technical assistance, members of the Cicerone group for their support, staff from NSW DPI and Rural Lands Protection Boards for their assistance in obtaining samples and for gelatin gel tests, and Woolmark and Australian Wool Innovation for funding.
REFERENCES Bloomfield GA, Whittle G, McDonagh MB, Katz ME, Cheetham BF, (1997) Analysis of sequences
flanking the vap regions of Dichelobacter nodosus: evidence for multiple integration events, a killer system, and a new genetic element, Microbiology 143, 553-562.
Cheetham BF, Tanjung LR, Sutherland M, Druitt J, Green G, McFarlane J, Bailey GD, Seaman JT, Katz ME (2006) Improved diagnosis of virulent ovine footrot using the intA gene, Vet. Microbiol in press
Cheetham BF, Tattersall DB, Bloomfield GA, Rood JI, Katz ME (1995) Identification of a gene encoding a bacteriophage-related integrase in a vap region of the Dichelobacter nodosus genome, Gene 162, 53-58.

The Cicerone Project – May 2006 Symposium 60
Hall E, Cheetham BF, Tanjung LR, Gaden C, Green G (2001) Gelatin gel stable strains of footrot which express as clinically benign: the Cicerone group PIRD projects, Proc. Aust. Sheep Vet. Soc. 11, 5-9.
Katz ME, Wright CL, Gartside TS, Cheetham BF, Doidge CV, Moses EK, Rood JI (1994) Genetic organization of the duplicated vap region of the Dichelobacter nodosus genome, J. Bacteriology 176, 2663-2669.
Whittle G, Bloomfield GA, Katz ME, Cheetham BF (1999) The site-specific integration of genetic elements may modulate thermostable protease production, a virulence factor in Dichelobacter nodosus, the causative agent of ovine footrot, Microbiology 145, 2845-2855.

The Cicerone Project – May 2006 Symposium 61
APPENDIX 1. CICERONE FARMLET GUIDELINES The ABC farmlets are to be run as individual ‘commercial’ farms. Each with a self-replacing Merino flock and the opportunity for cattle fattening/backgrounding but with the same ratio of sheep:cattle dses on each farmlet at any given time.
FARM A HIGH INPUT/FLEXIBLE GRAZING • 8-10 paddocks, • Aim for 100% of land sown to legumes and nutrient-responsive, deep-rooted
perennial grasses. • Flexible rotational grazing, based on Prograze principles, with approximately five
mobs in 8-10 paddocks and a stock density of 10 to 50 dse/ha. • Available soil phosphorus level to a target of 60 ppm (Colwell). • Available soil sulfate sulfur levels to a target of 10 ppm. • Strategic applications of nitrogen fertiliser. Periodic molybdenum applications. • Aiming for high legume content (i.e. up to 30% of feed on offer). • Vulpia and other weed control as necessary. • Opportunistic fodder conservation allowed. • Lime may be considered, depending on soil test. • Aim for an overall stocking rate of 15 DSE per hectare.
FARM B MEDIUM INPUT/FLEXIBLE GRAZING • 8-10 paddocks, • Treatment to represent typical district practices • Flexible rotational grazing, based on Prograze principles, with approximately five
mobs in 8-10 paddocks and a stock density of 5 to 30 dse/ha. • Available soil phosphorus level to a target of 20 ppm (Colwell). • Available soil sulfate sulfur levels to a target of 6 ppm. • Minimal pasture sowing, Vulpia control allowed, clover may be broadcast. • Aim for 6-7 DSE per hectare.
FARM C MEDIUM INPUT/ INTENSIVE ROTATIONAL GRAZING • Same inputs as B except for the following grazing differences • 30-40 paddocks, with electric fencing used to subdivide in order to ensure
appropriate grazing pressure, pasture utilisation and rest periods. • Intensive grazing, less than three mobs in 30-40 paddocks, 50-500 dse/ha stock
density. • Grazing periods to be short and intense, eat 1/3, trample 1/3 and leave 1/3 of
pasture on offer. • Rest periods determined by pasture recovery, do not graze plants growing on root
reserves. • Mobs may be combined to maintain appropriate rest periods and grazing pressure
for all paddocks. • Controlled or planned grazing principles to apply.
Thus between Farms A and B we have different levels of inputs, between Farms B and C we have different grazing intensities and between Farms A and C we have the effects of both grazing intensities and level of inputs (see Figure 1).

The Cicerone Project – May 2006 Symposium 62
C
B A
Controlled grazing
Moderate 'inputs'
Moderate 'inputs'
Flexible grazing
High 'inputs'
Flexible grazing
Effect - Level of inputs
Effects of Grazing Mgmnt
Confounded - (grazing and inputs)
Figure 1. Diagram of differences between farmlet systems.

The Cicerone Project – May 2006 Symposium 63
APPENDIX 2. CUMULATIVE GRAZING DAYS ON EACH FARMLET OVER TIME
0
5000
10000
15000
20000
25000
30000
35000
Jul-0
0
Jan-0
1Ju
l-01
Jan-0
2Ju
l-02
Jan-0
3Ju
l-03
Jan-0
4Ju
l-04
Jan-0
5Ju
l-05
Jan-0
6
Cum
ulat
ive
DSE
-day
s pe
r ha
.
A1 A2 A3A4 A5 A6A7 A8
0
5000
10000
15000
20000
25000
30000
35000
Cum
ulat
ive
DSE
-day
s pe
r ha
.
B1 B2 B3B4 B5 B6B7 B8
0
5000
10000
15000
20000
25000
30000
35000
Cum
ulat
ive
DSE
-day
s pe
r ha
. C1 C2 C3C4 C5 C6C7 C8 C9C10 C11 C12C13 C14 C15C16 C17 C18C19 C20

The Cicerone Project – May 2006 Symposium 64
APPENDIX 3. SUMMARY OF 2006 SURVEY OF MEMBERS Summary of 2006 survey of Cicerone members/former members (taken prior to May 2006 Symposium). Number of respondents was 64 (a 21% response rate).
Number Total Number of respondents 64 Average area (ha) of respondents farm 1544 94,172 Average number of cattle (number/farm) 481 25,960 Average number of sheep (number/farm) 6070 333,850 Number identifying with CMA regions
• Border Rivers - Gwydir CMA 19 • Namoi CMA 8 • Northern Rivers CMA 33 • Other (including Hunter-Central Rivers and Central
West) 6 Number identifying with different Cicerone farmlets Farm is run in similar fashion to farmlet A 15 Farm is run in similar fashion to farmlet B 39 Farm is run in similar fashion to farmlet C 19 Number identifying with a single farmlet type (A, B, or C) 43 Number identifying 2 farmlet types (AB, BC or AC) 6 Number identifying 3 farmlet types (A, B and C) 6
Farm
let A
is a
ppro
pria
te tr
eatm
ent
Farm
let B
is a
ppro
pria
te tr
eatm
ent
Farm
let C
is a
ppro
pria
te tr
eatm
ent
Farm
let D
wou
ld b
e in
tere
stin
g
Nee
d to
mea
sure
env
ironm
enta
l effe
cts
Sho
uld
cont
inue
for a
t lea
st 3
yea
rs
Mor
e fin
anci
al c
onst
rain
ts w
ould
be
inte
rest
ing
Cic
eron
e is
impo
rtant
lear
ning
reso
urce
for
sum
mer
dom
inan
t HR
Z
Cic
eron
e is
val
uabl
e pa
rtner
ship
Hig
hly
satis
fied
with
ach
ieve
men
tsstrongly agree
agree
neutral
strongly disagree
disagree
Figure 1. Average responses to 10 survey questionsA sent out to members and former members of Cicerone Project (+/- standard deviation). (Number of respondents = 64).
AFull text of questions referred to in Figure 1 is provided below:

The Cicerone Project – May 2006 Symposium 65
1. I believe that Farmlet A (high input, high adoption, high proportion of sown species, high soil fertility, flexible grazing management, 8-10 paddocks) has been an appropriate treatment for investigation
2. I believe that Farmlet B ('typical' farm, moderate input, moderate proportion of sown species, moderate soil fertility, flexible grazing management, 8-10 paddocks) has been an appropriate control treatment to allow for meaningful comparisons
3. I believe that Farmlet C (Intensive Rotational Grazing, moderate input, moderate proportion of sown species, moderate soil fertility, 33-40 paddocks) has been an appropriate treatment for investigation
4. I would be interested to see a Farmlet D investigated (Intensive Rotational Grazing, high input, high proportion of sown species, high soil fertility, 33-40 paddocks)
5. I believe we should find out more about the environmental effects of the different farmlet systems
6. I believe that the farmlet trials should continue for at least another 3 years to gather longer-term data
7. I think it would be interesting to place more financial constraints on the running of the farmlets (i.e. to ensure that each farm operates with the same 'overdraft' limit)
8. I believe that the Cicerone Project is an important learning resource for grazing enterprises in the summer dominant, high rainfall zone.
9. I believe that the Cicerone Project is a valuable partnership between farmers, researchers, and extension specialists
10. I am highly satisfied with the achievements of the Cicerone Project (thus far)

The Cicerone Project – May 2006 Symposium 66
APPENDIX 4. SUMMARY EVALUATION OF SYMPOSIUM (MAY 11, 2006) Registered participants numbered 65 for the day. Out of these 39 returned completed surveys.
Symposium
0%
10%
20%
30%
40%
50%
60%
70%
Landholders Advisors Academic Student Other
Figure 1. Groups attending May 2006 symposium.
• Landholders survey responses revealed that attendees were responsible for the management of 86, 660 sheep,9, 940 cattle,1,300 goats
• 92% of respondents said their overall satisfaction of the symposium was good to excellent.
• 84% said that impact of the symposium on their future farm management decisions was good to excellent
• 94% said the success of the partnership between producers, researchers and extension officers had been good to excellent.
• 90% of respondents said they were likely to change management decisions based on the information received at this symposium.
0
10
20
30
40
50
60
70
80
90
100
Botanicalcomposition
changes
The balancebetween
managingpastures andlivestock for
sustainabili ty
Reflections onthe Cicerone
farmlets
Soil ferti l itychanges on the
farmlets andlong termfertil iser
decisions
Grazingmanagement
and wormcontrol
Optimising andrisk
managementfor various
pasture basedsystems
Economicoutcomes fromthe 3 farmlets
Assessing thesustainabil ity
of the 3farmlets over
time
Implications forthe future
session
good
- ex
celle
nt %
Figure 2. Proportion of attendees rating the speakers’ presentations at the symposium.
The wide array of comments collated from respondents are collated in Table 1 below.

The Cicerone Project – May 2006 Symposium 67
Table 1. List of answers to questions re changes to management decisions
What management decision are you likely to change – those who answered YES 1 Pasture improvement programs, fertiliser inputs, stocking rates and grazing
management 2 Will develop dse/days chart paddock by paddock, will develop cash flow recording and
budgeting, will concentrate on growing winter feed 3 Stocking rate on highly improved new pastures 6 Maximum rate of sowing of 5% per annum 8 Watch inputs, find optimum, watch grazing system used, watch costs and returns –
budget and gross margin 11 Not a producer! But probably just reinforced my existing thoughts 12 Worm control – pasture utilization, improving pastures 13 Soil fertility management and worm control measures. Processing economic
management 14 Benefits of cell grazing 16 Maybe more inputs e.g. fertiliser 19 Rotation for worm burden, More care of legume persistence vigour, Need to reduce risk
on farm 20 Flexible grazing management on A and B according to the PROGRAZE principles 22 Take it steady 23 Worm control 24 Worm control, fertiliser management 25 Review on an ongoing basis and maybe adjust on all the inputs and observations
coming to hand 26 Stocking rate and fertiliser use 27 Rethink fertiliser application rate and rate of pasture improvement on farm 28 Further improve arable areas, fence to manage better undulating country i.e. better
composite management 30 Information received today is only one ingredient of many that are needed for the ‘cake
of farm production’ 31 Establishment of deep rooted legumes 34 More rotational grazing; more data collecting pastures/soils 36 Many and varied 37 Grazing management and worm control 38 Increase stocking rate, strategic use of fertiliser and pasture improvement 39 Using more rotational grazing for the benefit of pastures and worm control but certainly
NOT to the extent of farmlet C The messages from the symposium that were rated by attendees as important are shown in Table 2 below.
Table 2. List of the most important messages coming from the symposium “What to you was the most important message from the Symposium?”
1 Risk of planting improved pastures 2 Have to work on all aspects of farm and property management to succeed 3 Do not rush into capital expenditure for improved pasture without the capital or cash
flow available (i.e. 10% pasture improvement rate, not 20%). 5 The interaction between scientists, students and producers is the best aspect. 6 Premature closing of Cicerone if further funding cannot be sourced 7 Let it continue 8 Keep on learning from others, keep on trialling new pasture species, enterprises and
grazing systems until you find what works for you. 9 Be profitable and sustainable
10 Farm A was unsuitable and the most important input is water

The Cicerone Project – May 2006 Symposium 68
11 The need for ongoing and expanded ‘research’ to measure other variables – particularly related to soil and erosion, runoff, hydrology parameters. Also – how to get increasing knowledge out to landholders appropriately
12 The three farmlets and pasture versus livestock production 13 We still have lots to learn form this type of data collection project 14 Fertility is crucial 15 Excellent discussion forum 16 It needs longevity 17 Learn from your mistakes 19 Keep thinking forward, mgt should always be dynamic be open to new ideas 20 Environment – Soil – Plant – Animal – Economic 21 The need for sustained and extended research to draw some more definitive
conclusions about the sustainability and productivity 22 Be careful with worm control 23 Economic evaluation 24 Opportunity for improved worm control, improved grazing management (ME
deficient/surplus). Improved soil fertility management 25 To follow the results and compare with own situation 26 To think about farming practices 27 Impact of low rainfall on success of the improved pastures and the economic impact 28 Beware the ides of March i.e. winter feed! 29 Great interest from large number of producers 30 Summing up of results of 3 farmlets 31 Proceed with care on pasture sowings 34 Look at all options; take best pieces from all 3 farmlets 36 That there is no average farm - all are different - and the information gleaned has been
substantial and will be used over the years ahead. It is so hard for graziers to come in contact with the scientists of the calibre involved in this project on an equal basis and a lot can be learnt by us from them and vice versa.
37 It is important to have collaboration between all the agencies on multi-disciplinary research on whole farm systems
38 All. Each farmlet has its pluses and minuses. I can see the use of each farmlet on different parts of the landscape and for different animal enterprise goals. There seemed to be strict grazing management guidelines on farmlet C and not so for A and B. A and B type systems are therefore harder to manage or are more complex than a C type system.
39 The after lunch speaker that talked about risk etc involved in sowing 20% Farmlet A p.a. - two of his conclusions were derived by using a different method to that which I believe many successful local farmers have used for years – 1) sowing 2 – 4% of the farm is an acceptable risk in this climate 2) there were diminishing returns and higher acceptable risks for higher stocking rates, past 6-8 ewes/ha in this climate. My observations has been that there are many successful producers who stock conservatively at that 6 – 9 DSE (depending on land quality) have been successful in the long term in relation to $ earned, making physical infrastructure on their farm and most importantly they have maintained the capital of soil, water and pastures by being flexible in their management, particularly in bad seasons, and matched inputs and outgoings of fertility by appropriate fertiliser applications. It was encouraging to see an economist came up with some findings – using a different approach – that roughly parallel with some good local practice. 3) I thought Phillip Dutton’s summary was very good.

The Cicerone Project – May 2006 Symposium 69
There is no panacea for everything and we have to use what is appropriate for our land, business etc. It will be a great shame if this project can not be funded for another 5 – 10years to build on what has already been achieved. Please let me know if I can write to anyone to push for this funding to continue. To explore how farmers can build flexibility for livestock numbers into their systems to maintain long term profitability needs to be looked at (I discussed this with the speaker referred to earlier) egg My guess for a long term mix to give could be
40% DSE = breeding ewes (merinos?) 10% DSE = replacement ewes 20% DSE = wethers 15 – 20% = breeding cattle 10 – 15% = dry cattle/replacements Can someone look at this or other mixes taking everything into account - season, worm
control etc. By using Cicerone data to date, as well as, future (hopefully) data collected, producers
can be offered more good information that they can use, selectively if necessary to suit their operations. Unfortunately, I had to leave early for another appointment so may have missed some other things in the last hour. Well done to all for a most informative day. Sincerely …..


