Embed Size (px)
Citation preview

Aquaculture July 2000; 199 (73-91) http://dx.doi.org/10.1016/S0044-8486(01)00554-3Copyright ©2001Elsevier Science B.V. All rights reserved.
Archimer http://www.ifremer.fr/docelec/Archive Institutionnelle de l’Ifremer
Optimisation of the traditional Pacific cupped oyster (Crassostrea gigas Thunberg) culture on the French Atlantic coastline: autumnal fattening in
semi-closed ponds
P. Soletchnika,*, O. Le Moinea, P. Goulletquera, P. Geairona, D. Razeta, N. Faurya, D. Fouchéb
and S. Roberta
a Shellfish Research Aquaculture Laboratory of Poitou-Charentes (LCPC), Station IFREMER, Ronce Les Bains, 17390 La Tremblade, BP.133 France b Direction de l'environnement littoral, Station IFREMER, Ronce Les Bains, 17390 La Tremblade, BP.133 France *: Corresponding author : [email protected]
Abstract Oyster farming in France is a traditional activity. Each year, 60,000 tons of C. gigas are fattened before being sold. Present-day fattening techniques for improving oyster taste and colour and increasing the meat weight are not particularly reliable. To optimize the fattening process, large phytoplanktonic blooms were induced in ponds, then distributed in oyster ponds. Despite the variability of the autumn weather conditions, diatoms (Skeletonema costatum) have been successfully cultured in outdoor ponds. During neap tides (when no seawater replenishes the water in the oyster beds), between mid-October and mid-December 1996, the fattening index (the weight of the meat) was constant or increased by 10–15% when a supplement of algae of 380,000 cells/oyster/day was added to the ponds. Algal supplement was clearly responsible for fattening improvement. In 1995, the addition of 110,000 cells/oyster/day, a significantly lower quantity, was not sufficient to prevent weight loss. Over two periods of 3 months (in 1995 and 1996) of the experiment, a significant reduction in weight (up to 20%) was observed in oysters grown in ponds which did not receive additional algae. Author Keywords: Marennes Oléron Bay; Oyster farming; Crassostrea gigas; Fattening process
1

1. Introduction
The Marennes-Oléron Bay (figure 1), with its 100 000 metric tonnes stocking
biomass of Pacific cupped oysters (Crassostrea gigas) and an annual production
of 30 000 to 40 000 tonnes, is the largest oyster rearing area in Europe. Twenty
thousand tonnes of oysters, originating from other French rearing areas completes
the oyster stocks, which undergo a fattening process called ‘affinage’ before
commercialisation, therefore representing 40 % of the French production. This
fattening process allows the oysters to acquire the taste and often a green colour
specific from this rearing area. In 1997, the foreshore of the mainland and the
islands off the Charente coast counted 3 200 leased hectares. The 3 500 ha of
semi-closed ponds in the Marennes Oléron Bay account for over 90 % of all
French oyster ponds (Deslous-Paoli et al., 1981). The use of salt marshes as
"ponds" for "greening" the common European oyster Ostrea edulis dates back to
the 17th century (Papy, 1941) and Gaillon (in Moreau, 1970) described the
greening technique that was used at the turn of the 19th century.When the common
European oyster suddenly disappeared between 1920 and 1921, it was replaced by
the Portuguese oyster (Grelon, 1978 The Pacific oyster (Crassostrea gigas) was
introduced in massive numbers to France to replace it. Eighty thousand tonnes of
this oyster were being produced along the Atlantic coast of France as early as
1976, which indicates how successful the species introduction has been. (Héral,
1989; Grizel and Héral, 1991).
The French traditionally eat oysters during the festive periods and 70% of
commercialised oysters are eaten during the Christmas holidays (SECODIP,
1

1999). This is why the fattening period, which lasts between 1 and 2 months
(AFNOR, 1985), takes mainly place between October and December. This
fattening period is designed to perfect the oyster taste, appearance and colour
(Grelon, 1978). Traditionnally, the "spéciales" oysters are first fattened in ponds
from May to December at densities of 4-5 oysters per m2. Fattening is then
progressively carried out on the foreshore in order to free the oyster ponds for the
"fine" oysters. The stocking process called "passée" at 40-50 oysters per m2 only
lasts for a few weeks. The aim is to modify the taste of the oyster and possibly its
colour, since fattened oysters undergo "unpredictable fluctuations in greening"
(Grelon, 1978). Many studies have been carried out on Haslea ostrearia, the
diatom which is responsible for this greening (Moreau, 1967 ; Neuville and Daste
1970 ; Robert, 1973 ; Robert, 1982; Turpin et al., 1999). Today, oyster ponds are
used to produce mainly the "fine" oysters and breeding conditions are governed
by the AFNOR norms (1985), which stipulate that oysters must spend one month
in these ponds at a breeding density of not more than 1 kg/m2. Nevertheless, these
conditions do not always provide the appropriate quality oyster (Blachier et al.,
1998 ; Soletchnik et al., 1998a ; Robert et al., 1998).
Enrichment techniques used in agriculture (e.g., the use of phosphates, lime)
have been used to improve the fertility of oyster beds (Deltreil et al., 1977 ;
Grelon, 1978 ; Robert et al., 1979b). However the results have often been uneven,
making this kind of technique unreliable.
The aim of this study was to test at a commercial level the production of algae
using an enrichment technique developed for intensive aquaculture (Baud et al.,
1995 ; Hussenot, 1992 ; Gautier et al., 1993 ; Hussenot and Gautier, 1994 ;
2

Hussenot et al., 1998), and to measure the effect of a using dietary supplement
during the C.gigas fattening in oyster ponds.
2. Materials and methods
2.1. The experimental site
The experiments were carried out on the Atlantic coast of France in the
Marennes-Oléron Bay, in five 450 m2 ponds (figure 1). Seawater flowed in and
out of the ponds during the spring tides, under the control of both the lunar cycle
(tidal range) and the weather conditions (e.g., wind and atmospheric pressure)
(figures 2 and 3). The height of the water column was recorded continuously by
using an ecjhosounder probe, therefore allowing a precise estimate of the filling
time and seawater volume. This height in the ponds varied between 30 cm (no
seawater inflow) and more than 100 cm during the "spring tides". It was estimated
that in more than 80 % of cases, 50 % and sometimes as much as 70 % of the
seawater in the ponds was replaced. The frequency of refilling was around one
tide in 3. During "neap tides" as much as one week could pass without any
seawater entering the ponds. Depending on the tide strength, the flow of seawater
could last anywhere from a few minutes to 2 hours. Oyster ponds 2 and 4 were
equipped with a hydraulic ramp which allowed a supplement of phytoplankton to
be supplied from associated cultures of algae (figure 2). These ramps ran
lengthways across the ponds. Algae were distributed as a continuous flow from
each side of a feeding ramp, until algal tank production was empty
3

Ile d'Oléron
Marennes
Charente
Seudre
France
Ile d'Oléron
Marennes
Charente
Seudre
France
Figure 1. Experimental site located in the southern part of the Marennes Oleron Bay.
5
output
pumping system
234 15
oyster ponds
algal culture ponds
543 2 1
input
algaldistribution
system
Coastal line
Figure 2. Experimental oyster ponds and phytoplankton production ponds.
4

01/1201/12
02/1202/12
03/1203/12
04/1204/12
05/1205/12
06/1206/12
07/1207/12
08/1208/12
09/120
1
2
3
4
5
6
tidal
rang
e (m
)
2030405060708090100
wat
er le
vel (
cm)
tidal range (m) sea water level (cm)
Figure 3. Relationship between the tide cycle and the seawater input into the oyster ponds (e.g. December
1 to 6 spring tide in 1995).
2.2. Phytoplankton production
Phytoplankton were produced in clay ponds with a plastic covering of a surface
area of 100 m² and a depth of 70 cm. They were equipped with their own
hydraulic system and the seawater supply was pumped in from a reserve pond
where sedimentation occurs, therefore limiting the turbidity level (figure 2). In
1995, a "discontinuous" system was used to produce algae. The production pond
reached a peak concentration of algae after 5-7 days. The phytoplankton were
then distributed within 24 hours in the two algae-supplemented oyster ponds.
Seawater was filtered on 200 µm bolting gauze filters to avoid any zooplankton
predation. In 1996, algal production was carried out using the continuous method
(Hussenot and Brossard, 1995). Five ponds were organised in a 5 day-production
cycle which provided a continuous supply of phytoplankton to the oyster ponds.
The nutrient formula supplied (enrichment) was that established by Hussenot and
Brossard (1995) (table 1). The quantities of minerals were sufficient for a
5

maximum culture density of around 500 000 cells per millilitre. 109 cells were
added per oyster ; the oysters had an average weight of ~ 50 g (Baud et al., 1995 ;
Gautier et al., 1993). The phytoplankton cultures were monitored by measuring
fluorescence and counting the number of cells each day. Fluorescence was
measured with a Turner fluorimetre and cell counts made under the microscope
using a Malassez cell counting chamber. The inventory of the main phytoplankton
families was also carried out on samples of seawater taken daily from the oyster
ponds.
For the purposes of this study, a daily production of 33.5 m3 at 500 000 cells per
millilitre was necessary. The technique used to initiate the culture was developed
by Hussenot and Brossard (1995). The inoculum of algae was natural and came
from another culture pond. The culture was "boosted" by diluting and fertilising in
the same pond, in accordance with the " continuous" culture technique used by
Gautier et al. (1993). Measurements of ammoniacal nitrogen were carried out on a
daily basis in each oyster pond using the Koroleff's protocol (Koroleff, 1969).
Table 1. Nutrient supply for a 100 m3 algal culture (from Hussenot and Brossard, 1995)
Nutrients Name Daily supply (for 100 m3)
Concentration (mg/l)
N-NH4Cl Ammonium chlorid 808 g 150 P-PO4 Triphosphate 240 g 15 Silicium Sodium metasilicate 1591 g 60 Fe-FeCl3 Iron chlorid 41 g 3 Mn-MnSO4 Manganese sulfate 27 g 1.5
6

2.3. The stock of oysters
The cultured oyster populations used for the 1995 experiment came from
Normandy and for the 1996 experiment from the Marennes Oléron Basin (table
2). Oysters were spread out over the bottom of the beds at densities of 20
oysters / m², which corresponded to a load of 1.0 kg m-2 in 1995 and 1.1 kg m-2
in 1996. Pond n° 5 was used as a control of algal production without rearing
oysters. Total weight, weight of the shell, wet and dry meat weights were
measured on between 30 and 100 oysters sampled during rearing (table 2). The
AFNOR quality index is derived from the norm NF V45-056 (1985) and is
calculated according to the following equation :
AFNOR = (wet meat weight / total weight) x 100 (1)
An index of between 6.5 and 9 corresponds to "fine" oysters and greater than 9 to
"spéciale" oysters. Proximate biochemical composition (i.e., proteins,
carbohydrates, glycogen and lipids) were estimated according to the protocols
presented by Goulletquer et al. (1988).
7

Table 2. Characteristics of the initial oyster conditions and sampling strategy of the Crassostrea gigas oyster population in the semi closed oyster ponds in 1995 and 1996
1995 1996 Oyster population Origin Characteristics
Isigny Marennes Oléron Bay
Rearing time (days) 62 58 Total weight (g) (± STE) 47.7 ± 0.4 56.7 ± 0.5 Dry meat weight (g) (± STE) 1.74 ± 0.011 1.16 ± 0.014 AFNOR (*) index (%) (± STE) 11.91 ± 0.09 10.92 ± 0.11 Rearing density (kg m-2) 1.0 1.1 Sampling time
04/10/95 18/10/95 08/11/95 05/12/95
19/10/96 05/11/96 25/11/96 16/12/96
* AFNOR : Norme de qualité NFV45-05 (1985).
2.4. Statistical Analyses
Analysis of variance were performed for total weight, dry meat weight and
AFNOR variables. The least significant difference (LSD test) was then calculated
to range means (Cochran and Cox, 1957). Quality index, ratio (% of dry weight)
of proteins, lipids, carbohydrates and glycogen are presented in Box and Whisker
plot (median and quartiles) with a 5% significant level. Since a punctual and
limited variability of phytoplankton level was initially observed among ponds,
experimental ponds were statistically compared as separate treatments.
All the statistical analyses were carried out using the Statgraphic V. 3.1 software
programme.
8
3. Results
3.1. Production of algae in ponds
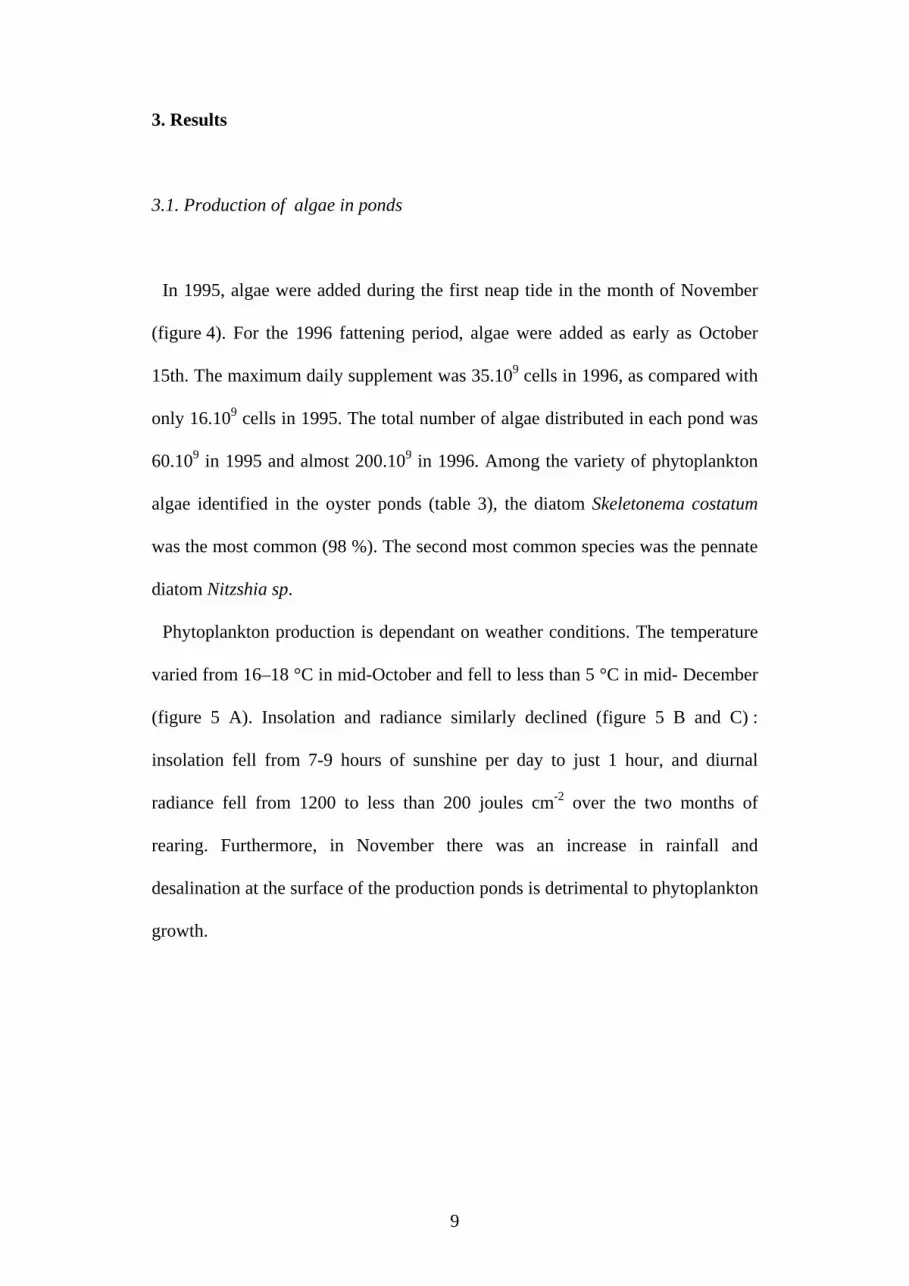
In 1995, algae were added during the first neap tide in the month of November
(figure 4). For the 1996 fattening period, algae were added as early as October
15th. The maximum daily supplement was 35.109 cells in 1996, as compared with
only 16.109 cells in 1995. The total number of algae distributed in each pond was
60.109 in 1995 and almost 200.109 in 1996. Among the variety of phytoplankton
algae identified in the oyster ponds (table 3), the diatom Skeletonema costatum
was the most common (98 %). The second most common species was the pennate
diatom Nitzshia sp.
Phytoplankton production is dependant on weather conditions. The temperature
varied from 16–18 °C in mid-October and fell to less than 5 °C in mid- December
(figure 5 A). Insolation and radiance similarly declined (figure 5 B and C) :
insolation fell from 7-9 hours of sunshine per day to just 1 hour, and diurnal
radiance fell from 1200 to less than 200 joules cm-2 over the two months of
rearing. Furthermore, in November there was an increase in rainfall and
desalination at the surface of the production ponds is detrimental to phytoplankton
growth.
9

14-oct.16-oct.
18-oct.20-oct.
22-oct.24-oct.
26-oct.28-oct.
30-oct.01-nov.
03-nov.05-nov.
07-nov.09-nov.
11-nov.13-nov.
15-nov.17-nov.
19-nov.21-nov.
23-nov.25-nov.
27-nov.29-nov.
01-déc.03-déc.
05-déc.07-déc.
09-déc.05
101520253035404550556065707580
cell.
/ da
y (x
10*
9)
-120
-80
-40
0
40
80
120
w
ater
leve
l (cm
)
phyto (1995) phyto (1996) tidal range 1995 tidal range 1996
Figure 4. Relationship between the daily phytoplankton production in 1995 and 1996 and the tide cycle directly
measured at the pond level. A filling of the oyster ponds occurs when the seawater level is greater than 30 cm.
Figure 5. Environmental conditions (1) from October to December in 1995 and 1996. Weekly average air
temperature (A), insulation (B), solar energy (C) and cumulative rainfalls (D).
(1) (from Météo – France, 1995, 1996).
10

Table 3. Description of the algae abundance (cells/ml) in the oyster ponds at the experiment initiation (Octobre 14, 1996)
Family Type - Genus &
species Pond (N°)
1 2 3 4 5 Cell number per ml
Diatoms Skeletonema costatum
22600 0 0 360 180
Central diatoms 7800 20 20 6700 8100 Pennales diatoms 300 10 10 110 70 Haslea Ostrearia 0 0 0 0 0 Phytoflagellates 180 0 10 6300 7200 Dinoflagellates 10 0 0 440 620
3.2. Abundance and species composition of the algae in the oyster ponds.
Within the oyster ponds, the centric diatoms mainly consisted of the genera
Chaetoceros, Rhizosolenia, Coscinodiscus, Thallassiosira and Melosira, and the
pennate Nitzshia, Thalassionema, Asterionella and Bacillaria. Euglenophyta,
Cryptophyta, Rhodomonas sp and Dunaliella sp constituted the principal
phytoflagellates. The dinoflagellates were represented by Gymnodynium,
Kryptoperidinium, Oxyrrhis and Scripsiella.
When the oyster cultures were set up in mid-October, pond 1 had a
naturally high concentration of Skeletonema sp (22600 cells ml-1) (table 3). The
algal populations showed the same pattern in ponds 4 and 5, with a predominance
of centric diatoms and phytoflagellates (6300-8100 cells / ml). Ponds 2 and 3
showed no signs of an algal bloom. However, the limited difference among ponds
resulting from one measurement at the initiation of the experiment is negligible
compared to the phytoplankton fluxes and algae concentrations which were
massively added later on into the ecosystem.
The introduction of oysters at 20 per m-2 (ponds 1, 2, 3 and 4), together with the
addition of algae (ponds 2 and 4), induced significant differences in the algal
11

populations present in the ponds (figure 6). From a qualitative point of view, the
main families that predominated were the pennates (principally Nitzshia sp.), the
phytoflagellates and Skeletonema sp, which were quickly filtered by the oysters.
A comparison of the populations of algae in the control pond with those of ponds
1 and 3 clearly shows that the pennates, and in particular Nitzshia sp., were
consumed in preference to the phytoflagellates : the concentration of the former
dropped by a factor of 40 compared with a factor of only 4 for the latter. The
continuous supply of algae modified considerably the chemical equilibrium of
ponds 2 and 4. Thus, the concentration of ammoniacal nitrogen in the water
column was between 3.0 – 4.8 µmol l-1 for the -supplemented ponds, compared
with 0.9 – 2.8 µmol l-1 for the 3 other ponds. Very few Skeletonema sp were found
among the plankton in the ponds at the end of the experiment (< 50 cell ml / ml).
Although initially present in abundance, they were consumed in preference to the
pennate (Nitzshia sp.) which were present in high concentrations in the water
column throughout the experiment (2000-3000 cell ml-1).
12

0
200
400
600
800
1000
1 2 3 4 5 6 7
alga
e (n
/ m
l)
control pond
0
50
100
150
200
250
1 2 3 4 5 6 7
alga
e (n
/ m
l)
oyster pond 1
oyster pond 3
0
500
1000
1500
2000
2500
3000
3500
Ske
leto
nem
aco
stat
um
Cen
tral
es
Pen
nale
s
Has
lea
ostr
earia
Phy
tofla
gela
tes
Din
ofla
gela
tes
dive
rs
alga
e (n
/ m
l)
oyster pond 2
oyster pond 4
Figure 6. Average abundance of the main phytoplanktonic species during the Crassostrea gigas fattening
period in 1996 ; control pond, without oyster ; ponds 2 - 4 and ponds 1 - 3, with- and without algae
respectively. The results represent the mean of 9 weekly samples over the experimental time.
3.3. Growth and quality of oysters
A comparison of ponds supplemented with algae (2, 4) and the others (1, 3)
shows that the addition of algae had a significant effect on oyster growth (p <=
0.008) and on the AFNOR quality index (p = 0.000), both in 1995 and 1996 (table
4). Oyster weight increased in all ponds in 1995 and 1996 (table 5). Total weight
gain was between 0 and 9 % for the ‘traditional’ ponds and was as high as 14 %
for algae-supplemented ponds. The use of algae as a supplement had a highly
significant effect on dry meat weight, which increased by as much as 17 % in
pond 4 in 1995 and 1996, and in pond 2 in 1996. For the ‘traditional’ ponds, dry
13

weight loss was between 4 % and 15 % over the two months of culture. In 1995,
the AFNOR index fell by 12 to 10.5 % during the first fortnight in October in all
of the ponds (figure 7). The dietary supplement in ponds 2 and 4 kept the AFNOR
index stable at its original value for pond 4, when at the same time the loss was
close to 20 % for ponds 1 and 3, where the traditional farming method was used
(table 5). In 1998, the addition of algae supplement as early as the second
fortnight in October prevented the drop in the index that was observed on the 5 of
November in ponds 1 and 3. At the end of the culture, the ponds fell into three
significantly different "groups" : pond 4, where the index increased by 10 to 15 %
and pond 2, where the AFNOR index after two months was identical to the initial
value (~ 11). Finally, the AFNOR index of the oysters that did not receive a
dietary supplement of algae fell by up to 10 % compared with the original value.
Afn
or in
dex
(%) oyster pond
1234
8
9
10
11
12
13
oct-19 nov-05 nov-25 dec-16
Afn
or in
dex
(%) oyster pond
1234
8
9
10
11
12
13
oct-04 oct-18 nov-08 dec-05
1996
1995
Figure 7. AFNOR index variability (wet meat weight/total weight x 100) of the Pacific cupped oyster
(Crassostrea gigas) during the 1995 and 1996 fattening periods.
14

Table 4. ANOVA tables of the total weight, dry meat weight and AFNOR index to assess 'Pond' effect on oyster growth in 1995 and 1996.-
Source of variation
among ponds treatment
Degree of freedom
F (Fisher's test)
Probability (p)
1995 Total weight 3 3.99 0.008 Dry Meat weight 3 31.62 0.000 AFNOR index 3 21.49 0.000 1996 Total weight 3 8.90 0.000 Dry meat weight 3 20.31 0.000 AFNOR index 3 24.71 0.000 Table 5. Growth comparisons between reared populations in food supplemented ponds and non
supplemented ponds (± STE). Ponds N°2 and 4 were supplemented by food in contrast to pond N°1 and 3. Significant effect at 1 ‰ level (p < 0.001), 1% (0.001< p < 0.01), 5 % (0.01< p < 0.05). * : comparison among ponds.
Year
Pond N°
Total weight
(g)
Com
parison *
Dry m
eat w
eight (g)
Com
parison *
AFN
OR
index (%
)
Com
parison *
1995 1 49.44 ± 0.75 A 1.52 ± 0.02 A 9.55 ± 0.19 A 3 50.72 ± 0.65 A 1.55 ± 0.02 A 9.71 ± 0.19 A 2 52.94 ± 0.78 B 1.68 ± 0.02 B 10.52 ± 0.23 B 4 50.83 ± 0.70 A 1.80 ± 0.03 C 11.67 ± 0.23 C
1996 1 56.77 ± 0.51 A 1.08 ± 0.02 A 10.52 ± 0.19 AB 3 57.77 ± 0.51 A 1.03 ± 0.03 A 9.99 ± 0.21 A 2 60.26 ± 0.51 B 1.22 ± 0.03 B 10.93 ± 0.18 B 4 59.68 ± 0.64 B 1.32 ± 0.03 C 12.27 ± 0.19 C
Year
Pond N°
Total weight
gain (%)
Dry m
eat w
eight gain (%)
AFN
OR
index gain (%
)
1995 1 + 1.2 / + 6.1 - 14.6 / -10.7 - 22.0 / - 17.5 3 + 4.1 / + 9.6 -12.9 / - 9.0 - 20.7 / -16.1 2 + 8.4 / + 13.6 - 5.4 / - 1.4 - 14.2 / - 8.9 4 + 4.2 / + 8.9 + 1.4 / + 5.5 - 4.7 / + 0.8
1996 1 - 1.6 / + 1.9 - 9.8 / - 3.9 - 6.1 / - 0.8 3 + 0.1 / + 3.7 - 14.1 / - 8.3 - 11.1 / -5.6 2 + 4.5 / + 8.1 + 2.1 / + 8.3 - 2.3 / + 2.9 4 + 3.2 / + 7.3 + 10.7 / + 17.0 + 9.8 / + 15.4
15

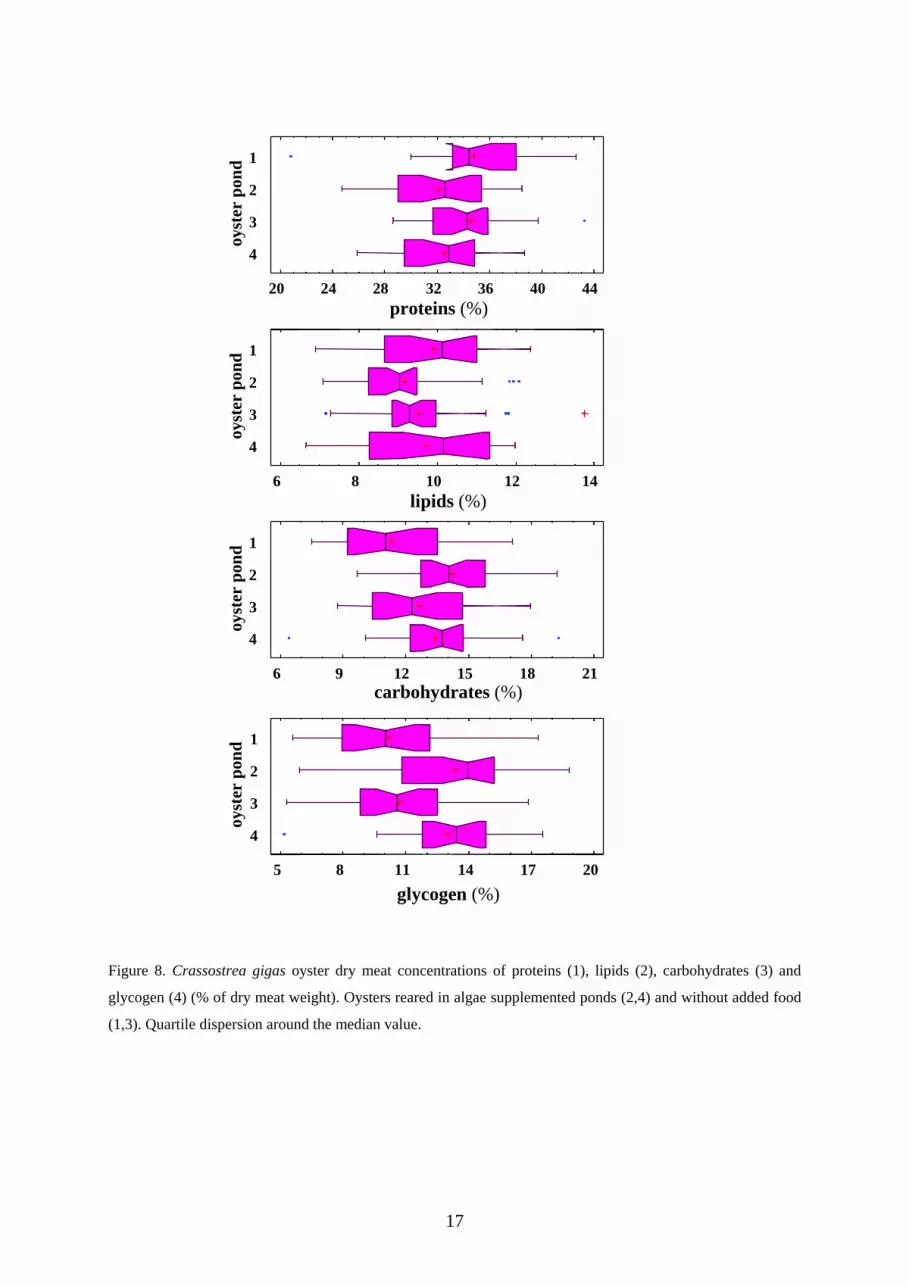
3.4 Proximate biochemical composition
The proximate biochemical composition of the oysters reared in the algae-
supplemented and the regular ponds were estimated from November 5th until
December 16th 1996. Proteins' and lipids' concentrations ranged between 32.1-
34.7% and 9.2-9.9% of dry meat weight respectively. Significant differences were
observed among ponds at 1% and 1‰ level for carbohydrates and glycogen
respectively (Kruskal and Wallis test) (table 6, figure 8). Therefore, the algae
supplement allowed a 2-3% increase of the glycogen concentration. The ratio
glycogen/total carbohydrates reached 85-90% in ponds 1 and 3 (without added
food) while a 93-97% concentration was obtained when supplemented food was
provided.
Table 6. Proximate biochemical analysis of the Crassostrea gigas oyster dry meat (%), fattened in ponds supplemented by algae (2, 4) and without supplement (1, 3) in 1996.
Pond N°
1 2 3 4 p (1)
Proteins (%) 34.76 32.07 34.55 32.55 0.068 Lipids (%) 9.90 9.16 9.52 9.72 0.343 Carbohydrates (%) 11.36 14.24 12.66 13.38 0.005 Glycogen (%) 10.18 13.31 10.71 13.00 p < 0.000
(1). Probability associated to the Kruskal – Wallis rank test (Statgraphic, V3.1)
16
oyst
er p
ond 1
2
3
4
20 24 28 32 36 40 44
oyst
er p
ond 1
2
3
4
6 8 10 12 14
oyst
er p
ond 1
2
3
4
6 9 12 15 18 21
oyst
er p
ond 1
2
3
4
5 8 11 14 17 20
proteins (%)
lipids (%)
carbohydrates (%)
glycogen (%)
Figure 8. Crassostrea gigas oyster dry meat concentrations of proteins (1), lipids (2), carbohydrates (3) and
glycogen (4) (% of dry meat weight). Oysters reared in algae supplemented ponds (2,4) and without added food
(1,3). Quartile dispersion around the median value.
17

4. Discussion
4.1 Primary production
Suspended matter in the ponds rapidly sediments and light can penetrate the
water column more easily than in the bay. If the supply of nutrients is sufficient,
phytoplankton blooms can develop when light is a limiting factor on the foreshore
(Soletchnik et al., 1998b). This explains why an algal bloom could occur in
December 1996 in the experimental ponds when the radiance and the temperature
were low. A chlorophyll concentration of 20 µg l-1 was also observed in a similar
ecosystem in December 1982 (Goulletquer et al., 1988).
The meteorological conditions were similar in the autumn of 1995 and 1996.
The production of algae was 2.5 times greater in 1996, resulting from the use of
the ‘continuous’ method of culture. Phytoplankton were added during the ‘neap
tides’, when no seawater replenishes the ponds. The temperature and insolation
conditions were sufficient to allow a significant production of algae from mid-
October to mid-November. The succession of low pressure systems in November
and the low temperatures in December resulted in a disappearance of blooms in
the open-air ponds, despite an enrichment of the culture medium with iron
(Hussenot and Gautier, 1994 ; Hussenot et al., 1998).
Oysters produce nitrogen waste by excretion and certain species of
phytoplankton, such as the diatom Nitzshia sp., are better able to metabolise
nitrogen in an organic rather than a mineral form (Robert et al., 1979a; Robert et
al., 1981; Maestrini and Robert, 1981; Vincendeau, 1987). The diatom responsible
for greening fattened oysters, Haslea ostrearia, is also an opportunistic species
18

whose development is associated with the decline of algal blooms, and in
particular with the disappearance of chlorophyll a and c (Moreau, 1970). This
author defined greening as an ecological phenomenon of disrupted metabolism
that alternates with the development of flora within the oyster pond. More
recently, several studies have refined our knowledge of this species and attempted
to control its production (Robert, 1982; Turpin et al., 1998). Concerning the
cultures set up in the autumn of 1995 and 1996, the flora biodiversity found in the
ponds was limiting the ‘greening’ process targeted by the oyster farmers.
A study of the algal populations and a comparison of the different ponds
confirmed that C. gigas carries out a selection on the organic matter in suspension
in the natural environment (Riera and Richard, 1996), and between the different
families of algae (Bougrier et al., 1997). In the context of this study, the diatom
Skeletonema costatum was consumed in preference to the pennate Nitzshia sp.,
whereas the oysters avoided the phytoflagellates.
4.2. Growth and quality of the cultured oysters
In the 70’s, during the fattening period, oysters were cultured at 3-4
oysters m-2 (Deslous-Paoli et al., 1981 ; Zanette and Garnier, 1981). When the
AFNOR norm was introduced in 1985 for the ‘fines de claires’, a one month
fattening period at a ma ximal density of 20 C. gigas per m2 was authorised. This
density is commonly used by oyster farmers on their farms. In the autumn of
1996, there was a daily gain in dry weight during fattening on traditional farms of
between 1.1 and 2.1 mg day-1 within the intertidal area in the south of the
Marennes Oléron Bay (growth monitoring network data from the LCPC).
However weight loss was observed in oyster ponds (between 1.4 and 2.2 mg day-
19

1). In 1996, the climatic and hydrological conditions facilitated oyster growth
rates within the intertidal area, and mainly in the southern part of the bay.
Nevertheless, for almost 10 years oysters grown in the 6 stations spread out over
the Marennes Oléron Basin (LCPC growth network) have often shown a
significant loss of dry weight during the autumn (Le Moine et al., 2000). This
result is in agreement with those of Deslous-Paoli and Héral (1988) who reported
negative growth of C.gigas in October in the Marennes Oléron Bay. This period
was marked by a temperature decline and a shortening of the photoperiod.
Although the oyster has adapted well to the French coast, the fact remains that it
is an exotic species in terms of its development (phylogenesis) and its biological
cycle means that it passes through a period of relative fragility in summer and
autumn (Soletchnik et al., 1997). The concentration of oyster leasing grounds in
the Marennes Oléron Basin, and in particular in the south (Soletchnik et al., in
press), induces a biomass overstocking problem, reducing the trophic resources
available for the renewed period of growth after the spawning in summer. Primary
production is low during this period. The ‘biological’ advantages of deploying
oysters in oyster ponds during this period are somewhat irregular and are mainly
associated with the penetration of sunlight into the water column. However, this
advantage is limited since the photoperiod is decreasing over time in the autumn.
The absence of food for 8-10 days in a row during the neap tides constitutes the
main constraint of placing the oyster stocks in ponds. In the situation where a
choice must be made between rearing in the autumn on the foreshore or in oyster
ponds, the conditions of climate, with their annual variations, must be weighed
against primary production, which is low in the autumn but is higher in ponds
than on the foreshore. By contrast, during this period a significant part of the
20

resource of nutrients accessible to oysters comes from organic matter that was
deposited on the foreshore or at the bottom of the oyster ponds and is then
resuspended. This organic matter derives from detritus, living organisms and by-
products of oyster biodeposits (Deslous-Paoli, 1980; Sornin et al., 1987; Cariou
and Blanchard, 1994). Turbulence is much greater along the foreshore than in the
oyster ponds. This turbulence comes from tidal currents, the lapping of the waves
and the shearing effect (direct erosion) caused by the wind. In oyster ponds, the
food supply is resuspended through hydrodynamic action, over a period which is
limited to a few hours a week. The wind plays the most important role in this
process and is probably the main factor responsible for fattening quality in oyster
beds.
Using the conditions defined by the ‘spéciale de claire’ norm for fattening (10
oysters per m2 for 1 month), C. gigas dry weight fell by between 0 and 25 %
between 1990 and 1994 (Blachier et al., 1998). Using the farming conditions for
‘fine de claire’ (20 oysters per m2 for 2 months), the loss of dry weight was
between 4 % and 15 % . These results show that density is not the only critical
factor for fattening C.gigas in oyster ponds. Differences in density of between 2.5
and 10 oysters m-2, using traditional conditions of fattening, did not result in any
differences in growth (Soletchnik et al., 1995). A similar result was obtained in
1995, when a density of 40 oysters m-2 was compared to a density of 20 oysters
m-2. Robert et al. (1998) came to the same conclusions with densities of 10, 20
and 30 oysters per m2. Thus, even if densities in the beds are increased, this factor
should not be considered without additional factors such as meteorological data in
‘fattening’ oysters.
21

By contrast, the effect of the dietary supplement, which was 2.5 times
greater than in 1996 compared with 1995 and which was seen earlier in 1996, was
directly related to the fattening index (AFNOR) at the end of maturation. The
importance of this supplement, compared with the results obtained in the control
oyster ponds, would appear to provide a clear explanation for the improved
growth rates achieved at the end of fattening process. This relationship between
the quantity of algae found at the outlet of the culture pond and the end product of
autumn fattening is one of the only cause and effect relationships established
during this process. The second concerns an experiment carried out in 1994, when
it was shown that currents dependent on the prevailing winds concentrated
particulate matter in those sectors where oyster growth rate was significantly
greater (Soletchnik et al., 1995).
In general, the fattening index at the end of the process will depend on the
initial quality of the stock (Blachier et al., 1998 ; Robert et al., 1998). Thus, with
an initial AFNOR condition index of 11-12, oysters end up with a repletion index
greater than 9 and fulfill the requirements of the ‘Spéciale de claire’ norm. This
becomes more difficult to achieve if the initial index is below 10.
4.3. Variability of the fattening results
Although the variability among different geographical 'pond' sectors of the
Marennes Oléron bay is high (Blachier et al., 1998), this is also true for oyster
ponds within the same experimental structure. In 1995 and in 1996, oysters
conditioned in pond 2 grew significantly less than those in pond 4, despite the fact
22

that the former were exposed to the same experimental conditions. Similarly, the
algal populations were different in the four ponds at the time when the
zootechnical test was set up. Thus each pond, within the same geographical area,
behaves like an individual mesocosm due to sediment characteristics. This
extensive ‘behavioural heterogeneity’ in this type of ecosystem can also be seen
in the greening process. When an oyster bed is divided into several sectors,
Haslea ostrearia often only colonises selected ones (Grelon, 1978).
5. Conclusion
The technical know-how required for the oyster fattening process is not
yet sufficiently advanced to control and reduce the variability in the quality of the
end product of oyster farming, which is subject to variations in climate and the
environmental pond characteristics. The comparison made between growth rates
during the autumn period in ponds or on the foreshore showed that meteorological
conditions are critical factors. Thus, a full tide followed by a sunny period can be
sufficient to allow algal blooms to develop in December in the ponds but not on
the foreshore. By contrast, phytoplanktonic blooms can still occur on the
foreshore in October. Although several research programs have been carried out,
on Haslea ostrearia, greening in oyster farms remains a ‘haphazard’ operation
(Turpin, 1999). Maintaining or even improving the quality of fattening during the
autumn is likely to require increased food availability by either resuspending
phytobenthic species or/and providing additional phytoplankton. For the first
approach, mechanical systems are expensive but rearing practices where
burrowing crustaceans (e.g. shrimp Peneaus japonicus) are combined with oysters
23

have given interesting results. Meanwhile, our study demonstrated clearly that an
algae dietary supplement continuously distributed during neap tides, was
undoubtedly responsible for improving the oyster dry meat weight (fattening
level) of the stock in the ponds. Therefore, the technical and biological feasibility
of this second approach was clearly demonstrated. However, the extra cost of
providing the cultures of algae, which has not been calculated in this study,
clearly needs further improvements to be used by professional farmers. Whatever
the case, it should be emphasized that the results of the fattening process are
strongly correlated with the initial quality of the product.
In the near future, product tracability will likely be required as well as a
certification of the technical processes. Based on our results, it appears that the
studied parameters are unable to guarantee the occurence of the fattening process
within ponds. Therefore, to address that matter, additional parameters to current
biometrics, and proximate biochemical composition will be considered including
biomarkers, such as polyunsaturated isoprenoid alkenes, aroma as well as fatty
acids composition (Belt et al., 1996; Le Guen et al., 2000; Piveteau et al., 1999).
Acknowledgements
The Regional Poitou-Charentes Council for financing this research program
within the pluriannual plan ‘Contrat de plan’ signed with IFREMER (1994-1998)
and entitled ‘Development of the Oyster Ponds’. The Shellfish Farmer's
organization (SRC Marennes Oleron) for sustaining the research effort.
24

References
AFNOR, 1985. Norme française huîtres creuses. Dénomination et classification. NF
V 45-056, 5 pp.
Baud, J.P., Brisset, E., Cardinal, M., 1995. Affinage contrôlé en bassin de l'huître
creuse Crassostrea gigas. IFREMER, RIDRV-95-17, 35 pp.
Belt, S.T., Cooke, D.A., Robert, J.M., Rowland, S.J., 1996. Structural
characterisation of widespread polyunsaturated isoprenoid biomarkers: A C25
triene, tetraene and pentaene from the diatom Haslea ostrearia Simonsen.
Tetrahedron Letters, 37:4755-4758.
Blachier, P., Carton, B., Guilbaud, Y., Huet, T., Machefaux, L., Oudot, G.,
Prenveille, C., Zanette, Y., 1998. Affinage de l'huître creuse (Crassostrea gigas)
en marais maritimes : bilan de quatre années d'expérimentation au Creaa (Centre
Régional d'Expérimentation et d'Application Aquacole). In: Hussenot J., Buchet
V. (eds), Marais maritimes et aquaculture. Actes colloq. Ifremer 19, Brest: 79-88.
Bougrier, S., Hawkins, A.J.S., Héral, M., 1997. Preingestive selection of different
microalgal mixtures in Crassostrea gigas and Mytilus edulis, analysed by flow
cytometry. Aquaculture 150, 123-134.
Cariou, V., Blanchard, G., 1994. Caractérisation et quantification pigmentaire du
microphytobenthos d'une vasière intertidale : résultats préliminaires. J. Rech.
Oceanogr. 19, 173-182.
Cochran, W.G., Cox, G.M., 1957. Experimental designs. Eds. Wiley and sons. 611
pp
Deltreil, J.P., Feuillet, M., Archambeau, G., 1977. Etude expérimentale de la
fertilisation phosphatée dans les claires à huîtres. Rev. Trav. Inst. Pêches marit.
25

41, 283-297.
Deslous-Paoli, J.M., 1980. Contribution à l'étude de la biologie de l'huître creuse
Crassostrea gigas (Thunberg) dans le bassin de Marennes-Oléron. Thèse de
doctorat de troisième cycle. Université d'Aix Marseille, 120 pp.
Deslous-Paoli, J.M., Zanette, Y., Héral, M., 1981. Amélioration de la forme et de la
qualité de l'huître Crassostrea gigas Thunberg dans les claires à huîtres de
Marennes Oléron. Rev. Trav. Inst. Pêches marit. 45, 181-194.
Deslous-Paoli, J.M., Héral, M., 1988. Biochemical composition and energy value of
Crassostrea gigas (Thunberg) cultured in the bay of Marennes-Oleron. Aquat.
Liv. Res. 1, 239-249.
Gautier, D., Ledu, C., Hussenot, J., Gérard, A., 1993. Production en masse de
Skeletonema costatum en bassins extérieurs par fertilisation minérale: Etude d'un
cycle estival. IFREMER, RIDRV-93.033-RA / CREMA-L'Houmeau / La
Tremblade, 35 pp.
Goulletquer, P., Nedhif, M., Héral, M., 1988. Production de Palourdes Japonaises
Ruditapes philippinarum (Adams et Reeve) en bassin semi fermé: Approche
énergétique et relations trophiques. Aquaculture 74, 331-348.
Grelon, M., 1978. Saintonge, pays des huîtres vertes. La Rochelle. Eds. Rupella. 364
pp.
Grizel, H., Héral, M., 1991. Introduction into France of the Japanese oyster
Crassostrea gigas. J. Cons. Int. Explor. Mer 47, 399-403.
Héral, M., 1989. Traditional oyster culture in France. In: Barnabé, (Eds),
Aquaculture, vol 1. (TEC & DOC) pp. 342-387.
Hussenot, J., 1992. Maîtriser la stimulation de la productivité naturelle permet de
proposer une aquaculture marine semi-extensive dans les marais de la côte
26
atlantique française. Aquarevue 41, 31-33.
Hussenot, J., Gautier, D., 1994. Techniques d'utilisation de la silice pour la
production en masse des algues diatomées. Synthèse des travaux 1989-1993.
IFREMER, RIDRV-94.03-RA / CREMA-L'Houmeau, 26 pp.
Hussenot, J., Brossard, N., 1995. Premiers essais automnaux de culture de diatomées
en masse (24 m3) sur eau de mer fertilisée (N/P/Si). Culture sans ensemencement
et conditions limitantes. IFREMER, RIDRV-95.02-RA / CREMA-L'Houmeau, 54
pp.
Hussenot, J., Brossard, N., Lefebvre, S., 1998. Mise au point d'un enrichissement de
l'eau de mer pour produire en masse des microalgues diatomées comme fourrage
pour les huîtres affinées ou stockées en claires. In: Hussenot J., Buchet V. (Eds),
Marais maritimes et aquaculture. Actes colloq. Ifremer 19, Brest, 107-115.
Koroleff, F., 1969. Direct determination of ammoniac in natural waters as
indophenol blue. CI.E.M., C2, 19, 22p.
Le Guen, S., Prost, C., Demaimay, M., 2000. Application of three aroma extraction
techniques for the screening of impact odorants in cooked mussels Mytilus edulis.
WAS, EAS Special Publication N°28, p. 383.
Le Moine, O., Geairon, P., Soletchnik, P., Faury, N., Goulletquer, P., Robert, S.,
Razet, D., Heurtebise, S., Taillade, S., 2000. Réseau de surveillance de la
croissance et de la production de l'huître creuse Crassostrea gigas dans le bassin
de Marennes Oléron: bilan de 12 années de suivi (1986-1998). IFREMER,
DIR/RST/2000/02, 46p.
Maestrini, S.Y., Robert, J.M., 1981. Rendements d'utilisation des sels nutritifs et
variation de l'état des cellules de trois diatomées des claires à huîtres de Vendée.
Oceanol. Acta 4, 13-21.
27

Météorologie Nationale, 1995, 1996. Bulletins climatiques mensuels, pp 25.
Moreau, J., 1967. Recherches préliminaires sur le verdissement en claires :
l'évolution de leurs divers pigments liée au complexe pigmentaire de Navicula
ostrearia Bory. Rev. Trav. Inst. Pêches marit. 31, 373-382.
Moreau, J., 1970. Le Bassin de Marennes Oléron et l'importance des claires à huîtres.
Rev. Trav. Inst. Pêches marit. 34, 383-462.
Neuville, D., Daste, P., 1970. Premières observations concernant la culture unialgale
de souches de diatomées provenant de claires ostréicoles de l'Ile d'Oléron. C. R
Acad. Sci., Paris 270, 2486-2488.
Papy, H., 1941. La côte atlantique de la Loire à la Gironde. Tome 1 : Les aspects
naturels. Introduction à une étude de géographie humaine. Tome 2 : L'homme et
la mer. Etude de géographie humaine. Bordeaux. Eds. Delmas, 302 pp et 528 pp.
Piveteau, F., Gandemer, G., Baud, J.P., Demaimay, M., 1999. Changes in lipid and
fatty acid compositions of European oysters fattened with Skeletonema costatum
diatom for six weeks in ponds. Aquaculture International 7, 341-355.
Riera, P., Richard, P., 1996. Isotopic determination of food sources of Crassostrea
gigas along a gradient in the estuarine bay of Marennes – Oléron. Estuar. Coast.
Shelf. Sci. 42, 347-360.
Robert, J.M., 1973. La diatomée Navicula ostrearia Bory en baie de Bourgneuf. Rev.
Trav. Inst. Pêches marit. 37, 363-368.
Robert, J.M., 1982. Fertilité des eaux des claires ostréicoles et verdissement :
Utilisation de l'azote par les diatomées dominantes. Thèse de doctorat d'Etat.
Université de Nantes, 281 pp.
Robert, J.M., Maestrini, S.Y., Bagès, M., Dréno, J.P., 1979a. Estimation aux moyens
de tests biologiques, de la fertilité pour trois diatomées des eaux des claires à
28

huîtres de Vendée. Oceanologica Acta 2, 275-286.
Robert, J.M., Maestrini, S.Y., Héral, M., Rincé, Y., Dreno, J.P., Beker, L., 1979b.
Enrichissement expérimental d'eaux printanières de claires à huîtres en baie de
Bourgneuf (Vendée, France) : augmentation de la biomasse et utilisation des
éléments nutritifs par les algues unicellulaires. Hydrobiologia 96, 53-63.
Robert, J.M., Maestrini, S.Y., Héral, M., Zanette, Y., 1981. Production des
microalgues des claires ostréicoles en relation avec l'azote organique dissous
excrété par les huîtres. Oceanologica acta, Proceedings of the International
Symposium on coastal lagoons, UNESCO, Bordeaux, 8-14 September 1981, 389-
395.
Robert, S., Goulletquer, P., Soletchnik, P., Geairon, P., Le Moine, O., Razet, D.,
Faury, N., Taillade, S., 1998. Affinage des huîtres creuses Crassostrea gigas en
claires ostréicoles du Bassin de Marennes Oléron : étude des modifications de la
Norme AFNOR-NF V 45 056. IFREMER, RIDRV-98.15-RA / La Tremblade, 36
pp.
SECODIP, 1999. Statistiques de productions et de consommations en France.
Bulletin annuel 1998, 25p.
Soletchnik, P., Razet, D., Goulletquer, P., Geairon, P., Le Moine, O., Faury, N.,
1995. Analyse de la capacité trophique de l'écosystème "claires ostréicoles" dans
le cadre de l'affinage de l'huître creuse Crassostrea gigas (Bassin de Marennes-
Oléron). IFREMER, RIDRV-95.24-RA / La Tremblade, 43 pp.
Soletchnik P., Razet, D., Geairon, P., Faury, N., Goulletquer, P., 1997.
Ecophysiologie de la maturation sexuelle et de la ponte de l’huître creuse
Crassostrea gigas: réponses métaboliques (respiration) et alimentaires (filtration,
absorption) en fonction des différents stades de maturation. Aquat. Living Resour.
29

10(3), 177-185.
Soletchnik, P., Razet, D., Goulletquer, P., Geairon, P., Le Moine, O., Faury, N.,
1998a. Relation entre la capacité trophique de l'écosystème "claires ostréicoles"
(Bassin de Marennes Oléron) et la production de l'huître creuse Crassostrea gigas
en période d'affinage. In: Hussenot J., Buchet V. (Eds), Marais maritimes et
aquaculture. Actes colloq. Ifremer 19, Brest, 89-96.
Soletchnik, P., Faury, N., Razet, D., Goulletquer, P., 1998b. Hydrobiology of the
Marennes-Oléron bay. Seasonal indices and analysis of trends from 1978 to 1995.
Hydrobiologia 386, 131-146.
Sornin, J.M., Delmas, D., Deslous-Paoli, J.M., 1987. Evolutions quantitatives et
qualitatives du seston dans une claire à huîtres. Relation avec la sédimentation et
la biodéposition. Océanis 13, 531-541.
Turpin, V., Robert, J.M., 1998. Fertilité potentielle des eaux des claires ostréicoles
de la région de Marennes – Oléron pour Haslea ostrearia Simonsen, en période
d'affinage des huîtres. In: Hussenot J., Buchet V. (Eds), Marais maritimes et
aquaculture. Actes colloq. Ifremer 19, Brest, 97-106.
Turpin, V., Robert, J.M., Goulletquer, P., 1999. Limiting nutrients of oyster ponds
seawater in the Bay of Marennes Oléron region for Haslea ostrearia (Simonsen):
application to the mass production of the diatom in mesocosm experiments.
Aquatic Liv. Res. 12(5), 335-342.
Turpin, V., 1999. Etude des évènements physico-chimiques et biologiques présidant
à la prolifération d'Haslea ostrearia (Simonsen) dans les claires ostréicoles de la
région de Marennes – Oléron : implication dans la maîtrise du verdissement.
Thèse de l'Université de Nantes, pp 208.
Vincendeau, M.L., 1987. Etude expérimentale de la fertilité des eaux des milieux
30

conchylicoles : influence de l'excrétion des huîtres et des palourdes sur la
production des diatomées dominantes. Thèse de Doctorat de l'Université Paris 6
Spécialité : Algologie. pp 223.
Zanette, Y., Garnier, J., 1981. Etude préliminaire de l'impact des huîtres Crassostrea
gigas Thunberg en élevage sur la biomasse des microorganismes des claires de
Marennes – Oléron. Cons. Inter. Expl. Mer, C.M. – L : 14pp.
31


