Embed Size (px)
Citation preview
2007) 129–138www.elsevier.com/locate/aqua-online
Aquaculture 267 (
Optimum dietary protein and lipid specifications for juvenilemalabar grouper (Epinephelus malabaricus)
Le Anh Tuan a, Kevin C. Williams b,⁎
a Faculty of Aquaculture, Nha Trang University, Nha Trang, Khanh Hoa, Viet Namb CSIRO Division of Marine Research, PO Box 120, Cleveland, Qld. 4163, Australia
Received 9 November 2006; received in revised form 6 March 2007; accepted 7 March 2007
Abstract
An 8-week comparative slaughter experiment was carried out to determine the optimal dietary dry matter (DM) crude protein(CP) and lipid for growth and nutrient retention of malabar grouper. Fingerlings of mean (±SD) starting weight of 17±1.3 g werefed twice daily to satiety one of 16 pelleted dry feeds (∼ 93% DM) that provided a 4×4 factorial comparison of seriallyincremented CP (from 44 to 60%) and lipid (from 7 to 23%) with three tank replicates (10 fish per tank). Tanks (100 L) weresituated within an enclosed laboratory and provided with bio-filtered, constant temperature (29±0.7 °C) recirculated seawater andwith supplementary aeration.
Fish survival averaged 94±5.3% and was unaffected by treatment. Modelling of the fish's response to dietary CP and lipidshowed that growth, feed conversion ratio (FCR) and dietary energy retention were all optimized when dietary CP was 55–56%;DM feed intake was highest for diets with the highest protein (60%) and lowest lipid (7%) content while N retention wasmaximized at 49% CP. The optimal dietary lipid level was about 12% for growth rate and N and energy retentions, and 17.5% forFCR. Changes in the whole body (WB) composition of the fish were more direct: protein composition decreased linearly as dietaryprotein increased (with increasing dietary lipid tending to have an opposing effect), while lipid composition increased linearly asdietary protein and lipid both increased. Thus, WB lipid was highest for fish fed the highest protein (60%) and the highest lipid(23%) diet while WB protein was greatest for fish fed the lower protein (44 or 50%) and highest lipid (23%) diets. Recommendeddietary protein, lipid and protein to energy ratio specifications for optimal productivity of juvenile malabar grouper are 55%, 12%and 28 g CP:MJ gross energy, respectively.© 2007 Elsevier B.V. All rights reserved.
Keywords: Nutrition; Feeding; Requirements; Protein to energy; Cod; Retention
1. Introduction
Improved hatchery technology and a more reliablesupply of hatchery-reared fry has resulted in a 10-foldexpansion in grouper aquaculture production in eastern
⁎ Corresponding author. Tel.: +61 7 3826 7284; fax: +61 7 3826 7222.E-mail address: [email protected] (K.C. Williams).
0044-8486/$ - see front matter © 2007 Elsevier B.V. All rights reserved.doi:10.1016/j.aquaculture.2007.03.007
Asia since the mid-1990's, with production now morethan 52,000 metric tonnes per annum (FAO, 2005).Trash fish is presently the main food source for rea-ring grouper in the region but its decreasing supply,increasing cost and downstream environmental impacts(Beveridge, 1996; New, 1996; Williams, 2002) areheightening the need for pelleted feeds and in turn, agreater knowledge of the fish's nutritional requirements.
130 L.A. Tuan, K.C. Williams / Aquaculture 267 (2007) 129–138
The nutritional requirements of groupers have beenreviewed most recently by Boonyaratpalin (1997) andChen (2001) who concluded that diets need to be highin crude protein (CP; 45 to 55%) and with up to 14%lipid to ensure good growth of the fish. More recentstudies have indicated that dietary protein and lipidrequirements of groupers may differ both between spe-cies and with size of the fish. For juvenile gold spotgrouper Epinephelus coioides, Luo et al. (2004) foundfish growth and feed conversion ratio (FCR) werebest when diets contained 48% CP (and 11% lipid) and53% CP (and 9% lipid), respectively. For the muchslower growing humpback grouper Cromileptes altive-lis, Williams et al. (2004) found growth and FCR ofjuveniles improved linearly up to the maximumexamined dietary CP level of 63% dry matter (DM)(58% on an as-fed basis) and this was independent ofdietary lipid over the range from 15 to 24% DM (14 to22%, on an as-fed basis). For humpback grouper of150–400 g size, the optimal dietary CP and lipidspecification was found to be 53% and 12%, respec-tively (Usman et al., 2005). Using a factorial approachto determine nutritional needs of the Mediterraneanwhite grouper Epinephelus aeneus, Lupatsch and Kissil(2005) advocated that for optimal nutrient efficiencydietary CP specification should decrease from 55 to40% as fish grew from 2 to 500–700 g; protein toenergy ratio correspondingly should decrease from 29to 21 g CP per MJ gross energy, which could be ac-commodated by increasing dietary lipid from 10 to14%.
Malabar grouper Epinephelus malabaricus is ahighly valued fish in the Asian live fish markets and isone of the most commonly farmed grouper species in SEAsia (Boonyaratpalin, 1997; Miao and Tang, 2002).However, there is very little published information on itsprotein and lipid (energy) requirements. Chen and Tsai(1994) fed juvenile malabar grouper casein-based semi-purified diets and found a dietary CP level of 48%resulted in maximal growth. With fish meal-based semi-purified diets, Shiau and Lan (1996) reported juvenilemalabar grouper did best on a diet containing 50% CPwhen the fat content was 7% but increasing the fat to13–14% enabled the CP content to be reduced to 45%without a significant adverse effect on growth. Morerecently, the effect of varying the lipid content ofisonitrogenous (50% CP) diets on the growth and theimmune response of malabar grouper was investigatedby Lin and Shiau (2003). They found that fish grew wellon diets containing from 4 to 12% lipid (optimum beingabout 9%) while growth, but not immune competence,was depressed with 16% lipid.
This paper reports a comparative slaughter experi-ment in which juvenile malabar grouper were fed dietsthat varied factorially in protein and lipid over a widerange. Productivity, body composition and nutrientretention responses of the fish were modelled to betterunderstand the independent and interactive effects ofvarying dietary protein and lipid and this informationwas used to derive optimal dietary protein, lipid andprotein to energy specifications for juvenile malabargrouper.
2. Materials and methods
2.1. Experimental design and diets
An 8-week growth and nutrient retention experimentwas carried out with juvenile malabar grouper to exam-ine the interactive effects of varying dietary protein andlipid on growth, nutrient retention and body composi-tion. Sixteen diets were formulated to provide a 4×4factorial of CP (from 44 to 60% DM at equal incre-ments) and lipid (from 7 to 23% DM at equal incre-ments), with three tank replicates of fish per treatment.Changes in the dietary concentrations of CP and lipid ina fish meal-based formulation were achieved by serialadjustment of casein (for protein) or a mixture of fish oiland soybean oil (for lipid) at the expense of tapiocastarch (Table 1).
Feed ingredients were finely ground and dry-mixedin a 20 L Chufood planetary dough mixer/meat mincer(CS 200, Chuseng Food Machinery Works Co. Ltd,Taichung, Taiwan, R.O.C.) before the oil and suffi-cient water were added to form a dough of approxi-mately 40 to 50% moisture. The dough was twiceextruded through a 3 mm diameter die plate and theresultant feed strands transferred to a commercial steam-ing oven (Stoddart Metal Fabrication P/L, Sunnybank,Queensland, Australia) for 5 min. After steaming, thefeed strands were dried overnight at 40 °C in a forceddraught oven, broken into pellets of 3 to 4 mm lengthand stored at −20 °C until just before use.
2.2. Fish, tanks and experimental management
Fingerlings were purchased from a local hatcheryand transported to the University of Fisheries seawaterlaboratory at Nha Trang, Vietnam. After 1-week ofacclimatization, fish were sorted by weight and absenceof physical abnormalities into a uniform group of 500fish of mean (±SD) weight of 17±1.3 g. Four hundredand forty eight of these fish were randomly distributedto the experimental tanks at an equal stocking rate of 10
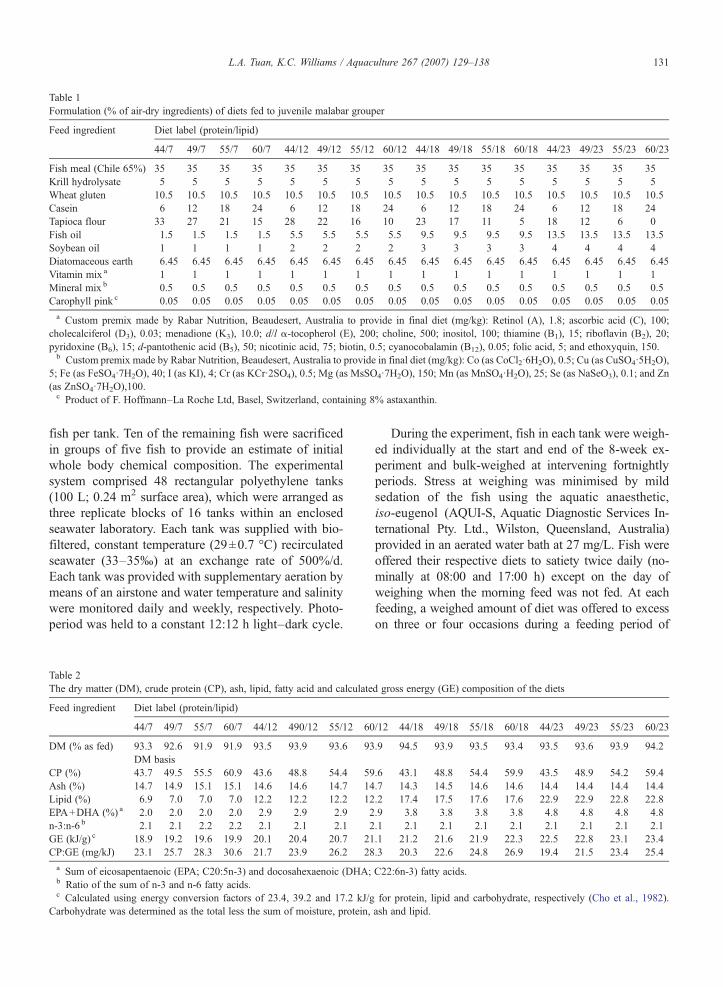
Table 1Formulation (% of air-dry ingredients) of diets fed to juvenile malabar grouper
Feed ingredient Diet label (protein/lipid)
44/7 49/7 55/7 60/7 44/12 49/12 55/12 60/12 44/18 49/18 55/18 60/18 44/23 49/23 55/23 60/23
Fish meal (Chile 65%) 35 35 35 35 35 35 35 35 35 35 35 35 35 35 35 35Krill hydrolysate 5 5 5 5 5 5 5 5 5 5 5 5 5 5 5 5Wheat gluten 10.5 10.5 10.5 10.5 10.5 10.5 10.5 10.5 10.5 10.5 10.5 10.5 10.5 10.5 10.5 10.5Casein 6 12 18 24 6 12 18 24 6 12 18 24 6 12 18 24Tapioca flour 33 27 21 15 28 22 16 10 23 17 11 5 18 12 6 0Fish oil 1.5 1.5 1.5 1.5 5.5 5.5 5.5 5.5 9.5 9.5 9.5 9.5 13.5 13.5 13.5 13.5Soybean oil 1 1 1 1 2 2 2 2 3 3 3 3 4 4 4 4Diatomaceous earth 6.45 6.45 6.45 6.45 6.45 6.45 6.45 6.45 6.45 6.45 6.45 6.45 6.45 6.45 6.45 6.45Vitamin mix a 1 1 1 1 1 1 1 1 1 1 1 1 1 1 1 1Mineral mix b 0.5 0.5 0.5 0.5 0.5 0.5 0.5 0.5 0.5 0.5 0.5 0.5 0.5 0.5 0.5 0.5Carophyll pink c 0.05 0.05 0.05 0.05 0.05 0.05 0.05 0.05 0.05 0.05 0.05 0.05 0.05 0.05 0.05 0.05a Custom premix made by Rabar Nutrition, Beaudesert, Australia to provide in final diet (mg/kg): Retinol (A), 1.8; ascorbic acid (C), 100;
cholecalciferol (D3), 0.03; menadione (K3), 10.0; d/l α-tocopherol (E), 200; choline, 500; inositol, 100; thiamine (B1), 15; riboflavin (B2), 20;pyridoxine (B6), 15; d-pantothenic acid (B5), 50; nicotinic acid, 75; biotin, 0.5; cyanocobalamin (B12), 0.05; folic acid, 5; and ethoxyquin, 150.b Custom premix made by Rabar Nutrition, Beaudesert, Australia to provide in final diet (mg/kg): Co (as CoCl2·6H2O), 0.5; Cu (as CuSO4·5H2O),
5; Fe (as FeSO4·7H2O), 40; I (as KI), 4; Cr (as KCr·2SO4), 0.5; Mg (as MsSO4·7H2O), 150; Mn (as MnSO4·H2O), 25; Se (as NaSeO3), 0.1; and Zn(as ZnSO4·7H2O),100.c Product of F. Hoffmann–La Roche Ltd, Basel, Switzerland, containing 8% astaxanthin.
131L.A. Tuan, K.C. Williams / Aquaculture 267 (2007) 129–138
fish per tank. Ten of the remaining fish were sacrificedin groups of five fish to provide an estimate of initialwhole body chemical composition. The experimentalsystem comprised 48 rectangular polyethylene tanks(100 L; 0.24 m2 surface area), which were arranged asthree replicate blocks of 16 tanks within an enclosedseawater laboratory. Each tank was supplied with bio-filtered, constant temperature (29±0.7 °C) recirculatedseawater (33–35‰) at an exchange rate of 500%/d.Each tank was provided with supplementary aeration bymeans of an airstone and water temperature and salinitywere monitored daily and weekly, respectively. Photo-period was held to a constant 12:12 h light–dark cycle.
Table 2The dry matter (DM), crude protein (CP), ash, lipid, fatty acid and calculate
Feed ingredient Diet label (protein/lipid)
44/7 49/7 55/7 60/7 44/12 490/12 55/12 60
DM (% as fed) 93.3 92.6 91.9 91.9 93.5 93.9 93.6 93DM basis
CP (%) 43.7 49.5 55.5 60.9 43.6 48.8 54.4 59Ash (%) 14.7 14.9 15.1 15.1 14.6 14.6 14.7 14Lipid (%) 6.9 7.0 7.0 7.0 12.2 12.2 12.2 12EPA+DHA (%) a 2.0 2.0 2.0 2.0 2.9 2.9 2.9 2n-3:n-6 b 2.1 2.1 2.2 2.2 2.1 2.1 2.1 2GE (kJ/g) c 18.9 19.2 19.6 19.9 20.1 20.4 20.7 21CP:GE (mg/kJ) 23.1 25.7 28.3 30.6 21.7 23.9 26.2 28a Sum of eicosapentaenoic (EPA; C20:5n-3) and docosahexaenoic (DHA;b Ratio of the sum of n-3 and n-6 fatty acids.c Calculated using energy conversion factors of 23.4, 39.2 and 17.2 kJ/g
Carbohydrate was determined as the total less the sum of moisture, protein,
During the experiment, fish in each tank were weigh-ed individually at the start and end of the 8-week ex-periment and bulk-weighed at intervening fortnightlyperiods. Stress at weighing was minimised by mildsedation of the fish using the aquatic anaesthetic,iso-eugenol (AQUI-S, Aquatic Diagnostic Services In-ternational Pty. Ltd., Wilston, Queensland, Australia)provided in an aerated water bath at 27 mg/L. Fish wereoffered their respective diets to satiety twice daily (no-minally at 08:00 and 17:00 h) except on the day ofweighing when the morning feed was not fed. At eachfeeding, a weighed amount of diet was offered to excesson three or four occasions during a feeding period of
d gross energy (GE) composition of the diets
/12 44/18 49/18 55/18 60/18 44/23 49/23 55/23 60/23
.9 94.5 93.9 93.5 93.4 93.5 93.6 93.9 94.2
.6 43.1 48.8 54.4 59.9 43.5 48.9 54.2 59.4
.7 14.3 14.5 14.6 14.6 14.4 14.4 14.4 14.4
.2 17.4 17.5 17.6 17.6 22.9 22.9 22.8 22.8
.9 3.8 3.8 3.8 3.8 4.8 4.8 4.8 4.8
.1 2.1 2.1 2.1 2.1 2.1 2.1 2.1 2.1
.1 21.2 21.6 21.9 22.3 22.5 22.8 23.1 23.4
.3 20.3 22.6 24.8 26.9 19.4 21.5 23.4 25.4
C22:6n-3) fatty acids.
for protein, lipid and carbohydrate, respectively (Cho et al., 1982).ash and lipid.
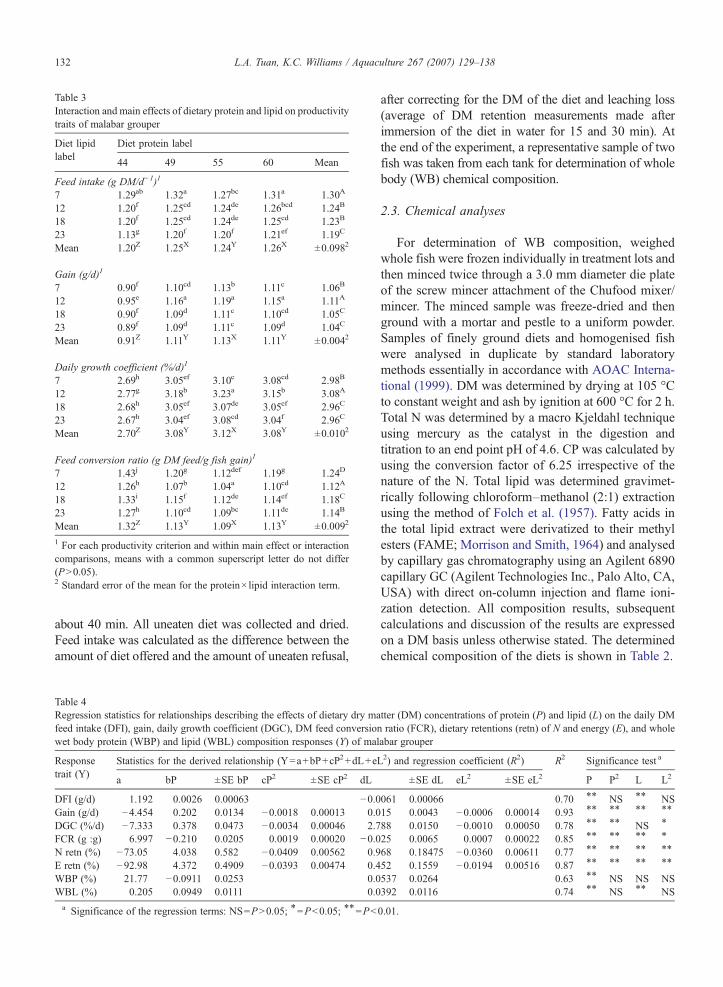
Table 3Interaction and main effects of dietary protein and lipid on productivitytraits of malabar grouper
Diet lipidlabel
Diet protein label
44 49 55 60 Mean
Feed intake (g DM/d−1)1
7 1.29ab 1.32a 1.27bc 1.31a 1.30A
12 1.20f 1.25cd 1.24de 1.26bcd 1.24B
18 1.20f 1.25cd 1.24de 1.25cd 1.23B
23 1.13g 1.20f 1.20f 1.21ef 1.19C
Mean 1.20Z 1.25X 1.24Y 1.26X ±0.0982
Gain (g/d)1
7 0.90f 1.10cd 1.13b 1.11c 1.06B
12 0.95e 1.16a 1.19a 1.15a 1.11A
18 0.90f 1.09d 1.11c 1.10cd 1.05C
23 0.89f 1.09d 1.11c 1.09d 1.04C
Mean 0.91Z 1.11Y 1.13X 1.11Y ±0.0042
Daily growth coefficient (%/d)1
7 2.69h 3.05ef 3.10c 3.08cd 2.98B
12 2.77g 3.18b 3.23a 3.15b 3.08A
18 2.68h 3.05ef 3.07de 3.05ef 2.96C
23 2.67h 3.04ef 3.08cd 3.04f 2.96C
Mean 2.70Z 3.08Y 3.12X 3.08Y ±0.0102
Feed conversion ratio (g DM feed/g fish gain)1
7 1.43j 1.20g 1.12def 1.19g 1.24D
12 1.26h 1.07b 1.04a 1.10cd 1.12A
18 1.33i 1.15f 1.12de 1.14ef 1.18C
23 1.27h 1.10cd 1.09bc 1.11de 1.14B
Mean 1.32Z 1.13Y 1.09X 1.13Y ±0.0092
1 For each productivity criterion and within main effect or interactioncomparisons, means with a common superscript letter do not differ(PN0.05).2 Standard error of the mean for the protein× lipid interaction term.
132 L.A. Tuan, K.C. Williams / Aquaculture 267 (2007) 129–138
about 40 min. All uneaten diet was collected and dried.Feed intake was calculated as the difference between theamount of diet offered and the amount of uneaten refusal,
Table 4Regression statistics for relationships describing the effects of dietary dry mafeed intake (DFI), gain, daily growth coefficient (DGC), DM feed conversiowet body protein (WBP) and lipid (WBL) composition responses (Y) of ma
Responsetrait (Y)
Statistics for the derived relationship (Y=a+bP+cP2+dL+e
a bP ±SE bP cP2 ±SE cP2 dL
DFI (g/d) 1.192 0.0026 0.00063 −0.0Gain (g/d) −4.454 0.202 0.0134 −0.0018 0.00013 0.0DGC (%/d) −7.333 0.378 0.0473 −0.0034 0.00046 2.7FCR (g :g) 6.997 −0.210 0.0205 0.0019 0.00020 −0.0N retn (%) −73.05 4.038 0.582 −0.0409 0.00562 0.9E retn (%) −92.98 4.372 0.4909 −0.0393 0.00474 0.4WBP (%) 21.77 −0.0911 0.0253 0.0WBL (%) 0.205 0.0949 0.0111 0.0
a Significance of the regression terms: NS=PN0.05; ⁎=Pb0.05; ⁎⁎=Pb
after correcting for the DM of the diet and leaching loss(average of DM retention measurements made afterimmersion of the diet in water for 15 and 30 min). Atthe end of the experiment, a representative sample of twofish was taken from each tank for determination of wholebody (WB) chemical composition.
2.3. Chemical analyses
For determination of WB composition, weighedwhole fish were frozen individually in treatment lots andthen minced twice through a 3.0 mm diameter die plateof the screw mincer attachment of the Chufood mixer/mincer. The minced sample was freeze-dried and thenground with a mortar and pestle to a uniform powder.Samples of finely ground diets and homogenised fishwere analysed in duplicate by standard laboratorymethods essentially in accordance with AOAC Interna-tional (1999). DM was determined by drying at 105 °Cto constant weight and ash by ignition at 600 °C for 2 h.Total N was determined by a macro Kjeldahl techniqueusing mercury as the catalyst in the digestion andtitration to an end point pH of 4.6. CP was calculated byusing the conversion factor of 6.25 irrespective of thenature of the N. Total lipid was determined gravimet-rically following chloroform–methanol (2:1) extractionusing the method of Folch et al. (1957). Fatty acids inthe total lipid extract were derivatized to their methylesters (FAME; Morrison and Smith, 1964) and analysedby capillary gas chromatography using an Agilent 6890capillary GC (Agilent Technologies Inc., Palo Alto, CA,USA) with direct on-column injection and flame ioni-zation detection. All composition results, subsequentcalculations and discussion of the results are expressedon a DM basis unless otherwise stated. The determinedchemical composition of the diets is shown in Table 2.
tter (DM) concentrations of protein (P) and lipid (L) on the daily DMn ratio (FCR), dietary retentions (retn) of N and energy (E), and wholelabar grouper
L2) and regression coefficient (R2) R2 Significance test a
±SE dL eL2 ±SE eL2 P P2 L L2
061 0.00066 0.70 ⁎⁎ NS ⁎⁎ NS15 0.0043 −0.0006 0.00014 0.93 ⁎⁎ ⁎⁎ ⁎⁎ ⁎⁎
88 0.0150 −0.0010 0.00050 0.78 ⁎⁎ ⁎⁎ NS ⁎
25 0.0065 0.0007 0.00022 0.85 ⁎⁎ ⁎⁎ ⁎⁎ ⁎
68 0.18475 −0.0360 0.00611 0.77 ⁎⁎ ⁎⁎ ⁎⁎ ⁎⁎
52 0.1559 −0.0194 0.00516 0.87 ⁎⁎ ⁎⁎ ⁎⁎ ⁎⁎
537 0.0264 0.63 ⁎⁎ NS NS NS392 0.0116 0.74 ⁎⁎ NS ⁎⁎ NS
0.01.
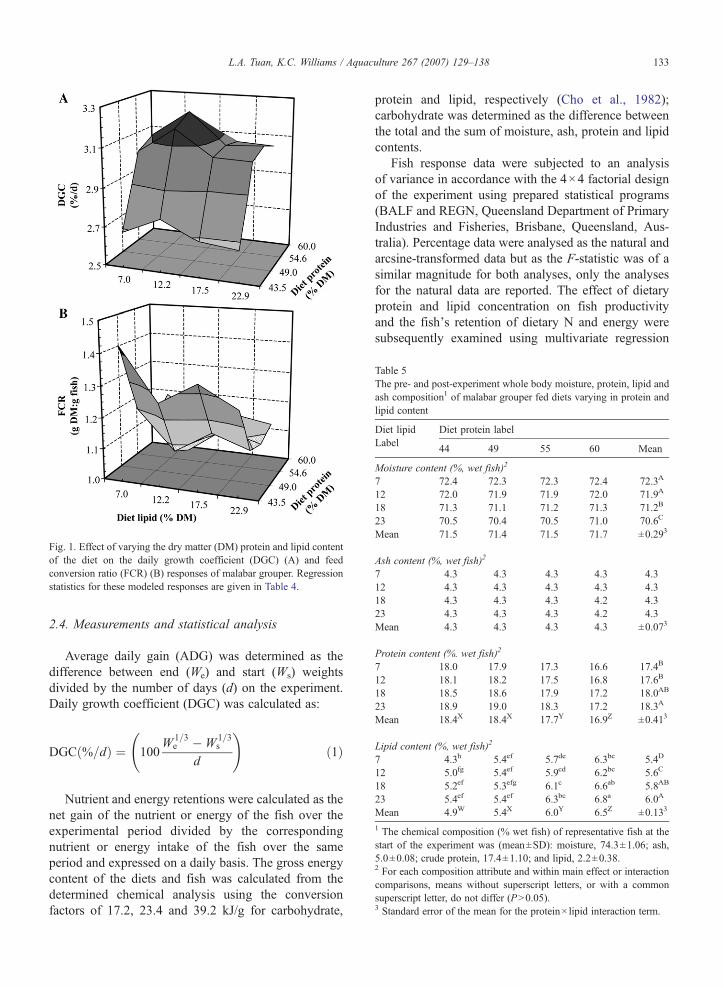
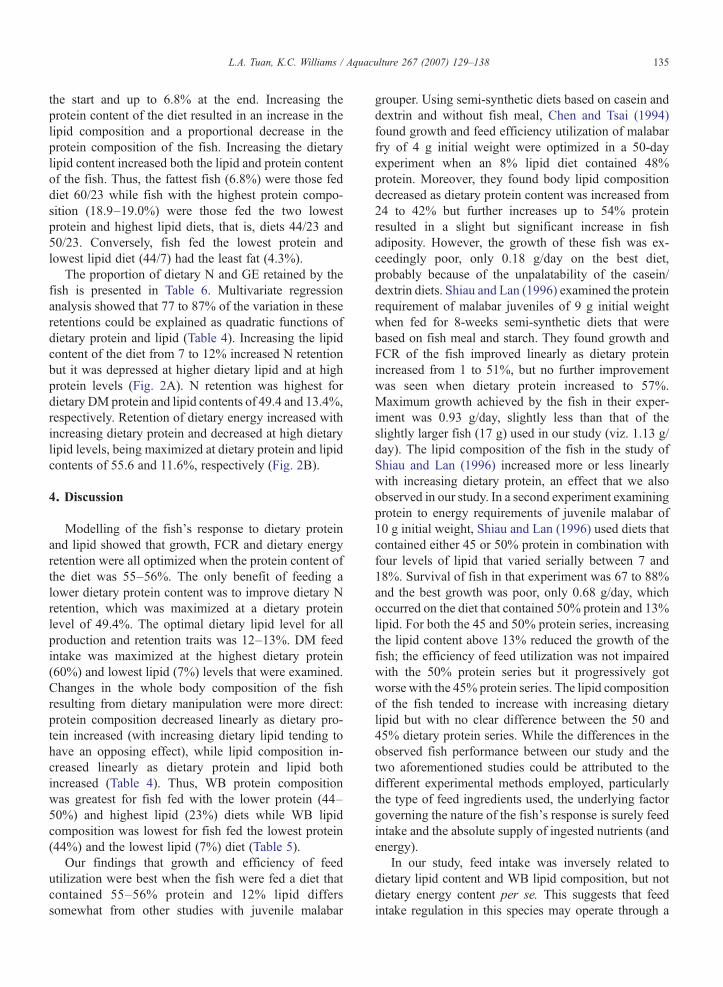
Fig. 1. Effect of varying the dry matter (DM) protein and lipid contentof the diet on the daily growth coefficient (DGC) (A) and feedconversion ratio (FCR) (B) responses of malabar grouper. Regressionstatistics for these modeled responses are given in Table 4.
Table 5The pre- and post-experiment whole body moisture, protein, lipid andash composition1 of malabar grouper fed diets varying in protein andlipid content
Diet lipidLabel
Diet protein label
44 49 55 60 Mean
Moisture content (%, wet fish)2
7 72.4 72.3 72.3 72.4 72.3A
12 72.0 71.9 71.9 72.0 71.9A
18 71.3 71.1 71.2 71.3 71.2B
23 70.5 70.4 70.5 71.0 70.6C
Mean 71.5 71.4 71.5 71.7 ±0.293
Ash content (%, wet fish)2
7 4.3 4.3 4.3 4.3 4.312 4.3 4.3 4.3 4.3 4.318 4.3 4.3 4.3 4.2 4.323 4.3 4.3 4.3 4.2 4.3Mean 4.3 4.3 4.3 4.3 ±0.073
Protein content (%. wet fish)2
7 18.0 17.9 17.3 16.6 17.4B
12 18.1 18.2 17.5 16.8 17.6B
18 18.5 18.6 17.9 17.2 18.0AB
23 18.9 19.0 18.3 17.2 18.3A
Mean 18.4X 18.4X 17.7Y 16.9Z ±0.413
Lipid content (%, wet fish)2
7 4.3h 5.4ef 5.7de 6.3bc 5.4D
12 5.0fg 5.4ef 5.9cd 6.2bc 5.6C
18 5.2ef 5.3efg 6.1c 6.6ab 5.8AB
23 5.4ef 5.4ef 6.3bc 6.8a 6.0A
Mean 4.9W 5.4X 6.0Y 6.5Z ±0.133
1 The chemical composition (% wet fish) of representative fish at thestart of the experiment was (mean±SD): moisture, 74.3±1.06; ash,5.0±0.08; crude protein, 17.4±1.10; and lipid, 2.2±0.38.2 For each composition attribute and within main effect or interactioncomparisons, means without superscript letters, or with a commonsuperscript letter, do not differ (PN0.05).3 Standard error of the mean for the protein× lipid interaction term.
133L.A. Tuan, K.C. Williams / Aquaculture 267 (2007) 129–138
2.4. Measurements and statistical analysis
Average daily gain (ADG) was determined as thedifference between end (We) and start (Ws) weightsdivided by the number of days (d) on the experiment.Daily growth coefficient (DGC) was calculated as:
DGCð%=dÞ ¼ 100W 1=3
e �W 1=3s
d
!ð1Þ
Nutrient and energy retentions were calculated as thenet gain of the nutrient or energy of the fish over theexperimental period divided by the correspondingnutrient or energy intake of the fish over the sameperiod and expressed on a daily basis. The gross energycontent of the diets and fish was calculated from thedetermined chemical analysis using the conversionfactors of 17.2, 23.4 and 39.2 kJ/g for carbohydrate,
protein and lipid, respectively (Cho et al., 1982);carbohydrate was determined as the difference betweenthe total and the sum of moisture, ash, protein and lipidcontents.
Fish response data were subjected to an analysisof variance in accordance with the 4×4 factorial designof the experiment using prepared statistical programs(BALF and REGN, Queensland Department of PrimaryIndustries and Fisheries, Brisbane, Queensland, Aus-tralia). Percentage data were analysed as the natural andarcsine-transformed data but as the F-statistic was of asimilar magnitude for both analyses, only the analysesfor the natural data are reported. The effect of dietaryprotein and lipid concentration on fish productivityand the fish's retention of dietary N and energy weresubsequently examined using multivariate regression
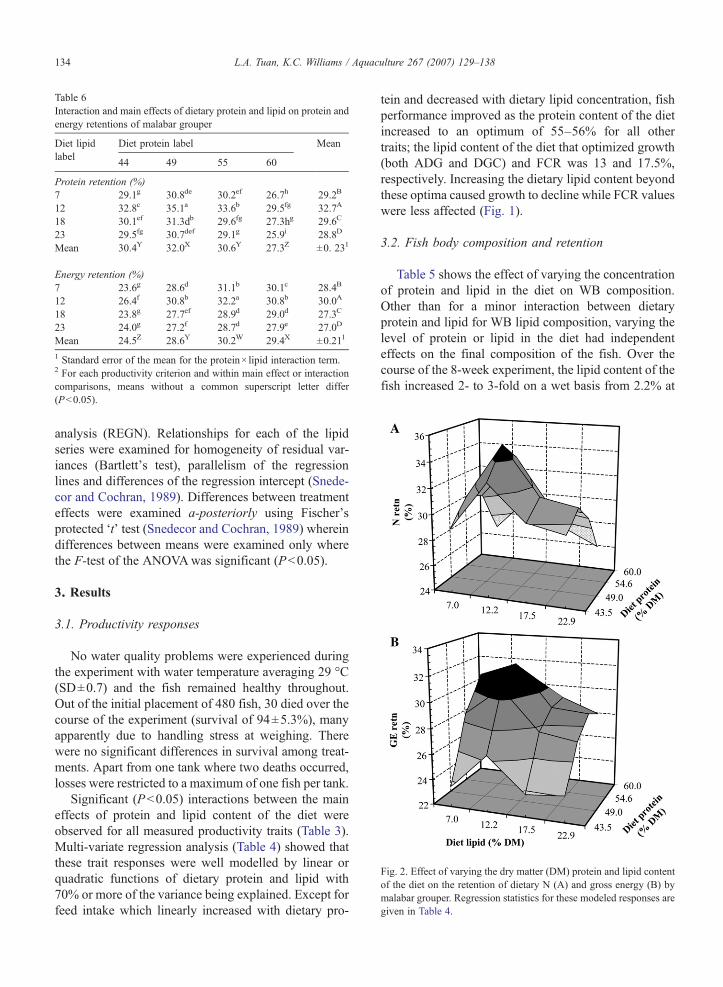
Table 6Interaction and main effects of dietary protein and lipid on protein andenergy retentions of malabar grouper
Diet lipidlabel
Diet protein label Mean
44 49 55 60
Protein retention (%)7 29.1g 30.8de 30.2ef 26.7h 29.2B
12 32.8c 35.1a 33.6b 29.5fg 32.7A
18 30.1ef 31.3db 29.6fg 27.3hg 29.6C
23 29.5fg 30.7def 29.1g 25.9i 28.8D
Mean 30.4Y 32.0X 30.6Y 27.3Z ±0. 231
Energy retention (%)7 23.6g 28.6d 31.1b 30.1c 28.4B
12 26.4f 30.8b 32.2a 30.8b 30.0A
18 23.8g 27.7ef 28.9d 29.0d 27.3C
23 24.0g 27.2f 28.7d 27.9e 27.0D
Mean 24.5Z 28.6Y 30.2W 29.4X ±0.211
1 Standard error of the mean for the protein× lipid interaction term.2 For each productivity criterion and within main effect or interactioncomparisons, means without a common superscript letter differ(Pb0.05).
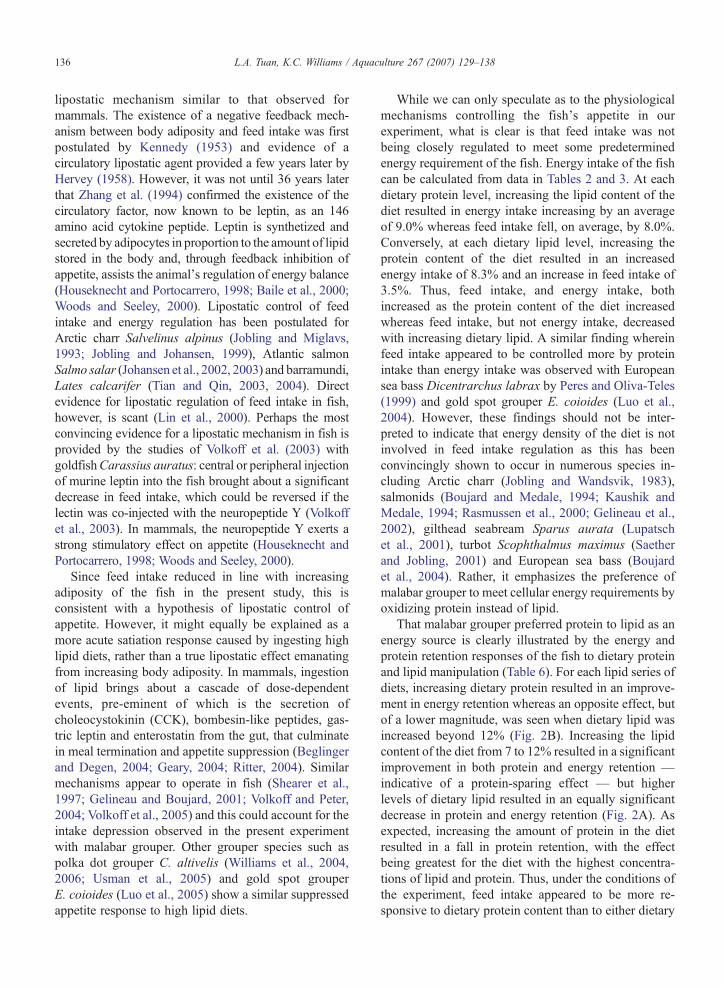
Fig. 2. Effect of varying the dry matter (DM) protein and lipid contentof the diet on the retention of dietary N (A) and gross energy (B) bymalabar grouper. Regression statistics for these modeled responses aregiven in Table 4.
134 L.A. Tuan, K.C. Williams / Aquaculture 267 (2007) 129–138
analysis (REGN). Relationships for each of the lipidseries were examined for homogeneity of residual var-iances (Bartlett's test), parallelism of the regressionlines and differences of the regression intercept (Snede-cor and Cochran, 1989). Differences between treatmenteffects were examined a-posteriorly using Fischer'sprotected ‘t’ test (Snedecor and Cochran, 1989) whereindifferences between means were examined only wherethe F-test of the ANOVAwas significant (Pb0.05).
3. Results
3.1. Productivity responses
No water quality problems were experienced duringthe experiment with water temperature averaging 29 °C(SD±0.7) and the fish remained healthy throughout.Out of the initial placement of 480 fish, 30 died over thecourse of the experiment (survival of 94±5.3%), manyapparently due to handling stress at weighing. Therewere no significant differences in survival among treat-ments. Apart from one tank where two deaths occurred,losses were restricted to a maximum of one fish per tank.
Significant (Pb0.05) interactions between the maineffects of protein and lipid content of the diet wereobserved for all measured productivity traits (Table 3).Multi-variate regression analysis (Table 4) showed thatthese trait responses were well modelled by linear orquadratic functions of dietary protein and lipid with70% or more of the variance being explained. Except forfeed intake which linearly increased with dietary pro-
tein and decreased with dietary lipid concentration, fishperformance improved as the protein content of the dietincreased to an optimum of 55–56% for all othertraits; the lipid content of the diet that optimized growth(both ADG and DGC) and FCR was 13 and 17.5%,respectively. Increasing the dietary lipid content beyondthese optima caused growth to decline while FCR valueswere less affected (Fig. 1).
3.2. Fish body composition and retention
Table 5 shows the effect of varying the concentrationof protein and lipid in the diet on WB composition.Other than for a minor interaction between dietaryprotein and lipid for WB lipid composition, varying thelevel of protein or lipid in the diet had independenteffects on the final composition of the fish. Over thecourse of the 8-week experiment, the lipid content of thefish increased 2- to 3-fold on a wet basis from 2.2% at
135L.A. Tuan, K.C. Williams / Aquaculture 267 (2007) 129–138
the start and up to 6.8% at the end. Increasing theprotein content of the diet resulted in an increase in thelipid composition and a proportional decrease in theprotein composition of the fish. Increasing the dietarylipid content increased both the lipid and protein contentof the fish. Thus, the fattest fish (6.8%) were those feddiet 60/23 while fish with the highest protein compo-sition (18.9–19.0%) were those fed the two lowestprotein and highest lipid diets, that is, diets 44/23 and50/23. Conversely, fish fed the lowest protein andlowest lipid diet (44/7) had the least fat (4.3%).
The proportion of dietary N and GE retained by thefish is presented in Table 6. Multivariate regressionanalysis showed that 77 to 87% of the variation in theseretentions could be explained as quadratic functions ofdietary protein and lipid (Table 4). Increasing the lipidcontent of the diet from 7 to 12% increased N retentionbut it was depressed at higher dietary lipid and at highprotein levels (Fig. 2A). N retention was highest fordietary DMprotein and lipid contents of 49.4 and 13.4%,respectively. Retention of dietary energy increased withincreasing dietary protein and decreased at high dietarylipid levels, being maximized at dietary protein and lipidcontents of 55.6 and 11.6%, respectively (Fig. 2B).
4. Discussion
Modelling of the fish's response to dietary proteinand lipid showed that growth, FCR and dietary energyretention were all optimized when the protein content ofthe diet was 55–56%. The only benefit of feeding alower dietary protein content was to improve dietary Nretention, which was maximized at a dietary proteinlevel of 49.4%. The optimal dietary lipid level for allproduction and retention traits was 12–13%. DM feedintake was maximized at the highest dietary protein(60%) and lowest lipid (7%) levels that were examined.Changes in the whole body composition of the fishresulting from dietary manipulation were more direct:protein composition decreased linearly as dietary pro-tein increased (with increasing dietary lipid tending tohave an opposing effect), while lipid composition in-creased linearly as dietary protein and lipid bothincreased (Table 4). Thus, WB protein compositionwas greatest for fish fed with the lower protein (44–50%) and highest lipid (23%) diets while WB lipidcomposition was lowest for fish fed the lowest protein(44%) and the lowest lipid (7%) diet (Table 5).
Our findings that growth and efficiency of feedutilization were best when the fish were fed a diet thatcontained 55–56% protein and 12% lipid differssomewhat from other studies with juvenile malabar
grouper. Using semi-synthetic diets based on casein anddextrin and without fish meal, Chen and Tsai (1994)found growth and feed efficiency utilization of malabarfry of 4 g initial weight were optimized in a 50-dayexperiment when an 8% lipid diet contained 48%protein. Moreover, they found body lipid compositiondecreased as dietary protein content was increased from24 to 42% but further increases up to 54% proteinresulted in a slight but significant increase in fishadiposity. However, the growth of these fish was ex-ceedingly poor, only 0.18 g/day on the best diet,probably because of the unpalatability of the casein/dextrin diets. Shiau and Lan (1996) examined the proteinrequirement of malabar juveniles of 9 g initial weightwhen fed for 8-weeks semi-synthetic diets that werebased on fish meal and starch. They found growth andFCR of the fish improved linearly as dietary proteinincreased from 1 to 51%, but no further improvementwas seen when dietary protein increased to 57%.Maximum growth achieved by the fish in their exper-iment was 0.93 g/day, slightly less than that of theslightly larger fish (17 g) used in our study (viz. 1.13 g/day). The lipid composition of the fish in the study ofShiau and Lan (1996) increased more or less linearlywith increasing dietary protein, an effect that we alsoobserved in our study. In a second experiment examiningprotein to energy requirements of juvenile malabar of10 g initial weight, Shiau and Lan (1996) used diets thatcontained either 45 or 50% protein in combination withfour levels of lipid that varied serially between 7 and18%. Survival of fish in that experiment was 67 to 88%and the best growth was poor, only 0.68 g/day, whichoccurred on the diet that contained 50% protein and 13%lipid. For both the 45 and 50% protein series, increasingthe lipid content above 13% reduced the growth of thefish; the efficiency of feed utilization was not impairedwith the 50% protein series but it progressively gotworse with the 45% protein series. The lipid compositionof the fish tended to increase with increasing dietarylipid but with no clear difference between the 50 and45% dietary protein series. While the differences in theobserved fish performance between our study and thetwo aforementioned studies could be attributed to thedifferent experimental methods employed, particularlythe type of feed ingredients used, the underlying factorgoverning the nature of the fish's response is surely feedintake and the absolute supply of ingested nutrients (andenergy).
In our study, feed intake was inversely related todietary lipid content and WB lipid composition, but notdietary energy content per se. This suggests that feedintake regulation in this species may operate through a
136 L.A. Tuan, K.C. Williams / Aquaculture 267 (2007) 129–138
lipostatic mechanism similar to that observed formammals. The existence of a negative feedback mech-anism between body adiposity and feed intake was firstpostulated by Kennedy (1953) and evidence of acirculatory lipostatic agent provided a few years later byHervey (1958). However, it was not until 36 years laterthat Zhang et al. (1994) confirmed the existence of thecirculatory factor, now known to be leptin, as an 146amino acid cytokine peptide. Leptin is synthetized andsecreted by adipocytes in proportion to the amount of lipidstored in the body and, through feedback inhibition ofappetite, assists the animal's regulation of energy balance(Houseknecht and Portocarrero, 1998; Baile et al., 2000;Woods and Seeley, 2000). Lipostatic control of feedintake and energy regulation has been postulated forArctic charr Salvelinus alpinus (Jobling and Miglavs,1993; Jobling and Johansen, 1999), Atlantic salmonSalmo salar (Johansen et al., 2002, 2003) and barramundi,Lates calcarifer (Tian and Qin, 2003, 2004). Directevidence for lipostatic regulation of feed intake in fish,however, is scant (Lin et al., 2000). Perhaps the mostconvincing evidence for a lipostatic mechanism in fish isprovided by the studies of Volkoff et al. (2003) withgoldfishCarassius auratus: central or peripheral injectionof murine leptin into the fish brought about a significantdecrease in feed intake, which could be reversed if thelectin was co-injected with the neuropeptide Y (Volkoffet al., 2003). In mammals, the neuropeptide Y exerts astrong stimulatory effect on appetite (Houseknecht andPortocarrero, 1998; Woods and Seeley, 2000).
Since feed intake reduced in line with increasingadiposity of the fish in the present study, this isconsistent with a hypothesis of lipostatic control ofappetite. However, it might equally be explained as amore acute satiation response caused by ingesting highlipid diets, rather than a true lipostatic effect emanatingfrom increasing body adiposity. In mammals, ingestionof lipid brings about a cascade of dose-dependentevents, pre-eminent of which is the secretion ofcholeocystokinin (CCK), bombesin-like peptides, gas-tric leptin and enterostatin from the gut, that culminatein meal termination and appetite suppression (Beglingerand Degen, 2004; Geary, 2004; Ritter, 2004). Similarmechanisms appear to operate in fish (Shearer et al.,1997; Gelineau and Boujard, 2001; Volkoff and Peter,2004; Volkoff et al., 2005) and this could account for theintake depression observed in the present experimentwith malabar grouper. Other grouper species such aspolka dot grouper C. altivelis (Williams et al., 2004,2006; Usman et al., 2005) and gold spot grouperE. coioides (Luo et al., 2005) show a similar suppressedappetite response to high lipid diets.
While we can only speculate as to the physiologicalmechanisms controlling the fish's appetite in ourexperiment, what is clear is that feed intake was notbeing closely regulated to meet some predeterminedenergy requirement of the fish. Energy intake of the fishcan be calculated from data in Tables 2 and 3. At eachdietary protein level, increasing the lipid content of thediet resulted in energy intake increasing by an averageof 9.0% whereas feed intake fell, on average, by 8.0%.Conversely, at each dietary lipid level, increasing theprotein content of the diet resulted in an increasedenergy intake of 8.3% and an increase in feed intake of3.5%. Thus, feed intake, and energy intake, bothincreased as the protein content of the diet increasedwhereas feed intake, but not energy intake, decreasedwith increasing dietary lipid. A similar finding whereinfeed intake appeared to be controlled more by proteinintake than energy intake was observed with Europeansea bass Dicentrarchus labrax by Peres and Oliva-Teles(1999) and gold spot grouper E. coioides (Luo et al.,2004). However, these findings should not be inter-preted to indicate that energy density of the diet is notinvolved in feed intake regulation as this has beenconvincingly shown to occur in numerous species in-cluding Arctic charr (Jobling and Wandsvik, 1983),salmonids (Boujard and Medale, 1994; Kaushik andMedale, 1994; Rasmussen et al., 2000; Gelineau et al.,2002), gilthead seabream Sparus aurata (Lupatschet al., 2001), turbot Scophthalmus maximus (Saetherand Jobling, 2001) and European sea bass (Boujardet al., 2004). Rather, it emphasizes the preference ofmalabar grouper to meet cellular energy requirements byoxidizing protein instead of lipid.
That malabar grouper preferred protein to lipid as anenergy source is clearly illustrated by the energy andprotein retention responses of the fish to dietary proteinand lipid manipulation (Table 6). For each lipid series ofdiets, increasing dietary protein resulted in an improve-ment in energy retention whereas an opposite effect, butof a lower magnitude, was seen when dietary lipid wasincreased beyond 12% (Fig. 2B). Increasing the lipidcontent of the diet from 7 to 12% resulted in a significantimprovement in both protein and energy retention —indicative of a protein-sparing effect — but higherlevels of dietary lipid resulted in an equally significantdecrease in protein and energy retention (Fig. 2A). Asexpected, increasing the amount of protein in the dietresulted in a fall in protein retention, with the effectbeing greatest for the diet with the highest concentra-tions of lipid and protein. Thus, under the conditions ofthe experiment, feed intake appeared to be more re-sponsive to dietary protein content than to either dietary
137L.A. Tuan, K.C. Williams / Aquaculture 267 (2007) 129–138
lipid or energy. However, lipid at levels up to about 12%had a protein-sparing effect, which is similar to thatobserved for this and other species of grouper (Shiauand Lan, 1996; Williams et al., 2004, 2006; Luo et al.,2005; Usman et al., 2005).
A number of conclusions can be drawn from thisstudy. Firstly, increasing the amount of lipid in the dietabove 7% results in a progressive decrease in feedintake, with this effect intensifying as the protein contentof the diet reduces. Secondly, juvenile malabar groupergrow best when fed diets that contain high levels ofprotein (at least 55%) and lipid levels that do not exceedabout 12%. While slightly higher lipid diets mayimprove FCR, this will be at the expense of somegrowth because of a concomitant depression of feedintake. Thirdly, whole body fat content of the fishincreases with increasing dietary lipid but this increasein adiposity is attenuated when low protein diets are fedbecause the feed intake depression of lipid is amplifiedwith low protein diets. Finally, on the basis that theoptimal protein and lipid specification of the diet forjuvenile malabar grouper is 55 and 12%, respectively,the optimal protein to energy ratio is calculated to be28 g crude protein per MJ of gross energy.
Acknowledgements
The research was carried out as part of an AustralianAusAID project with Vietnam (CARDProject 15) and thisfinancial support is acknowledged. We thank Ta QuangDuong for technical assistance in the conduct of the ex-periment and Dang Thuy Binh for the chemical analyses.
References
AOAC International, 1999. Official Methods of Analysis, 16th edn.Association of Official Analytical Chemists International, Mary-land, USA. 1141 pp.
Baile, C.A., Della-Fera, M.A., Martin, R.J., 2000. Regulation ofmetabolism and body fat mass by leptin. Annu. Rev. Nutr. 20,105–127.
Beglinger, C., Degen, L., 2004. Fat in the intestine as a regulator ofappetite — role of CCK. Physiol. Behav. 83, 617–621.
Beveridge, M.C.M., 1996. Cage Aquaculture, 2nd edn. Fishing NewsBooks, Oxford. 352 pp.
Boonyaratpalin, M., 1997. Nutrient requirements of marine food fishcultured in Southeast Asia. Aquaculture 151, 283–313.
Boujard, T., Medale, F., 1994. Regulation of voluntary feed intake injuvenile rainbow trout fed by hand or by self feeders with dietscontaining two different protein/energy ratios. Aquat. LivingResour. 7, 211–215.
Boujard, T., Gelineau, A., Coves, D., Corraze, G., Dutto, G., Gasset,E., Kaushik, S., 2004. Regulation of feed intake, growth, nutrientand energy utilisation in European sea bass (Dicentrarchus labrax)fed high fat diets. Aquaculture 231, 529–545.
Chen, H.-Y., 2001. Nutritional studies and feed development of theEpinephelus groupers in Taiwan. In: Liao, I.C., Baker, J. (Eds.),Aquaculture and Fisheries Resources Management. TFRI Confer-ence Proceedings, vol. 4. Taiwan Fisheries Research Institute,Tungkang, Taiwan, pp. 169–172.
Chen, H.-Y., Tsai, J.-C., 1994. Optimal dietary protein level for thegrowth of juvenile grouper, Epinephelus malabaricus, fedsemipurified diets. Aquaculture 119, 265–271.
Cho, C.Y., Slinger, S.J., Bayley, H.S., 1982. Bioenergetics of salmonidfishes: energy intake, expenditure and productivity. Comp.Biochem. Physiol. 73B, 25–41.
FAO,2005. Fishstat Plus. http://www.fao.org/fi/statist/FISOFT/FISHPLUS.asp#General.
Folch, J., Lees, M., Sloane-Stanley, G.H., 1957. A simple method for theisolation and purification of total lipid from animal tissues. J. Biol.Chem. 226, 497–509.
Geary, N., 2004. Endocrine controls of eating: CCK, leptin, and ghrelin.Physiol. Behav. 81, 719–733.
Gelineau, A., Boujard, T., 2001. Oral administration of choleocystokininreceptor antagonists increase feed intake in rainbow trout. J. FishBiol. 58, 716–724.
Gelineau, A., Bolliet, V., Corraze, G., Boujard, T., 2002. The combinedeffects of feeding time and dietary fat levels on feed intake, growthand body composition in rainbow trout. Aquat. Living Resour. 15,225–230.
Hervey, G.R., 1958. The effects of lesions in the hypothalamus inparabiotic rats. J. Physiol. 145, 336–352.
Houseknecht, K.L., Portocarrero, C.P., 1998. Leptin and its receptors:Regulators of whole-body energy homeostasis. Dom. Anim. Endocri-nol. 15, 457–475.
Jobling, M., Johansen, S.J.S., 1999. The lipostat, hyperphagia andcatch-up growth. Aquac. Res. 30, 473–478.
Jobling, M., Miglavs, I., 1993. The size of lipid depots — a factorcontributing to the control of food intake in Arctic charr, Salvelinusalpinus? J. Fish Biol. 43, 487–489.
Jobling, M., Wandsvik, A., 1983. An investigation of factors con-trolling food intake in Arctic charr, Salvelinus alpinus L. J. FishBiol. 23, 397–404.
Johansen, S.J.S, Ekli, M., Jobling, M., 2002. Is there lipostatic regu-lation of feed intake in Atlantic salmon Salmo salar L.? Aquac.Res. 33, 515–524.
Johansen, S.J.S., Sveier, H., Jobling, M., 2003. Lipostatic regulation offeed intake in Atlantic salmon Salmo salar L.: defending adiposityat the expense of growth? Aquac. Res. 34, 317–331.
Kaushik, S.J., Medale, F., 1994. Energy requirements, utilization anddietary supply to salmonids. Aquaculture 124, 81–97.
Kennedy, G.C., 1953. The role of depot fat in the hypothalamuscontrol of food intake in the rat. Proc. R. Soc. Lond., B Biol. Sci.140, 578–592.
Lin, Y.-H., Shiau, S.-Y., 2003. Dietary lipid requirement of grouper,Epinephelus malabaricus, and effects on immune responses.Aquaculture 225, 243–250.
Lin, X., Volkoff, H., Narnaware, Y., Bernier, N.J., Peyon, P., Peter, R.E.,2000. Brain regulation of feeding behaviour and food intake in fish.Comp. Biochem. Physiol. 126A, 415–434.
Luo, Z., Liu, Y.J., Mai, K.S., Tian, L.X., Liu, D.H., Tan, X.Y., 2004.Optimal dietary protein requirement of grouper Epinepheluscoioides juveniles fed isoenergetic diets in floating net cages.Aquac. Nutr. 10, 247–252.
Luo,Z., Liu,Y.-J.,Mai,K.-S., Tian,L.-X., Liu,D.-H., Tan,X.-Y., Lin,H.-Z.,2005. Effect of dietary lipid level on growth performance, feedutilization and body composition of grouper Epinephelus coioides
138 L.A. Tuan, K.C. Williams / Aquaculture 267 (2007) 129–138
juveniles fed isonitrogenous diets in floating netcages. Aquac. Int. 13,257–269.
Lupatsch, I., Kissil, G.Wm., 2005. Feed formulations based on energyand protein demands in white grouper (Epinephelus aeneus).Aquaculture 248, 83–95.
Lupatsch, I., Kissil, G.W.M., Sklan, D., Pfeffer, E., 2001. Effects ofvarying dietary protein and energy supply on growth, body com-position and protein utilization in gilthead seabream (Sparusaurata L.). Aquac. Nutr. 7, 71–80.
Miao, S., Tang, H.-C., 2002. Bioeconomic analysis of improvingmanagement productivity regarding grouper Epinephelus mala-baricus farming in Taiwan. Aquaculture 211, 151–169.
Morrison, W.R., Smith, L.M., 1964. Preparation of fatty acid methylesters and dimethylacetals from lipids with boron fluride–methanol. J. Lipid Res. 5, 600–608.
New, M.B., 1996. Responsible use of aquaculture feeds. Aquacult.Asia 1, 3–15.
Peres, H., Oliva-Teles, A., 1999. Effect of dietary lipid level on growthperformance and feed utilization by European sea bass juveniles(Dicentrarchus labrax). Aquaculture 179, 325–334.
Rasmussen, R.S., Ostenfeld, T.H., McLean, E., 2000. Growth and feedutilization of rainbow trout subjected to changes in feed lipidconcentrations. Aquac. Int. 8, 531–542.
Ritter, R.C., 2004. Gastrointestinal mechanisms of satiation for food.Physiol. Behav. 81, 249–273.
Saether, B.-S., Jobling, M., 2001. Fat content in turbot feed: influenceon feed intake, growth and body composition. Aquac. Res. 32,451–458.
Shearer, K.D., Silverstein, J.T., Plisetskaya, E.M., 1997. Role ofadiposity in food intake control of juvenile Chinook salmon(Oncorhynchus tshawytscha). Comp. Biochem. Physiol. 118A,1209–1215.
Shiau, S.-Y., Lan, C.-W., 1996. Optimum dietary protein level andprotein to energy ratio for growth of grouper (Epinephelusmalabaricus). Aquaculture 145, 259–266.
Snedecor, G.W., Cochran, W.G., 1989. Statistical Methods, 8th edn.Iowa State University Press, Ames, Iowa, USA. 503 pp.
Tian, X., Qin, J.G., 2003. A single phase of food deprivation provokedcompensatory growth in barramundi Lates calcarifer. Aquaculture224, 169–179.
Tian, X., Qin, J.G., 2004. Effects of previous ration restriction oncompensatory growth in barramundi Lates calcarifer. Aquaculture235, 273–283.
Usman, Rachmansyah, Laining, A., Ahmad, T., Williams, K.C., 2005.Optimum dietary protein and lipid specifications for grow-out ofhumpback grouper Cromileptes altivelis (Valenciennes). Aquac.Res. 36, 1285–1292.
Volkoff, H., Peter, R.E., 2004. Effects of lipopolysaccharide treatmenton feeding of goldfish: role of appetite-regulating peptides. BrainRes. 998, 139–147.
Volkoff, H., Eykelbosh, A.J., Peter, R.E., 2003. Role of leptin in thecontrol of feeding of goldfish Carassius auratus: interactions withcholecystokinin, neuropeptide Y and orexin A, and modulation offasting. Brain Res. 972, 90–109.
Volkoff, H., Canosa, L.F., Unniappan, S., Cerda-Reverter, J.M.,Bernier, N.J., Kelly, S.P., Peter, R.E., 2005. Neuropeptides and thecontrol of food intake in fish. Gen. Comp. Endocrinol. 142, 3–19.
Williams, M.J., 2002. Asian fisheries in the 21st century: Which wayto prosperity? (keynote address to the 6th Asian Fisheries Forum,Kaohsiung, Taiwan November 25–29 2001) http://www.compass.com.ph/~afs/mjwkeynote.html.
Williams, K.C., Irvin, S., Barclay,M., 2004. Polka dot grouperCromileptesaltivelis fingerlings require high protein and moderate lipid diets foroptimal growth and nutrient retention. Aquac. Nutr. 10, 125–134.
Williams, I., Williams, K.C., Smith, D.M., Jones, M., 2006. Polka dotgrouper, Cromileptes altivelis, can utilize dietary fat efficiently.Aquac. Nutr. 12, 379–387.
Woods, S.C., Seeley, R.J., 2000. Adiposity signals and the control ofenergy homeostasis. Nutrition 16, 894–902.
Zhang, Y., Proenca, R.,Maffei, M., Barone,M., Leopold, L., Friedman,J.M., 1994. Positional cloning of the mouse obese gene and itshuman homologue. Nature 372, 425–432.


