Embed Size (px)
Citation preview
11
ORANGE COUNTYWORKFORCE INDICATORS REPORT
2017-2018

22
33
table of contentsWELCOME
INTRODUCTION
DEMOGRAPHIC TRENDS
EDUCATION AND WORKFORCE TRAINING TRENDS
K-12 EDUCATION
COLLEGE READINESS
STEM
INDUSTRY AND OCCUPATION TRENDS
UNEMPLOYMENT INDUSTRY CLUSTER EMPLOYMENT AND COMPENSATION TRENDS
OCCUPATIONAL GROWTH TRENDS
VETERAN EMPLOYMENT IN ORANGE COUNTY
WORKFORCE HOUSING
ADVANCED MANUFACTURING, HEALTHCARE, IT, TOURISM
ORANGE COUNTY MEDICAL DEVICE INDUSTRY
ORANGE COUNTY RETAIL INDUSTRY TRENDS
THE STATE OF IT AND CONNECTIVITY IN ORANGE COUNTY
REPORT PARTNERS
4
7
11
19
20
26
30
33
34
38
44
49
55
63
77
83
89
97
44
Dear Workforce Development Partner: Orange County Business Council (OCBC) and the Orange County Development Board (OCDB) are pleased to present the 16th annual “2017-2018 Orange County Workforce Indicators Report.” This research highlights the central accomplishments of Orange County’s employers, educators and workers, the education and workforce training system, as well as remaining challenges that Orange County must address to close the skills gap and develop a highly-trained workforce for a competitive 21st century economy. Orange County’s trifecta of a high quality of life, a diverse economy, and a well-educated workforce has propelled the county to become a leading region in growth and prosperity. However, a growing and persistent skills gap threatens that continued success. Even as the unemployment rate has reached its lowest level to date, employers face rising difficulties in filling positions with skilled, educated workers. Last year’s report focused on the economic trends shaping the past decade of workforce development. This year’s report continues with that research as Wallace Walrod, Ph.D., OCBC’s Chief Economic Adviser explores how to capitalize on emerging technologies and industries to educate a highly-skilled workforce, fill open positions, and cultivate a globalized economy. The theme for this year’s conference is “Elevate Engineering: Adapt, Connect and Transform OC’s Workforce.” Orange County is a great place to live, work and thrive, but faces new challenges as the old ways of doing business evolve into technology-based processes, creating a new set of needs and skills for Orange County’s workforce and economic prosperity as a whole. Together, OCBC and the OCDB have built an enduring alliance to seek out creative workforce solutions, educational success and the best in workforce training. We hope you will gain a new understanding about these issues in a spirit of collaboration and partnership. We encourage you to utilize today’s materials to plan for future success in all endeavors. Sincerely,
Lucy Dunn President and CEO Orange County Business Council
Bob Bunyan 2016 Chair Orange County Development Board
55

66
77
INTRODUCTION
The 2017-2018 Orange County Workforce Indicators Report provides a
detailed overview of the local economy, highlighting numerous
strengths driving economic growth in the region, as well as issues
limiting the county’s economic performance. This report provides
current, past and projected trends across multiple, diverse metrics
including demographics, industry clusters, education and workforce
trends, and workforce housing.
88
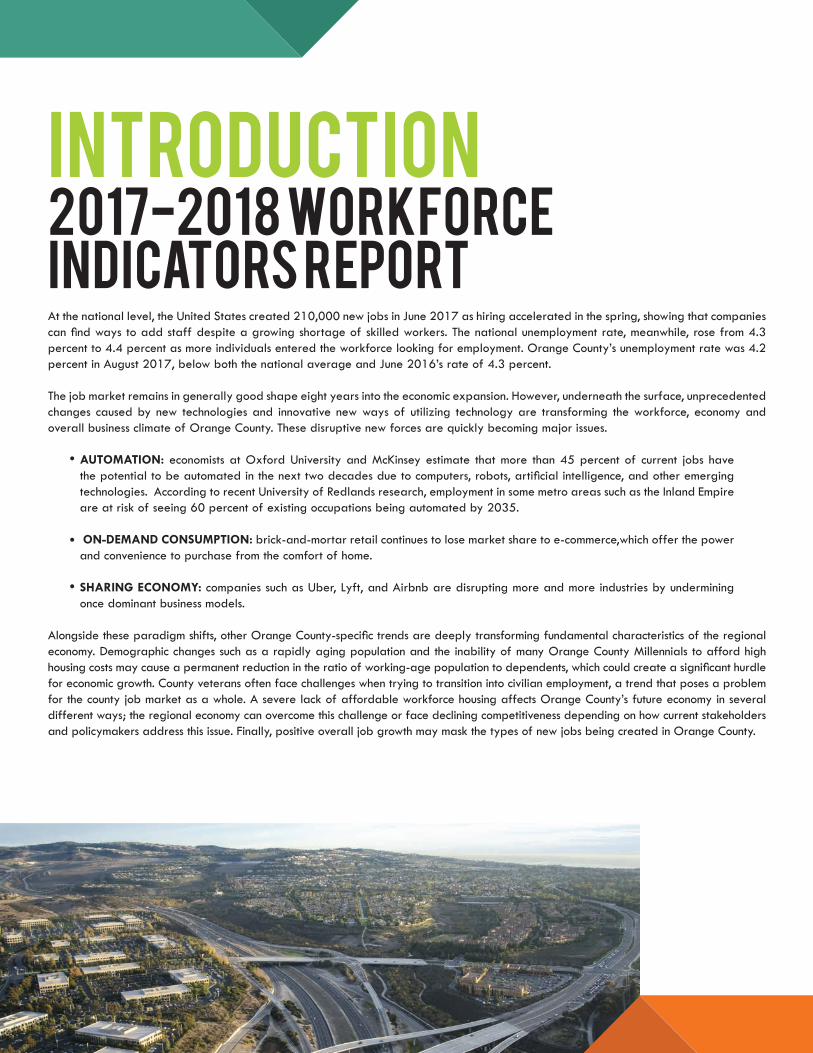
INTRODUCTION2017-2018 WORKFORCE INDICATORS REPORTAt the national level, the United States created 210,000 new jobs in June 2017 as hiring accelerated in the spring, showing that companies can find ways to add staff despite a growing shortage of skilled workers. The national unemployment rate, meanwhile, rose from 4.3 percent to 4.4 percent as more individuals entered the workforce looking for employment. Orange County’s unemployment rate was 4.2 percent in August 2017, below both the national average and June 2016’s rate of 4.3 percent.
The job market remains in generally good shape eight years into the economic expansion. However, underneath the surface, unprecedented changes caused by new technologies and innovative new ways of utilizing technology are transforming the workforce, economy and overall business climate of Orange County. These disruptive new forces are quickly becoming major issues.
AUTOMATION: economists at Oxford University and McKinsey estimate that more than 45 percent of current jobs have the potential to be automated in the next two decades due to computers, robots, artificial intelligence, and other emerging technologies. According to recent University of Redlands research, employment in some metro areas such as the Inland Empire are at risk of seeing 60 percent of existing occupations being automated by 2035.
ON-DEMAND CONSUMPTION: brick-and-mortar retail continues to lose market share to e-commerce,which offer the power and convenience to purchase from the comfort of home.
SHARING ECONOMY: companies such as Uber, Lyft, and Airbnb are disrupting more and more industries by undermining once dominant business models.
Alongside these paradigm shifts, other Orange County-specific trends are deeply transforming fundamental characteristics of the regional economy. Demographic changes such as a rapidly aging population and the inability of many Orange County Millennials to afford high housing costs may cause a permanent reduction in the ratio of working-age population to dependents, which could create a significant hurdle for economic growth. County veterans often face challenges when trying to transition into civilian employment, a trend that poses a problem for the county job market as a whole. A severe lack of affordable workforce housing affects Orange County’s future economy in several different ways; the regional economy can overcome this challenge or face declining competitiveness depending on how current stakeholders and policymakers address this issue. Finally, positive overall job growth may mask the types of new jobs being created in Orange County.
99
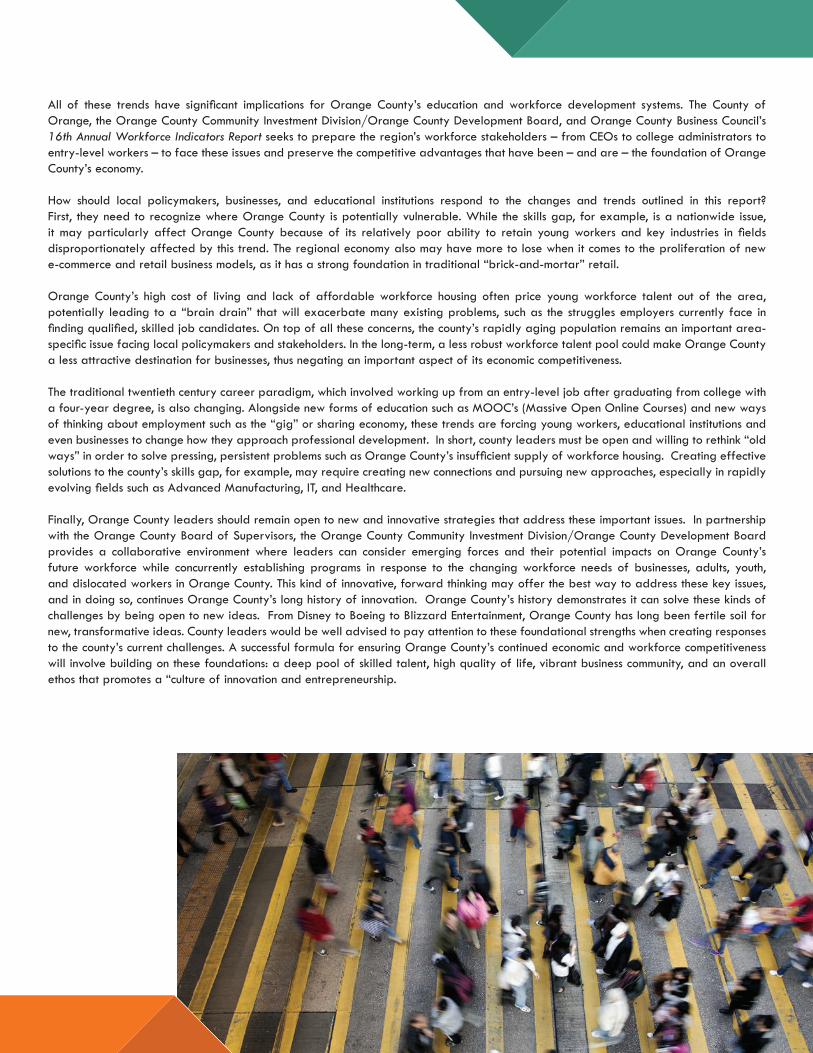
All of these trends have significant implications for Orange County’s education and workforce development systems. The County of Orange, the Orange County Community Investment Division/Orange County Development Board, and Orange County Business Council’s 16th Annual Workforce Indicators Report seeks to prepare the region’s workforce stakeholders – from CEOs to college administrators to entry-level workers – to face these issues and preserve the competitive advantages that have been – and are – the foundation of Orange County’s economy.
How should local policymakers, businesses, and educational institutions respond to the changes and trends outlined in this report? First, they need to recognize where Orange County is potentially vulnerable. While the skills gap, for example, is a nationwide issue, it may particularly affect Orange County because of its relatively poor ability to retain young workers and key industries in fields disproportionately affected by this trend. The regional economy also may have more to lose when it comes to the proliferation of new e-commerce and retail business models, as it has a strong foundation in traditional “brick-and-mortar” retail.
Orange County’s high cost of living and lack of affordable workforce housing often price young workforce talent out of the area, potentially leading to a “brain drain” that will exacerbate many existing problems, such as the struggles employers currently face in finding qualified, skilled job candidates. On top of all these concerns, the county’s rapidly aging population remains an important area-specific issue facing local policymakers and stakeholders. In the long-term, a less robust workforce talent pool could make Orange County a less attractive destination for businesses, thus negating an important aspect of its economic competitiveness.
The traditional twentieth century career paradigm, which involved working up from an entry-level job after graduating from college with a four-year degree, is also changing. Alongside new forms of education such as MOOC’s (Massive Open Online Courses) and new ways of thinking about employment such as the “gig” or sharing economy, these trends are forcing young workers, educational institutions and even businesses to change how they approach professional development. In short, county leaders must be open and willing to rethink “old ways” in order to solve pressing, persistent problems such as Orange County’s insufficient supply of workforce housing. Creating effective solutions to the county’s skills gap, for example, may require creating new connections and pursuing new approaches, especially in rapidly evolving fields such as Advanced Manufacturing, IT, and Healthcare.
Finally, Orange County leaders should remain open to new and innovative strategies that address these important issues. In partnership with the Orange County Board of Supervisors, the Orange County Community Investment Division/Orange County Development Board provides a collaborative environment where leaders can consider emerging forces and their potential impacts on Orange County’s future workforce while concurrently establishing programs in response to the changing workforce needs of businesses, adults, youth, and dislocated workers in Orange County. This kind of innovative, forward thinking may offer the best way to address these key issues, and in doing so, continues Orange County’s long history of innovation. Orange County’s history demonstrates it can solve these kinds of challenges by being open to new ideas. From Disney to Boeing to Blizzard Entertainment, Orange County has long been fertile soil for new, transformative ideas. County leaders would be well advised to pay attention to these foundational strengths when creating responses to the county’s current challenges. A successful formula for ensuring Orange County’s continued economic and workforce competitiveness will involve building on these foundations: a deep pool of skilled talent, high quality of life, vibrant business community, and an overall ethos that promotes a “culture of innovation and entrepreneurship.
1010
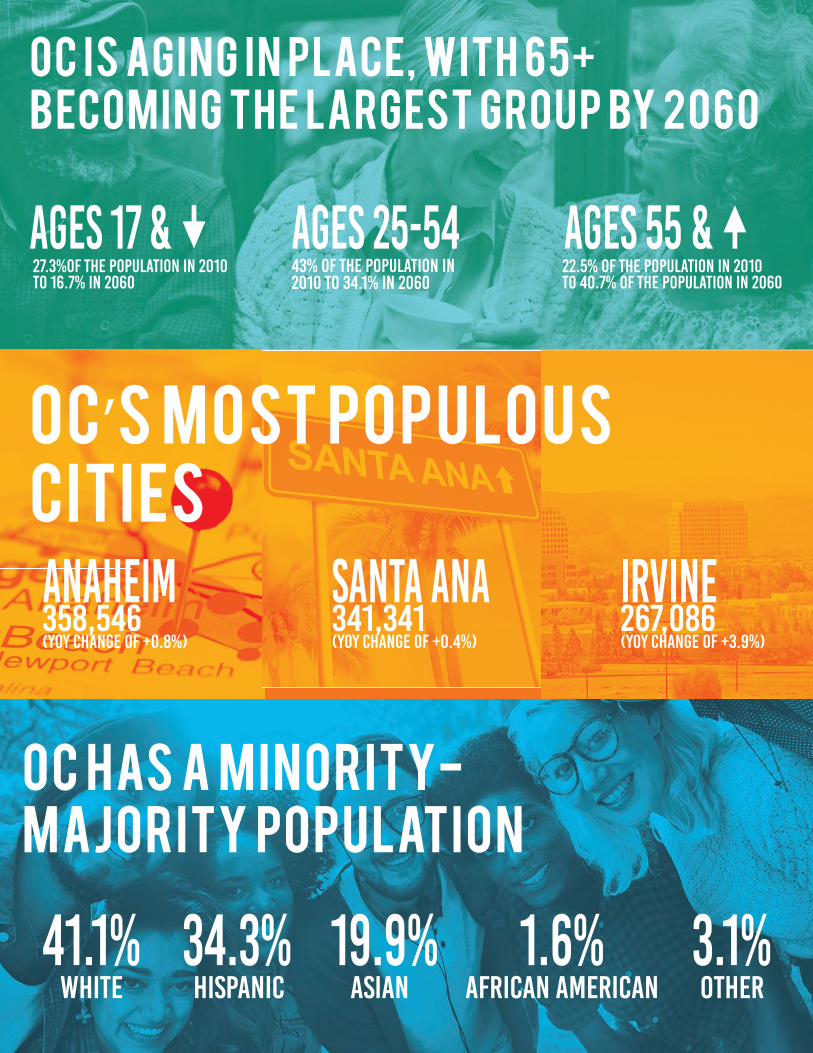
O C has a m i n o r ity-m aj o r ity po pu lati o n
O C is ag i n g i n place, w ith 65+ b eco m i n g th e la rg est g ro u p by 20 6 0
aGES 17 & 27.3%of the population in 2010 to 16.7% in 2060
41.1%White
aGES 25-5443% of the population in 2010 to 34.1% in 2060
AGES 55 & 22.5% of the population in 2010 to 40.7% of the population in 2060
O C’s m ost po pu lo us citi esanaheim358,546 (YoY Change of +0.8%)
santa ana341,341 (YoY Change of +0.4%)
Irvine267,086 (YoY Change of +3.9%)
34.3%Hispanic
19.9%Asian
1.6%African American
3.1%other
1111
DEMOGRAPHIC TRENDS
As the county continues to grow into a thriving metropolitan center, business and
government will need to adjust to Orange County’s changing dynamics to remain
competitive and a desirable place to live and do business. Orange County’s population
looks very different today than it did just 20 years ago, and it will continue to change
— impacting how community, government and economic leaders plan for the future.
1212
DEMOGRAPHIC TRENDSINTRODUCTIONOrange County is currently undergoing several significant, long-term demographic changes that will transform the county’s workforce and economic landscape, especially an aging and increasingly diverse population, along with the ongoing loss of key millennial workforce talent to other regions. Local leaders, stakeholders, and policymakers must consider and address these dramatic changes when planning for the future, creating strategies to protect the county’s core competitive advantages.
WHAT HAS HAPPENED?Orange County has experienced four major demographic shifts since the 1990s: a rapidly aging population, fluctuations in population growth based upon migration trends, increasing ethnic diversity, and increasing educational attainment and income rates.
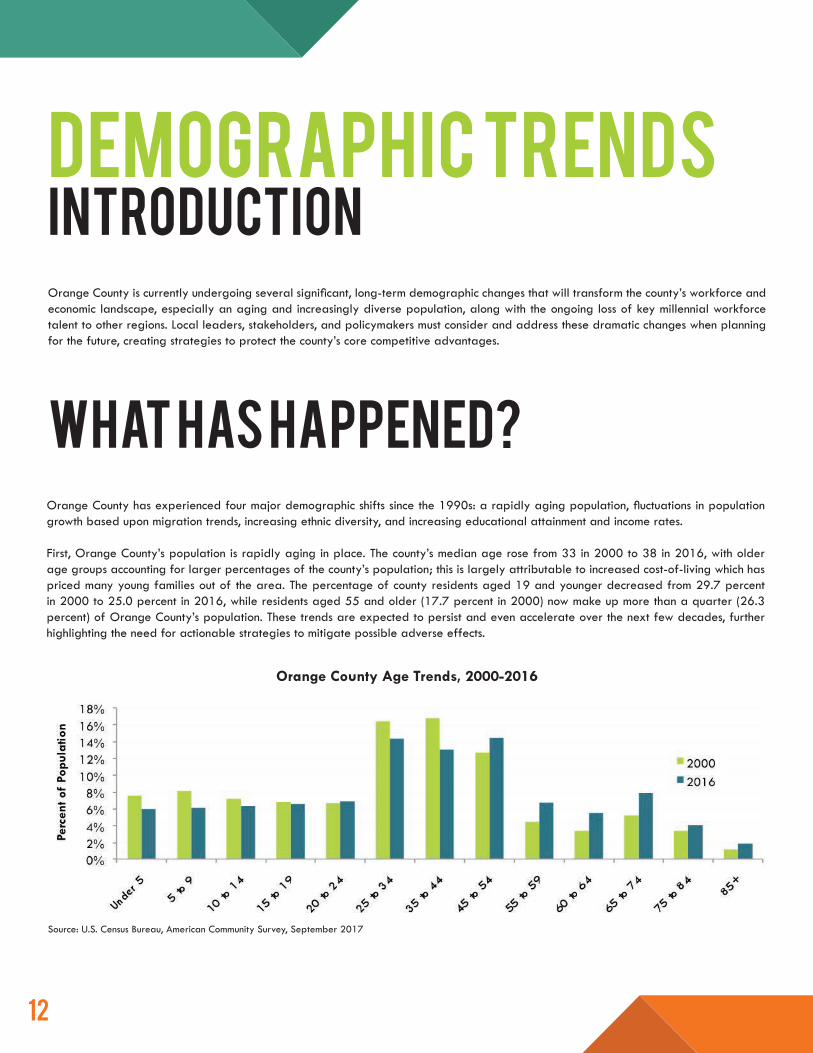
First, Orange County’s population is rapidly aging in place. The county’s median age rose from 33 in 2000 to 38 in 2016, with older age groups accounting for larger percentages of the county’s population; this is largely attributable to increased cost-of-living which has priced many young families out of the area. The percentage of county residents aged 19 and younger decreased from 29.7 percent in 2000 to 25.0 percent in 2016, while residents aged 55 and older (17.7 percent in 2000) now make up more than a quarter (26.3 percent) of Orange County’s population. These trends are expected to persist and even accelerate over the next few decades, further highlighting the need for actionable strategies to mitigate possible adverse effects.
Orange County Age Trends, 2000-2016
Source: U.S. Census Bureau, American Community Survey, September 2017
1313
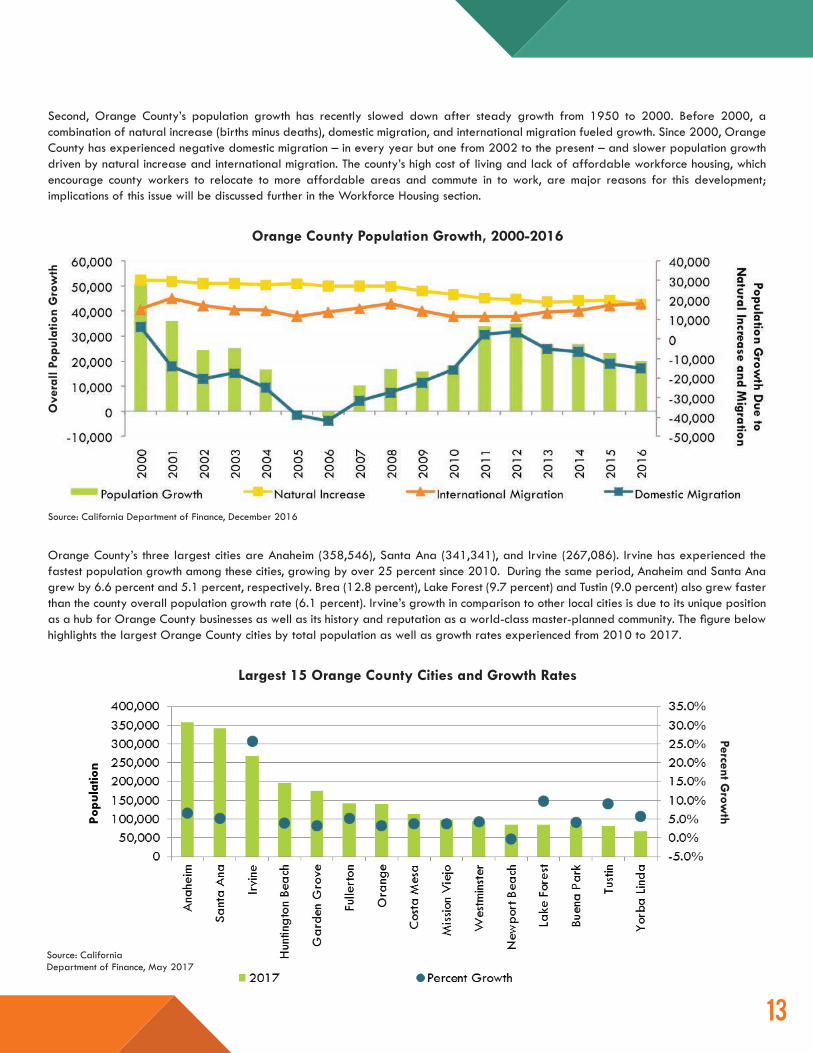
Second, Orange County’s population growth has recently slowed down after steady growth from 1950 to 2000. Before 2000, a combination of natural increase (births minus deaths), domestic migration, and international migration fueled growth. Since 2000, Orange County has experienced negative domestic migration – in every year but one from 2002 to the present – and slower population growth driven by natural increase and international migration. The county’s high cost of living and lack of affordable workforce housing, which encourage county workers to relocate to more affordable areas and commute in to work, are major reasons for this development; implications of this issue will be discussed further in the Workforce Housing section.
Orange County’s three largest cities are Anaheim (358,546), Santa Ana (341,341), and Irvine (267,086). Irvine has experienced the fastest population growth among these cities, growing by over 25 percent since 2010. During the same period, Anaheim and Santa Ana grew by 6.6 percent and 5.1 percent, respectively. Brea (12.8 percent), Lake Forest (9.7 percent) and Tustin (9.0 percent) also grew faster than the county overall population growth rate (6.1 percent). Irvine’s growth in comparison to other local cities is due to its unique position as a hub for Orange County businesses as well as its history and reputation as a world-class master-planned community. The figure below highlights the largest Orange County cities by total population as well as growth rates experienced from 2010 to 2017.
Orange County Population Growth, 2000-2016
Source: California Department of Finance, December 2016
Largest 15 Orange County Cities and Growth Rates
Source: CaliforniaDepartment of Finance, May 2017
Percent Grow
th
Ove
rall
Popu
latio
n G
row
th
1414
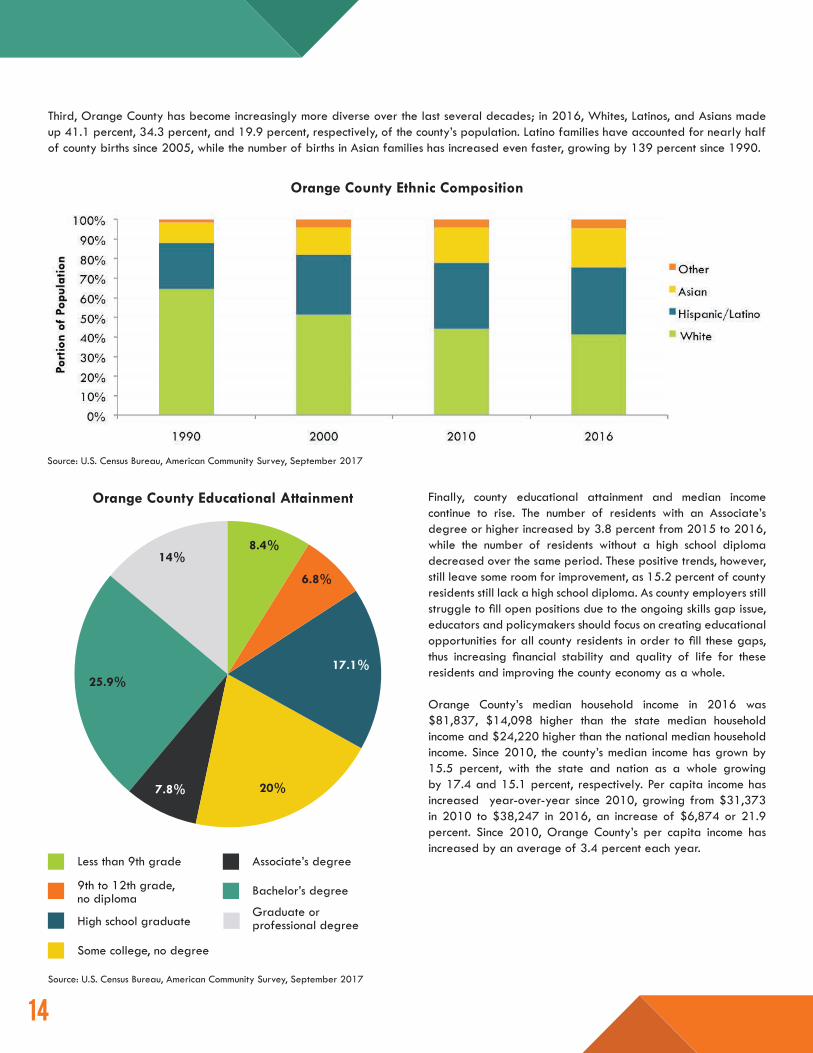
Third, Orange County has become increasingly more diverse over the last several decades; in 2016, Whites, Latinos, and Asians made up 41.1 percent, 34.3 percent, and 19.9 percent, respectively, of the county’s population. Latino families have accounted for nearly half of county births since 2005, while the number of births in Asian families has increased even faster, growing by 139 percent since 1990.
Finally, county educational attainment and median income continue to rise. The number of residents with an Associate’s degree or higher increased by 3.8 percent from 2015 to 2016, while the number of residents without a high school diploma decreased over the same period. These positive trends, however, still leave some room for improvement, as 15.2 percent of county residents still lack a high school diploma. As county employers still struggle to fill open positions due to the ongoing skills gap issue, educators and policymakers should focus on creating educational opportunities for all county residents in order to fill these gaps, thus increasing financial stability and quality of life for these residents and improving the county economy as a whole.
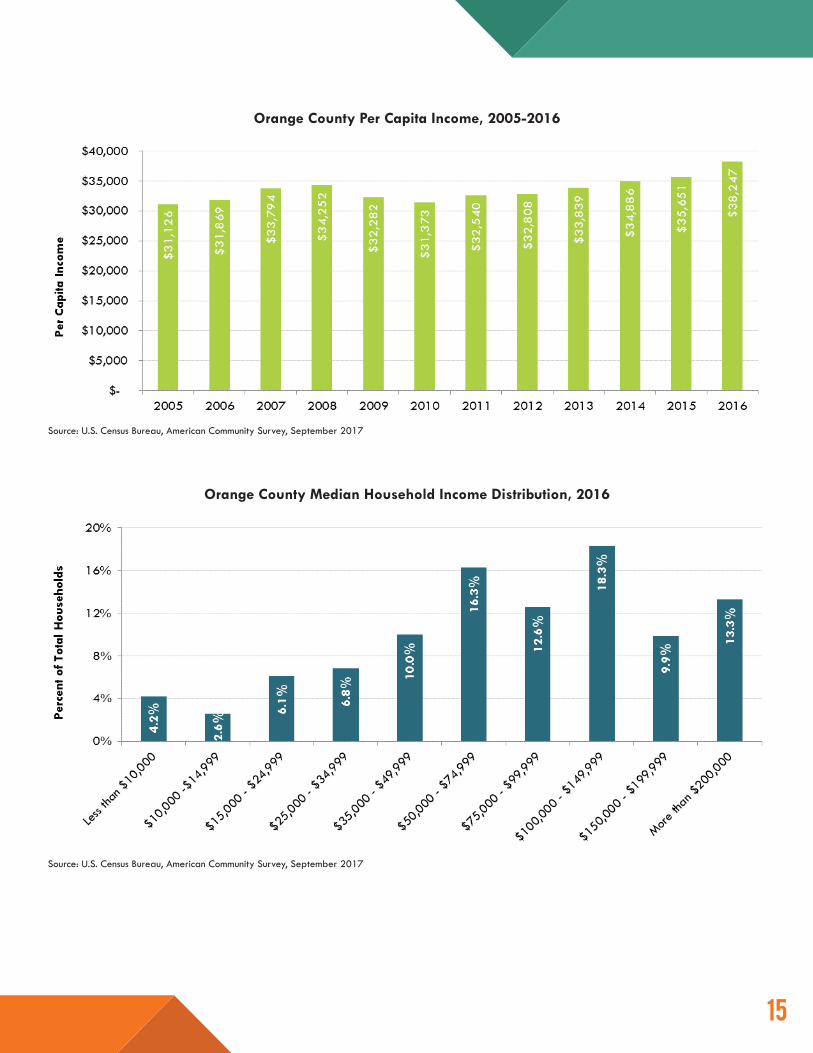
Orange County’s median household income in 2016 was $81,837, $14,098 higher than the state median household income and $24,220 higher than the national median household income. Since 2010, the county’s median income has grown by 15.5 percent, with the state and nation as a whole growing by 17.4 and 15.1 percent, respectively. Per capita income has increased year-over-year since 2010, growing from $31,373 in 2010 to $38,247 in 2016, an increase of $6,874 or 21.9 percent. Since 2010, Orange County’s per capita income has increased by an average of 3.4 percent each year.
Orange County Ethnic Composition
Source: U.S. Census Bureau, American Community Survey, September 2017
Orange County Educational Attainment
8.4%
6.8%
17.1%
20%7.8%
25.9%
14%
Less than 9th grade
9th to 12th grade, no diploma
High school graduate
Some college, no degree
Associate’s degree
Bachelor’s degree
Graduate or professional degree
Source: U.S. Census Bureau, American Community Survey, September 2017
1515
Orange County Per Capita Income, 2005-2016
Source: U.S. Census Bureau, American Community Survey, September 2017
Orange County Median Household Income Distribution, 2016
Source: U.S. Census Bureau, American Community Survey, September 2017
$
1616
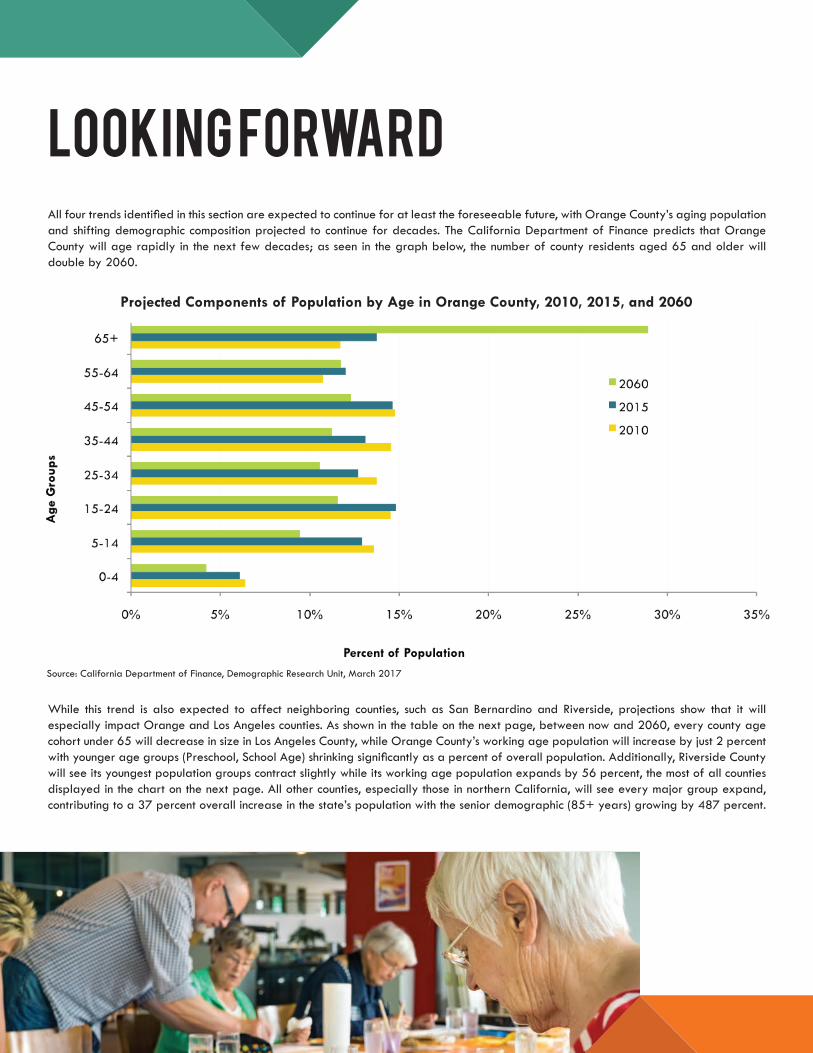
LOOKING FORWARDAll four trends identified in this section are expected to continue for at least the foreseeable future, with Orange County’s aging population and shifting demographic composition projected to continue for decades. The California Department of Finance predicts that Orange County will age rapidly in the next few decades; as seen in the graph below, the number of county residents aged 65 and older will double by 2060.
While this trend is also expected to affect neighboring counties, such as San Bernardino and Riverside, projections show that it will especially impact Orange and Los Angeles counties. As shown in the table on the next page, between now and 2060, every county age cohort under 65 will decrease in size in Los Angeles County, while Orange County’s working age population will increase by just 2 percent with younger age groups (Preschool, School Age) shrinking significantly as a percent of overall population. Additionally, Riverside County will see its youngest population groups contract slightly while its working age population expands by 56 percent, the most of all counties displayed in the chart on the next page. All other counties, especially those in northern California, will see every major group expand, contributing to a 37 percent overall increase in the state’s population with the senior demographic (85+ years) growing by 487 percent.
Projected Components of Population by Age in Orange County, 2010, 2015, and 2060
Source: California Department of Finance, Demographic Research Unit, March 2017
1717
Rapid aging will have significant ramifications for Orange County. To name just a few, an increasing share of older residents will likely require additional healthcare and other governmental services, placing additional strains on the county’s healthcare, senior housing, and social services. While potentially creating new jobs tied to these services -- and partially offset by Baby Boomer’s tendency to work longer -- Orange County’s shrinking working age population, however, may not be enough to support this older population. In 2016, Orange County had two working age adults for every dependent resident (17 and younger or 65 and older); this number will fall to one by 2040.
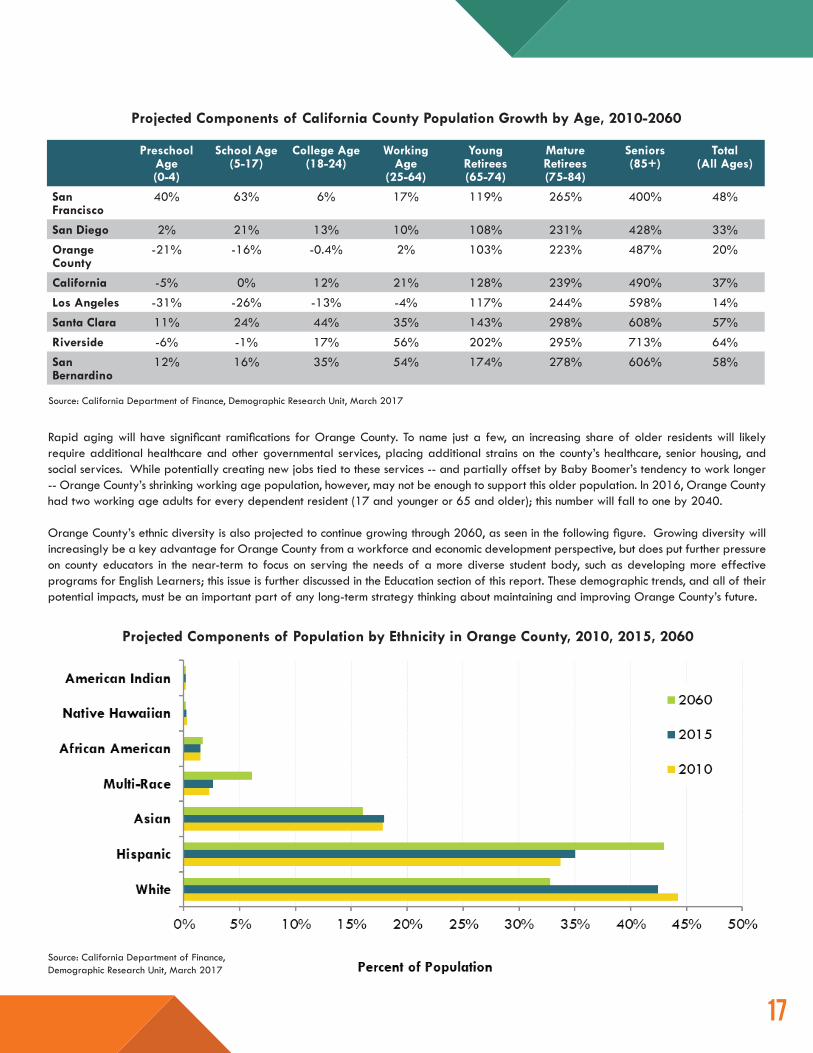
Orange County’s ethnic diversity is also projected to continue growing through 2060, as seen in the following figure. Growing diversity will increasingly be a key advantage for Orange County from a workforce and economic development perspective, but does put further pressure on county educators in the near-term to focus on serving the needs of a more diverse student body, such as developing more effective programs for English Learners; this issue is further discussed in the Education section of this report. These demographic trends, and all of their potential impacts, must be an important part of any long-term strategy thinking about maintaining and improving Orange County’s future.
Projected Components of Population by Ethnicity in Orange County, 2010, 2015, 2060
Source: California Department of Finance, Demographic Research Unit, March 2017
Projected Components of California County Population Growth by Age, 2010-2060
Preschool Age (0-4)
School Age (5-17)
College Age (18-24)
Working Age
(25-64)
Young Retirees (65-74)
Mature Retirees (75-84)
Seniors (85+)
Total (All Ages)
San Francisco
40% 63% 6% 17% 119% 265% 400% 48%
San Diego 2% 21% 13% 10% 108% 231% 428% 33%Orange County
-21% -16% -0.4% 2% 103% 223% 487% 20%
California -5% 0% 12% 21% 128% 239% 490% 37%Los Angeles -31% -26% -13% -4% 117% 244% 598% 14%Santa Clara 11% 24% 44% 35% 143% 298% 608% 57%Riverside -6% -1% 17% 56% 202% 295% 713% 64%San Bernardino
12% 16% 35% 54% 174% 278% 606% 58%
Source: California Department of Finance, Demographic Research Unit, March 2017
1818
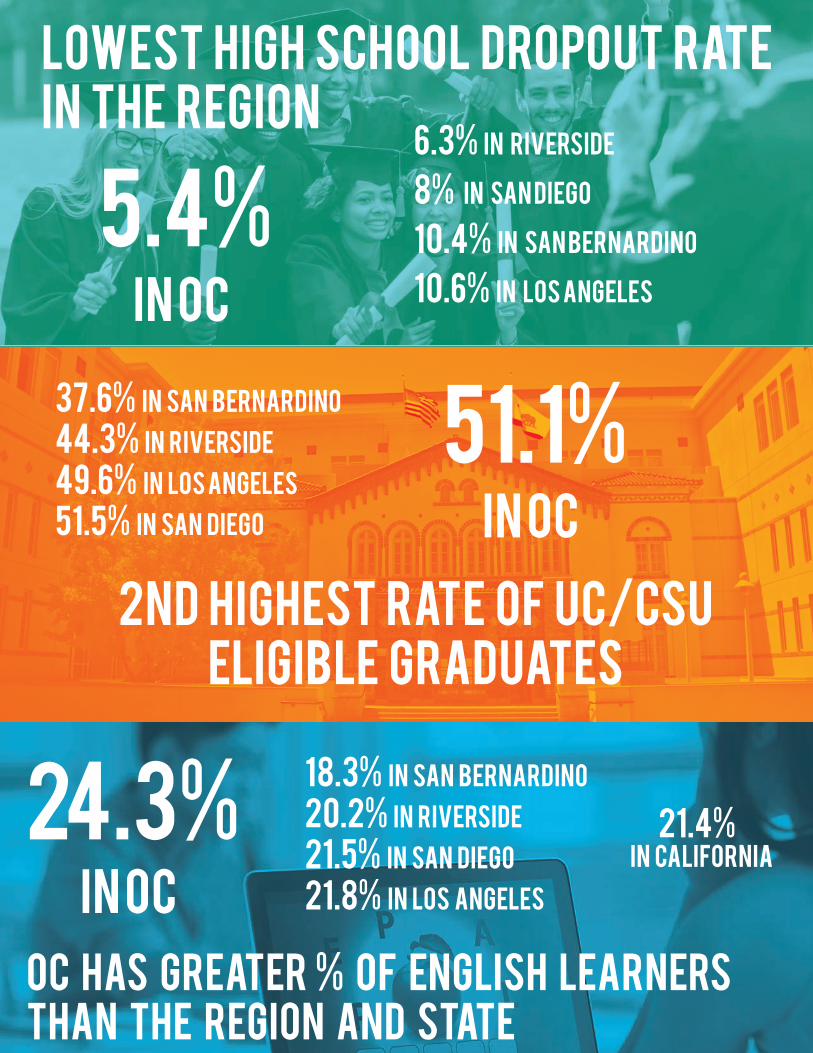
5.4%
lowest high school dropout rate in the region
6.3% in riverside
8% in san diego
10.4% in san bernardino
10.6% in los angelesin OC
2nd highest rate of uc/CSU eligible graduates
51.1%in OC
37.6% in san bernardino
44.3% in riverside
49.6% in los angeles
51.5% in san diego
oc has greater % of english learnersthan the region and state
24.3%in OC
18.3% in san bernardino
20.2% in riverside
21.5% in san diego
21.8% in los angeles
21.4% in California

1919
EDUCATION AND WORKFORCE TRAINING TRENDS
K-12, higher education, and technical training trends greatly impact Orange County’s
economic development and ability to foster a thriving, highly-skilled workforce. This
section highlights how well academia prepares students for the realities of the 21st
century labor market while also emphasizing challenges present in the current
educational climate.
2020
WORKFORCE ANDTRAINING TRENDSINTRODUCTIONOrange County’s rapidly changing 21st century workplace requires an educated, skilled workforce talent that displays a robust mix of hard and soft skills, especially those related to STEM (Science, Technology, Engineering, and Mathematics) disciplines. Due to this rapid evolution, educators must constantly update their curricula in order to properly prepare students for higher education and successful career paths in the modern, knowledge-based economy. While Orange County students generally performed very well at the K-12 and college levels, there is still room for improvement in lower-performing school districts. In addition, stakeholders and policymakers should consider creating or supporting programs that allow students from underrepresented groups to increasingly acquire in-demand STEM skills. Despite education’s continual transformation, it still remains the single best tool for ensuring access to gainful employment.
K-12 EDUCATIONWHAT HAS HAPPENED?While Orange County continues to outperform regional peers and national averages, it still has room to improve its educational systems. Stakeholders should pay particular attention to three important metrics of K-12 education – English language learners, dropout rates and college preparation.
English Language Learning should remain a priority as Orange County’s residents become increasingly diverse and age demographics continue to shift. Improving English Language Learner (ELL) programs will help more students develop the tools and skills required to advance through their academics, reduce dropout risks, and increase students’ chances to attend University of California or California State University schools. Thus, local educators and policymakers must emphasize English language programs when creating or revising curricula.
Alongside these shifting demographics, social and technology trends are serving to disrupt a number of traditional industries and their labor markets; this, in turn, will change the kinds of skills required by local and regional employers. These new labor market trends will require individuals to have a mix of hard and soft skills, forcing K-12 and post-secondary institutions to rethink how they prepare students for employment after graduation. Additionally, more emphasis should be placed on certification programs as these provide less expensive, highly focused programs capable of better preparing individuals for new and emerging technical occupations which provide higher-than-average wages. Marketing these programs and their benefits should be a priority for local educators and workforce professionals, along with ensuring that these programs remain up-to-date in a rapidly evolving labor market.
2121
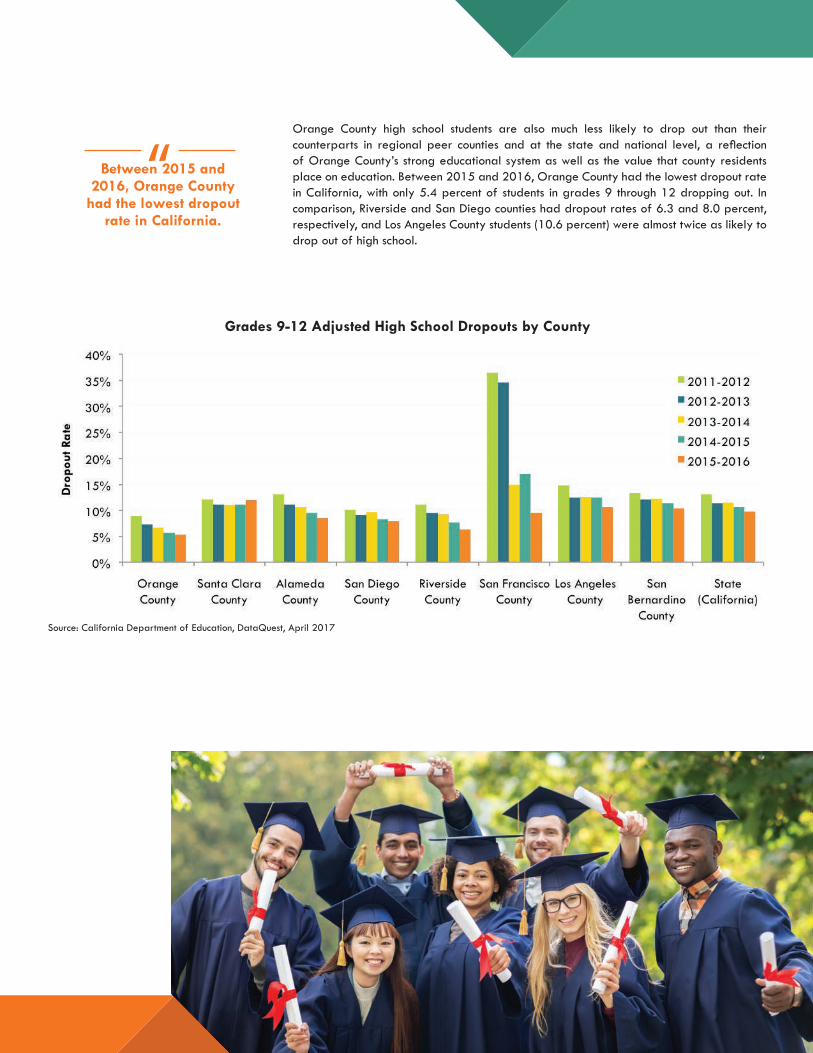
Orange County high school students are also much less likely to drop out than their counterparts in regional peer counties and at the state and national level, a reflection of Orange County’s strong educational system as well as the value that county residents place on education. Between 2015 and 2016, Orange County had the lowest dropout rate in California, with only 5.4 percent of students in grades 9 through 12 dropping out. In comparison, Riverside and San Diego counties had dropout rates of 6.3 and 8.0 percent, respectively, and Los Angeles County students (10.6 percent) were almost twice as likely to drop out of high school.
Grades 9-12 Adjusted High School Dropouts by County
Source: California Department of Education, DataQuest, April 2017
Between 2015 and 2016, Orange County
had the lowest dropout rate in California.
“
2222
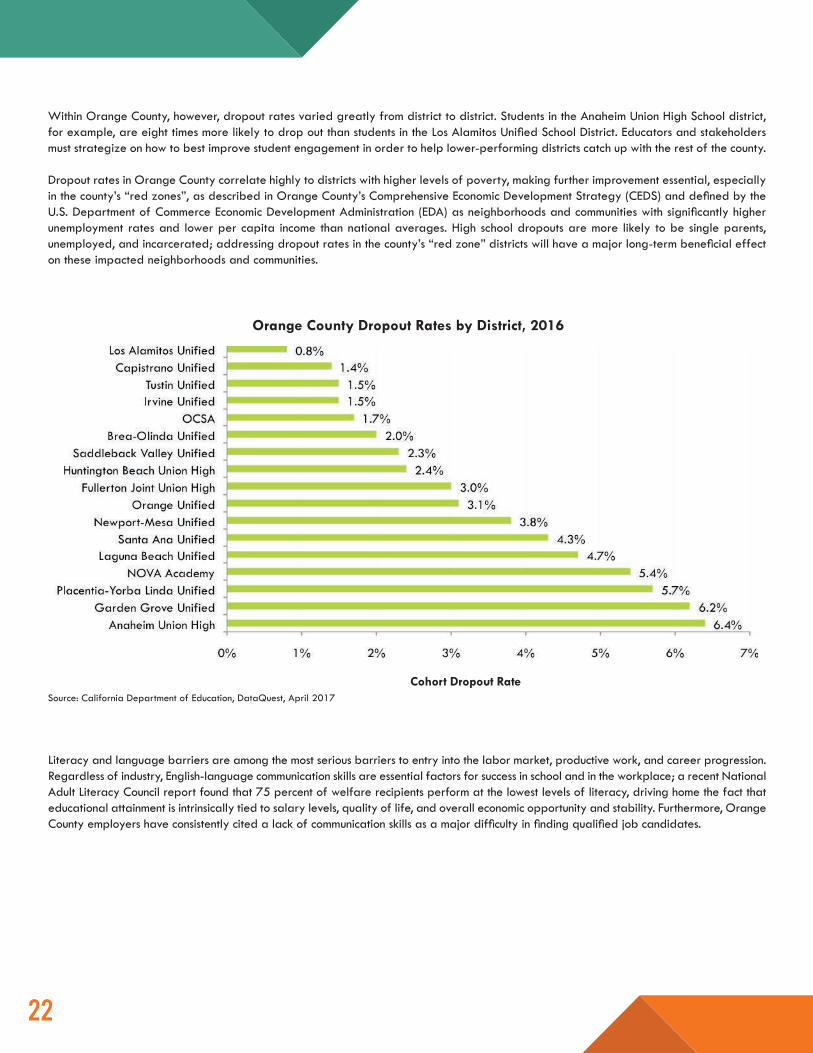
Within Orange County, however, dropout rates varied greatly from district to district. Students in the Anaheim Union High School district, for example, are eight times more likely to drop out than students in the Los Alamitos Unified School District. Educators and stakeholders must strategize on how to best improve student engagement in order to help lower-performing districts catch up with the rest of the county.
Dropout rates in Orange County correlate highly to districts with higher levels of poverty, making further improvement essential, especially in the county’s “red zones”, as described in Orange County’s Comprehensive Economic Development Strategy (CEDS) and defined by the U.S. Department of Commerce Economic Development Administration (EDA) as neighborhoods and communities with significantly higher unemployment rates and lower per capita income than national averages. High school dropouts are more likely to be single parents, unemployed, and incarcerated; addressing dropout rates in the county’s “red zone” districts will have a major long-term beneficial effect on these impacted neighborhoods and communities.
Orange County Dropout Rates by District, 2016
Literacy and language barriers are among the most serious barriers to entry into the labor market, productive work, and career progression. Regardless of industry, English-language communication skills are essential factors for success in school and in the workplace; a recent National Adult Literacy Council report found that 75 percent of welfare recipients perform at the lowest levels of literacy, driving home the fact that educational attainment is intrinsically tied to salary levels, quality of life, and overall economic opportunity and stability. Furthermore, Orange County employers have consistently cited a lack of communication skills as a major difficulty in finding qualified job candidates.
Source: California Department of Education, DataQuest, April 2017Cohort Dropout Rate
2323
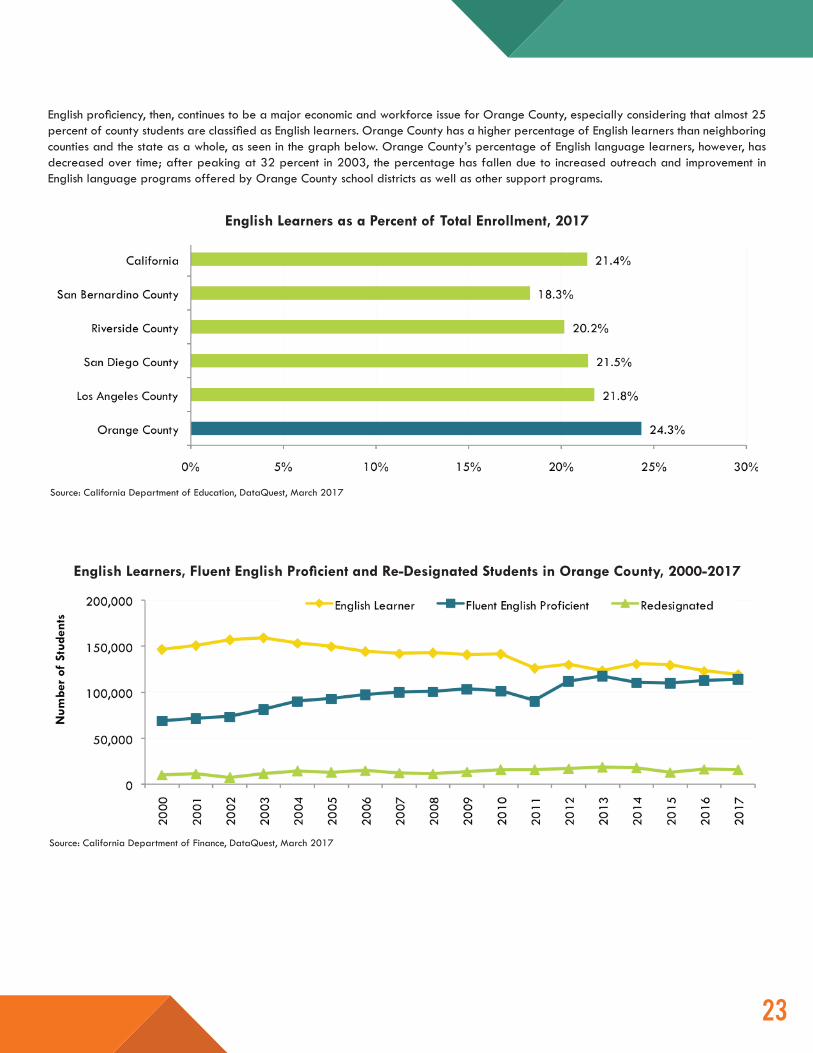
English Learners as a Percent of Total Enrollment, 2017
Source: California Department of Education, DataQuest, March 2017
English Learners, Fluent English Proficient and Re-Designated Students in Orange County, 2000-2017
Source: California Department of Finance, DataQuest, March 2017
English proficiency, then, continues to be a major economic and workforce issue for Orange County, especially considering that almost 25 percent of county students are classified as English learners. Orange County has a higher percentage of English learners than neighboring counties and the state as a whole, as seen in the graph below. Orange County’s percentage of English language learners, however, has decreased over time; after peaking at 32 percent in 2003, the percentage has fallen due to increased outreach and improvement in English language programs offered by Orange County school districts as well as other support programs.
2424
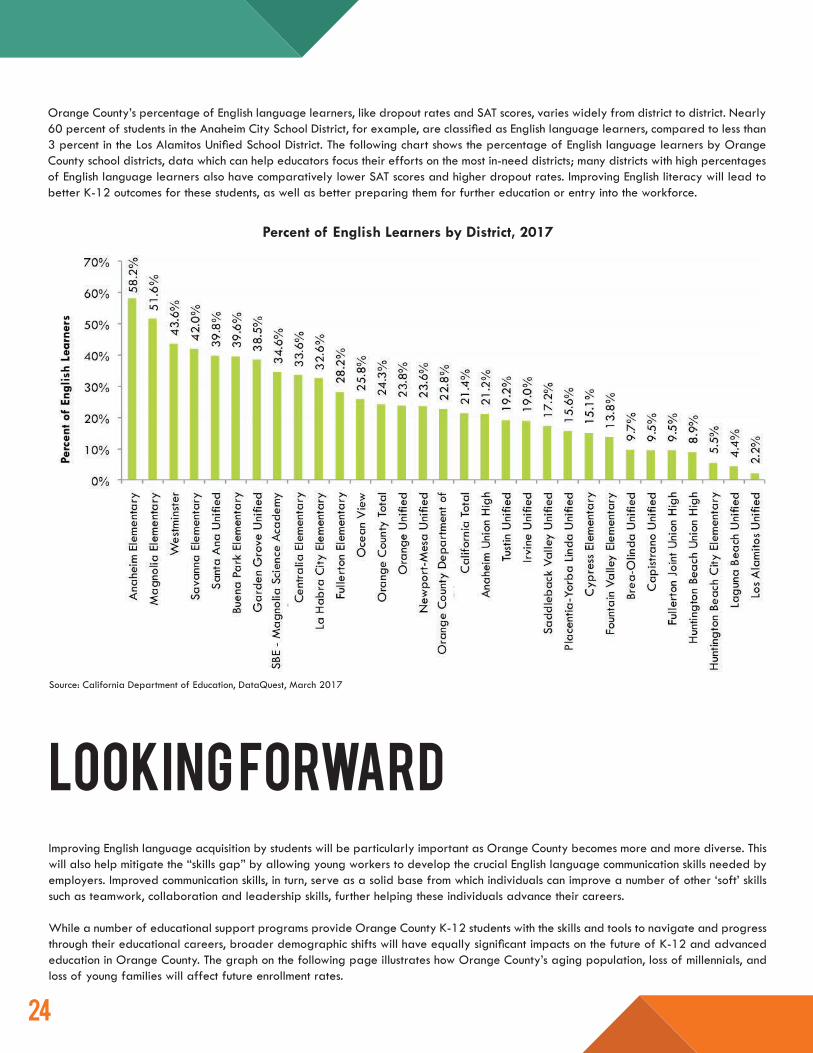
Percent of English Learners by District, 2017
Source: California Department of Education, DataQuest, March 2017
LOOKING FORWARDImproving English language acquisition by students will be particularly important as Orange County becomes more and more diverse. This will also help mitigate the “skills gap” by allowing young workers to develop the crucial English language communication skills needed by employers. Improved communication skills, in turn, serve as a solid base from which individuals can improve a number of other ‘soft’ skills such as teamwork, collaboration and leadership skills, further helping these individuals advance their careers.
While a number of educational support programs provide Orange County K-12 students with the skills and tools to navigate and progress through their educational careers, broader demographic shifts will have equally significant impacts on the future of K-12 and advanced education in Orange County. The graph on the following page illustrates how Orange County’s aging population, loss of millennials, and loss of young families will affect future enrollment rates.
Orange County’s percentage of English language learners, like dropout rates and SAT scores, varies widely from district to district. Nearly 60 percent of students in the Anaheim City School District, for example, are classified as English language learners, compared to less than 3 percent in the Los Alamitos Unified School District. The following chart shows the percentage of English language learners by Orange County school districts, data which can help educators focus their efforts on the most in-need districts; many districts with high percentages of English language learners also have comparatively lower SAT scores and higher dropout rates. Improving English literacy will lead to better K-12 outcomes for these students, as well as better preparing them for further education or entry into the workforce.
2525
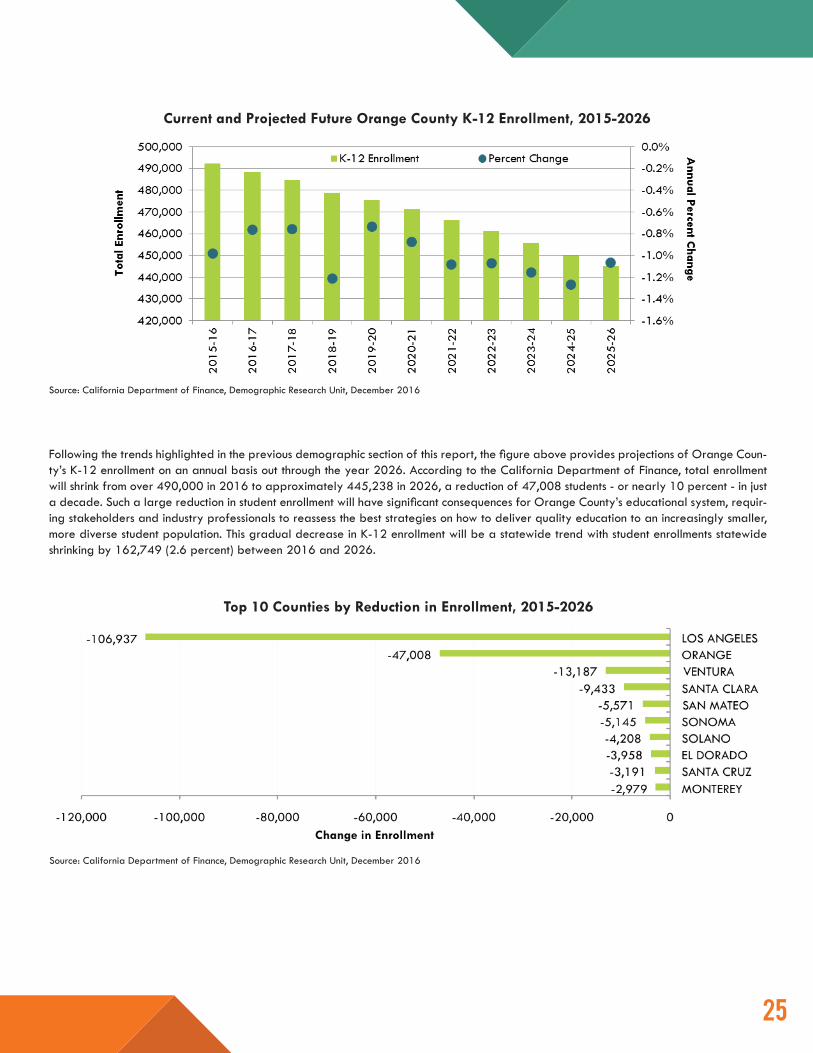
Current and Projected Future Orange County K-12 Enrollment, 2015-2026
Following the trends highlighted in the previous demographic section of this report, the figure above provides projections of Orange Coun-ty’s K-12 enrollment on an annual basis out through the year 2026. According to the California Department of Finance, total enrollment will shrink from over 490,000 in 2016 to approximately 445,238 in 2026, a reduction of 47,008 students - or nearly 10 percent - in just a decade. Such a large reduction in student enrollment will have significant consequences for Orange County’s educational system, requir-ing stakeholders and industry professionals to reassess the best strategies on how to deliver quality education to an increasingly smaller, more diverse student population. This gradual decrease in K-12 enrollment will be a statewide trend with student enrollments statewide shrinking by 162,749 (2.6 percent) between 2016 and 2026.
Source: California Department of Finance, Demographic Research Unit, December 2016
Top 10 Counties by Reduction in Enrollment, 2015-2026
Source: California Department of Finance, Demographic Research Unit, December 2016
2626
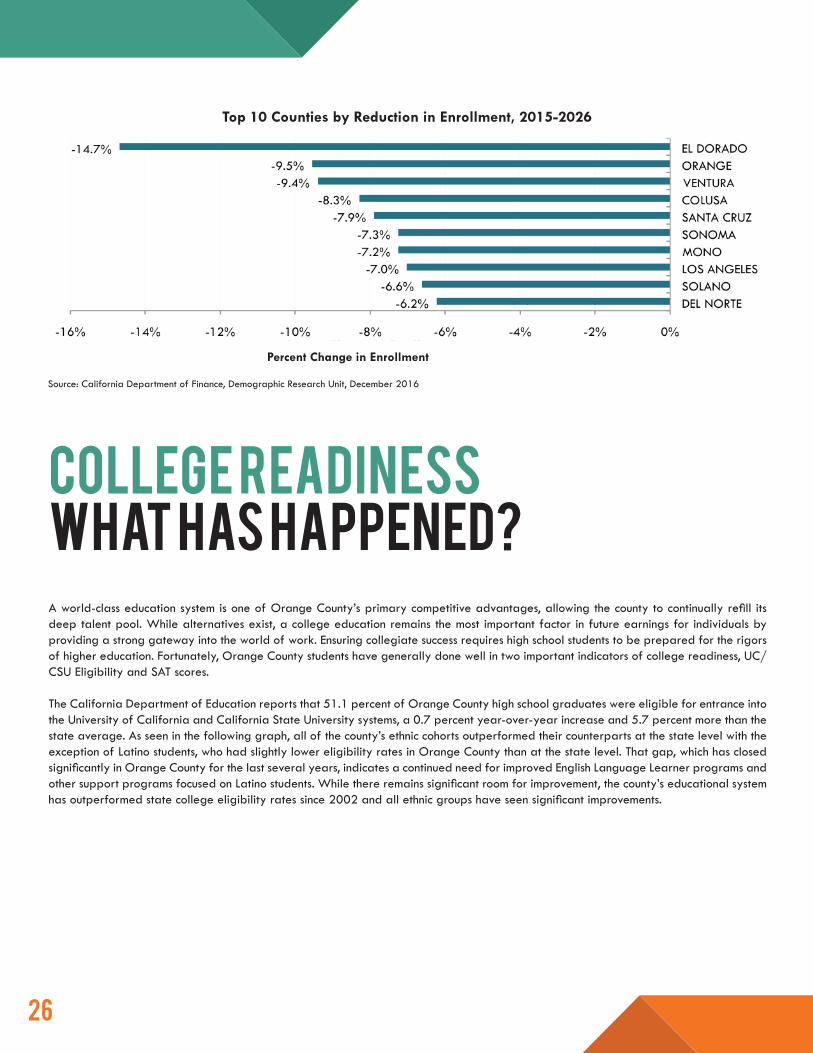
Top 10 Counties by Reduction in Enrollment, 2015-2026
Source: California Department of Finance, Demographic Research Unit, December 2016
COLLEGE READINESSWHAT HAS HAPPENED?A world-class education system is one of Orange County’s primary competitive advantages, allowing the county to continually refill its deep talent pool. While alternatives exist, a college education remains the most important factor in future earnings for individuals by providing a strong gateway into the world of work. Ensuring collegiate success requires high school students to be prepared for the rigors of higher education. Fortunately, Orange County students have generally done well in two important indicators of college readiness, UC/CSU Eligibility and SAT scores.
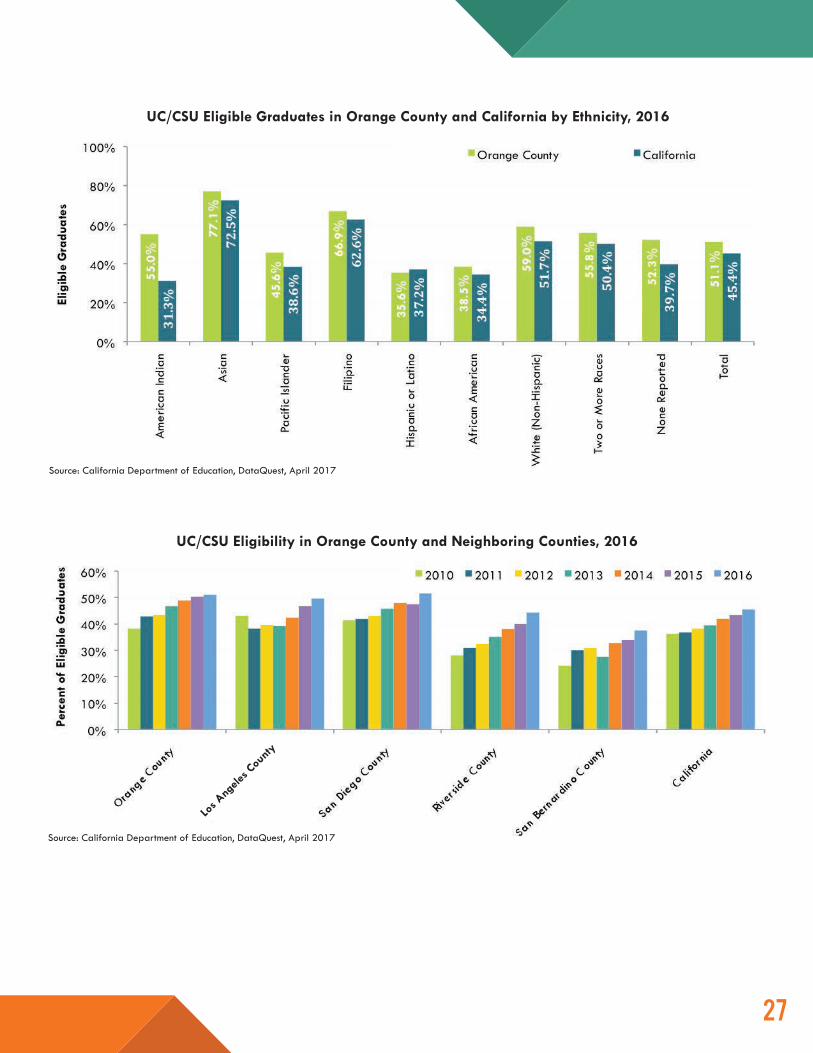
The California Department of Education reports that 51.1 percent of Orange County high school graduates were eligible for entrance into the University of California and California State University systems, a 0.7 percent year-over-year increase and 5.7 percent more than the state average. As seen in the following graph, all of the county’s ethnic cohorts outperformed their counterparts at the state level with the exception of Latino students, who had slightly lower eligibility rates in Orange County than at the state level. That gap, which has closed significantly in Orange County for the last several years, indicates a continued need for improved English Language Learner programs and other support programs focused on Latino students. While there remains significant room for improvement, the county’s educational system has outperformed state college eligibility rates since 2002 and all ethnic groups have seen significant improvements.
Percent Change in Enrollment
2727
UC/CSU Eligible Graduates in Orange County and California by Ethnicity, 2016
Source: California Department of Education, DataQuest, April 2017
UC/CSU Eligibility in Orange County and Neighboring Counties, 2016
Source: California Department of Education, DataQuest, April 2017
Los A
ngele
s Cou
nty
2828
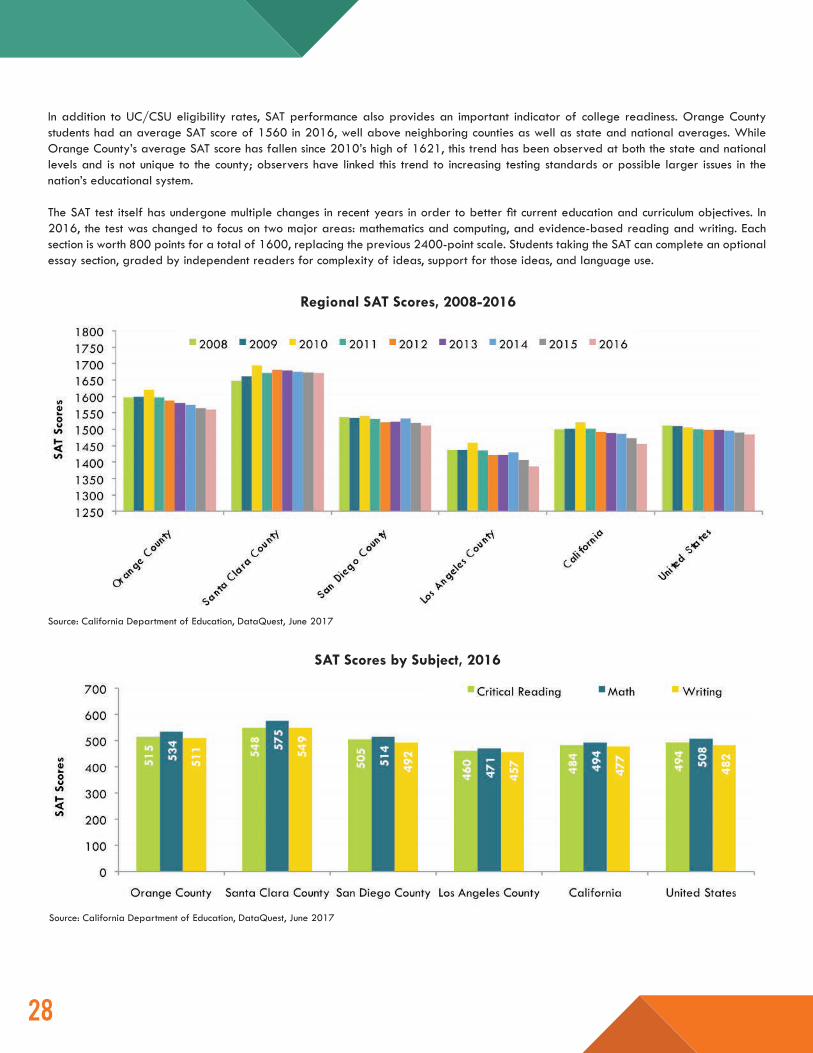
In addition to UC/CSU eligibility rates, SAT performance also provides an important indicator of college readiness. Orange County students had an average SAT score of 1560 in 2016, well above neighboring counties as well as state and national averages. While Orange County’s average SAT score has fallen since 2010’s high of 1621, this trend has been observed at both the state and national levels and is not unique to the county; observers have linked this trend to increasing testing standards or possible larger issues in the nation’s educational system.
The SAT test itself has undergone multiple changes in recent years in order to better fit current education and curriculum objectives. In 2016, the test was changed to focus on two major areas: mathematics and computing, and evidence-based reading and writing. Each section is worth 800 points for a total of 1600, replacing the previous 2400-point scale. Students taking the SAT can complete an optional essay section, graded by independent readers for complexity of ideas, support for those ideas, and language use.
Regional SAT Scores, 2008-2016
Source: California Department of Education, DataQuest, June 2017
SAT Scores by Subject, 2016
Source: California Department of Education, DataQuest, June 2017
2929
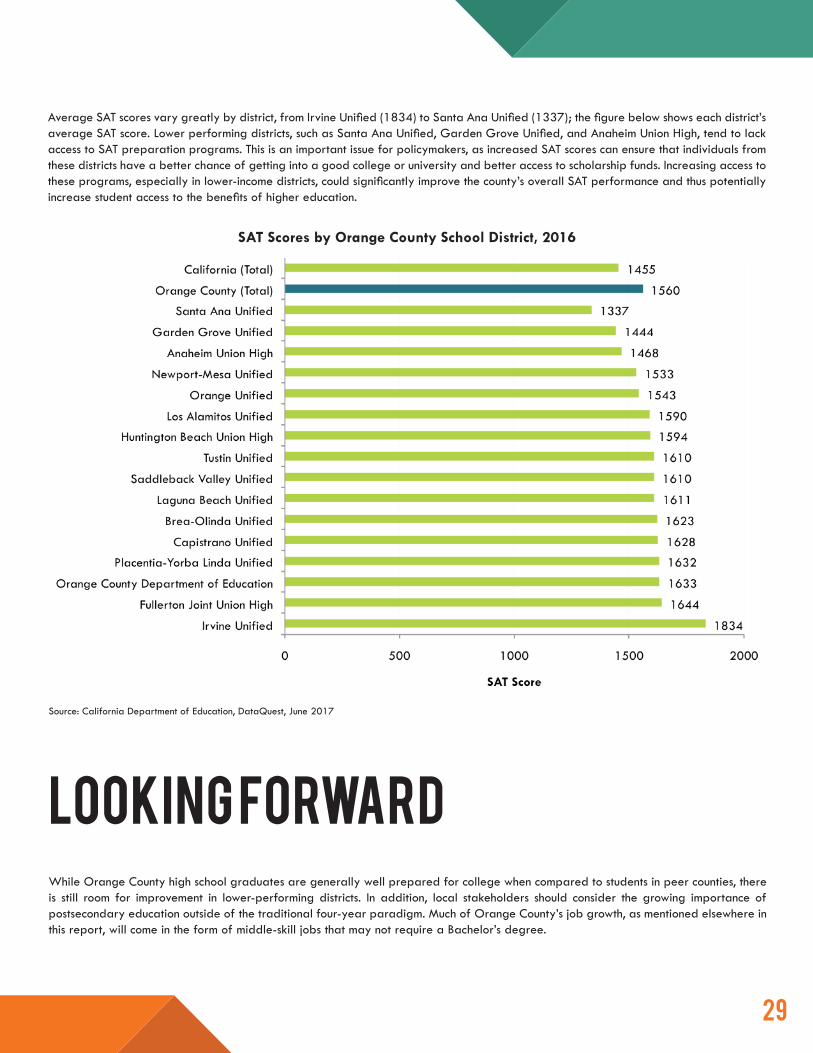
Average SAT scores vary greatly by district, from Irvine Unified (1834) to Santa Ana Unified (1337); the figure below shows each district’s average SAT score. Lower performing districts, such as Santa Ana Unified, Garden Grove Unified, and Anaheim Union High, tend to lack access to SAT preparation programs. This is an important issue for policymakers, as increased SAT scores can ensure that individuals from these districts have a better chance of getting into a good college or university and better access to scholarship funds. Increasing access to these programs, especially in lower-income districts, could significantly improve the county’s overall SAT performance and thus potentially increase student access to the benefits of higher education.
SAT Scores by Orange County School District, 2016
Source: California Department of Education, DataQuest, June 2017
looking forwardWhile Orange County high school graduates are generally well prepared for college when compared to students in peer counties, there is still room for improvement in lower-performing districts. In addition, local stakeholders should consider the growing importance of postsecondary education outside of the traditional four-year paradigm. Much of Orange County’s job growth, as mentioned elsewhere in this report, will come in the form of middle-skill jobs that may not require a Bachelor’s degree.
3030
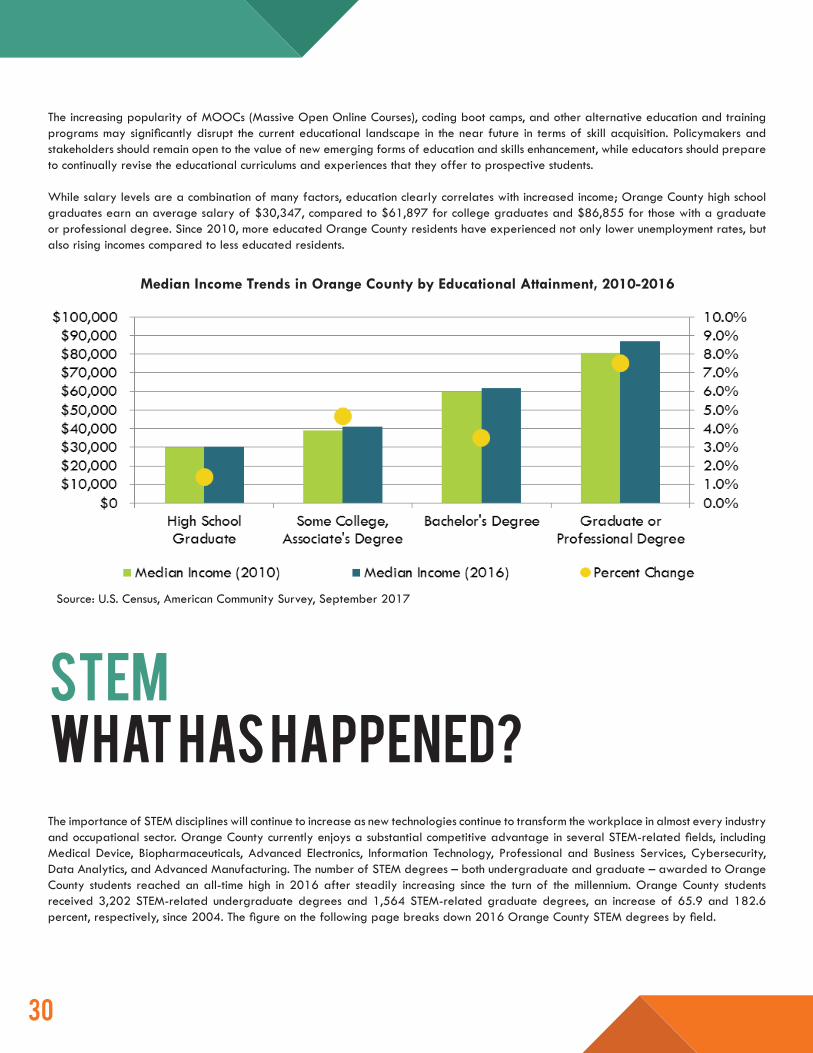
Median Income Trends in Orange County by Educational Attainment, 2010-2016
The increasing popularity of MOOCs (Massive Open Online Courses), coding boot camps, and other alternative education and training programs may significantly disrupt the current educational landscape in the near future in terms of skill acquisition. Policymakers and stakeholders should remain open to the value of new emerging forms of education and skills enhancement, while educators should prepare to continually revise the educational curriculums and experiences that they offer to prospective students.
While salary levels are a combination of many factors, education clearly correlates with increased income; Orange County high school graduates earn an average salary of $30,347, compared to $61,897 for college graduates and $86,855 for those with a graduate or professional degree. Since 2010, more educated Orange County residents have experienced not only lower unemployment rates, but also rising incomes compared to less educated residents.
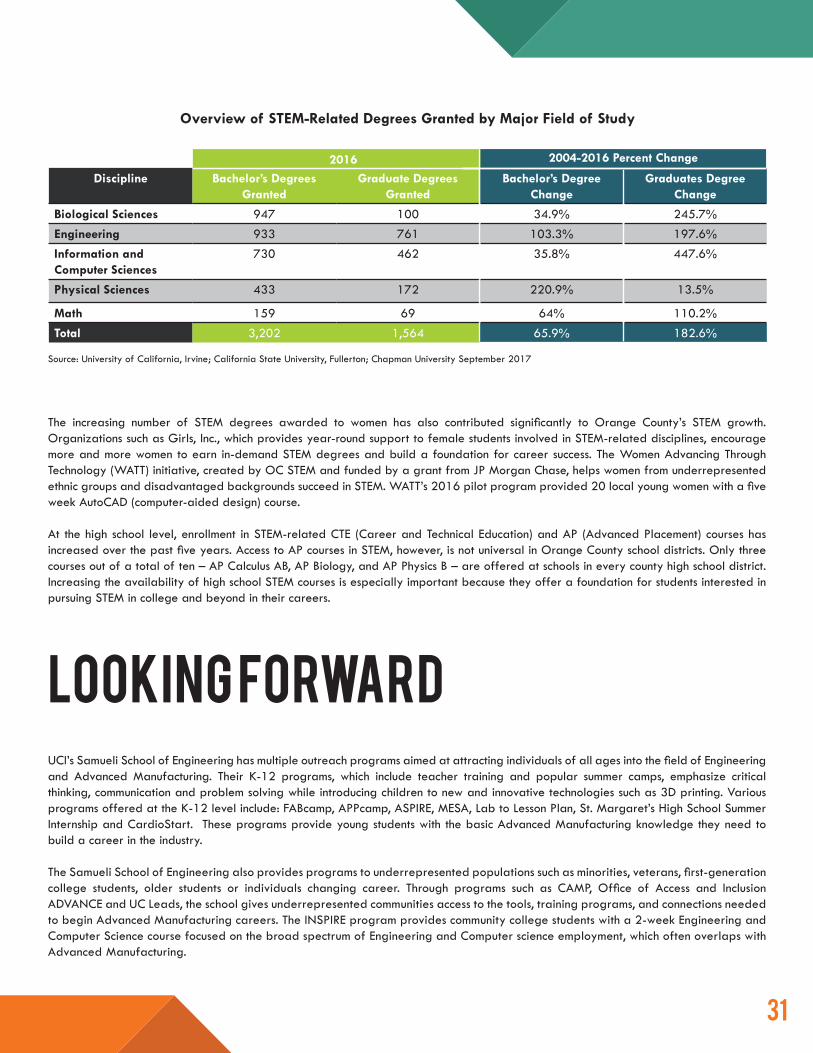
STEMWHAT HAS HAPPENED?The importance of STEM disciplines will continue to increase as new technologies continue to transform the workplace in almost every industry and occupational sector. Orange County currently enjoys a substantial competitive advantage in several STEM-related fields, including Medical Device, Biopharmaceuticals, Advanced Electronics, Information Technology, Professional and Business Services, Cybersecurity, Data Analytics, and Advanced Manufacturing. The number of STEM degrees – both undergraduate and graduate – awarded to Orange County students reached an all-time high in 2016 after steadily increasing since the turn of the millennium. Orange County students received 3,202 STEM-related undergraduate degrees and 1,564 STEM-related graduate degrees, an increase of 65.9 and 182.6 percent, respectively, since 2004. The figure on the following page breaks down 2016 Orange County STEM degrees by field.
Source: U.S. Census, American Community Survey, September 2017
3131
Discipline Bachelor’s Degrees Granted
Graduate Degrees Granted
Bachelor’s Degree Change
Graduates Degree Change
Biological Sciences 947 100 34.9% 245.7%Engineering 933 761 103.3% 197.6%Information and Computer Sciences
730 462 35.8% 447.6%
Physical Sciences 433 172 220.9% 13.5%
Math 159 69 64% 110.2%Total 3,202 1,564 65.9% 182.6%
Overview of STEM-Related Degrees Granted by Major Field of Study
Source: University of California, Irvine; California State University, Fullerton; Chapman University September 2017
The increasing number of STEM degrees awarded to women has also contributed significantly to Orange County’s STEM growth. Organizations such as Girls, Inc., which provides year-round support to female students involved in STEM-related disciplines, encourage more and more women to earn in-demand STEM degrees and build a foundation for career success. The Women Advancing Through Technology (WATT) initiative, created by OC STEM and funded by a grant from JP Morgan Chase, helps women from underrepresented ethnic groups and disadvantaged backgrounds succeed in STEM. WATT’s 2016 pilot program provided 20 local young women with a five week AutoCAD (computer-aided design) course.
At the high school level, enrollment in STEM-related CTE (Career and Technical Education) and AP (Advanced Placement) courses has increased over the past five years. Access to AP courses in STEM, however, is not universal in Orange County school districts. Only three courses out of a total of ten – AP Calculus AB, AP Biology, and AP Physics B – are offered at schools in every county high school district. Increasing the availability of high school STEM courses is especially important because they offer a foundation for students interested in pursuing STEM in college and beyond in their careers.
looking forwardUCI’s Samueli School of Engineering has multiple outreach programs aimed at attracting individuals of all ages into the field of Engineering and Advanced Manufacturing. Their K-12 programs, which include teacher training and popular summer camps, emphasize critical thinking, communication and problem solving while introducing children to new and innovative technologies such as 3D printing. Various programs offered at the K-12 level include: FABcamp, APPcamp, ASPIRE, MESA, Lab to Lesson Plan, St. Margaret’s High School Summer Internship and CardioStart. These programs provide young students with the basic Advanced Manufacturing knowledge they need to build a career in the industry.
The Samueli School of Engineering also provides programs to underrepresented populations such as minorities, veterans, first-generation college students, older students or individuals changing career. Through programs such as CAMP, Office of Access and Inclusion ADVANCE and UC Leads, the school gives underrepresented communities access to the tools, training programs, and connections needed to begin Advanced Manufacturing careers. The INSPIRE program provides community college students with a 2-week Engineering and Computer Science course focused on the broad spectrum of Engineering and Computer science employment, which often overlaps with Advanced Manufacturing.
2016 2004-2016 Percent Change
3232
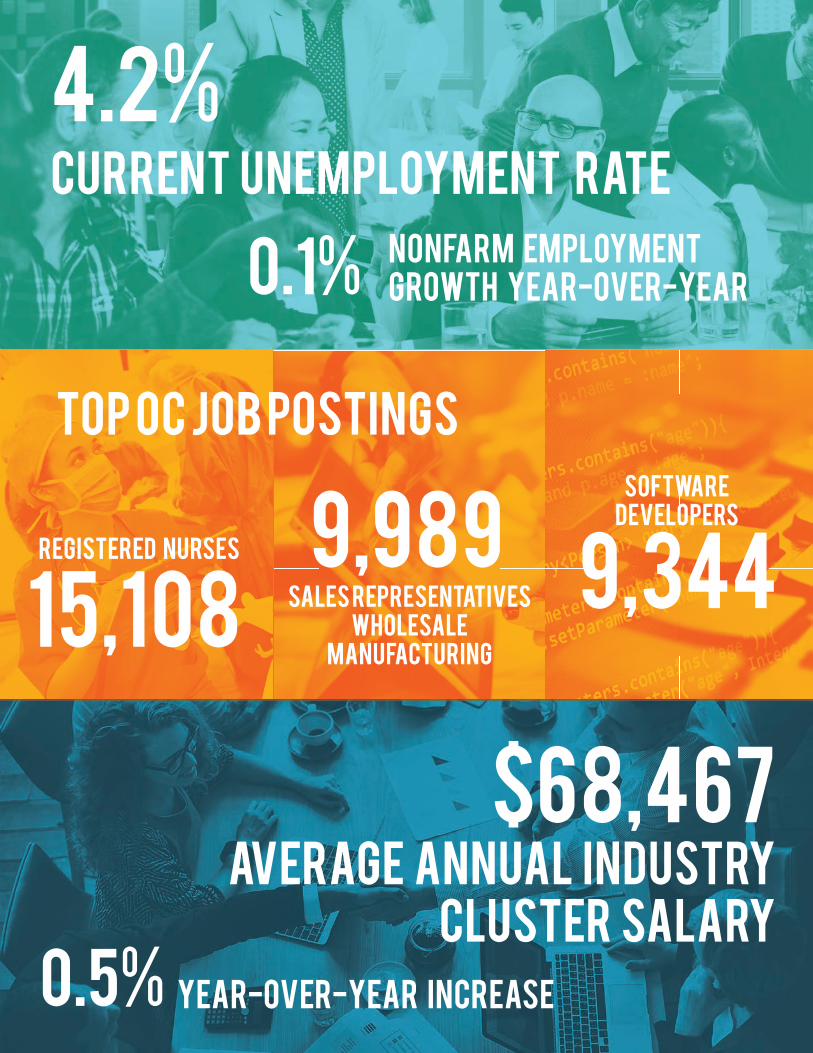
4.2%current unemployment rate
0.1% nonfarm employment growth year-over-year
top oc job postings
15,108Registered nurses
Sales representativeswholesale
manufacturing
9,989Software
developers
9,344
$68,467Average annual industry
cluster salary0.5% year-over-year increase
3333
INDUSTRY ANDOCCUPATION TRENDS
There are several key industries that currently drive Orange County’s economy, from
healthcare to technology to tourism. This section discusses the opportunities within these
high-growth sectors while also addressing the challenges that may hinder development
in the future, including a skills gap and automation.

3434
industry and occupation trendsintroductionOrange County’s economy continues to thrive, enjoying low unemployment rates, job growth, and strong and vibrant industry clusters. However, several growing issues – automation, skills gap, and a lack of affordable workforce housing – threaten to slow this growth and leave Orange County less competitive if not addressed. Many other regions, especially in California, face the same challenges. Orange County must address these topics in order to remain Southern California’s economic engine and preserve the county’s economic growth, high quality of life, and world-class industry clusters.
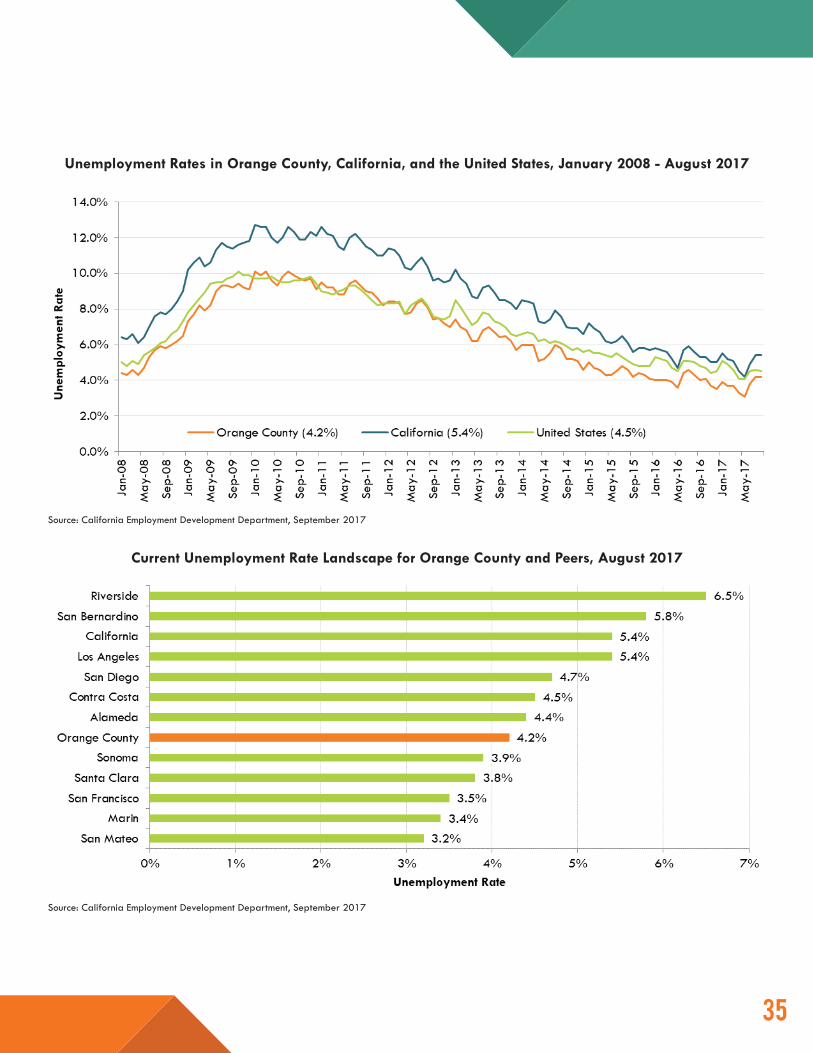
unemploymentOrange County’s unemployment rate fluctuates throughout the year as annual events such as college graduations create influxes of job seekers in the labor market; this is a pattern that is typical of nearly all California counties. At the beginning of 2016, for example, Orange County’s unemployment rate was 4.0 percent, which fell to 3.8 percent by June 2017 and increased back up to 4.2 percent in August 2017. As seen in the following graphs, Orange County has consistently outperformed state and national unemployment rates over the past five years. Additionally, Orange County has outperformed its Southern California neighbors, but still lags behind a handful of counties in Northern California, including San Mateo, Marin, San Francisco, Santa Clara and Sonoma counties.
3535
Unemployment Rates in Orange County, California, and the United States, January 2008 - August 2017
Current Unemployment Rate Landscape for Orange County and Peers, August 2017
Source: California Employment Development Department, September 2017
Source: California Employment Development Department, September 2017
3636
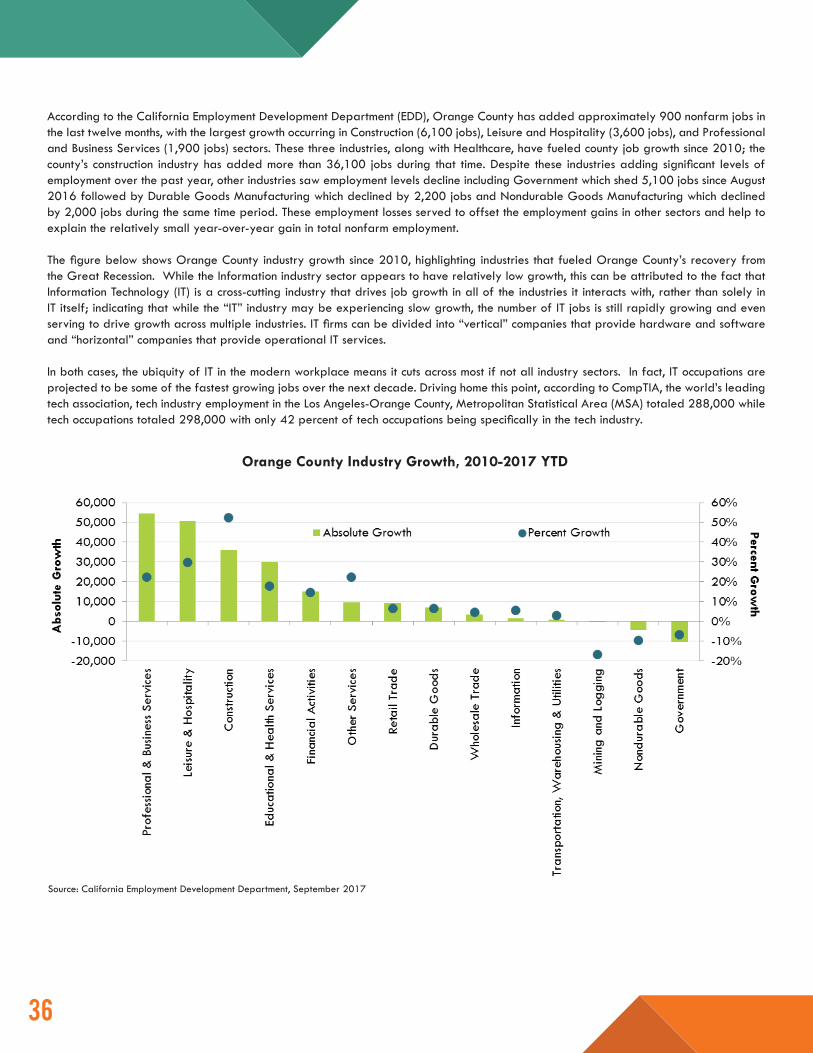
According to the California Employment Development Department (EDD), Orange County has added approximately 900 nonfarm jobs in the last twelve months, with the largest growth occurring in Construction (6,100 jobs), Leisure and Hospitality (3,600 jobs), and Professional and Business Services (1,900 jobs) sectors. These three industries, along with Healthcare, have fueled county job growth since 2010; the county’s construction industry has added more than 36,100 jobs during that time. Despite these industries adding significant levels of employment over the past year, other industries saw employment levels decline including Government which shed 5,100 jobs since August 2016 followed by Durable Goods Manufacturing which declined by 2,200 jobs and Nondurable Goods Manufacturing which declined by 2,000 jobs during the same time period. These employment losses served to offset the employment gains in other sectors and help to explain the relatively small year-over-year gain in total nonfarm employment.
The figure below shows Orange County industry growth since 2010, highlighting industries that fueled Orange County’s recovery from the Great Recession. While the Information industry sector appears to have relatively low growth, this can be attributed to the fact that Information Technology (IT) is a cross-cutting industry that drives job growth in all of the industries it interacts with, rather than solely in IT itself; indicating that while the “IT” industry may be experiencing slow growth, the number of IT jobs is still rapidly growing and even serving to drive growth across multiple industries. IT firms can be divided into “vertical” companies that provide hardware and software and “horizontal” companies that provide operational IT services.
In both cases, the ubiquity of IT in the modern workplace means it cuts across most if not all industry sectors. In fact, IT occupations are projected to be some of the fastest growing jobs over the next decade. Driving home this point, according to CompTIA, the world’s leading tech association, tech industry employment in the Los Angeles-Orange County, Metropolitan Statistical Area (MSA) totaled 288,000 while tech occupations totaled 298,000 with only 42 percent of tech occupations being specifically in the tech industry.
Orange County Industry Growth, 2010-2017 YTD
Source: California Employment Development Department, September 2017
3737
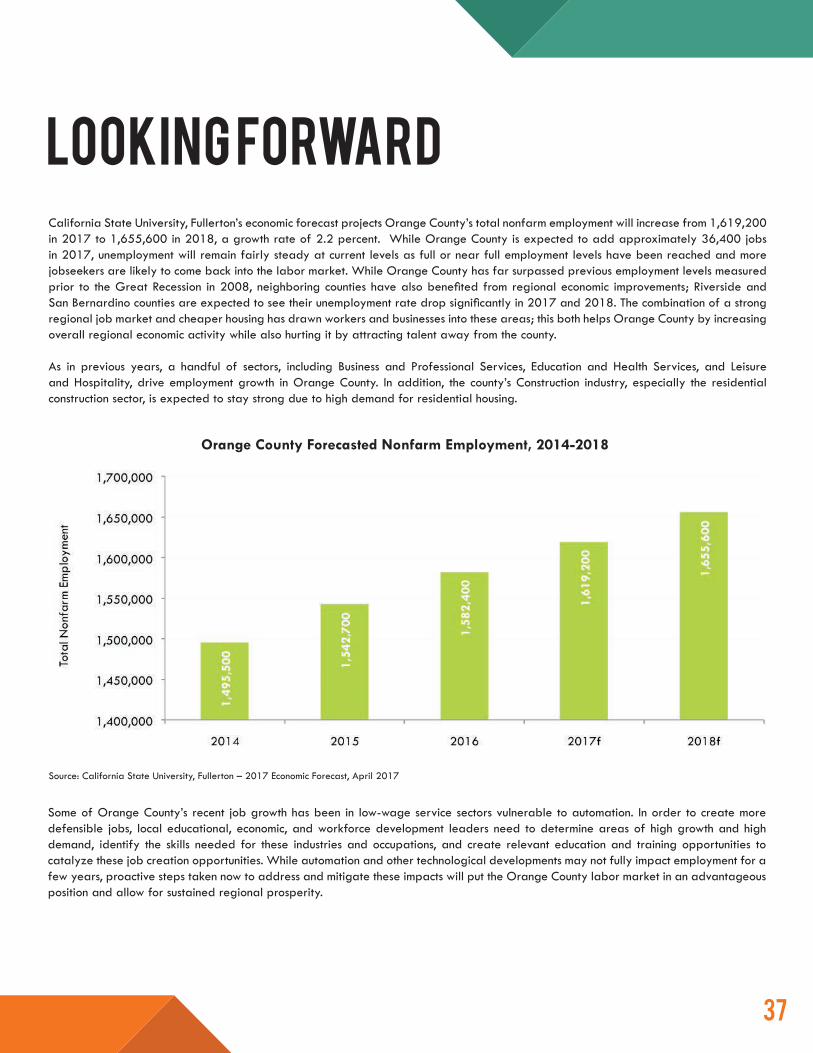
looking forwardCalifornia State University, Fullerton’s economic forecast projects Orange County’s total nonfarm employment will increase from 1,619,200 in 2017 to 1,655,600 in 2018, a growth rate of 2.2 percent. While Orange County is expected to add approximately 36,400 jobs in 2017, unemployment will remain fairly steady at current levels as full or near full employment levels have been reached and more jobseekers are likely to come back into the labor market. While Orange County has far surpassed previous employment levels measured prior to the Great Recession in 2008, neighboring counties have also benefited from regional economic improvements; Riverside and San Bernardino counties are expected to see their unemployment rate drop significantly in 2017 and 2018. The combination of a strong regional job market and cheaper housing has drawn workers and businesses into these areas; this both helps Orange County by increasing overall regional economic activity while also hurting it by attracting talent away from the county.
As in previous years, a handful of sectors, including Business and Professional Services, Education and Health Services, and Leisure and Hospitality, drive employment growth in Orange County. In addition, the county’s Construction industry, especially the residential construction sector, is expected to stay strong due to high demand for residential housing.
Orange County Forecasted Nonfarm Employment, 2014-2018
Some of Orange County’s recent job growth has been in low-wage service sectors vulnerable to automation. In order to create more defensible jobs, local educational, economic, and workforce development leaders need to determine areas of high growth and high demand, identify the skills needed for these industries and occupations, and create relevant education and training opportunities to catalyze these job creation opportunities. While automation and other technological developments may not fully impact employment for a few years, proactive steps taken now to address and mitigate these impacts will put the Orange County labor market in an advantageous position and allow for sustained regional prosperity.
Source: California State University, Fullerton – 2017 Economic Forecast, April 2017
3838
Industry Cluster Employment and Compensation TrendsIndustry clusters are characterized by critical mass, regional specialization, high multiplier effects, high growth rates, and a legacy of world-class iconic industry leaders. Napa Valley’s wine industry and Hollywood’s entertainment industry exemplify globally recognized industry clusters, while Orange County’s Medical Device and Tourism Hospitality industries provide examples closer to home. Strong industry clusters provide multiple benefits to their home region:
A CRITICAL MASS of firms and supporting firms in an industry cluster provides specialized labor pools, reduces logistical costs, and promotes both collaboration and healthy competition.
REGIONAL SPECIALIZATION leads to increased consumer spending and high demand for exports, increasing cash flow into the region.
A HIGH MULTIPLIER EFFECT reflects the significant impact industry clusters have on the economy as a whole and their ability to create jobs in other fields.
THE HIGH GROWTH RATES of industry clusters, along with their previously mentioned advantages attract businesses and skilled workers to a region, boosting its economic growth.
Finally, the presence of WORLD-CLASS, INDUSTRY-LEADING COMPANIES, such as Allergan and Edwards Lifesciences, Disney, Broadcom, and Blizzard publicly associates the region with innovation, expertise, and success.
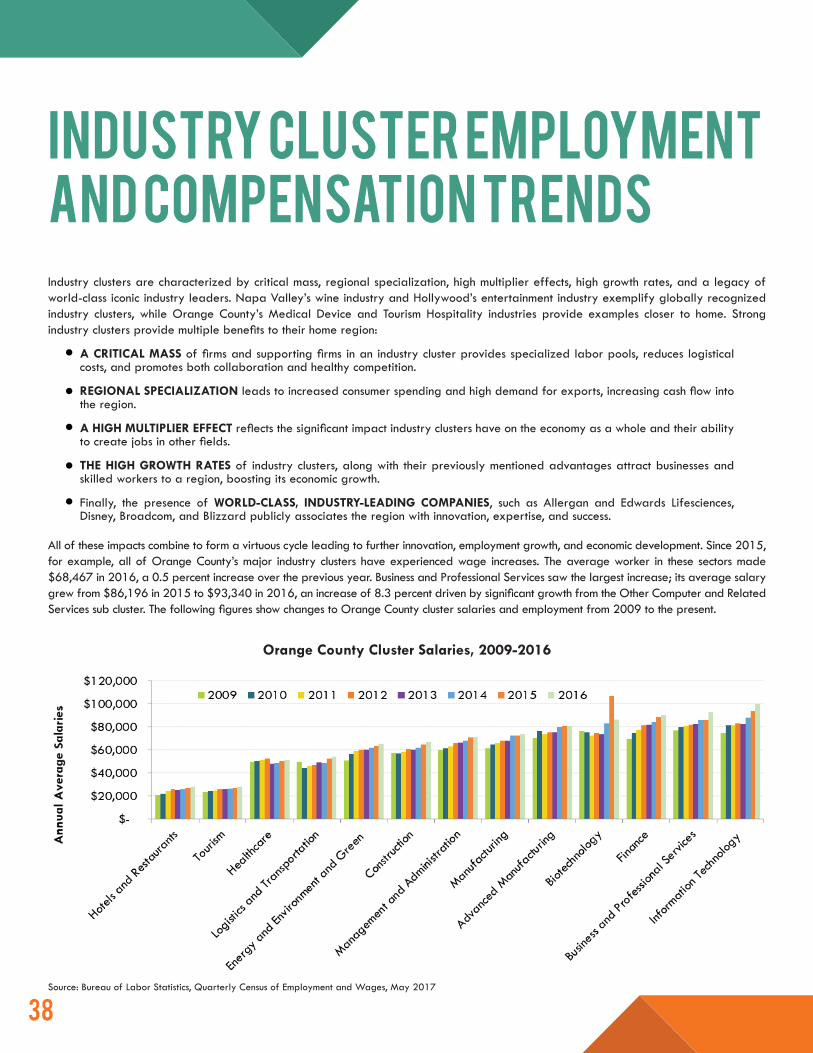
All of these impacts combine to form a virtuous cycle leading to further innovation, employment growth, and economic development. Since 2015, for example, all of Orange County’s major industry clusters have experienced wage increases. The average worker in these sectors made $68,467 in 2016, a 0.5 percent increase over the previous year. Business and Professional Services saw the largest increase; its average salary grew from $86,196 in 2015 to $93,340 in 2016, an increase of 8.3 percent driven by significant growth from the Other Computer and Related Services sub cluster. The following figures show changes to Orange County cluster salaries and employment from 2009 to the present.
Orange County Cluster Salaries, 2009-2016
Source: Bureau of Labor Statistics, Quarterly Census of Employment and Wages, May 2017
3939
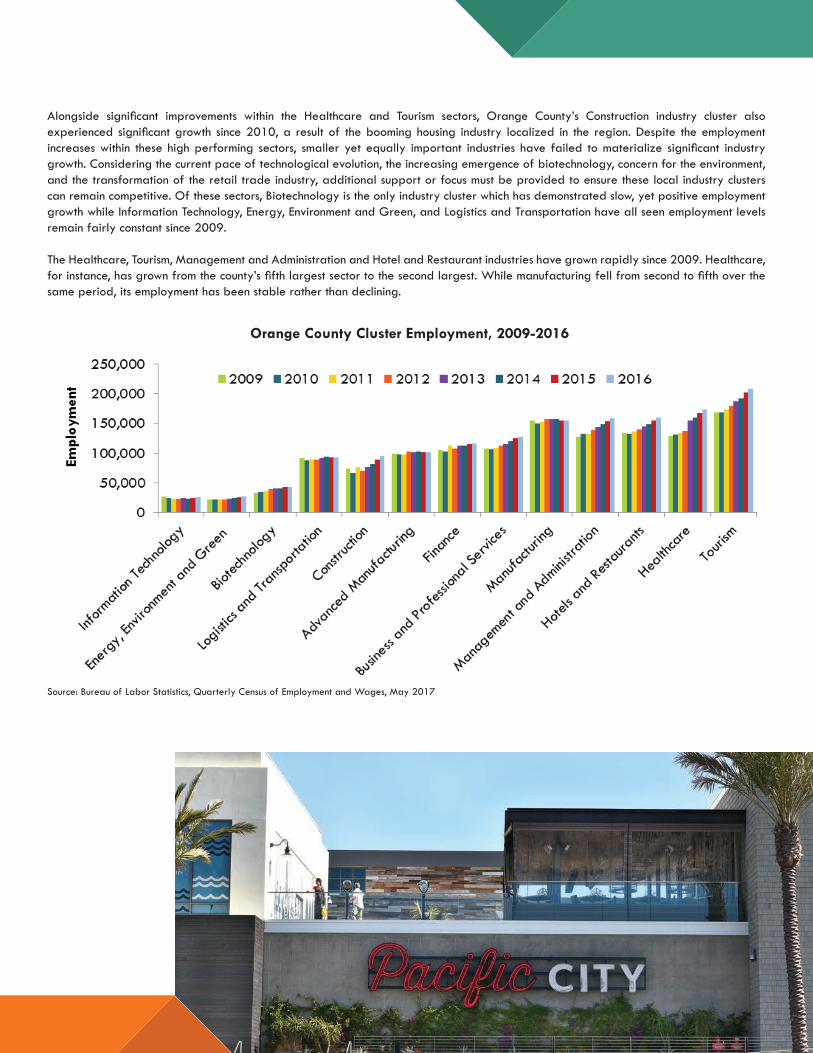
Alongside significant improvements within the Healthcare and Tourism sectors, Orange County’s Construction industry cluster also experienced significant growth since 2010, a result of the booming housing industry localized in the region. Despite the employment increases within these high performing sectors, smaller yet equally important industries have failed to materialize significant industry growth. Considering the current pace of technological evolution, the increasing emergence of biotechnology, concern for the environment, and the transformation of the retail trade industry, additional support or focus must be provided to ensure these local industry clusters can remain competitive. Of these sectors, Biotechnology is the only industry cluster which has demonstrated slow, yet positive employment growth while Information Technology, Energy, Environment and Green, and Logistics and Transportation have all seen employment levels remain fairly constant since 2009.
The Healthcare, Tourism, Management and Administration and Hotel and Restaurant industries have grown rapidly since 2009. Healthcare, for instance, has grown from the county’s fifth largest sector to the second largest. While manufacturing fell from second to fifth over the same period, its employment has been stable rather than declining.
Orange County Cluster Employment, 2009-2016
Source: Bureau of Labor Statistics, Quarterly Census of Employment and Wages, May 2017
4040
Almost every county industry has seen increased compensation levels since 2009, with Information Technology, Business and Professional Services, and Construction experiencing the greatest gains. Since the U.S. has experienced negligible inflation in recent years, wage increases suggest higher productivity and labor market demand for these industries.
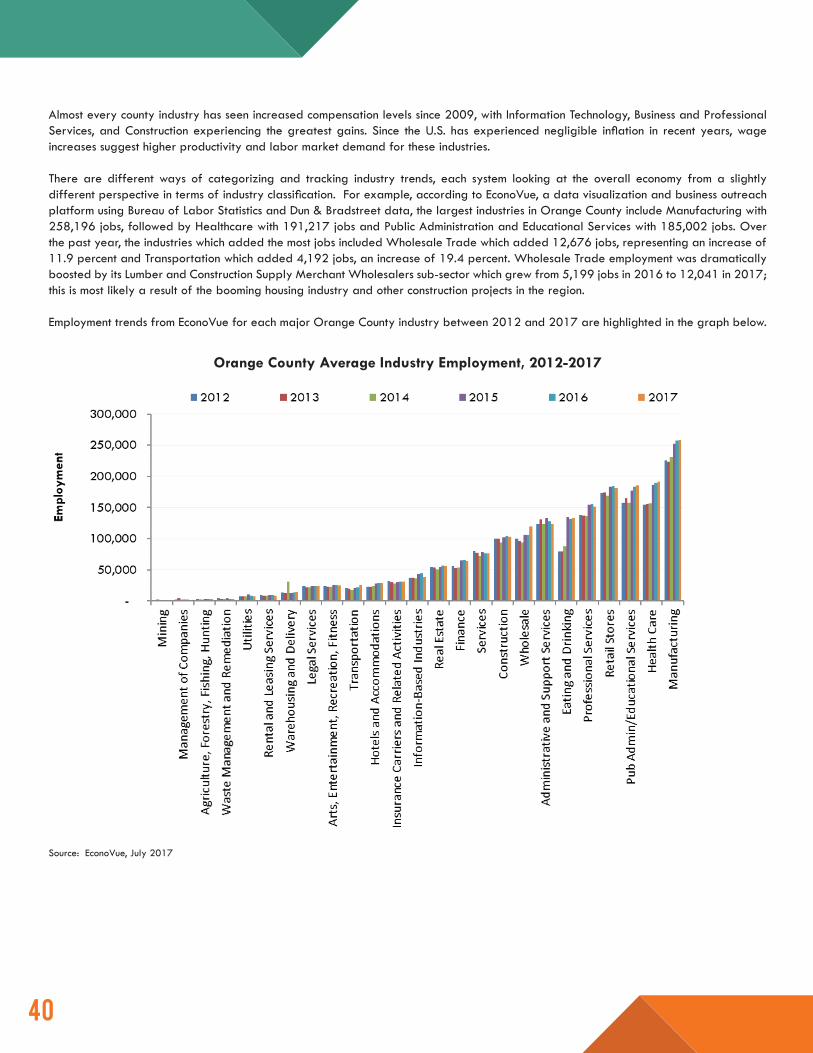
There are different ways of categorizing and tracking industry trends, each system looking at the overall economy from a slightly different perspective in terms of industry classification. For example, according to EconoVue, a data visualization and business outreach platform using Bureau of Labor Statistics and Dun & Bradstreet data, the largest industries in Orange County include Manufacturing with 258,196 jobs, followed by Healthcare with 191,217 jobs and Public Administration and Educational Services with 185,002 jobs. Over the past year, the industries which added the most jobs included Wholesale Trade which added 12,676 jobs, representing an increase of 11.9 percent and Transportation which added 4,192 jobs, an increase of 19.4 percent. Wholesale Trade employment was dramatically boosted by its Lumber and Construction Supply Merchant Wholesalers sub-sector which grew from 5,199 jobs in 2016 to 12,041 in 2017; this is most likely a result of the booming housing industry and other construction projects in the region.
Employment trends from EconoVue for each major Orange County industry between 2012 and 2017 are highlighted in the graph below.
Orange County Average Industry Employment, 2012-2017
Source: EconoVue, July 2017
4141
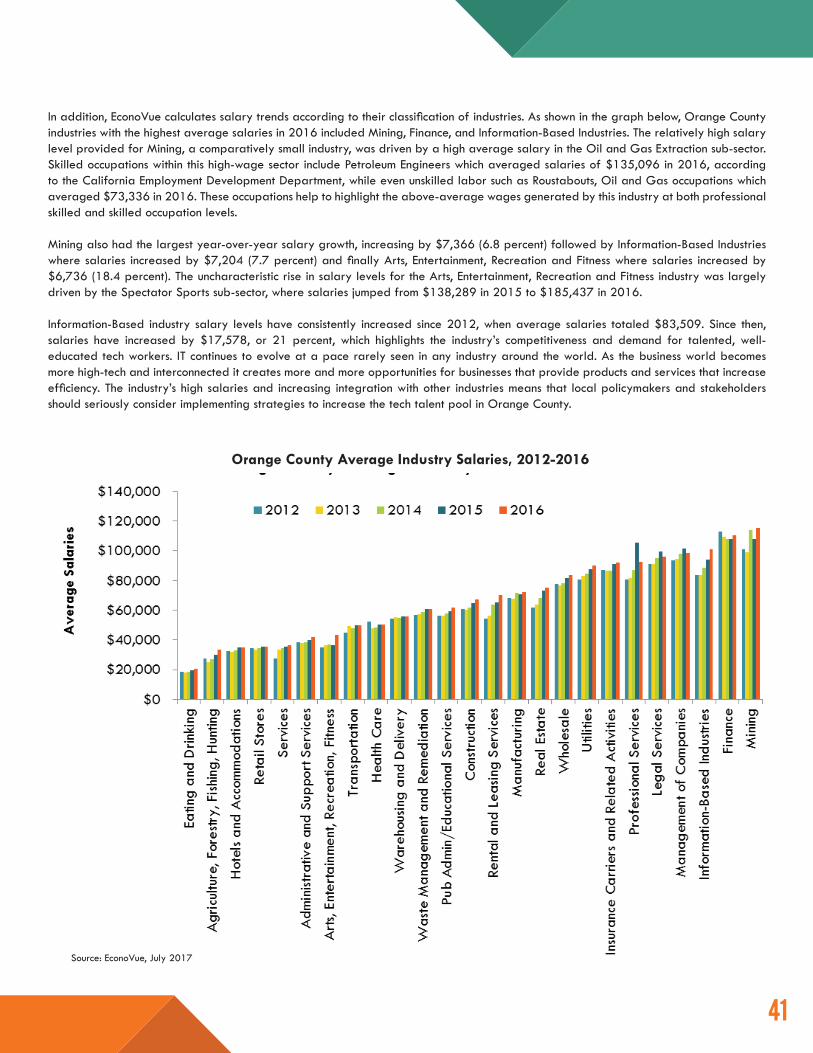
In addition, EconoVue calculates salary trends according to their classification of industries. As shown in the graph below, Orange County industries with the highest average salaries in 2016 included Mining, Finance, and Information-Based Industries. The relatively high salary level provided for Mining, a comparatively small industry, was driven by a high average salary in the Oil and Gas Extraction sub-sector. Skilled occupations within this high-wage sector include Petroleum Engineers which averaged salaries of $135,096 in 2016, according to the California Employment Development Department, while even unskilled labor such as Roustabouts, Oil and Gas occupations which averaged $73,336 in 2016. These occupations help to highlight the above-average wages generated by this industry at both professional skilled and skilled occupation levels.
Mining also had the largest year-over-year salary growth, increasing by $7,366 (6.8 percent) followed by Information-Based Industries where salaries increased by $7,204 (7.7 percent) and finally Arts, Entertainment, Recreation and Fitness where salaries increased by $6,736 (18.4 percent). The uncharacteristic rise in salary levels for the Arts, Entertainment, Recreation and Fitness industry was largely driven by the Spectator Sports sub-sector, where salaries jumped from $138,289 in 2015 to $185,437 in 2016.
Information-Based industry salary levels have consistently increased since 2012, when average salaries totaled $83,509. Since then, salaries have increased by $17,578, or 21 percent, which highlights the industry’s competitiveness and demand for talented, well-educated tech workers. IT continues to evolve at a pace rarely seen in any industry around the world. As the business world becomes more high-tech and interconnected it creates more and more opportunities for businesses that provide products and services that increase efficiency. The industry’s high salaries and increasing integration with other industries means that local policymakers and stakeholders should seriously consider implementing strategies to increase the tech talent pool in Orange County.
Orange County Average Industry Salaries, 2012-2016
Source: EconoVue, July 2017
4242
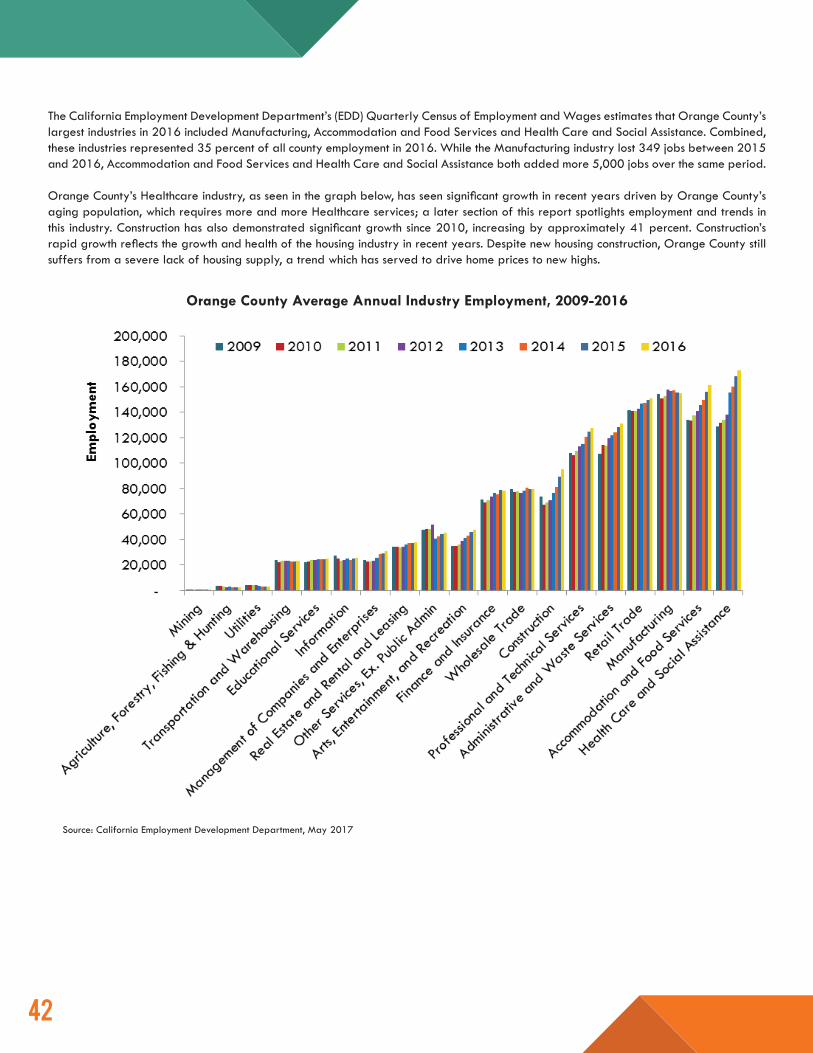
The California Employment Development Department’s (EDD) Quarterly Census of Employment and Wages estimates that Orange County’s largest industries in 2016 included Manufacturing, Accommodation and Food Services and Health Care and Social Assistance. Combined, these industries represented 35 percent of all county employment in 2016. While the Manufacturing industry lost 349 jobs between 2015 and 2016, Accommodation and Food Services and Health Care and Social Assistance both added more 5,000 jobs over the same period.
Orange County’s Healthcare industry, as seen in the graph below, has seen significant growth in recent years driven by Orange County’s aging population, which requires more and more Healthcare services; a later section of this report spotlights employment and trends in this industry. Construction has also demonstrated significant growth since 2010, increasing by approximately 41 percent. Construction’s rapid growth reflects the growth and health of the housing industry in recent years. Despite new housing construction, Orange County still suffers from a severe lack of housing supply, a trend which has served to drive home prices to new highs.
Orange County Average Annual Industry Employment, 2009-2016
Source: California Employment Development Department, May 2017
4343
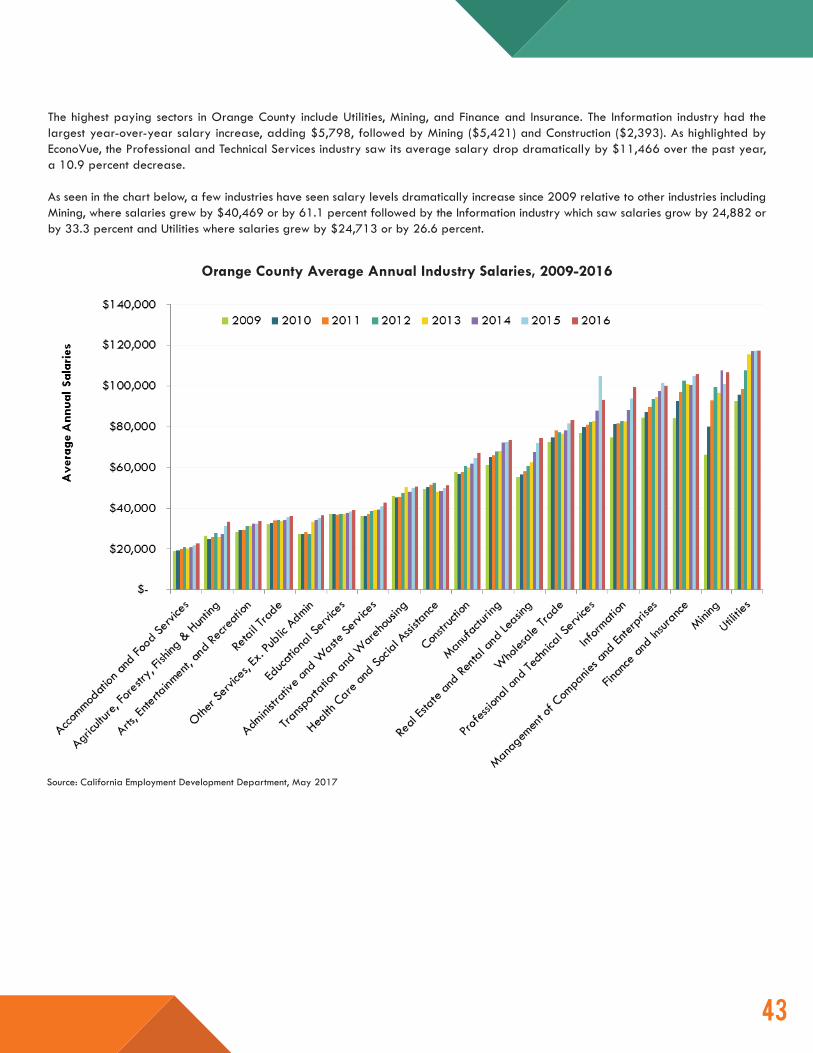
The highest paying sectors in Orange County include Utilities, Mining, and Finance and Insurance. The Information industry had the largest year-over-year salary increase, adding $5,798, followed by Mining ($5,421) and Construction ($2,393). As highlighted by EconoVue, the Professional and Technical Services industry saw its average salary drop dramatically by $11,466 over the past year, a 10.9 percent decrease.
As seen in the chart below, a few industries have seen salary levels dramatically increase since 2009 relative to other industries including Mining, where salaries grew by $40,469 or by 61.1 percent followed by the Information industry which saw salaries grow by 24,882 or by 33.3 percent and Utilities where salaries grew by $24,713 or by 26.6 percent.
Orange County Average Annual Industry Salaries, 2009-2016
Source: California Employment Development Department, May 2017
4444
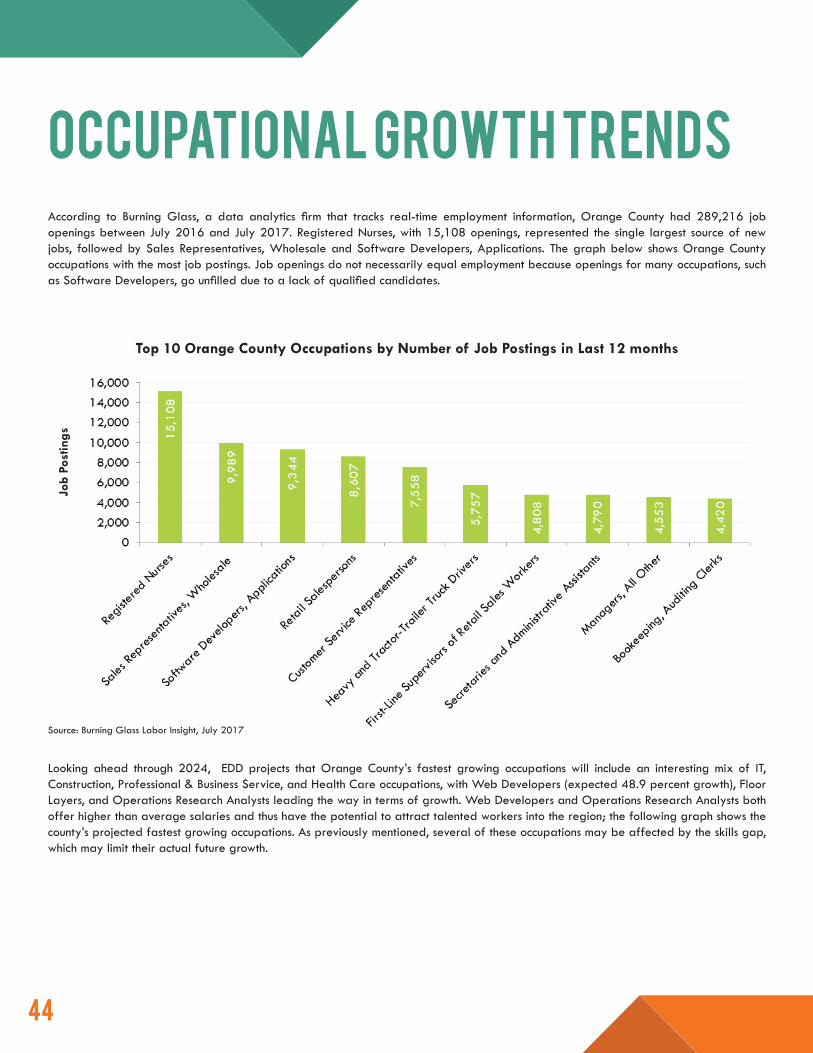
Occupational Growth TrendsAccording to Burning Glass, a data analytics firm that tracks real-time employment information, Orange County had 289,216 job openings between July 2016 and July 2017. Registered Nurses, with 15,108 openings, represented the single largest source of new jobs, followed by Sales Representatives, Wholesale and Software Developers, Applications. The graph below shows Orange County occupations with the most job postings. Job openings do not necessarily equal employment because openings for many occupations, such as Software Developers, go unfilled due to a lack of qualified candidates.
Top 10 Orange County Occupations by Number of Job Postings in Last 12 months
Source: Burning Glass Labor Insight, July 2017
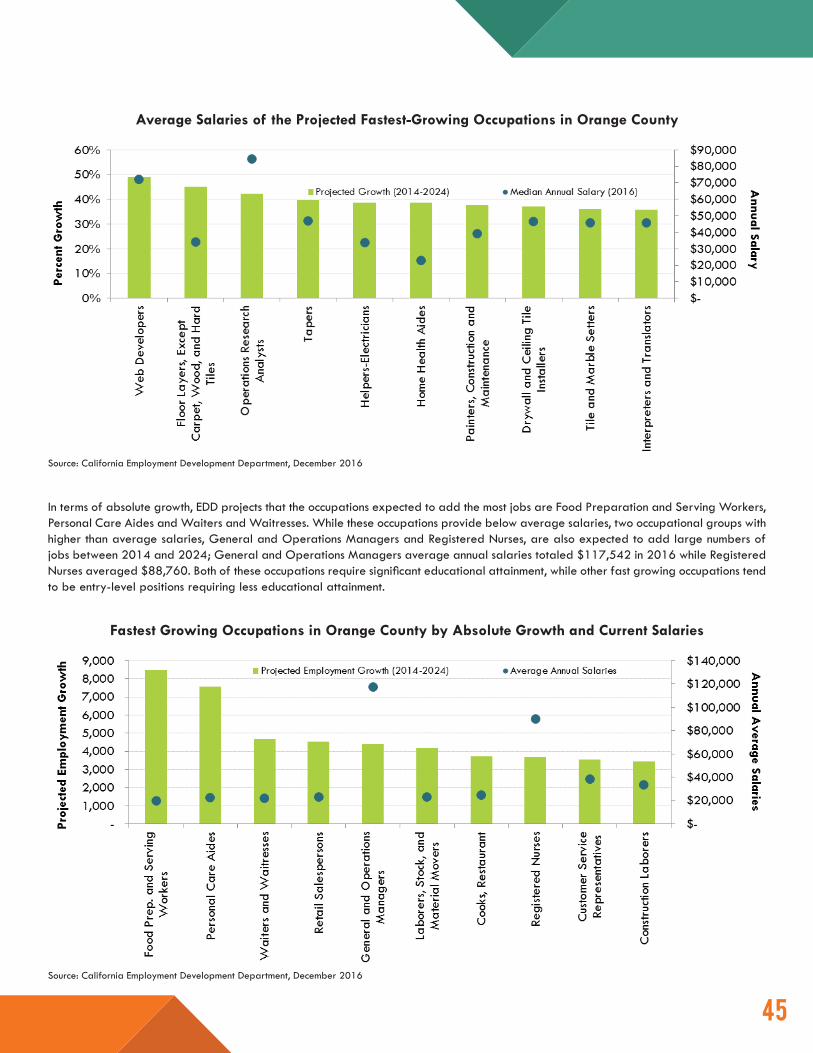
Looking ahead through 2024, EDD projects that Orange County’s fastest growing occupations will include an interesting mix of IT, Construction, Professional & Business Service, and Health Care occupations, with Web Developers (expected 48.9 percent growth), Floor Layers, and Operations Research Analysts leading the way in terms of growth. Web Developers and Operations Research Analysts both offer higher than average salaries and thus have the potential to attract talented workers into the region; the following graph shows the county’s projected fastest growing occupations. As previously mentioned, several of these occupations may be affected by the skills gap, which may limit their actual future growth.
Job
Post
ings
4545
Average Salaries of the Projected Fastest-Growing Occupations in Orange County
In terms of absolute growth, EDD projects that the occupations expected to add the most jobs are Food Preparation and Serving Workers, Personal Care Aides and Waiters and Waitresses. While these occupations provide below average salaries, two occupational groups with higher than average salaries, General and Operations Managers and Registered Nurses, are also expected to add large numbers of jobs between 2014 and 2024; General and Operations Managers average annual salaries totaled $117,542 in 2016 while Registered Nurses averaged $88,760. Both of these occupations require significant educational attainment, while other fast growing occupations tend to be entry-level positions requiring less educational attainment.
Fastest Growing Occupations in Orange County by Absolute Growth and Current Salaries
Source: California Employment Development Department, December 2016
Source: California Employment Development Department, December 2016
4646
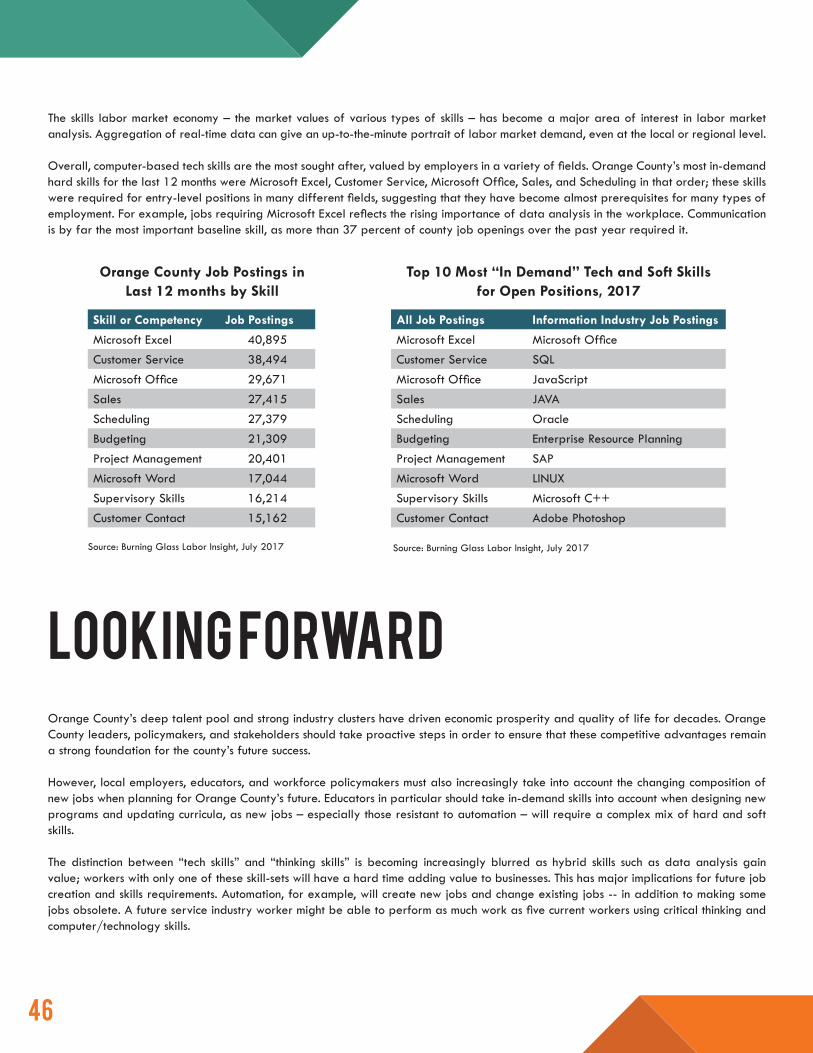
The skills labor market economy – the market values of various types of skills – has become a major area of interest in labor market analysis. Aggregation of real-time data can give an up-to-the-minute portrait of labor market demand, even at the local or regional level.
Overall, computer-based tech skills are the most sought after, valued by employers in a variety of fields. Orange County’s most in-demand hard skills for the last 12 months were Microsoft Excel, Customer Service, Microsoft Office, Sales, and Scheduling in that order; these skills were required for entry-level positions in many different fields, suggesting that they have become almost prerequisites for many types of employment. For example, jobs requiring Microsoft Excel reflects the rising importance of data analysis in the workplace. Communication is by far the most important baseline skill, as more than 37 percent of county job openings over the past year required it.
looking forwardOrange County’s deep talent pool and strong industry clusters have driven economic prosperity and quality of life for decades. Orange County leaders, policymakers, and stakeholders should take proactive steps in order to ensure that these competitive advantages remain a strong foundation for the county’s future success.
However, local employers, educators, and workforce policymakers must also increasingly take into account the changing composition of new jobs when planning for Orange County’s future. Educators in particular should take in-demand skills into account when designing new programs and updating curricula, as new jobs – especially those resistant to automation – will require a complex mix of hard and soft skills.
The distinction between “tech skills” and “thinking skills” is becoming increasingly blurred as hybrid skills such as data analysis gain value; workers with only one of these skill-sets will have a hard time adding value to businesses. This has major implications for future job creation and skills requirements. Automation, for example, will create new jobs and change existing jobs -- in addition to making some jobs obsolete. A future service industry worker might be able to perform as much work as five current workers using critical thinking and computer/technology skills.
Skill or Competency Job Postings
Microsoft Excel 40,895Customer Service 38,494Microsoft Office 29,671Sales 27,415Scheduling 27,379Budgeting 21,309Project Management 20,401Microsoft Word 17,044Supervisory Skills 16,214Customer Contact 15,162
All Job Postings Information Industry Job Postings
Microsoft Excel Microsoft OfficeCustomer Service SQLMicrosoft Office JavaScriptSales JAVAScheduling OracleBudgeting Enterprise Resource PlanningProject Management SAPMicrosoft Word LINUXSupervisory Skills Microsoft C++Customer Contact Adobe Photoshop
Orange County Job Postings in Last 12 months by Skill
Top 10 Most “In Demand” Tech and Soft Skills for Open Positions, 2017
Source: Burning Glass Labor Insight, July 2017Source: Burning Glass Labor Insight, July 2017
4747
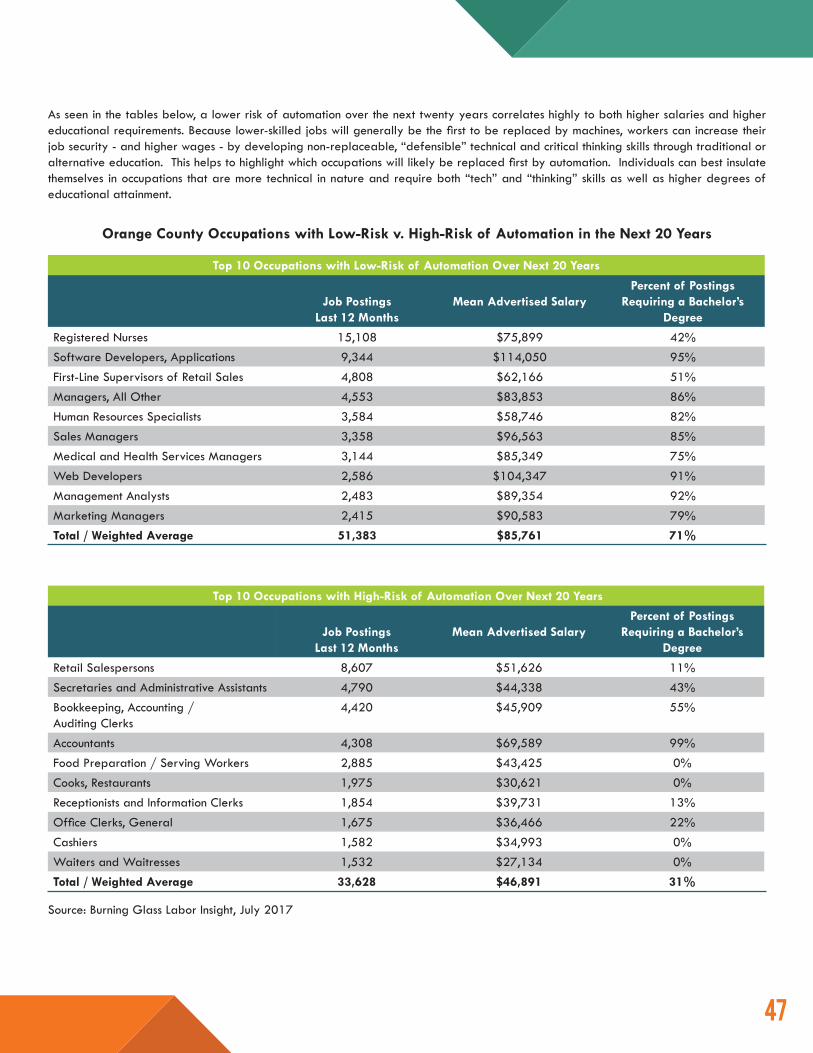
As seen in the tables below, a lower risk of automation over the next twenty years correlates highly to both higher salaries and higher educational requirements. Because lower-skilled jobs will generally be the first to be replaced by machines, workers can increase their job security - and higher wages - by developing non-replaceable, “defensible” technical and critical thinking skills through traditional or alternative education. This helps to highlight which occupations will likely be replaced first by automation. Individuals can best insulate themselves in occupations that are more technical in nature and require both “tech” and “thinking” skills as well as higher degrees of educational attainment.
Top 10 Occupations with Low-Risk of Automation Over Next 20 Years
Job Postings
Last 12 MonthsMean Advertised Salary
Percent of Postings Requiring a Bachelor’s
Degree
Registered Nurses 15,108 $75,899 42%Software Developers, Applications 9,344 $114,050 95%First-Line Supervisors of Retail Sales 4,808 $62,166 51%Managers, All Other 4,553 $83,853 86%Human Resources Specialists 3,584 $58,746 82%Sales Managers 3,358 $96,563 85%Medical and Health Services Managers 3,144 $85,349 75%Web Developers 2,586 $104,347 91%Management Analysts 2,483 $89,354 92%Marketing Managers 2,415 $90,583 79%Total / Weighted Average 51,383 $85,761 71%
Top 10 Occupations with High-Risk of Automation Over Next 20 Years
Job Postings Last 12 Months
Mean Advertised SalaryPercent of Postings
Requiring a Bachelor’s Degree
Retail Salespersons 8,607 $51,626 11%Secretaries and Administrative Assistants 4,790 $44,338 43%Bookkeeping, Accounting / Auditing Clerks
4,420 $45,909 55%
Accountants 4,308 $69,589 99%Food Preparation / Serving Workers 2,885 $43,425 0%Cooks, Restaurants 1,975 $30,621 0%Receptionists and Information Clerks 1,854 $39,731 13%Office Clerks, General 1,675 $36,466 22%Cashiers 1,582 $34,993 0%Waiters and Waitresses 1,532 $27,134 0%Total / Weighted Average 33,628 $46,891 31%
Orange County Occupations with Low-Risk v. High-Risk of Automation in the Next 20 Years
Source: Burning Glass Labor Insight, July 2017
4848
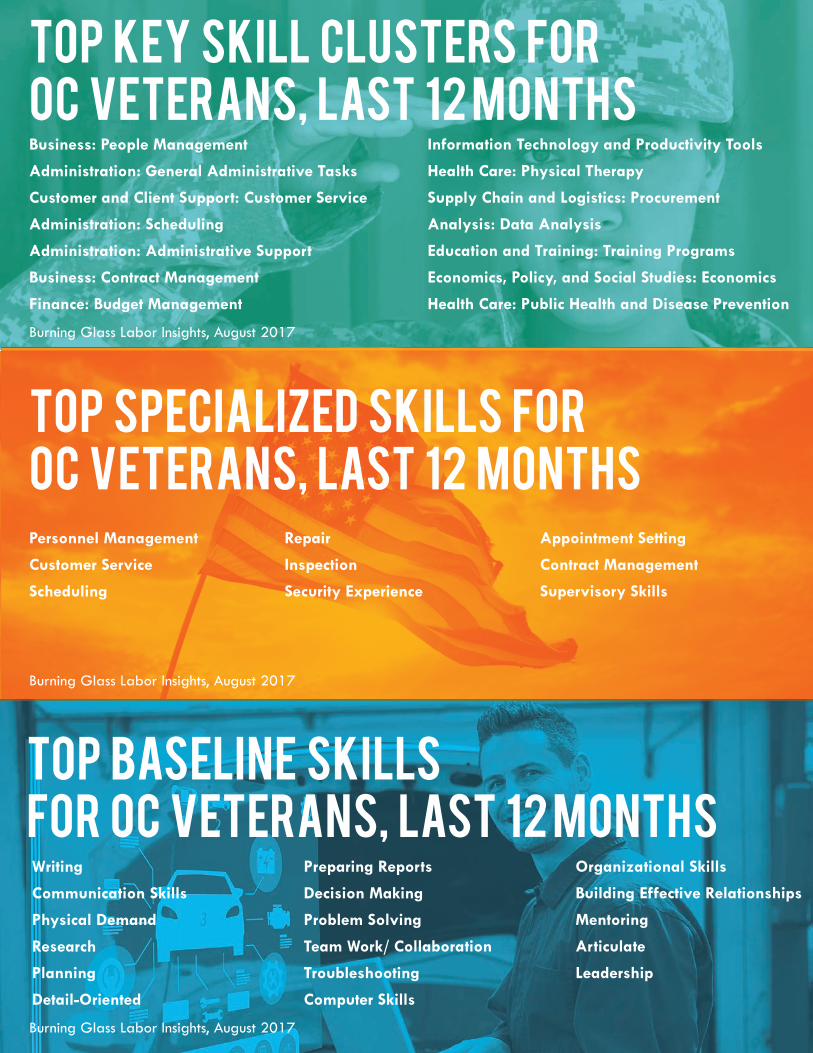
Top Key Skill Clusters for OC Veterans, last 12 monthsBusiness: People Management
Administration: General Administrative Tasks
Customer and Client Support: Customer Service
Administration: Scheduling
Administration: Administrative Support
Business: Contract Management
Finance: Budget Management
Information Technology and Productivity Tools
Health Care: Physical Therapy
Supply Chain and Logistics: Procurement
Analysis: Data Analysis
Education and Training: Training Programs
Economics, Policy, and Social Studies: Economics
Health Care: Public Health and Disease Prevention
Top Specialized Skills for oc Veterans, last 12 monthsPersonnel Management
Customer Service
Scheduling
Repair
Inspection
Security Experience
Appointment Setting
Contract Management
Supervisory Skills
Top Baseline Skills for oc Veterans, last 12 monthsWriting
Communication Skills
Physical Demand
Research
Planning
Detail-Oriented
Preparing Reports
Decision Making
Problem Solving
Team Work/ Collaboration
Troubleshooting
Computer Skills
Organizational Skills
Building Effective Relationships
Mentoring
Articulate
Leadership
Burning Glass Labor Insights, August 2017
Burning Glass Labor Insights, August 2017
Burning Glass Labor Insights, August 2017

4949
VETERAN EMPLOYMENTIN ORANGE COUNTY
Orange County veterans are more highly educated than the average resident and
bring a variety of desirable skills to the workforce. Despite the many benefits of hiring
veterans, unfortunately many veterans in Orange County and nationwide struggle to
find gainful employment after returning home. Orange County must continue to create
and support programs that help set veterans up for success with this transition; helping
veterans find economic opportunity will also help Orange County’s economy as a whole
by connecting employers to potential workers with many of the in-demand and soft
skills crucial to success in today’s workplac and economy.
5050
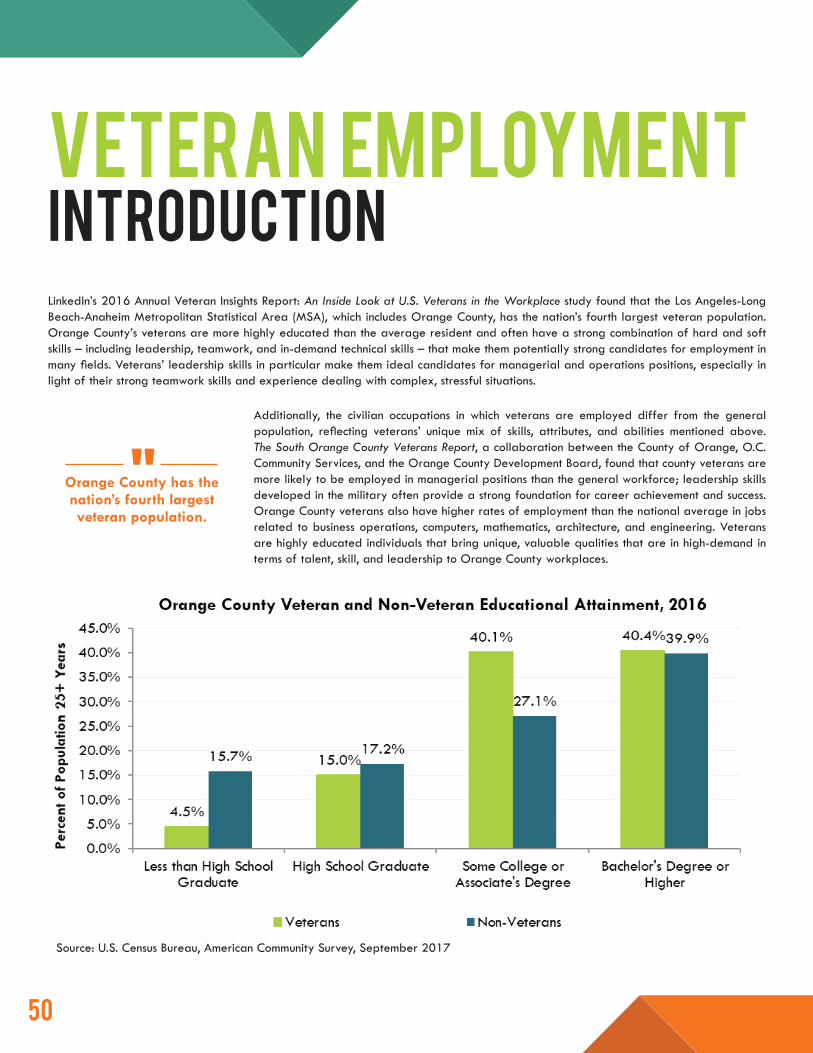
Veteran employment IntroductionLinkedIn’s 2016 Annual Veteran Insights Report: An Inside Look at U.S. Veterans in the Workplace study found that the Los Angeles-Long Beach-Anaheim Metropolitan Statistical Area (MSA), which includes Orange County, has the nation’s fourth largest veteran population. Orange County’s veterans are more highly educated than the average resident and often have a strong combination of hard and soft skills – including leadership, teamwork, and in-demand technical skills – that make them potentially strong candidates for employment in many fields. Veterans’ leadership skills in particular make them ideal candidates for managerial and operations positions, especially in light of their strong teamwork skills and experience dealing with complex, stressful situations.
Source: U.S. Census Bureau, American Community Survey, September 2017
Additionally, the civilian occupations in which veterans are employed differ from the general population, reflecting veterans’ unique mix of skills, attributes, and abilities mentioned above. The South Orange County Veterans Report, a collaboration between the County of Orange, O.C. Community Services, and the Orange County Development Board, found that county veterans are more likely to be employed in managerial positions than the general workforce; leadership skills developed in the military often provide a strong foundation for career achievement and success. Orange County veterans also have higher rates of employment than the national average in jobs related to business operations, computers, mathematics, architecture, and engineering. Veterans are highly educated individuals that bring unique, valuable qualities that are in high-demand in terms of talent, skill, and leadership to Orange County workplaces.
Orange County has the nation’s fourth largest veteran population. "
5151
Source: U.S. Bureau of Labor Statistics, Employment Situation of Veterans News Release, March 2017
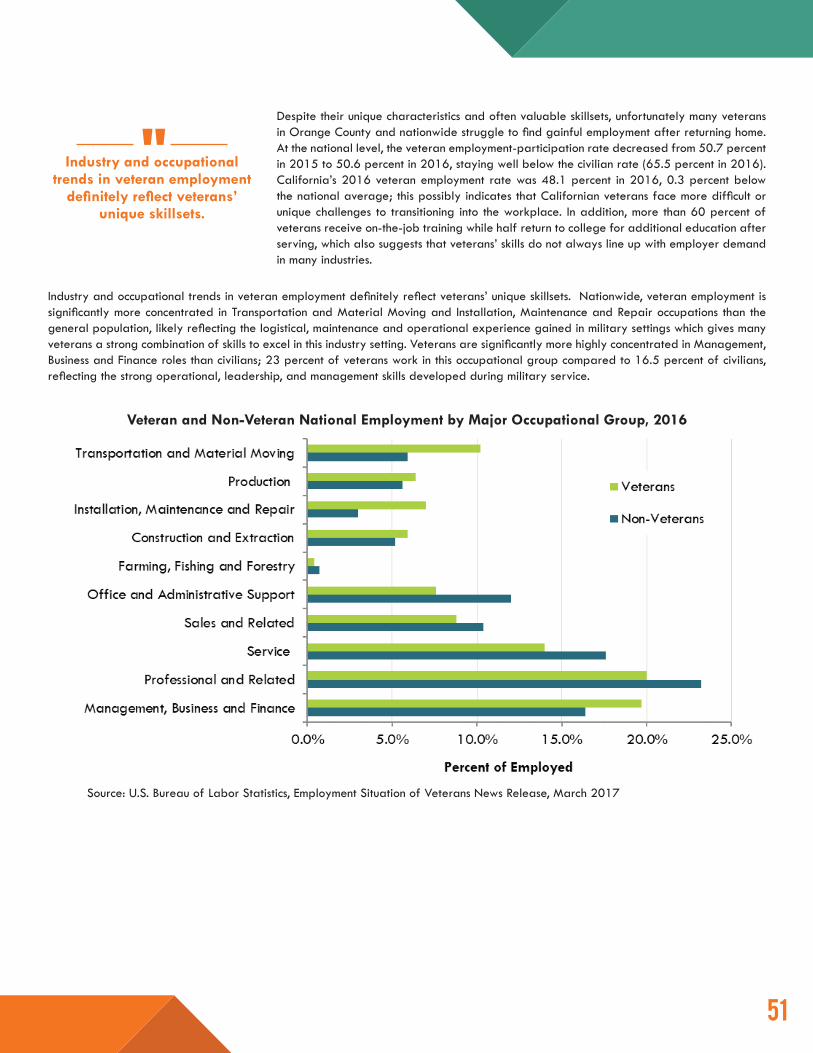
Industry and occupational trends in veteran employment definitely reflect veterans’ unique skillsets. Nationwide, veteran employment is significantly more concentrated in Transportation and Material Moving and Installation, Maintenance and Repair occupations than the general population, likely reflecting the logistical, maintenance and operational experience gained in military settings which gives many veterans a strong combination of skills to excel in this industry setting. Veterans are significantly more highly concentrated in Management, Business and Finance roles than civilians; 23 percent of veterans work in this occupational group compared to 16.5 percent of civilians, reflecting the strong operational, leadership, and management skills developed during military service.
Despite their unique characteristics and often valuable skillsets, unfortunately many veterans in Orange County and nationwide struggle to find gainful employment after returning home. At the national level, the veteran employment-participation rate decreased from 50.7 percent in 2015 to 50.6 percent in 2016, staying well below the civilian rate (65.5 percent in 2016). California’s 2016 veteran employment rate was 48.1 percent in 2016, 0.3 percent below the national average; this possibly indicates that Californian veterans face more difficult or unique challenges to transitioning into the workplace. In addition, more than 60 percent of veterans receive on-the-job training while half return to college for additional education after serving, which also suggests that veterans’ skills do not always line up with employer demand in many industries.
Industry and occupational trends in veteran employment
definitely reflect veterans’ unique skillsets.
Veteran and Non-Veteran National Employment by Major Occupational Group, 2016
"
5252
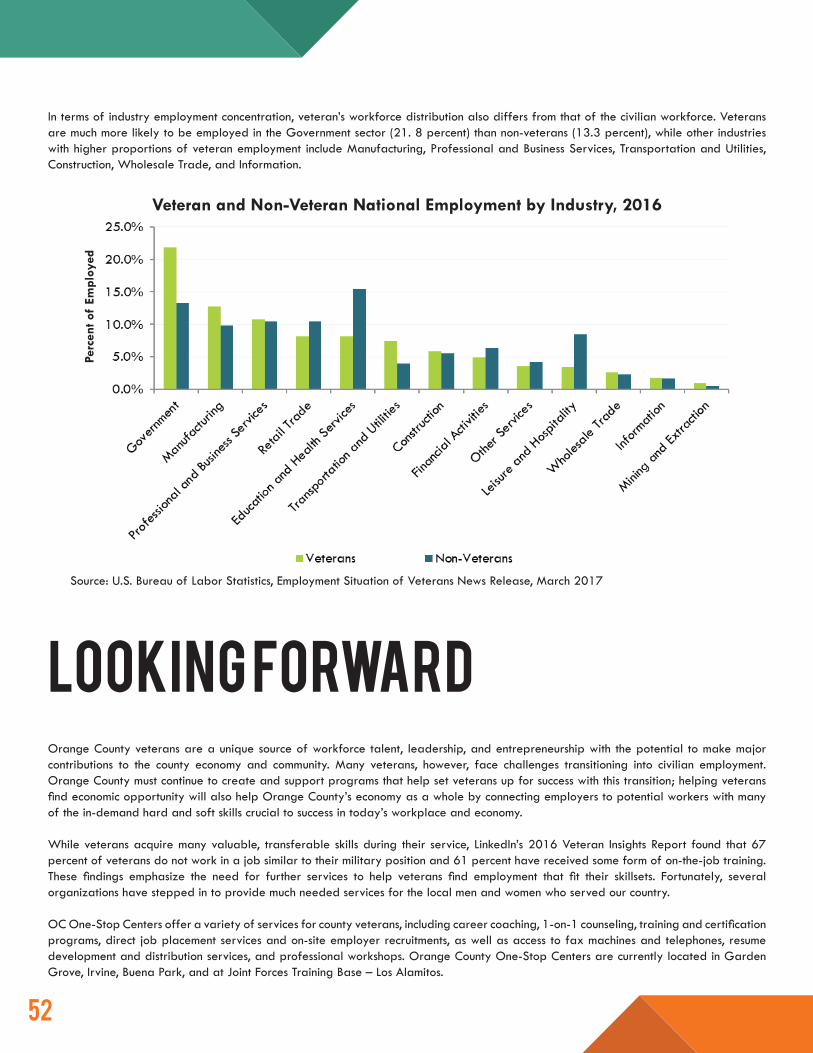
Veteran and Non-Veteran National Employment by Industry, 2016
Orange County veterans are a unique source of workforce talent, leadership, and entrepreneurship with the potential to make major contributions to the county economy and community. Many veterans, however, face challenges transitioning into civilian employment. Orange County must continue to create and support programs that help set veterans up for success with this transition; helping veterans find economic opportunity will also help Orange County’s economy as a whole by connecting employers to potential workers with many of the in-demand hard and soft skills crucial to success in today’s workplace and economy.
While veterans acquire many valuable, transferable skills during their service, LinkedIn’s 2016 Veteran Insights Report found that 67 percent of veterans do not work in a job similar to their military position and 61 percent have received some form of on-the-job training. These findings emphasize the need for further services to help veterans find employment that fit their skillsets. Fortunately, several organizations have stepped in to provide much needed services for the local men and women who served our country.
OC One-Stop Centers offer a variety of services for county veterans, including career coaching, 1-on-1 counseling, training and certification programs, direct job placement services and on-site employer recruitments, as well as access to fax machines and telephones, resume development and distribution services, and professional workshops. Orange County One-Stop Centers are currently located in Garden Grove, Irvine, Buena Park, and at Joint Forces Training Base – Los Alamitos.
looking forward
Source: U.S. Bureau of Labor Statistics, Employment Situation of Veterans News Release, March 2017
In terms of industry employment concentration, veteran’s workforce distribution also differs from that of the civilian workforce. Veterans are much more likely to be employed in the Government sector (21. 8 percent) than non-veterans (13.3 percent), while other industries with higher proportions of veteran employment include Manufacturing, Professional and Business Services, Transportation and Utilities, Construction, Wholesale Trade, and Information.
Perc
ent o
f Em
ploy
ed
5353
The Veterans’ Employment-Related Assistance Program (VEAP), a collaboration between the California Employment Development Department and the California Workforce Development Board, serves veterans who require higher levels of support: veterans who have left active duty in the last 48 months, campaign veterans, and those with significant barriers to employment. VEAP connects veterans with the education, training and industry-recognized certifications required for high-wage, high-growth industries. In addition to these services, VEAP works in partnership with the Orange County Health Care Agency and the OC Service Office to run OC4Vets, a behavioral health program that helps veterans and their families’ access mental health and related services.
Located centrally in Santa Ana, the Orange County Veterans Service Office provides professional services for military veterans, their dependents and survivors who are entitled to benefits from the United States Department of Veterans Affairs, the State of California, the County of Orange and other agencies, as applicable.
The Orange County Veterans Service Office is responsible for providing claim development, claim filing, advocacy, and case management services to Orange County veterans. This vital segment of the population includes an ever increasing number of aging veterans, and homeless veterans.
Benefits Include:• Service-Connected Disability Compensation • Non Service-Connected Disability Pension • Dependency Indemnity Compensation (DIC) • Death Pension • Aid & Attendance Entitlement• VA Medical Care Eligibility & Access• Vocational Rehabilitation • California College Fee Waiver Program• VA Life Insurance• State Veterans Homes• Requests for Military Records• Discharge Upgrade Information• Burial Reimbursement
The Veterans Service Office is also responsible for administering the College Fee Waiver Program for Veterans’ Dependents. This program is afforded to spouses, unmarried surviving spouses, and children of service-connected disabled or service-related deceased veterans. Eligible dependents are not required to pay “mandatory system wide” tuition and fees while attending either a California Community College, a campus of the California State University (Cal State) system, or a campus of the University of California (UC) system. This program not only provides eligible dependents with the incentive, but also the opportunity to pursue their career goals.
The Los Alamitos Joint Forces Training Base (JFTB), a full-service joint military training center and airfield, is home to a Military and Veterans Resource Center, which in turn houses a County of Orange run One-Stop Center Satellite that provides employment and training services to eligible military personnel, veterans, veteran Spouses and military families. One-Stop services include employment and training programs funded under the Workforce Innovation and Opportunity Act (WIOA), as well as job search assistance, a resource room, workshops, job counseling, career guidance and assessment. The One-Stop also conducts on site employer and job seeker events, recruitment, and outreach, and works collaboratively with other veteran agencies at the Military and Veterans Resource Center including the Employment Development Department (EDD), Columbia College, Family Assistance, ESGR, Transitional Services, and Work for Warriors.
One-Stop veterans services include employment and training programs
funded under the Workforce Innovation and Opportunity Act, as well as job search assistance, a resource room, workshops, job counseling, career
guidance and assessment.
"
5454
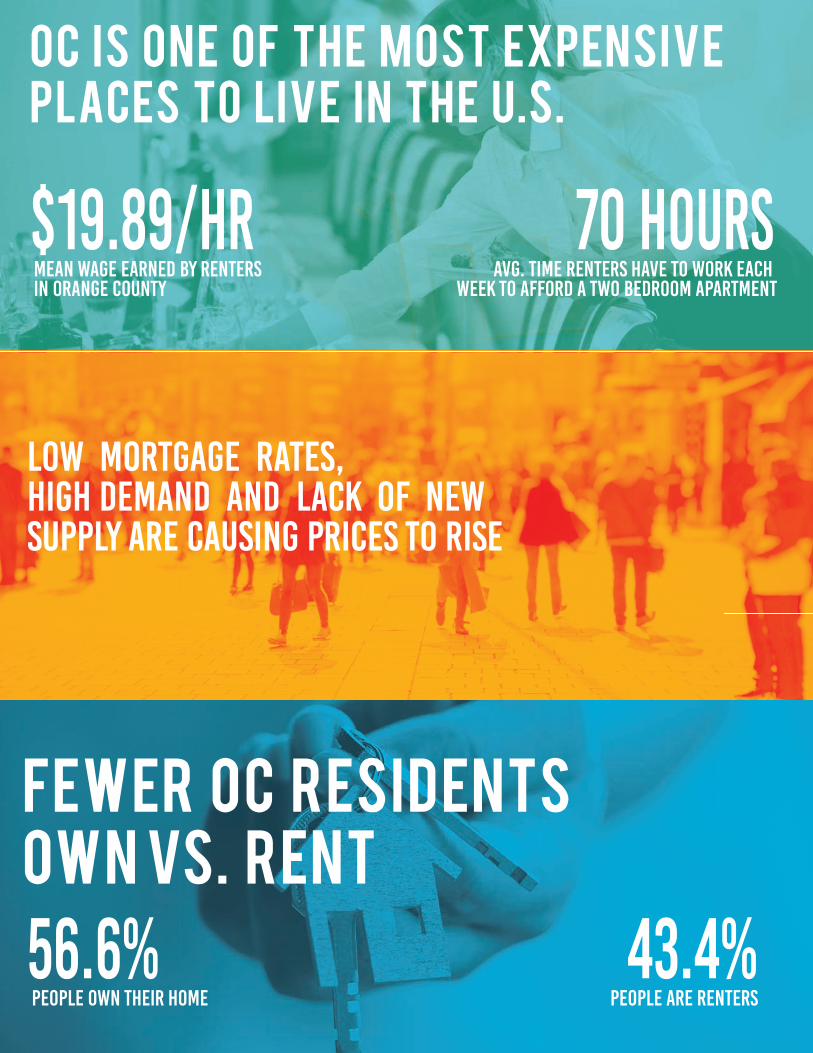
Low mortgage rates, high demand and lack of new supply are causing prices to rise
few er o c r esi d ents OW N vs. r ent
o c is o n e o f th e m ost expen sive places to live i n th e u.s.
$19.89/hr Mean wage earned by renters in Orange County
70 hours avg. time renters have to work each
week to afford a two bedroom apartment
56.6%people own their home
43.4%people are renters
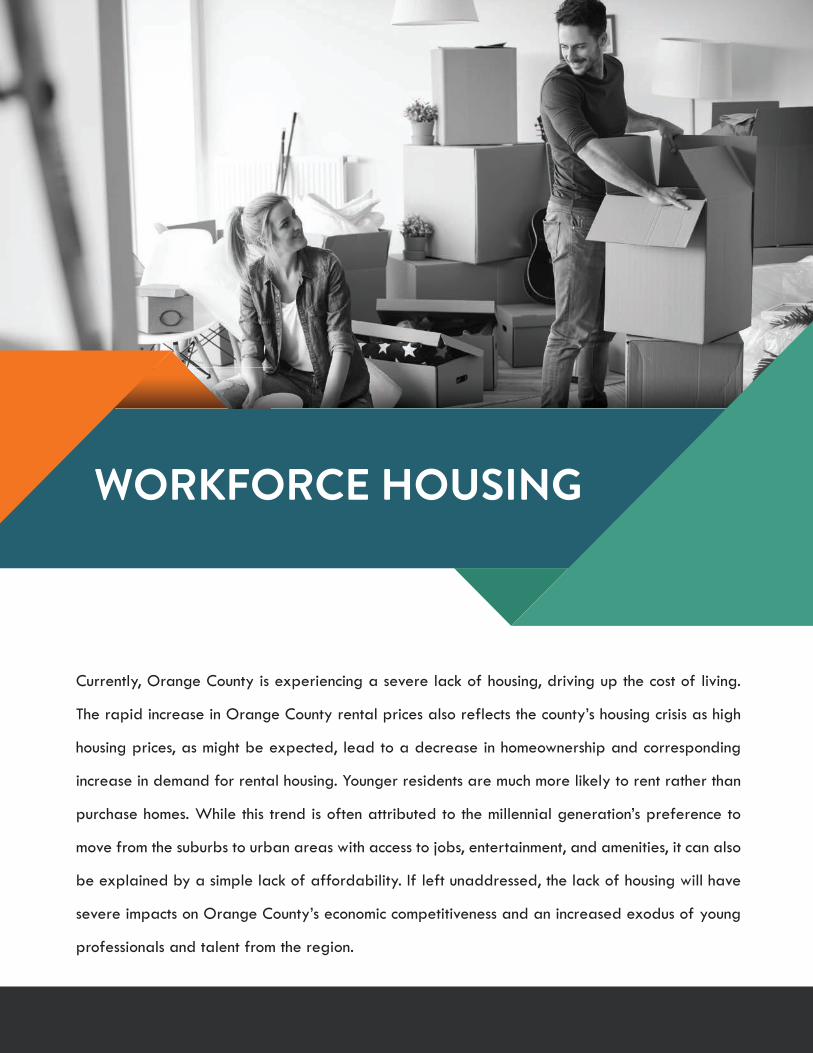
5555
WORKFORCE HOUSING
Currently, Orange County is experiencing a severe lack of housing, driving up the cost of living.
The rapid increase in Orange County rental prices also reflects the county’s housing crisis as high
housing prices, as might be expected, lead to a decrease in homeownership and corresponding
increase in demand for rental housing. Younger residents are much more likely to rent rather than
purchase homes. While this trend is often attributed to the millennial generation’s preference to
move from the suburbs to urban areas with access to jobs, entertainment, and amenities, it can also
be explained by a simple lack of affordability. If left unaddressed, the lack of housing will have
severe impacts on Orange County’s economic competitiveness and an increased exodus of young
professionals and talent from the region.
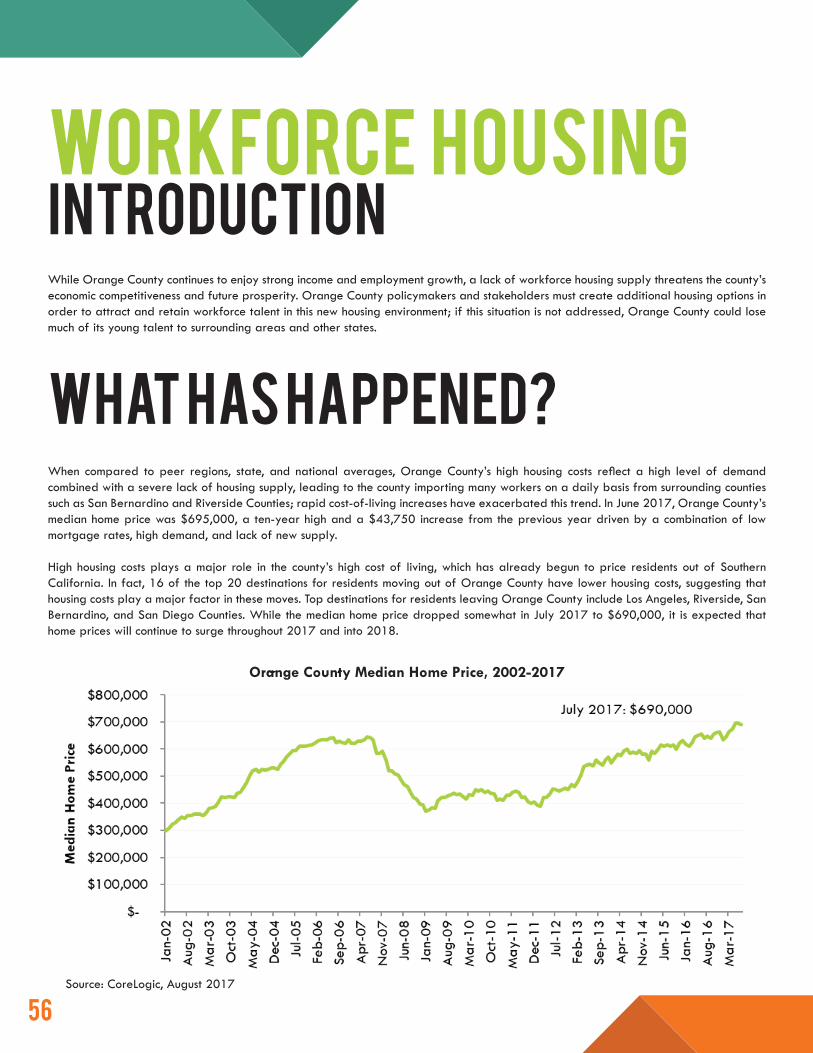
5656
WORKFORCE HOUSING IntroductionWhile Orange County continues to enjoy strong income and employment growth, a lack of workforce housing supply threatens the county’s economic competitiveness and future prosperity. Orange County policymakers and stakeholders must create additional housing options in order to attract and retain workforce talent in this new housing environment; if this situation is not addressed, Orange County could lose much of its young talent to surrounding areas and other states.
WHAT HAS HAPPENED?When compared to peer regions, state, and national averages, Orange County’s high housing costs reflect a high level of demand combined with a severe lack of housing supply, leading to the county importing many workers on a daily basis from surrounding counties such as San Bernardino and Riverside Counties; rapid cost-of-living increases have exacerbated this trend. In June 2017, Orange County’s median home price was $695,000, a ten-year high and a $43,750 increase from the previous year driven by a combination of low mortgage rates, high demand, and lack of new supply.
High housing costs plays a major role in the county’s high cost of living, which has already begun to price residents out of Southern California. In fact, 16 of the top 20 destinations for residents moving out of Orange County have lower housing costs, suggesting that housing costs play a major factor in these moves. Top destinations for residents leaving Orange County include Los Angeles, Riverside, San Bernardino, and San Diego Counties. While the median home price dropped somewhat in July 2017 to $690,000, it is expected that home prices will continue to surge throughout 2017 and into 2018.
Source: CoreLogic, August 2017
Orange County Median Home Price, 2002-2017
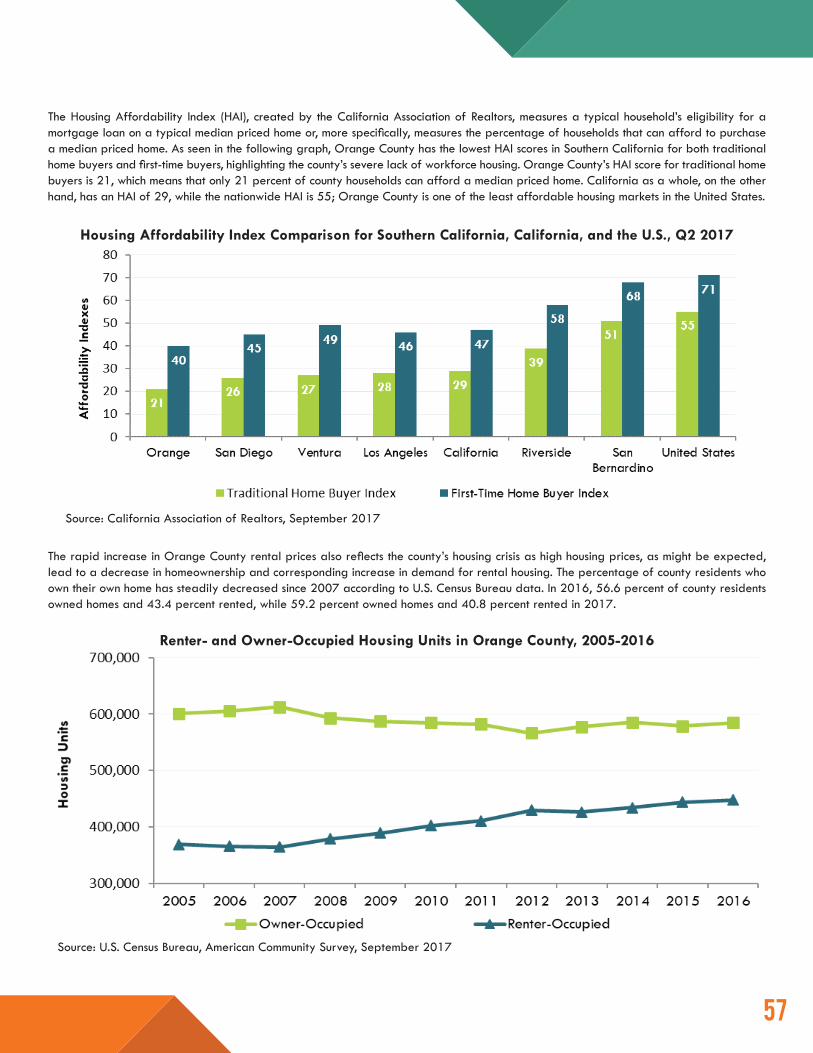
5757
The Housing Affordability Index (HAI), created by the California Association of Realtors, measures a typical household’s eligibility for a mortgage loan on a typical median priced home or, more specifically, measures the percentage of households that can afford to purchase a median priced home. As seen in the following graph, Orange County has the lowest HAI scores in Southern California for both traditional home buyers and first-time buyers, highlighting the county’s severe lack of workforce housing. Orange County’s HAI score for traditional home buyers is 21, which means that only 21 percent of county households can afford a median priced home. California as a whole, on the other hand, has an HAI of 29, while the nationwide HAI is 55; Orange County is one of the least affordable housing markets in the United States.
Source: California Association of Realtors, September 2017
Housing Affordability Index Comparison for Southern California, California, and the U.S., Q2 2017
Source: U.S. Census Bureau, American Community Survey, September 2017
The rapid increase in Orange County rental prices also reflects the county’s housing crisis as high housing prices, as might be expected, lead to a decrease in homeownership and corresponding increase in demand for rental housing. The percentage of county residents who own their own home has steadily decreased since 2007 according to U.S. Census Bureau data. In 2016, 56.6 percent of county residents owned homes and 43.4 percent rented, while 59.2 percent owned homes and 40.8 percent rented in 2017.
Renter- and Owner-Occupied Housing Units in Orange County, 2005-2016
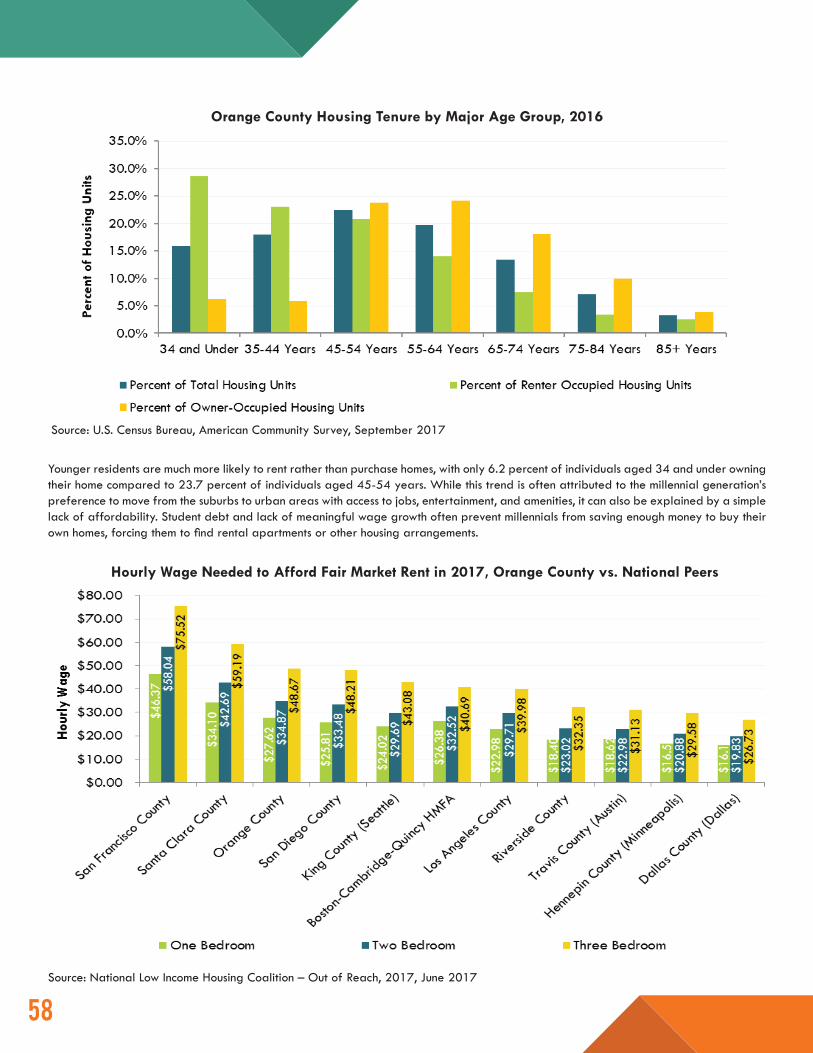
5858
Younger residents are much more likely to rent rather than purchase homes, with only 6.2 percent of individuals aged 34 and under owning their home compared to 23.7 percent of individuals aged 45-54 years. While this trend is often attributed to the millennial generation’s preference to move from the suburbs to urban areas with access to jobs, entertainment, and amenities, it can also be explained by a simple lack of affordability. Student debt and lack of meaningful wage growth often prevent millennials from saving enough money to buy their own homes, forcing them to find rental apartments or other housing arrangements.
Source: U.S. Census Bureau, American Community Survey, September 2017
Orange County Housing Tenure by Major Age Group, 2016
Source: National Low Income Housing Coalition – Out of Reach, 2017, June 2017
Hourly Wage Needed to Afford Fair Market Rent in 2017, Orange County vs. National Peers
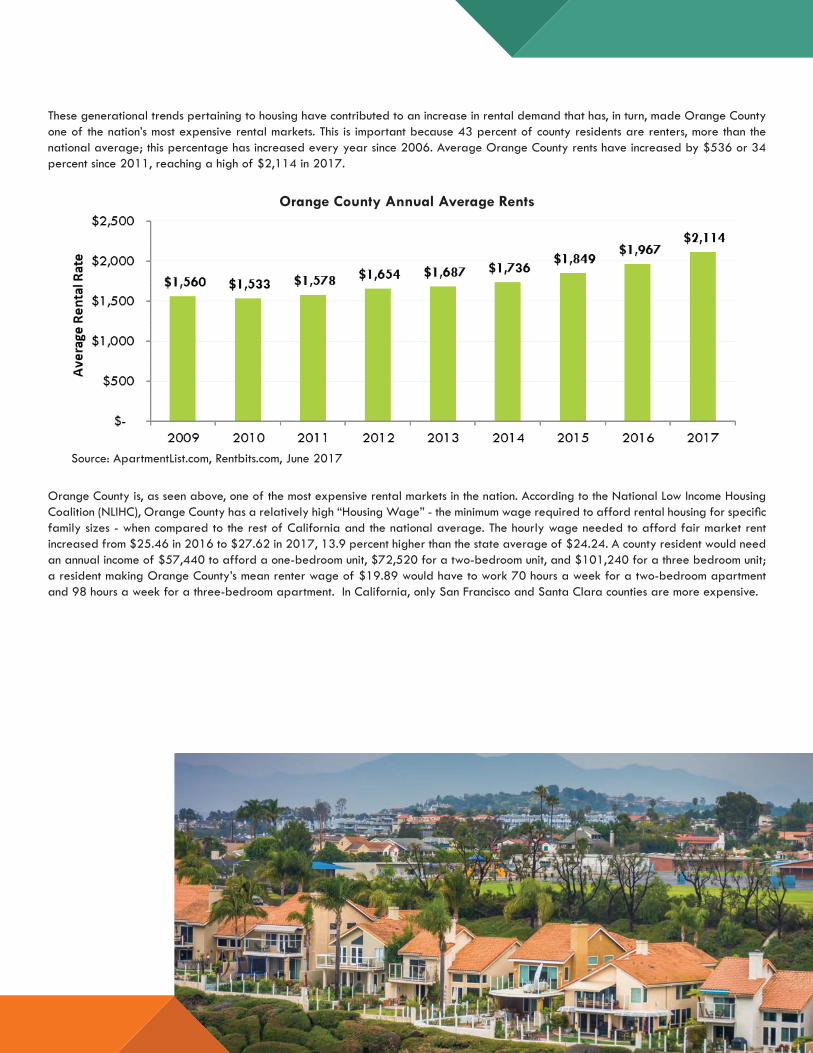
5959
Orange County is, as seen above, one of the most expensive rental markets in the nation. According to the National Low Income Housing Coalition (NLIHC), Orange County has a relatively high “Housing Wage” - the minimum wage required to afford rental housing for specific family sizes - when compared to the rest of California and the national average. The hourly wage needed to afford fair market rent increased from $25.46 in 2016 to $27.62 in 2017, 13.9 percent higher than the state average of $24.24. A county resident would need an annual income of $57,440 to afford a one-bedroom unit, $72,520 for a two-bedroom unit, and $101,240 for a three bedroom unit; a resident making Orange County’s mean renter wage of $19.89 would have to work 70 hours a week for a two-bedroom apartment and 98 hours a week for a three-bedroom apartment. In California, only San Francisco and Santa Clara counties are more expensive.
Source: ApartmentList.com, Rentbits.com, June 2017
These generational trends pertaining to housing have contributed to an increase in rental demand that has, in turn, made Orange County one of the nation’s most expensive rental markets. This is important because 43 percent of county residents are renters, more than the national average; this percentage has increased every year since 2006. Average Orange County rents have increased by $536 or 34 percent since 2011, reaching a high of $2,114 in 2017.
Orange County Annual Average Rents
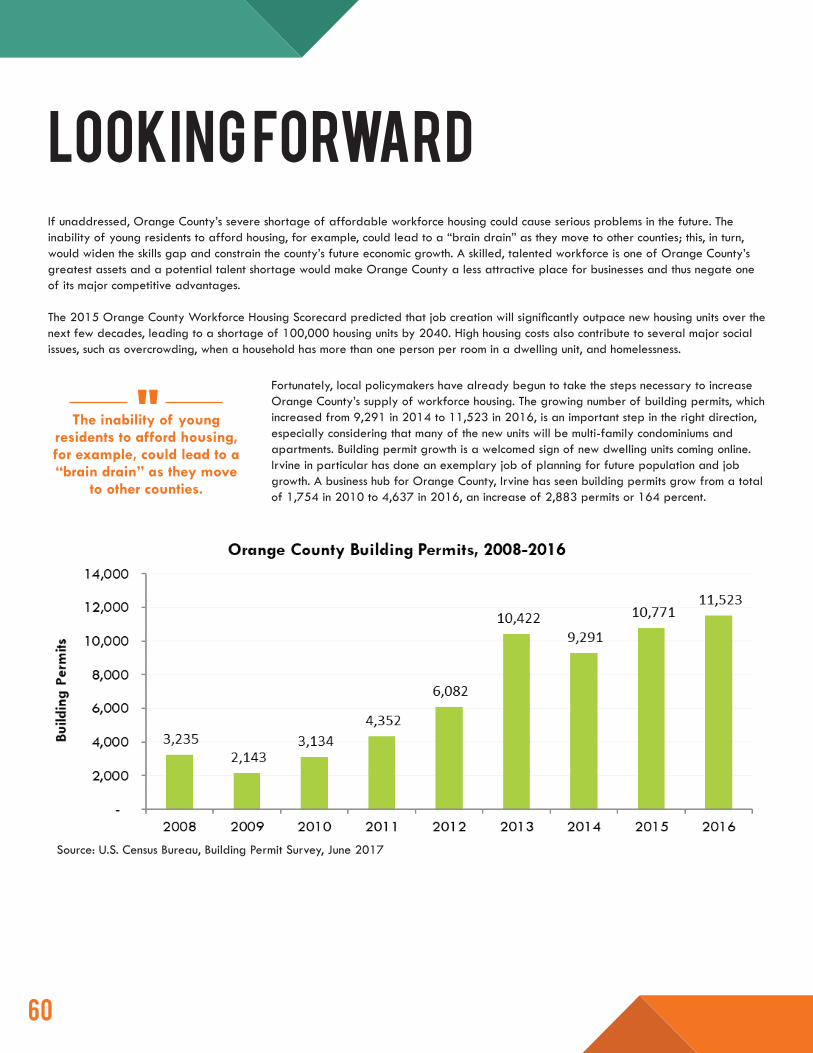
6060
Fortunately, local policymakers have already begun to take the steps necessary to increase Orange County’s supply of workforce housing. The growing number of building permits, which increased from 9,291 in 2014 to 11,523 in 2016, is an important step in the right direction, especially considering that many of the new units will be multi-family condominiums and apartments. Building permit growth is a welcomed sign of new dwelling units coming online. Irvine in particular has done an exemplary job of planning for future population and job growth. A business hub for Orange County, Irvine has seen building permits grow from a total of 1,754 in 2010 to 4,637 in 2016, an increase of 2,883 permits or 164 percent.
LOOKING FORWARDIf unaddressed, Orange County’s severe shortage of affordable workforce housing could cause serious problems in the future. The inability of young residents to afford housing, for example, could lead to a “brain drain” as they move to other counties; this, in turn, would widen the skills gap and constrain the county’s future economic growth. A skilled, talented workforce is one of Orange County’s greatest assets and a potential talent shortage would make Orange County a less attractive place for businesses and thus negate one of its major competitive advantages.
The 2015 Orange County Workforce Housing Scorecard predicted that job creation will significantly outpace new housing units over the next few decades, leading to a shortage of 100,000 housing units by 2040. High housing costs also contribute to several major social issues, such as overcrowding, when a household has more than one person per room in a dwelling unit, and homelessness.
Source: U.S. Census Bureau, Building Permit Survey, June 2017
The inability of young residents to afford housing, for example, could lead to a “brain drain” as they move
to other counties.
"

6161
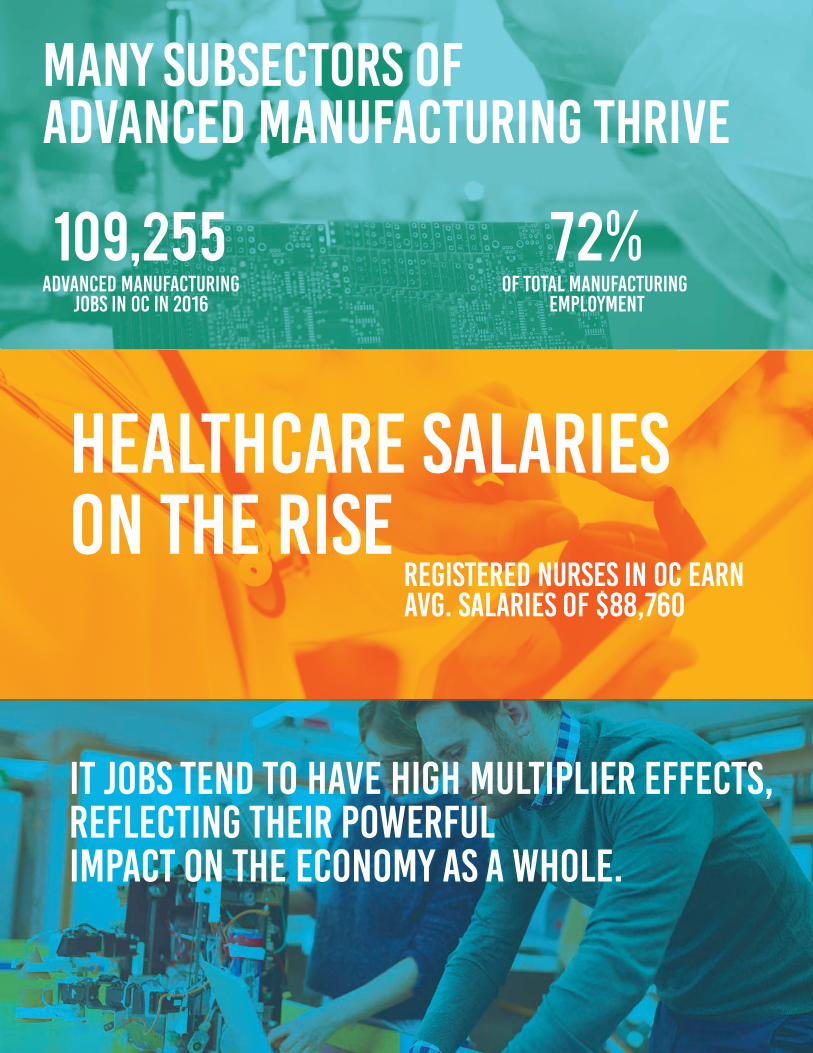
6262
Many subsectors of advanced manufacturing thrive
healthcare salaries on the rise
AVG. Salaries of $88,760 registered nurses in oc Earn
IT jobs tend to have high multiplier effects, reflecting their powerful impact on the economy as a whole.
advanced manufacturingjobs in oc in 2016
109,255 of total manufacturing
employment
72%
6363
ADVANCED MANUFACTURING, HEALTHCARE, IT, TOURISM
Orange County’s key drivers of economic growth are Advanced Manufacturing,
Healthcare, Information Technology, and Tourism. While advancements in technology
are continuously changing the landscape of these different industry sectors, there are
ample opportunities for employment for individuals at all educational and skill levels.

6464
Advanced Manufacturing, Healthcare, IT, TourismIntroductionFour industries - Advanced Manufacturing, Healthcare, Information Technology (IT), and Tourism – are key drivers of Orange County’s economic growth, creating jobs at nearly all skill levels and offering diverse opportunities for career advancement in many in-demand, growing fields. The constant development and increasing adoption of new, cutting-edge technology solutions continues to transform all four industries in both obvious and subtle ways. In addition to the obvious shifts, such as the development of new automated manufacturing technology and its direct impacts on firms in the Advanced Manufacturing sector, subtler shifts are also occurring at a more rapid pace than ever before.
A relatively simple technology such as Yelp!, for example, transforms how industries in the Tourism sector capture potential customers, while mobile apps can change the way Healthcare interacts and communicates with patients. Advances in IT and other technology factors have transformed the employment landscape in these industries, which also offer strong job growth in the “middle-skill” category; a middle-skill job requires a certification or associate’s degree beyond a high school diploma, but not a Bachelor’s or higher. This makes employment in these sectors a particularly good opportunity for many Orange County workers without a college degree.
advanced manufacturingThe term “Advanced Manufacturing” refers to manufacturing that utilizes advanced technology and processes, with major sectors in Orange County including:
• Advanced Electronics• Aerospace• Analytical Instruments• Biopharmaceuticals• Communications Equipment• Medical Devices
Orange County Advanced Manufacturing employment totaled 109,255 in 2016, accounting for over 72 percent of total manufacturing employment; many subsectors have managed to thrive despite Orange County’s higher labor costs by automating many of their processes to significantly increase productivity and efficiency.
While Orange County’s strong manufacturing base and deep talent pool will likely provide a stable home for Advanced Manufacturing in the foreseeable future, several factors set it apart from other county industries and provide a unique challenge for retaining and attracting talented workers. First, manufacturing as a whole has an image problem; many prospective employees, career counselors and advisors ignore opportunities in this field because they perceive it to be in decline and incorrectly believe that its jobs are low quality, low wage and low skill. This has led to a lack of relevant skills training in schools which has, in turn, exacerbated this industry’s severe skills gap.
Most of the jobs that would have been created ten or twenty years ago are
now filled by robots or other machines/automated processes."
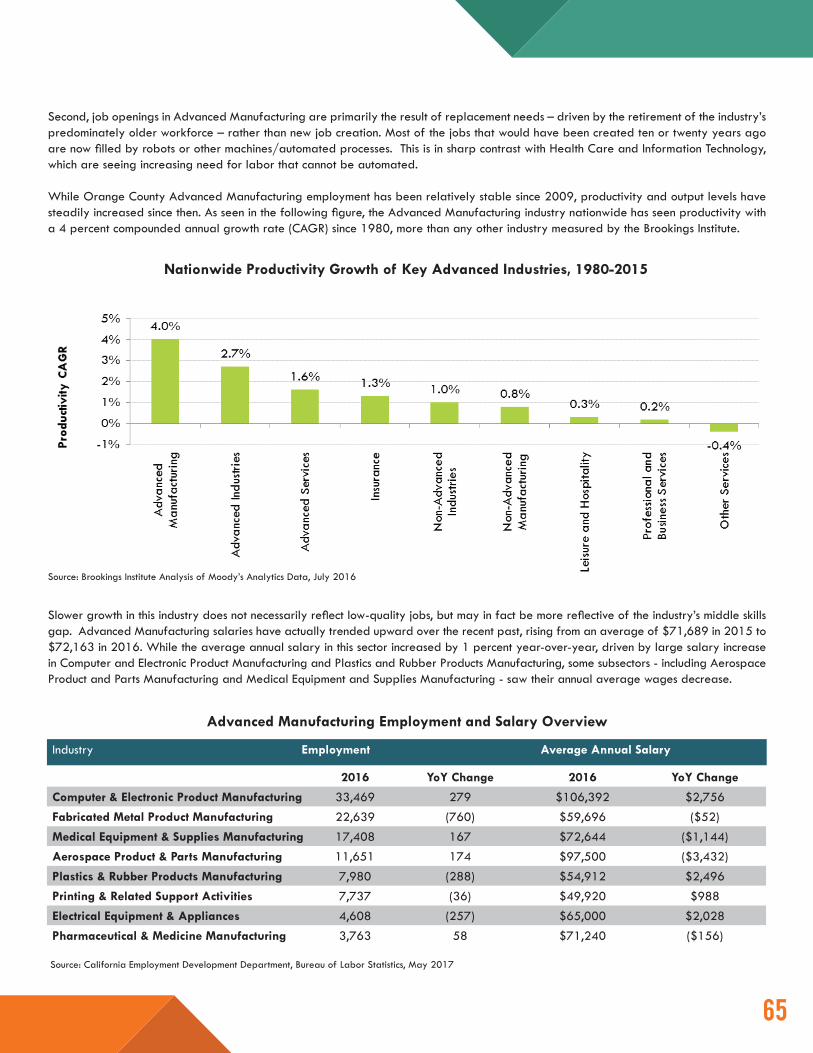
6565
Second, job openings in Advanced Manufacturing are primarily the result of replacement needs – driven by the retirement of the industry’s predominately older workforce – rather than new job creation. Most of the jobs that would have been created ten or twenty years ago are now filled by robots or other machines/automated processes. This is in sharp contrast with Health Care and Information Technology, which are seeing increasing need for labor that cannot be automated.
While Orange County Advanced Manufacturing employment has been relatively stable since 2009, productivity and output levels have steadily increased since then. As seen in the following figure, the Advanced Manufacturing industry nationwide has seen productivity with a 4 percent compounded annual growth rate (CAGR) since 1980, more than any other industry measured by the Brookings Institute.
Slower growth in this industry does not necessarily reflect low-quality jobs, but may in fact be more reflective of the industry’s middle skills gap. Advanced Manufacturing salaries have actually trended upward over the recent past, rising from an average of $71,689 in 2015 to $72,163 in 2016. While the average annual salary in this sector increased by 1 percent year-over-year, driven by large salary increase in Computer and Electronic Product Manufacturing and Plastics and Rubber Products Manufacturing, some subsectors - including Aerospace Product and Parts Manufacturing and Medical Equipment and Supplies Manufacturing - saw their annual average wages decrease.
Source: Brookings Institute Analysis of Moody’s Analytics Data, July 2016
Advanced Manufacturing Employment and Salary Overview
Industry Employment Average Annual Salary
2016 YoY Change 2016 YoY Change
Computer & Electronic Product Manufacturing 33,469 279 $106,392 $2,756Fabricated Metal Product Manufacturing 22,639 (760) $59,696 ($52)Medical Equipment & Supplies Manufacturing 17,408 167 $72,644 ($1,144)Aerospace Product & Parts Manufacturing 11,651 174 $97,500 ($3,432)Plastics & Rubber Products Manufacturing 7,980 (288) $54,912 $2,496Printing & Related Support Activities 7,737 (36) $49,920 $988Electrical Equipment & Appliances 4,608 (257) $65,000 $2,028Pharmaceutical & Medicine Manufacturing 3,763 58 $71,240 ($156)
Source: California Employment Development Department, Bureau of Labor Statistics, May 2017
Nationwide Productivity Growth of Key Advanced Industries, 1980-2015
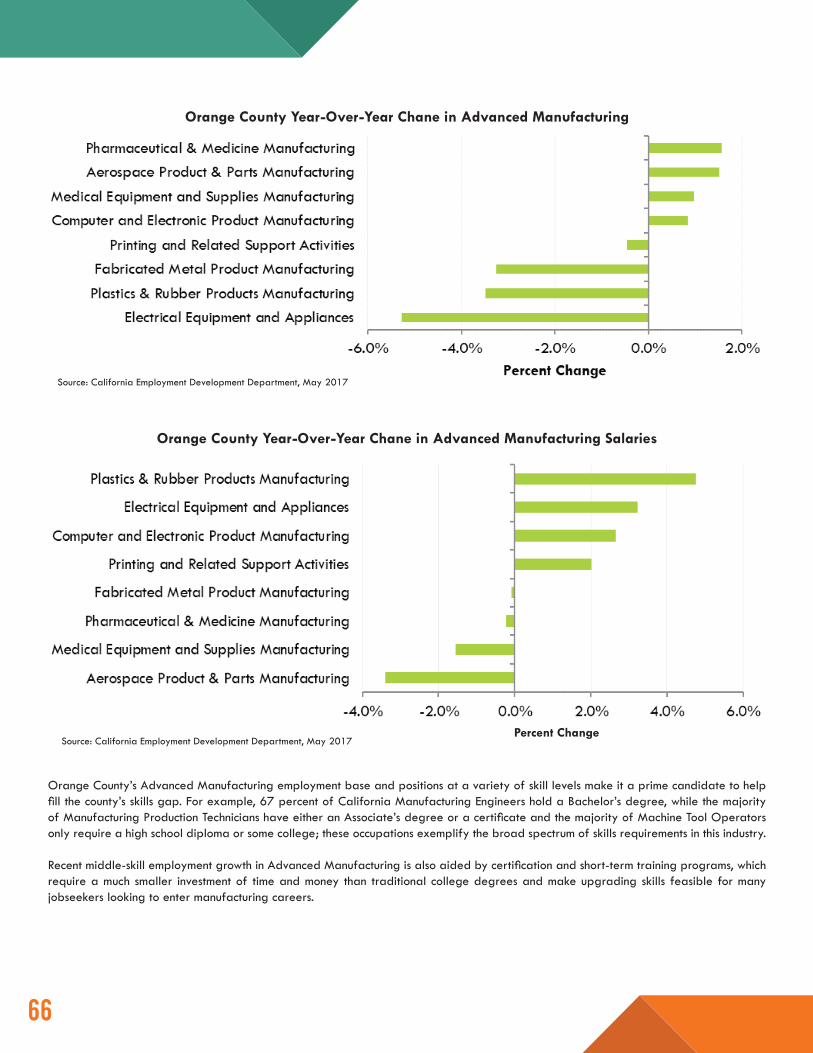
6666
Orange County’s Advanced Manufacturing employment base and positions at a variety of skill levels make it a prime candidate to help fill the county’s skills gap. For example, 67 percent of California Manufacturing Engineers hold a Bachelor’s degree, while the majority of Manufacturing Production Technicians have either an Associate’s degree or a certificate and the majority of Machine Tool Operators only require a high school diploma or some college; these occupations exemplify the broad spectrum of skills requirements in this industry.
Recent middle-skill employment growth in Advanced Manufacturing is also aided by certification and short-term training programs, which require a much smaller investment of time and money than traditional college degrees and make upgrading skills feasible for many jobseekers looking to enter manufacturing careers.
Source: California Employment Development Department, May 2017
Source: California Employment Development Department, May 2017
Orange County Year-Over-Year Chane in Advanced Manufacturing
Orange County Year-Over-Year Chane in Advanced Manufacturing Salaries
Percent Change
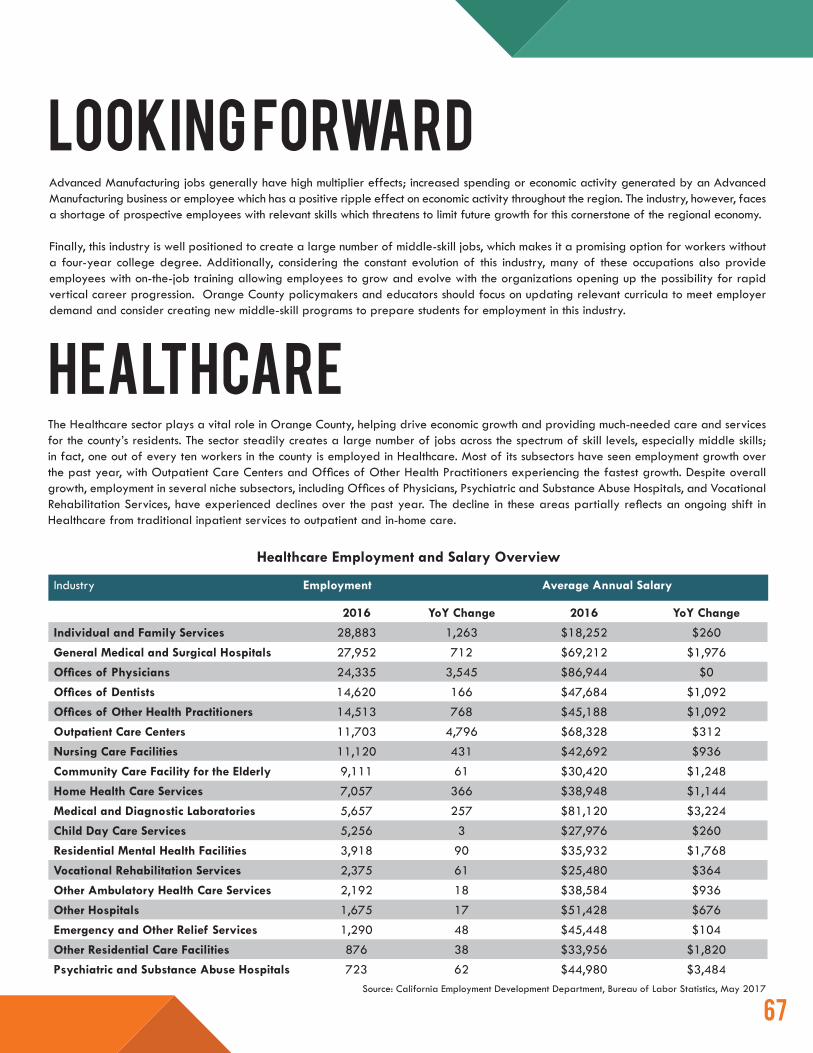
6767
looking forwardAdvanced Manufacturing jobs generally have high multiplier effects; increased spending or economic activity generated by an Advanced Manufacturing business or employee which has a positive ripple effect on economic activity throughout the region. The industry, however, faces a shortage of prospective employees with relevant skills which threatens to limit future growth for this cornerstone of the regional economy.
Finally, this industry is well positioned to create a large number of middle-skill jobs, which makes it a promising option for workers without a four-year college degree. Additionally, considering the constant evolution of this industry, many of these occupations also provide employees with on-the-job training allowing employees to grow and evolve with the organizations opening up the possibility for rapid vertical career progression. Orange County policymakers and educators should focus on updating relevant curricula to meet employer demand and consider creating new middle-skill programs to prepare students for employment in this industry.
The Healthcare sector plays a vital role in Orange County, helping drive economic growth and providing much-needed care and services for the county’s residents. The sector steadily creates a large number of jobs across the spectrum of skill levels, especially middle skills; in fact, one out of every ten workers in the county is employed in Healthcare. Most of its subsectors have seen employment growth over the past year, with Outpatient Care Centers and Offices of Other Health Practitioners experiencing the fastest growth. Despite overall growth, employment in several niche subsectors, including Offices of Physicians, Psychiatric and Substance Abuse Hospitals, and Vocational Rehabilitation Services, have experienced declines over the past year. The decline in these areas partially reflects an ongoing shift in Healthcare from traditional inpatient services to outpatient and in-home care.
Healthcare
Healthcare Employment and Salary Overview
Industry Employment Average Annual Salary
2016 YoY Change 2016 YoY Change
Individual and Family Services 28,883 1,263 $18,252 $260General Medical and Surgical Hospitals 27,952 712 $69,212 $1,976Offices of Physicians 24,335 3,545 $86,944 $0Offices of Dentists 14,620 166 $47,684 $1,092Offices of Other Health Practitioners 14,513 768 $45,188 $1,092Outpatient Care Centers 11,703 4,796 $68,328 $312Nursing Care Facilities 11,120 431 $42,692 $936Community Care Facility for the Elderly 9,111 61 $30,420 $1,248Home Health Care Services 7,057 366 $38,948 $1,144Medical and Diagnostic Laboratories 5,657 257 $81,120 $3,224Child Day Care Services 5,256 3 $27,976 $260Residential Mental Health Facilities 3,918 90 $35,932 $1,768Vocational Rehabilitation Services 2,375 61 $25,480 $364Other Ambulatory Health Care Services 2,192 18 $38,584 $936Other Hospitals 1,675 17 $51,428 $676Emergency and Other Relief Services 1,290 48 $45,448 $104Other Residential Care Facilities 876 38 $33,956 $1,820Psychiatric and Substance Abuse Hospitals 723 62 $44,980 $3,484
Source: California Employment Development Department, Bureau of Labor Statistics, May 2017
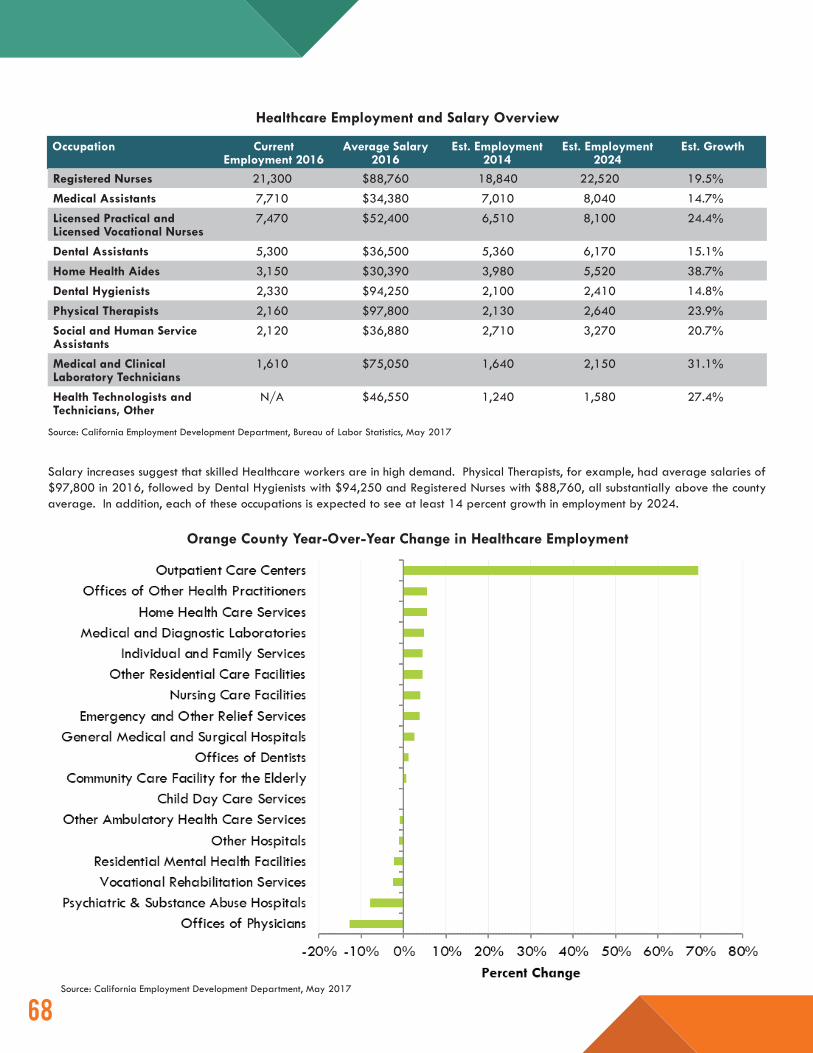
6868
Occupation Current Employment 2016
Average Salary2016
Est. Employment2014
Est. Employment2024
Est. Growth
Healthcare Employment and Salary Overview
Registered Nurses 21,300 $88,760 18,840 22,520 19.5%Medical Assistants 7,710 $34,380 7,010 8,040 14.7%Licensed Practical and Licensed Vocational Nurses
7,470 $52,400 6,510 8,100 24.4%
Dental Assistants 5,300 $36,500 5,360 6,170 15.1%Home Health Aides 3,150 $30,390 3,980 5,520 38.7%Dental Hygienists 2,330 $94,250 2,100 2,410 14.8%Physical Therapists 2,160 $97,800 2,130 2,640 23.9%Social and Human Service Assistants
2,120 $36,880 2,710 3,270 20.7%
Medical and Clinical Laboratory Technicians
1,610 $75,050 1,640 2,150 31.1%
Health Technologists and Technicians, Other
N/A $46,550 1,240 1,580 27.4%
Source: California Employment Development Department, Bureau of Labor Statistics, May 2017
Source: California Employment Development Department, May 2017
Salary increases suggest that skilled Healthcare workers are in high demand. Physical Therapists, for example, had average salaries of $97,800 in 2016, followed by Dental Hygienists with $94,250 and Registered Nurses with $88,760, all substantially above the county average. In addition, each of these occupations is expected to see at least 14 percent growth in employment by 2024.
Orange County Year-Over-Year Change in Healthcare Employment
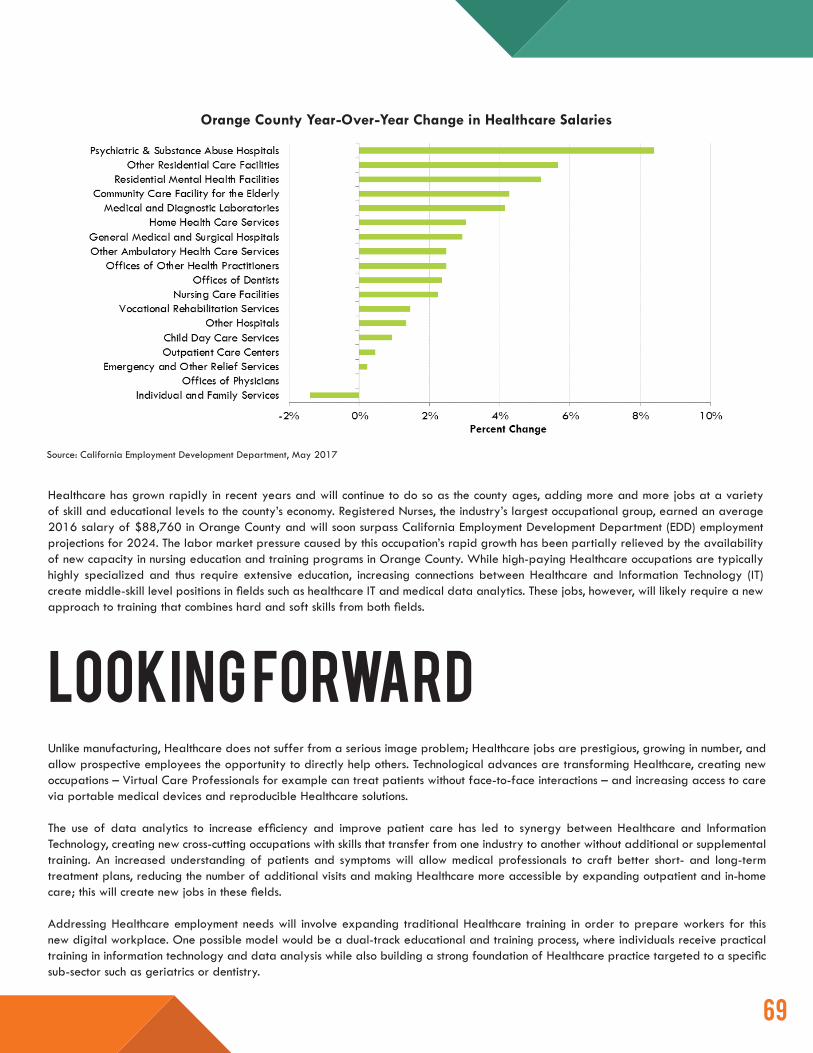
6969
Healthcare has grown rapidly in recent years and will continue to do so as the county ages, adding more and more jobs at a variety of skill and educational levels to the county’s economy. Registered Nurses, the industry’s largest occupational group, earned an average 2016 salary of $88,760 in Orange County and will soon surpass California Employment Development Department (EDD) employment projections for 2024. The labor market pressure caused by this occupation’s rapid growth has been partially relieved by the availability of new capacity in nursing education and training programs in Orange County. While high-paying Healthcare occupations are typically highly specialized and thus require extensive education, increasing connections between Healthcare and Information Technology (IT) create middle-skill level positions in fields such as healthcare IT and medical data analytics. These jobs, however, will likely require a new approach to training that combines hard and soft skills from both fields.
Looking ForwardUnlike manufacturing, Healthcare does not suffer from a serious image problem; Healthcare jobs are prestigious, growing in number, and allow prospective employees the opportunity to directly help others. Technological advances are transforming Healthcare, creating new occupations – Virtual Care Professionals for example can treat patients without face-to-face interactions – and increasing access to care via portable medical devices and reproducible Healthcare solutions.
The use of data analytics to increase efficiency and improve patient care has led to synergy between Healthcare and Information Technology, creating new cross-cutting occupations with skills that transfer from one industry to another without additional or supplemental training. An increased understanding of patients and symptoms will allow medical professionals to craft better short- and long-term treatment plans, reducing the number of additional visits and making Healthcare more accessible by expanding outpatient and in-home care; this will create new jobs in these fields.
Addressing Healthcare employment needs will involve expanding traditional Healthcare training in order to prepare workers for this new digital workplace. One possible model would be a dual-track educational and training process, where individuals receive practical training in information technology and data analysis while also building a strong foundation of Healthcare practice targeted to a specific sub-sector such as geriatrics or dentistry.
Source: California Employment Development Department, May 2017
Orange County Year-Over-Year Change in Healthcare Salaries
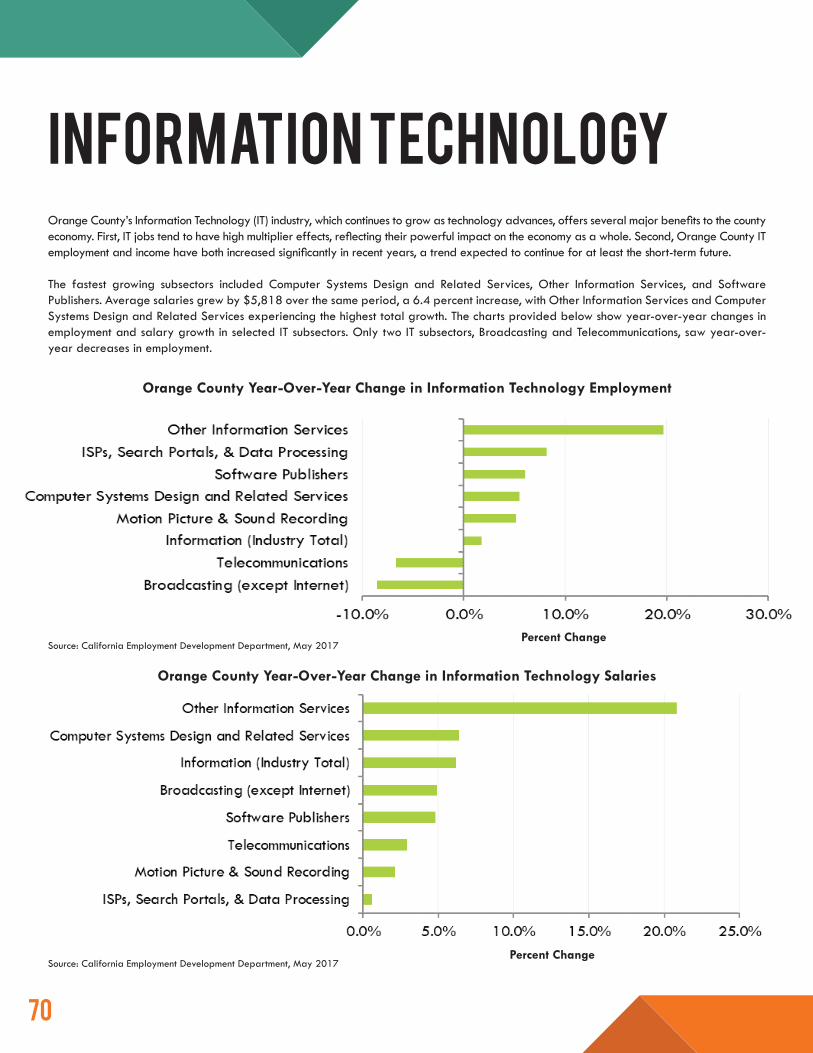
7070
Information TechnologyOrange County’s Information Technology (IT) industry, which continues to grow as technology advances, offers several major benefits to the county economy. First, IT jobs tend to have high multiplier effects, reflecting their powerful impact on the economy as a whole. Second, Orange County IT employment and income have both increased significantly in recent years, a trend expected to continue for at least the short-term future.
The fastest growing subsectors included Computer Systems Design and Related Services, Other Information Services, and Software Publishers. Average salaries grew by $5,818 over the same period, a 6.4 percent increase, with Other Information Services and Computer Systems Design and Related Services experiencing the highest total growth. The charts provided below show year-over-year changes in employment and salary growth in selected IT subsectors. Only two IT subsectors, Broadcasting and Telecommunications, saw year-over-year decreases in employment.
Source: California Employment Development Department, May 2017
Source: California Employment Development Department, May 2017
Orange County Year-Over-Year Change in Information Technology Employment
Orange County Year-Over-Year Change in Information Technology Salaries
Percent Change
Percent Change
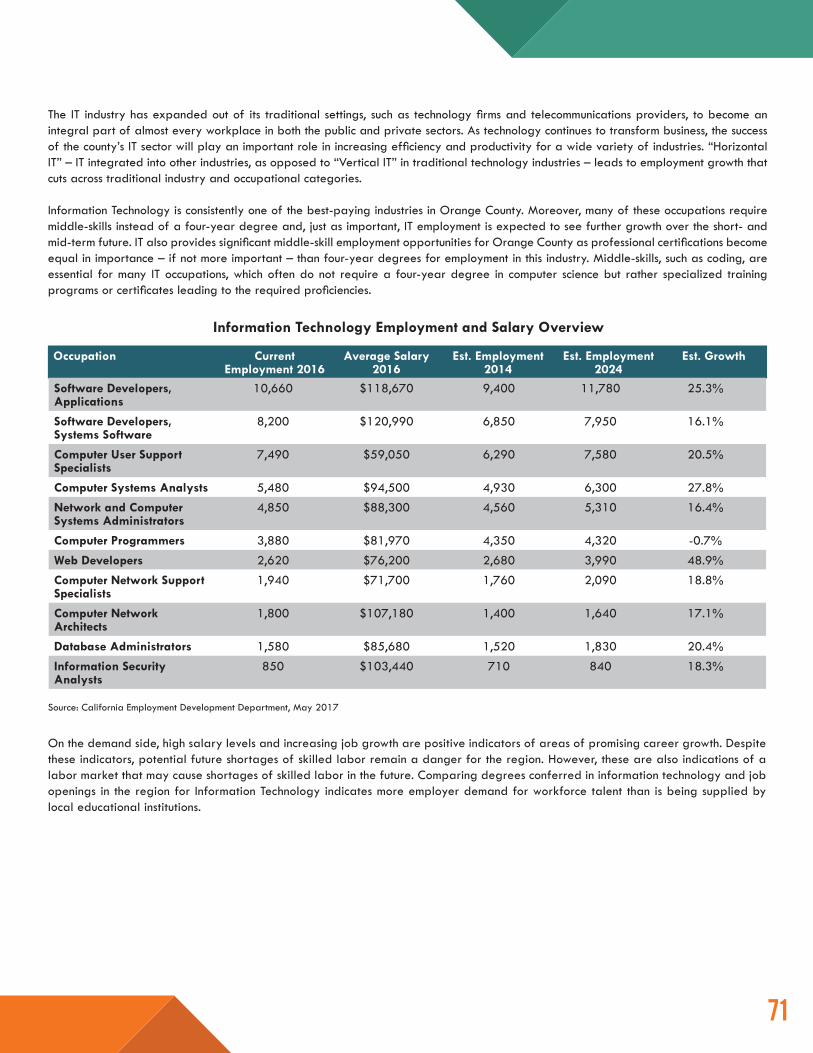
7171
The IT industry has expanded out of its traditional settings, such as technology firms and telecommunications providers, to become an integral part of almost every workplace in both the public and private sectors. As technology continues to transform business, the success of the county’s IT sector will play an important role in increasing efficiency and productivity for a wide variety of industries. “Horizontal IT” – IT integrated into other industries, as opposed to “Vertical IT” in traditional technology industries – leads to employment growth that cuts across traditional industry and occupational categories.
Information Technology is consistently one of the best-paying industries in Orange County. Moreover, many of these occupations require middle-skills instead of a four-year degree and, just as important, IT employment is expected to see further growth over the short- and mid-term future. IT also provides significant middle-skill employment opportunities for Orange County as professional certifications become equal in importance – if not more important – than four-year degrees for employment in this industry. Middle-skills, such as coding, are essential for many IT occupations, which often do not require a four-year degree in computer science but rather specialized training programs or certificates leading to the required proficiencies.
On the demand side, high salary levels and increasing job growth are positive indicators of areas of promising career growth. Despite these indicators, potential future shortages of skilled labor remain a danger for the region. However, these are also indications of a labor market that may cause shortages of skilled labor in the future. Comparing degrees conferred in information technology and job openings in the region for Information Technology indicates more employer demand for workforce talent than is being supplied by local educational institutions.
Occupation Current Employment 2016
Average Salary2016
Est. Employment2014
Est. Employment2024
Est. Growth
Information Technology Employment and Salary Overview
Software Developers, Applications
10,660 $118,670 9,400 11,780 25.3%
Software Developers, Systems Software
8,200 $120,990 6,850 7,950 16.1%
Computer User Support Specialists
7,490 $59,050 6,290 7,580 20.5%
Computer Systems Analysts 5,480 $94,500 4,930 6,300 27.8%Network and Computer Systems Administrators
4,850 $88,300 4,560 5,310 16.4%
Computer Programmers 3,880 $81,970 4,350 4,320 -0.7%Web Developers 2,620 $76,200 2,680 3,990 48.9%Computer Network Support Specialists
1,940 $71,700 1,760 2,090 18.8%
Computer Network Architects
1,800 $107,180 1,400 1,640 17.1%
Database Administrators 1,580 $85,680 1,520 1,830 20.4%Information Security Analysts
850 $103,440 710 840 18.3%
Source: California Employment Development Department, May 2017
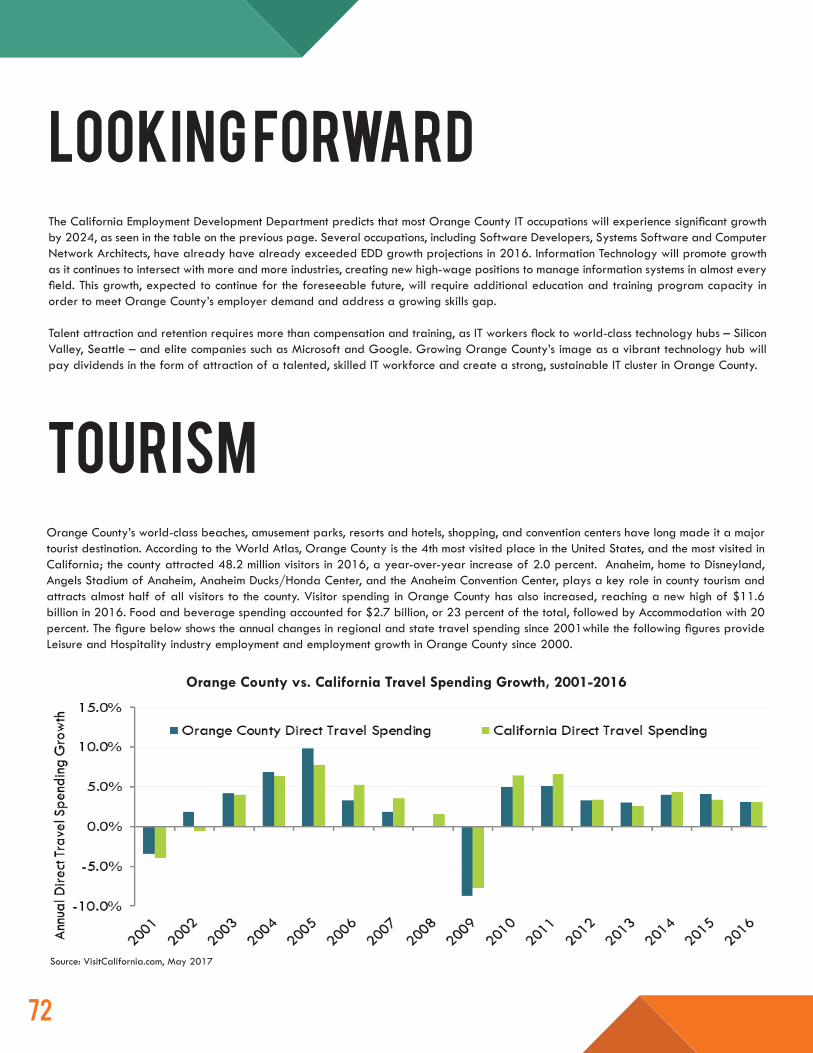
7272
tourismOrange County’s world-class beaches, amusement parks, resorts and hotels, shopping, and convention centers have long made it a major tourist destination. According to the World Atlas, Orange County is the 4th most visited place in the United States, and the most visited in California; the county attracted 48.2 million visitors in 2016, a year-over-year increase of 2.0 percent. Anaheim, home to Disneyland, Angels Stadium of Anaheim, Anaheim Ducks/Honda Center, and the Anaheim Convention Center, plays a key role in county tourism and attracts almost half of all visitors to the county. Visitor spending in Orange County has also increased, reaching a new high of $11.6 billion in 2016. Food and beverage spending accounted for $2.7 billion, or 23 percent of the total, followed by Accommodation with 20 percent. The figure below shows the annual changes in regional and state travel spending since 2001while the following figures provide Leisure and Hospitality industry employment and employment growth in Orange County since 2000.
Source: VisitCalifornia.com, May 2017
Orange County vs. California Travel Spending Growth, 2001-2016
looking forwardThe California Employment Development Department predicts that most Orange County IT occupations will experience significant growth by 2024, as seen in the table on the previous page. Several occupations, including Software Developers, Systems Software and Computer Network Architects, have already have already exceeded EDD growth projections in 2016. Information Technology will promote growth as it continues to intersect with more and more industries, creating new high-wage positions to manage information systems in almost every field. This growth, expected to continue for the foreseeable future, will require additional education and training program capacity in order to meet Orange County’s employer demand and address a growing skills gap.
Talent attraction and retention requires more than compensation and training, as IT workers flock to world-class technology hubs – Silicon Valley, Seattle – and elite companies such as Microsoft and Google. Growing Orange County’s image as a vibrant technology hub will pay dividends in the form of attraction of a talented, skilled IT workforce and create a strong, sustainable IT cluster in Orange County.
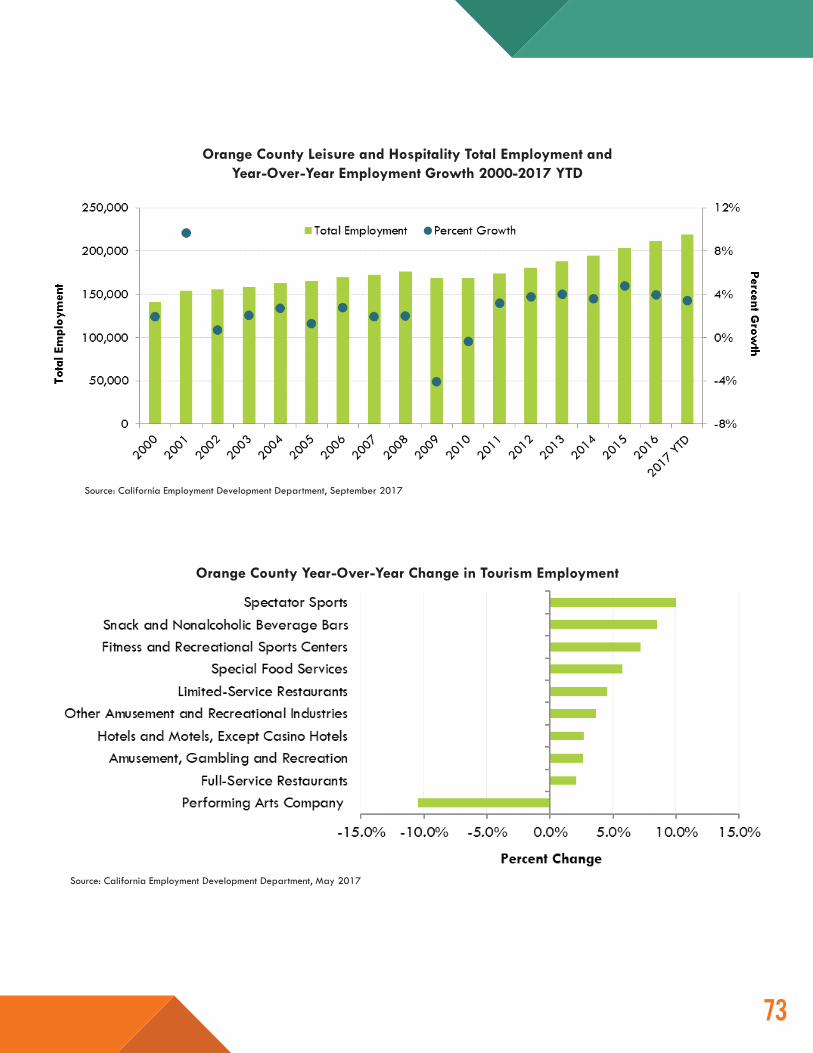
7373
Source: California Employment Development Department, September 2017
Source: California Employment Development Department, May 2017
Orange County Leisure and Hospitality Total Employment and Year-Over-Year Employment Growth 2000-2017 YTD
Orange County Year-Over-Year Change in Tourism Employment
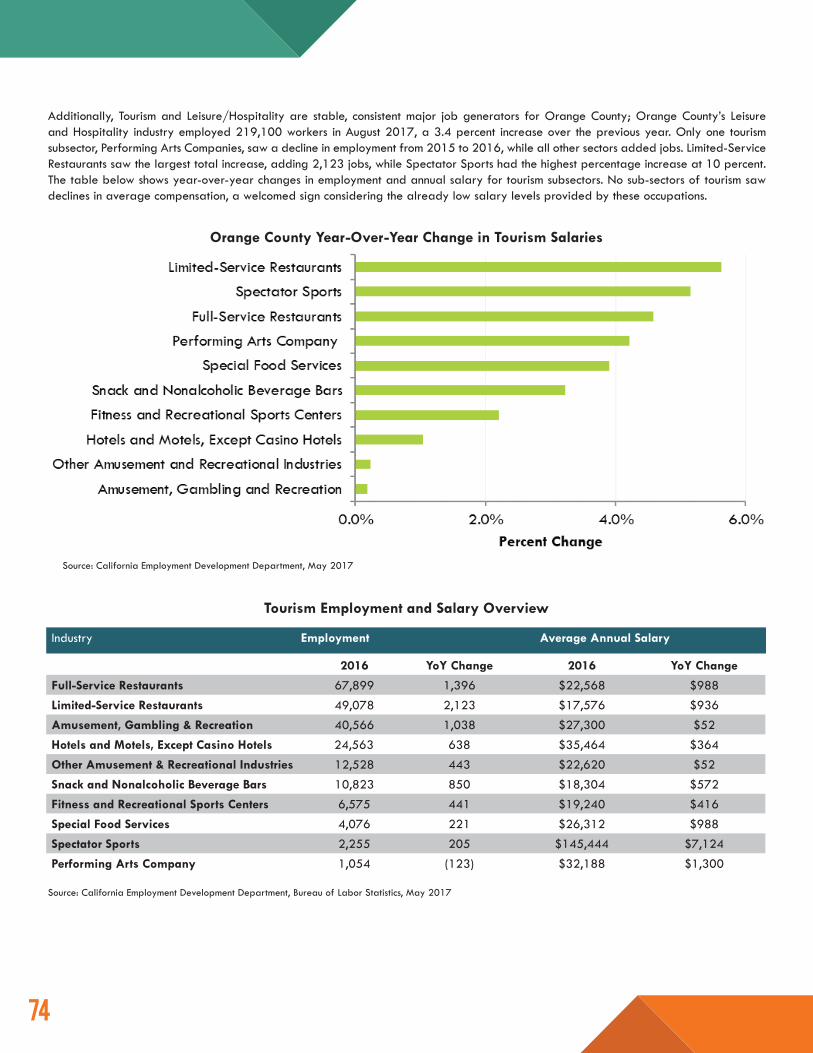
7474
Additionally, Tourism and Leisure/Hospitality are stable, consistent major job generators for Orange County; Orange County’s Leisure and Hospitality industry employed 219,100 workers in August 2017, a 3.4 percent increase over the previous year. Only one tourism subsector, Performing Arts Companies, saw a decline in employment from 2015 to 2016, while all other sectors added jobs. Limited-Service Restaurants saw the largest total increase, adding 2,123 jobs, while Spectator Sports had the highest percentage increase at 10 percent. The table below shows year-over-year changes in employment and annual salary for tourism subsectors. No sub-sectors of tourism saw declines in average compensation, a welcomed sign considering the already low salary levels provided by these occupations.
Orange County Year-Over-Year Change in Tourism Salaries
Industry Employment Average Annual Salary
2016 YoY Change 2016 YoY Change
Full-Service Restaurants 67,899 1,396 $22,568 $988Limited-Service Restaurants 49,078 2,123 $17,576 $936Amusement, Gambling & Recreation 40,566 1,038 $27,300 $52Hotels and Motels, Except Casino Hotels 24,563 638 $35,464 $364Other Amusement & Recreational Industries 12,528 443 $22,620 $52Snack and Nonalcoholic Beverage Bars 10,823 850 $18,304 $572Fitness and Recreational Sports Centers 6,575 441 $19,240 $416Special Food Services 4,076 221 $26,312 $988Spectator Sports 2,255 205 $145,444 $7,124Performing Arts Company 1,054 (123) $32,188 $1,300
Source: California Employment Development Department, Bureau of Labor Statistics, May 2017
Source: California Employment Development Department, May 2017
Tourism Employment and Salary Overview
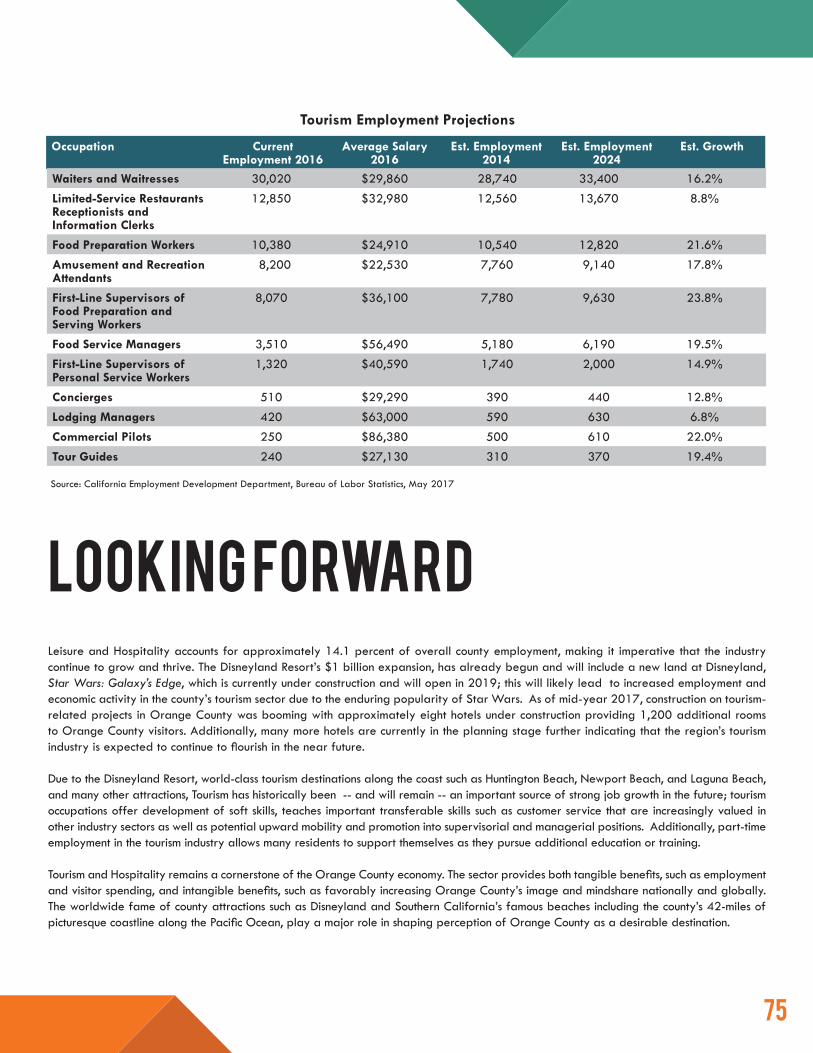
7575
looking forwardLeisure and Hospitality accounts for approximately 14.1 percent of overall county employment, making it imperative that the industry continue to grow and thrive. The Disneyland Resort’s $1 billion expansion, has already begun and will include a new land at Disneyland, Star Wars: Galaxy’s Edge, which is currently under construction and will open in 2019; this will likely lead to increased employment and economic activity in the county’s tourism sector due to the enduring popularity of Star Wars. As of mid-year 2017, construction on tourism-related projects in Orange County was booming with approximately eight hotels under construction providing 1,200 additional rooms to Orange County visitors. Additionally, many more hotels are currently in the planning stage further indicating that the region’s tourism industry is expected to continue to flourish in the near future.
Due to the Disneyland Resort, world-class tourism destinations along the coast such as Huntington Beach, Newport Beach, and Laguna Beach, and many other attractions, Tourism has historically been -- and will remain -- an important source of strong job growth in the future; tourism occupations offer development of soft skills, teaches important transferable skills such as customer service that are increasingly valued in other industry sectors as well as potential upward mobility and promotion into supervisorial and managerial positions. Additionally, part-time employment in the tourism industry allows many residents to support themselves as they pursue additional education or training.
Tourism and Hospitality remains a cornerstone of the Orange County economy. The sector provides both tangible benefits, such as employment and visitor spending, and intangible benefits, such as favorably increasing Orange County’s image and mindshare nationally and globally. The worldwide fame of county attractions such as Disneyland and Southern California’s famous beaches including the county’s 42-miles of picturesque coastline along the Pacific Ocean, play a major role in shaping perception of Orange County as a desirable destination.
Occupation Current Employment 2016
Average Salary2016
Est. Employment2014
Est. Employment2024
Est. Growth
Waiters and Waitresses 30,020 $29,860 28,740 33,400 16.2%Limited-Service Restaurants Receptionists and Information Clerks
12,850 $32,980 12,560 13,670 8.8%
Food Preparation Workers 10,380 $24,910 10,540 12,820 21.6%Amusement and Recreation Attendants
8,200 $22,530 7,760 9,140 17.8%
First-Line Supervisors of Food Preparation and Serving Workers
8,070 $36,100 7,780 9,630 23.8%
Food Service Managers 3,510 $56,490 5,180 6,190 19.5%First-Line Supervisors of Personal Service Workers
1,320 $40,590 1,740 2,000 14.9%
Concierges 510 $29,290 390 440 12.8%Lodging Managers 420 $63,000 590 630 6.8%Commercial Pilots 250 $86,380 500 610 22.0%Tour Guides 240 $27,130 310 370 19.4%
Tourism Employment Projections
Source: California Employment Development Department, Bureau of Labor Statistics, May 2017
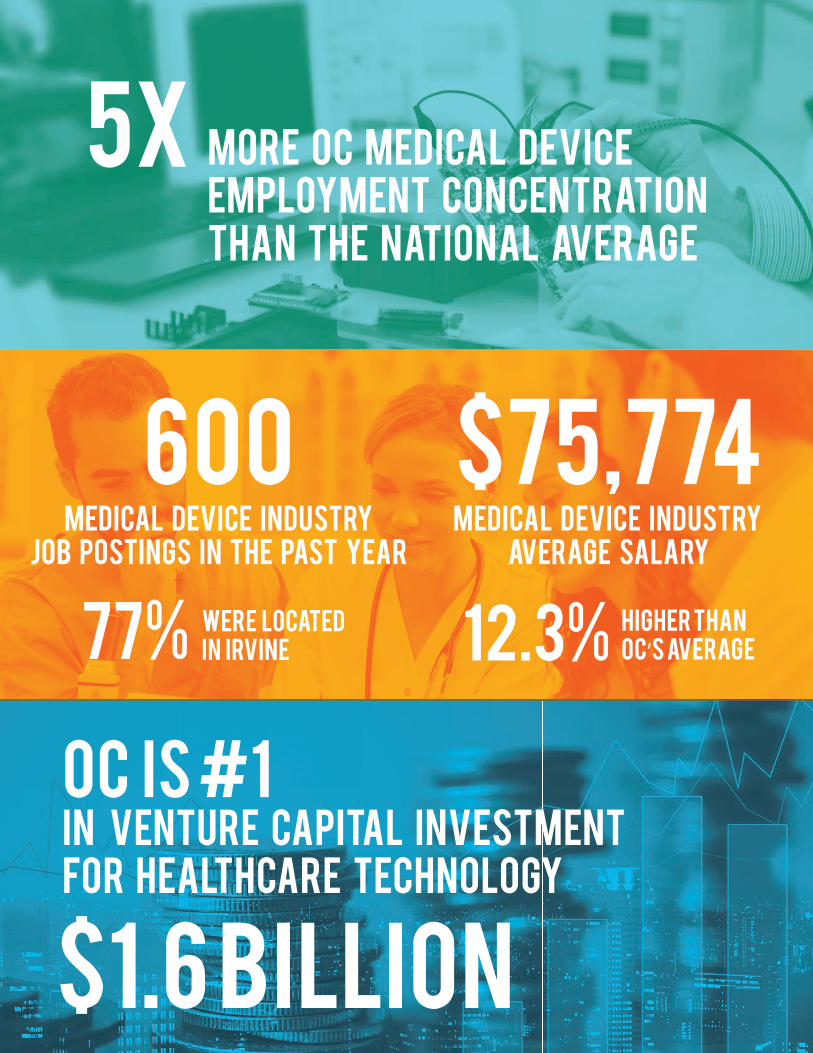
7676
5x
$1.6 billion
600medical device industry
job postings in the past year
MORE OC MEDICAL DEVICE EMPLOYMENT CONCENTRATION THAN THE NATIONAL AVERAGE
77% were located in irvine
$75,774medical device industry
average salary
12.3% higher than oc’s average
oc is #1 in venture capITAl investment for healthcare technology
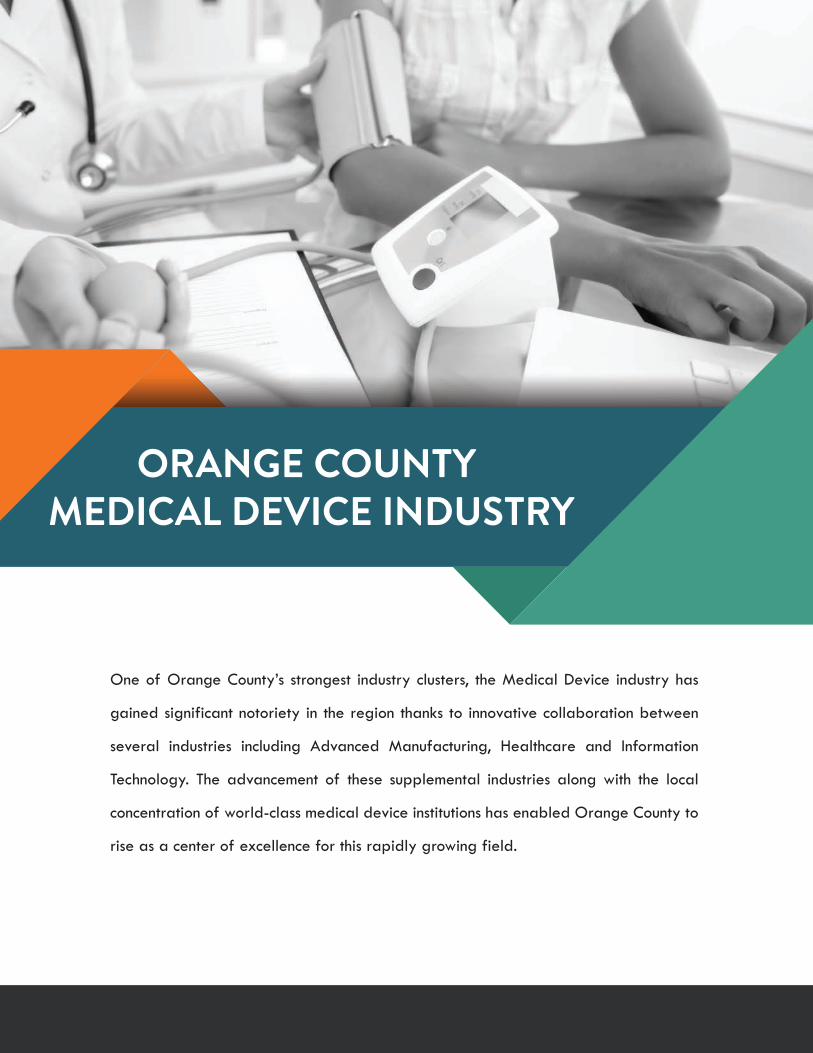
7777
ORANGE COUNTY MEDICAL DEVICE INDUSTRY
One of Orange County’s strongest industry clusters, the Medical Device industry has
gained significant notoriety in the region thanks to innovative collaboration between
several industries including Advanced Manufacturing, Healthcare and Information
Technology. The advancement of these supplemental industries along with the local
concentration of world-class medical device institutions has enabled Orange County to
rise as a center of excellence for this rapidly growing field.
7878
OC's Medical Device Industry introductionOrange County’s Medical Device industry, a product of the county’s strengths in Advanced Manufacturing, Healthcare, and Information Technology, has grown into one of the nation’s (and world’s) strongest industry cluster hubs and centers of excellence in this rapidly growing field, employing approximately 7.5 percent of medical device workers in the U.S. with only slightly over 1 percent of the nation’s overall labor force. World-class medical device manufacturers based in Orange County include:
• Allergan• Edwards Lifesciences• Alliance Medical Products• B. Braun Medical Inc.• Beckman Coulter• J&J AMO• Alcon Research
The success of these companies reflects the cluster’s regional competitiveness. Orange County’s Medical Device cluster has the nation’s top location quotient, which measures an industry’s concentration in a given area compared to the national average. U.S. Cluster Mapping, a project led by Harvard Business School’s Institute for Strategy and Competitiveness and funded by the U.S. Department of Commerce’s Economic Development Administration, measures this industry’s Orange County location quotient at 5.54, meaning that it is about five and a half times more concentrated in Orange County than in the nation as a whole; the Medical Device industry is by far Orange County’s most concentrated industry cluster.
In particular, Orange County’s innovative university research and development (R&D) programs and strong Advanced Manufacturing, Medical Device, and Pharmaceutical industry clusters have combined to make Ophthalmic Goods Manufacturing a thriving, rapidly expanding subsector of the medical device industry. This highly supportive environment of innovation, in fact, has allowed Orange County Ophthalmic Goods manufacturing to flourish in the region, expanding rapidly to become a world-class center of excellence.
According to EconoVue/Dun & Bradstreet, total county employment in the Medical Device industry reached 20,573 in 2016, a 5.3 percent increase over the previous year and a 28 percent increase since 2012. The table on the following page provides an overview of industry subsectors in Orange County.
Orange County had more than 600 Medical Device industry job postings in the past year, with 77 percent of these postings in Irvine. When compared to other industries, Medical Device jobs require relatively high educational requirements; 58.9 percent of job postings required a Bachelor’s degree, with 21.7 percent requiring a Master’s degree. The sub-sector’s average salary, $75,774, is 12.3 percent higher than Orange County’s average cluster salary of $67,416.
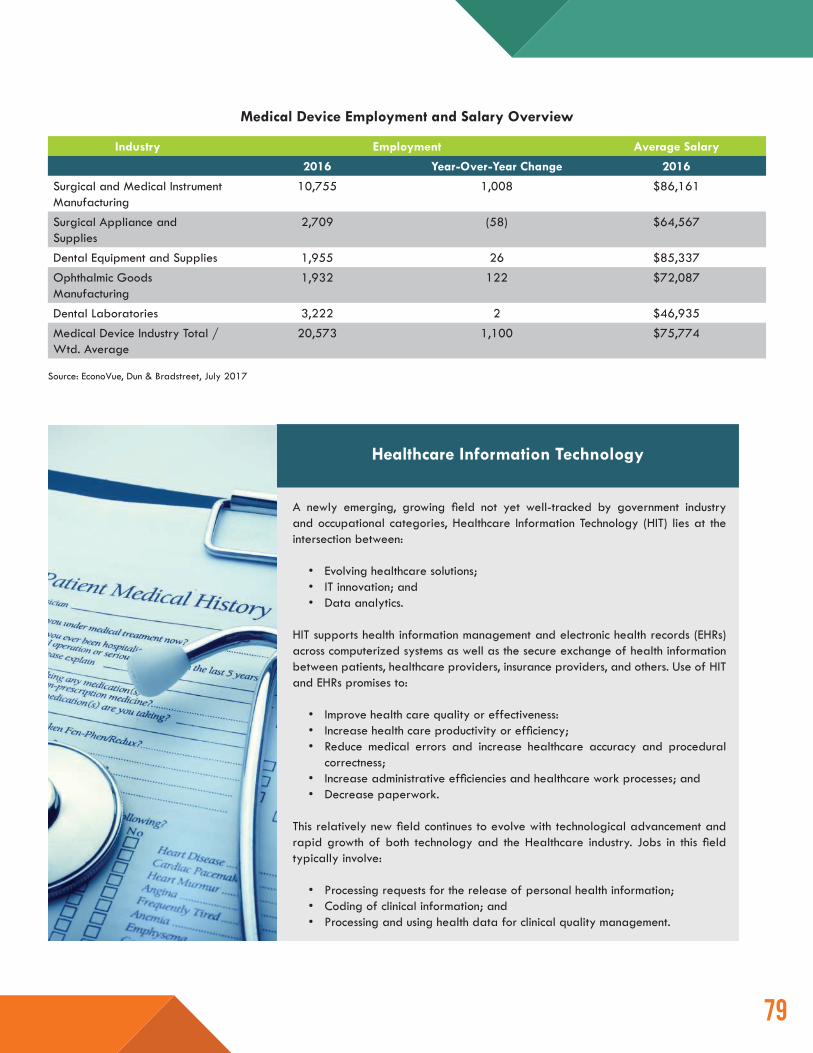
7979
Industry Employment Average Salary
2016 Year-Over-Year Change 2016
Surgical and Medical Instrument Manufacturing
10,755 1,008 $86,161
Surgical Appliance and Supplies
2,709 (58) $64,567
Dental Equipment and Supplies 1,955 26 $85,337Ophthalmic Goods Manufacturing
1,932 122 $72,087
Dental Laboratories 3,222 2 $46,935Medical Device Industry Total / Wtd. Average
20,573 1,100 $75,774
Medical Device Employment and Salary Overview
Source: EconoVue, Dun & Bradstreet, July 2017
A newly emerging, growing field not yet well-tracked by government industry and occupational categories, Healthcare Information Technology (HIT) lies at the intersection between:
• Evolving healthcare solutions;• IT innovation; and• Data analytics.
HIT supports health information management and electronic health records (EHRs) across computerized systems as well as the secure exchange of health information between patients, healthcare providers, insurance providers, and others. Use of HIT and EHRs promises to:
• Improve health care quality or effectiveness:• Increase health care productivity or efficiency;• Reduce medical errors and increase healthcare accuracy and procedural
correctness;• Increase administrative efficiencies and healthcare work processes; and• Decrease paperwork.
This relatively new field continues to evolve with technological advancement and rapid growth of both technology and the Healthcare industry. Jobs in this field typically involve:
• Processing requests for the release of personal health information;• Coding of clinical information; and• Processing and using health data for clinical quality management.
Healthcare Information Technology
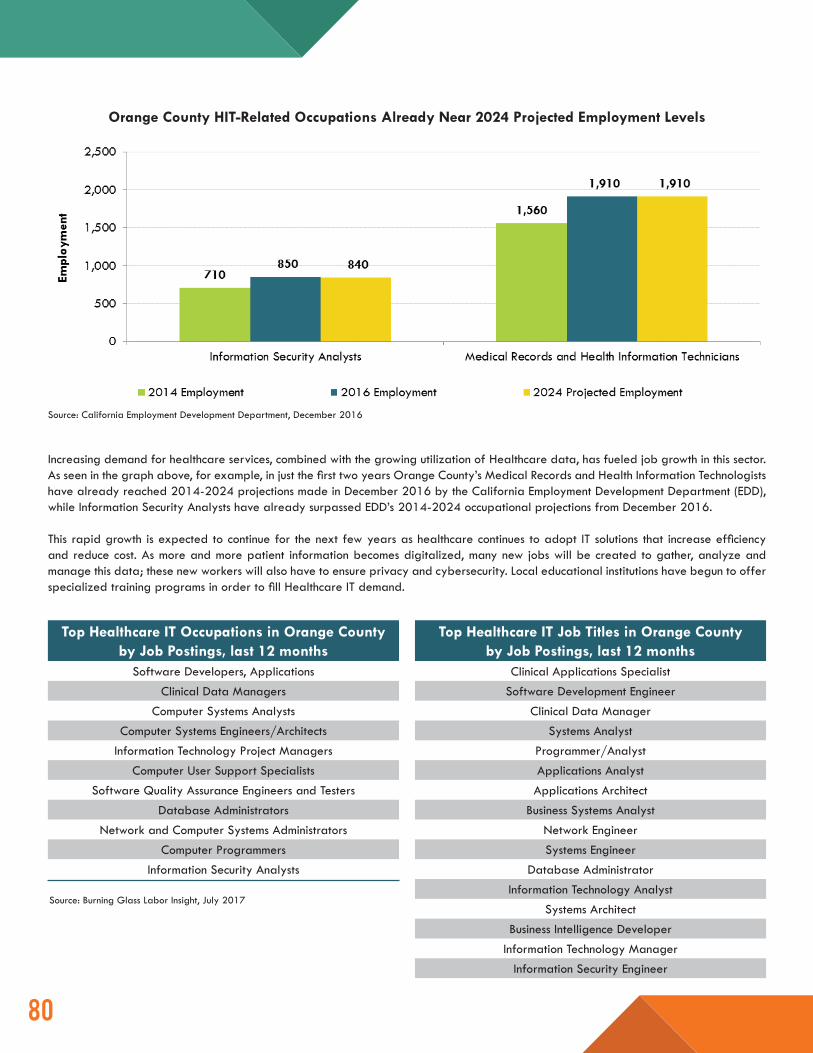
8080
Orange County HIT-Related Occupations Already Near 2024 Projected Employment Levels
Source: California Employment Development Department, December 2016
Increasing demand for healthcare services, combined with the growing utilization of Healthcare data, has fueled job growth in this sector. As seen in the graph above, for example, in just the first two years Orange County’s Medical Records and Health Information Technologists have already reached 2014-2024 projections made in December 2016 by the California Employment Development Department (EDD), while Information Security Analysts have already surpassed EDD’s 2014-2024 occupational projections from December 2016.
This rapid growth is expected to continue for the next few years as healthcare continues to adopt IT solutions that increase efficiency and reduce cost. As more and more patient information becomes digitalized, many new jobs will be created to gather, analyze and manage this data; these new workers will also have to ensure privacy and cybersecurity. Local educational institutions have begun to offer specialized training programs in order to fill Healthcare IT demand.
Top Healthcare IT Occupations in Orange County by Job Postings, last 12 months
Software Developers, ApplicationsClinical Data Managers
Computer Systems AnalystsComputer Systems Engineers/Architects
Information Technology Project ManagersComputer User Support Specialists
Software Quality Assurance Engineers and TestersDatabase Administrators
Network and Computer Systems AdministratorsComputer Programmers
Information Security Analysts
Top Healthcare IT Job Titles in Orange County by Job Postings, last 12 months
Clinical Applications SpecialistSoftware Development Engineer
Clinical Data ManagerSystems Analyst
Programmer/AnalystApplications AnalystApplications Architect
Business Systems AnalystNetwork EngineerSystems Engineer
Database AdministratorInformation Technology Analyst
Systems ArchitectBusiness Intelligence Developer
Information Technology ManagerInformation Security Engineer
Source: Burning Glass Labor Insight, July 2017
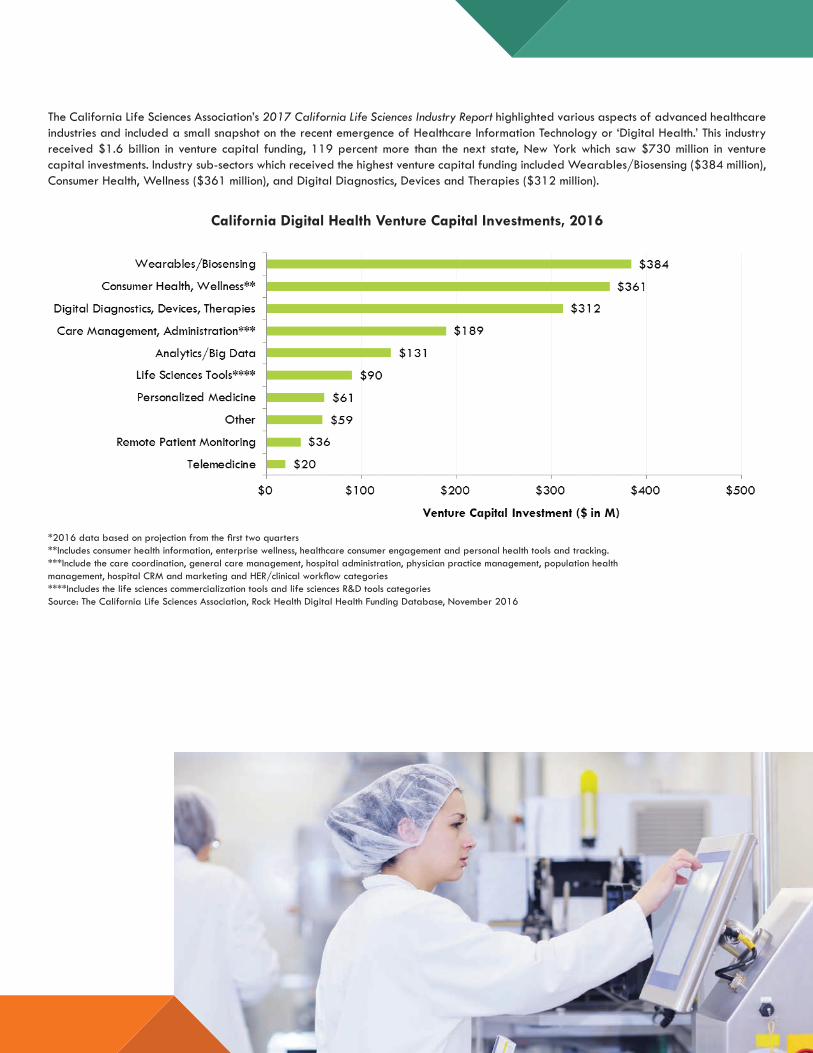
8181
The California Life Sciences Association’s 2017 California Life Sciences Industry Report highlighted various aspects of advanced healthcare industries and included a small snapshot on the recent emergence of Healthcare Information Technology or ‘Digital Health.’ This industry received $1.6 billion in venture capital funding, 119 percent more than the next state, New York which saw $730 million in venture capital investments. Industry sub-sectors which received the highest venture capital funding included Wearables/Biosensing ($384 million), Consumer Health, Wellness ($361 million), and Digital Diagnostics, Devices and Therapies ($312 million).
California Digital Health Venture Capital Investments, 2016
*2016 data based on projection from the first two quarters**Includes consumer health information, enterprise wellness, healthcare consumer engagement and personal health tools and tracking.***Include the care coordination, general care management, hospital administration, physician practice management, population health management, hospital CRM and marketing and HER/clinical workflow categories****Includes the life sciences commercialization tools and life sciences R&D tools categoriesSource: The California Life Sciences Association, Rock Health Digital Health Funding Database, November 2016
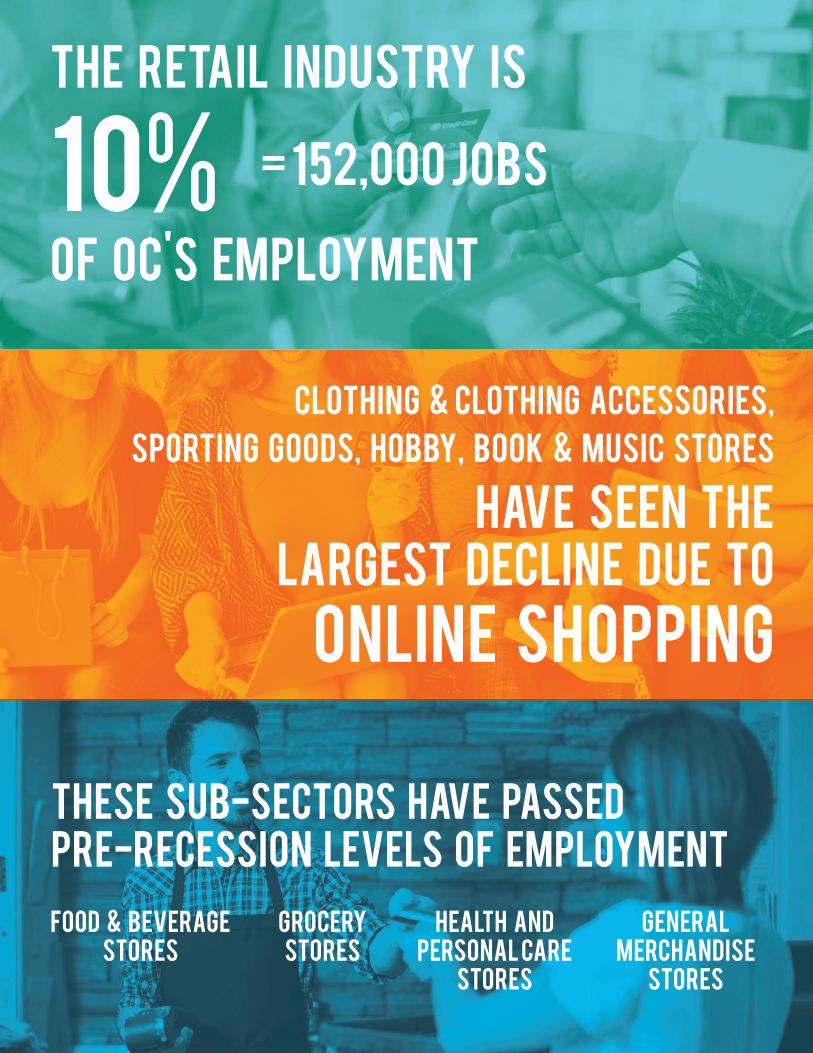
8282
10%of oc's employment
the retail industry is
= 152,000 jobs
These sub-sectors have passed pre-recession levels of employmentfood & beverage
storesGrocery
storesHealth and
personal carestores
generalmerchandise
stores
Clothing & Clothing Accessories,Sporting Goods, Hobby, Book & Music Stores
have seen the largest decline due to
online shopping
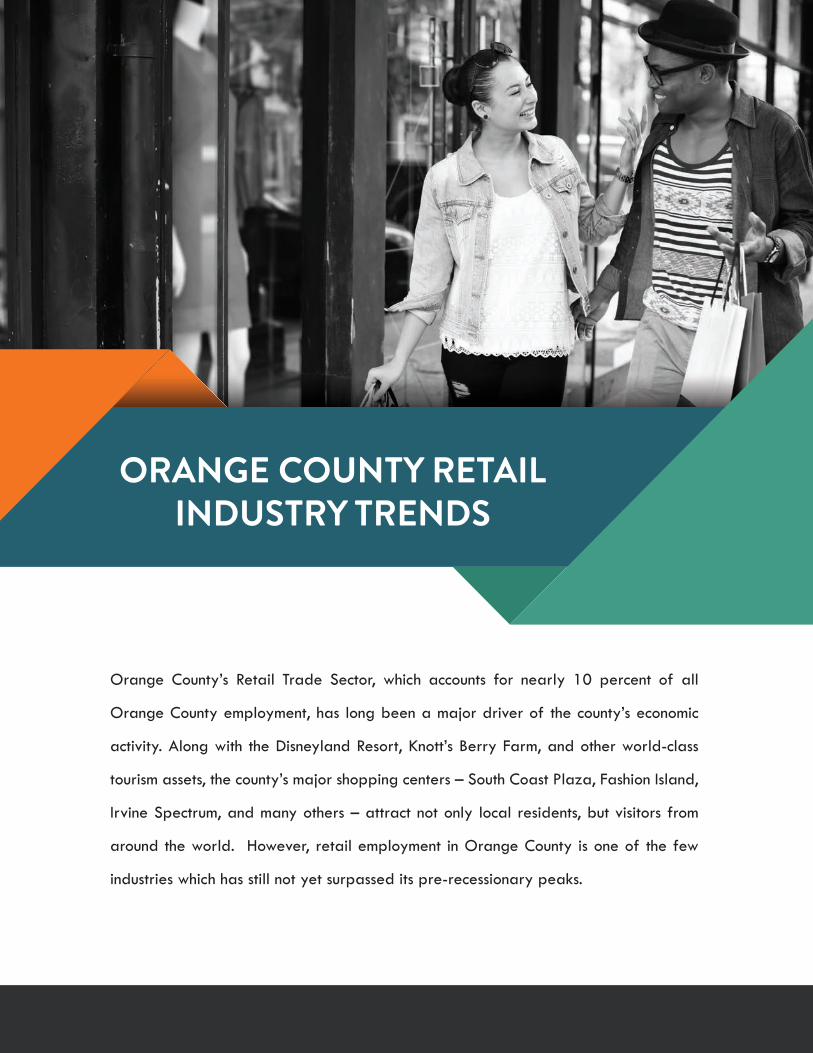
8383
ORANGE COUNTY RETAIL INDUSTRY TRENDS
Orange County’s Retail Trade Sector, which accounts for nearly 10 percent of all
Orange County employment, has long been a major driver of the county’s economic
activity. Along with the Disneyland Resort, Knott’s Berry Farm, and other world-class
tourism assets, the county’s major shopping centers – South Coast Plaza, Fashion Island,
Irvine Spectrum, and many others – attract not only local residents, but visitors from
around the world. However, retail employment in Orange County is one of the few
industries which has still not yet surpassed its pre-recessionary peaks.
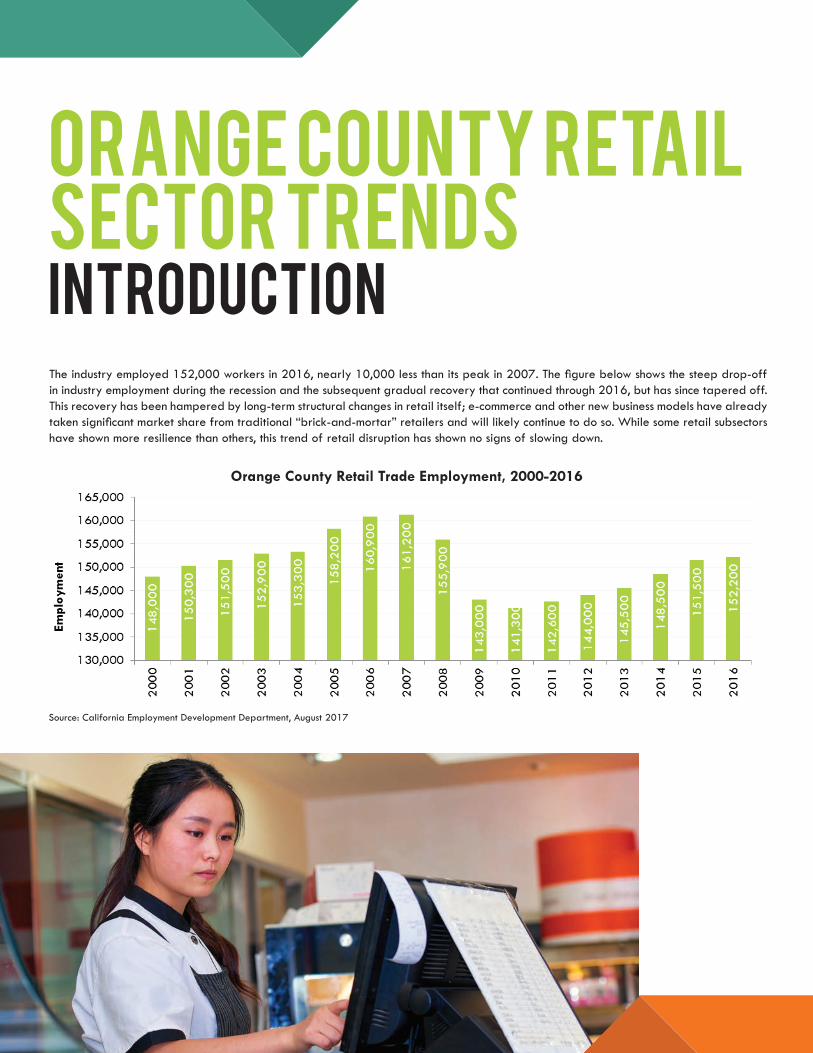
8484
Orange County Retail Sector TrendsIntroductionThe industry employed 152,000 workers in 2016, nearly 10,000 less than its peak in 2007. The figure below shows the steep drop-off in industry employment during the recession and the subsequent gradual recovery that continued through 2016, but has since tapered off. This recovery has been hampered by long-term structural changes in retail itself; e-commerce and other new business models have already taken significant market share from traditional “brick-and-mortar” retailers and will likely continue to do so. While some retail subsectors have shown more resilience than others, this trend of retail disruption has shown no signs of slowing down.
Source: California Employment Development Department, August 2017
Orange County Retail Trade Employment, 2000-2016
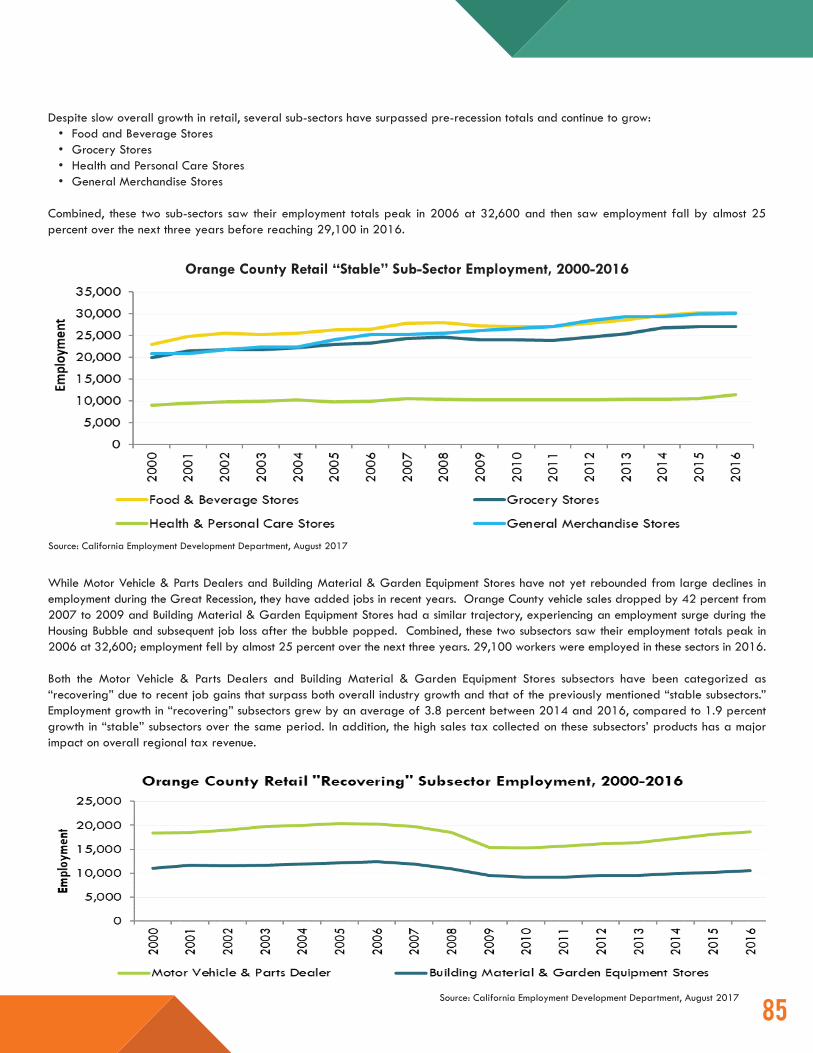
8585
Despite slow overall growth in retail, several sub-sectors have surpassed pre-recession totals and continue to grow: • Food and Beverage Stores• Grocery Stores• Health and Personal Care Stores• General Merchandise Stores
Combined, these two sub-sectors saw their employment totals peak in 2006 at 32,600 and then saw employment fall by almost 25 percent over the next three years before reaching 29,100 in 2016.
Source: California Employment Development Department, August 2017
While Motor Vehicle & Parts Dealers and Building Material & Garden Equipment Stores have not yet rebounded from large declines in employment during the Great Recession, they have added jobs in recent years. Orange County vehicle sales dropped by 42 percent from 2007 to 2009 and Building Material & Garden Equipment Stores had a similar trajectory, experiencing an employment surge during the Housing Bubble and subsequent job loss after the bubble popped. Combined, these two subsectors saw their employment totals peak in 2006 at 32,600; employment fell by almost 25 percent over the next three years. 29,100 workers were employed in these sectors in 2016.
Both the Motor Vehicle & Parts Dealers and Building Material & Garden Equipment Stores subsectors have been categorized as “recovering” due to recent job gains that surpass both overall industry growth and that of the previously mentioned “stable subsectors.” Employment growth in “recovering” subsectors grew by an average of 3.8 percent between 2014 and 2016, compared to 1.9 percent growth in “stable” subsectors over the same period. In addition, the high sales tax collected on these subsectors’ products has a major impact on overall regional tax revenue.
Source: California Employment Development Department, August 2017
Orange County Retail “Stable” Sub-Sector Employment, 2000-2016
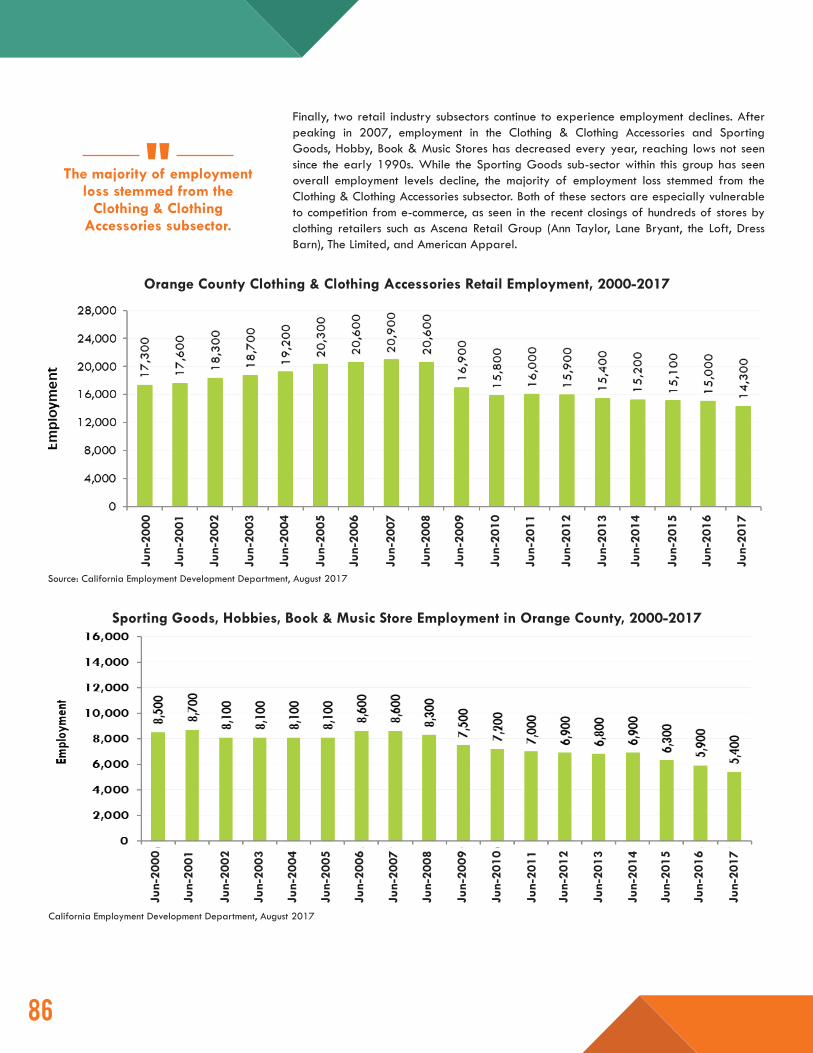
8686
The majority of employment loss stemmed from the
Clothing & Clothing Accessories subsector."
Finally, two retail industry subsectors continue to experience employment declines. After peaking in 2007, employment in the Clothing & Clothing Accessories and Sporting Goods, Hobby, Book & Music Stores has decreased every year, reaching lows not seen since the early 1990s. While the Sporting Goods sub-sector within this group has seen overall employment levels decline, the majority of employment loss stemmed from the Clothing & Clothing Accessories subsector. Both of these sectors are especially vulnerable to competition from e-commerce, as seen in the recent closings of hundreds of stores by clothing retailers such as Ascena Retail Group (Ann Taylor, Lane Bryant, the Loft, Dress Barn), The Limited, and American Apparel.
Orange County Clothing & Clothing Accessories Retail Employment, 2000-2017
Source: California Employment Development Department, August 2017
Sporting Goods, Hobbies, Book & Music Store Employment in Orange County, 2000-2017
California Employment Development Department, August 2017
Jun-
2000
Jun-
2001
Jun-
2011
Jun-
2003
Jun-
2004
Jun-
2005
Jun-
2006
Jun-
2007
Jun-
2008
Jun-
2009
Jun-
2010
Jun-
2002
Jun-
2012
Jun-
2013
Jun-
2014
Jun-
2015
Jun-
2016
Jun-
2017
Jun-
2000
Jun-
2001
Jun-
2011
Jun-
2003
Jun-
2004
Jun-
2005
Jun-
2006
Jun-
2007
Jun-
2008
Jun-
2009
Jun-
2010
Jun-
2002
Jun-
2012
Jun-
2013
Jun-
2014
Jun-
2015
Jun-
2016
Jun-
2017
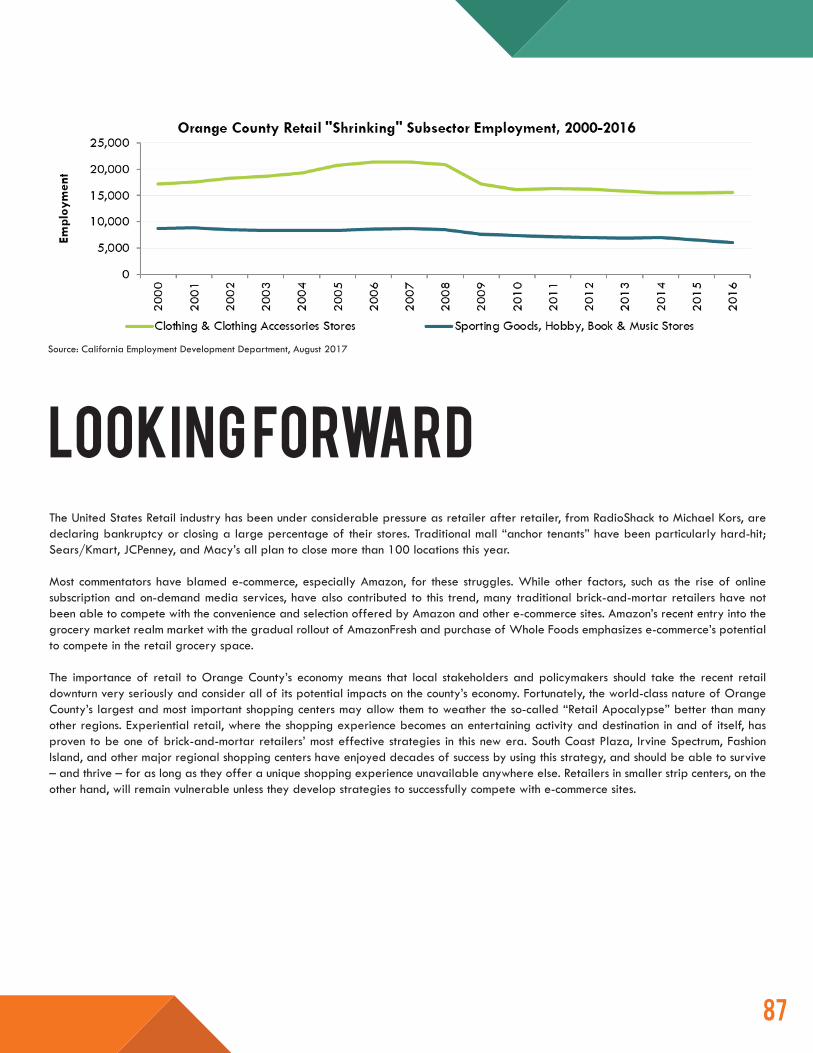
8787
Source: California Employment Development Department, August 2017
Looking ForwardThe United States Retail industry has been under considerable pressure as retailer after retailer, from RadioShack to Michael Kors, are declaring bankruptcy or closing a large percentage of their stores. Traditional mall “anchor tenants” have been particularly hard-hit; Sears/Kmart, JCPenney, and Macy’s all plan to close more than 100 locations this year.
Most commentators have blamed e-commerce, especially Amazon, for these struggles. While other factors, such as the rise of online subscription and on-demand media services, have also contributed to this trend, many traditional brick-and-mortar retailers have not been able to compete with the convenience and selection offered by Amazon and other e-commerce sites. Amazon’s recent entry into the grocery market realm market with the gradual rollout of AmazonFresh and purchase of Whole Foods emphasizes e-commerce’s potential to compete in the retail grocery space.
The importance of retail to Orange County’s economy means that local stakeholders and policymakers should take the recent retail downturn very seriously and consider all of its potential impacts on the county’s economy. Fortunately, the world-class nature of Orange County’s largest and most important shopping centers may allow them to weather the so-called “Retail Apocalypse” better than many other regions. Experiential retail, where the shopping experience becomes an entertaining activity and destination in and of itself, has proven to be one of brick-and-mortar retailers’ most effective strategies in this new era. South Coast Plaza, Irvine Spectrum, Fashion Island, and other major regional shopping centers have enjoyed decades of success by using this strategy, and should be able to survive – and thrive – for as long as they offer a unique shopping experience unavailable anywhere else. Retailers in smaller strip centers, on the other hand, will remain vulnerable unless they develop strategies to successfully compete with e-commerce sites.
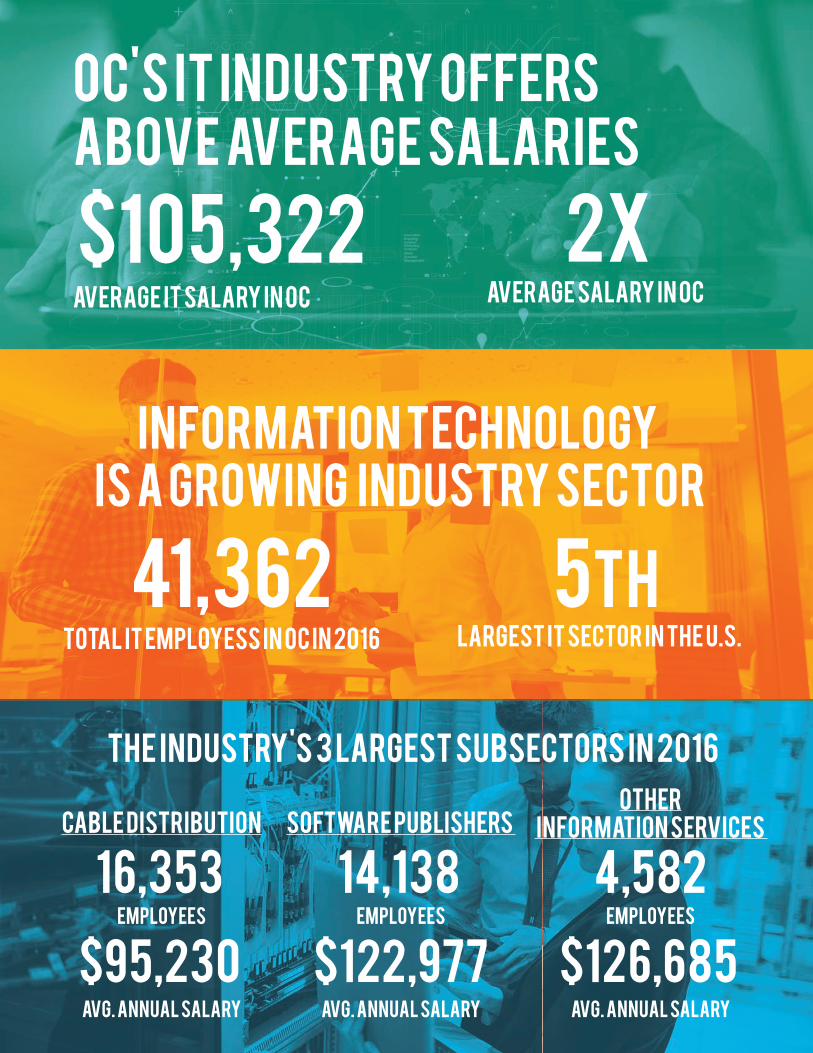
8888
oc's it industry offers above average salaries
information technology is a growing industry sector
The industry's 3 largest subsectors in 2016
$105,322average it salary in oc
41,362 Total IT employess in OC in 2016
5thlargest it sector in the u.s.
2xaverage salary in oc
Cable Distribution Software Publishers Other
Information Services
16,353 employees
$95,230 avg. annual Salary
14,138 employees
$122,977avg. annual Salary
4,582employees
$126,685 avg. annual Salary

8989
THE STATE OF IT ANDCONNECTIVITY IN OC
The continued evolution of technological products and services continues to upend and
disrupt both traditional industries and consumer behavior as has been seen with the
emergence of e-commerce, ridesharing and streaming, on-demand entertainment
services. Integrating itself as an almost basic necessity, broadband access and its
required infrastructure has become increasingly important as it provides local residents
with reliable connectivity to important services and information ranging from
employment searches to mobile banking and medical records.

9090
The State of IT and Connectivity in ocintroductionThe nexus of IT and internet connectivity continues to grow in importance as more and more products and services become available online and can be streamed anytime, anywhere. This, in turn, puts pressure on regions to ensure that current and planned infrastructure can handle increasing internet traffic or create new infrastructure to meet the demand. Entertainment services such as streaming music, television, and movies, for example, have both transformed industries and greatly increased overall web traffic; the rise of e-commerce has also had a similar effect.
In addition to transforming entertainment and retail, increased connectivity has also reshaped crucial services such as searching for a job and even accessing health services such as patient diagnosis and online pharmacies. With unparalleled access and convenience, individuals are now able to pay utility bills or mortgages online, manage their finances on their mobile smartphone, and research new or advanced career opportunities. Further driving home the importance of having state-of-the-art IT infrastructure, this transformation further emphasizes the importance of internet access as a basic service like electricity or running water. For example, cities around the world – including Tel Aviv, Seoul, Osaka, Perth, and Barcelona – have implemented free public Wi-Fi, while closer to home, San Francisco has partnered with Google to turn more than thirty of its public spaces into Wi-Fi hotspots.
The county’s IT industry, and economy in general, must continue to adapt to these changes and “stay ahead of the game” as the online migration of products and services in a world of global connectivity continues to create significant economic opportunities through cycles of innovation, disruption, and adoption.
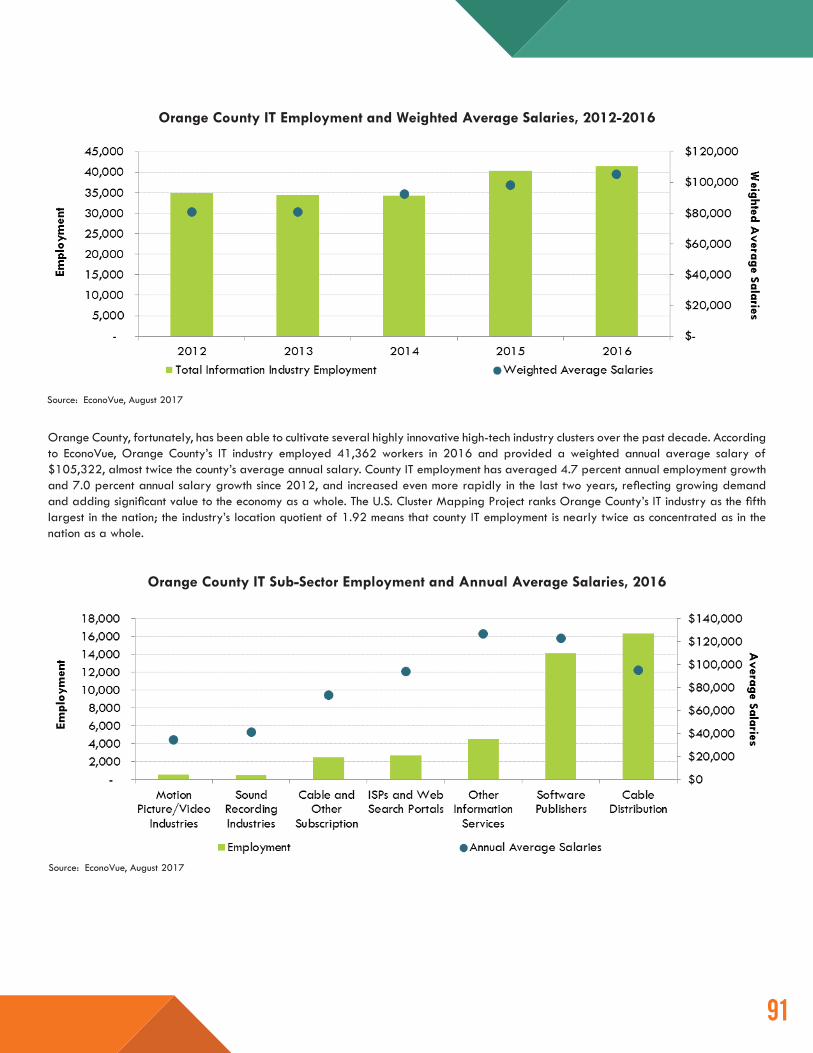
9191
Orange County, fortunately, has been able to cultivate several highly innovative high-tech industry clusters over the past decade. According to EconoVue, Orange County’s IT industry employed 41,362 workers in 2016 and provided a weighted annual average salary of $105,322, almost twice the county’s average annual salary. County IT employment has averaged 4.7 percent annual employment growth and 7.0 percent annual salary growth since 2012, and increased even more rapidly in the last two years, reflecting growing demand and adding significant value to the economy as a whole. The U.S. Cluster Mapping Project ranks Orange County’s IT industry as the fifth largest in the nation; the industry’s location quotient of 1.92 means that county IT employment is nearly twice as concentrated as in the nation as a whole.
Orange County IT Sub-Sector Employment and Annual Average Salaries, 2016
Source: EconoVue, August 2017
Orange County IT Employment and Weighted Average Salaries, 2012-2016
Source: EconoVue, August 2017
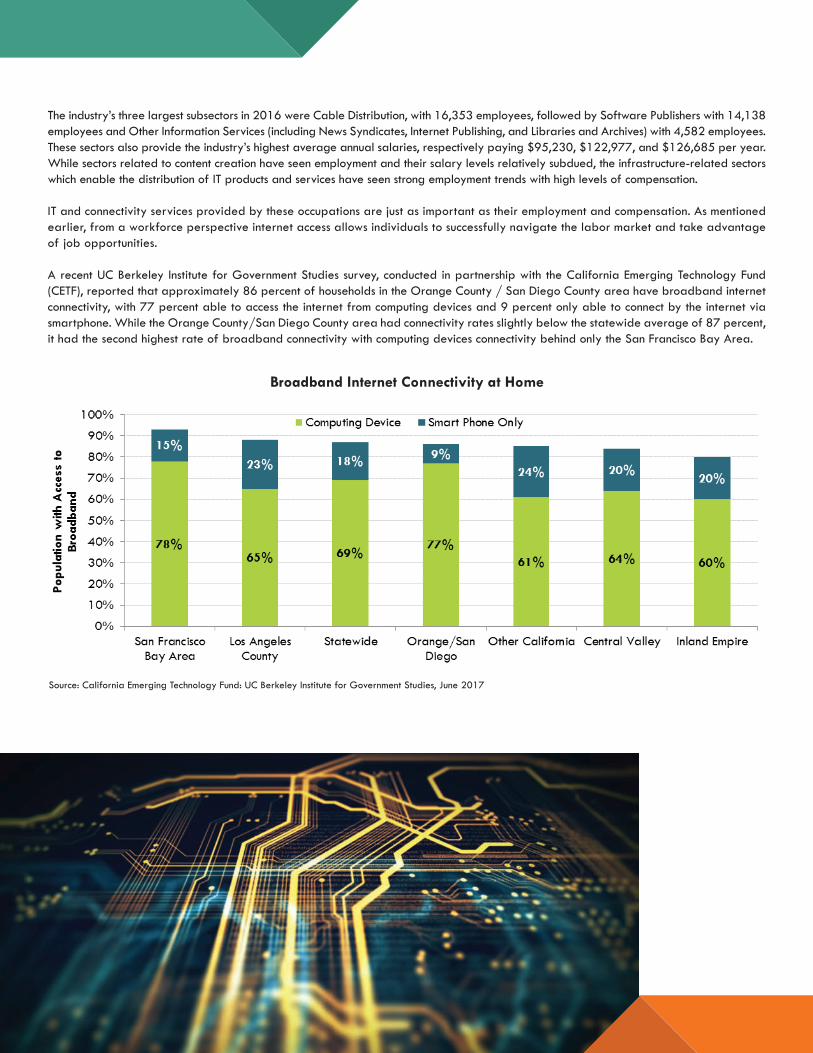
9292
Broadband Internet Connectivity at Home
Source: California Emerging Technology Fund: UC Berkeley Institute for Government Studies, June 2017
The industry’s three largest subsectors in 2016 were Cable Distribution, with 16,353 employees, followed by Software Publishers with 14,138 employees and Other Information Services (including News Syndicates, Internet Publishing, and Libraries and Archives) with 4,582 employees. These sectors also provide the industry’s highest average annual salaries, respectively paying $95,230, $122,977, and $126,685 per year. While sectors related to content creation have seen employment and their salary levels relatively subdued, the infrastructure-related sectors which enable the distribution of IT products and services have seen strong employment trends with high levels of compensation.
IT and connectivity services provided by these occupations are just as important as their employment and compensation. As mentioned earlier, from a workforce perspective internet access allows individuals to successfully navigate the labor market and take advantage of job opportunities.
A recent UC Berkeley Institute for Government Studies survey, conducted in partnership with the California Emerging Technology Fund (CETF), reported that approximately 86 percent of households in the Orange County / San Diego County area have broadband internet connectivity, with 77 percent able to access the internet from computing devices and 9 percent only able to connect by the internet via smartphone. While the Orange County/San Diego County area had connectivity rates slightly below the statewide average of 87 percent, it had the second highest rate of broadband connectivity with computing devices connectivity behind only the San Francisco Bay Area.
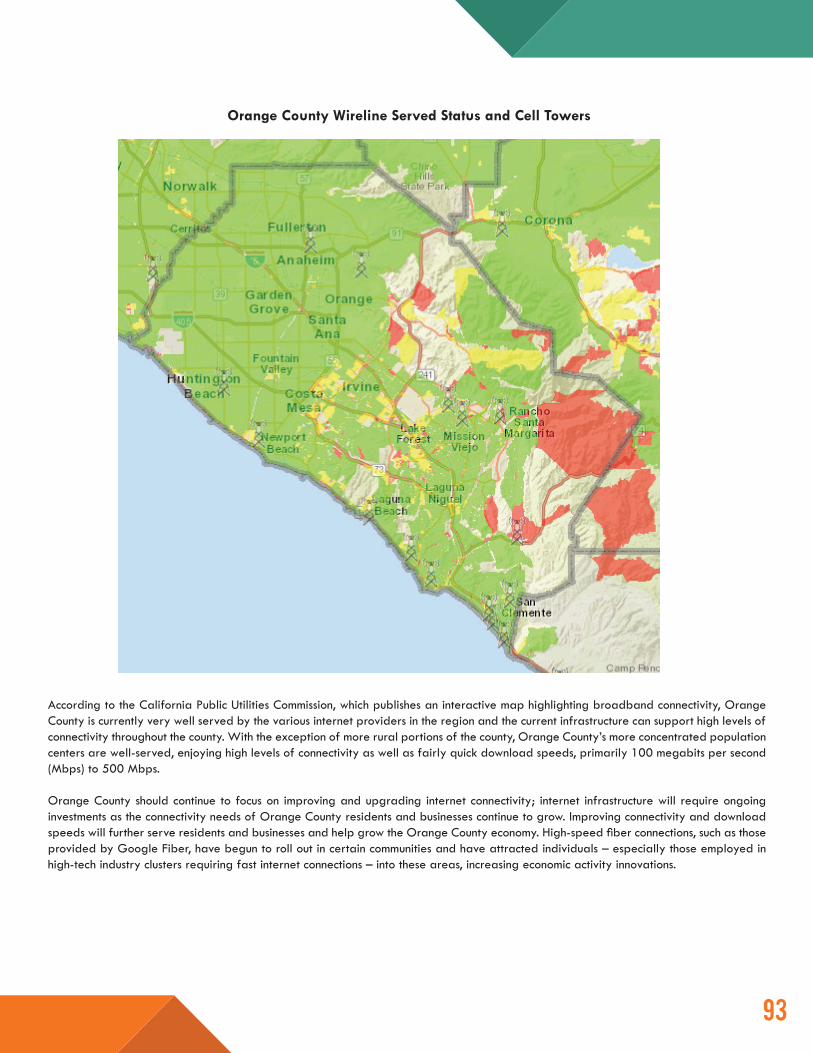
9393
Orange County Wireline Served Status and Cell Towers
According to the California Public Utilities Commission, which publishes an interactive map highlighting broadband connectivity, Orange County is currently very well served by the various internet providers in the region and the current infrastructure can support high levels of connectivity throughout the county. With the exception of more rural portions of the county, Orange County’s more concentrated population centers are well-served, enjoying high levels of connectivity as well as fairly quick download speeds, primarily 100 megabits per second (Mbps) to 500 Mbps.
Orange County should continue to focus on improving and upgrading internet connectivity; internet infrastructure will require ongoing investments as the connectivity needs of Orange County residents and businesses continue to grow. Improving connectivity and download speeds will further serve residents and businesses and help grow the Orange County economy. High-speed fiber connections, such as those provided by Google Fiber, have begun to roll out in certain communities and have attracted individuals – especially those employed in high-tech industry clusters requiring fast internet connections – into these areas, increasing economic activity innovations.
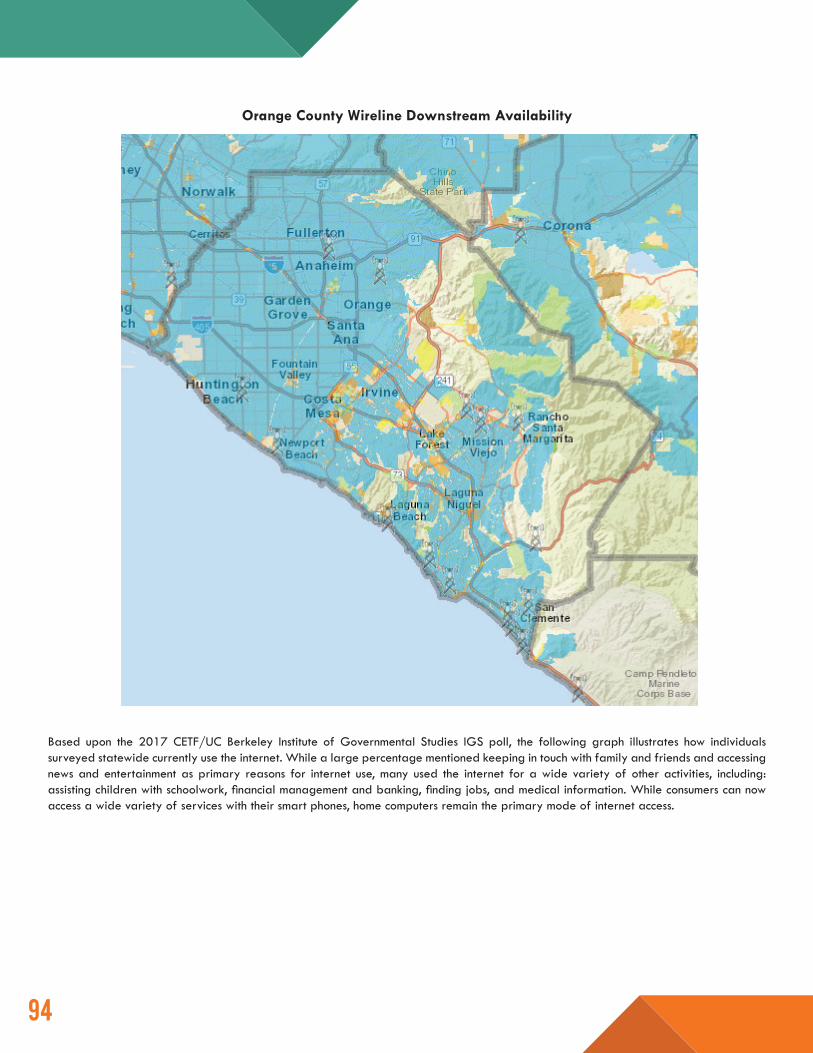
9494
Orange County Wireline Downstream Availability
Based upon the 2017 CETF/UC Berkeley Institute of Governmental Studies IGS poll, the following graph illustrates how individuals surveyed statewide currently use the internet. While a large percentage mentioned keeping in touch with family and friends and accessing news and entertainment as primary reasons for internet use, many used the internet for a wide variety of other activities, including: assisting children with schoolwork, financial management and banking, finding jobs, and medical information. While consumers can now access a wide variety of services with their smart phones, home computers remain the primary mode of internet access.
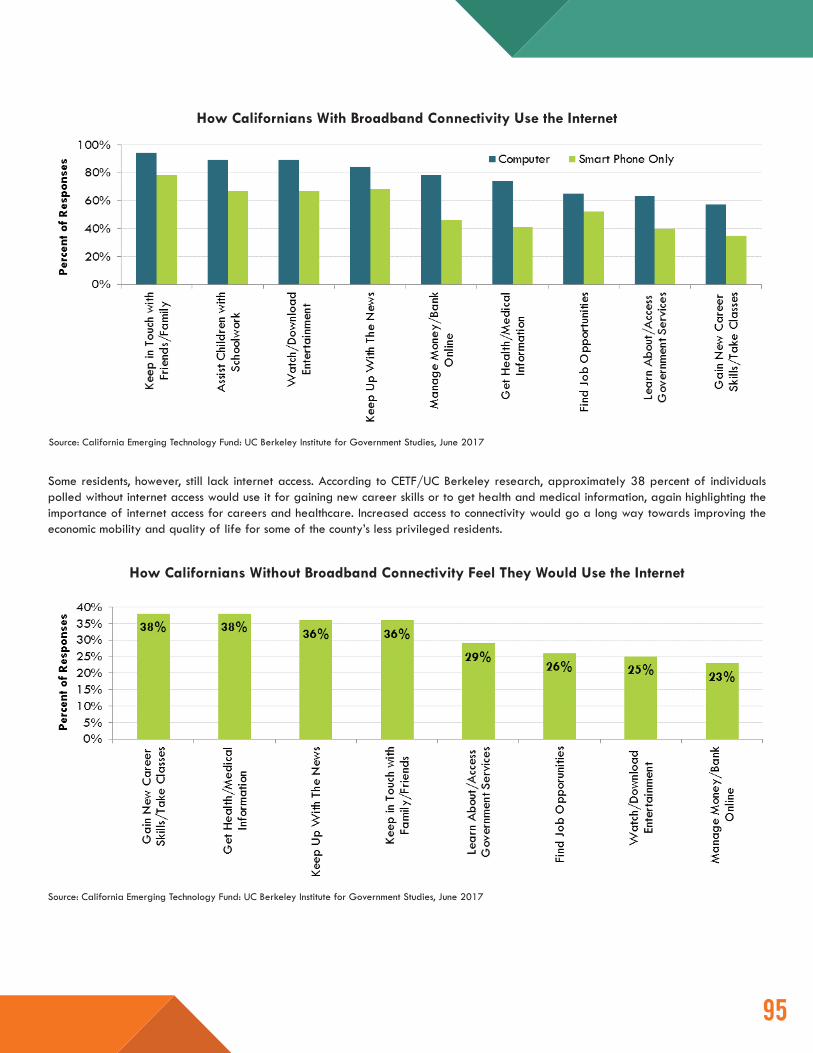
9595
How Californians With Broadband Connectivity Use the Internet
Some residents, however, still lack internet access. According to CETF/UC Berkeley research, approximately 38 percent of individuals polled without internet access would use it for gaining new career skills or to get health and medical information, again highlighting the importance of internet access for careers and healthcare. Increased access to connectivity would go a long way towards improving the economic mobility and quality of life for some of the county’s less privileged residents.
Source: California Emerging Technology Fund: UC Berkeley Institute for Government Studies, June 2017
How Californians Without Broadband Connectivity Feel They Would Use the Internet
Source: California Emerging Technology Fund: UC Berkeley Institute for Government Studies, June 2017

9696

9797
REPORT PARTNERS
The 2017-2018 Orange County Workforce Indicators Report is the product of a
collaborative effort among many parties, whose support and involvement are critical
to its ongoing impact. Many thanks to all who participated.
9898
Data Sources• Apartmentlist• Anaheim/Orange County Visitor Center & Convention Bureau• Brookings Institute • Burning Glass Labor Insights• California Association of Realtors • California Department of Education, DataQuest - Educational Demographics Units• California Department of Finance• California Department of Finance, Demographic Research Unit• California Emerging Technology Fund• California Employment Development Department• California Employment Development Department, QCEW Dataset• California Employment Development Department, OES Dataset• California Life Sciences Association• California Public Utilities Commission• California State University, Fullerton• California State University, Fullerton; Center for Demographic Research• California State University, Fullerton; Institute for Economic and Environmental Studies• California State University, Fullerton; 2017 Economic Forecast• Chapman University• Chapman University, A. Gary Anderson Center for Economic Research • CompTIA• Corelogic, Real Estate Data Reports• Dun & Bradstreet• Harvard Business School Institute for Strategy and Competitiveness• LinkedIn, 2016 Annual Veteran Insights Report: An Inside Look at U.S. Veterans in the Workplace• McKinsey & Company• Moody’s Analytics • National Adult Literacy Council• National Association of Realtors • National Low Income Housing Coalition, Out of Reach 2017• Oxford University• Rentbits• Rock Health Digital Health Funding Database• The Urban Explorer, EconoVue• U.S. Bureau of Labor Statistics• U.S. Bureau of Labor Statistics, Employment Situation of Veterans• U.S. Bureau of Labor Statistics, Occupation Employment Statistics• U.S. Bureau of Labor Statistics, Quarterly Census of Employment and Wages• U.S. Census Bureau, 1990 Census• World Atlas
9999
Special thanks for their thoughtful contributions
• Renee Ramirez, Director, Orange County Community Services• Brian Rayburn, Interim Director, Orange County Development Board• Nancy Cook, Special Projects Manager, Orange County Development Board• Jessica Amezcua, Staff Specialist, Orange County Development Board• Lucy Dunn, President and CEO, Orange County Business Council
Project Team• Dr. Wallace Walrod, Chief Economic Advisor, OCBC• Alicia Berhow, Vice President, Workforce Development and Advocacy, OCBC• Patty Conover, Director of Communications, OCBC• Benjamin Palmer, Economic Research Assistant, OCBC • Robert Walrod, Research Assistant, OCBC

100100
THANK YOU SPONSORS
AT&T THE BOEING COMPANY
CHARTER COMMUNICATIONSCSU FULLERTON
ORANGE COUNTY UNITED WAYSOUTHERN CALIFORNIA EDISON
SCHOOLSFIRST FEDERAL CREDIT UNION
SILVER SPONSORS
GOLD SPONSORS
TITLE SPONSOR