Embed Size (px)
Citation preview

A
eiEifigegc©
K
1
nteeah(eAhb(io
1d
Available online at www.sciencedirect.com
Respiratory Physiology & Neurobiology 159 (2007) 155–162
Organ growth in chicken embryos during hypoxia:Implications on organ “sparing” and “catch-up growth”
Milene A. Azzam, Jacopo P. Mortola ∗Department of Physiology, McGill University, 3655 Promenade Sir William Osler, Montreal, Quebec H3G 1Y6, Canada
Accepted 11 June 2007
bstract
The primary aim of this study was to establish whether or not embryonic hypoxia selectively affects the growth of specific organs. Chickenmbryos were incubated either in normoxia (Nx) or in hypoxia (15% O2 from embryonic day E5, Hx). The length of the beak and third toe (asndexes of skeletal growth) and the weights of internal organs (eyes, brain, heart, lungs, liver, kidneys, stomach, and intestines) were collected at14, E17, E19, and E20. Hypoxia reduced embryonic body weight (BW). At any given age, the specific weight (organ weight/BW) of some organs
n Hx was higher, and that of others was lower, than in Nx. However, almost all differences disappeared when organ weights were compared asunction of BW, rather than at fixed chronological ages. The important exception was the chorioallantoic membrane (CAM), the mass of whichn Hx developed out of proportion. In a third group of embryos, hypoxic until E14 and normoxic thereafter, there was no post-hypoxic catch-uprowth, differently from what known to occur postnatally. A possible interpretation is that catch-up growth does not depend on the age of the
mbryo but on its BW. In conclusion, at least in the chicken embryo and for the level of hypoxia tested, hypoxia has no selective effects on therowth of specific organs, except for the CAM. Qualitative differences in the weight response to hypoxia among organs observed at any given agean be explained largely by the effects of the blunted growth on the growth trajectory of the individual organs.2007 Elsevier B.V. All rights reserved.
emb
oaidhft1
ofiwng
eywords: Embryonic development; Heart; Hypoxia; Lungs; Chorioallantoic m
. Introduction
In mammals, hypoxia during gestation usually results in smalleonates, although the maternal response to hypoxia can limithe blunting of fetal growth (Moore and Price, 1948; Metcalfet al., 1962; Smith et al., 1969; Robinson et al., 1983; Changt al., 1984; Faridy et al., 1988; Moore et al., 1982; Mongend Leon-Velarde, 1991; Moore, 2003). In the avian embryo,ypoxia during incubation consistently decreases body growthe.g., Tazawa et al., 1971; Wangensteen et al., 1974; Metcalfet al., 1981; McCutcheon et al., 1982; Xu and Mortola, 1989;zzam et al., 2007). As one may expect, small embryos alsoave small internal organs. However, upon normalisation byody weight (BW), some organs have larger specific weights
organ weight/BW) than normoxic controls, meaning that dur-ng hypoxia the drop in their weight was not as marked as thatf the whole body, at the expense of other organs where the∗ Corresponding author. Tel.: +1 514 398 4335; fax: +1 514 398 7452.E-mail address: [email protected] (J.P. Mortola).
cwfbtwf
569-9048/$ – see front matter © 2007 Elsevier B.V. All rights reserved.oi:10.1016/j.resp.2007.06.003
rane; Normalisation
pposite had occurred. Non-homogeneous effects of hypoxiamong internal organs have been observed also in mammals dur-ng development (Mortola, 2001, for review). These inter-organifferences may reflect differences in metabolic sensitivity toypoxia and the redistribution of O2 delivery, which appears toavour key vital organs, at the expense of organs less crucial forhe immediate survival (Kuwahira et al., 1993; Cote and Porras,998).
The impression that, during hypoxia, the growth of somergans may increase at the expense of others is based on thending that, at any given developmental age, their specificeights are higher than in normoxic controls. However, BW-ormalisation when comparing same-age animals with differentrowth rates (as it happens in hypoxia) can lead to misleadingonclusions whenever the growth rate of various organs differ,hich is typically the case during embryonic development. In
act, for an organ normally growing at a rate lower than the whole
ody (and therefore dropping its specific weight with age), inhe case of stunted body growth, at any given age its specificeight must exceed the control value. The opposite has to occuror any organ normally growing at a rate higher than that of

1 ysiol
tadhgeiBeg
nawmaamt
2
cs
waai4ecw(oAEnhoautgpT
Fwewnmm
56 M.A. Azzam, J.P. Mortola / Respiratory Ph
he whole embryo. Therefore, whenever comparisons are madet fixed chronological ages, one cannot sort out to what extentifferences in organ specific weights result from the effects ofypoxia on that organ or from the generalised blunting in bodyrowth. In this study, organ weights of hypoxic and normoxicmbryos were compared not only at predetermined chronolog-cal ages, but also at comparable BWs, reasoning that a uniqueW–organ weight relationship between normoxic and hypoxicmbryos would indicate no selective effects of hypoxia on therowth of the organ.
The primary aim of this study was to establish whether orot embryonic hypoxia affects the growth of specific organs,part from its general effects on body growth. Measurementsere conducted on chicken embryos, rather than on a mam-alian animal model, to eliminate the possibilities of maternal
nd placental contributions to the fetal outcome. Second, wesked whether or not, during the post-hypoxic return to nor-oxia, the “catch-up” growth of some organs might prevail over
hat of others.
. Methods
Freshly laid chicken eggs of the Leghorn variety were pur-hased from a local supplier. Eggs were stored at 15 ◦C until thetart of incubation, and for no longer than 7 days. The eggs were
fr
o
ig. 1. (Top) Schematic representation of the growth of an organ occurring at a raeight declines with age (middle panel). The curves represent the conditions of norm
qual to half the normoxic rate. In these conditions, at any given age the organ spechen represented as function of embryo’s weight, the data fall on a unique relationormoxia (open circles) or in hypoxia (filled triangles). At any given age, the head abiddle panels). However, when plotted against embryo’s weight, the head weights ofeans ± 1 S.E.M. *Statistically significant difference between the two groups.
ogy & Neurobiology 159 (2007) 155–162
eighed and placed in incubators (Hova-Bator, Savannah, GA)round midday (embryonic day E0). The incubators maintainedsteady temperature (T) of about 38 ◦C and 60% relative humid-
ty, and provided a 45◦ egg rotation four times a day. For the firstdays all eggs were incubated in normoxic conditions. Then, at
mbryonic day E5, they were separated into two groups. Someontinued in normoxia (21% O2, normoxic, Nx, N = 52), othersere transferred into a hypoxic incubator kept at 15–16% O2
on average, 15.5% ± 0.01, including the periods of incubatorpening for egg transfer and cleaning) (hypoxic, Hx, N = 52).
third group of eggs was treated as the Hx eggs until day14, when they were returned to normoxia, and maintained inormoxia thereafter. This group will be referred to as the “post-ypoxic normoxic” group (Hx–Nx, N = 41). The desired levelf hypoxia was obtained by leaking a small stream of warmednd humidified N2 into the incubator from a pressurised tank,nder the control of a flowmeter. The O2 concentration withinhe incubator was continuously sampled by a calibrated fuel cellas analyser (Foxbox, Sable Systems Int., Las Vegas, NV), dis-layed on a computer monitor, and stored for later averaging. A-data logger and a hygrometer were inside each incubator; the
ormer collected the T value every 10 min, while humidity wasead daily.Data collection for the Nx and Hx groups was conductedn days E14, E17, E19, and E20, with 13 embryos per group
te slower than that of the whole body (left panel), so that the specific organoxia (continuous line) and hypoxia (dashed line), the latter with a growth rateific weight in hypoxia exceeds the normoxic value (middle panel). However,ship (right panel). (Bottom) Body and head weights of embryos incubated insolute and specific weights were greater in hypoxia than in normoxia (left andhypoxic and normoxic embryos fell on the same relationship. Values are group
ysiol
a(twawthwt(rulbwi31tewbr
ctefd
3
3
m5basN(os(
3o
eelngg
tocw
u(odBwootwg
3
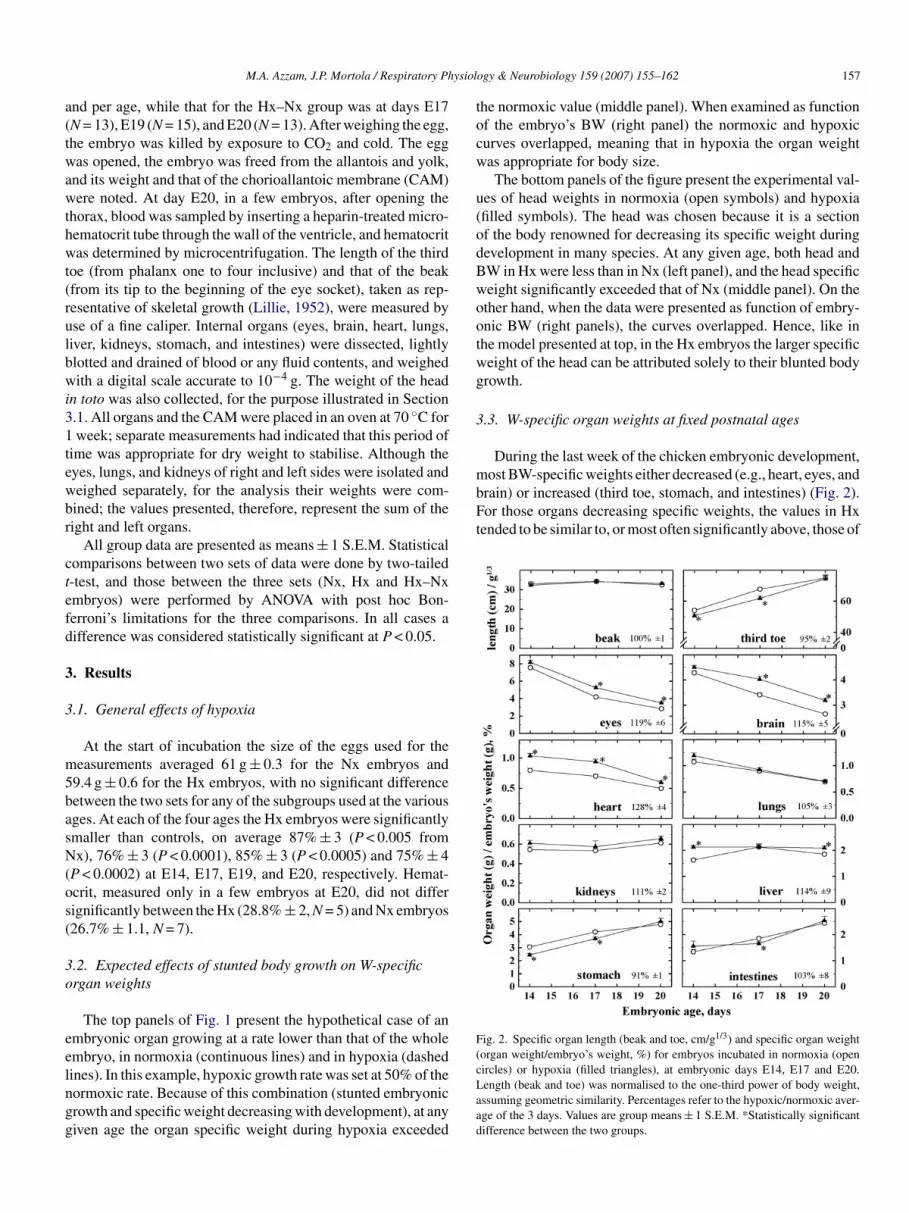
most BW-specific weights either decreased (e.g., heart, eyes, andbrain) or increased (third toe, stomach, and intestines) (Fig. 2).For those organs decreasing specific weights, the values in Hxtended to be similar to, or most often significantly above, those of
Fig. 2. Specific organ length (beak and toe, cm/g1/3) and specific organ weight(organ weight/embryo’s weight, %) for embryos incubated in normoxia (open
M.A. Azzam, J.P. Mortola / Respiratory Ph
nd per age, while that for the Hx–Nx group was at days E17N = 13), E19 (N = 15), and E20 (N = 13). After weighing the egg,he embryo was killed by exposure to CO2 and cold. The eggas opened, the embryo was freed from the allantois and yolk,
nd its weight and that of the chorioallantoic membrane (CAM)ere noted. At day E20, in a few embryos, after opening the
horax, blood was sampled by inserting a heparin-treated micro-ematocrit tube through the wall of the ventricle, and hematocritas determined by microcentrifugation. The length of the third
oe (from phalanx one to four inclusive) and that of the beakfrom its tip to the beginning of the eye socket), taken as rep-esentative of skeletal growth (Lillie, 1952), were measured byse of a fine caliper. Internal organs (eyes, brain, heart, lungs,iver, kidneys, stomach, and intestines) were dissected, lightlylotted and drained of blood or any fluid contents, and weighedith a digital scale accurate to 10−4 g. The weight of the head
n toto was also collected, for the purpose illustrated in Section.1. All organs and the CAM were placed in an oven at 70 ◦C forweek; separate measurements had indicated that this period of
ime was appropriate for dry weight to stabilise. Although theyes, lungs, and kidneys of right and left sides were isolated andeighed separately, for the analysis their weights were com-ined; the values presented, therefore, represent the sum of theight and left organs.
All group data are presented as means ± 1 S.E.M. Statisticalomparisons between two sets of data were done by two-tailed-test, and those between the three sets (Nx, Hx and Hx–Nxmbryos) were performed by ANOVA with post hoc Bon-erroni’s limitations for the three comparisons. In all cases aifference was considered statistically significant at P < 0.05.
. Results
.1. General effects of hypoxia
At the start of incubation the size of the eggs used for theeasurements averaged 61 g ± 0.3 for the Nx embryos and
9.4 g ± 0.6 for the Hx embryos, with no significant differenceetween the two sets for any of the subgroups used at the variousges. At each of the four ages the Hx embryos were significantlymaller than controls, on average 87% ± 3 (P < 0.005 fromx), 76% ± 3 (P < 0.0001), 85% ± 3 (P < 0.0005) and 75% ± 4
P < 0.0002) at E14, E17, E19, and E20, respectively. Hemat-crit, measured only in a few embryos at E20, did not differignificantly between the Hx (28.8% ± 2, N = 5) and Nx embryos26.7% ± 1.1, N = 7).
.2. Expected effects of stunted body growth on W-specificrgan weights
The top panels of Fig. 1 present the hypothetical case of anmbryonic organ growing at a rate lower than that of the wholembryo, in normoxia (continuous lines) and in hypoxia (dashed
ines). In this example, hypoxic growth rate was set at 50% of theormoxic rate. Because of this combination (stunted embryonicrowth and specific weight decreasing with development), at anyiven age the organ specific weight during hypoxia exceededcLaad
ogy & Neurobiology 159 (2007) 155–162 157
he normoxic value (middle panel). When examined as functionf the embryo’s BW (right panel) the normoxic and hypoxicurves overlapped, meaning that in hypoxia the organ weightas appropriate for body size.The bottom panels of the figure present the experimental val-
es of head weights in normoxia (open symbols) and hypoxiafilled symbols). The head was chosen because it is a sectionf the body renowned for decreasing its specific weight duringevelopment in many species. At any given age, both head andW in Hx were less than in Nx (left panel), and the head specificeight significantly exceeded that of Nx (middle panel). On thether hand, when the data were presented as function of embry-nic BW (right panels), the curves overlapped. Hence, like inhe model presented at top, in the Hx embryos the larger specificeight of the head can be attributed solely to their blunted bodyrowth.
.3. W-specific organ weights at fixed postnatal ages
During the last week of the chicken embryonic development,
ircles) or hypoxia (filled triangles), at embryonic days E14, E17 and E20.ength (beak and toe) was normalised to the one-third power of body weight,ssuming geometric similarity. Percentages refer to the hypoxic/normoxic aver-ge of the 3 days. Values are group means ± 1 S.E.M. *Statistically significantifference between the two groups.
158 M.A. Azzam, J.P. Mortola / Respiratory Physiology & Neurobiology 159 (2007) 155–162
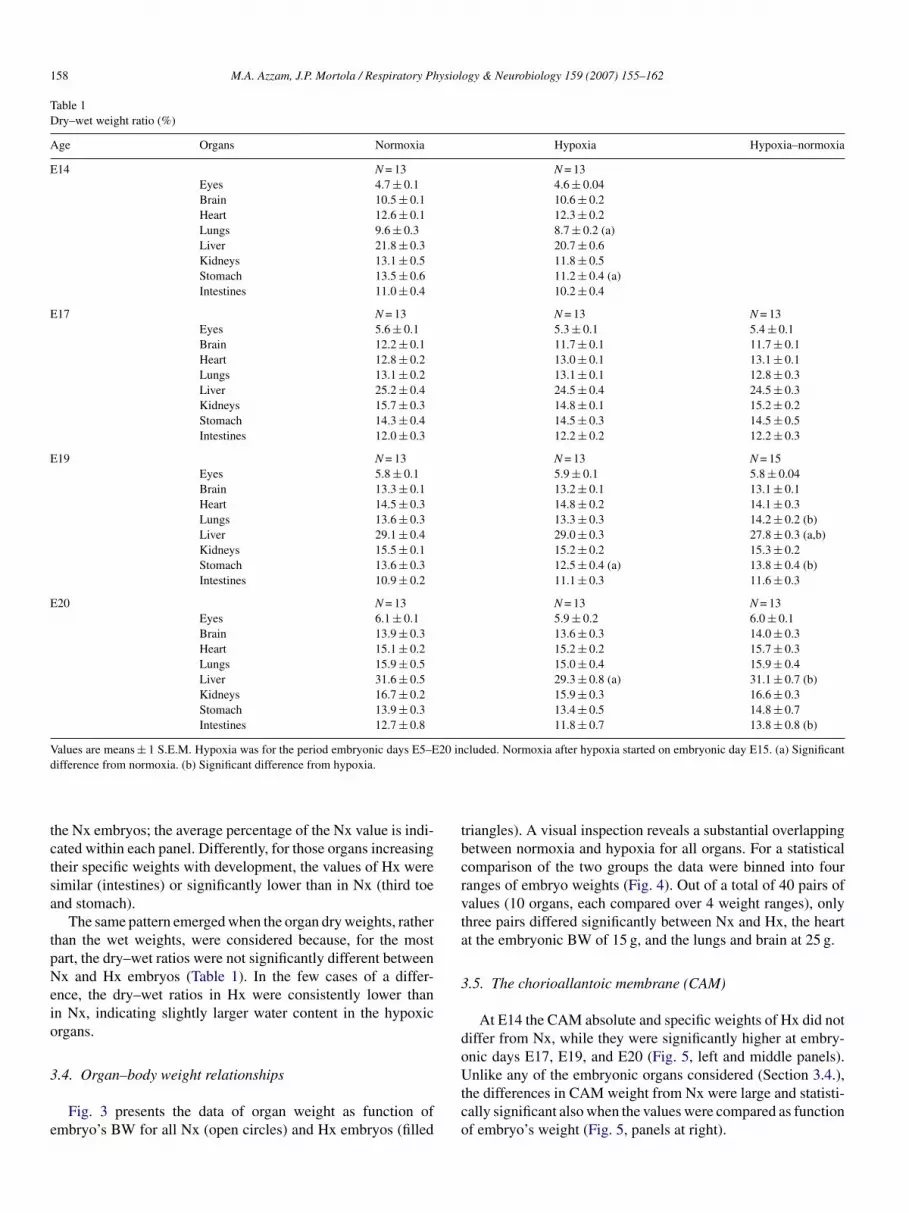
Table 1Dry–wet weight ratio (%)
Age Organs Normoxia Hypoxia Hypoxia–normoxia
E14 N = 13 N = 13Eyes 4.7 ± 0.1 4.6 ± 0.04Brain 10.5 ± 0.1 10.6 ± 0.2Heart 12.6 ± 0.1 12.3 ± 0.2Lungs 9.6 ± 0.3 8.7 ± 0.2 (a)Liver 21.8 ± 0.3 20.7 ± 0.6Kidneys 13.1 ± 0.5 11.8 ± 0.5Stomach 13.5 ± 0.6 11.2 ± 0.4 (a)Intestines 11.0 ± 0.4 10.2 ± 0.4
E17 N = 13 N = 13 N = 13Eyes 5.6 ± 0.1 5.3 ± 0.1 5.4 ± 0.1Brain 12.2 ± 0.1 11.7 ± 0.1 11.7 ± 0.1Heart 12.8 ± 0.2 13.0 ± 0.1 13.1 ± 0.1Lungs 13.1 ± 0.2 13.1 ± 0.1 12.8 ± 0.3Liver 25.2 ± 0.4 24.5 ± 0.4 24.5 ± 0.3Kidneys 15.7 ± 0.3 14.8 ± 0.1 15.2 ± 0.2Stomach 14.3 ± 0.4 14.5 ± 0.3 14.5 ± 0.5Intestines 12.0 ± 0.3 12.2 ± 0.2 12.2 ± 0.3
E19 N = 13 N = 13 N = 15Eyes 5.8 ± 0.1 5.9 ± 0.1 5.8 ± 0.04Brain 13.3 ± 0.1 13.2 ± 0.1 13.1 ± 0.1Heart 14.5 ± 0.3 14.8 ± 0.2 14.1 ± 0.3Lungs 13.6 ± 0.3 13.3 ± 0.3 14.2 ± 0.2 (b)Liver 29.1 ± 0.4 29.0 ± 0.3 27.8 ± 0.3 (a,b)Kidneys 15.5 ± 0.1 15.2 ± 0.2 15.3 ± 0.2Stomach 13.6 ± 0.3 12.5 ± 0.4 (a) 13.8 ± 0.4 (b)Intestines 10.9 ± 0.2 11.1 ± 0.3 11.6 ± 0.3
E20 N = 13 N = 13 N = 13Eyes 6.1 ± 0.1 5.9 ± 0.2 6.0 ± 0.1Brain 13.9 ± 0.3 13.6 ± 0.3 14.0 ± 0.3Heart 15.1 ± 0.2 15.2 ± 0.2 15.7 ± 0.3Lungs 15.9 ± 0.5 15.0 ± 0.4 15.9 ± 0.4Liver 31.6 ± 0.5 29.3 ± 0.8 (a) 31.1 ± 0.7 (b)Kidneys 16.7 ± 0.2 15.9 ± 0.3 16.6 ± 0.3Stomach 13.9 ± 0.3 13.4 ± 0.5 14.8 ± 0.7Intestines 12.7 ± 0.8 11.8 ± 0.7 13.8 ± 0.8 (b)
Values are means ± 1 S.E.M. Hypoxia was for the period embryonic days E5–E20 included. Normoxia after hypoxia started on embryonic day E15. (a) Significantd
tctsa
tpNeio
3
e
tbcrvta
3
donic days E17, E19, and E20 (Fig. 5, left and middle panels).
ifference from normoxia. (b) Significant difference from hypoxia.
he Nx embryos; the average percentage of the Nx value is indi-ated within each panel. Differently, for those organs increasingheir specific weights with development, the values of Hx wereimilar (intestines) or significantly lower than in Nx (third toend stomach).
The same pattern emerged when the organ dry weights, ratherhan the wet weights, were considered because, for the mostart, the dry–wet ratios were not significantly different betweenx and Hx embryos (Table 1). In the few cases of a differ-
nce, the dry–wet ratios in Hx were consistently lower thann Nx, indicating slightly larger water content in the hypoxicrgans.
.4. Organ–body weight relationships
Fig. 3 presents the data of organ weight as function ofmbryo’s BW for all Nx (open circles) and Hx embryos (filled
Utco
riangles). A visual inspection reveals a substantial overlappingetween normoxia and hypoxia for all organs. For a statisticalomparison of the two groups the data were binned into fouranges of embryo weights (Fig. 4). Out of a total of 40 pairs ofalues (10 organs, each compared over 4 weight ranges), onlyhree pairs differed significantly between Nx and Hx, the heartt the embryonic BW of 15 g, and the lungs and brain at 25 g.
.5. The chorioallantoic membrane (CAM)
At E14 the CAM absolute and specific weights of Hx did notiffer from Nx, while they were significantly higher at embry-
nlike any of the embryonic organs considered (Section 3.4.),he differences in CAM weight from Nx were large and statisti-ally significant also when the values were compared as functionf embryo’s weight (Fig. 5, panels at right).

M.A. Azzam, J.P. Mortola / Respiratory Physiology & Neurobiology 159 (2007) 155–162 159
Fig. 3. Length (beak and toe, mm) and weight (g) of various organs for embryosincubated in normoxia (open circles) or hypoxia (filled triangles), representedad
3
E
Fig. 4. Length (beak and toe, mm) and weight (g) of various organs for embryosincubated in normoxia (open circles) or hypoxia (filled triangles), binned infEm
days E17, E19, and E20. At each age, the BW and the wet weight
Ft(
s function of the corresponding embryo’s body weight. Data refer to incubationays E14, E17, E19, and E20.
.6. Post-hypoxic normoxia
These embryos (Hx–Nx) were exposed to hypoxia until day14 and to normoxia thereafter; their organs were measured at
olf
ig. 5. Absolute (left) and specific (middle) weights of the chorioallantoic membranriangles). At right, the data are plotted against the corresponding embryo’s body wbottom right). Values are group means ± 1 S.E.M. *Statistically significant differenc
our groups of body weight ranges. The data refer to incubation days E14, E17,19, and E20 and are those represented individually in Fig. 3. Values are groupeans ± 1 S.E.M. *Statistically significant difference between the two groups.
f most organs were below the average Nx values (100%, dashedines in Fig. 6), and for the most part did not differ significantlyrom the corresponding values of the Hx embryos. The very few
e (CAM) for embryos incubated in normoxia (open circles) or hypoxia (filledeight, either individually (top right) or binned in four groups of body weightse between the two groups.

160 M.A. Azzam, J.P. Mortola / Respiratory Physiol
Fig. 6. Average values of embryo’s body weight (at left) and weights of variousorgans, expressed in percent of the corresponding mean values in normoxia(horizontal dashed line), for embryos incubated in hypoxia (filled bars) andfor embryos returned to normoxia after hypoxic exposure until day E14 (“post-hEd
esw
wHa8t
4
M1Baioseaoat
eoibhbriiABaasebai
aawwmarmfag
sdmvnchpsBtcsisdIdildl
ypoxic normoxia”, grey bars). Columns indicate group means at days E17 (top),19 (middle), and E20 (bottom), bars are 1 S.E.M. *Statistically significantifference between the two groups.
xceptions were the toe and, notably, the kidneys at E17, whichignificantly exceeded the Hx values, and the stomach at E19,hich was significantly smaller.Similar results were obtained with the organ specific dry
eights. In this case, the only significant differences betweenx–Nx and Hx were the kidneys at E17 (118% ± 7 in Hx–Nx
nd 79% ± 6 in Hx, P < 0.001), the brain at E19 (respectively,8% ± 2 and 96% ± 2, P < 0.05) and the stomach at E20 (respec-ively, 105% ± 11 and 77% ± 7, P < 0.05).
. Discussion
As on many previous occasions (e.g., Smith et al., 1969;etcalfe et al., 1981; McCutcheon et al., 1982; Adair et al.,
987; Stock and Metcalfe, 1987; Xu and Mortola, 1989; Asson-atres et al., 1989; Dzialowski et al., 2002; Azzam et al., 2007),lso the current measurements indicated that hypoxia duringncubation blunted embryonic growth. The effects on hemat-crit were not significant. Previous data too have shown onlymall or no increase in hematocrit in hypoxic embryos (Jalavistot al., 1965; Burton and Smith, 1969; Tazawa et al., 1971; Xu
nd Mortola, 1989; Dzialowski et al., 2002), probably becausef the modest erythropoietic response and hemoconcentrationt these developmental stages. Several authors had reported onhe effects of hypoxia on the growth of internal organs. Foro(pb
ogy & Neurobiology 159 (2007) 155–162
xample, McCutcheon et al. (1982) found that the three internalrgans that they examined, brain, heart and liver, were smallern hypoxic than in normoxic embryos; the decreases in heart andrain were less than that of the whole embryo, while the liverad the opposite response. Hence, they concluded that heart andrain were spared by hypoxia, at the expense of the liver. Similaresults and conclusions were reached by other studies exam-ning these or other organs at predetermined embryonic agesn avian (Stock and Metcalfe, 1987; Xu and Mortola, 1989;sson-Batres et al., 1989; Dzialowski et al., 2002; Chan andurggren, 2005) and non-avian embryonic models (Crossleynd Altimiras, 2006). Also the current data, when analysedt fixed chronological ages (Fig. 2), would give the impres-ion that some organs may be protected (e.g., brain, heart, andyes) possibly at the expense of skeletal growth (as exemplifiedy the toe) or of the abdominal viscera (intestines and stom-ch). However, we believe that such interpretation of the data isncorrect.
As mentioned in Section 1 and illustrated in Fig. 1, thepproach of comparing organ-specific weights between animalst fixed chronological times can lead to misleading conclusionshenever embryos are growing at different rates and the specificeights of the organs under consideration change with develop-ent. Both situations occur in the comparison between hypoxic
nd normoxic embryos. When compared as function of BW,ather than age, the conclusion was reached that hypoxia hadinimal selective effects on the growth of specific organs; there-
ore, the inter-organ differences in specific weights observed atny given age, for the most part, are attributable to the bluntedrowth.
In young and adult mammals, the most effective responses toustained hypoxia are those aiming to save energy and protect O2elivery. However, many of those responses (e.g., drop in ther-ogenesis, peripheral vasoconstriction, increased pulmonary
entilation, cardiac output, and hematocrit) are minimally orot functional in the early embryonic phases. The autonomicontrol of blood flow becomes operational only in the secondalf of incubation (Mulder et al., 1998, 2002). Cardiac hypertro-hy, which is a characteristic of sustained hypoxia after birth, ismall or absent before hatching (Burton and Smith, 1969; Asson-atres et al., 1989), presumably because sustained hypoxia in
he embryo causes vasodilatation and decreases systemic vas-ular resistance (Adair et al., 1987). Hence, the major survivaltrategy against hypoxia is the decrease in body growth. It isnteresting to note that the slow rate of body growth not onlyaves energy but also, by delaying organ growth, achieves someegree of protection for key organs like the heart and the brain.n fact, the heart and the brain being among the organs thatrop their specific weights during development, a slow growthmplies that they will retain a greater proportion of BW for aonger period of time; the opposite occurs to organs with delayedevelopment, like the stomach and the guts. Hence, even withimited mechanisms to redistribute blood flow, during embry-
nic development the inter-organ differences in time trajectoriesFig. 2) are such that solely by blunting body growth the relativeroportion among organs shifts in favour of the heart and therain.
ysiology & Neurobiology 159 (2007) 155–162 161
fmh12ot(picgZ
tucigmdota(hhrpToomMltuttsdalttitms1riigte
Fig. 7. Hypothetical growth curves in normoxia (continuous lines), hypoxia(dashed lines), and post-hypoxic normoxia (filled triangles). In (A), the growthcurves are convex with respect to the time-axis (growth rate increasing withtime); in (B), they are concave toward the time-axis (growth rate declining withtime). In either case, the growth rate of the hypoxic curve is assumed to occur athalf the normoxic rate. From day 14, the hypoxic growth curve resumes at the ratethat the normoxic curve had at that body weight (filled triangles), mimickingt(v
oomlbcohdadfmrh
A
t
R
A
M.A. Azzam, J.P. Mortola / Respiratory Ph
The CAM is an extra-embryonic organ that becomes fullyormed at E12. After that age, its specific weight declines (Fig. 5,iddle panel). The CAM weight and structural changes in
ypoxia have been reported by several authors (Strick et al.,991; Burton and Palmer, 1992; Wagner-Amos and Seymour,003; Chan and Burggren, 2005). Differently from all embryonicrgans, the CAM weight increased not only at fixed developmen-al ages but also when examined as function of embryo’s BWFig. 5, panels at right). This indicates that hypoxia had a specificositive effect on the mass of the CAM, most likely providing anmprovement of its O2 diffusion capacity, and reminiscent of thehanges in placenta structure seen in mammals during hypoxicestation (Faridy et al., 1988; Monge and Leon-Velarde, 1991;amudio, 2003).
The second goal of the study was to consider the possibilityhat, during post-hypoxic normoxia, some organs may catch-p at a faster pace than others. However the results, globallyonsidered, indicated that neither the whole embryo nor itsndividual organs showed a significant post-hypoxic catch-uprowth. There were very few exceptions to this pattern, and theost notable one was the increase in kidney size at E17, i.e. 3
ays after termination of hypoxia. This increase, however, wasnly transient, and its basis is not clear; it cannot be ascribedo a post-hypoxic surge in blood flow, because the increase waspproximately the same for the wet (121%) and dry kidneys118%). Postnatally, the return to normoxia after several days inypoxia stimulates an increased speed of growth. For example,uman infants growth-retarded because of cardiogenic cyanoticight-to-left shunts recover to the normal, or quasi-normal, Wercentile after surgical correction of the disease (Prader andanner, 1963; Gingell et al., 1981). Catch-up growth has beenbserved also in numerous animal experiments upon resolutionf the original growth restriction, including the return to nor-oxia after hypoxia (Okubo and Mortola, 1988; Sant’Anna andortola, 2003). The current data, on the other hand, show a
ack of catch-up growth in the hypoxic avian embryo returnedo normoxia. The mechanisms behind the phenomenon of catch-p growth are still obscure, but it is worth noting that the growthrajectory upon termination of hypoxia can be an important fac-or in determining the magnitude of catch-up growth. This ischematically illustrated in Fig. 7, where the growth curves areepicted as convex (A) or as concave (B) relative to the time-xis. In these examples, the growth curves in hypoxia (dashedines) are chosen to be half of the normoxic curves. Upon restora-ion of normoxia (filled triangles), if the growth rate resumed athe rate pertinent to that body W, catch-up growth will be min-mal in condition A and almost complete in condition B. B ishe familiar growth trajectory after birth, while A is the com-
on growth pattern during embryonic development for manypecies, including the chicken embryo (e.g., Wangensteen et al.,974; Vleck et al., 1980; Azzam et al., 2007). Hence, if theeturn to normoxia after a period of hypoxia consisted primar-ly in resuming body growth at the rate pertinent to that BW,
rrespective of chronological age, then, the degree of catch-uprowth could depend largely on the body growth trajectory. Inhis case, therefore, catch-up growth in the embryonic period isxpected to be minimal, and lower than postnatally.A
he situation of the hypoxic embryos returned to normoxia. Catch-up growthexpressed as percent of normoxia, bottom panels, and filled triangles) in (A) isirtually non-existent, while in (B) is almost complete by day 24.
In conclusion, we confirm previous data that, during embry-nic hypoxia, at any given age, the specific weight of somergans may exceed, and that of others may be below, the nor-oxic values. However, at least in the chicken embryo and for the
evel of hypoxia tested, these differences are largely explainedy the generalised blunting in body growth, and there is no indi-ation that hypoxia has selective effects on the growth of specificrgans. An important exception is the CAM, the mass of which inypoxia develops out of proportion. Upon return to normoxia,ifferently from the postnatal life, catch-up growth is almostbsent, presumably because embryonic growth rate does notepend on age but on the embryo’s BW. Globally taken, there-ore, these data suggest that during embryonic development theass of the individual organs during hypoxia, and their rate of
ecovery upon return to normoxia, much depend on the effect ofypoxia on embryo’s BW.
cknowledgment
This study was supported financially by the Canadian Insti-ute of Health Research.
eferences
dair, T.H., Guyton, A.C., Montani, J.-P., Lindsay, H.L., Stanek, K.A., 1987.
Whole body structural vascular adaptation to prolonged hypoxia in chickembryos. Am. J. Physiol. 252, H1228–H1234.sson-Batres, M.A., Stock, M.K., Hare, J.F., Metcalfe, J., 1989. O2 effecton composition of chick embryonic heart and brain. Respir. Physiol. 77,101–109.

1 ysiol
A
B
B
C
C
C
C
D
F
G
J
K
L
M
M
M
M
M
M
M
M
M
M
O
P
R
S
S
S
S
T
V
W
W
62 M.A. Azzam, J.P. Mortola / Respiratory Ph
zzam, M.A., Szdzuy, K., Mortola, J.P., 2007. Hypoxic incubation blunts thedevelopment of thermogenesis in chicken embryos and hatchlings. Am. J.Physiol. (Regul. Integr. Comp. Physiol.) 292, R2373–R2379.
urton, R.R., Smith, A.H., 1969. Induction of cardiac hypertrophy and poly-cythemia in the developing chick at high altitude. Fed. Proc. 28, 1170–1177.
urton, G.J., Palmer, M.E., 1992. Development of the chick chorioallantoiccapillary plexus under normoxic and normobaric hypoxic and hyperoxicconditions: a morphometric study. J. Exp. Zool. 262, 291–298.
han, T., Burggren, W., 2005. Hypoxic incubation creates differential morpho-logical effects during specific developmental critical windows in the embryoof the chicken (Gallus gallus). Respir. Physiol. Neurobiol. 145, 251–263.
hang, J.H.T., Rutledge, J.C., Stoops, D., Abbe, R., 1984. Hypobaric hypoxia-induced intrauterine growth retardation. Biol. Neonate 46, 10–13.
ote, A., Porras, H., 1998. Respiratory, cardiovascular, and metabolic adjust-ments to hypoxemia during sleep in piglets. Can. J. Physiol. Pharmacol. 76,747–755.
rossley.II., D.A., Altimiras, J., 2006. Cardiovascular development in embryosof the American alligator Alligator mississippiensis: effects of chronic andacute hypoxia. J. Exp. Biol. 208, 31–39.
zialowski, E.M., Plettenberg, von, D., Elmonoufy, N.A., Burggren, W.W.,2002. Chronic hypoxia alters the physiological and morphological trajec-tories of developing chicken embryos. Comp. Biochem. Physiol. A 131,713–724.
aridy, E.E., Sanii, M.R., Thliveris, J.A., 1988. Fetal lung growth: influence ofmaternal hypoxia and hyperoxia in rats. Respir. Physiol. 73, 225–242.
ingell, R.L., Pieroni, D.R., Hornung, M.G., 1981. Growth problems associatedwith congenital heart disease in infancy. In: Lebenthal, E. (Ed.), Textbook ofGastroenterology and Nutrition in Infancy, 2. Raven Press, New York, NY,pp. 853–860.
alavisto, E., Kuorinka, I., Kyllastinen, M., 1965. Responsiveness of the erythronto variations of oxygen tension in the chick embryo and young chicken. ActaPhysiol. Scand. 63, 479–486.
uwahira, I., Heisler, N., Piiper, J., Gonzales, N.C., 1993. Effect of chronichypoxia on hemodynamics, organ blood flow and O2 supply in rats. Respir.Physiol. 92, 227–238.
illie, F.R., 1952. The Development of the Chick; An Introduction to Embryol-ogy, 3rd ed. rev. Holt & Co., New York, pp. 70–91.
cCutcheon, I.E., Metcalfe, J., Metzenberg, A.B., Ettinger, T., 1982. Organgrowth in hyperoxic and hypoxic chick embryos. Respir. Physiol. 50,153–163.
etcalfe, J., Meschia, G., Hellegers, A., Prystowsky, H., Huckabee, W., Barron,D.H., 1962. Observations on the placental gas exchange of the respira-tory gases in pregnant ewes at high altitude. Quart. J. Exp. Physiol. 47,74–92.
etcalfe, J., McCutcheon, I.E., Francisco, D.L., Metzenberg, A.B., Welch, J.E.,1981. Oxygen availability and growth of the chick embryo. Respir. Physiol.46, 81–88.
onge, C.C., Leon-Velarde, F., 1991. Physiological adaptation to high altitude:oxygen transport in mammals and birds. Physiol. Rev. 71, 1135–1172.
X
Z
ogy & Neurobiology 159 (2007) 155–162
oore, L.G., 2003. Fetal growth restriction and maternal oxygen transportduring high altitude pregnancy. High Alt. Med. Biol. 4, 141–156.
oore, C.R., Price, D., 1948. A study at high altitude of reproduction, growth,sexual maturity, and organ weights. J. Exp. Zool. 108, 171–216.
oore, L.G., Rounds, S.S., Jahnigen, D., Grover, R.F., Reeves, J.T., 1982. Infantbirth weight is related to maternal arterial oxygenation at high altitude. J.Appl. Physiol. 52, 695–699.
ortola, J.P., 2001. Respiratory Physiology of Newborn Mammals. A Compara-tive Perspective. The Johns Hopkins University Press, Baltimore, Maryland,p. 344.
ulder, A.L.M., van Golde, J.C., Prinzen, F.W., Blanco, C.E., 1998. Cardiacoutput distribution in response to hypoxia in the chick embryo in the secondhalf of incubation time. J. Physiol. (London) 508, 281–287.
ulder, A.L.M., Miedema, A., De Mey, J.G.R., Giussani, D.A., Blanco, C.E.,2002. Sympathetic control of cardiovascular response to acute hypoxemiain the chick embryo. Am. J. Physiol. 282, R1156–R1163.
kubo, S., Mortola, J.P., 1988. Long-term respiratory effects of neonatal hypoxiain the rat. J. Appl. Physiol. 64, 952–958.
rader, A., Tanner, J.M., Harnack, von, G.A., 1963. Catch-up growth followingillness or starvation. An example of developmental canalization in man. J.Pediatr. 62, 646–659.
obinson, J.S., Jones, C.T., Kingston, E.J., 1983. Studies on experimental growthretardation in sheep. The effects of maternal hypoxaemia. J. Dev. Physiol.5, 89–100.
ant’Anna, G., Mortola, J.P., 2003. Inter-organ unevenness and catch-up growthin rats. Growth Dev. Aging 67, 27–46.
mith, A.H., Burton, R.R., Besch, E.L., 1969. Development of the chick embryoat high altitude. Fed. Proc. 28, 1092–1098.
tock, M.K., Metcalfe, J., 1987. Modulation of growth and metabolism of thechick embryo by a brief (72-hr) change in oxygen availability. J. Exp. Zool.Suppl. 1, 351–356.
trick, D.M., Waycaster, R.L., Montani, J.-P., Gay, W.J., Adair, T.H., 1991. Mor-phometric measurements of chorioallantoic membrane vascularity: effectsof hypoxia and hyperoxia. Am. J. Physiol. 260, H1385–H1389.
azawa, H., Mikami, T., Yoshimoto, C., 1971. Effect of reducing the shell areaon the respiratory properties of chicken embryonic blood. Respir. Physiol.13, 352–360.
leck, C.M., Vleck, D., Hoyt, D.F., 1980. Patterns of metabolism and growthin avian embryos. Am. Zool. 20, 405–416.
agner-Amos, K., Seymour, R.S., 2003. Effect of local shell conductance onthe vascularisation of the chicken chorioallantoic membrane. Respir. Physiol.Neurobiol. 134, 155–167.
angensteen, O.D., Rahn, H., Burton, R.R., Smith, A.H., 1974. Respiratorygas exchange of high altitude adapted chick embryos. Respir. Physiol. 21,
61–70.u, L., Mortola, J.P., 1989. Effects of hypoxia or hyperoxia on the lung of thechick embryo. Can. J. Physiol. Pharmacol. 67, 515–519.
amudio, S., 2003. The placenta at high altitude. High Alt. Med. Biol. 4,171–191.


