Embed Size (px)
Citation preview

A
varmfoptsutca©
K
1
g(tcl
0d
Available online at www.sciencedirect.com
Journal of Membrane Science 313 (2008) 23–43
Organic compounds passage through RO membranes
Dan Libotean a, Jaume Giralt a, Robert Rallo b, Yoram Cohen c,1, Francesc Giralt a,∗,Harry F. Ridgway d, Grisel Rodriguez d, Don Phipps d
a Grup de Fenomens de Transport, Departament d’Enginyeria Quimica, Universitat Rovira i Virgili,Av. Paısos Catalans, 26, 43007 Tarragona, Catalunya, Spain
b Grup de Fenomens de Transport, Departament d’Enginyeria Informatica i Matematiques, Universitat Rovira i Virgili,Av. Paısos Catalans, 26, 43007 Tarragona, Catalunya, Spain
c Chemical and Biomolecular Engineering Department, 5531 Boelter Hall, University of California, Los Angeles,CA 90095-1592, United States
d Orange County Water District, Fountain Valley, CA 92708, United States
Received 23 June 2007; received in revised form 13 November 2007; accepted 24 November 2007Available online 5 December 2007
bstract
Organic solute permeation, sorption, and rejection by reverse osmosis membranes, from aqueous solutions, were studied experimentally andia artificial neural networks (ANN)-based quantitative structure–property relations (QSPR), for a set of fifty organic compounds for polyamidend cellulose acetate membranes. Membrane solute sorption and passage for dead-end filtration model experiments were quantified based onadioactivity measurements for radiolabeled compounds in the feed, permeate and the membrane, while solute rejection was determined from aass balance on the permeated solution volume. Artificial neural networks-based quantitative structure–property relations models were developed
or the organic passage (P), sorbed (M) and rejected (R) fractions using the most relevant set of molecular descriptors selected from a poolf 45 molecular descriptors by means of a correlation-based feature selection method and self-organizing maps (SOM). The analysis includedre-screening with principal components analysis and SOM of the chemical domain for the study chemicals as defined by chemical descriptorso identify the applicability domain and chemical similarities. The QSPR models predicted the P and M mass fractions within the range of thetandard deviations of measurements for the experimental data set of fifty compounds. Mass balance closure (requiring that M, P and R sum tonity) was satisfactory for the experimental data set of fifty compounds and for an external set of 144 test chemicals, which were not included in
he model development. Somewhat higher prediction errors were encountered for a few chemicals that were not well represented within the presenthemical domain. The quality of the QSPR/NN models developed suggests that there is merit in extending both the present compound databasend the present approach to develop a comprehensive tool for assessing organic solute behavior in RO water treatment processes.2007 Elsevier B.V. All rights reserved.
anic r
erobe
eywords: Reverse osmosis; Neural networks; Organic chemical passage; Org
. Introduction
In recent years there has been a growing interest in the inte-ration of low pressure reverse osmosis (RO) and nanofiltrationNF) membrane technologies for municipal and industrial water
reatment [1]. Such membranes have been touted as suitable forost-effective desalination and the removal of a wide range ofow-molecular-weight (LMW) trace organic constituents. How-∗ Corresponding author. Tel.: +34 977 559638; fax: +34 977 559621.E-mail addresses: [email protected] (Y. Cohen), [email protected] (F. Giralt).
1 Tel.: +1 310 825 8766.
bcnvmodi
376-7388/$ – see front matter © 2007 Elsevier B.V. All rights reserved.oi:10.1016/j.memsci.2007.11.052
ejection; QSPR
ver, the widespread acceptability of RO for the above use willequire careful assessment of the expected membrane passagef undesirable organics (or rejection) as well as their sorptiony the membrane [2]. Compounds of particular interest includendocrine disruptors, human and animal antibiotics, disinfectionyproducts, insecticides and herbicides, and various pharma-eutical drugs. Many of these compounds have been detected inatural ecosystems at bioactive concentrations [3–5]. Althougharious models have been proposed regarding the mechanism of
embrane fouling, to date, deterministic mechanistic models ofrganic fouling and rejection performance are lacking, in part,ue to the complexity of organic solutes and foulant precursorsnteractions with polymeric membranes [6–8].

2 embr
tpdph(imHmpSr2imatnsc(pdaoahanfNataodwdumfdm
ophpmstipio
pcirpo
pocm(e3ecwwsctdao
ann(awodrloco
aphflwrcaaspaBe
4 D. Libotean et al. / Journal of M
Studies on organic fouling of RO membranes have shownhat the rejection of organic substances is governed by theirhysicochemical properties (e.g., molecular size, solubility,iffusivity, polarity, hydrophobicity, and charge), membraneroperties (e.g., permeability, pore size, surface roughness,ydrophobicity, and charge) and process operating conditionse.g., flux, transmembrane pressure and temperature) [2,7–16]. Its generally held that, solute retention increases with increasing
olecular size (which often correlates with molecular weight).owever, several studies [12,14] have shown that even largeolecules, such as certain endocrine disrupting compounds, can
ass through RO membranes. The early work of Matsuura andourirajan [7] investigated the correlation of cellulose acetateejection of 54 organic compounds (32 alcohols and phenols and2 mono-carboxylic acids) as a function of the relative acid-ty of the molecule, estimated by the shift in the OH- band
aximum in the IR spectra, and of the Taft number, whichccounted for the effect of substituents on the polar effect ofhe organic molecule [17]. The rejection of alcohols and phe-ols was reported to decrease with increasing acidity with ateep change in rejection for the low acidity range. For mono-arboxylic acids, the rejection decreased with increased acidityas represented by the pKa) to a minimum level, thereafter dis-laying increased rejection with increased acidity. The rejectionecreased with increasing Taft number for alcohols, phenolsnd aliphatic mono-carboxylic acids, while a reverse trend wasbserved for substituted benzoic acids. Kastelan-Kunst et al. [9]lso reported that the rejection of organic compounds (3 alco-ols, 1 aldehyde, 1 ketone, 1 ester, 1 ether), by FT30 cellulosecetate RO membranes, decreased linearly with increased Taftumber. Van der Bruggen et al. [10] measured the rejection ofour pesticides (atrazine, simazine, diuron, isoproturon) by fourF membranes (three polyamides and one polyethersulfone)
nd concluded that the rejection of organics of approximatelyhe same size decreased with increasing solute dipole moment. Inlater study, Van der Bruggen et al. [11] correlated the rejectionf 25 organics (including alcohols, ketones, esters, sugars andyes) in NF membranes (two polyamides and two polysulfones)ith solute size parameters, such as molecular weight, Stokesiameter and equivalent molar diameter (derived from molar vol-me), and a molecular diameter (obtained based on optimizedolecular configuration). The above studies demonstrated that
or RO and NF membranes organic solute rejection generallyecreased with increasing dipole moment and increased witholecular size.Kiso et al. [12] reported that rejection of 14 pesticide by
ne RO membrane (polyamide) and three NF membranes (oneolyamide and two polyethersulfone) increased with soluteydrophobicity as quantified by the organic solute octanol–waterartition coefficient (log P). Rejection also increased witholecular weight and molecular width. Kiso et al. [13,14]
howed in subsequent studies, with the same four membranes,hat the rejection of alcohols and saccharides increased with
ncreased molecular width. The rejection of aromatic com-ounds (11 alkyl phthalates and 7 mono-substituted benzenes)ncreased with log P, with the best linear correlation (R2 = 0.81)btained for the mono-substituted benzenes. Rejection of alkyltwpq
ane Science 313 (2008) 23–43
hthalates was higher than 95% for 9 of the 11 compoundsonsidered for membranes that displayed high NaCl rejection,rrespective of their log P values. For membranes with low NaClejection, high organic rejection (>90%) was observed for com-ounds with log P > 4.7, while low organic rejection (<40%) wasbtained for compounds with log P < 4.
Ozaki and Li [8] evaluated, for charged ultra-low pressureolyamide membranes, the correlation of the rejection of 19rganic compounds (5 alcohols, 9 phenols, acetic acid, urea, glu-ose, aniline and methyl chlorophenoxy acetic acid) with theirolecular weight, molecular size and acid dissociation constant
pKa). At pH 5 and 9, organic solute rejection increased lin-arly (with R2 > 0.96) with molecular weight in the range of0–180 Da for 6 of the undissociated organics (methyl alcohol,thyl alcohol, ethylene glycol, triethylene glycol, urea, glu-ose), excluding benzyl alcohol. Rejection correlated linearlyith molecular width (R2 > 0.94) for the undissociated organicshen triethylene glycol was excluded. The rejection of dis-
ociated organics (9 phenols, acetic acid, aniline and methylhlorophenoxy acetic acid), however, did not correlate with nei-her molecular weight nor molecular width, but rejection didecrease linearly with the pKa at pH of 5, while two distinctnd separable linear domains below and above pKa ≈ 7 werebserved.
Kimura et al. [15] reported for a polyamide RO membranen increased rejection with increased molecular weight for 11eutral endocrine disruptors (4 phenylphenol, carbaryl, bisphe-ol A, and 17beta estradiol) and pharmaceutical compoundsphenacetine, primidone, isopropylantipyrine, carbamazepine,nd sulphamethoxazole). These authors also noted consistentith previous studies [10] that the rejection of organic solutes,f approximately the same size, by a polyamide membraneecreased with increasing dipole moment. However, increasedejection with increased dipole moment was observed for the cel-ulose acetate membrane. Interestingly, for either the polyamider the cellulose acetate membranes, there was no apparentorrelation between organic solute rejection and the solutectanol–water partition coefficient.
Characterization of rejection by polyamide, cellulose acetatend polysulfone membranes for a mixed set of 22 organics (7henols, 11 alkyl alcohols, benzene, toluene, acetone and cyclo-exane) was reported by Schutte [18]. A correlation for soluteux, based on a simplified solvophobic theory, was proposedith the adjusted total cavity surface area parameter. In a later
eview, Bellona et al. [19] proposed a diagram for qualitativelassification of organic solute rejection (as either low, moder-te or high) based on experts’ assessment of the main factorsffecting rejection. While the above heuristic approach was atep forward, the present study demonstrates that solute-relatedarameters (or descriptors) can be selected quantitatively usingdvanced feature selection algorithms. More recently, Van derruggen et al. [20] extended the qualitative approach of Bellonat al. [19] by providing a classification of observed experimen-
al rejection ranges based on a number of parameters (moleculareight, log P, molecular size, molecular weight cutoff, pH andKa and membrane charge). The above approach provided aualitative heuristic classification of compounds into ten fami-
embr
li
NdTwpbmopdiaqcwso(QpceebocDcspAo
2
2
lRdiU[tALUoarbap
iwtd
c[ICBc(ifwwaaw9(
elMamAtOtmutibg(ahatip
2
ftpLp
D. Libotean et al. / Journal of M
ies with the corresponding rejection ranges for the compoundsn the specific families.
The existing literature on organic solute rejection by RO andF membranes summarized above reveals that while rejectionepends on molecular parameters, conflicting trends still exist.hese studies have mostly focused on the correlation of rejectionith a few molecular properties for a small number of com-ounds belonging to narrow chemical classes. Clearly, it woulde beneficial to develop predictive models based on a detailedechanistic understanding of the reasons for the observed
rganic solute rejection levels (or passage) as a function of theroperties of the solute and the membrane. Nevertheless, this is aaunting task given the large number of current and future organ-cs (and compound classes) that may be of concern in municipalnd industrial wastewaters. An alternative approach is to developuantitative structure–property relations (QSPR) models thatonsider the simultaneous correlation of organic solute rejectionith multiple molecular parameters for the membranes con-
idered, with the potential for being applied to a broad-rangef compound classes. In this regard, artificial neural networksANN) offer a unique capability for building multi-parameterSPRs with wide applicability domains. ANN models have beenroposed for surface fouling diagnosis [21–25] and for chemi-al property estimation [26–32]. Accordingly, the current studyxplores the potential application of ANN-based QSPR mod-ls for the analysis and prediction of organic solute rejectiony RO membranes. The QSPR/ANN models have been devel-ped with experimental RO performance data generated by aomprehensive experimental study at the Orange County Wateristrict of Southern California [33] for fifty different organic
ompounds and five different commercial RO membranes. Aystematic approach has been applied to select the most appro-riate model input variables to correlate and estimate, withNN-based QSPR models, the passage, sorption and rejectionf organic compounds by RO membranes.
. Experimental
.1. Organic compounds and membranes
The set of 50 compounds listed in Table 1 , mostly of pub-ic health concern, was selected for a detailed experimentalO study by the Orange County Water District (OCWD) asetailed elsewhere [33]. The selection was made based on annterrogation of a number of available databases, including the.S. Geological Survey Toxic Substances Hydrology Program
34], U.S. Environmental Protection Agency Unregulated Con-aminant Monitoring Rule [35], U.S. Environmental Protectiongency Announcement of the Drinking Water Contaminantist [36], and the California Department of Health Servicesnregulated Chemicals Requiring Monitoring [37]. The listf compounds includes endocrine disruptors, pharmaceuticallyctive compounds, antibiotics and antimicrobial agents, neu-
oactive drugs, insecticides, herbicides, pesticides, disinfectionyproducts, solvents and fuel hydrocarbons. Several aminocids were also considered to broaden the range of molecularroperties variations. In addition to the above, another 144 chem-cttm
ane Science 313 (2008) 23–43 25
cals (listed in Supplementary data) of water quality concernere evaluated with respect to their estimated rejection using
he present model with the results provided as Supplementaryata.
The organic compounds used in the experimental part of theurrent study, which was carried out at the OCWD facilities33], were obtained from American Radiolabeled Chemicals,nc., St. Louis, MO; Amersham, Piscataway, NJ; ICN, Irvine,A; PerkinElmer Life Sciences, Inc., Boston, MA; Moravekiochemicals, Inc., Brea, CA and Sigma, St. Louis, MO. Allompounds, with purity >99%, were stored either at 4 or −20 ◦Cdepending on the compound) for a minimal period of time (typ-cally less than one week) prior to assay to lessen the opportunityor post-manufacture chemical changes. Compounds labeledith 14C were chosen preferentially over compounds labeledith 3H to reduce the possibility of radiolysis during storage
nd to suppress 3H proton exchange with water during inter-ction with the membrane [38]. Only four compounds labeledith 3H were used; these were cimetidine (CAS 51481-61-), beta-sitostanol-n-hydrate (CAS 19466-47-8), doxycyclineCAS 564-25-0) and tetracycline (CAS 60-54-8).
Organic compound passage and sorption were obtainedxperimentally for four polyamide membranes and one cellu-ose acetate membrane, whose properties are listed in Table 2.
embrane properties include contact angle, zeta potentialnd zeta potential slope (at the pH range of 5–7), root-ean-square (RMS) surface roughness and specific water flux.dditional information for the polyamide membranes include
he polyamide layer thickness, two COO−/amide ratios and theH−/amide ratio derived from attenuated total internal reflec-
ion Fourier transform infra-red (ATR-FTIR) spectroscopiceasurements. These four polyamide membrane parameters are
nitless relative indices based on ratios between the absorp-ion at different wavelengths corresponding to the presencen the membrane of carboxyl group (1415 cm−1), amide Ionds (1665 cm−1), amide II bonds (1542 cm−1), hydroxylroup (3400 cm−1) and polysulfone membrane support layer874 cm−1). The contact angles along with the zeta potentialre typically used as indicators of the degree of membraneydrophilicity. The RMS surface roughness is also reported assurrogate measure that indicates possible differences in sorp-
ion surface area. Finally, the polyamide layer thickness is alsoncluded in Table 2 because it directly affects membrane trans-ort resistance of the polyamide membranes.
.2. RO membrane characterization studies
The organic compounds selected and a summary of the rangesor their experimentally measured organic passage and sorp-ion fractions are provided in Table 1 for the four commercialolyamide (PA) reverse osmosis membranes (BW30, ESPA2,FC1, TFCHR) and a cellulose acetate (CA) membrane, whoseroperties are given in Table 2. Details of the experimental study
an be found elsewhere [33]. Briefly, membrane characterizationests consisted of determining solute permeation and sorption,hereby enabling calculation of rejection in a series of dead-endembrane filtration experiments carried out in the apparatus

26 D. Libotean et al. / Journal of Membrane Science 313 (2008) 23–43
Table 1Sorbed (M) and passage (P) fractions of the organic compounds screened for the polyamide and cellulose acetate membranes listed in Table 2 with identification ofapplication and/or effects
Familya CAS Name CA PAs (BW30, ESPA2, LFC1, TFCHR) Compound class, known useand/or toxicity endpoint
M × 100 P × 100 M range × 100 P range × 100
A 15972-60-8 2-Chloro-2′,6′-diethyl-N-(methoxymethyl)acetanilide(alachlor)
5.2–21.2 0.4–2.4 Endocrine disruptor
A 71-43-2 Benzene 43.4 56.6 64.0–78.6 19.5–26.0 Fuel hydrocarbon-carcinogenA 80-05-7 2,2-bis(4-
Hydroxyphenyl)propane(bisphenol A)
99.1 0.9 16.1–28.3 0.6–3.1 Estrogenic/antiandrogenhousehold waste waterproduct
A 58-08-2 1,3,7-Trimethyl-2,6-dioxo-1,2,3,6-tetrahydropurine(Caffeine)
10.1 75.5 14.1–21.8 14.6–20.6 Pharmaceutical human drug
A 2921-88-2 O,O-diethyl-O-(3,5,6-trichloro-2-pyridinyl)phosphorothioicacid (clorpyrifos)
97.1 2.9 21.2–59.6 0.66–1.1 Insecticide-industrial/household wastewater product
A 57-88-5 (3beta)-Cholest-5-en-3-ol(cholesterol)
16.5 0.3 12.6–17.9 0.1–0.4 Pharmaceutical sex/steroidhormone-fecal indicator
A 51481-61-9 2-Cyano-1-methyl-3-(2-(((5-methylimidazol-4-yl)methyl)thio)ethyl)guanidine(cimetidine)
21.7 59.9 13.4–34.1 5.2–19.6 Pharmaceutical human drug
A 76-57-3 3-o-Methylmorphinemonohydrate (codeine)
26.2 57.3 13.1–47.7 7.7–15.4 Pharmaceutical human drug
A 120-83-2 2,4-Dichlorophenol 97.6 2.4 82.6–98.0 2.0–7.4 Algicide, antihelmintic,bactericid, agriculturalfungicide
A 94-75-7 2,4-Dichlorophenoxyaceticacid
5.3 43.7 3.9–17.3 4.8–15.8 Endocrine disruptor
A 84-66-2 1,2-Benzenedicarboxylic aciddiethyl ester(diethylphthalate)
83.5 16.5 29.9–41.2 1.5–6.8 Plasticizer-industrial/household wastewater product
A 56-53-1 3,4-bis(p-Hydroxyphenyl)-3-hexene(diethylstilbestrol)
99.7 0.3 18.4–47.8 0.1–0.2 Pharmaceutical-estrogen-carcinogen
A 121-14-2 2,4-Dinitrotoluene 92.9 7.1 94.9–98.3 1.7–5.1 Production of isocyanate andexplosives-carcinogen
A 57-91-0 17a Estradiol 97.5 2.5 67.3–85.9 0.2–1.7 Pharmaceutical-estrogen-sex/steroidhormone
A 53-16-7 1,3,5(10)-Estratrien-3-ol-17-one(estrone)
97.3 2.7 69.6–99.8 0.2–0.9 Pharmaceutical-sex/steroidhormone
A 100-41-4 Ethylbenzene 66.6 25.6 96.5–98.4 1.6–3.6 Fuel hydrocarbonA 71-00-1 2-Amino-3-(3H-imidazol-4-
yl)propanoic acid(histidine)
8.8 45.3 4.6–8.0 11.7–17.3 Amino acid
A 15687-27-1 2-[4-(2-Methylpropyl)phenyl]propanoicacid (ibuprofen)
20.5 58.0 8.6–18.4 4.0–16.2 Non-steroidalanti-inflammatory drug
A 58-89-9 1,2,3,4,5,6-Hexachlorocyclohexane(lindane)
98.5 1.5 37.3–66.3 0.9–2.4 Insecticide
A 298-00-0 O,O-Diethyl-O-4-nitro-phenylthiophosphate (methylparathion)
97.8 2.2 12.0–28.2 1.0–3.5 Insecticide
A 98-95-3 Nitrobenzene 65.5 34.5 99.5–99.7 0.3–0.5 Solvent and mild oxidizingagent
A 104-40-5 4-Nonylphenol 96.0 0.7 21.0–69.9 0.3–0.3 Surfactant (endocrinedisruptor)
A 87-86-5 2,3,4,5,6-Pentachlorophenol 97.8 2.2 44.7–68.7 0.4–5.1 Endocrine disruptorA 108-95-2 Phenol 28.3 71.7 60.0–65.3 30.4–35.4 Phenolic compound

D. Libotean et al. / Journal of Membrane Science 313 (2008) 23–43 27
Table 1 (Continued )
Familya CAS Name CA PAs (BW30, ESPA2, LFC1, TFCHR) Compound class, known useand/or toxicity endpoint
M × 100 P × 100 M range × 100 P range × 100
A 85-44-9 1,2-Benzenedicarboxylicanhydride (phthalicanhydride)
6.2 29.1 1.7–3.5 6.1–8.1 Plasticizer-industrial/household waste waterproduct
A 57-83-0 Pregn-4-ene-3,20-dione(progesterone)
98.5 1.5 23.3–34.2 0.0–0.3 Pharmaceutical-sex/steroidhormone
A 19466-47-8
beta-Sitostanol-n-hydrate 28.2 0.7 14.3–48.6 0.4–0.5 Plant sterol-endocrinedisruptor
A 58-22-0 17b-Hydroxy-4-androsten-3-one(testosterone)
74.4 21.0 11.7–41.2 0.5–2.3 Hormone
A 108-88-3 Toluene 52.2 47.8 81.0–98.5 1.5–19.0 Solvent (carcinogen)A 85-01-8 Phenanthrene 99.6 0.4 85.3–99.7 0.3–0.7 Polycyclic aromatic
hydrocarbon
B 56-41-7 2-Aminopropanoic acid(alanine)
6.8 53.9 4.2–5.8 10.2–18.5 Amino acid
B 70-47-3 2-Amino-3-carbamoylpropanoic acid(asparagine)
0.7 65.0 2.4–7.4 6.9–31.9 Amino acid
B 56-84-8 2-Aminobutanedioic acid(aspartic acid)
8.5 34.2 2.8–5.5 9.7–15.7 Amino acid
B 52-90-4 2-Amino-3-mercaptopropanoic acid(cysteine)
9.4 43.9 5.0–12.6 7.0–17.8 Amino acid
B 79-43-6 2,2-Dichloroacetic acid 6.2 41.3 7.1–8.8 16.5–30.6 Disinfect byproductB 124-40-3 N,N-Dimethylamine 13.3 54.9 6.9–28.8 28.6–34.7 Raw material, or solvent in
synthesisB 56-40-6 Aminoethanoic acid (glycine) 6.7 56.4 3.4–6.5 14.9–26.9 Amino acidB 56-87-1 (S)-2,6-Diaminohexanoic
acid (lysine)9.3 51.9 2.4–6.9 6.2–14.2 Amino acid
B 63-68-3 (S)-2-Amino-4-(methylsulfanyl)-butanoicacid (methionine)
8.6 46.9 4.1–25.1 10.3–24.1 Amino acid
B 62-75-9 N-Nitroso dimethyl amine 3.5 94.1 0.5–21.3 78.7–86.8 CarcinogenB 75-65-0 t-Butyl alcohol 4.0 87.4 5.2–10.1 17.0–25.9 Alcohol (used as industrial
solvent)B 72-19-5 (2S,3R)-2-Amino-3-
hydroxybutanoic acid(threonine)
7.5 45.7 3.6–4.9 9.2–12.0 Amino acid
B 76-03-9 Trichloroacetic acid 4.2 60.1 2.0–8.8 12.8–29.1 Disinfection byproductB 57-13-6 Urea 3.1 90.6 1.4–8.3 85.1–95.5 FertilizerB 72-18-4 (S)-2-Amino-3-methyl-
butanoic acid(valine)
5.6 62.7 4.6–8.8 11.1–23.0 Amino acid
B 127-18-4 1,1,2,2-Tetrachloroethylene 67.8 30.8 99.7–100.0 0.0–0.3 Industrial chlorinated solvent
DB 85721-33-1
1-Cyclopropyl-6-fluoro-1,4-dihydro-4-oxo-7-(1-piperazinyl)-3-quinolinecarboxylic acid(ciprofloxacin)
27.0 35.0 2.7–30.5 2.1–10.6 Pharmaceuticalhuman/veterinary antibiotic
DB 564-25-0 4-(Dimethylamino)-1,4,4a,5,5a,6,11,12a-octahydro-3,5,10,12,12a-pentahydroxy-6-methyl-1,11-dioxo-2-naphthacenecarboxamidemonohydrate (doxycycline)
30.6 18.0 10.5–16.7 3.3–10.2 Pharmaceuticalhuman/veterinary antibiotic
DB 60-00-4 Ethylenediaminetetraaceticacid
7.5 48.1 2.0–9.1 5.3–14.3 Chelating agent
DB 60-54-8 Tetracycline 14.4 32.3 7.7–18.9 2.9–7.1 Antibiotic
a Chemical space family as identified in Fig. 2a. A: Family A; B: Family B; DB: domain border.

28 D. Libotean et al. / Journal of Membrane Science 313 (2008) 23–43
Table 2Properties of the membranes used in the current study
Membrane properties BW30 ESPA2 LFC1 TFCHR CA
Contact angle (◦) 61.5 61.3 61.7 61.5 66.2Zeta potential (mV) −12.8 −26.0 −17.3 −16.3 −22.4Zeta potential slope (pH 5–7) −2.67 −5.00 −1.03 −1.61 −0.62COO-/amide I ratio 0.46 0.31 0.43 0.33 –COO-/amide II ratio 0.42 0.27 0.42 0.33 –OH-/amide I ratio 2.09 0.53 1.37 0.80 –Polyamide thickness 1.30 1.31 1.19 0.69 –Roughness (nm) 82.9 90.9 111.5 48.6 44.6Specific water flux (m3 m−2 s−1 kPa−1) 1.03 1.44 1.44 1.23 0.34
B tec);f ion RR
dasmdfbfic
a((fmflphcii
Ft
1w
(ua(cotwtfifwe#l
W30: thin film composite (TFC) brackish water RO membrane (DOW Filmouling brackish water RO membrane (Hydranautics); TFCHR: TFC high rejectO membrane (Osmonics).
epicted in Fig. 1. Solute mass in the feed, collected permeatend sorbed by the membrane was determined based on mea-urements of the radioactivity of the feed, permeate and theembrane itself. Solute mass rejected by the membrane was
etermined by the difference between the solute mass in theeed charge and the sum of the mass accumulated on the mem-rane plus the organic compound mass in the permeate. At leastve measurements were performed for each membrane–soluteombination.
The membrane performance studies were carried out usingsmall dead-end stainless-steel/Teflon pressure filtration cell
VWR, Bristol, CN), which supported the membrane coupon1.25 cm diameter) on a perforated stainless steel disk with theeed surface sealed with a Teflon O-ring. Membrane sampleseasuring 10.1 cm × 15.2 cm were preconditioned under cross-ow conditions in a plate-and-frame stainless steel RO cell at aressure of 1034 kPa 16 h using 1 �mho/cm deionized water toydrate and clean the membranes. Following preconditioning,
ircular 1.25 cm diameter coupons of membrane were cut for usen a high-pressure dead-end filtration cell drawn schematicallyn Fig. 1. These conditioned membrane coupons were stored inig. 1. Schematic illustration of solute permeation, rejection and retention byhe RO membrane in the experimental dead-end filtration mode.
(Ai1nir
cMhO(wigmw1otti
ESPA2: TFC brackish water RO membrane (Hydranautics); LFC1: TFC lowO membrane (Koch Membrane Systems); CA: cellulose acetate brackish water
7 M�-cm ASTM I ultrapure water at 4 ◦C for no more than 1eek before use.Prior to each experiment, the feed side of the pressure cell
Fig. 1) was filled with 5 ml feed solution, prepared usingltrapure water, with the target organic at concentration ofbout 9 �M, resulting in typically 105–106 disintegrations/minDPM) of the radiolabeled (14C or 3H) test compound. At thisoncentration, the effects of concentration polarization on thesmotic pressure were expected to be relatively low, despitehe dead-end filtration mode of operation. All the experimentsere carried out at 1034 kPa and 24 ◦C with the feed solu-
ion pH adjusted to 7 using HCl or NaOH. A minimum ofve replicate membrane performance measurements were per-ormed for each membrane–solute combination. All componentsere thoroughly cleaned and decontaminated prior to each
xperiment with a radiodecontamination solution (Radiocwash005-400, Biodex Medical Systems, Inc., Shirley, MA), fol-owed by detergent cleaning to remove organic contaminantsMicro-90, International Products Corporation, Burlington, NJ).ll system components were subsequently washed with deion-
zed water and subsequently soaked in water for a minimum ofh. Prior to use all system components were scrubbed with aylon bristle brush, rinsed with deionized water followed by rins-ng with 70% laboratory grade denatured ethanol, an additionalinse with deionized water and finally drying in air.
Permeate product was collected in a 10 ml of scintillationocktail (SC) solution (Optifluor, Packard Instrument Company,eriden, CT) in a 22 ml scintillation vial, through a 18-gauge
ypodermic needle attached to the pressure cell product side.nce a permeate volume of approximately 0.5 ml was collected
and weighted to precision of ±0.005 g), the membrane couponas removed and rinsed by sequentially immersing and swishing
n three 400 ml beakers containing 350 ml of 17 M�-cm ASTM Irade ultrapure water. Excess solution was wicked away from theembrane surface using an adsorbent paper and the membraneas then immersed into a 22 ml scintillation vial containing0 ml of the SC solution. Membrane samples were incubatedvernight in order to facilitate permeation of the cocktail into
he membrane material. The above procedure yielded higherhan 99% recovery of membrane-retained (i.e., sorbed) organ-cs. Scintillation vials containing feed, permeate and membrane
embrane Science 313 (2008) 23–43 29
sLSuerS
3
3
tl4fiDs[wtMltraivtosc[
ibrbMiiievligoodfatqso
Table 3Initial set of molecular descriptors and membrane properties
Molecular descriptors1 Atom count (all atoms)2 Bond count (all bonds)3 Bond count (single bonds)4 Bond count (double bonds)5 Ring count (all rings)6 Size of smallest ring7 Size of largest ring8 Molecular weight (Da)9 Connectivity index order 0
10 Connectivity index order 111 Connectivity index order 212 Valence connectivity index order 013 Valence connectivity index order 114 Valence connectivity index order 215 Shape index kappa116 Shape index kappa217 Shape index kappa318 Moment of inertia A (g cm2)19 Moment of inertia B (g cm2)20 Moment of inertia C (g cm2)21 Solvent accessibility surface area (A2)22 Polarizability (A3)23 Dipole moment (C m)24 Dipole vector X (C m)25 Dipole vector Y (C m)26 Dipole vector Z ( C m)27 Dipole point-charge (C m)28 Dipole hybridization (C m)29 HOMO energy (eV)30 LUMO energy (eV)31 Dielectric energy (kcal/mol)32 Steric energy (kcal/mol)33 Heat of formation (kcal/mol)34 One term energy electron–electron repulsion (eV)35 One term energy electron–nuclear attraction (eV)36 One term energy total (eV)37 Two-center energy electron–electron repulsion (eV)38 Two-center energy electron–nuclear attraction (eV)39 Two-center energy nuclear–nuclear repulsion (eV)40 Two-center energy total electrostatic (eV)41 Two-center energy resonance (eV)42 Two-center energy exchange (eV)43 Two-center energy total (eV)44 Total energy (eV)45 Molar refractivity
Membrane properties46 Contact angle (◦)47 Zeta potential (mV)48 Zeta potential slope (pH 5–7)49 COO-/amide I ratio50 COO-/amide II ratio51 OH-/amide I ratio52 Polyamide thickness53 Roughness (nm)54 Specific water flux (m3 m−2 s−1 kPa−1)
Molecular descriptors and membrane properties selected for at least one modelare highlighted in italic boldface. Variable from 1 to 45 represent moleculardescriptors, while variables from 46 to 54 are properties of the membranes.Variables 49 to 52 refer only to the polyamide membranes.
D. Libotean et al. / Journal of M
amples were analyzed using a scintillation counter (WallacKB 1219 Rackbeta Liquid Scintillation Counter, PerkinElmer,helton, CT). Quench and counting efficiency were correctedsing the external sample channel ratio method with 226Ra as thexternal standard to yield a DPM measurement, which was cor-ected for background DPM measured for a 10 ml of a referenceC solution.
. Model development
.1. Model input and output parameters
Molecular descriptors were derived from molecular calcula-ions given the chemical structures of the selected compoundsisted in Table 1. The initial set of descriptors (Table 3) included5 molecular solute descriptors. Molecular structures wererst drawn using ACD/ChemSketch 8.00 (Advance Chemistryevelopment Inc.) [39] and converted to three-dimensional
tructures using the CAChe Software (Oxford Molecular Ltd.)40]. The geometry of the three-dimensional structures for theater dissolved compounds were subsequently optimized using
he molecular orbital package (MOPAC) with the AM1 (Austinodel) Hamiltonian [41,42]. The initial set of 45 molecu-
ar descriptors (Table 3) was selected to ensure inclusion ofhe major descriptors that have been shown effective for neu-al network-based correlations of chemical properties such asqueous solubility [28], octanol–water partition coefficient [30],nfinite-dilution activity coefficient [32], critical properties [27],apor pressure [29] and Henry’s law constant [31], in addi-ion to those correlating descriptors reported in previous studiesf organic solute rejection by RO membranes [7–15]. Theelected chemical descriptors included constitutional, topologi-al, geometrical, electrostatic and quantum chemical parameters42].
The constitutional descriptors included the number of atomsn the solute molecule, bond counts (single bonds and doubleonds), number of rings, size of the smallest and the largesting, and molecular weight. The bonds count excluded ioniconds, and the coordinate bonds were counted as simple bonds.olecular topological descriptors included three connectivity
ndices [43,44] of orders 0, 1 and 2, three valence connectivityndices [43,44] of orders 0, 1 and 2, and three � (kappa) shapendices of orders 1, 2 and 3 [45]. Molecular connectivity indicesncode two-dimensional structural information into numericalalues based on a molecular structure, which is expressed topo-ogically by a hydrogen-suppressed graph. The connectivityndices are the valence weighted counts of the connected sub-raphs. The zeroth order term (atomic) is related to the degreef branching and size of the molecule expressed as the numberf non-hydrogen atoms. The first order term (bond) represents aissection of the molecular skeleton into “two contiguous bond”ragments. The second order (path) is a weighted count of fourtoms (three-bond) fragment representing the potential of rota-
ion around the central bond. The first order kappa shape indexuantifies the number of cycles in the chemical compound, theecond order kappa shape index quantifies the degree of linearityr star-likeness of the chemical, and the third order kappa shape
3 embr
ic
Botssiam
ipratai(ttc
dTosoairreenteearmwlwTiniotra
ipm
m
P
wcttforpc
3b
tn
X
wtmimto
rdadchiadtsvisoFptvpSi
0 D. Libotean et al. / Journal of M
ndex quantifies the degree of branching toward the center of thehemical.
The geometrical descriptors were the moments of inertia (A,and C) and the solvent accessibility surface area. The moments
f inertia characterize the mass distribution in the molecule andhe susceptibility of the molecule to different rotational tran-itions. Each moment of inertia is defined with respect to apecific rotational axis. The solvent accessibility surface areas the molecular surface area that is accessible for contact with
sphere of 1.4 A2 which approximates the radius of a waterolecule [46].The selected electrostatic descriptors [42] were the polar-
zability, dipole moment, dipole vectors (X, Y and Z), dipoleoint-charge and dipole hybridization. The polarizability rep-esents the response of electron distribution to an externallypplied static electric field. The dipole moment accounts forhe internal separation of the positive and negative charges in
molecule, being a sum of two terms: one term correspond-ng to the non-uniform distribution of the electrons in bondsdipole point-charge), and the second term to the influence ofhe atoms hybridization (dipole hybridization). The dipole vec-ors provide information regarding the spatial orientation of theharge distribution [41].
Quantum chemical descriptors (Table 3) included 15 energyescriptors, heat of formation and molar refractivity [42].he quantum total energy parameter is defined as the sumf one-center and two-center energy terms, which were con-idered as two additional potential chemical descriptors. Thene-center energy terms include electron–electron repulsionnd electron–nuclear attraction. The two-center energy termsnclude resonance energy, exchange energy, electron–electronepulsion, electron–nuclear attraction, and nuclear–nuclearepulsion. The total electrostatic (or Coulombic) interaction isqual to the sum of the following two-center energy terms:lectron–electron repulsion, electron–nuclear attraction anduclear–nuclear repulsion. The resonance energy correspondso the difference in delocalized pi electrons and localized pilectron in a double bond. The exchanged energy involves twolectrons where the energy of attraction is between the nucleind the overlap charge in the bond. HOMO energy is the energyequired to remove an electron from the highest unoccupiedolecular orbital, while the LUMO energy is the energy gainedhen an electron is added to the lowest unoccupied molecu-
ar orbital. The heat of formation is the energy released or usedhen a molecule is formed from elements in their standard state.he steric energy is a summation of the energy terms for all
ncluded bonds, angles and torsions, taking into account also theon-bonded interactions (e.g., van der Waals and electrostaticnteractions). The dielectric energy is the stabilizing portionf the total energy of a molecule that results from screeninghe charges in the molecule by a dielectric. Finally, molecularefractivity is related to the refractive index, molecular weightnd density [47].
Membrane performance parameters included the solute massn the permeate (p) and sorbed by the membrane (m) for a givenermeate volume collected. These performance parameters, nor-alized as the permeate (P) and membrane sorbed (M) solute
su
a
ane Science 313 (2008) 23–43
ass fractions, were determined as,
= p
p + m + r; M = m
p + m + r(1)
here f is the solute mass in a feed charge volume equal to theollected permeate volume, and m and r (i.e., r = f − (p + m)), arehe membrane sorbed and rejected solute mass associated withhe above feed charge volume. It is also noted that the above massractions can also be considered as the fractions of the fluxesf solute permeation and sorption per membrane surface area,elative to the total additive solute mass flux over the permeationeriod. The dimensionless rejected organic fraction, R, was thenalculated from a simple mass balance, i.e., R = 1 − (M + P).
.2. Data conditioning and selection of compoundselonging to the same chemical domain
All model input and output variables (i.e., molecular descrip-ors and solute passage, sorption, and rejection fractions) wereormalized in the range [0,1] as follows:
′ij = Xij − min(Xj)
max(Xj) − min(Xj)(2)
here X′ij denote the normalized variable j (molecular descrip-
or, the P or the M fraction) for compound i and min(Xj) andax(Xj) are the minimum and maximum values of that variable
n the respective dataset. The above normalization was imple-ented to ensure that the importance of the input parameters in
he course of model building was not biased by the magnitudef their native values.
The development of accurate QSPR models requires explo-ation of the chemical space which defines the model applicationomain. Chemicals, such as those listed in Table 1, are usu-lly characterized in terms of molecular descriptors by usingifferent approaches. For example, descriptor value ranges, prin-ipal component ranges, geometric methods based on the convexull, distance-based methods, and probability density model-ng methods can be applied [48]. The principal componentsnalysis (PCA)-based approach, which uses the orthogonal coor-inate system defined by the principal components, is one ofhe most widely adopted approaches. A 2D projection onto thepace spanned by the two first principal components usually pro-ides adequate information about the distribution of data in thenput space. On the other hand, the K-means clustering of theelf-organizing map (SOM) is a suitable alternative to PCA andther standard methods since it integrates most of their features.irst, SOM is a topology preserving projection method, whichermits visualization of the data space in a 2D plot. Second,he SOM clustering process uses Euclidean distances betweenectors formed by the compounds’ chemical descriptors to com-ute the similarity between chemicals in the dataset. Finally, theOM approaches the point probability density of the input space
n such a way that more units are placed in regions of the input
pace where data points are dense (i.e., concentrated) and fewernits where the density is sparse.The PCA and SOM results for 50 chemicals listed in Table 1re shown in Fig. 2a and b, respectively. Each compound in

D. Libotean et al. / Journal of Membr
FS
ta(Aiccsdp
sdup
aatma{aagc5c6csm
emSocdfTe
toFettsonanad(acn(nFa
ig. 2. Analysis of the chemical space by means of (a) PCA; (b) SOM. The 10OM chemical classes are identified with circled numbers.
hese plots is represented by a 45-dimensional vector formed byll 45 descriptors listed in Table 3. The PCA projection resultsFig. 2a) suggest the presence of two chemical families. Family
with the first 30 chemicals and Family B with the follow-ng 16 chemicals listed in Table 1. Fig. 2a also identifies fourhemicals, with their CAS numbers indicated, which are located
loser to the boundaries of the chemical domain (DB chemicals;ee also Table 1) and thus will significantly influence any modeleveloped. Fig. 2b shows the K-means classification of the SOMrototype vectors representing the clusters obtained after clas-(
lt
ane Science 313 (2008) 23–43 31
ifying all 50 chemicals that are also represented by vectors ofescriptors. Ten coherent chemical classes (in terms of molec-lar descriptors) can be identified from the clustering of SOMrototypes in Fig. 2b.
The PCA discrimination between chemicals in Families And B (Table 1) is mainly accomplished by the occurrence ofromatic rings in the former or of amino functional groups inhe latter. Family B contains chemicals without rings in their
olecular structure. Moreover, it includes 9 of the 10 aminocids considered in this study, the exception being Histidine71-00-1} which belongs to Family A because it is an aminocid with an imidazol aromatic ring in its molecule. Family Blso includes three amines, two acids, one alcohol and one halo-enated aliphatic compound. It should also be noted that the 16hemicals of Family B in Fig. 2a (Table 1) constitute class no.in the SOM classification depicted in Fig. 2b, while the 30
hemicals of Family A are clustered in the SOM classes 1, 2, 3,, 7, 8 and 9. Thus, PCA and SOM complement each other in theharacterization of the chemical domain explored in the currenttudy with respect to organic chemicals passages through ROembranes.Of the chemicals near the domain boundary (DB),
thylenediaminetetra-acetic acid {60-00-4} is unique from theolecular structure viewpoint since it constitutes the singleOM class no. 4, i.e., it is not structurally similar to any of thether chemicals in Table 1. The antibiotics tetracycline, doxy-ycline, and ciprofloxacin {60-54-8, 564-25-0, 85721-33-1},etected at the domain borders by the PCA analysis (Fig. 2a),orm another coherent and separate SOM class no. 10 in Fig. 2b.hese three antibiotics are located in the neighborhood ofthylenediaminetetra-acetic acid {60-00-4}.
A more detailed understanding of the chemical domain forhe current 50 chemicals can be obtained from the examinationf the functional groups that best discriminate between the threeamilies of compounds A, B, and DB in Table 1, as suggestedlsewhere [49]. This functional group analysis is summarized inhe histogram depicted in Fig. 3. The more characteristic func-ional groups of Family A are nCq (number of total quaternaryp3 C), nCrq (number of ring quaternary sp3 C), nCXr (numberf X on ring sp3 C), nArCOOR (number of aromatic esters),ArNO2 (number of aromatic nitro groups), nArOR (number ofromatic ethers), nPO4 (number of phosphates/thiophosphates),Imidazoles (number of Imidazoles), nRCONR2 (number ofliphatic tertiary amides), nC( N)N2 (number of guanidineerivatives), nROR (number of aliphatic ethers), nO(C O)2number of anhydrides [thio-]), nCH2RX (number of CH2RX),nd nPyridines (number of Pyridines). For Family B, the moreharacteristic functional groups are nR Cp (number of termi-al primary sp2 C), nR CX2 (number of R CX2), nRNNOxnumber of aliphatic N-nitroso groups), nSH (number of thiols),CHRX2 (number of CHRX2), and nCRX3 (number of CRX3).or the DB chemicals, the more characteristic functional groupsre nArCO (number of aromatic carboxylic acids) and nArNR2
number of aromatic tertiary amines).The above suggests that the selected compounds are simi-ar in terms of functional groups that are both coherent withhe families identified by PCA and SOM analyses, and match

32 D. Libotean et al. / Journal of Membrane Science 313 (2008) 23–43
F identit upCou
thBaccoce
sdtgepiic
3d
awstrs[wsss
vbs
3
woeaduwif
wnn
n
who[faao
ig. 3. Discriminant functional groups for the compounds in the three familiesaken from http://www.talete.mi.it/help/dragon help/index.html?FunctionalGro
he selection criteria. For example, chemicals that are of publicealth concern are included in Family A, amino acids in Familyand antibiotics in the DB compounds class. In addition, the
bove classification and domain characterization results indi-ate that the majority of the 50 chemicals reasonably span thehemical space. Since the data set is small, from a QSPR devel-pment point of view, all chemicals have been considered in theurrent model building, even though higher prediction errors arexpected for under-represented compounds.
It is noted that the descriptors selected by the present featureelection algorithms typically represent the general molecularescription that includes molecular size, shape and charge dis-ribution. Solute-descriptors that are consistent with the aboveeneral molecular characteristics were also reported by Bellonat al. [19] and Van der Bruggen et al. [20]. However, in theresent study chemical families were identified based on chem-cal similarity, derived using fundamental chemical descriptors,n order to define the borders of model applicability for thehemical data set.
.3. Selection of the most suitable set of molecularescriptors
It is desirable to select the smallest number of input vari-bles (i.e., hereinafter termed “features”) to train the modelithout redundant molecular information [44]. In the current
tudy filters have been applied to descriptor selection sinceheir application is model-independent [50]. Two filter algo-ithms, the correlation-based feature selection (CFS; [51]) andelf-organizing map dissimilarity measure analysis (SOM-DA;52]) were applied. CFS aims at attaining the highest correlation
ith the desired target and the lowest with any other previouslyelected descriptor. SOM-DA classifies features by means ofelf-organizing maps (SOM; [52]) and selects the descriptorubset that best represents the information space of the target
mhew
fied by the PCA analysis in Fig. 2a. Functional groups abbreviations have beennts11.
ariable, as estimated by a dissimilarity measure of differentest map organizations obtained for the most target-correlatedubsets.
.4. Development of artificial neural network models
The artificial neural network (ANN)-based QSPR modelsere developed based on back-propagation architecture withne input layer, one hidden layer and one output layer. The lin-ar transfer function was utilized for the input and output layers,nd a hyperbolic tangent transfer function was used for the hid-en layer [53]. A Levenberg–Marquardt technique [54,55] wassed during the learning phase for adjusting the weights by back-ard propagation [53] of the error between the ANN output of an
nput pattern and the corresponding target experimental soluteraction value.
For each model that was generated, the network architectureas established with the condition that the total number of con-ections between network’s neurons would not exceed the totalumber of input data points. This condition was specified as
h = min(nmax
h ; 2 · ni − 1)
; nmaxh ≤ ntr − no
1 + ni + no(3)
here ni, nh, and no are the number of neurons in the input layer,idden layer and output layer, respectively, and ntr is the numberf data in the training set. A clustering SOM-based algorithm56] was used to divide the chemical data set (using the besteature subset and target variable), for each selected networkrchitecture, into consistent training and test sets. In the presentpproach, the compound nearest to the centroid of each hexag-nal SOM cell was taken to be as most representative of that
ap unit. The representative compounds of the 6 cells with theigher number of hits (i.e., number of molecules allocated toach cell) were selected for the test set (i.e., 6 compounds),ith the remaining compounds (44) assigned to the training
embr
sdd
3
O(a[tiacoT(oppre
cirTqf
q
wnwA
wtdvcwtes
oii
q
wietifcw
4
esopov
TF
M
C
B
E
L
T
P
M
s
D. Libotean et al. / Journal of M
et. The above procedure assured that the training set containedata that were reasonably representative of the entire chemicalomain.
.5. Assessment of model quality
Validation guidelines for QSAR/QSPR proposed by therganization for Economic Co-operation and Development
OECD) state that “models should be associated with appropri-te measures of goodness-of-fit, robustness, and predictivity”57]. The assessment of QSPR models is established using sta-istical validation procedures which consist of measuring both,nternal model performance (goodness-of-fit and robustness)nd external performance (predictivity). Since the number ofurrent compounds is small from a QSPR development pointf view, two types of analyses and modeling were carried out.he first focused on internal validation with a leave-one-out
LOO) cross-validation approach [58,59]. The second consistedf an external validation with an independent set of test com-ounds that were not used for model training [58,59]. Modelerformance was evaluated with respect to the absolute andelative absolute average errors and standard deviation of therrors.
Internal model validation was based on the leave-one-out pro-edure (LOO). Each one of the 50 chemicals in Table 1 wasndividually and sequentially eliminated from the data set and theemaining (50 − 1) compounds used to train 50 different models.he cross-validation explained variance in the prediction index,2, was then calculated for all the individually predicted massractions using the 50 models [58],
2 = 1 −∑n
i=1(yi − yi)2
∑ni=1(yi − y)2 (4)
here y is the average fraction value of experimental data for allcompounds, q2 is the explained variance in prediction index,hich varies from 0 to 1. Low q2 values indicate overfitting.low value of q2 in the LOO test typically indicates a model
cAtp
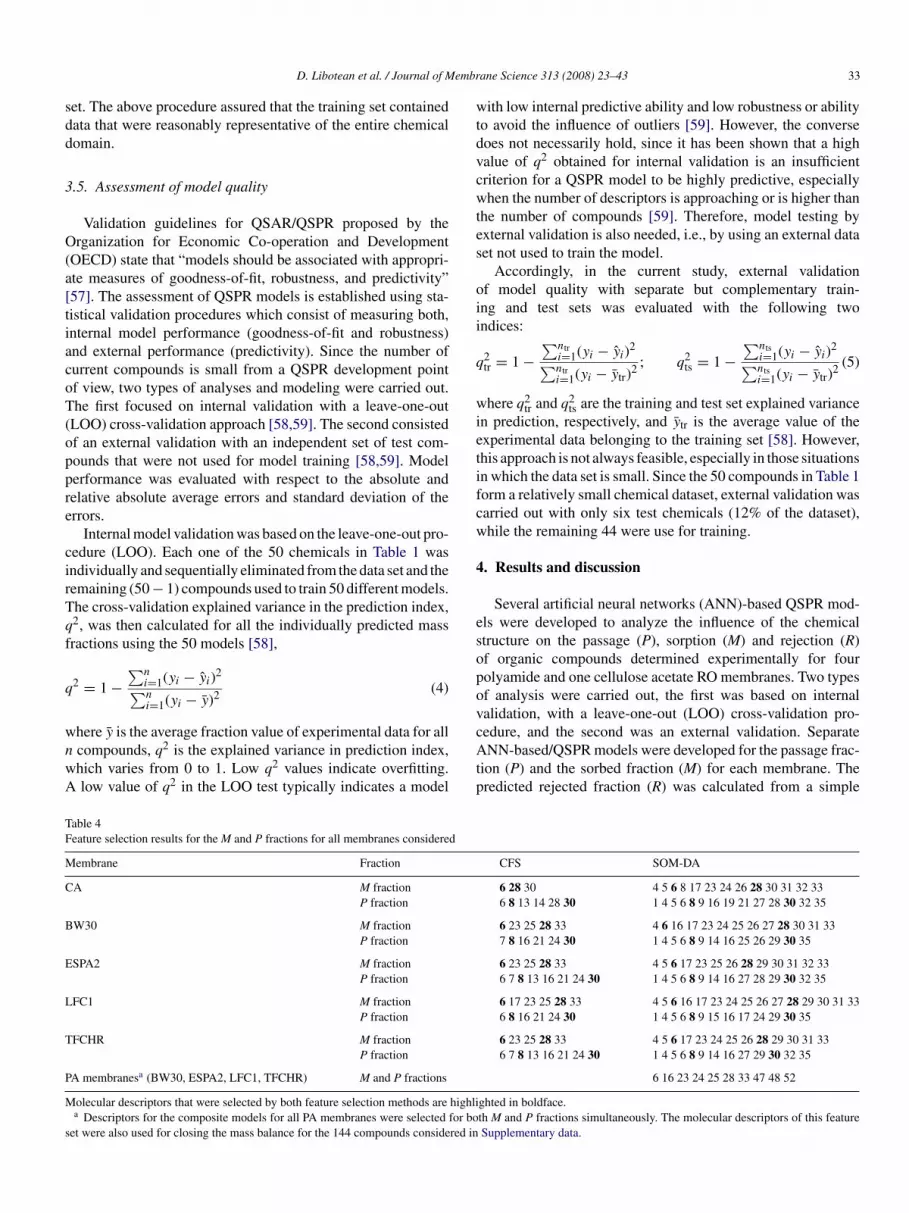
able 4eature selection results for the M and P fractions for all membranes considered
embrane Fraction
A M fractionP fraction
W30 M fractionP fraction
SPA2 M fractionP fraction
FC1 M fractionP fraction
FCHR M fractionP fraction
A membranesa (BW30, ESPA2, LFC1, TFCHR) M and P fractions
olecular descriptors that were selected by both feature selection methods are highlia Descriptors for the composite models for all PA membranes were selected for bo
et were also used for closing the mass balance for the 144 compounds considered in
ane Science 313 (2008) 23–43 33
ith low internal predictive ability and low robustness or abilityo avoid the influence of outliers [59]. However, the converseoes not necessarily hold, since it has been shown that a highalue of q2 obtained for internal validation is an insufficientriterion for a QSPR model to be highly predictive, especiallyhen the number of descriptors is approaching or is higher than
he number of compounds [59]. Therefore, model testing byxternal validation is also needed, i.e., by using an external dataet not used to train the model.
Accordingly, in the current study, external validationf model quality with separate but complementary train-ng and test sets was evaluated with the following twondices:
2tr = 1 −
∑ntri=1(yi − yi)2
∑ntri=1(yi − ytr)2 ; q2
ts = 1 −∑nts
i=1(yi − yi)2
∑ntsi=1(yi − ytr)2 (5)
here q2tr and q2
ts are the training and test set explained variancen prediction, respectively, and ytr is the average value of thexperimental data belonging to the training set [58]. However,his approach is not always feasible, especially in those situationsn which the data set is small. Since the 50 compounds in Table 1orm a relatively small chemical dataset, external validation wasarried out with only six test chemicals (12% of the dataset),hile the remaining 44 were use for training.
. Results and discussion
Several artificial neural networks (ANN)-based QSPR mod-ls were developed to analyze the influence of the chemicaltructure on the passage (P), sorption (M) and rejection (R)f organic compounds determined experimentally for fourolyamide and one cellulose acetate RO membranes. Two typesf analysis were carried out, the first was based on internalalidation, with a leave-one-out (LOO) cross-validation pro-
edure, and the second was an external validation. SeparateNN-based/QSPR models were developed for the passage frac-ion (P) and the sorbed fraction (M) for each membrane. Theredicted rejected fraction (R) was calculated from a simple
CFS SOM-DA
6 28 30 4 5 6 8 17 23 24 26 28 30 31 32 336 8 13 14 28 30 1 4 5 6 8 9 16 19 21 27 28 30 32 35
6 23 25 28 33 4 6 16 17 23 24 25 26 27 28 30 31 337 8 16 21 24 30 1 4 5 6 8 9 14 16 25 26 29 30 35
6 23 25 28 33 4 5 6 17 23 25 26 28 29 30 31 32 336 7 8 13 16 21 24 30 1 4 5 6 8 9 14 16 27 28 29 30 32 35
6 17 23 25 28 33 4 5 6 16 17 23 24 25 26 27 28 29 30 31 336 8 16 21 24 30 1 4 5 6 8 9 15 16 17 24 29 30 35
6 23 25 28 33 4 5 6 17 23 24 25 26 28 29 30 31 336 7 8 13 16 21 24 30 1 4 5 6 8 9 14 16 27 29 30 32 35
6 16 23 24 25 28 33 47 48 52
ghted in boldface.th M and P fractions simultaneously. The molecular descriptors of this featureSupplementary data.

3 embr
mmw(CtPsbo
(nrProcadff
4
mttaeSTtttttt(ebttmm
rai6tatFtt
sttomsufttstmttdtp
4r
mssdStrrLhcdtsawt
rRFaScposopa
4 D. Libotean et al. / Journal of M
ass balance, i.e., R = 1 − (P + M), where P and M were esti-ated from the ANN/QSPR models. The ANN/QSPR modelsere developed using the most suitable set of input descriptors
Table 4), selected from the initial set of indices (Table 3) by theFS and SOM-DA feature selection methods. Chemical descrip-
ors selected by both methods, for a given fraction (i.e., M and), are highlighted in boldface. The SOM-DA method alwayselected the largest number of features for all models consideredecause it searches for the best classification topology in termsf chemical similarity.
Model performance for the four polyamide membranesTable 2) was similar as determined by both internal and exter-al validations. Thus, for simplicity and brevity in what follows,esults are only presented and discussed in detail for two of theA membranes (BW30 and TFCHR), as these are reasonablyepresentative of the studied PA membranes. An examinationf Table 4 shows that the chemical descriptors that best explainhemical behavior for the BW30 and LFC1 membranes, as wells for the TFCHR and ESPA2 membranes, are almost coinci-ent. Furthermore, the ranges of M, P and calculated R fractionsor the BW30 and TFCHR are representative of those reportedor the set of four PA membranes in Table 1.
.1. Selection of model input parameters
The larger number of descriptors selected by SOM-DAethod, relative to the CFS correlation-based procedure, is due
o the specific criteria used by the former method to reducehe number of input parameters. Descriptors in the SOM-DApproach are sorted in a decreasing order of importance of influ-ncing the topological organization of the target variable in theOM map that accounts for chemical similarity. For example,able 4 shows that the smaller set of input descriptors selected by
he CFS method for the M fraction model was usually a subset ofhose selected by the SOM-DA method for all membranes. Forhe P fraction models, however, not all descriptors selected byhe CFS method were contained in the descriptor set selected byhe SOM-DA method. In all cases where a mismatch is observed,he affected CFS descriptor belongs to the same descriptor classTable 3) of one of the descriptors selected by SOM-DA. Forxample, Table 4 shows that four of the six descriptors selectedy CFS, for the P fraction model for the CA membrane (descrip-ors 6, 8, 28 and 30), were also selected by the SOM-DA method;he remaining two topological descriptors, selected by the CFS
ethod (descriptors 13 and 14), were replaced by the SOM-DAethod with two different topological descriptors, i.e., 9 and 16.A close examination of molecular features selected in Table 4
eveal descriptor selection similarities between the polyamidend cellulose acetate membranes. For example, comparing thenput sets selected with the CFS method, molecular descriptors
and 28 were commonly selected for all five membranes forhe M fraction model. Similarly, molecular descriptors 8 and 30re commonly selected for all five membranes for predicting
he P fraction. However, certain differences are also observed.or example, for the M fraction prediction, molecular descrip-ors 23, 25 and 33 were selected by the CFS method only forhe polyamide membranes, while molecular descriptor 30 was
htuc
ane Science 313 (2008) 23–43
elected only for the cellulose acetate membrane. For the P frac-ion, molecular descriptors 16, 21 and 24 were selected only forhe PA membranes, while molecular descriptor 14 was selectednly for the CA membrane. Similarly, with the SOM-DA methodolecular descriptors 4, 6, 17, 23, 26, 28, 30, 31 and 33 were
elected for all five membranes for the M fraction, while molec-lar descriptors 1, 4, 5, 6, 8, 9, 16, 30 and 35 were selectedor all five membranes for the P fraction. It should be notedhat molecular descriptor 8 was selected only for the M frac-ion for the CA membrane, while molecular descriptor 25 waselected only for the four PA membranes. Molecular descrip-ors 19 and 21 were selected only for the P fraction and CA
embrane, while molecular descriptor 29 was selected only forhe four PA membranes. The above results are consistent withhe expectation that the significance of specific solute chemicalescriptors for the prediction of solute permeation and sorp-ion (i.e., P and M fractions) should also vary with membraneroperties.
.2. Correlating input descriptors for organic chemicalejection
The most relevant molecular descriptors that characterizeembrane performance in terms of organic solute passage and
orption, and calculated rejection, can be identified via analy-is of the frequency of occurrence of the different molecularescriptors in the optimal input sets selected by the CFS andOM-DA feature selection methods (Table 4). Accordingly,
he molecular descriptors identified as most relevant for cor-elating solute passage (P fraction) are size of the smallesting (6), molecular weight (8), shape index kappa2 (16) andUMO Energy (30). For the cellulose acetate membrane, dipoleybridization (28) was selected as an additional parameter toharacterize the P fraction. The most influential molecularescriptors for correlating solute sorption (M fraction) for eitherhe polyamide or cellulose acetate membranes are the size of themallest ring (6), dipole moment (23), dipole hybridization (28)nd heat of formation (33). In addition, the dipole vector Y (25)as also selected as a relevant for correlating solute sorption by
he polyamide membranes.The current identification of molecular descriptors as most
elevant for describing organic passage, sorption rejection byO membranes is in general agreement with previous studies.or example, previous studies have reported that molecular sizend steric effects influence organics rejection [8,11,12,14,15].pecifically, descriptors selected in the present approach whichharacterize molecular size and steric effects included, for exam-le, molecular weight (8), shape index kappa2 (16), momentf inertia B (19). Other selected descriptors are the size of themallest ring (6) and the heat of formation (33). The selectionf the former is consistent with the fact that 70% of the com-ounds in the study set, those pertaining to Family A in Fig. 2and Table 1, contain at least one aromatic ring. Selection of the
eat of formation (33) can also be rationalized by the fact thathe heat of formation is related, among other factors, to molec-lar size and molecular bonds stability in relation to structuralomplexity.
embr
lYEpd[mstbtfictotsda
4m
vtmtaibdLoiaaCtto
a(waajntotaaoC
4
dieiLlteemhosCawapoafiDmsgeme
wdfteiWsPo0Ftmmc(ataw
D. Libotean et al. / Journal of M
The current feature selection methods also identified molecu-ar dipole parameters, such as dipole moment (23), dipole vector
(25) and dipole hybridization (28), in addition to the LUMOnergy (30), as relevant molecular information for organic com-ounds passage through RO membranes. The identification ofipole moment descriptors is consistent with previous studies7,9,10,15] that have suggested the importance of the dipoleoment as a factor affecting solute–RO membrane electro-
tatic interactions [11]. Previous studies have also suggestedhat the rejection of organic compounds is strongly influencedy surface hydrophobic/hydrophobic interactions that have beenypically correlated with the solute octanol–water partition coef-cient [12–14]. It is emphasized that the octanol–water partitionoefficient (Kow) is not a fundamental molecular parameter andhus it was not explicitly considered in the present initial setf descriptors. However, a number of the molecular descrip-ors identified in Table 4 as relevant for organic passage andorption, i.e., molecular weight (8), dipole moment (23) andipole hybridization (28), have also been previously identifieds relevant molecular descriptors for the prediction of Kow [30].
.3. Quantitative structure performance models forembrane solute passage, sorption and rejection
The M and P mass fractions predicted by the LOO internalalidation QSPR models, together with the calculated R frac-ion, are depicted in Figs. 4–6 for the BW30, TFCHR, and CA
embranes, respectively. The external validation predictions forhe M and P fractions, together with the calculated R fractions,re plotted in Fig. 7 for the same three membranes. All figuresnclude the results obtained with both sets of descriptors selectedy the CFS methods and SOM-DA (Table 4). All QSPR modelseveloped, including those not shown here for the ESPA2 andFC1 membranes, have an explained variance in the predictionf M and P fractions, and calculated R fraction, of q2 ≥ 0.98 fornternal LOO cross-validation. As expected, the explained vari-nce for external test set validation decreased to q2 ≈ 0.90, whichlso indicates a remarkable model performance, except for theA membrane with the three molecular descriptors selected with
he CFS method. The small number of descriptors selected inhis case (Table 4) is the cause of the lower model performancebserved in Fig. 7f.
The average absolute errors and standard deviation of thebsolute error for all predicted fractions were up to about 0.066average relative error of 70.9%), except for the CA membraneith descriptors selected by the CFS method which doubled the
verage absolute deviation. For brevity of reporting, the relativebsolute average errors are reported hereinafter in parenthesis,ust after the reporting the corresponding absolute values. Weote that these error calculations exclude mass fraction valueshat are equal to zero or that could be considered zero basedn the average standard deviation of the experimental errors forhe data set under consideration. As is evident from Figs. 4–7
nd Table 1, the QSPR models developed for organic passagend sorbed mass fractions properly capture the lower passage ofrganic chemicals through the PA membranes compared to theA membrane.a
dc
ane Science 313 (2008) 23–43 35
.3.1. Internal validation with LOO modelsIn order to explore the adequacy of the selected chemical
escriptors, internal LOO validation analysis was carried forndependent models for the M and P fractions, as the gov-rning mechanisms for sorption and permeation is likely tonvolve respond to different solute/membrane interactions. TheOO validation for the M and P models and for the calcu-
ated R fraction as shown in Figs. 4 and 5, for the BW30 andhe TFCHR membranes, revealed good performance. A highxplained variance in prediction, q2 ≈ 0.98, and average absoluterrors smaller than 0.012 (7.0%) were obtained for all predictedass fractions for the BW30 and TFCHR membranes. Slightly
igher average absolute errors, as high as 0.020 (12.4%), werebtained when modeling the organic compounds sorption, pas-age and rejection (M, P and R, respectively) fractions for theA membrane (Fig. 6). The maximum absolute error (for M, Pnd R) for all the polyamide membrane models (Figs. 4 and 5)as 0.186 (88.2%) compared to 0.394 (67.3%) for the cellulose
cetate membrane. These high maximum deviations betweenredicted and measured mass fractions indicate the presence ofutliers, particularly for the CA membrane data set. Figs. 4–6lso illustrate that (i) it is possible to describe organic passageor the RO membranes with the proper selection of molecularnformation (Table 4); (ii) the descriptors selected by SOM-A appear to capture the observe experimental differences inembrane/organic chemical pair interactions (i.e., passage and
orption) better than for the CFS selected descriptors as sug-ested by the LOO cross-validation performances across thentire chemical domain (Fig. 2a); and (iii) there is good agree-ent between measured and predicted mass fractions over the
ntire experimental mass fractions [0,1] range.The predicted M and P fractions for the BW30 membrane
ith LOO models and using the SOM-DA selected molecularescriptors are in good agreement with the measured organicractions as is evident in Fig. 4a and c. The M and P frac-ions were predicted with essentially the same average absoluterror of 0.008 (4.2% for M and 7.0% for P), with correspond-ng standard deviations of 0.014 (5.3 and 12.5%, respectively).
hen the input molecular descriptors to the LOO models wereelected by the CFS method, model performance for the M and
fractions (Fig. 4b and d) were with average absolute errorsf 0.006 (5.1%) and 0.005 (5.2%), with standard deviations of.009 (11.8%) and 0.010 (8.5%), respectively. Comparison ofigs. 4 and 5 indicates that the LOO models, for the M and P frac-
ions, built independently for the BW30 and TFCHR polyamideembranes perform equally well. Performance of the M and Podels based on the SOM-DA selected descriptors (Fig. 5a and
) was with average absolute errors of 0.006 (3.1%) and 0.0073.2%), respectively, with standard deviations of 0.007 (3.4%)nd 0.027 (4.8%), respectively. When the CFS selected descrip-ors were used, the M and P fractions were predicted with averagebsolute errors of 0.010 (6.3%) and 0.004 (3.3%), respectively,ith the corresponding standard deviations of 0.018 (15.0%)
nd 0.006 (3.6%), respectively.Organic compounds of M, P and R fractions that were pre-
icted to be larger than the standard deviation (Figs. 4 and 5)an be considered outliers. For example, for the P fraction model

36 D. Libotean et al. / Journal of Membrane Science 313 (2008) 23–43
Fig. 4. LOO cross-validation of QSPR models for the polyamide BW30 membrane. M fractions with (a) SOM-DA and (b) CFS descriptors; P fractions with (c)SOM-DA and (d) CFS descriptors; R fractions as calculated from the predicted M and P fractions, i.e., R = 1 − (M + P), with (e) SOM-DA and (f) CFS descriptors.

D. Libotean et al. / Journal of Membrane Science 313 (2008) 23–43 37
F braneS M an
bT7s
ig. 5. LOO cross-validation of QSPR models for the polyamide TFCHR memOM-DA and (d) CFS descriptors; R fractions as calculated from the predicted
uilt using the descriptors selected by SOM-DA method for theFCHR membrane (Fig. 5c), N-nitroso dimethyl amine {62-5-9} presents an absolute deviation of 0.186 (23.6%). Fig. 2bhows that this compound is classified alone in its SOM unit.
Mu
m
. M fractions with (a) SOM-DA and (b) CFS descriptors; P fractions with (c)d P fractions, i.e., R = 1 − (M + P), with (e) SOM-DA and (f) CFS descriptors.
oreover, the distance from this compound to the center of itsnit is higher than the average map topographic distance.
The results reported in Figs. 4 and 5 for the two polyamideembranes are coherent in terms of the applicability domain

38 D. Libotean et al. / Journal of Membrane Science 313 (2008) 23–43
F mbraS M an
ocbt
ig. 6. LOO cross-validation of QSPR models for the cellulose acetate (CA) meOM-DA and (d) CFS descriptors; R fractions as calculated from the predicted
f current models as determined by the chemical informationontained in the dataset. LOO models built for the CA mem-rane yield predictions with higher deviations than those forhe polyamide membranes. The predicted M and P fractions
iDm0
ne. M fractions with (a) SOM-DA and (b) CFS descriptors; P fractions with (c)d P fractions, i.e., R = 1 − (M + P), with (e) SOM-DA and (f) CFS descriptors.
n the CA membrane with LOO models based on the SOM-A selected descriptors (Fig. 6a and c) are in agreement witheasurements with absolute average errors of 0.012 (6.6%) and
.014 (3.0%), with standard deviations of 0.022 (15.1%) and

D. Libotean et al. / Journal of Membrane Science 313 (2008) 23–43 39
Fig. 7. External validation of QSPR models for the BW30, TFCHR and cellulose acetate (CA) membranes with descriptors selected by SOM-DA and CFS for theM, P, and R fractions corresponding only to test compounds. BW30 with (a) SOM-DA and (b) CFS; TFCHR with (c) SOM-DA and (d) CFS; CA with (e) SOM-DAand (f) CFS. Note that the number of test compounds for the R fraction is larger because R is calculated from the union of mostly different test compounds for the Mand P fractions.

4 embr
0micPgTsClI{itopc
4
vdptccnasfm3mtt
aFwawahc4qt
nbdftMard
wesolstbftawfittaswsdaos
n(idd(olcrAdpbCita(wptftBtbr
0 D. Libotean et al. / Journal of M
.035 (6.2%), for the M and P fractions, respectively. For theseodels, four compounds act like outliers: lindane {58-89-9},
n the M fraction model and 2,4 dichlorophenol {120-83-2},imetidine {51481-61-9} and ibuprofen {15687-27-1} in thefraction model. These four compounds are allocated to sin-
le map units in the SOM classification presented in Fig. 2b.he three CFS selected descriptors (Table 4) did not provideufficient information for the LOO M model developed for theA membrane (Fig. 6b) which is partially the reason for the
arge errors and corresponding standard deviations observed.n this case, the prediction of 2,4-dichlorophenoxyacetic acid94-75-7} was observed to deviate significantly from the exper-mental value 0.143 (270.2%). The above analysis demonstrateshe influence of molecular information on the performancef quantitative-structure-property models for RO organic com-ounds passage in the treatment of aqueous solutions of theseompounds.
.3.2. QSPR models with external validationExternal validation is more demanding that the LOO cross-
alidation models discussed previously, particularly for smallatasets as in the present work (Table 1), since the former iserformed with never seen before test compounds while the lat-er maximizes the amount of information used for training (49ompounds) and minimizes the information used for testing (1ompound) in 50 consecutive models. The acceptable compact-ess of the chemical space in Fig. 2 justifies the application ofn external validation, which was carried out by dividing themall data set of 50 compounds (Table 1) into 44 compoundsor training the M and the P fractions QSPR models and 6 forodel testing, following the SOM procedure outlined in Section
.4. Training and test compounds were different for all M and Podels, even for the same membrane. Thus, the total number of
est compounds for the calculated R fractions was always largerhan 6 and at most equal to 12.
The M, P and R fractions predicted for the test compoundsre compared with experimental measurements as shown inig. 7. All QSPR models developed with descriptors selectedith SOM-DA and the CFS method show a high explained vari-
nce in prediction indices of q2 ≈ 0.92 for the PA membranes,hich reduced to q2 ≈ 0.83 for the CA membrane for the M
nd P fraction models. These values compare very well with theigh q2 ≈ 0.98 obtained for the LOO cross-validation, especiallyonsidering the heterogeneous nature and the small number of4 training compounds. In contrast, model performance with2 ≈ 0.33 was obtained for the calculated R fraction when usinghe CFS selected descriptors.
Evaluation of the M and P fraction models with the exter-al data test sets is shown in Fig. 7a for the BW30 membrane,ased on the models built with the SOM-DA selected molecularescriptors. This figure also includes the R fraction calculatedrom the M and P fractions (i.e., R = 1 − (M + P)) models forhe test and training data being compound pairs of either test
–test P, test M–train P or train M–test P. The absolute aver-ge errors obtained for the predicted M and P fraction models,espectively, are 0.066 (70.9%) and 0.018 (44.5%), with standardeviations of 0.064 (88.2%) and 0.021 (70.2%). These errors,
id
b
ane Science 313 (2008) 23–43
hile being relatively high, are comparable with the averagexperimental standard deviations of 0.040 and 0.014 for the testet compounds for the M and P models, respectively. Deviationsf the same order of magnitude are also observed for the calcu-ated R fractions (Fig. 7a). Predicted M and P fractions for theame BW30 membrane, with models developed using descrip-ors selected by the CFS method (Fig. 7b), reveal comparableehavior; the respective absolute average errors for the M and Praction models are 0.034 (17.6%) and 0.024 (42.6%), respec-ively, with corresponding standard deviations of 0.040 (14.1%)nd 0.015 (49.8%). While deviations for M fraction predictionsere higher than the experimental standard deviation (0.025), P
raction model deviations were close to the corresponding exper-mental value (0.025). Superior performance was obtained forhe TFCHR polyamide membrane with descriptors selected byhe SOM-DA and the CFS methods (Fig. 7c and d). Absoluteverage errors for the M and P fraction models, with descriptorselected by SOM-DA (Fig. 7c), respectively, were 0.017 (20.2%)ith standard deviation of 0.012 (27.2%) and 0.021 (15.9%) with
tandard deviation of 0.003 (3.3%). For the models built withescriptors selected with the CFS method (Fig. 7d), the aver-ge absolute errors were 0.015 (8.7%) with standard deviationf 0.017 (13.8%) for the M fraction and 0.025 (38.5%) withtandard deviation of 0.015 (25.2%) for the P fraction.
As in the LOO cross-validation models, the worst exter-al validation results were obtained for the cellulose acetateCA) membrane (Fig. 7e and f). As expected, model predictionsmproved significantly when the M and P fraction models wereeveloped using the SOM-DA selected descriptors (Fig. 7e),isplaying average absolute errors of 0.013 (8.5%) and 0.04310.4%), respectively, with corresponding standard deviationsf 0.008 (10.6%) and 0.030 (5.3%). Deviations for the calcu-ated R fractions were higher since R values calculated for testompounds using test M–train P and train M–test P data pairseflect the greater training errors for these two M and P models.s in the LOO results (Fig. 6b, d and f), models built using theescriptors selected by the CFS method (Fig. 7f) have a poorererformance, could be attributed, in part, to the reduced num-er of descriptors (i.e., 3) selected for the CA membrane by theFS method, especially for M fraction. As a result the chemical
nformation provided to the QSPR model was insufficient andhus absolute average deviations for predicted M fraction weres high as 0.112 (44.3%), with a standard deviation of 0.13567.3%). Lower but still significant deviations of 0.041 (10.1%),ith a standard deviation of 0.025 (4.5%), were obtained for theredicted P fractions for the CA membrane. It should be notedhat the 0.036 standard deviation of absolute experimental errorsor the P fractions for the CA membrane is also higher thanhe experimental standard deviation of 0.023 obtained for theW30 and TFCHR polyamide membranes. It is emphasized that
he fact that the experimental P fraction data for the CA mem-rane covered the entire [0–1] range, as opposed to the smalleranges for the organic passage fractions for the PA membranes,
s partially responsible for the poorer performance of the modelseveloped for the CA membranes.The development of a composite model that included mem-rane properties (Table 2) would require an extensive data set for

embr
aPemtotbdftpmaMM(tcif(csa
nwmaTopeti
5
ficpeoapasttpusapp
tktTcatab
imanbpAirtaavbtpcsdcTtwQap
A
EICw0r
A
i
D. Libotean et al. / Journal of M
wide range of membrane properties. Therefore, the set of fourA membranes and 1 CA membrane was insufficient for gen-rating a general correlation. However, given that several PAembranes were assessed with a larger number of parameters
han for the CA membrane, it is worth exploring the significancef membrane parameters by developing a composite model forhe four PA membranes. Models for the M and P fractions wereuilt, based on seven molecular descriptors: dipole moment,ipole vector X, dipole vector Y, dipole hybridization, heat oformation, size of smallest ring, and shape index kappa2, in addi-ion to the following membrane properties: zeta potential, zetaotential slope (pH 5–7) and polyamide thickness. Compositeodels with these ten input parameters (10:14:1 neural network
rchitecture) were built for the four PA membranes for the P andfractions from which the R fraction was calculated. For theand P fraction models, 44 compounds were used for training
i.e., representing 175 points) and 6 compounds were used foresting (i.e., representing 24 points). The total number of testompounds for the calculated R fraction was 10 (i.e., represent-ng 40 points). The average absolute error for the predicted Rraction was 0.087 (16.1%), with a standard deviation of 0.05419.9%). The above result demonstrates that the development ofomposite models for a collection of membranes is feasible if aufficiently large number of membrane characteristics and datare available.
Finally, the current approach was also evaluated with an exter-al set of additional 144 compounds of public health concernithout experimental passage information by testing them forass balance with models developed for M, P and R with the
bove seven molecular descriptors and 50 chemicals listed inable 1. The mass balance was predicted within 25% for 129f these chemicals, with higher errors for only 15 of the com-ounds which were not well represented by the fifty compoundxperimental data set. An expanded discussion and results forhe mass balance closure analysis for the total of 194 compoundss provided in Supplementary data.
. Conclusions
The passage, sorption and rejection of organics in ROltration were studied experimentally and using quantitative-hemical structure-property analysis. Organic sorption andassage measurements for aqueous solutions were carried outxperimentally for 50 organics that included specific chemicalsf public health concern in addition to amino acids and selectedntibiotics. The present study demonstrated that organic soluteassage and sorption in RO membranes can be qualitativelynd quantitatively related to chemical structure. Two featureelections methods, CFS and SOM-DA, were effectively usedo discriminate the most relevant set of molecular descriptorso account for organic solute sorption by RO membranes andassage through these membranes. The most significant molec-lar descriptors to characterize the sorbed fraction included
ize of the smallest ring, dipole moment, dipole hybridizationnd heat of formation, with the dipole vector Y as additionalarameter specific for the polyamide membranes. For the soluteassage fraction the most relevant molecular descriptors wereR
ane Science 313 (2008) 23–43 41
he size of the smallest ring, molecular weight, shape indexappa2 and LUMO energy, with the dipole hybridization as addi-ional descriptor specific for the cellulose acetate membrane.he chemical space of the experimental data set of 50 chemi-als and the applicability domain for the models developed werenalyzed by means of PCA and Self-organizing maps. Familieshat included chemicals of public health concern, amino acidsnd antibiotics where identified and successfully discriminatedy functional group counts.
Leave-one-out (LOO) cross-validation and externally val-dated quantitative structure property relationship (QSPR)odels for organic solute sorption and passage for polyamide
nd cellulose acetate membranes were developed using artificialeural networks (ANN). Predictions of organic solute were madeased on an overall mass balance using the ANN-QSPR modelredictions for solute sorption and passage. Highly performingNN/QSPR models were built with a variance in prediction
ndices q2 exceeding 0.90 in most cases, i.e., with a good cor-elation between the predicted and experimental values and inhe absence of model overfitting. The absolute average errorsnd standard deviations for predicted organic passage, sorptionnd rejection fractions were generally low for all LOO cross-alidation and externally validated models, the largest valueseing 0.066 (70.9%). Predictions were consistent with the facthat higher organic solute rejection and lower organic soluteassage occur in the polyamide membranes compared to theellulose acetate membrane. Mass balance closure (i.e., for theum of M, P and R) was satisfactory for both the experimentalata set of fifty compounds and for the external set of 144 testhemicals, which were not included in the model development.he results of the present study are encouraging and suggest
he potential application of the methods applied in the currentork for developing comprehensive and predictive ANN-basedSPR models, using expanded databases, that will provide the
nalysis and forecasting capability necessary for public healthrotection that is afforded by RO water treatment processes.
cknowledgements
This work was supported, in part, by the United Statesnvironmental Protection Agency, the National Water Research
nstitute, the UCLA Water Technology Research Center and thealifornia Department of Water Resources. Financial supportas also received from the Catalan Government (2005SGR-0735), the CICYT (CTQ2006-08844) and a distinguishedesearch award (Generalitat de Catalunya) to Dr. Francesc Giralt.
ppendix A. Supplementary data
Supplementary data associated with this article can be found,n the online version, at doi:10.1016/j.memsci.2007.11.052.
eferences
[1] K. Karakulski, M. Gryta, M. Sasim, Production of process water usingintegrated membrane processes, Chem. Papers 60 (6) (2006) 416–421.

4 embr
[
[
[
[
[
[
[
[
[
[
[
[
[
[
[
[
[
[
[
[
[
[
[
[
[
[
[
[
[
[[[
[
[
[
2 D. Libotean et al. / Journal of M
[2] K. Kimura, G. Amy, J.E. Drewes, T. Heberer, T.U. Kim, Y. Watanabe,Rejection of organic micropollutants (disinfection by-products, endocrinedisrupting compounds, and pharmaceutically active compounds) by NF/ROmembranes, J. Membr. Sci. 227 (1/2) (2003) 113–121.
[3] T. Heberer, Occurrence, fate, and assessment of polycyclic musk residuesin the aquatic environment of urban areas—a review, Acta Hydrochim.Hydrobiol. 30 (5/6) (2003) 227–243.
[4] D.W. Kolpin, E.T. Furlong, M.T. Meyer, E.M. Thurman, S.D. Zaugg,L.B. Barber, H.T. Buxton, Pharmaceuticals, hormones, and other organicwastewater contaminants in US streams, 1999–2000: a national reconnais-sance, Environ. Sci. Technol. 36 (6) (2002) 1202–1211.
[5] C. Baronti, R. Curini, G. D’Ascenzo, A. Di Corcia, A. Gentili, R. Sam-peri, Monitoring natural and synthetic estrogens at activated sludge sewagetreatment plants and in a receiving river water, Environ. Sci. Technol. 34(24) (2000) 5059–5066.
[6] A.K. Zander, N.K. Curry, Membrane and solution effects on solute rejectionand productivity, Water Res. 35 (18) (2001) 4426–4434.
[7] T. Matsuura, S. Sourirajan, Physicochemical criteria for reverse osmosisseparation of alcohols, phenols, and monocarboxylic acids in aqueous solu-tions using porous cellulose acetate membranes, J. Appl. Polym. Sci. 15(12) (1971) 2905–2927.
[8] H. Ozaki, H.F. Li, Rejection of organic compounds by ultra-low pressurereverse osmosis membrane, Water Res. 36 (1) (2002) 123–130.
[9] L. Kastelan-Kunst, K. Kosutic, V. Dananic, B. Kunst, FT30 membranesof characterized porosities in the reverse osmosis organics removal fromaqueous solutions, Water Res. 31 (11) (1997) 2878–2884.
10] B. Van der Bruggen, J. Schaep, W. Maes, D. Wilms, C. Vandecasteele,Nanofiltration as a treatment method for the removal of pesticides fromground waters, Desalination 117 (1–3) (1998) 139–147.
11] B. Van der Bruggen, J. Schaep, D. Wilms, C. Vandecasteele, Influence ofmolecular size, polarity and charge on the retention of organic moleculesby nanofiltration, J. Membr. Sci. 156 (1) (1999) 29–41.
12] Y. Kiso, Y. Nishimura, T. Kitao, K. Nishimura, Rejection properties of non-phenylic pesticides with nanofiltration membranes, J. Membr. Sci. 171 (2)(2000) 229–237.
13] Y. Kiso, T. Kon, T. Kitao, K. Nishimura, Rejection properties of alkylphthalates with nanofiltration membranes, J. Membr. Sci. 182 (1/2) (2001)205–214.
14] Y. Kiso, Y. Sugiura, T. Kitao, K. Nishimura, Effects of hydrophobicityand molecular size on rejection of aromatic pesticides with nanofiltrationmembranes, J. Membr. Sci. 192 (1/2) (2001) 1–10.
15] K. Kimura, S. Toshima, G. Amy, Y. Watanabe, Rejection of neutralendocrine disrupting compounds (EDCs) and pharmaceutical active com-pounds (PhACs) by RO membranes, J. Membr. Sci. 245 (1/2) (2004)71–78.
16] C.N. Laabs, G.L. Amy, M. Jekel, Understanding the size and characterof fouling-causing substances from effluent organic matter (EfOM) inlow-pressure membrane filtration, Environ. Sci. Technol. 40 (14) (2006)4495–4499.
17] T. Matsuura, S. Sourirajan, Reverse osmosis separation of some organicsolutes in aqueous solution using porous cellulose acetate membranes, Ind.Eng. Chem. Process Des. Dev. 10 (1) (1971) 102–108.
18] C.F. Schutte, The rejection of specific organic compounds by reverse osmo-sis membranes, Desalination 158 (1–3) (2003) 285–294.
19] C. Bellona, J.E.J.E. Drewes, P. Xu, G. Amy, Factors affecting the rejectionof organic solutes during NF/RO treatment—a literature review, Water Res.38 (12) (2004) 2795–2809.
20] B. Van der Bruggen, A. Verliefde, L. Braeken, E.R. Cornelissen, K. Moons,J. Verberk, H.J.C. van Dijk, G. Amy, Assessment of a semi-quantitativemethod for estimation of the rejection of organic compounds in aqueoussolution in nanofiltration, J. Chem. Technol. Biotechnol. 81 (7) (2006)1166–1176.
21] A. Abbas, N. Al-Bastaki, Modeling of an reverse osmosis water desali-
nation unit using neural networks, Chem. Eng. J. 114 (2005) 139–143.22] G.R. Shetty, S. Chellam, Predicting membrane fouling during municipaldrinking water nanofiltration using artificial neural networks, J. Membr.Sci. 217 (1/2) (2003) 69–86.
[
[
ane Science 313 (2008) 23–43
23] S. Chellam, Artificial neural network model for transient crossflow micro-filtration of polydispersed suspensions, J. Membr. Sci. 258 (1/2) (2005)35–42.
24] H.Q. Chen, A.S. Kim, Prediction of permeate flux decline in crossflowmembrane filtration of colloidal suspension: a radial basis function neuralnetwork approach, Desalination 192 (1–3) (2006) 415–428.
25] G.B. Sahoo, C. Ray, Predicting flux decline in crossflow membranes usingartificial neural networks and genetic algorithms, J. Membr. Sci. 283 (1/2)(2006) 147–157.
26] G. Espinosa, D. Yaffe, Y. Cohen, A. Arenas, F. Giralt, Neural network basedquantitative structural property relations (QSPRs) for predicting boilingpoints of aliphatic hydrocarbons, J. Chem. Inf. Comput. Sci. 40 (3) (2000)859–879.
27] G. Espinosa, D. Yaffe, A. Arenas, Y. Cohen, F. Giralt, A fuzzy ARTMAP-based quantitative structure-property relationship (QSPR) for predictingphysical properties of organic compounds, Ind. Eng. Chem. Res. 40 (12)(2001) 2757–2766.
28] D. Yaffe, Y. Cohen, G. Espinosa, A. Arenas, F. Giralt, A fuzzy ARTMAPbased on quantitative structure-property relationships (QSPRs) for predict-ing aqueous solubility of organic compounds, J. Chem. Inf. Comput. Sci.41 (5) (2001) 1177–1207.
29] D. Yaffe, Y. Cohen, Neural network based temperature-dependent quanti-tative structure property relations (QSPRs) for predicting vapor pressureof hydrocarbons, J. Chem. Inf. Comput. Sci. 41 (2) (2001) 463–477.
30] D. Yaffe, Y. Cohen, G. Espinosa, A. Arenas, F. Giralt, Fuzzy, ARTMAP andback-propagation neural networks based quantitative structure-propertyrelationships (QSPRs) for octanol–water partition coefficient of organiccompounds, J. Chem. Inf. Comput. Sci. 42 (2) (2002) 162–183.
31] D. Yaffe, Y. Cohen, G. Espinosa, A. Arenas, F. Giralt, A fuzzy ARTMAP-based quantitative structure–property relationship (QSPR) for the Henry’slaw constant of organic compounds, J. Chem. Inf. Comput. Sci. 43 (1)(2003) 85–112.
32] F. Giralt, G. Espinosa, A. Arenas, J. Ferre-Gine, L. Amat, X. Girones, R.Carbo-Dorca, Y. Cohen, Estimation of infinite dilution activity coefficientsof organic compounds in water with neural classifiers, AICHE J. 50 (6)(2004) 1315–1343.
33] G. Rodriguez, S. Buonora, T. Knoell, D. Phipps, H. Ridgway, Rejection ofpharmaceuticals by reverse osmosis (RO) membranes: quantitative struc-ture activity relationship (QSAR) analysis, NWRI Project No. 01-EC-002,National Water Research Institute, 2004.
34] H.T. Buxton, U.S. Geological Survey Fact Sheet FS-062-00, U.S. Geolog-ical Survey Toxic Substances Hydrology Program, 2000, p. 4.
35] U.S. Environmental Protection Agency Unregulated Contaminant Moni-toring Rule, U.S. Environmental Protection Agency, Federal Register, vol.64, Number 180, 1999.
36] U.S. Environmental Protection Agency Announcement of the DrinkingWater Contaminant List, U.S. Environmental Protection Agency, FederalRegister, vol. 63, Number 40, 1998.
37] Unregulated Chemicals Requiring Monitoring, Title 22 of the CaliforniaCode of Regulations, No. 64450, California Division of Drinking Waterand Environmental Management, 2001.
38] R.T. Riley, B.W. Kemppainen, W.P. Norred, Quantitative tritium exchangeof H-3 aflatoxin-B1 during penetration through isolated human-skin,Biochem. Biophys. Res. Commun. 153 (1) (1988) 395–401.
39] ChemSketch 8.00, Advanced Chemistry Development Inc.40] CAChe Worksystem Pro 6.1, Oxford Molecular Ltd.41] J.J.P. Stewart, Optimization of parameters for semiempirical methods. 1.
Method, J. Comput. Chem. 10 (2) (1989) 209–220.42] D.C. Young, Computational Chemistry—A Practical Guide for Applying
Techniques to Real-World Problems, Wiley-Interscience, 2001.43] L.B. Kier, L.H. Hall, Molecular Connectivity in Chemistry and Drug
Research, Academic Press, New York, 1976.44] L.B. Kier, L.H. Hall, Molecular Connectivity in Structure–Activity Anal-
ysis, John Wiley & Sons Inc, New York, 1985.45] L.B. Kier, A shape index from molecular graphs, Quant. Struct. Act. Relat.
4 (3) (1985) 109–116.46] B. Lee, F.M. Richards, Interpretation of protein structures—estimation of
static accessibility, J. Mol. Biol. 55 (3) (1971) 379–400.

embr
[
[
[
[
[
[
[
[
[
[
[
[58] A. Tropsha, P. Gramatica, V.K. Gombar, The importance of being earnest:
D. Libotean et al. / Journal of M
47] S.A. Wildman, G.M. Crippen, Prediction of physicochemical parametersby atomic contributions, J. Chem. Inf. Comput. Sci. 39 (5) (1999) 868–873.
48] J. Jaworska, T. Aldenberg, N. Nikolova, Review of methods for QSARapplicability domain estimation by the training test, European Commission,Joint Research Centre, Institute of Health & Consumer Protection, 2005.
49] I.V. Tetko, J. Gasteiger, R. Todeschini, A. Mauri, D. Livingstone, P. Ertl,V. Palyulin, E. Radchenko, N.S. Zefirov, A.S. Makarenko, V.Y. Tanchuk,V.V. Prokopenko, Virtual computational chemistry laboratory—design anddescription, J. Comput. Aided Mol. Des. 19 (6) (2005) 453–463.
50] H. Liu, H. Motoda, Feature Selection for Knowledge Discovery and DataMining, Kluwer Academic Publisher, 1998.
51] M.A. Hall, Correlation-based feature selection for discrete and numeric
class machine learning, in: International Conference on Machine Learning,Stanford University, Morgan Kaufmann Publishers, 2000.52] R. Rallo, G. Espinosa, F. Giralt, Using an ensemble of neural based QSARsfor the prediction of toxicological properties of chemical contaminants,Process Saf. Environ. Prot. 83 (B4) (2005) 387–392.
[
ane Science 313 (2008) 23–43 43
53] C.M. Bishop, Neural Networks for Pattern Recognition, Oxford UniversityPress, 2002.
54] S.P. Chitra, Use neural networks for problem-solving, Chem. Eng. Prog.89 (4) (1993) 44–52.
55] G.E. Hinton, How neural networks learn from experience, Sci. Am. 267(3) (1992) 145–151.
56] T. Kohonen, The self-organizing map, Neurocomputing 21 (1–3) (1998)1–6.
57] Guidance Document on the Validation of (Quantitative) Structure–ActivityRelationships [(Q)SAR] Models, Organisation for Economic Co-operationand Development, 2007.
validation is the absolute essential for successful application and interpre-tation of QSPR models, QSAR Comb. Sci. 22 (1) (2003) 69–77.
59] A. Golbraikh, A. Tropsha, Beware of q(2)!, J. Mol. Graph. 20 (4) (2002)269–276.


![SUCCES CU C++[RO]](https://img.pdfslide.net/doc/110x75/63184289bc8291e22e0e9589/succes-cu-cro.jpg)


![LIN·GUAM RO IAN]CAM](https://img.pdfslide.net/doc/110x75/6335f8d6d2b7284203082322/linguam-ro-iancam.jpg)


