Embed Size (px)
Citation preview
Oriented and exfoliated single wall carbon nanotubes in polyacrylonitrile
Han Gi Chae, Marilyn L. Minus, Satish Kumar *,1
School of Polymer, Textile and Fiber Engineering, Georgia Institute of Technology, P.O. Box 0295, Atlanta, GA 30332-0295, USA
Received 7 February 2006; received in revised form 13 March 2006; accepted 14 March 2006
Available online 3 April 2006
Abstract
Polyacrylonitrile (PAN)/single wall carbon nanotubes (SWNT) fibers were gel spun at 0, 0.5, and 1 wt% SWNT content to a draw ratio of 51.
Structure, morphology, and mechanical and dynamic mechanical properties of these fibers have been studied. PAN/SWNT composite exhibited
much higher electron beam radiation resistance than PAN. As a result, PAN lattice images could be easily observed in the composite fiber by high
resolution transmission electron microscopy. The PAN/SWNT composite fiber also exhibited higher solvent resistance than the control PAN fiber.
UV–vis spectroscopy of highly drawn fiber exhibited van Hove transitions, suggesting SWNT exfoliation upon drawing. SWNT exfoliation was
also confirmed by high resolution transmission electron microscopy (HRTEM). At 1 wt% SWNT loading, fiber storage modulus (at 1 Hz)
increased by 13.9, 6.6, and 0.2 GPa atK75, 25, and 150 8C, respectively. This suggests that the load transfer ability and hence interfacial strength
is increasing with decreasing temperature, even below the polymer’s g transition temperature.
q 2006 Elsevier Ltd. All rights reserved.
Keywords: Polyacrylonitrile; Single wall carbon nanotube; Gel spinning
1. Introduction
Polymer/carbon nanotube (CNT) composite films and fibers
are of significant current interest [1]. While, numerous
polymer/CNT composite systems have been processed with
significantly improved properties [2–10], SWNT exfoliation
and orientation in polymer matrices remains a challenge. The
orientation requirement for achieving high modulus in CNT
based fibers [11] is similar to that for achieving high modulus
in polymeric and carbon fibers. Ultra high orientation and
hence high modulus in polymeric fibers such as Kevlare,
Zylone, and pitch based carbon fibers [12] is achieved by
spinning from liquid crystalline media. Modulus value as high
as 827 GPa (O78% of the theoretical value for graphite) has
been achieved in commercial pitch based carbon fiber (P120)
[13]. Ultra high orientation in polymers can also be achieved
by gel spinning. Gel spun polyethylene fiber was commercia-
lized in 1980s [14,15]. Gel spinning has also been demon-
strated on poly(vinyl alcohol) (PVA) [16,17] and PAN
[18–23]. Recently, PAN/CNT composites have attracted
significant attention [8,24–37]. In this study, PAN/SWNT
0032-3861/$ - see front matter q 2006 Elsevier Ltd. All rights reserved.
doi:10.1016/j.polymer.2006.03.050
* Corresponding author. Tel.: C1 404 894 7550; fax: C1 404 894 8780.
E-mail addresses: [email protected] (H.G. Chae), marilyn.minus@
ptfe.gatech.edu (M.L. Minus), [email protected] (S. Kumar).1 http://www.ptfe.gatech.edu/faculty/kumar/kumar.html.
composite fiber was gel spun, demonstrating good SWNT
orientation and exfoliation. Structure and properties of the fiber
have been studied and compared to the properties of the control
gel spun PAN fiber.
2. Experimental
PAN (viscosity averagemolecularweightZ2.5!105 g/mol)
was obtained from Exlan, Co. (Japan). Purified SWNTs were
obtained from Carbon Nanotechnologies, Inc. (Houston, TX).
Based on thermogravimetric analysis (TGA) in air, SWNTs
used in this study contain less than 1 wt%metallic impurity. The
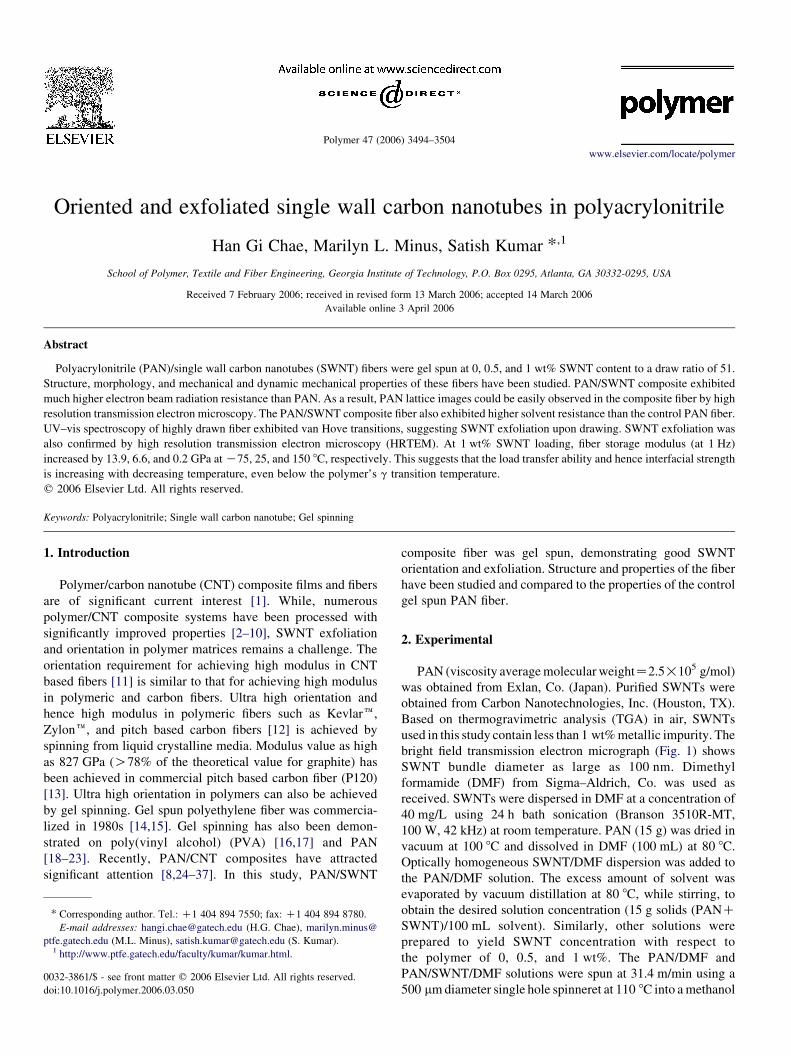
bright field transmission electron micrograph (Fig. 1) shows
SWNT bundle diameter as large as 100 nm. Dimethyl
formamide (DMF) from Sigma–Aldrich, Co. was used as
received. SWNTs were dispersed in DMF at a concentration of
40 mg/L using 24 h bath sonication (Branson 3510R-MT,
100 W, 42 kHz) at room temperature. PAN (15 g) was dried in
vacuum at 100 8C and dissolved in DMF (100 mL) at 80 8C.
Optically homogeneous SWNT/DMF dispersion was added to
the PAN/DMF solution. The excess amount of solvent was
evaporated by vacuum distillation at 80 8C, while stirring, to
obtain the desired solution concentration (15 g solids (PANCSWNT)/100 mL solvent). Similarly, other solutions were
prepared to yield SWNT concentration with respect to
the polymer of 0, 0.5, and 1 wt%. The PAN/DMF and
PAN/SWNT/DMF solutions were spun at 31.4 m/min using a
500 mmdiameter single hole spinneret at 110 8C into amethanol
Polymer 47 (2006) 3494–3504
www.elsevier.com/locate/polymer
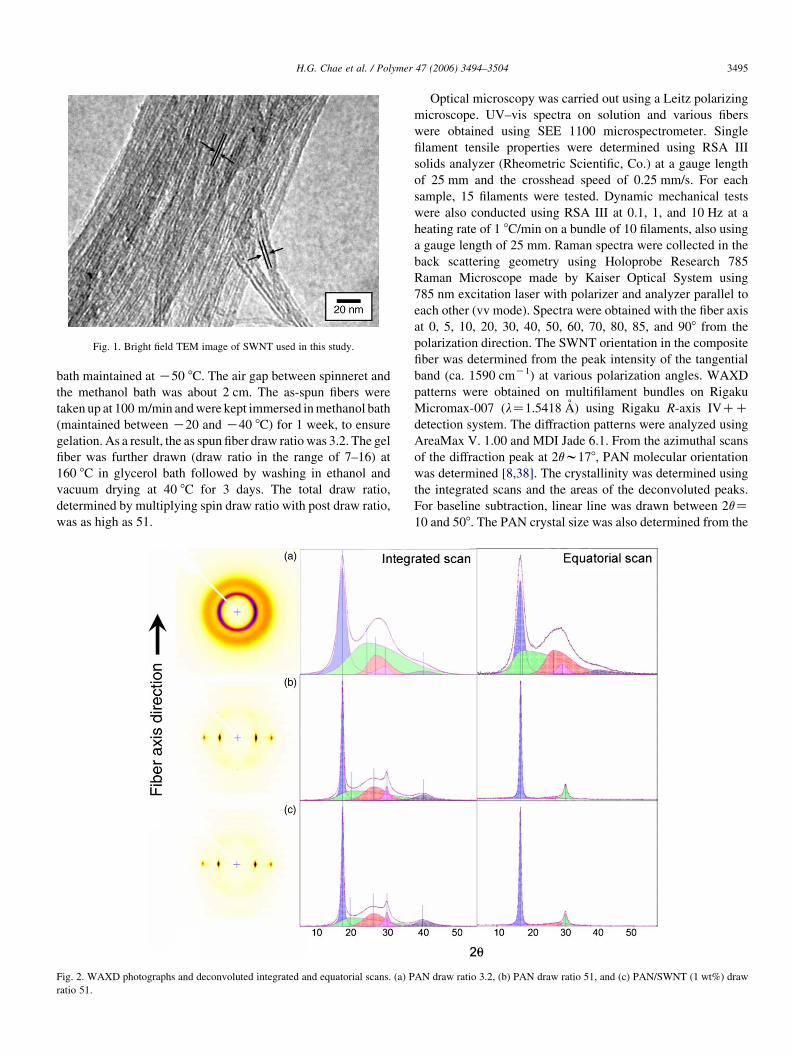
Fig. 1. Bright field TEM image of SWNT used in this study.
H.G. Chae et al. / Polymer 47 (2006) 3494–3504 3495
bath maintained atK50 8C. The air gap between spinneret and
the methanol bath was about 2 cm. The as-spun fibers were
taken up at 100 m/min andwere kept immersed inmethanol bath
(maintained between K20 and K40 8C) for 1 week, to ensure
gelation. As a result, the as spun fiber draw ratio was 3.2. The gel
fiber was further drawn (draw ratio in the range of 7–16) at
160 8C in glycerol bath followed by washing in ethanol and
vacuum drying at 40 8C for 3 days. The total draw ratio,
determined by multiplying spin draw ratio with post draw ratio,
was as high as 51.
Fig. 2. WAXD photographs and deconvoluted integrated and equatorial scans. (a) P
ratio 51.
Optical microscopy was carried out using a Leitz polarizing
microscope. UV–vis spectra on solution and various fibers
were obtained using SEE 1100 microspectrometer. Single
filament tensile properties were determined using RSA III
solids analyzer (Rheometric Scientific, Co.) at a gauge length
of 25 mm and the crosshead speed of 0.25 mm/s. For each
sample, 15 filaments were tested. Dynamic mechanical tests
were also conducted using RSA III at 0.1, 1, and 10 Hz at a
heating rate of 1 8C/min on a bundle of 10 filaments, also using
a gauge length of 25 mm. Raman spectra were collected in the
back scattering geometry using Holoprobe Research 785
Raman Microscope made by Kaiser Optical System using
785 nm excitation laser with polarizer and analyzer parallel to
each other (vv mode). Spectra were obtained with the fiber axis
at 0, 5, 10, 20, 30, 40, 50, 60, 70, 80, 85, and 908 from the
polarization direction. The SWNT orientation in the composite
fiber was determined from the peak intensity of the tangential
band (ca. 1590 cmK1) at various polarization angles. WAXD
patterns were obtained on multifilament bundles on Rigaku
Micromax-007 (lZ1.5418 A) using Rigaku R-axis IVCCdetection system. The diffraction patterns were analyzed using
AreaMax V. 1.00 and MDI Jade 6.1. From the azimuthal scans
of the diffraction peak at 2qw178, PAN molecular orientation
was determined [8,38]. The crystallinity was determined using
the integrated scans and the areas of the deconvoluted peaks.
For baseline subtraction, linear line was drawn between 2qZ10 and 508. The PAN crystal size was also determined from the
AN draw ratio 3.2, (b) PAN draw ratio 51, and (c) PAN/SWNT (1 wt%) draw
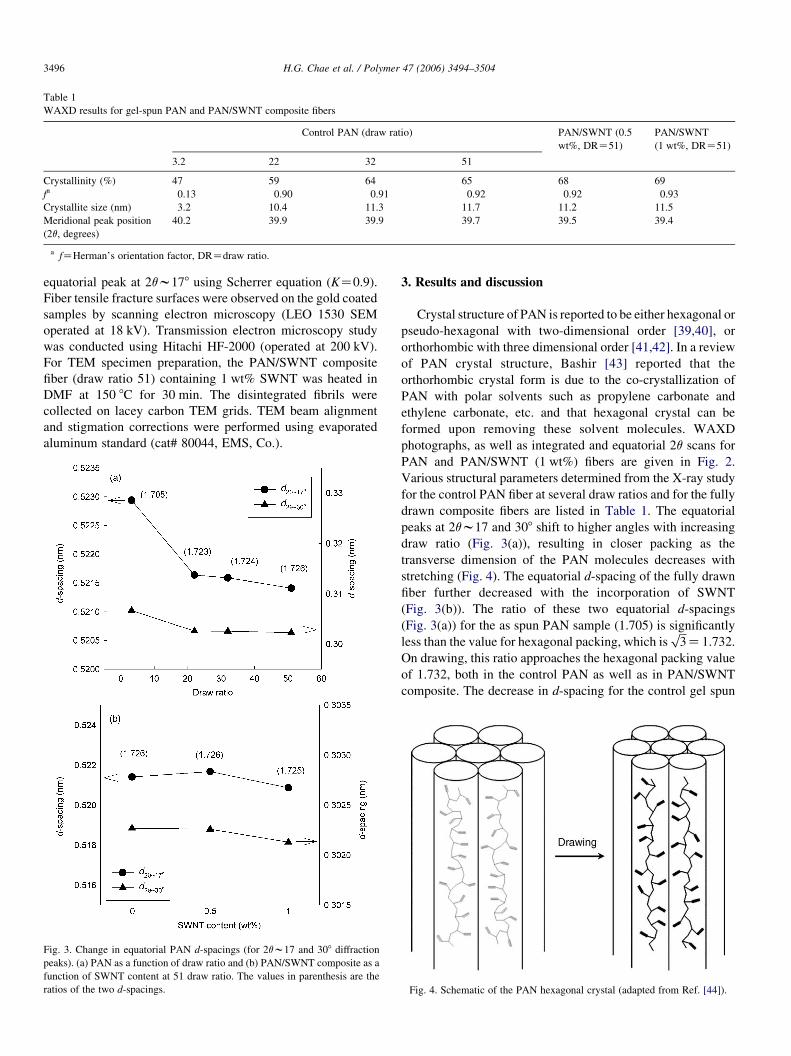
Table 1
WAXD results for gel-spun PAN and PAN/SWNT composite fibers
Control PAN (draw ratio) PAN/SWNT (0.5
wt%, DRZ51)
PAN/SWNT
(1 wt%, DRZ51)
3.2 22 32 51
Crystallinity (%) 47 59 64 65 68 69
fa 0.13 0.90 0.91 0.92 0.92 0.93
Crystallite size (nm) 3.2 10.4 11.3 11.7 11.2 11.5
Meridional peak position
(2q, degrees)
40.2 39.9 39.9 39.7 39.5 39.4
a fZHerman’s orientation factor, DRZdraw ratio.
H.G. Chae et al. / Polymer 47 (2006) 3494–35043496
equatorial peak at 2qw178 using Scherrer equation (KZ0.9).
Fiber tensile fracture surfaces were observed on the gold coated
samples by scanning electron microscopy (LEO 1530 SEM
operated at 18 kV). Transmission electron microscopy study
was conducted using Hitachi HF-2000 (operated at 200 kV).
For TEM specimen preparation, the PAN/SWNT composite
fiber (draw ratio 51) containing 1 wt% SWNT was heated in
DMF at 150 8C for 30 min. The disintegrated fibrils were
collected on lacey carbon TEM grids. TEM beam alignment
and stigmation corrections were performed using evaporated
aluminum standard (cat# 80044, EMS, Co.).
Fig. 3. Change in equatorial PAN d-spacings (for 2qw17 and 308 diffraction
peaks). (a) PAN as a function of draw ratio and (b) PAN/SWNT composite as a
function of SWNT content at 51 draw ratio. The values in parenthesis are the
ratios of the two d-spacings.
3. Results and discussion
Crystal structure of PAN is reported to be either hexagonal or
pseudo-hexagonal with two-dimensional order [39,40], or
orthorhombic with three dimensional order [41,42]. In a review
of PAN crystal structure, Bashir [43] reported that the
orthorhombic crystal form is due to the co-crystallization of
PAN with polar solvents such as propylene carbonate and
ethylene carbonate, etc. and that hexagonal crystal can be
formed upon removing these solvent molecules. WAXD
photographs, as well as integrated and equatorial 2q scans for
PAN and PAN/SWNT (1 wt%) fibers are given in Fig. 2.
Various structural parameters determined from the X-ray study
for the control PAN fiber at several draw ratios and for the fully
drawn composite fibers are listed in Table 1. The equatorial
peaks at 2qw17 and 308 shift to higher angles with increasing
draw ratio (Fig. 3(a)), resulting in closer packing as the
transverse dimension of the PAN molecules decreases with
stretching (Fig. 4). The equatorial d-spacing of the fully drawn
fiber further decreased with the incorporation of SWNT
(Fig. 3(b)). The ratio of these two equatorial d-spacings
(Fig. 3(a)) for the as spun PAN sample (1.705) is significantly
less than the value for hexagonal packing, which isffiffiffi3
pZ1:732.
On drawing, this ratio approaches the hexagonal packing value
of 1.732, both in the control PAN as well as in PAN/SWNT
composite. The decrease in d-spacing for the control gel spun
Fig. 4. Schematic of the PAN hexagonal crystal (adapted from Ref. [44]).
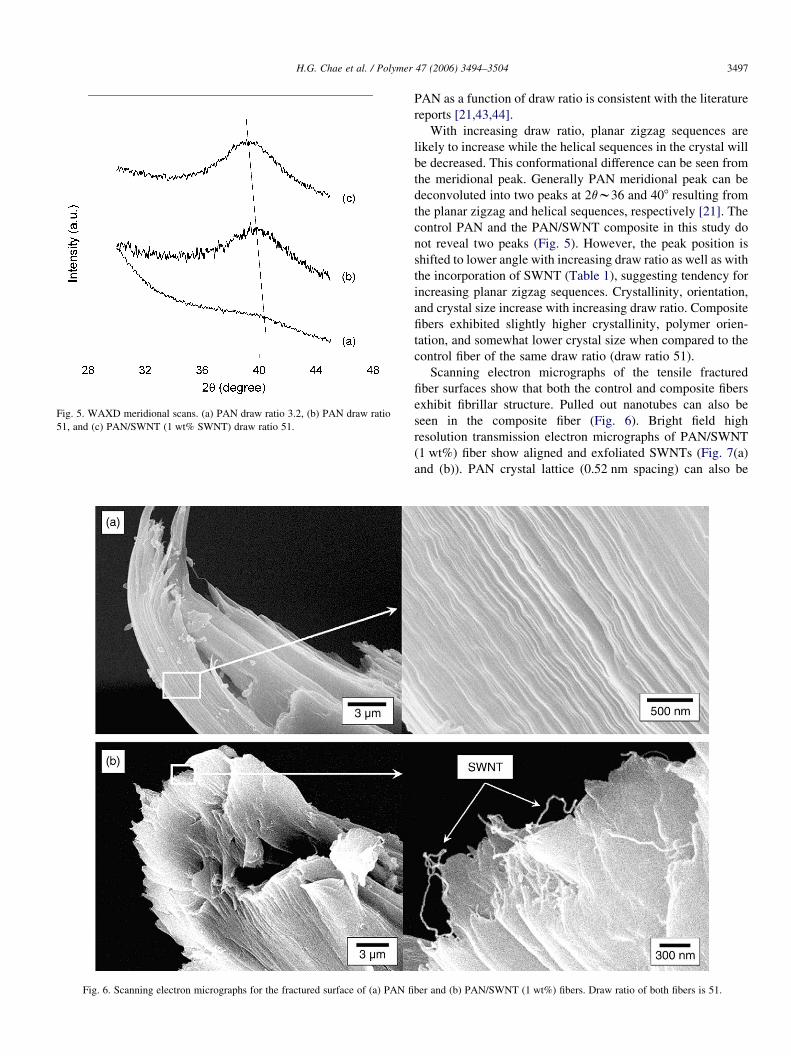
Fig. 5. WAXD meridional scans. (a) PAN draw ratio 3.2, (b) PAN draw ratio
51, and (c) PAN/SWNT (1 wt% SWNT) draw ratio 51.
Fig. 6. Scanning electron micrographs for the fractured surface of (a) PAN fi
H.G. Chae et al. / Polymer 47 (2006) 3494–3504 3497
PAN as a function of draw ratio is consistent with the literature
reports [21,43,44].
With increasing draw ratio, planar zigzag sequences are
likely to increase while the helical sequences in the crystal will
be decreased. This conformational difference can be seen from
the meridional peak. Generally PAN meridional peak can be
deconvoluted into two peaks at 2qw36 and 408 resulting from
the planar zigzag and helical sequences, respectively [21]. The
control PAN and the PAN/SWNT composite in this study do
not reveal two peaks (Fig. 5). However, the peak position is
shifted to lower angle with increasing draw ratio as well as with
the incorporation of SWNT (Table 1), suggesting tendency for
increasing planar zigzag sequences. Crystallinity, orientation,
and crystal size increase with increasing draw ratio. Composite
fibers exhibited slightly higher crystallinity, polymer orien-
tation, and somewhat lower crystal size when compared to the
control fiber of the same draw ratio (draw ratio 51).
Scanning electron micrographs of the tensile fractured
fiber surfaces show that both the control and composite fibers
exhibit fibrillar structure. Pulled out nanotubes can also be
seen in the composite fiber (Fig. 6). Bright field high
resolution transmission electron micrographs of PAN/SWNT
(1 wt%) fiber show aligned and exfoliated SWNTs (Fig. 7(a)
and (b)). PAN crystal lattice (0.52 nm spacing) can also be
ber and (b) PAN/SWNT (1 wt%) fibers. Draw ratio of both fibers is 51.
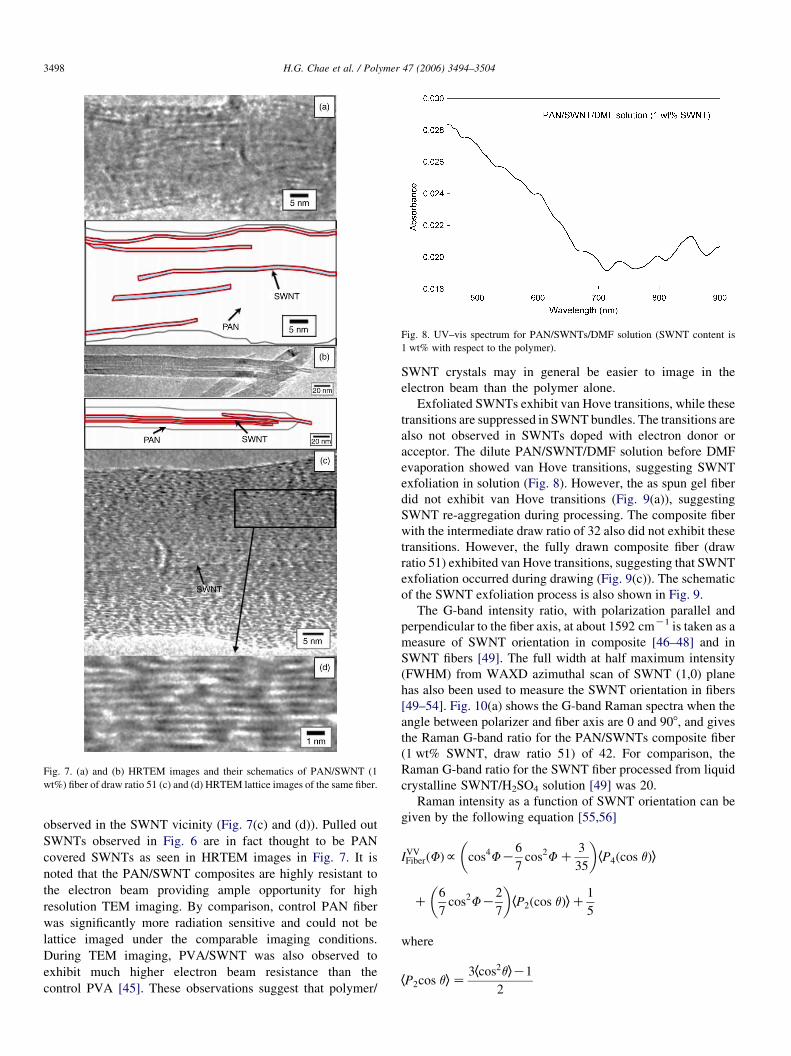
Fig. 7. (a) and (b) HRTEM images and their schematics of PAN/SWNT (1
wt%) fiber of draw ratio 51 (c) and (d) HRTEM lattice images of the same fiber.
Fig. 8. UV–vis spectrum for PAN/SWNTs/DMF solution (SWNT content is
1 wt% with respect to the polymer).
H.G. Chae et al. / Polymer 47 (2006) 3494–35043498
observed in the SWNT vicinity (Fig. 7(c) and (d)). Pulled out
SWNTs observed in Fig. 6 are in fact thought to be PAN
covered SWNTs as seen in HRTEM images in Fig. 7. It is
noted that the PAN/SWNT composites are highly resistant to
the electron beam providing ample opportunity for high
resolution TEM imaging. By comparison, control PAN fiber
was significantly more radiation sensitive and could not be
lattice imaged under the comparable imaging conditions.
During TEM imaging, PVA/SWNT was also observed to
exhibit much higher electron beam resistance than the
control PVA [45]. These observations suggest that polymer/
SWNT crystals may in general be easier to image in the
electron beam than the polymer alone.
Exfoliated SWNTs exhibit van Hove transitions, while these
transitions are suppressed in SWNT bundles. The transitions are
also not observed in SWNTs doped with electron donor or
acceptor. The dilute PAN/SWNT/DMF solution before DMF
evaporation showed van Hove transitions, suggesting SWNT
exfoliation in solution (Fig. 8). However, the as spun gel fiber
did not exhibit van Hove transitions (Fig. 9(a)), suggesting
SWNT re-aggregation during processing. The composite fiber
with the intermediate draw ratio of 32 also did not exhibit these
transitions. However, the fully drawn composite fiber (draw
ratio 51) exhibited van Hove transitions, suggesting that SWNT
exfoliation occurred during drawing (Fig. 9(c)). The schematic
of the SWNT exfoliation process is also shown in Fig. 9.
The G-band intensity ratio, with polarization parallel and
perpendicular to the fiber axis, at about 1592 cmK1 is taken as a
measure of SWNT orientation in composite [46–48] and in
SWNT fibers [49]. The full width at half maximum intensity
(FWHM) from WAXD azimuthal scan of SWNT (1,0) plane
has also been used to measure the SWNT orientation in fibers
[49–54]. Fig. 10(a) shows the G-band Raman spectra when the
angle between polarizer and fiber axis are 0 and 908, and gives
the Raman G-band ratio for the PAN/SWNTs composite fiber
(1 wt% SWNT, draw ratio 51) of 42. For comparison, the
Raman G-band ratio for the SWNT fiber processed from liquid
crystalline SWNT/H2SO4 solution [49] was 20.
Raman intensity as a function of SWNT orientation can be
given by the following equation [55,56]
IVVFiberðFÞf cos4FK6
7cos2FC
3
35
� �hP4ðcos qÞi
C6
7cos2FK
2
7
� �hP2ðcos qÞiC
1
5
where
hP2cos qiZ3hcos2qiK1
2
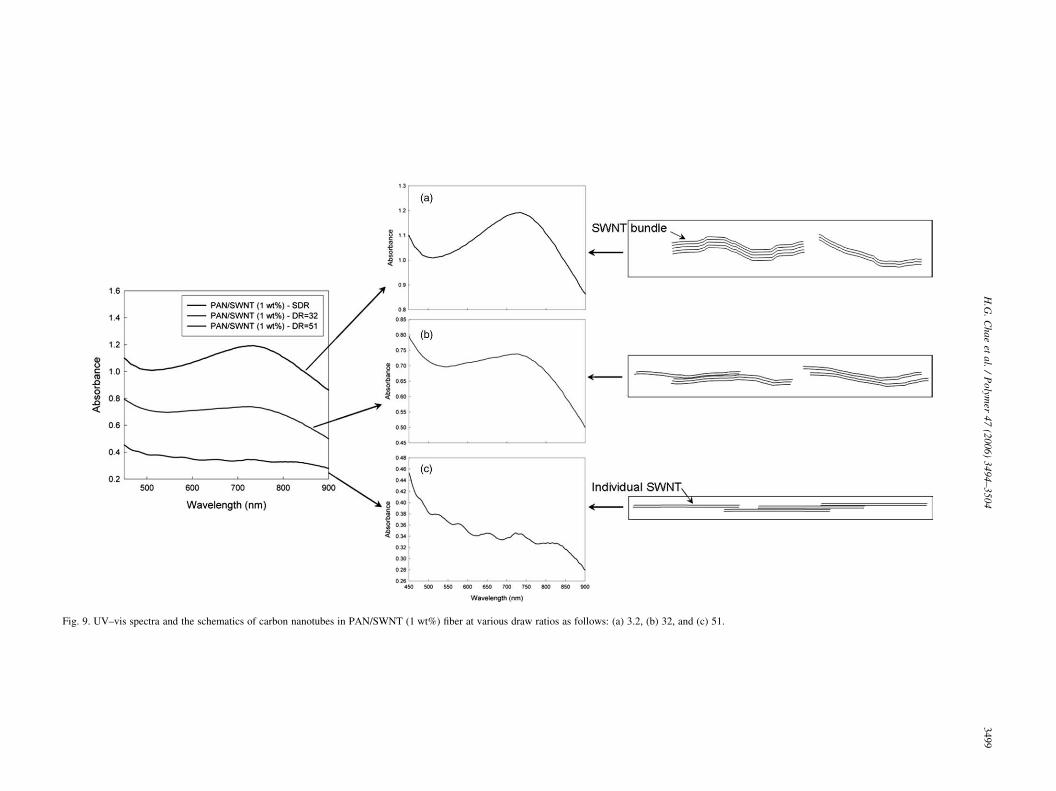
Fig. 9. UV–vis spectra and the schematics of carbon nanotubes in PAN/SWNT (1 wt%) fiber at various draw ratios as follows: (a) 3.2, (b) 32, and (c) 51.
H.G.Chaeet
al./Polym
er47(2006)3494–3504
3499
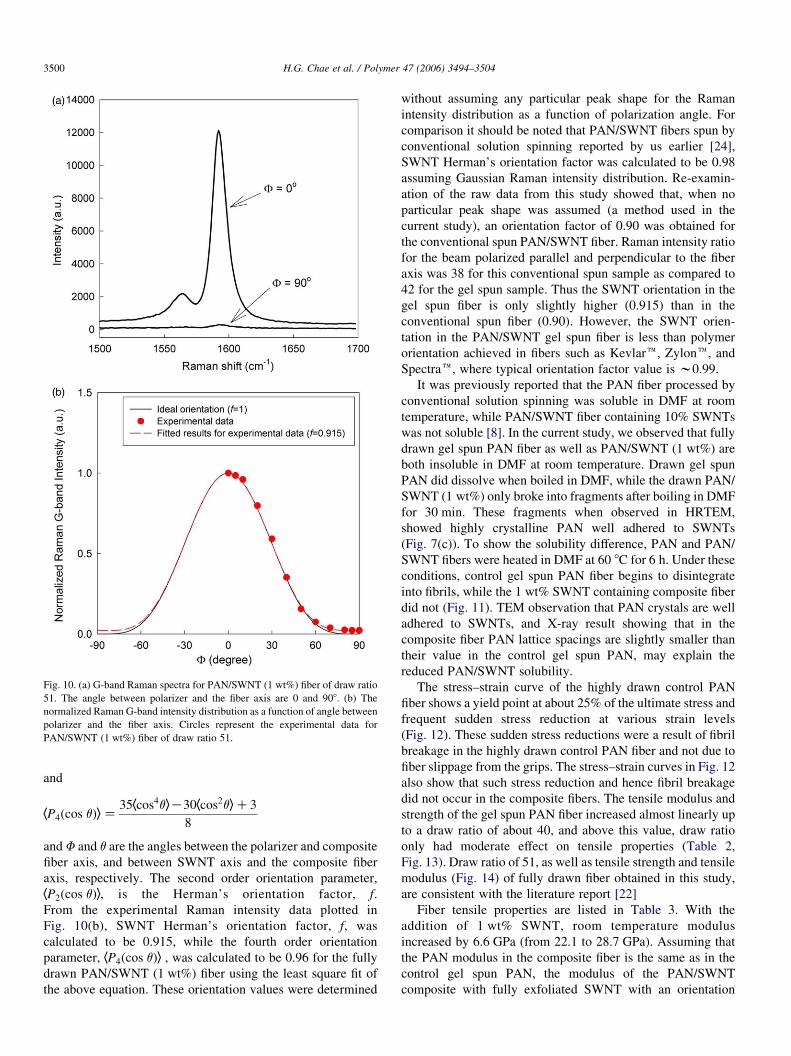
Fig. 10. (a) G-band Raman spectra for PAN/SWNT (1 wt%) fiber of draw ratio
51. The angle between polarizer and the fiber axis are 0 and 908. (b) The
normalized Raman G-band intensity distribution as a function of angle between
polarizer and the fiber axis. Circles represent the experimental data for
PAN/SWNT (1 wt%) fiber of draw ratio 51.
H.G. Chae et al. / Polymer 47 (2006) 3494–35043500
and
hP4ðcos qÞiZ35hcos4qiK30hcos2qiC3
8
andF and q are the angles between the polarizer and composite
fiber axis, and between SWNT axis and the composite fiber
axis, respectively. The second order orientation parameter,
hP2ðcos qÞi, is the Herman’s orientation factor, f.
From the experimental Raman intensity data plotted in
Fig. 10(b), SWNT Herman’s orientation factor, f, was
calculated to be 0.915, while the fourth order orientation
parameter, hP4ðcos qÞi , was calculated to be 0.96 for the fully
drawn PAN/SWNT (1 wt%) fiber using the least square fit of
the above equation. These orientation values were determined
without assuming any particular peak shape for the Raman
intensity distribution as a function of polarization angle. For
comparison it should be noted that PAN/SWNT fibers spun by
conventional solution spinning reported by us earlier [24],
SWNT Herman’s orientation factor was calculated to be 0.98
assuming Gaussian Raman intensity distribution. Re-examin-
ation of the raw data from this study showed that, when no
particular peak shape was assumed (a method used in the
current study), an orientation factor of 0.90 was obtained for
the conventional spun PAN/SWNT fiber. Raman intensity ratio
for the beam polarized parallel and perpendicular to the fiber
axis was 38 for this conventional spun sample as compared to
42 for the gel spun sample. Thus the SWNT orientation in the
gel spun fiber is only slightly higher (0.915) than in the
conventional spun fiber (0.90). However, the SWNT orien-
tation in the PAN/SWNT gel spun fiber is less than polymer
orientation achieved in fibers such as Kevlare, Zylone, and
Spectrae, where typical orientation factor value is w0.99.
It was previously reported that the PAN fiber processed by
conventional solution spinning was soluble in DMF at room
temperature, while PAN/SWNT fiber containing 10% SWNTs
was not soluble [8]. In the current study, we observed that fully
drawn gel spun PAN fiber as well as PAN/SWNT (1 wt%) are
both insoluble in DMF at room temperature. Drawn gel spun
PAN did dissolve when boiled in DMF, while the drawn PAN/
SWNT (1 wt%) only broke into fragments after boiling in DMF
for 30 min. These fragments when observed in HRTEM,
showed highly crystalline PAN well adhered to SWNTs
(Fig. 7(c)). To show the solubility difference, PAN and PAN/
SWNT fibers were heated in DMF at 60 8C for 6 h. Under these
conditions, control gel spun PAN fiber begins to disintegrate
into fibrils, while the 1 wt% SWNT containing composite fiber
did not (Fig. 11). TEM observation that PAN crystals are well
adhered to SWNTs, and X-ray result showing that in the
composite fiber PAN lattice spacings are slightly smaller than
their value in the control gel spun PAN, may explain the
reduced PAN/SWNT solubility.
The stress–strain curve of the highly drawn control PAN
fiber shows a yield point at about 25% of the ultimate stress and
frequent sudden stress reduction at various strain levels
(Fig. 12). These sudden stress reductions were a result of fibril
breakage in the highly drawn control PAN fiber and not due to
fiber slippage from the grips. The stress–strain curves in Fig. 12
also show that such stress reduction and hence fibril breakage
did not occur in the composite fibers. The tensile modulus and
strength of the gel spun PAN fiber increased almost linearly up
to a draw ratio of about 40, and above this value, draw ratio
only had moderate effect on tensile properties (Table 2,
Fig. 13). Draw ratio of 51, as well as tensile strength and tensile
modulus (Fig. 14) of fully drawn fiber obtained in this study,
are consistent with the literature report [22]
Fiber tensile properties are listed in Table 3. With the
addition of 1 wt% SWNT, room temperature modulus
increased by 6.6 GPa (from 22.1 to 28.7 GPa). Assuming that
the PAN modulus in the composite fiber is the same as in the
control gel spun PAN, the modulus of the PAN/SWNT
composite with fully exfoliated SWNT with an orientation
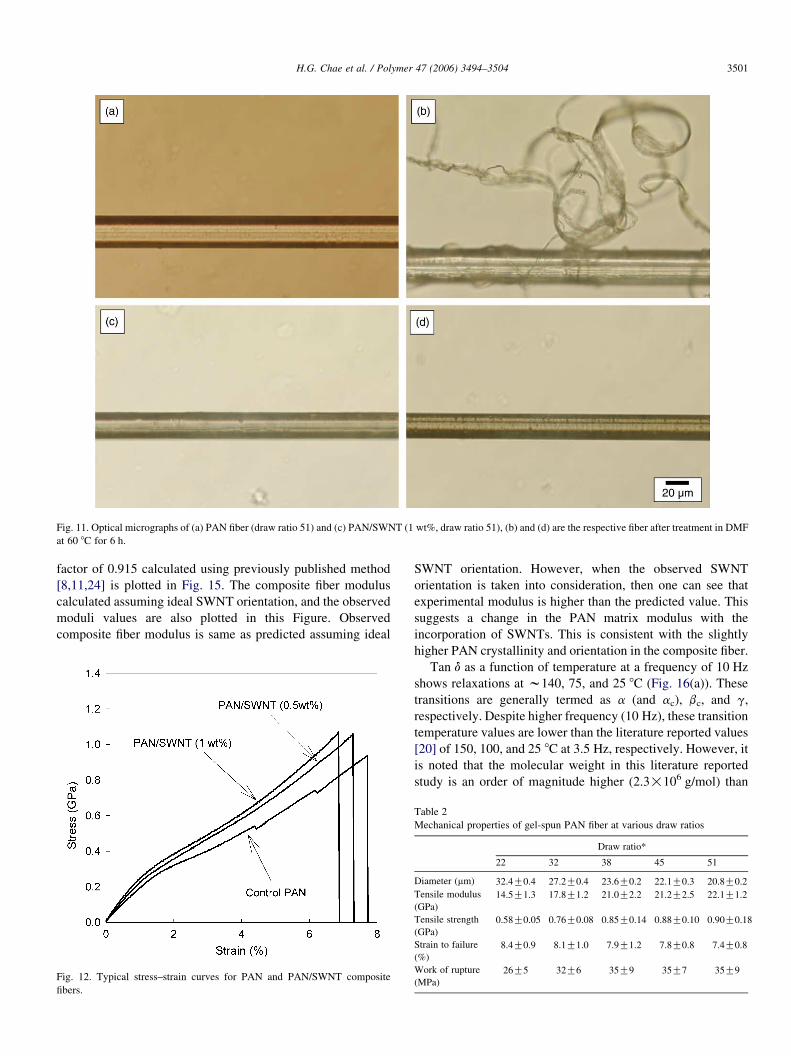
Fig. 11. Optical micrographs of (a) PAN fiber (draw ratio 51) and (c) PAN/SWNT (1 wt%, draw ratio 51), (b) and (d) are the respective fiber after treatment in DMF
at 60 8C for 6 h.
H.G. Chae et al. / Polymer 47 (2006) 3494–3504 3501
factor of 0.915 calculated using previously published method
[8,11,24] is plotted in Fig. 15. The composite fiber modulus
calculated assuming ideal SWNT orientation, and the observed
moduli values are also plotted in this Figure. Observed
composite fiber modulus is same as predicted assuming ideal
Fig. 12. Typical stress–strain curves for PAN and PAN/SWNT composite
fibers.
SWNT orientation. However, when the observed SWNT
orientation is taken into consideration, then one can see that
experimental modulus is higher than the predicted value. This
suggests a change in the PAN matrix modulus with the
incorporation of SWNTs. This is consistent with the slightly
higher PAN crystallinity and orientation in the composite fiber.
Tan d as a function of temperature at a frequency of 10 Hz
shows relaxations at w140, 75, and 25 8C (Fig. 16(a)). These
transitions are generally termed as a (and ac), bc, and g,
respectively. Despite higher frequency (10 Hz), these transition
temperature values are lower than the literature reported values
[20] of 150, 100, and 25 8C at 3.5 Hz, respectively. However, it
is noted that the molecular weight in this literature reported
study is an order of magnitude higher (2.3!106 g/mol) than
Table 2
Mechanical properties of gel-spun PAN fiber at various draw ratios
Draw ratio*
22 32 38 45 51
Diameter (mm) 32.4G0.4 27.2G0.4 23.6G0.2 22.1G0.3 20.8G0.2
Tensile modulus
(GPa)
14.5G1.3 17.8G1.2 21.0G2.2 21.2G2.5 22.1G1.2
Tensile strength
(GPa)
0.58G0.05 0.76G0.08 0.85G0.14 0.88G0.10 0.90G0.18
Strain to failure
(%)
8.4G0.9 8.1G1.0 7.9G1.2 7.8G0.8 7.4G0.8
Work of rupture
(MPa)
26G5 32G6 35G9 35G7 35G9
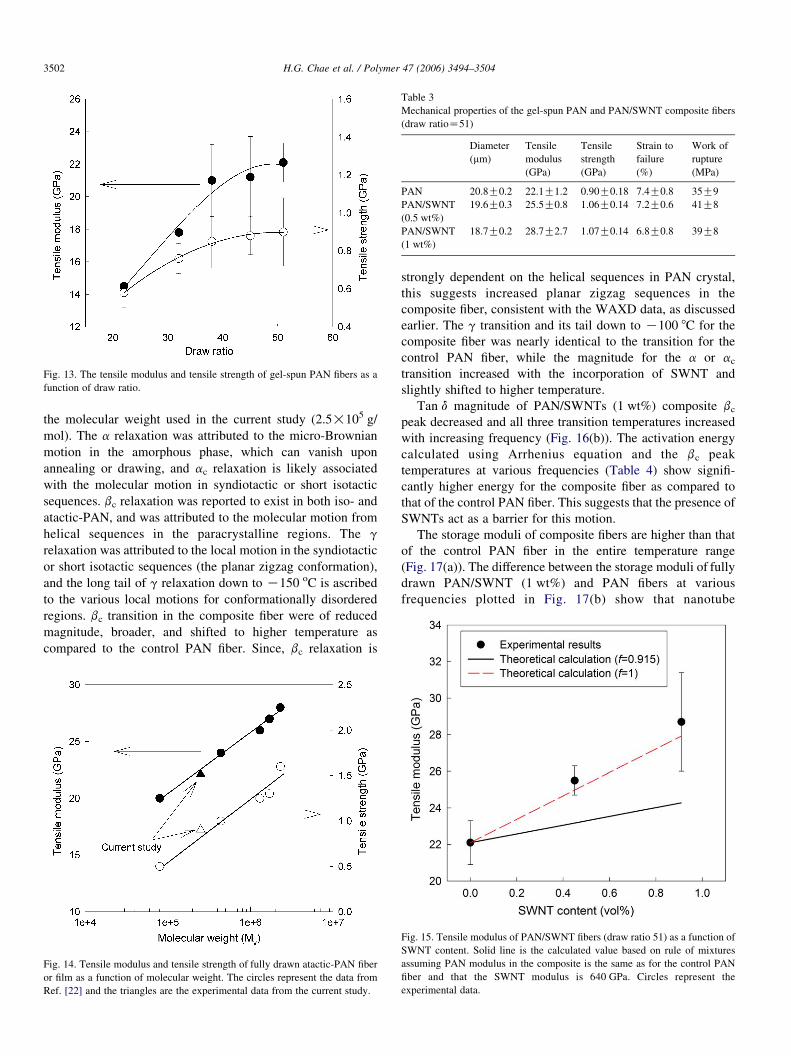
Fig. 13. The tensile modulus and tensile strength of gel-spun PAN fibers as a
function of draw ratio.
Table 3
Mechanical properties of the gel-spun PAN and PAN/SWNT composite fibers
(draw ratioZ51)
Diameter
(mm)
Tensile
modulus
(GPa)
Tensile
strength
(GPa)
Strain to
failure
(%)
Work of
rupture
(MPa)
PAN 20.8G0.2 22.1G1.2 0.90G0.18 7.4G0.8 35G9
PAN/SWNT
(0.5 wt%)
19.6G0.3 25.5G0.8 1.06G0.14 7.2G0.6 41G8
PAN/SWNT
(1 wt%)
18.7G0.2 28.7G2.7 1.07G0.14 6.8G0.8 39G8
H.G. Chae et al. / Polymer 47 (2006) 3494–35043502
the molecular weight used in the current study (2.5!105 g/
mol). The a relaxation was attributed to the micro-Brownian
motion in the amorphous phase, which can vanish upon
annealing or drawing, and ac relaxation is likely associated
with the molecular motion in syndiotactic or short isotactic
sequences. bc relaxation was reported to exist in both iso- and
atactic-PAN, and was attributed to the molecular motion from
helical sequences in the paracrystalline regions. The g
relaxation was attributed to the local motion in the syndiotactic
or short isotactic sequences (the planar zigzag conformation),
and the long tail of g relaxation down to K150 oC is ascribed
to the various local motions for conformationally disordered
regions. bc transition in the composite fiber were of reduced
magnitude, broader, and shifted to higher temperature as
compared to the control PAN fiber. Since, bc relaxation is
Fig. 14. Tensile modulus and tensile strength of fully drawn atactic-PAN fiber
or film as a function of molecular weight. The circles represent the data from
Ref. [22] and the triangles are the experimental data from the current study.
strongly dependent on the helical sequences in PAN crystal,
this suggests increased planar zigzag sequences in the
composite fiber, consistent with the WAXD data, as discussed
earlier. The g transition and its tail down to K100 8C for the
composite fiber was nearly identical to the transition for the
control PAN fiber, while the magnitude for the a or actransition increased with the incorporation of SWNT and
slightly shifted to higher temperature.
Tan d magnitude of PAN/SWNTs (1 wt%) composite bcpeak decreased and all three transition temperatures increased
with increasing frequency (Fig. 16(b)). The activation energy
calculated using Arrhenius equation and the bc peak
temperatures at various frequencies (Table 4) show signifi-
cantly higher energy for the composite fiber as compared to
that of the control PAN fiber. This suggests that the presence of
SWNTs act as a barrier for this motion.
The storage moduli of composite fibers are higher than that
of the control PAN fiber in the entire temperature range
(Fig. 17(a)). The difference between the storage moduli of fully
drawn PAN/SWNT (1 wt%) and PAN fibers at various
frequencies plotted in Fig. 17(b) show that nanotube
Fig. 15. Tensile modulus of PAN/SWNT fibers (draw ratio 51) as a function of
SWNT content. Solid line is the calculated value based on rule of mixtures
assuming PAN modulus in the composite is the same as for the control PAN
fiber and that the SWNT modulus is 640 GPa. Circles represent the
experimental data.
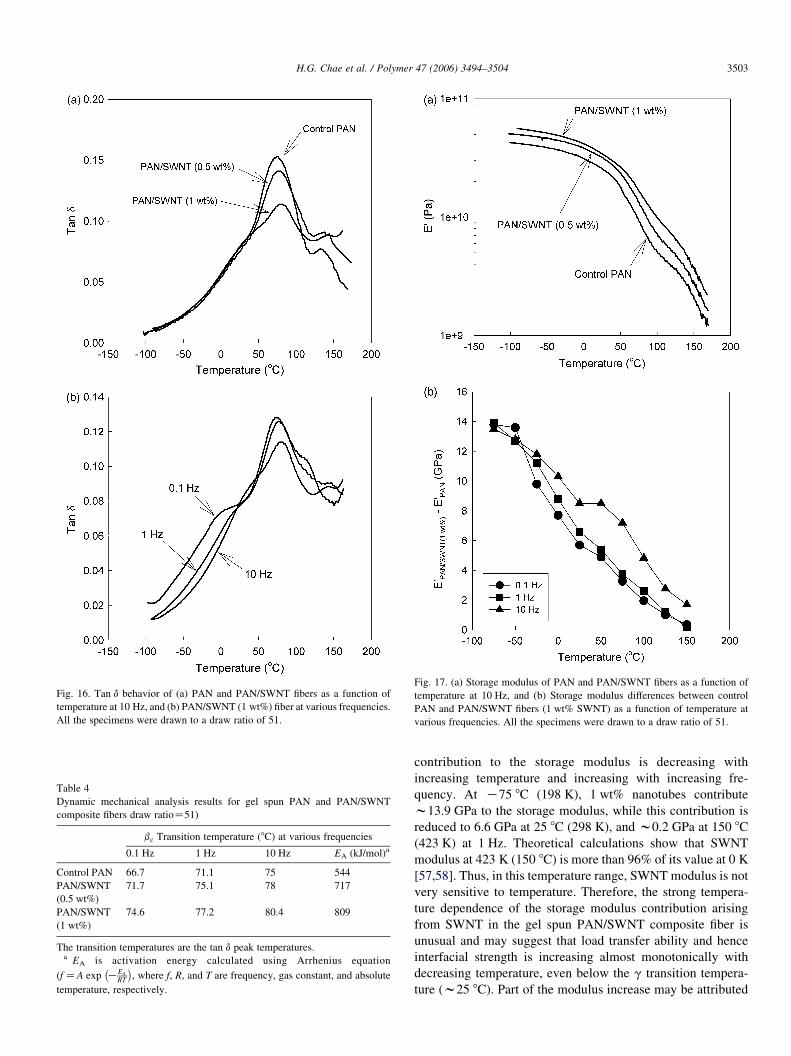
Fig. 16. Tan d behavior of (a) PAN and PAN/SWNT fibers as a function of
temperature at 10 Hz, and (b) PAN/SWNT (1 wt%) fiber at various frequencies.
All the specimens were drawn to a draw ratio of 51.
Table 4
Dynamic mechanical analysis results for gel spun PAN and PAN/SWNT
composite fibers draw ratioZ51)
bc Transition temperature (8C) at various frequencies
0.1 Hz 1 Hz 10 Hz EA (kJ/mol)a
Control PAN 66.7 71.1 75 544
PAN/SWNT
(0.5 wt%)
71.7 75.1 78 717
PAN/SWNT
(1 wt%)
74.6 77.2 80.4 809
The transition temperatures are the tan d peak temperatures.a EA is activation energy calculated using Arrhenius equation
(fZA exp KEA
RT
� �, where f, R, and T are frequency, gas constant, and absolute
temperature, respectively.
Fig. 17. (a) Storage modulus of PAN and PAN/SWNT fibers as a function of
temperature at 10 Hz, and (b) Storage modulus differences between control
PAN and PAN/SWNT fibers (1 wt% SWNT) as a function of temperature at
various frequencies. All the specimens were drawn to a draw ratio of 51.
H.G. Chae et al. / Polymer 47 (2006) 3494–3504 3503
contribution to the storage modulus is decreasing with
increasing temperature and increasing with increasing fre-
quency. At K75 8C (198 K), 1 wt% nanotubes contribute
w13.9 GPa to the storage modulus, while this contribution is
reduced to 6.6 GPa at 25 8C (298 K), and w0.2 GPa at 150 8C
(423 K) at 1 Hz. Theoretical calculations show that SWNT
modulus at 423 K (150 8C) is more than 96% of its value at 0 K
[57,58]. Thus, in this temperature range, SWNT modulus is not
very sensitive to temperature. Therefore, the strong tempera-
ture dependence of the storage modulus contribution arising
from SWNT in the gel spun PAN/SWNT composite fiber is
unusual and may suggest that load transfer ability and hence
interfacial strength is increasing almost monotonically with
decreasing temperature, even below the g transition tempera-
ture (w25 8C). Part of the modulus increase may be attributed
H.G. Chae et al. / Polymer 47 (2006) 3494–35043504
to the changes in PAN structure and morphology resulting from
the presence of SWNT.
Acknowledgements
This work is supported by the Office of Naval Research
(N00014-01-1-0657), Air Force Office of Scientific Research
(F49620-03-1-0124 and FA9550-06-1-0122), and Carbon
Nanotechnologies, Inc. Polyacrylonitrile was obtained from
Exlan Corporation, Japan.
References
[1] Baughman RH, Zakhidov AA, de Heer WA. Science 2002;297:787–92.
[2] Biercuk MJ, Llaguno MC, Radosavljevic M, Hyun JK, Johnson AT,
Fischer JE. Appl Phys Lett 2002;80:2767–9.
[3] Kim B, Lee J, Yu IS. J Appl Phys 2003;94:6724–8.
[4] Ko F, Gogotsi Y, Ali A, Naguib N, Ye HH, Yang GL, et al. Adv Mater
2003;15:1161–5.
[5] Kumar S, Dang TD, Arnold FE, Bhattacharyya AR, Min BG, Zhang XF,
et al. Macromolecules 2002;35:9039–43.
[6] Sandler JKW, Kirk JE, Kinloch IA, Shaffer MSP, Windle AH. Polymer
2003;44:5893–9.
[7] Shaffer MSP, Windle AH. Adv Mater 1999;11:937–41.
[8] Sreekumar TV, Liu T, Min BG, Guo H, Kumar S, Hauge RH, et al. Adv
Mater 2004;16:58–61.
[9] Zhang XF, Liu T, Sreekumar TV, Kumar S, Moore VC, Hauge RH, et al.
Nano Lett 2003;3:1285–8.
[10] Putz KW, Mitchell CA, Krishnamoorti R, Green PF. J Polym Sci, Part B:
Polym Phys 2004;42:2286–93.
[11] Liu T, Kumar S. Nano Lett 2003;3:647–50.
[12] Chawla KK. Fibrous materials. Cambridge: Cabridge University Press;
1998. 214–219.
[13] Minus ML, Kumar S. JOM 2005;57:52–8.
[14] Smith P, Lemstra PJ. J Polym Sci, Part B: Polym Phys 1981;19:1007–9.
[15] Smith P, Lemstra PJ, Kalb B, Pennings AJ. Polym Bull 1979;1:733–6.
[16] Cha WI, Hyon SH, Ikada Y. J Polym Sci Part B-Polym Phys 1994;32:
297–304.
[17] Takahashi T, Suzuki K, Aoki T, Sakurai K. J Macromol Sci, Phys B 1991;
30:101–18.
[18] Qian BJ, Lin WP, He JM, Hu PP, Wu CX. J Polym Eng 1996;15:327–45.
[19] Sawai D, Kanamoto T, Porter RS. Macromolecules 1998;31:2010–2.
[20] Sawai D, Kanamoto T, Yamazaki H, Hisatani K. Macromolecules 2004;
37:2839–46.
[21] Sawai D, Yamane A, Kameda T, Kanamoto T, Ito M, Yamazaki H,
Hisatani K. Macromolecules 1999;32:5622–30.
[22] Sawai D, Yamane A, Takahashi H, Kanamoto T, Ito M, Porter RS.
J Polym Sci, Part B: Polym Phys 1998;36:629–40.
[23] Yamane A, Sawai D, Kameda T, Kanamoto T, Ito M, Porter RS.
Macromolecules 1997;30:4170–8.
[24] Chae HG, Sreekumar TV, Uchida T, Kumar S. Polymer 2005;46:
10925–35.
[25] Ge JJ, Hou HQ, Li Q, Graham MJ, Greiner A, Reneker DH, et al. J Am
Chem Soc 2004;126:15754–61.
[26] Guo H, Sreekumar TV, Liu T, Minus M, Kumar S. Polymer 2005;46:
3001–5.
[27] Kim SH, Min BG, Lee SC, Park SB, Lee TD, Park M, et al. Fiber Polym
2004;5:198–203.
[28] Koganemaru A, Bin Y, Agari Y, Matsuo M. Adv Funct Mater 2004;14:
842–50.
[29] Lam HL, Naguib N, Ye HH, Ali A, Gogotsi Y, Yang GL, et al. Abstracts
Papers Am Chem Soc 2003;226:U403–U40U.
[30] Min BG, Sreekumar TV, Uchida T, Kumar S. Carbon 2005;43:599–604.
[31] Oya A, Yokoyama T, Yamamoto M, Hulicova D. Key Eng mater 2004;
264–268:2275–8 [Viii, Pts1–3].
[32] Petrov P, Lou XD, Pagnoulle C, Jerome C, Calberg C, Jerome R.
Macromol Rapid Commun 2004;25:987–90.
[33] Pirlot C, Mekhalif Z, Fonseca A, Nagy JB, Demortier G, Delhalle J. Chem
Phys Lett 2003;372:595–602.
[34] Pirlot C, Willems I, Fonseca A, Nagy JB, Delhalle J. Adv Eng Mater
2002;4:109–14.
[35] Wang B, Li JW,Wang HP, Jiang JM, Liu YQ.Macromol Symp 2004;216:
189–94.
[36] Weisenberger MC, Grulke EA, Jacques D, Rantell T, Andrews R.
J Nanosci Nanotechnol 2003;3:535–9.
[37] Ye HH, Lam H, Titchenal N, Gogotsi Y, Ko F. Appl Phys Lett 2004;85:
1775–7.
[38] Samuels RJ. Structured polymer properties. New York: Wiley; 1974. 28–
41.
[39] Allen RA, Ward IM, Bashir Z. Polymer 1994;35:4035–40.
[40] Allen RA, Ward IM, Bashir Z. Polymer 1994;35:2063–71.
[41] Colvin BG, Storr P. Eur Polym J 1974;10:337–40.
[42] Kumamaru F, Kajiyama T, Takayanagi M. J Cryst Growth 1980;48:
202–9.
[43] Bashir Z. J Polym Sci, Part B: Polym Phys 1994;32:1115–28.
[44] Bashir Z. In: Jassal M, Agrawal AK, editors. Order and morphology in
atactic polyacrylonitrile, International conference on emerging trends in
polymers and textiles. IIT Delhi, India: Deptartment of Textile
Technology; 2005. p. 17–28.
[45] Minus M, Chae HG, Kumar S. polymer, in press.
[46] Haggenmueller R, ZhouW, Fischer JE, Winey KI. J Nanosci Nanotechnol
2003;3:105–10.
[47] Potschke P, Brunig H, Janke A, Fischer D, Jehnichen D. Polymer 2005;
46:10355–63.
[48] Zhao Q, Wagner HD. In: Philosophical transactions of the Royal Society
of London series a-mathematical physical and engineering sciences, 362;
2004, 2004. p. 2407–24.
[49] Ericson LM, Fan H, Peng HQ, Davis VA, Zhou W, Sulpizio J, et al.
Science 2004;305:1447–50.
[50] Li YL, Kinloch IA, Windle AH. Science 2004;304:276–8.
[51] Miaudet P, Badaire S, Maugey M, Derre A, Pichot V, Launois P, et al.
Nano Lett 2005;5:2212–5.
[52] Motta M, Li YL, Kinloch I, Windle A. Nano Lett 2005;5:1529–33.
[53] Vigolo B, Penicaud A, Coulon C, Sauder C, Pailler R, Journet C, et al.
Science 2000;290:1331–4.
[54] Zhou W, Vavro J, Guthy C, Winey KI, Fischer JE, Ericson LM, et al.
J Appl Phys 2004;95:649–55.
[55] Liu T, Kumar S. Chem Phys Lett 2003;378:257–62.
[56] McBrierty VJ, Ward IM. J Phys D: Appl Phys 1968;1:1529–42.
[57] Jiang H, Huang Y, Hwang KC. J Eng Mater Technol-Trans Asme 2005;
127:408–16.
[58] Raravikar NR, Keblinski P, Rao AM, Dresselhaus MS, Schadler LS,
Ajayan PM. Phys Rev B 2002;66:235424.


