Embed Size (px)
Citation preview
Osmotic drought stress influence on physiological
and biochemical characteristics of pistachio (Pistacia
spp.) seedlings
Ali Esmaeilpour
.

In The Name Of Allah, The Most Beneficent, The Most Merciful
Promotors:
Prof. dr. ir. Patrick Van Damme, Laboratory of
Tropical and Subtropical Agronomy and Ethnobotany,
Department of Plant Production, Faculty of Bioscience
Engineering, Ghent University, Belgium
Prof. dr. ir. Roeland Samson, Department of
Bioscience Engineering, Faculty of Science, Antwerp
University, Belgium
Faculty of Bioscience Engineering
Dean:
Prof. dr. ir. Marc Van Meirvenne
Rector:
Prof. dr. Anne De Paepe
Ali Esmaeilpour
Osmotic drought stress influence on physiological and biochemical
characteristics of pistachio (Pistacia spp.) seedlings
Thesis submitted in fulfilment of the requirements for the degree of Doctor (PhD) in
Applied Biological Sciences
This work should be cited as:
Esmaeilpour, A. 2017. Osmotic drought stress influence on physiological and biochemical
characteristics of pistachio (Pistacia spp.) seedlings. PhD thesis, 181 pp, Ghent University,
Ghent, Belgium.
Copyright:
The author and the promoters give the authorization to consult and to copy parts of this
work for personal use only. Every other use is subject to the copyright laws. Permission to
reproduce any material contained in this work should be obtained from the author.
ISBN- number: 9789463570442
Cover illustration:
Front page:
Adult pistachio tree
Back page:
Top left: male flowers
Middle left: female flowers
Top right: ripen fruits
Bottom left: fruits in shell
Bottom right: pistachio kernels
Members of the jury
Prof. Jo Dewulf (Chairman)
Department of Sustainable Organic Chemistry and Technology
Faculty of Bioscience Engineering, Ghent University
Prof. Kathy Steppe (Secretary)
Department of Applied Ecology & Environmental Biology
Faculty of Bioscience Engineering, Ghent University
Prof. Marie-Christine Van Labeke
Department of Plant Production
Faculty of Bioscience Engineering, Ghent University
Dr. ir. Karen Wuyts
Department of Bioscience Engineering
Faculty of Science, Antwerp University
Dr. ir. Wouter Maes
Department of Applied Ecology & Environmental Biology
Faculty of Bioscience Engineering, Ghent University
Dr. ir. Wouter Vanhove
Department of Plant Production
Faculty of Bioscience Engineering, Ghent University
Prof. Patrick Van Damme (Promotor)
Department of Plant Production
Faculty of Bioscience Engineering, Ghent University
Prof. Roeland Samson (Promotor)
Department of Bioscience Engineering
Faculty of Science, Antwerp University
Acknowledgements
First of all, I am grateful to The Almighty God for establishing me to complete this
research. This thesis would not have been possible without the support of many people.
I would like to express my deepest appreciation to my first promotor, Prof. dr. ir. Patrick
Van Damme, for his constant support, guidance and valuable comments through the period of
this study.
I am very grateful to my other promoter, Prof. dr. ir. Roeland Samson from Antwerp
University for his great comments and also his support for providing all devices that I
required to measure some data parameters during my research in his laboratory thanks also to
his colleagues for helping me in this project.
I would also like to thank Prof. dr. ir. Marie-Chrisitine Van Labeke, who advised my
research in the best way at horticulture laboratory. She provided me with all the facilities that
I needed in my research and I am deeply thankful to her and her colleagues in this laboratory
for their great expertise and contribution to my research.
I am very thankful to the director of Iran’s Pistachio Research Institute (IPRI) and
Agricultural Research, Education and Extension Organization (AREEO) of Iran for awarding
me a scholarship for doing this PhD research. I would like to thank former rector of Ghent
University Prof. dr. Paul Van Cauwenberge, dean of bioscience faculty Prof. dr. ir. Guido
Van Huylebroeck and Head of Laboratory of Tropical and Subtropical Agriculture and
Ethnobotany Prof. dr. ir. P. Van Damme for accepting me as a doctoral student.
I am deeply grateful to Prof. dr. ir. P. Van Damme and Prof. dr. ir. Van Labeke for their
invaluable assistance and remarks during the course of writing my thesis and publications.
I am very grateful, for the help and hospitality of the staff in the Laboratory of Tropical
and Subtropical Agriculture and Ethnobotany, Ghent University: Johan Geirnaert, who
assisted me during all glasshouse experiments and solved my technical problems, dr. ir.
Wouter Vanhove, dr. ir. Celine Termote, ir. Kaat Verzelen, ir. Arne Baert, dr. ir. Hannes
Cosyns and Isabel Vandriessche who helped me during my study here.
I take this opportunity to record our sincere thanks to all my colleagues in the laboratory
of Horticulture in the Department of Plant Production in Ghent University; ir. Katrien De
Dauw, Mieke, Thea and Christophe thanks to you all for your kind help and support.
I would like to thank Prof. dr. ir. Pascal Boeckx and Katja Van Nieuwland, laboratory of
Isotope Bioscience–ISOFYS, Ghent University, who assisted me in measuring carbon and
nitrogen isotope contents in plant samples.
I would like to thank Nafiseh (my daughter) for translating the summary to Dutch and also
Dr. ir. Wouter Vanhove who did scientific editing of the Dutch summary.
I also place on record my sense of appreciation to all of my colleagues in Iran’s Pistachio
Research Institute: dr. ir. H. Hashaminasab, dr. ir. A. Javanshah, dr. ir. H. Hokmabadi, dr. ir.
A.H. Mohamadi, dr. ir. M.R. Mehrnejad, dr. ir. M. abdolahi, dr. ir. B. Panahi, ir. Akbar
Mohamadi and ir. M. Heidari and other my colleagues who directly or indirectly have lent
their helping hand in this venture. I greatly appreciate the help, co-operation and friendship of
all my Iranian friends in Gent: dr. ir. M. Mohammadimasoudi, dr. ir. Meisam Rezaei, ir. S.
Safari, Mrs. Tahera Safari, ir. Siamak Ghafaripour (God bless him), dr. ir. K. Mehdikhanlo,
dr. ir. A. Jahanshahi, ir. A. Fardis, dr. ir K. Mahdian and dr. ir Z. Aazami.
I wish to express my eternal gratitude to my parents and my parents in laws who have
always been faithful supporters to my life and education.
Finally, I would like to express my special gratitude to my wife “Maryam” for all her
support, taking care of me and our children. She has patiently endured; many long hours at
home, alone with the kids, teach my younger daughter while I worked on my thesis. Nafiseh
our wonderful daughter thank you for all your patient and efforts, I know your studding here
were so difficult because you did not know Dutch and French languages before our coming
but you tried hard to learn them in a very short time and entered to regular high school, got
diploma, passed the medicine exam successfully and studied in the university eagerly. But,
my very cute child, Nazanin as you were very young when we came here, I believe new
school, new language, new friends and travel to Brussel every day were so difficult to do, but
you incredibly did all these hard conditions without any complain once. I would like thanks
again for you all for your help and co-operation during my studies. From now on, I promise
to be with you all time everywhere.
Regards,
Ali Esmaeilpour
Ghent, Belgium
October 2017
Summary
i
Summary
Pistachio belongs to the Anacardiaceae family. Only Pistacia vera L., i.e. cultivated
pistachio, has economic importance. Iran, as the region of origin of pistachio, has always had
the largest cultivation area in the world. About 80 percent of Iran is categorized as semi-arid
and arid. In Iran, pistachios are usually cultivated under dry and saline conditions as they
have a high drought and salinity tolerance. Still, water deficit and salinity can cause a
reduction in growth, yield and nut quality. Drought stress adversely affects growth, dry mass
accumulation, and productivity of plants, and causes a higher rate of impairment than any
other environmental factor.
There is wide variation in edible pistachio (P. vera) cultivars in Iran which are grown
under different environmental conditions. Yet, physiological responses of some pistachio
cultivars and rootstocks to drought stress have hardly been studied. The aim of this study was
to evaluate the effects of osmotic drought stress and subsequent recovery on physiological
performance of three pistachio rootstocks (P. vera L. cv. Badami, P. vera L. cv. Sarakhs and
P. terebinthus) and three of the country’s most common P.vera cultivars (Akbari, Kaleghochi
and Ohadi). In this respect, we conducted two experiments during a two years period in the
glasshouse in Ghent, Belgium.
In the first year, three pistachio rootstocks, i.e., P. vera L. cv. Badami, P. vera L. cv.
Sarakhs and P. terebinthus were subjected to four osmotic drought stress treatments: -0.1
(control), -0.5, -1.0 and -1.5 MPa using PEG 6000. Results obtained from this experiment
(Chapter 3) indicate that all drought stress treatments decreased maximum quantum yield of
PSII (Fv/Fm), effective PSII quantum yield (YII) and photochemical quenching (qP).
A decreasing osmotic potential of the nutrient solution significantly decreased leaf
phosphorous (P) concentration compared to control plants. Effects of rootstocks on leaf
mineral element contents varied significantly with drought stress condition.
Drought stress significantly decreased both plant fresh and dry weight, shoot and root dry
weight, leaf area and stem elongation. There was also a significant rootstock effect on these
growth parameters under drought stress condition. Under osmotic stress treatments,
root/shoot ratio increased significantly. Control plants showed normal elongation growth, but
growth was stopped with all drought stress treatments, and differences were significant for all
three rootstocks. After two weeks of stress, a recovery of 2 weeks was applied. This period
was insufficient to fully restore the negative effects of the applied severe stress on the studied
rootstocks.
Summary
ii
The applied osmotic drought stress on pistachio rootstocks induced significant reductions
in chlorophyll fluorescence parameters, reduction in leaf nutrient content and increases in the
leaf carbon isotope composition in pistachio rootstocks. Our results in this experiment show
that P. terebinthus rootstock had better tolerated the applied drought stress as shown by the
higher growth parameters performance in drought stress condition and lower carbon isotope
composition as compared with P. vera L. Badami and Sarakhs rootstocks. YII could be used
to distinguish the different response to drought stress in the studied pistachio rootstocks. As
YII was affected after drought stress period, this parameter has a potential to be the early and
non-destructive tool to screen pistachio rootstocks for drought tolerance.
In the second experiment, the three pistachio cultivars, i.e., Akbari, Kaleghochi and Ohadi,
were subjected to three osmotic drought stress levels: control (-0.1 MPa), moderate (-0.75
MPa) and severe drought (-1.5 MPa) stress using PEG 6000 for a 14 day period. Our results
(Chapter 4) showed that all drought stress treatments decreased net photosynthesis (Pn),
stomatal conductance (gs), intercellular CO2 concentration (Ci), and transpiration rate (E) of
pistachio cultivars tested, but also that Ohadi cultivar better maintained its photosynthetic
capacity compared to Akbari and Kaleghochi under drought stress conditions. Maximum
quantum yield of PSII (Fv/Fm), effective PSII quantum yield (YII) and photochemical
quenching (qP) were also reduced. Chlorophyll fluorescence parameters indicated that Akbari
was more susceptible to the applied drought stress. Drought stress levels decreased
chlorophyll pigments levels, fresh and dry weight, stem elongation, leaf nitrogen content (N),
and leaf water potential, and increased water use efficiency (WUE). Proline strongly
increased under drought stress for Akbari. After two weeks of stress, a recovery of 2 weeks
was applied. This period was insufficient to fully restore the negative effects of the applied
stress on the studied cultivars. Based on reduction of photosynthesis and increase of proline
content, Akbari seems more sensitive to the applied drought stress.
Among pistachio cultivars, Ohadi had higher amounts of plant dry weight (biomass) and
root dry weight under drought conditions than Akbari (significant) and Kaleghochi (non-
significant).
Results obtained from the present study (Chapter 5) also revealed that carbohydrate
accumulation varied with drought stress levels and pistachio cultivars. Both drought stress
treatments increased carbohydrate and starch values. Sucrose amounts significantly increased
with drought stress in all three cultivars, whereas glucose contents did not change
Summary
iii
significantly. Relative water content (RWC) varied between pistachio cultivars. However,
during the drought period, there were significant differences in the relative water content
between drought stress levels and their respective control for Kaleghochi.
Drought stress significantly increased water use efficiency of treated seedlings for all
cultivars. Stomatal numbers were significantly affected by the highest drought stress level in
Kaleghochi; which was in contrast with non-significant changes in Akbari and Ohadi.
The impact of drought stress treatments on carbon isotope composition (δ13
C) was not
significant compared to the control in pistachio cultivars. There were no significant
correlation between δ13
C and intrinsic and instantaneous WUE, biomass, Pn and soluble
sugars in this experiment. Nitrogen isotope composition (δ15
N) decreased in both drought
stress treatments (-0.75 and -1.5 MPa) compared to the control.
Our study showed that different pistachio rootstocks and cultivars apply different
mechanisms to deal with drought stress: drought avoidance and drought-tolerance
mechanisms. Taking all ecophysiological and biochemical parameters obtained in this
evaluation into consideration, it can be concluded that Terebinthus (P. terebinthus) rootstock
and Ohadi (P. vera) cultivar are more tolerant to lower water availability in comparison with
the other evaluated pistachio genotypes.

SAMENVATTING
i
SAMENVATTING
Pistache behoort tot de familie Anacardiaceae. Alleen P. vera L., d.w.z. gecultiveerde
pistache, heeft een significant economisch belang. Iran, de oorsprongsregio van pistache, is
ook d het grootste teeltgebied ter wereld. Ongeveer 80 procent van het landoppervlakte in
Iran is gecategoriseerd als halfdroog of droog. In Iran worden pistachenoten gewoonlijk
onder droge omgevings- en mineraalrijke bodemomstandigheden geteeld, omdat ze een hoge
tolerantie hebben tegen droogte, en zoute bodems en/of grondwater. Toch kan watertekort en
saliniteit leiden tot een vermindering van de groei, de opbrengst en de nootkwaliteit.
Droogtestress heeft een nadelige invloed op de groei, de accumulatie van droge massa en de
productiviteit van de planten en veroorzaakt een sterkere productievermindering dan elke
andere omgevingsfactor.
Er is grote variatie in eetbare pistachio (P. vera) cultivars in Iran die onder verschillende
omgevingsomstandigheden worden gekweekt. Toch zijn de fysiologische reacties van
sommige pistache cultivars en onderstammen op droogtestress nauwelijks bestudeerd. Het
doel van deze studie was om de effecten van osmotische droogtestress en het daaropvolgende
herstel te evalueren op de fysiologische prestaties van drie pistache-onderstammen (Pistacia
vera L. cv. Badami, P. vera L. cv. Sarakhs en P. terebinthus) en drie van de in Iran, meest
voorkomende P.vera cultivars (Akbari, Kaleghochi en Ohadi). In dit verband hebben we
gedurende twee jaar twee experimenten uitgevoerd in de serres van de Faculteit Bio-
ingenieurswetenschappen van de Universiteit Gent (België).
In het eerste jaar, werden drie pistachio onderstammen, d.w.z. Pistacia vera L. cv.
Badami, P. vera L. cv. Sarakhs en P. terebinthus onderworpen aan vier osmotische
droogtestressbehandelingen: -0.1 (controle), -0.5, -1.0 en -1.5 MPa met behulp van PEG
6000. De resultaten verkregen uit dit experiment (Hoofdstuk 3) geven aan dat bij alle
droogtebehandelingen de kwantumopbrengst van PSII fotochemie (Fv/Fm), effectieve PSII
kwantumopbrengst (YII) en photochemicsche quenching (qP) verminderden.
Een afnemend osmotisch potentieel van de voedingsoplossing zorgde voor de significante
vermindering van de het fosforgehalte in bladeren in vergelijking met controle planten.
Effecten van onderstammen op de minerale gehalte van de bladeren varieerden aanzienlijk
volgens droogtestresscondities.
Droogtestress verminderde zowel het totale vers- als drooggewicht, het zdrooggewicht
van stengels en wortelen, de bladoppervlakte en de stengelverlenging. Er was ook een
significant onderstameffect op deze groeiparameters onder de droogtestresscondities. Onder
SAMENVATTING
ii
osmotische stressbehandelingen steeg de wortel/stengelverhouding aanzienlijk.
Controleplanten vertoonden normale verlengingsgroei, maar de groei werd gestopt bij alle
droogtebehandelingen, en de verschillen waren significant voor de drie onderstammen. Na
twee weken stress werd een herstelperiode van 2 weken toegepast. Deze periode was
onvoldoende om de negatieve effecten van de toegepaste ernstige stress op de onderzochte
onderstammen volledig te herstellen.
De toegepaste osmotische droogtestress op de pistache onderstammen veroorzaakte
significante verlagingen van de chlorofylfluorescentieparameters, een vermindering van het
bladnutriëntengehalte en verhogingen in de bladkoolstof-isotoopsamenstelling. De resultaten
van dit experiment laten zien dat de Pistacia terebinthus onderstammen de toegepaste
droogtestress beter tolereerden, zoals blijkt uit de hogere groeiparametersprestaties in de
droogte-stressconditie en de lagere koolstofisotopenamenstelling, in vergelijking met P. vera
L. Badami en Sarakhs onderstammen. YII kan worden gebruikt om de verschillende reacties
op droogtestress in de onderzochte pistache onderstammen te onderscheiden. Aangezien YII
na de droogtestressperiode was aangetast, kan deze parameter een vroeg en niet-destructief
hulpmiddel zijn om pistache onderstammen te screenen voor droogtetolerantie.
In het tweede jaar werden de drie pistachecultivars, d.w.z. Akbari, Kaleghochi en Ohadi,
onderworpen aan drie osmotische droogtestresscondities: controle (-0.1 MPa), matige (-0.75
MPa) en ernstige droogtestress (-1.5 MPa) a.d.h.v. PEG 6000 gedurende een periode van 14
dagen. Onze resultaten (hoofdstuk 4) laten zien dat alle droogtestressbehandelingen de netto
fotosynthese (Pn), de stomatale geleidbaarheid (gs), de intercellulaire CO2-concentratie (Ci)
en de transpiratiesnelheid (E) van de pistachekultivars verminderen, maar ook dat de Ohadi-
cultivar een hogere fotosynthetische capaciteit had ten opzichte van Akbari en Kaleghochi,
onder droogtestressomstandigheden. Maximale kwantumopbrengst van PSII fotochemie
(Fv/Fm), effectieve PSII kwantumopbrengst (YII) en fotochemische quenching (qP) werden
ook verminderd. Chlorofylfluorescentie parameters hebben aangetoond dat Akbari gevoeliger
is voor de toegepaste droogtestress. De droogtesterkte verlaagde het gehalte aan
chlorofylpigmenten, vers en droog gewicht, stengelverlenging, bladstikstofgehalte (N) en het
bladwaterpotentieel en verhoogde de watergebruiksefficiëntie (WUE). Proline groeide sterk
onder droogtestress voor Akbari. Na twee weken stress werd een herstelperiode van 2 weken
toegepast. Deze periode was onvoldoende om de negatieve effecten van de toegepaste stress
op de bestudeerde cultivars volledig te herstellen. Op basis van de verlaging van de
SAMENVATTING
iii
fotosynthese en deverhoging van het prolinegehalte lijkt Akbari gevoeliger voor de
toegepaste droogtestress.
Onder de pistachecultivars had Ohadi een hoger totaal drooggewicht (biomassa) en
worteldrooggewicht onder droogteomstandigheden dan zowel de Akbari (significante
verschillen) als de Kaleghochi (niet-significante verschillen) cultivars.
Uit onze resultaten (Hoofdstuk 5) bleek ook dat accumulatie van koolhydraten sterk
varieert tussen droogtestressniveaus en pistachecultivars. Beide droogtebehandelingen
verhoogden de koolhydraat- en zetmeelgehaltes. Sucrosehoeveelheden werden significant
verhoogd onder droogtestressomstandigheden in alle drie de cultivars, terwijl de glucose-
inhoud niet significant veranderde. Het relatiefve watergehalten variëren tussen de pistache
cultivars. Tijdens de droogteperiode waren er echter significante verschillen in het relatieve
watergehalte tussen de planten onderworpen aan droogtestress en hun respectievelijke
controleplanten bij de Kaleghochi cultivar.
Door droogtestress is de watergebruiksefficiëntie van de behandelde zaailingen voor alle
cultivars aanzienlijk verhoogd. De aantallen stomata werden significant beïnvloed door het
hoogste droogte-stressniveau in Kaleghochi; dit is echter in tegenspraak met de niet-
significante veranderingen in Akbari en Ohadi cultivars.
Ons onderzoek toont aan dat verschillende pistache onderstammen en cultivars op
verschillende manieren met droogtestress omgaan: droogte vermijding en droogtetolerantie
mechanismen. Wanneer we alle ecofysiologische en biochemische parameters uit onze studie
in rekening brengen, kunnen we besluiten dat de Terebinthus (P. terebinthus) onderstam en
de Ohadi (P. vera) cultivar meer tolerant zijn voor lage waterbeschikbaarheid in vergelijking
met de andere bestudeerde pistache genotypes.

Table of contents
i
Table of Contents
Summary ............................................................................................................................... i
SAMENVATTING ............................................................................................................... i
Table of Contents .................................................................................................................. i
List of Figures ....................................................................................................................... i
List of Tables ........................................................................................................................ i
List of abbreviations ............................................................................................................ 1
List of Publications .............................................................................................................. 1
A review of global pistachio production ............................................................. 3 Chapter 1.
1.1 Introduction ............................................................................................................. 4
1.2 Importance of pistachio........................................................................................... 6
1.3 Pistachio taxonomy ................................................................................................. 9
1.3.1 Pistacia vera L. ............................................................................................. 10
1.3.1.1 P.vera cv. Akbari ...................................................................................... 10
1.3.1.2 P.vera cv. Badami- Zarand ....................................................................... 11
1.3.1.3 P. vera cv. Kaleghochi .............................................................................. 13
1.3.1.4 P. vera cv. Ohadi ...................................................................................... 13
1.3.1.5 P. vera cv. Sarakhs.................................................................................... 14
1.3.2 P. terebinthus L. ............................................................................................ 15
1.4 Production problems ............................................................................................. 16
1.5 Research objective ................................................................................................ 17
1.6 Outline of thesis .................................................................................................... 19
Literature review ................................................................................................. 21 Chapter 2.
2.1 Drought stress ....................................................................................................... 22
2.2 Mechanism of drought resistance ......................................................................... 22
2.2.1 Drought escape.............................................................................................. 22
2.2.2 Drought avoidance ........................................................................................ 23
2.2.3 Drought tolerance.......................................................................................... 23
Table of contents
ii
2.3 Plant responses to drought stress .......................................................................... 24
2.3.1 Effect of drought stress on morphological plant characteristics ................... 24
2.3.1.1 Leaf characteristics ................................................................................... 25
2.3.1.2 Stomata ..................................................................................................... 26
2.3.1.3 Stem elongation and plant height .............................................................. 27
2.3.1.4 Fresh and dry biomass .............................................................................. 28
2.3.1.5 Yield .......................................................................................................... 29
2.3.2 Effect of drought stress on physiological characteristics .............................. 29
2.3.2.1 Photosynthesis........................................................................................... 29
2.3.2.2 Photosynthesis pigments ........................................................................... 31
2.3.2.3 Chlorophyll fluorescence .......................................................................... 32
2.3.2.4 Water relations .......................................................................................... 36
2.3.2.4.1 Relative Water Content (RWC).......................................................... 38
2.3.2.4.2 Leaf Water Potential (LWP) ............................................................... 39
2.3.2.4.2.1 Pre-dawn leaf water potential (PLWP) ............................................................ 40
2.3.2.4.2.2 Leaf water potential (LWP) ............................................................................. 40
2.3.2.4.2.3 Stem water potential (SWP)............................................................................. 40
2.3.2.4.3 Water Use Efficiency (WUE) ............................................................. 42
2.3.2.5 Osmolyte accumulation ............................................................................ 42
2.3.2.5.1 Proline ................................................................................................ 43
2.3.2.5.2 Carbohydrate ...................................................................................... 44
2.3.2.6 Root signaling under drought stress .......................................................... 45
2.3.3 Effect of drought stress on biochemical characteristics ................................ 45
2.3.3.1 Reactive Oxygen Species (ROS) .............................................................. 45
2.3.3.2 Antioxidant defense system ...................................................................... 45
2.3.3.3 Nutrient relations ...................................................................................... 46
Table of contents
iii
2.3.3.4 Carbon isotope discrimination .................................................................. 48
2.3.3.5 Nitrogen isotope discrimination ................................................................ 50
Effects of osmotic drought stress on physiological responses, growth Chapter 3.
characteristics, mineral elements and carbon isotope composition of three
pistachio (Pistacia spp.) rootstocks .................................................................... 52
3.1 Introduction ........................................................................................................... 53
3.2 Materials and methods .......................................................................................... 54
3.2.1 Plant material and experimental set-up ......................................................... 54
3.2.2 Measurements ............................................................................................... 57
3.2.2.1 Chlorophyll fluorescence measurements .................................................. 57
3.2.2.2 Leaf mineral element content.................................................................... 58
3.2.2.3 Carbon isotope composition ..................................................................... 59
3.2.2.4 Plant growth parameters ........................................................................... 59
3.2.3 Statistical analysis ......................................................................................... 60
3.3 Results ................................................................................................................... 61
3.3.1 Multivariate analysis of variance (MANOVA) ............................................ 61
3.3.2 Chlorophyll fluorescence .............................................................................. 61
3.3.3 Plant growth parameters ............................................................................... 62
3.3.4 Leaf mineral elements ................................................................................... 66
3.3.5 Carbon isotope composition ......................................................................... 66
3.3.6 Principal component analysis (PCA) ............................................................ 69
3.4 Discussion ............................................................................................................. 72
3.5 Conclusion ............................................................................................................ 77
Osmotic stress affects physiological responses and growth characteristics of Chapter 4.
three pistachio (Pistacia vera L.) cultivars ........................................................ 79
4.1 Introduction ........................................................................................................... 80
4.2 Materials and Methods .......................................................................................... 81
4.2.1 Plant material and experimental set-up ......................................................... 81
Table of contents
iv
4.2.2 Measurements ............................................................................................... 83
4.2.2.1 Leaf water potential .................................................................................. 83
4.2.2.2 Photosynthesis measurements ................................................................... 84
4.2.2.3 Chlorophyll fluorescence measurements .................................................. 84
4.2.2.4 Chlorophyll content .................................................................................. 87
4.2.2.5 Proline content .......................................................................................... 87
4.2.2.6 Leaf nitrogen content ................................................................................ 87
4.2.2.7 Plant growth parameters ........................................................................... 88
4.2.3 Statistical analysis ......................................................................................... 89
4.3 Results ................................................................................................................... 90
4.3.1 Multivariate analysis of variance (MANOVA) ............................................ 90
4.3.2 Plant water relations ...................................................................................... 90
4.3.3 Gas exchange parameters and WUE ............................................................. 91
4.3.4 Chlorophyll fluorescence .............................................................................. 93
4.3.5 Chlorophyll and carotenoid contents ............................................................ 95
4.3.6 Proline ........................................................................................................... 98
4.3.7 Biomass characterization .............................................................................. 98
4.4 Discussion ........................................................................................................... 103
4.5 Conclusions ......................................................................................................... 107
Impact of osmotic drought stress on the biochemical characteristics, water Chapter 5.
relations, and nitrogen and carbon isotope composition of pistachio (Pistacia
vera L.) cultivars ................................................................................................ 109
5.1 Introduction ......................................................................................................... 110
5.2 Materials and methods ........................................................................................ 112
5.2.1 Plant material and experimental set-up ....................................................... 112
5.2.2 Measurements ............................................................................................. 112
Table of contents
v
5.2.2.1 Carbohydrate analysis ............................................................................. 112
5.2.2.2 Relative Water Content (RWC) .............................................................. 113
5.2.2.3 Water Use Efficiency (WUE) ................................................................. 113
5.2.2.4 Stomatal characteristics .......................................................................... 114
5.2.2.5 Carbon and nitrogen isotope analyses..................................................... 114
5.2.3 Statistical analysis ....................................................................................... 115
5.3 Results ................................................................................................................. 116
5.3.1 Changes in carbohydrate concentrations .................................................... 116
5.3.2 Relative Water Content (RWC) .................................................................. 116
5.3.3 Stomatal characteristics .............................................................................. 116
5.3.4 Intrinsic and instantaneous WUE................................................................ 120
5.3.5 Carbon and nitrogen isotope composition .................................................. 121
5.3.6 Relations between WUE, carbon and nitrogen isotope composition and
soluble sugars .................................................................................................................. 121
5.3.7 Principal component analysis (PCA) .......................................................... 124
5.4 Discussion ........................................................................................................... 128
5.5. Conclusion ............................................................................................................. 133
General conclusions and perspectives ............................................................. 134 Chapter 6.
6.1 General conclusion.............................................................................................. 135
6.2 Perspectives for future research .......................................................................... 141
6.3 Recommendations for farmers, researchers, and government ............................ 145
References ........................................................................................................................ 147
Curriculum Vitae ............................................................................................................. 166
Appendices ....................................................................................................................... 174

List of Figures
i
List of Figures
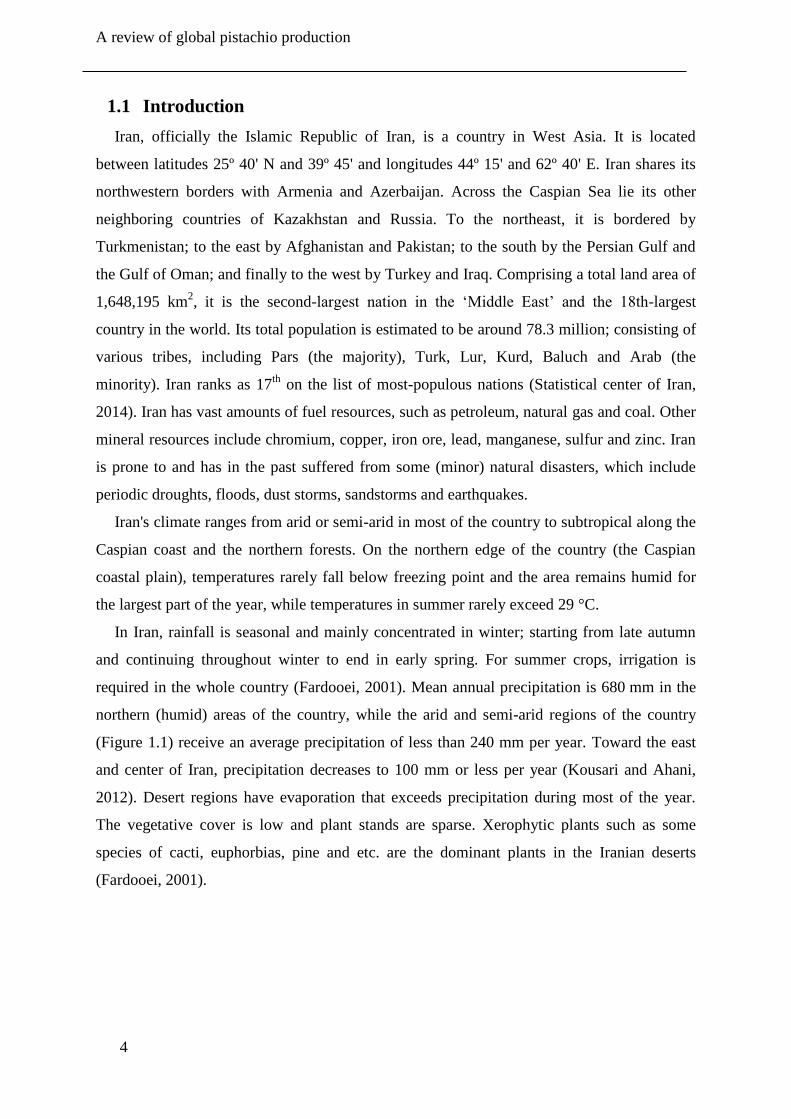
Figure 1.1: Climatology map of Iran (Peel et al., 2013). ............................................................ 5
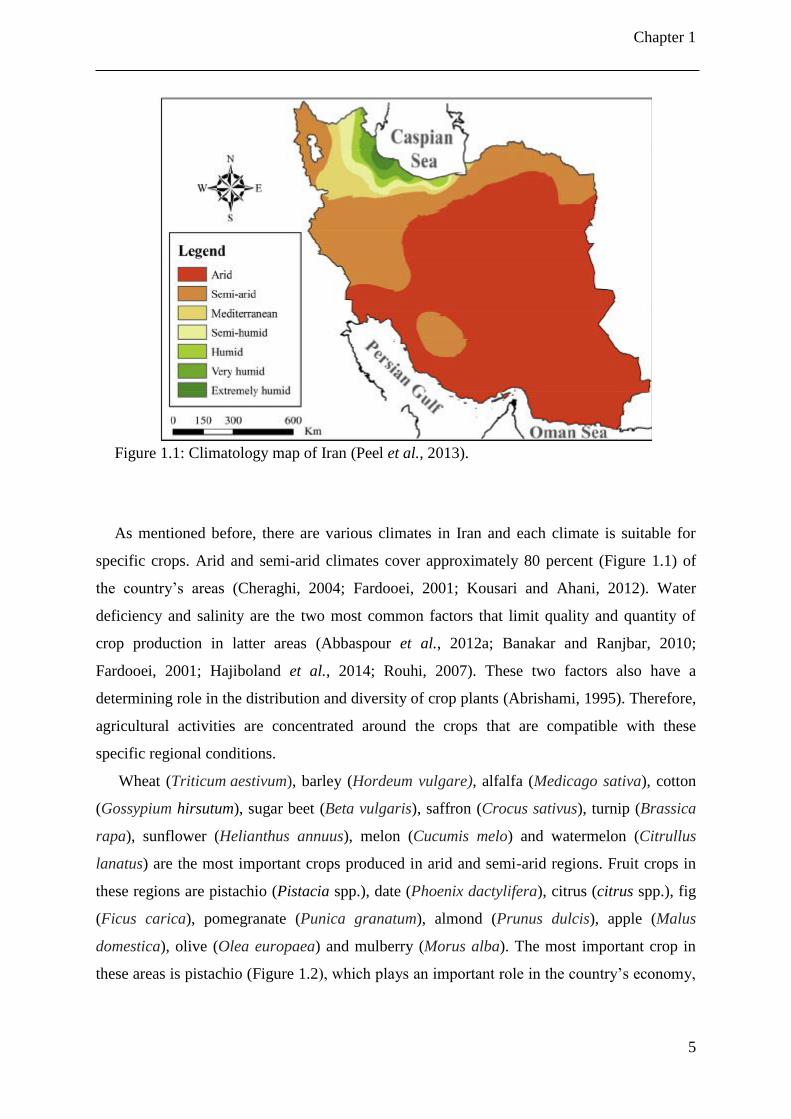
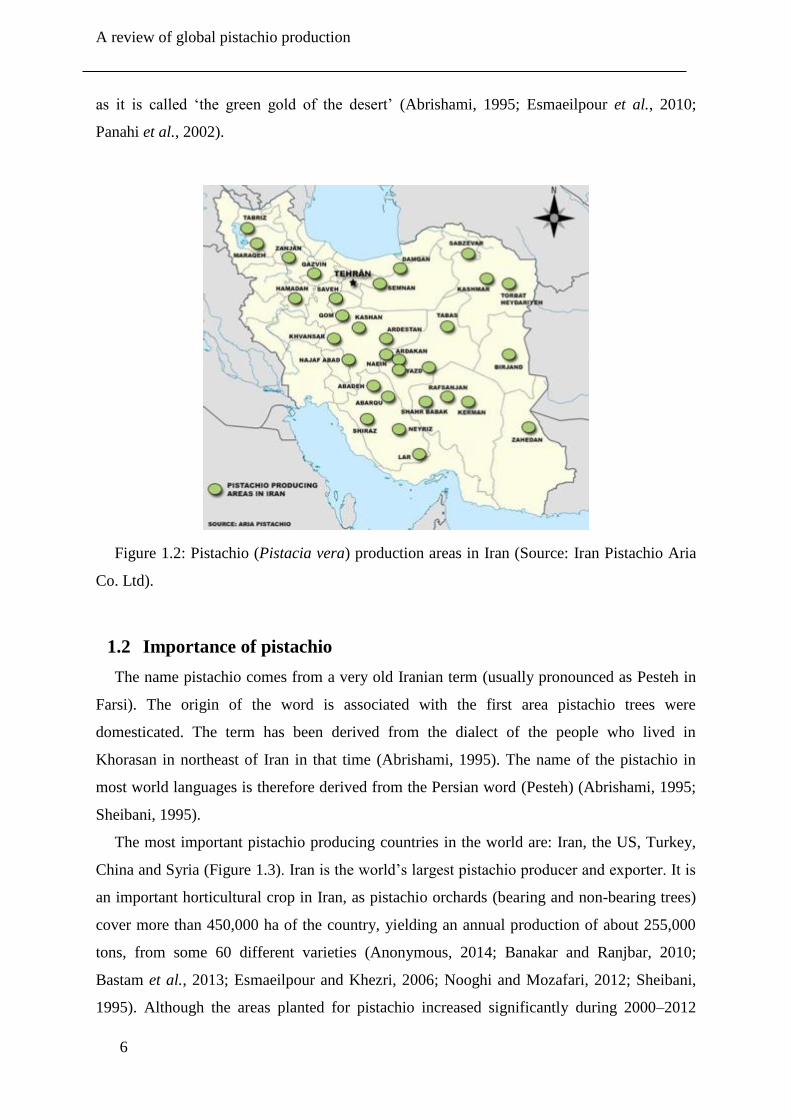
Figure 1.2: Pistachio (Pistacia vera) production areas in Iran (Source: Iran Pistachio Aria Co.
Ltd). ................................................................................................................................. 6
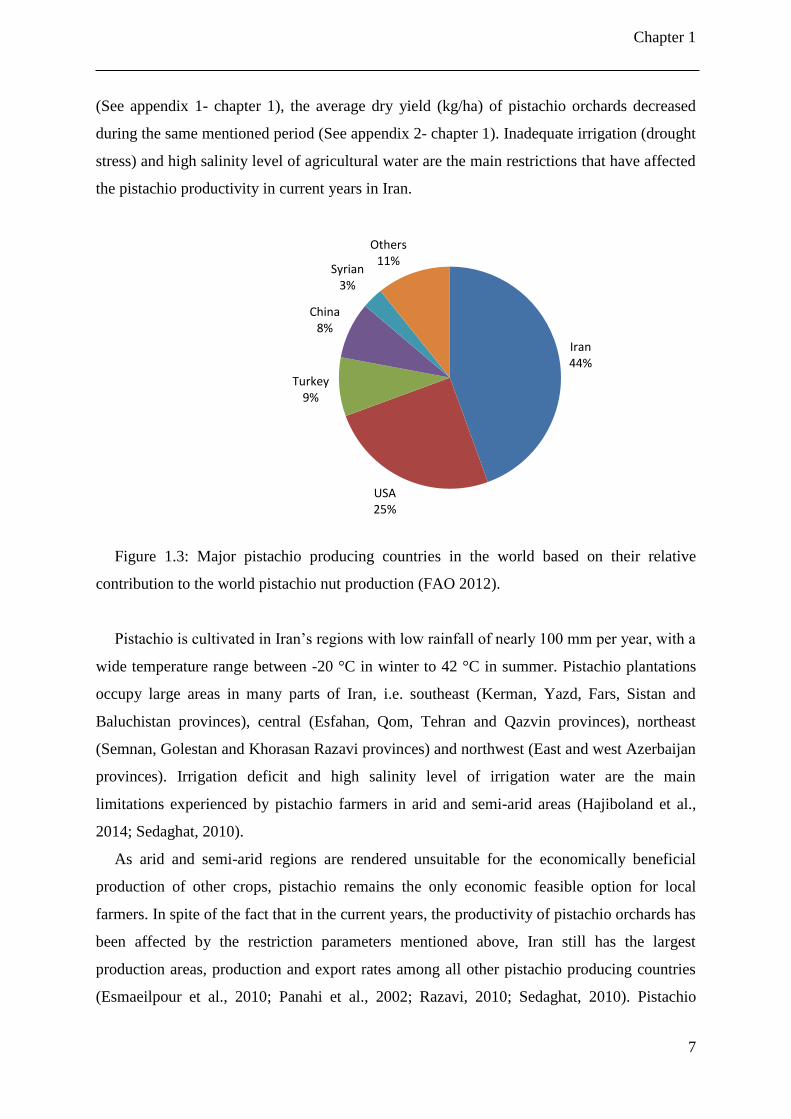
Figure 1.3: Major pistachio producing countries in the world based on their relative
contribution to the world pistachio nut production (FAO 2012). ................................... 7
Figure 1.4: Shares of Iran's exported main crops in 2014 (Anonymous, 2014). ....................... 8
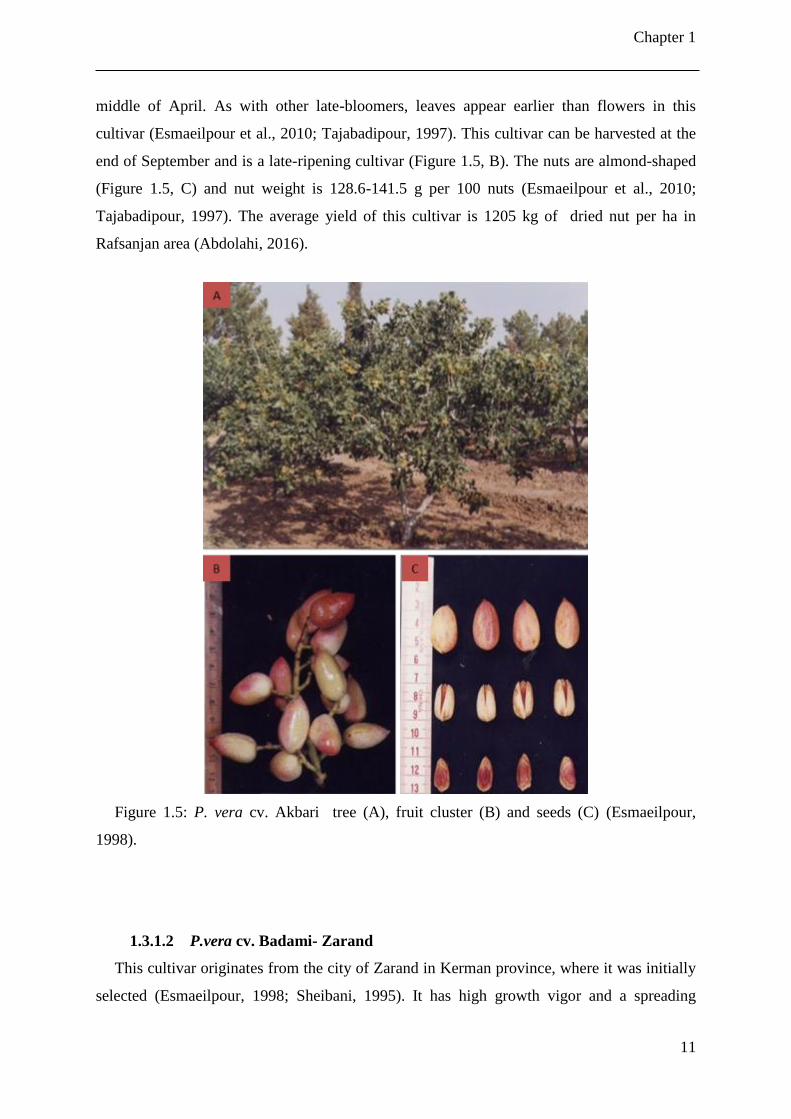
Figure 1.5: P. vera cv. Akbari tree (A), fruit cluster (B) and seeds (C) (Esmaeilpour, 1998).11
Figure 1.6: P. vera cv. Badami-Zarand tree (A), fruit cluster (B) and seeds (C) (Esmaeilpour,
1998). ............................................................................................................................ 12
Figure 1.7: P. vera cv. Kaleghochi tree (A), fruit cluster (B) and seeds (C) (Esmaeilpour,
1998). ............................................................................................................................ 13
Figure 1.8: P. vera cv. Ohadi tree (A), fruit cluster (B) and seeds (C) (Esmaeilpour, 1998). .. 14
Figure 1.9: Natural forest of wild pistachio (P.vera var. Sarakhs) (A) and seeds (B) in Iran
(Esmaeilpour, 1998). ..................................................................................................... 15
Figure 1.10: P. terebinthus tree (A), leaves and fruit cluster (B) and seeds (C). ...................... 16
Figure 2.1: Sequence of a typical fluorescence trace (Maxwell and Johnson, 2000). .............. 33
Figure 2.2: The pressure chamber method for measuring plant leaf water potential. .............. 39
Figure 2.3: The thermocouple psychrometer instrument to measure the water potential of a
plant tissue. ................................................................................................................... 40
Figure 3.1: Seeds of different pistachio rootstocks (A- Pistacia vera cv. Badami; B- P. vera
cv. Sarakhs and C- P. terebinthus) to study the response of pistachio seedlings to
water deficit induced by PEG at varying water potentials in nutrient solution under
glasshouse conditions.................................................................................................... 55
Figure 3.2: Experimental set up to study the response of pistachio rootstock seedlings to
water deficit induced by PEG at varying water potentials in nutrient solution under
glasshouse conditions.................................................................................................... 57
Figure 3.3: Measurement of leaf chlorophyll fluorometer parameters (A and B) of pistachio
seedlings to water deficit induced by PEG at varying water potentials in nutrient
solution under glasshouse conditions............................................................................ 58
Figure 3.4: Grinding of leaf pistachio rootstock seedlings to measure carbon and nitrogen
isotope contents exposed to water deficit induced by PEG at varying water potentials
in nutrient solution under glasshouse conditions. ......................................................... 59
Figure 3.5: Measurement of fresh and dry weights of different parts (A-E) of pistachio
rootstock seedlings to water deficit induced by PEG at varying water potentials in
nutrient solution under glasshouse conditions. ............................................................. 60
Figure 3.6: Biplot analysis of measured parameters and three pistachio rootstocks under
different environmental conditions. Numbers 1 to 4 represent the Badami rootstock
under four osmotic drought stress levels: -0.1 (MPa), -0.5 (MPa), -1.0 (MPa) and -1.5
(MPa), respectively; Numbers 5 to 8 represent the Terebinthus rootstock; while
List of Figures
ii
Numbers 9 to 12 represent the Sarakhs rootstock both under the same four osmotic
drought stress levels. ..................................................................................................... 71
Figure 3.7: Standard deviations (SD) of three pistachio rootstocks (Badami, Terebinthus and
Sarakhs) under four osmotic drought stress levels (-0.1 MPa, -0.5 MPa, -1.0 MPa and
-1.5 MPa) in Biplot analysis. Horizontal and vertical bars indicate SD for PC1 and
PC2 (mean of five replicates ± SD), respectively. Arrows in different colors show the
distance between the control (-0.1 MPa) and the severe drought stress (-1.5 MPa)
treatments in different rootstocks (red- Badami; blue- Terebinthus and blank-
Sarakhs)......................................................................................................................... 72
Figure 4.1: Seeds of different pistachio cultivars (A, Akbari; B, Kaleghochi and C, Ohadi) to
study the response of pistachio seedlings to water deficit induced by PEG at varying
water potentials in nutrient solution under glasshouse conditions................................ 82
Figure 4.2: Experimental setup to study the response of pistachio seedlings to water deficit
induced by PEG at varying water potentials in nutrient solution under glasshouse
conditions. ..................................................................................................................... 83
Figure 4.3: Measurement of leaf water potential (A and B), and gas exchange parameters (C
and D) of pistachio seedlings to water deficit induced by PEG at varying water
potentials in nutrient solution under glasshouse conditions. ........................................ 85
Figure 4.4: Average temperature and relative humidity (means) during the experiment (A),
and at the start of drought and recovery stages (B) and photosynthetic active radiation
(PAR) during the experiment (C) in the glasshouse of faculty of Bioscience
engineering, Ghent, Belgium. ....................................................................................... 86
Figure 4.5: Measurement of chlorophyll contents (A and B), and proline contents (C and D)
of pistachio seedlings to water deficit induced by PEG at varying water potentials in
nutrient solution under glasshouse conditions. ............................................................. 88
Figure 4.6: Measurement of fresh and dry weights (A, B and C) of different parts of pistachio
seedlings to water deficit induced by PEG at varying water potentials in nutrient
solution under glasshouse conditions............................................................................ 89
Figure 4.7: Midday leaf water potential (MPa) of three pistachio cultivars subjected to a 14 d-
period of drought osmotic stress (top) and a 2 week-period of recovery (bottom). Each
value is the mean of six replicates. Different letters indicate significant differences
between treatments by Tukey’s HSD test (P < 0.05). ................................................... 92
Figure 4.8: Changing ratio of Ci/Ca as a function of stomatal conductance for three pistachio
cultivars under increasing drought stress. Each symbol represents a value for every
cultivar as given in Table 4.2; the line represents the following linear relationship: y=
0.13n(x) + 0.85; R2= 0.68; n=27; P < 0.01. .................................................................. 95
Figure 4.9: Changes in plant dry weight in three pistachio cultivars (i.e. Akbari, Kaleghochi
and Ohadi) at control (-0.1 MPa), and different drought stress levels (-0.75 and -1.5
MPa) induced by PEG (n = 9). Within each cultivar, means superscript with unlike
letters are significantly different (P< 0.05). .................................................................. 99
Figure 4.10: Relationship between leaf nitrogen content (%) and Pn for the three pistachio
cultivars exposed to a 14 d-period of osmotic stress (top) and a 2 week-period of
recovery (bottom). Each symbol represents a value for every cultivar as given in
List of Figures
iii
Table 4.2; the line represents the following linear relationship: y= 5.24x; R2= 0.37;
n=27; P < 0.01(Drought stage) and y= 7.42x; R2= 0.51; n=27; P < 0.01(Recovery
stage). .......................................................................................................................... 101
Figure 5.1: Pulverization of pistachio leaves with liquid nitrogen (A and B) and keeping them
at -80 ºC (C). ............................................................................................................... 113
Figure 5.2: Counting of pistachio leaf stomata (A) and measurement of stomatal length and
width (B). .................................................................................................................... 114
Figure 5.3: Packing of ground leaf plant material in tin metal capsule to analyze subsample
for 13
C and 15
N presence by an elemental analyzer. ................................................... 115
Figure 5.4: Changes in RWC, during drought (A) and recovery stage (B), and instantaneous
WUE, in drought (C) and recovery stage (D), of plants exposed to -0.1, -0.75 and -1.5
MPa drought stress levels in three Iranian pistachio cultivars. Data are means of six
replications. For each column, different letters indicate significant differences
(P<0.05), according to Tukey’s range test. ................................................................. 119
Figure 5.5: Relation between leaf stomata number (density) with stomata width (left) and
stomata length (right) in pistachio cultivars exposed to osmotic drought stress. Each
symbol represents a mean value for every cultivar as given in Table 5.2; the line
represents the following linear relationship: y= -0.01x + 20.93; R2=0.22; n=27; P <
0.01(Stomata width) and y= -0.01x + 29.35; R2= 0.02; n=27; P ˃ 0.05 (Stomata
length). ........................................................................................................................ 121
Figure 5.6: Relation between soluble sugars (g/100 fresh weight) and intrinsic water use
efficiency (WUE, µ mol CO2 mol -1
H2O) in pistachio cultivars exposed to osmotic
drought stress. Each symbol represents a value for every cultivar as shown in
Table 5.4; the line represents the following linear relationship: y= 18.57x+49.77 ;
R2=0.11; n=27; P < 0.03. ............................................................................................ 124
Figure 5.7: Biplot analysis of measured parameters and three pistachio cultivars under
different environmental conditions. Numbers 1 to 3 represent the Akbari cultivar
under three osmotic drought stress levels: -1.5 (MPa), -0.75 (MPa) and-0.1 (MPa),
respectively; Numbers 4 to 6 represent the Kaleghochi cultivar; while Numbers 7 to 9
represent the Ohadi cultivar both under the same three osmotic drought stress levels.127
Figure 5.8: Standard deviations (SD) of three pistachio cultivars (Akbari, Kaleghochi and
Ohadi) under three osmotic drought stress levels (-1.5 MPa, -0.75 MPa and -0.1 MPa)
in Biplot analysis. Horizontal and vertical bars indicate SD for PC1 and PC2 (mean of
nine replicates ± SD), respectively. Arrows in different colors show the distance
between the control (-0.1 MPa) and the severe drought stress (-1.5 MPa) treatments in
different cultivars (red- Akbari; blue- Kaleghochi and blank- Ohadi). ...................... 128

List of Tables
i
List of Tables
Table 3.1: Multivariate analysis of variance (MANOVA) for all measured parameters under
different environmental conditions in three pistachio rootstocks. ................................ 61
Table 3.2: Changes in chlorophyll fluorescence parameters (Fv/Fm, YII, NPQ, qP) in three
pistachio rootstocks (R) during a period of osmotic drought stress (T, MPa) and
subsequent recovery. Values are means ± SE of five replicates. .................................. 64
Table 3.3: Effects of osmotic stress treatments (T, MPa) on plant fresh weight (PFW, g),
plant dry weight (PDW, g), shoot dry weight (SDW, g), leaf dry weight (LDW, g),
root dry weight (RDW, g), root/shoot dry weight (R/S ratio), leaf area (LA, cm2),
stem elongation (SEL, cm) and shedding (Shed, g) after two weeks of recovery for
three pistachio rootstocks (R). Values are means ± SE of five replicates. ................... 65
Table 3.4: Mean values and ANOVA results of potassium (K, %), calcium (Ca, %),
magnesium (Mg, %), iron (Fe, ppm), zinc (Zn, ppm) and δ13c (‰) for osmotic stress
treatments (T, MPa) in three pistachio rootstocks (R). Values are means ± SE of five
replicates. ...................................................................................................................... 67
Table 3.5: Correlation coefficient analysis results of Fv/Fm, YII, NPQ, qP, PDW, P, K, Ca,
Mg, Fe, Zn and δ13
c in three pistachio rootstocks under drought stress conditions.
Asterisks indicate significant correlation between two variables (* P <0.05 or ** P<
0.0 1). ............................................................................................................................ 68
Table 3.6: Principle component analysis of measured parameters under different
environmental conditions in three pistachio rootstocks. ............................................... 70
Table 3.7: Adequate and critical levels of nutrient elements in pistachio (P. vera) leave
(Ferguson et al, 2005). .................................................................................................. 76
Table 4.1: Multivariate analysis of variance (MANOVA) for all measured parameters under
different environmental conditions in three pistachio cultivars. ................................... 90
Table 4.2: Gas exchange parameters in three pistachio cultivars (C) after a 14 d-period of
osmotic stress (T, MPa) and a 2 week-period of recovery. Values of Pn (µmol m-2
s-1
),
gs (mol H2O m-2
s-1
), Ci (μmol CO2 mol -1
), E (mmol (H2O) m-2
s-1
) and WUE (Pn /gs).
Values are means ± SE of five replicates. ..................................................................... 94
Table 4.3: Changes in chlorophyll fluorescence parameters in three pistachio cultivars (C)
after a 14 d-period of osmotic stress (T, MPa) and a 2 week-period of recovery.
Values are means ± SE of nine replicates. .................................................................... 96
Table 4.4: Mean values and ANOVA results of Chl a (µg/g FW), Chl b (µg/g FW), Car (µg/g
FW) and proline (µmol g-1
FW) in different osmotic stress treatments after a 14 d-
period of osmotic stress (T, MPa) and a 2 week-period of recovery for pistachio
cultivars (C). Values are means ± SE of nine replicates. .............................................. 97
Table 4.5: Effects of a 14 d-period of osmotic stress (T, MPa) followed by a 2-week recovery
period on plant fresh weight (PFW, g), leaf dry weight (LDW, g), root dry weight
(RDW, g), root/shoot ratio (RDW/SDW), stem elongation (SEL, cm) and leaf
nitrogen (N, % DW) of pistachio cultivars (C). Values are mean ± SE of nine
replicates for plant growth parameters and three replicates for nitrogen content. ...... 100
List of Tables
ii
Table 4.6: Overall correlation coefficient analysis of Pn, gs, Ci, E, Fv/Fm, Chl a, SEL and N
after a 14 d-period of osmotic stress (T, MPa) and after a 2 week-period of recovery
for pistachio cultivars. ................................................................................................. 102
Table 5.1: Mean values of glucose, fructose, sucrose and starch (g/100 fresh weight) at
different drought stress levels, in both the drought and recovery stages for three
pistachio cultivars. Abbreviations are treatment (T), cultivar (C). Values are means ±
SE of nine replicates. .................................................................................................. 118
Table 5.2: Mean values of stomatal length (SL, µm), stomatal width (SW, µm) and stomatal
density (SD) in different drought stress treatments (T) for three pistachio cultivars (C)
i.e. Akbari, Kaleghochi and Ohadi. Values are means ± SE of nine replicates. ......... 120
Table 5.3: Mean values of intrinsic and instantaneous (inst.) water use efficiency (WUE,
µmol CO2 mol -1
H2O), carbon isotope composition (δ13C, ‰) and nitrogen isotope
composition (δ15N, ‰) in different osmotic drought stress levels (T, MPa) and three
pistachio cultivar seedlings after two weeks osmotic stress. Values are means ± SE of
nine replicates for both WUE and three for δ13C and δ
15N. ........................................ 123
Table 5.4: Overall correlation coefficients of intrinsic and instantaneous water use efficiency
(WUE, µmol CO2 mol -1
H2O), carbon isotope composition (δ13C, ‰) and nitrogen
isotope composition (δ15N, ‰), biomass (g), Pn (µmol m
-2s
-1) and soluble sugars in
three pistachio cultivar seedlings in different osmotic drought stress levels (T, MPa)
after two weeks osmotic stress. ................................................................................... 123
Table 5.5; Principle component analysis of measured parameters under different
environmental conditions in three pistachio cultivars. ............................................... 126
Table 6.1: Overview of the changes of all measured parameters under severe drought stress
treatment (-1.5 MPa) compared to corresponding control (-0.1 MPa) plants of the
drought intermediate, tolerant and susceptible pistachio rootstocks under drought
stress conditions. Parameters that do not have unit, indicated by minus sign (-).
Significant decrease, significant increase and non- significant changes are shown with
down arrow ( ), up arrow ( ) and n.s., respectively. ............................................. 137
Table 6.2: Overview of the changes of all measured parameters under severe drought stress
treatment (-1.5 MPa) compared to corresponding control (-0.1 MPa) plants of the
drought susceptible, intermediate and tolerant pistachio cultivars under drought stress
conditions... Parameters that do not have unit, indicated by minus sign (-). Significant
decrease, significant increase and non- significant changes are shown with down
arrow ( ), up arrow ( ) and n.s., respectively. ...................................................... 139
List of abbreviations
1
List of abbreviations
ATP- adenosine triphosphate
ABA- abscisic acid
ANOVA- analysis of variance
AK- Akbari
Ca- ambient CO2
Ca- calcium
Car- carotenoid
CAT– catalase
Chl fluorescence- chlorophyll fluorescence
Chl a- chlorophyll a
Chl a+b- total chlorophyll
Chl b- chlorophyll b
Ci- intercellular CO2
C isotope- carbon isotope composition
D- diameter
Dr. - drought stage
E- transpiration rate
ETR- electron transport rate
Fe- iron
Fm- maximum fluorescence yield
Fv- variable fluorescence
Fv/Fm - maximum quantum yield of PSII
Fʹm - maximum fluorescence in ambient light
Ft- steady fluorescence in ambient light
GB- glycine betaine
GPX- glutathione peroxidase
GR- glutathione reductase
gs- stomatal conductance
GSH- reduced glutathione
H- height
H2O2- hydrogen peroxide
List of abbreviations
2
HO•- hydroxyl radical
K- potassium
KA- Kaleghochi
LA- leaf area
LDW- leaf dry weight
LI- light intensity
Mg- magnesium
N- nitrogen
NPQ- non-photochemical quenching of chlorophyll fluorescence
O2 - singlet oxygen
O2•- - superoxide radical
OA- osmotic adjustment
OH- Ohadi
P- phosphorous
PAR- photosynthetic active radiation photosystem I
PAM- Pulse-Amplitude-Modulated
PDW - plant dry weight, biomass
PEG- polyethylene Glycol
PFW- plant fresh weight
Pn- net photosynthesis
PSII- photosystem II
QP- photochemical quenching of chlorophyll fluorescence
Re.- recovery stage
R/S- root /shoot ratio
RDW- root dry weight
RH- relative humidity
ROS- reactive oxygen species
RWC- relative water content
SA- salicylic acid
SDW- shoots dry weight
SE- standard error
SEL- stems elongation
SD- standard deviation
List of abbreviations
3
Si- silicon
SL- stomata length
SN- stomatal number
ST- starch
SW- stomata width
T- temperature
Tl- temperature of leaf thermocouple
VPDl- vapour pressure deficit based on leaf temperature
WUE- water use efficiency
Zn - zinc
YII- effective quantum yield of PSII electron transport
Ψl- leaf osmotic potential
Ψs- osmotic potential of nutrition solution
Ψw- leaf water potential
∆13
C- carbone isotope discrimination
∆15
N- nitrogen isotope discrimination
δ13
C- carbon isotope composition
δ15
N- nitrogen isotope composition

List of publications
1
List of Publications
A1/ ISI publications (published)
1. Esmaeilpour, Ali; Van Labeke, Marie-Christine; Samson, Roeland; Van
Damme, Patrick. 2015. Osmotic stress affects physiological responses and growth
characteristics of three pistachio cultivars. Acta Physiologiae Plantarum 37(6):1-14.
2. Esmaeilpour, Ali; Van Labeke, Marie-Christine; Samson, Roeland; P. Boeckx;
Van Damme, Patrick. 2016. Variation in biochemical characteristics, water status,
stomata features, leaf carbon isotope composition and its relationship to water use
efficiency in pistachio (Pistacia vera L.) cultivars under drought stress condition.
Scientia Horticulturae 211:158-166.
Papers in A2 journals (published):
1. Esmailpour, Ali; Van Labeke, Marie-Christine; Samson, Roeland; S.
Ghafaripour; Van Damme, Patrick. 2015. Comparison of biomass production-based
drought tolerance indices of pistachio (Pistacia vera L.) seedlings in drought stress.
International Journal of Agronomy and Agricultural Research. Vol. 7, No. 2, p. 36-
44.
Presentations or posters at international conferences
1. Esmaeilpour, A. and P. Van Damme. 2014. Evaluation of Seed Soaking Times
on Germination Percentage, Germination Rate and Growth Characteristics of
Pistachio Seedlings. The 29th
international horticultural congress (IHC2014).
Brisbane, Australia.
2. Esmaeilpour, A., M. C. Van Labeke, R. Samson and P. Van Damme. 2014.
Variation of Relative Water Content, Water Use Efficiency and Stomatal Density
during Drought Stress and Subsequent Recovery in Pistachio Cultivars (Pistacia vera
L.). The 29th
international horticultural congress (IHC2014). Brisbane, Australia.
3. Esmaeilpour, A., M. C. Van Labeke, R. Samson and P. Van Damme. 2014.
Chlorophyll fluorescence as a tool for evaluation of drought stress tolerance in Iranian

List of publications
2
pistachio cultivars. International conference on research on food security, natural
resource management and rural development (Tropendag 2014). September 17-19,
2014. Prague, Czech Republic.
4. Esmaeilpour, A., M.C. Van Labeke, P. Boeckx and P. Van Damme. 2015.
Impact of osmotic drought stress on carbon isotope discrimination and growth
parameters in three pistachio rootstocks. XVI GREMPA Meeting on Almonds and
Pistachios. May 12-14, 2015. Meknes, Morocco.
Chapter 1
3
A review of global pistachio production Chapter 1.
A review of global pistachio production
4
1.1 Introduction
Iran, officially the Islamic Republic of Iran, is a country in West Asia. It is located
between latitudes 25º 40' N and 39º 45' and longitudes 44º 15' and 62º 40' E. Iran shares its
northwestern borders with Armenia and Azerbaijan. Across the Caspian Sea lie its other
neighboring countries of Kazakhstan and Russia. To the northeast, it is bordered by
Turkmenistan; to the east by Afghanistan and Pakistan; to the south by the Persian Gulf and
the Gulf of Oman; and finally to the west by Turkey and Iraq. Comprising a total land area of
1,648,195 km2, it is the second-largest nation in the ‘Middle East’ and the 18th-largest
country in the world. Its total population is estimated to be around 78.3 million; consisting of
various tribes, including Pars (the majority), Turk, Lur, Kurd, Baluch and Arab (the
minority). Iran ranks as 17th
on the list of most-populous nations (Statistical center of Iran,
2014). Iran has vast amounts of fuel resources, such as petroleum, natural gas and coal. Other
mineral resources include chromium, copper, iron ore, lead, manganese, sulfur and zinc. Iran
is prone to and has in the past suffered from some (minor) natural disasters, which include
periodic droughts, floods, dust storms, sandstorms and earthquakes.
Iran's climate ranges from arid or semi-arid in most of the country to subtropical along the
Caspian coast and the northern forests. On the northern edge of the country (the Caspian
coastal plain), temperatures rarely fall below freezing point and the area remains humid for
the largest part of the year, while temperatures in summer rarely exceed 29 °C.
In Iran, rainfall is seasonal and mainly concentrated in winter; starting from late autumn
and continuing throughout winter to end in early spring. For summer crops, irrigation is
required in the whole country (Fardooei, 2001). Mean annual precipitation is 680 mm in the
northern (humid) areas of the country, while the arid and semi-arid regions of the country
(Figure 1.1) receive an average precipitation of less than 240 mm per year. Toward the east
and center of Iran, precipitation decreases to 100 mm or less per year (Kousari and Ahani,
2012). Desert regions have evaporation that exceeds precipitation during most of the year.
The vegetative cover is low and plant stands are sparse. Xerophytic plants such as some
species of cacti, euphorbias, pine and etc. are the dominant plants in the Iranian deserts
(Fardooei, 2001).
Chapter 1
5
Figure 1.1: Climatology map of Iran (Peel et al., 2013).
As mentioned before, there are various climates in Iran and each climate is suitable for
specific crops. Arid and semi-arid climates cover approximately 80 percent (Figure 1.1) of
the country’s areas (Cheraghi, 2004; Fardooei, 2001; Kousari and Ahani, 2012). Water
deficiency and salinity are the two most common factors that limit quality and quantity of
crop production in latter areas (Abbaspour et al., 2012a; Banakar and Ranjbar, 2010;
Fardooei, 2001; Hajiboland et al., 2014; Rouhi, 2007). These two factors also have a
determining role in the distribution and diversity of crop plants (Abrishami, 1995). Therefore,
agricultural activities are concentrated around the crops that are compatible with these
specific regional conditions.
Wheat (Triticum aestivum), barley (Hordeum vulgare), alfalfa (Medicago sativa), cotton
(Gossypium hirsutum), sugar beet (Beta vulgaris), saffron (Crocus sativus), turnip (Brassica
rapa), sunflower (Helianthus annuus), melon (Cucumis melo) and watermelon (Citrullus
lanatus) are the most important crops produced in arid and semi-arid regions. Fruit crops in
these regions are pistachio (Pistacia spp.), date (Phoenix dactylifera), citrus (citrus spp.), fig
(Ficus carica), pomegranate (Punica granatum), almond (Prunus dulcis), apple (Malus
domestica), olive (Olea europaea) and mulberry (Morus alba). The most important crop in
these areas is pistachio (Figure 1.2), which plays an important role in the country’s economy,
A review of global pistachio production
6
as it is called ‘the green gold of the desert’ (Abrishami, 1995; Esmaeilpour et al., 2010;
Panahi et al., 2002).
Figure 1.2: Pistachio (Pistacia vera) production areas in Iran (Source: Iran Pistachio Aria
Co. Ltd).
1.2 Importance of pistachio
The name pistachio comes from a very old Iranian term (usually pronounced as Pesteh in
Farsi). The origin of the word is associated with the first area pistachio trees were
domesticated. The term has been derived from the dialect of the people who lived in
Khorasan in northeast of Iran in that time (Abrishami, 1995). The name of the pistachio in
most world languages is therefore derived from the Persian word (Pesteh) (Abrishami, 1995;
Sheibani, 1995).
The most important pistachio producing countries in the world are: Iran, the US, Turkey,
China and Syria (Figure 1.3). Iran is the world’s largest pistachio producer and exporter. It is
an important horticultural crop in Iran, as pistachio orchards (bearing and non-bearing trees)
cover more than 450,000 ha of the country, yielding an annual production of about 255,000
tons, from some 60 different varieties (Anonymous, 2014; Banakar and Ranjbar, 2010;
Bastam et al., 2013; Esmaeilpour and Khezri, 2006; Nooghi and Mozafari, 2012; Sheibani,
1995). Although the areas planted for pistachio increased significantly during 2000–2012
Chapter 1
7
(See appendix 1- chapter 1), the average dry yield (kg/ha) of pistachio orchards decreased
during the same mentioned period (See appendix 2- chapter 1). Inadequate irrigation (drought
stress) and high salinity level of agricultural water are the main restrictions that have affected
the pistachio productivity in current years in Iran.
Figure 1.3: Major pistachio producing countries in the world based on their relative
contribution to the world pistachio nut production (FAO 2012).
Pistachio is cultivated in Iran’s regions with low rainfall of nearly 100 mm per year, with a
wide temperature range between -20 °C in winter to 42 °C in summer. Pistachio plantations
occupy large areas in many parts of Iran, i.e. southeast (Kerman, Yazd, Fars, Sistan and
Baluchistan provinces), central (Esfahan, Qom, Tehran and Qazvin provinces), northeast
(Semnan, Golestan and Khorasan Razavi provinces) and northwest (East and west Azerbaijan
provinces). Irrigation deficit and high salinity level of irrigation water are the main
limitations experienced by pistachio farmers in arid and semi-arid areas (Hajiboland et al.,
2014; Sedaghat, 2010).
As arid and semi-arid regions are rendered unsuitable for the economically beneficial
production of other crops, pistachio remains the only economic feasible option for local
farmers. In spite of the fact that in the current years, the productivity of pistachio orchards has
been affected by the restriction parameters mentioned above, Iran still has the largest
production areas, production and export rates among all other pistachio producing countries
(Esmaeilpour et al., 2010; Panahi et al., 2002; Razavi, 2010; Sedaghat, 2010). Pistachio
Iran 44%
USA 25%
Turkey 9%
China 8%
Syrian 3%
Others 11%
A review of global pistachio production
8
production has the second position in Iran’s economy in terms of exported values after
petroleum, which is not a renewable resource. Economy experts in Iran want to increase the
economic stability by increasing non-oil exports to other countries. In this respect, there are a
number of alternatives to oil and one of the strongest is the improvement of pistachio’s role in
the country’s economy (Abrishami, 1995; Esmaeilpour et al., 2010; Sedaghat, 2010).
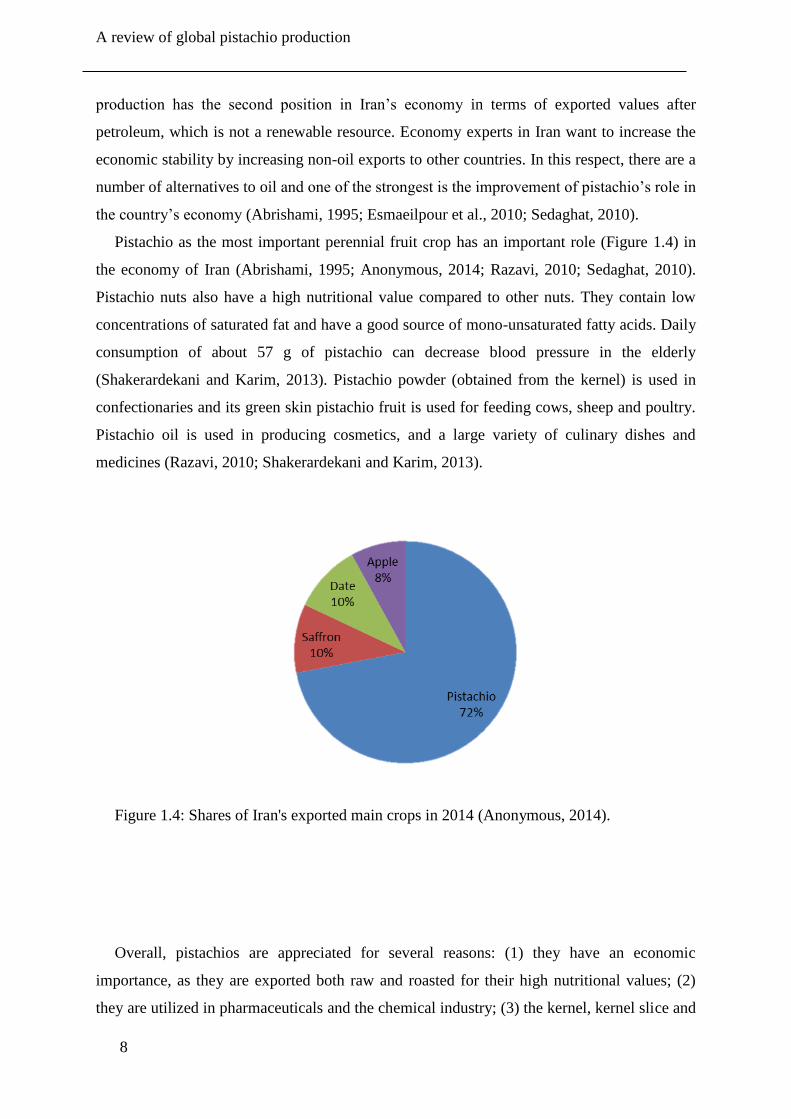
Pistachio as the most important perennial fruit crop has an important role (Figure 1.4) in
the economy of Iran (Abrishami, 1995; Anonymous, 2014; Razavi, 2010; Sedaghat, 2010).
Pistachio nuts also have a high nutritional value compared to other nuts. They contain low
concentrations of saturated fat and have a good source of mono-unsaturated fatty acids. Daily
consumption of about 57 g of pistachio can decrease blood pressure in the elderly
(Shakerardekani and Karim, 2013). Pistachio powder (obtained from the kernel) is used in
confectionaries and its green skin pistachio fruit is used for feeding cows, sheep and poultry.
Pistachio oil is used in producing cosmetics, and a large variety of culinary dishes and
medicines (Razavi, 2010; Shakerardekani and Karim, 2013).
Figure 1.4: Shares of Iran's exported main crops in 2014 (Anonymous, 2014).
Overall, pistachios are appreciated for several reasons: (1) they have an economic
importance, as they are exported both raw and roasted for their high nutritional values; (2)
they are utilized in pharmaceuticals and the chemical industry; (3) the kernel, kernel slice and
Chapter 1
9
powder are used in the confectionary industry, delicacies such as ‘halva’, butter and milk are
produced from its kernel; (4) they are a huge natural (forest) genetic resource for
conservation; and finally (5) trees provide soil stabilization for soil erosion control.
1.3 Pistachio taxonomy
The genus Pistacia is a member of the Anacardiaceae, or cashew family. Other important
members of this family include cashew (Anacardium occidentale), mango (Mangifera spp.),
poison oak (Toxicodendron vernicifluum), and sumac (Rhus coriaria). Pistacia L. is mainly a
subtropical genus and it consists of 11 species of dioecious trees and shrubs. All are
characterized by pinnate leaves and single-seeded drupes (Zohary, 1996; Zohary, 1952). The
term ’dioecious’ refers to the fact that there are separate male and female trees and
pollination is by wind (Esmaeilpour, 1998; Tajabadipour, 1997).
The most important species used as rootstock are Pistacia vera L., P. atlantica Desf., P.
integerrima Rech.F, P. terebinthus L., P. mutica (Fisher), P. khinjuk Stock, P. palestina
Boiss, P. chinensis, P. lentiscus L., P. mexicana HBK and P. texana Swingle (Zohary, 1952).
The latter author performed the first complete taxonomic classification of the pistachio genus.
However, today, Zohary’s taxonomy is highly questionable regarding the status of many
Pistacia spp., and the accuracy of dividing the genus into four sections. In the present study,
we have used the classification of Al-Saghir and Porter (2012) which has divided the Pistacia
genus in two sections (Pistacia and Lentiscella), nine species and five subspecies. P. vera L.
is the only cultivated and commercially grown species in the genus (Zohary, 1996). Some of
the other species are used as ornamentals and others as non-economic fruit trees. The first
nine species are native to ‘the old world’; two occur in southern USA and Mexico.
Geographically, the largest concentration of Pistacia species is found in West Asia and the
Mediterranean basin. Zohary (1996) performed the full-scale taxonomic treatment of
Pistacia, using as the main diagnostic traits leaf characteristics and fruit morphology.
The genus Pistacia consists of xerophyte species (Belhadj et al., 2011). Iran is one of its
origin and diversity centers in the world (Arzani et al., 2013; Esmaeilpour, 1998; Panahi et
al., 2002; Pazouki et al., 2010; Sheibani, 1995). In addition to the cultivated species (P. vera
L.), Iran is also home to three wild species of pistachio i.e. P. vera, P. khinjuk and P.
atlantica. The latter has three subspecies (mutica, kurdica and cabolica) (Khatamsaz, 1988).
The characteristics of the pistachio species and cultivars that were used in our experiments
are described in the following paragraphs.
A review of global pistachio production
10
1.3.1 Pistacia vera L.
The origin of Pistacia vera L. (pistachio) can be traced back to the Middle East and central
Asia. It is one of the most important tree species grown in the Mediterranean climate areas of
Iran, Syria, Lebanon, Turkey, Tunisia and Egypt (Zohary, 1996). The area of origin of
domesticated P. vera is Khorasan Razavi province located in northeast Iran (Abrishami,
1995; Sheibani, 1995). All domestic pistachios (cultivars) and wild Sarakh (native) belong to
this species (Esmaeilpour, 1998; Sheibani, 1995). Fruits of this species are large, edible and
have great economic value. This species is generally grown as a tree (Panahi et al., 2002;
Sheibani, 1995), with a height of between 3 to 5 m. The tree crown, especially in female
plants spread. Leaves are compound and odd-pinnate. There are one or two pairs of leaflets
and odd leaflets on the tip of the leaves, which are generally larger than the other leaflets. The
leaves without stipules are dark green, the upper side is bright and the bottom dull-colored.
The shape of the leaflets of the female trees is elliptic, whereas in male trees its shape is
closer to ovate (Tajabadipour, 1997).
The inflorescence of P. vera is a panicle, staminate and pistillate flowers do not have
petals. Staminate clusters have 200-300 flowers and pistillate clusters have 80-130 flowers
(Esmaeilpour et al., 2010; Panahi et al., 2002). The fruits are drupes of 10-23 mm long and 6-
12 mm wide (Tajabadipour, 1997). Male flowers of this species open earlier than female
flowers (protandry), in early to mid-April in Iran (Esmaeilpour et al., 2010). The shape of the
fruits varies from long elliptic to round (Tajabadipour, 1997). In Iran, the Badami variety is
mostly used as rootstock, although in some areas, Ghazvini and Sarakhs are used as well
(Esmaeilpour, 1998; Panahi, 2009). The chromosome number is 2n =30 in this species (Basr
Ila et al., 2003; Harandi and Ghaffari, 2001).
1.3.1.1 P.vera cv. Akbari
This variety is a high-vigor cultivar (Figure 1.5, A); nuts are long, elongated and large.
The main characteristics of cultivar Akbari are: sparse clusters, high productivity, uniformity
of fruit ripening, high vegetative growth, and large and numerous leaves (Esmaeilpour, 1998;
Tajabadipour, 1997). Due to its high vegetative growth, this cultivar is suitable for regions
with intense sunlight and hot summer temperatures in order to decline the effects of sunburn
damages of pistachio fruits, stems and trunks (Esmaeilpour et al., 2010). Almost all its leaves
are composed of three and five leaflets, whereas the cultivar also has single and 4-leaflet
leaves (Tajabadipour, 1997). It is late-blooming; experiencing its blooming period in the
Chapter 1
11
middle of April. As with other late-bloomers, leaves appear earlier than flowers in this
cultivar (Esmaeilpour et al., 2010; Tajabadipour, 1997). This cultivar can be harvested at the
end of September and is a late-ripening cultivar (Figure 1.5, B). The nuts are almond-shaped
(Figure 1.5, C) and nut weight is 128.6-141.5 g per 100 nuts (Esmaeilpour et al., 2010;
Tajabadipour, 1997). The average yield of this cultivar is 1205 kg of dried nut per ha in
Rafsanjan area (Abdolahi, 2016).
Figure 1.5: P. vera cv. Akbari tree (A), fruit cluster (B) and seeds (C) (Esmaeilpour,
1998).
1.3.1.2 P.vera cv. Badami- Zarand
This cultivar originates from the city of Zarand in Kerman province, where it was initially
selected (Esmaeilpour, 1998; Sheibani, 1995). It has high growth vigor and a spreading
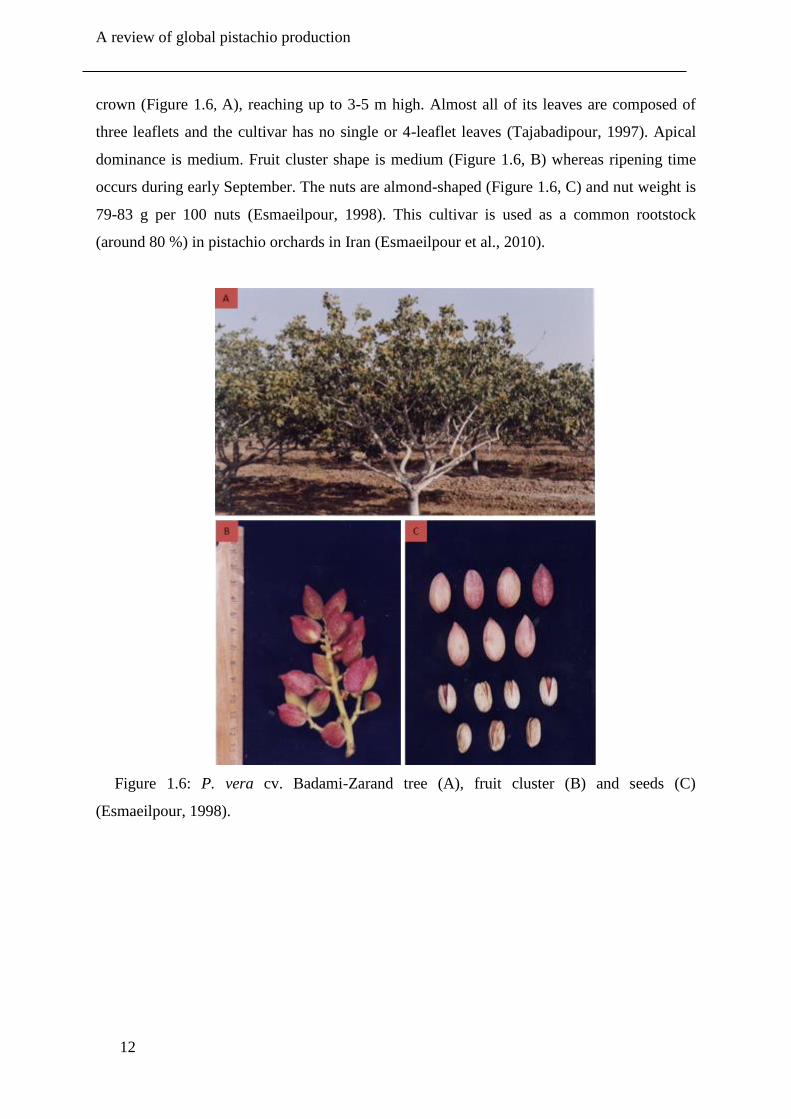
A review of global pistachio production
12
crown (Figure 1.6, A), reaching up to 3-5 m high. Almost all of its leaves are composed of
three leaflets and the cultivar has no single or 4-leaflet leaves (Tajabadipour, 1997). Apical
dominance is medium. Fruit cluster shape is medium (Figure 1.6, B) whereas ripening time
occurs during early September. The nuts are almond-shaped (Figure 1.6, C) and nut weight is
79-83 g per 100 nuts (Esmaeilpour, 1998). This cultivar is used as a common rootstock
(around 80 %) in pistachio orchards in Iran (Esmaeilpour et al., 2010).
Figure 1.6: P. vera cv. Badami-Zarand tree (A), fruit cluster (B) and seeds (C)
(Esmaeilpour, 1998).
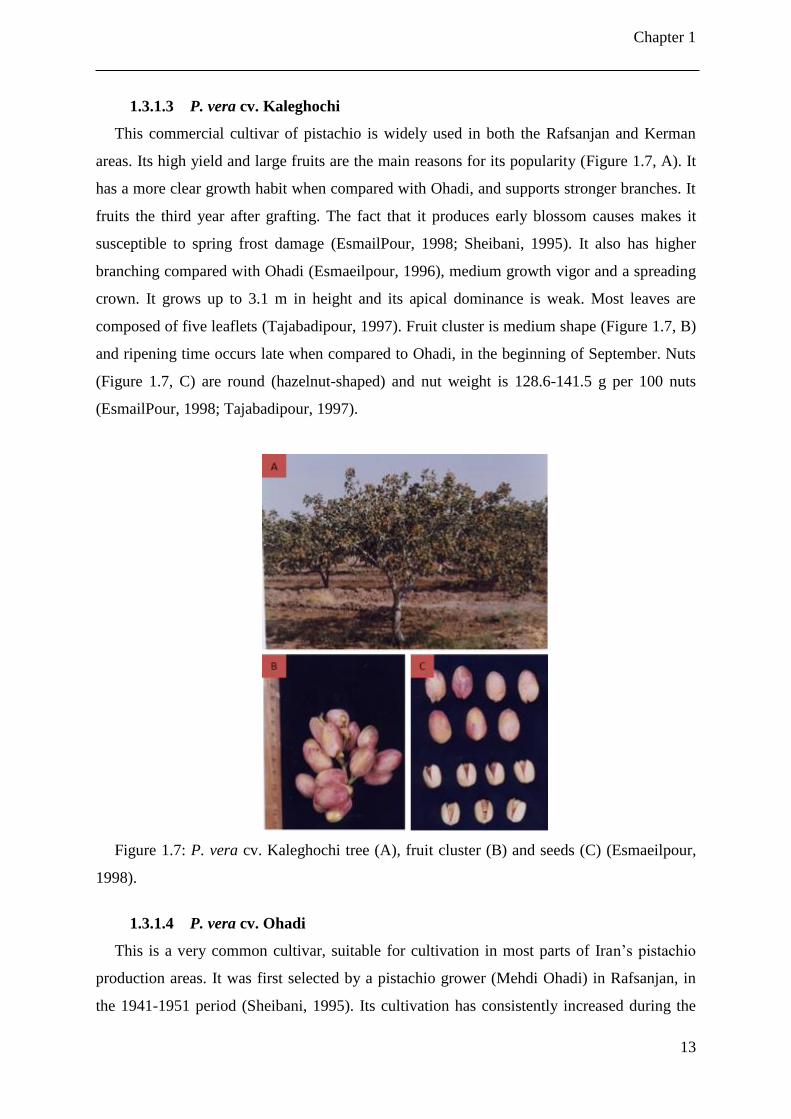
Chapter 1
13
1.3.1.3 P. vera cv. Kaleghochi
This commercial cultivar of pistachio is widely used in both the Rafsanjan and Kerman
areas. Its high yield and large fruits are the main reasons for its popularity (Figure 1.7, A). It
has a more clear growth habit when compared with Ohadi, and supports stronger branches. It
fruits the third year after grafting. The fact that it produces early blossom causes makes it
susceptible to spring frost damage (EsmailPour, 1998; Sheibani, 1995). It also has higher
branching compared with Ohadi (Esmaeilpour, 1996), medium growth vigor and a spreading
crown. It grows up to 3.1 m in height and its apical dominance is weak. Most leaves are
composed of five leaflets (Tajabadipour, 1997). Fruit cluster is medium shape (Figure 1.7, B)
and ripening time occurs late when compared to Ohadi, in the beginning of September. Nuts
(Figure 1.7, C) are round (hazelnut-shaped) and nut weight is 128.6-141.5 g per 100 nuts
(EsmailPour, 1998; Tajabadipour, 1997).
Figure 1.7: P. vera cv. Kaleghochi tree (A), fruit cluster (B) and seeds (C) (Esmaeilpour,
1998).
1.3.1.4 P. vera cv. Ohadi
This is a very common cultivar, suitable for cultivation in most parts of Iran’s pistachio
production areas. It was first selected by a pistachio grower (Mehdi Ohadi) in Rafsanjan, in
the 1941-1951 period (Sheibani, 1995). Its cultivation has consistently increased during the
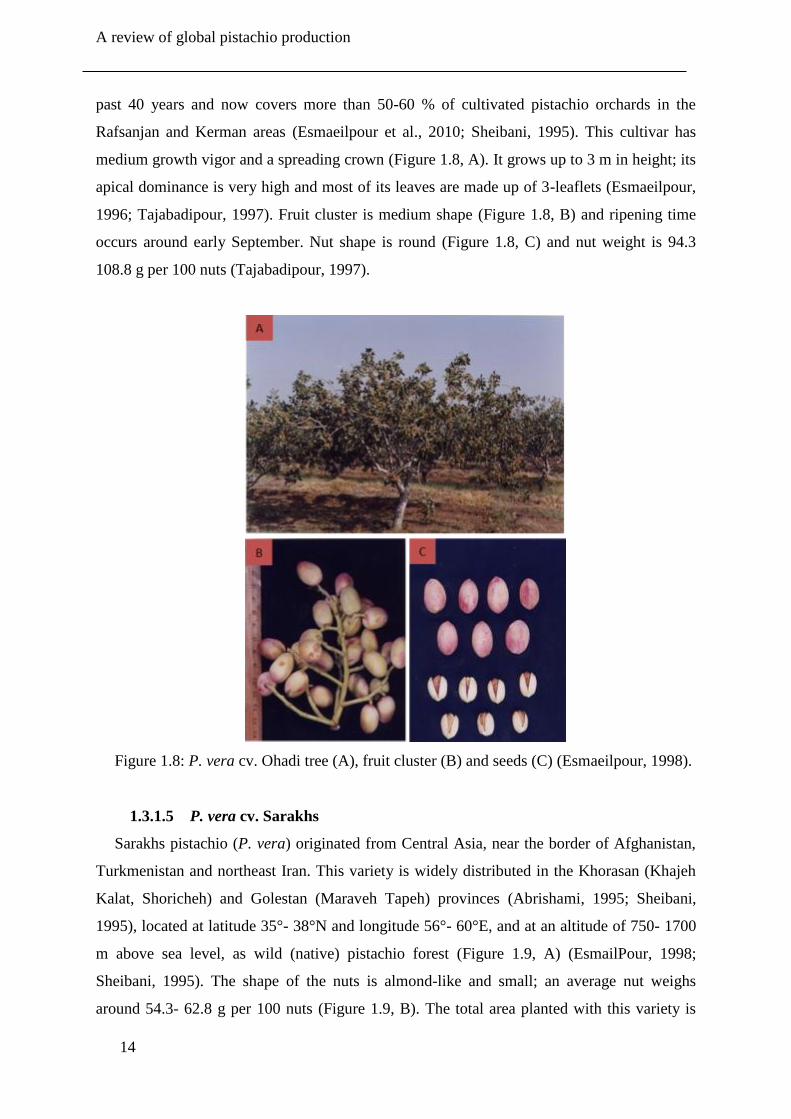
A review of global pistachio production
14
past 40 years and now covers more than 50-60 % of cultivated pistachio orchards in the
Rafsanjan and Kerman areas (Esmaeilpour et al., 2010; Sheibani, 1995). This cultivar has
medium growth vigor and a spreading crown (Figure 1.8, A). It grows up to 3 m in height; its
apical dominance is very high and most of its leaves are made up of 3-leaflets (Esmaeilpour,
1996; Tajabadipour, 1997). Fruit cluster is medium shape (Figure 1.8, B) and ripening time
occurs around early September. Nut shape is round (Figure 1.8, C) and nut weight is 94.3
108.8 g per 100 nuts (Tajabadipour, 1997).
Figure 1.8: P. vera cv. Ohadi tree (A), fruit cluster (B) and seeds (C) (Esmaeilpour, 1998).
1.3.1.5 P. vera cv. Sarakhs
Sarakhs pistachio (P. vera) originated from Central Asia, near the border of Afghanistan,
Turkmenistan and northeast Iran. This variety is widely distributed in the Khorasan (Khajeh
Kalat, Shoricheh) and Golestan (Maraveh Tapeh) provinces (Abrishami, 1995; Sheibani,
1995), located at latitude 35°- 38°N and longitude 56°- 60°E, and at an altitude of 750- 1700
m above sea level, as wild (native) pistachio forest (Figure 1.9, A) (EsmailPour, 1998;
Sheibani, 1995). The shape of the nuts is almond-like and small; an average nut weighs
around 54.3- 62.8 g per 100 nuts (Figure 1.9, B). The total area planted with this variety is
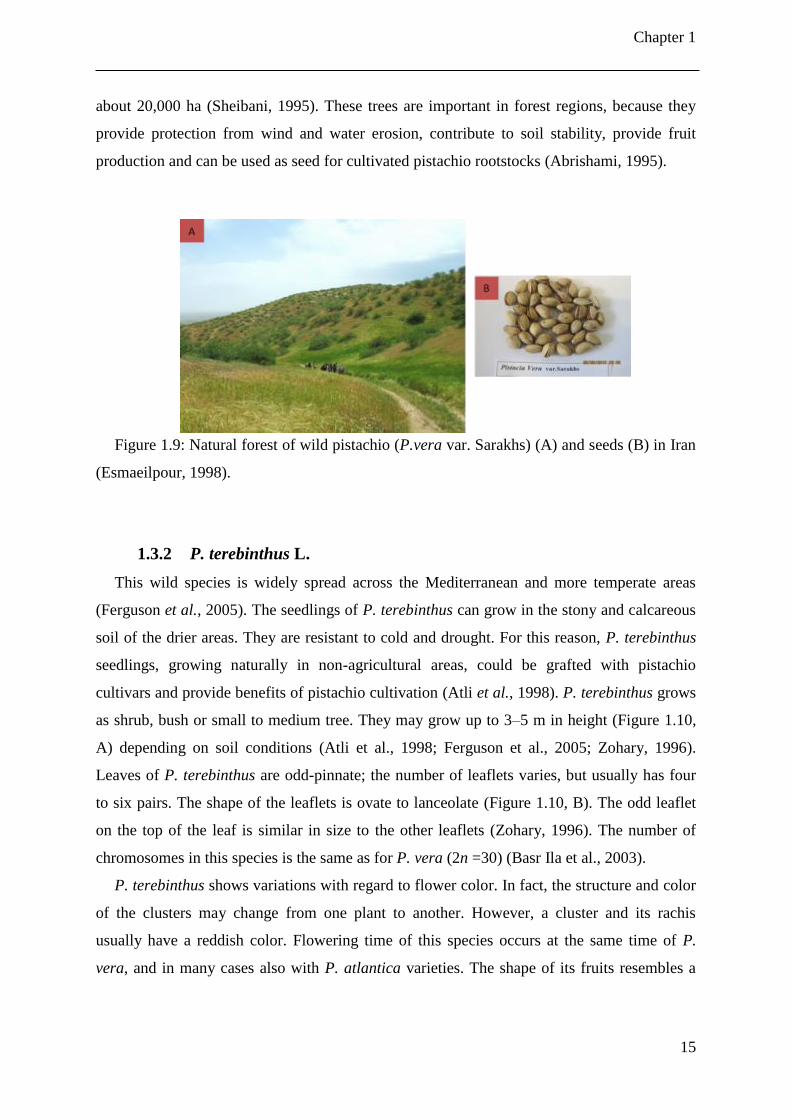
Chapter 1
15
about 20,000 ha (Sheibani, 1995). These trees are important in forest regions, because they
provide protection from wind and water erosion, contribute to soil stability, provide fruit
production and can be used as seed for cultivated pistachio rootstocks (Abrishami, 1995).
Figure 1.9: Natural forest of wild pistachio (P.vera var. Sarakhs) (A) and seeds (B) in Iran
(Esmaeilpour, 1998).
1.3.2 P. terebinthus L.
This wild species is widely spread across the Mediterranean and more temperate areas
(Ferguson et al., 2005). The seedlings of P. terebinthus can grow in the stony and calcareous
soil of the drier areas. They are resistant to cold and drought. For this reason, P. terebinthus
seedlings, growing naturally in non-agricultural areas, could be grafted with pistachio
cultivars and provide benefits of pistachio cultivation (Atli et al., 1998). P. terebinthus grows
as shrub, bush or small to medium tree. They may grow up to 3–5 m in height (Figure 1.10,
A) depending on soil conditions (Atli et al., 1998; Ferguson et al., 2005; Zohary, 1996).
Leaves of P. terebinthus are odd-pinnate; the number of leaflets varies, but usually has four
to six pairs. The shape of the leaflets is ovate to lanceolate (Figure 1.10, B). The odd leaflet
on the top of the leaf is similar in size to the other leaflets (Zohary, 1996). The number of
chromosomes in this species is the same as for P. vera (2n =30) (Basr Ila et al., 2003).
P. terebinthus shows variations with regard to flower color. In fact, the structure and color
of the clusters may change from one plant to another. However, a cluster and its rachis
usually have a reddish color. Flowering time of this species occurs at the same time of P.
vera, and in many cases also with P. atlantica varieties. The shape of its fruits resembles a
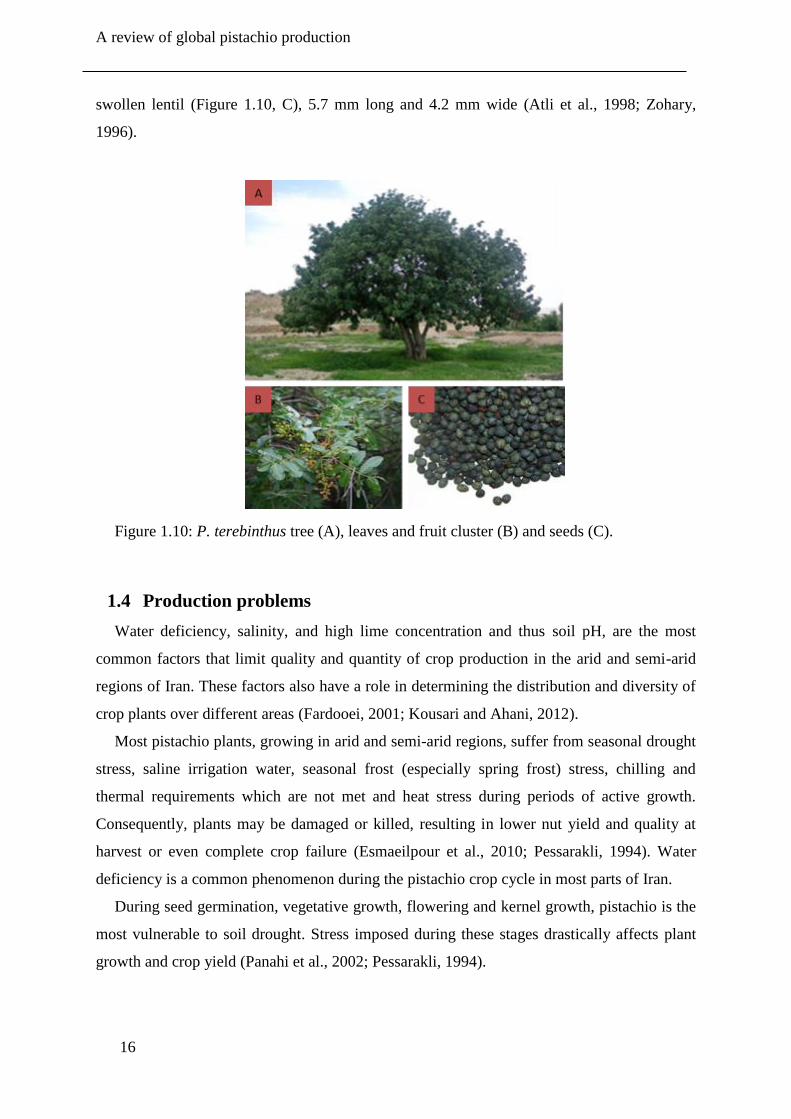
A review of global pistachio production
16
swollen lentil (Figure 1.10, C), 5.7 mm long and 4.2 mm wide (Atli et al., 1998; Zohary,
1996).
Figure 1.10: P. terebinthus tree (A), leaves and fruit cluster (B) and seeds (C).
1.4 Production problems
Water deficiency, salinity, and high lime concentration and thus soil pH, are the most
common factors that limit quality and quantity of crop production in the arid and semi-arid
regions of Iran. These factors also have a role in determining the distribution and diversity of
crop plants over different areas (Fardooei, 2001; Kousari and Ahani, 2012).
Most pistachio plants, growing in arid and semi-arid regions, suffer from seasonal drought
stress, saline irrigation water, seasonal frost (especially spring frost) stress, chilling and
thermal requirements which are not met and heat stress during periods of active growth.
Consequently, plants may be damaged or killed, resulting in lower nut yield and quality at
harvest or even complete crop failure (Esmaeilpour et al., 2010; Pessarakli, 1994). Water
deficiency is a common phenomenon during the pistachio crop cycle in most parts of Iran.
During seed germination, vegetative growth, flowering and kernel growth, pistachio is the
most vulnerable to soil drought. Stress imposed during these stages drastically affects plant
growth and crop yield (Panahi et al., 2002; Pessarakli, 1994).
Chapter 1
17
Commercial pistachio cultivars which were used in this research i.e. Akbari, Kaleghochi
and Ohadi have the ability to produce an annual average yield of 1205, 1075 and 1055 kg dry
nuts per hectare, respectively (Abdolahi, 2016). The quality characteristics (nut shape and
weight, clean shell, split percentage and blank percentage) of these 3 cultivars are better than
that of the other Iranian cultivars, because these cultivars were selected according to these
valuable characteristics by farmers over the last few decades.
In pistachio, water deficiency not only decreases tree growth and nut yield, but it also
affects nut quality (decreased proportion of split nuts in comparison to nut size) and increases
the alternate bearing intensity (Goldhamer and Beede, 2004; Kanber et al., 1993). The level
of injury or death of seedlings and adult pistachio trees as a result of severe and progressive
drought stress conditions depends on the drought tolerance abilities of pistachio rootstocks
and cultivars.
The potential impact of climate change will result in unreliable precipitation patterns and
endanger the available quality and quantity of irrigation water (Razavi, 2012). Global
climatic changes will have important effects on plant photosynthesis (Pessarakli, 1994). In
addition, climate change and global warming will lead to warming up of the temperate zones,
so that they also become suitable for subtropical crops like pistachio.
Pistachio plants can be used as an agricultural crop in arid and semi-arid areas, because
they are tolerant to drought, soil and water salinity and high pH; in other words, conditions
deemed inadequate for any other crop. On the other hand, as mentioned before there is a wide
genetic variation among pistachio cultivars in Iran, so that they may have different responses
ability to drought condition. Despite its potentially high drought tolerance and high genetic
variation, responses of pistachio cultivars to drought stress have not been adequately
determined.
1.5 Research objective
During the last fifty years, efforts have been done to develop pistachio cultivation areas in
Kerman province (Iran) but global warming has caused increasing water deficiency and
salinity in Kerman during the last decade, and consequently has decreased the pistachio
production in this area. However, pistachio cultivation has been still extending in other
suitable areas in Iran.
Akbari, Kaleghochi and Ohadi are commercial cultivars with good productivity (in terms
of quality and quantity) and Badami-Zarand and Sarakhs are common rootstocks that are
A review of global pistachio production
18
used in Iran and P.terebinthus is one of pistachio species which is used as a rootstock for
pistachio cultivars in Turkey, Greece, Italy and USA. There are limited studies about the
suitability of P.terebinthus for development in Iran and other countries.
There is a general postulate that the pistachio tree is tolerant to drought. This claim is
confirmed by observations done under natural conditions and by a few number of
experimental studies on different rootstocks (Abbaspour et al., 2011; Bagheri et al., 2011;
Habibi and Hajiboland, 2013; Panahi, 2009). Although adult pistachio trees are well-known
for their drought tolerance, drought is one of the important environmental stresses that
decreases the pistachio yield in Iran (Sedaghati and Hokmabadi, 2015). However limited
evidence is available on the underlying mechanisms of drought tolerance associated with the
plant’s biochemical composition, physiological responses, water relation parameters, growth
features and especially carbon and nitrogen isotope composition.
We hypothesize here that there is/are cultivar(s), among above mentioned pistachio
genotypes, which is/are more tolerant to drought stress than others.
The main objectives of this study were to (1) identify the plant defence mechanisms
against drought stress in pistachio rootstocks and cultivars (2) identify the most drought
tolerant rootstock and cultivar under stress conditions (3) and identify suitable traits in order
to screen rootstock and cultivar for their drought tolerance.
The specific objectives of these investigations were to:
(1) To determine chlorophyll fluorescence responses, leaf mineral contents,
growth parameters and carbon isotope composition of three pistachio rootstocks i.e. P.
vera cv. Badami, P. vera cv. Sarakhs and P. terebinthus during varying degrees of
drought stress and subsequent recovery period, for the estimation of their growth
potential as rootstock materials.
(2) To evaluate photosynthetic gas exchange patterns, biochemical responses, leaf
water status, growth parameters, stomatal features, and carbon and nitrogen isotope
composition of three important Iranian pistachio cultivars, i.e. P. vera cv. Akbari, P.
vera cv. Kaleghochi and P. vera cv. Ohadi, under varying degrees of osmotic drought
stress and subsequent recovery period, for the estimation of their growth potential as
rootstock materials.
(3) And to identify a fast method to screen drought tolerant pistachio cultivars and
rootstocks by using carbon isotope composition.
These investigations should ultimately lead to better-informed recommendations for the
selection of drought tolerant cultivars and rootstocks.
Chapter 1
19
Seedling rootstocks have improved pistachio tree growth and nut production (Esmaeilpour
et al., 2010; Ferguson et al., 2002a; Ferguson et al., 2002b; Panahi et al., 2002). Therefore,
researchers and growers have been focusing their efforts on selecting suitable rootstocks and
cultivars for domestic pistachio trees. Selection of the best rootstock and cultivars, based on
ecophysiological drought stress characteristics and growth parameters is of critical
importance to optimize vegetation growth in dry environments.
Field studies of drought effects are difficult to perform, time-consuming and usually
imprecise. An accurate control of soil water potential is also difficult to assess in the field. To
overcome these problems, polyethylene glycol (PEG) has been used to maintain rooting
media at predetermined water potential values.
1.6 Outline of thesis
Activities and results related to our objectives are spelled out here in 6 chapters. The first
chapter covers the general review of pistachio both in Iran and the world. It focuses on
important characteristics and the distribution of pistachio species and cultivars, and presents
the research problems. Chapter 2 deals with the literature of abiotic drought stress and plant
response to drought stress condition.
As indicated in first part of our specific objective, chapter 3 deals with the effects of
osmotic drought stress on physiological responses (chlorophyll fluorescence parameters),
growth characteristics (leaf, stem, root and total dry weight), mineral elements (P, Ca, Mg, Fe
and Zn) and carbon isotope composition of three pistachio rootstocks i.e. P. vera cv. Badami,
P. vera cv. Sarakhs and P. terebinthus, during varying degrees of drought stress and a
subsequent recovery period. This chapter describes the mechanism involved in drought stress
treatments in different pistachio species and how these rootstock seedlings overcome drought
stress.
Chapter 4 focuses on osmotic stress and how it affects physiological responses and growth
characteristics at different drought stress treatments in glasshouse for three pistachio
cultivars. This chapter is related to our second objective and describes the effect of drought
stress on photosynthetic gas exchange patterns, chlorophyll fluorescence parameters,
pigments concentration and biomass content in pistachio cultivars i.e. P. vera cv. Akbari, P.
vera cv. Kaleghochi and P. vera cv. Ohadi during drought stress and subsequent recovery
weeks. The aim of this research was to evaluate the physiological mechanisms of drought
tolerance of three pistachio cultivars. As we know not only the drought period in plants but
A review of global pistachio production
20
also water recovery by plants after the drought stress is very important. Therefore, this
chapter investigates the mechanisms of drought stress on pistachio cultivars during drought
stress and the subsequent recovery weeks.
In chapter 5 impact of osmotic drought stress on the biochemical characteristics, water
relations, and nitrogen and carbon isotope composition of pistachio (Pistacia vera L.)
cultivars are described. The aim of this research was to evaluate the mechanisms of drought
stress tolerance according to biochemical responses on three pistachio cultivars with as the
final goal of the development of suitable criteria for selecting drought tolerant cultivars. This
chapter evaluates effects of drought stress on the accumulation of carbohydrate and starch,
leaf water potential, and stomatal characteristics (first objective) as well as nitrogen and
carbon isotopes composition (third objective) in the above-mentioned pistachio cultivars,
during drought stress and subsequent recovery weeks. Finally, our general conclusions are
discussed and recommendations are offered for future research in chapter 6.

Chapter 2
21
Literature review Chapter 2.
Litrature review
22
2.1 Drought stress
Drought is a meteorological and environmental event, defined somewhat loosely as
absence of rainfall for a long time period that causes depletion of soil moisture and damage to
plants (Levitt, 1980; Turner, 1997). A similar definition has been brought up by Van Damme
(1990), who stated that drought stress is a water deficit stress caused by a rain deficit that
would make it a more meteorological term. When plant is exposed to an artificial water
shortage, this is usually called desiccation (Levitt, 1980).
Drought is the most important environmental stress that severely impairs plant growth and
development, limits plant production and the performance of crop plants more than any other
environmental stress factor (Shao et al., 2009). Plants experience drought stress either when
the water supply to roots becomes impaired or when the transpiration rate becomes very high
(Ali et al., 2008; Jaleel et al., 2009).
In agriculture, drought resistance is defined as the ability to grow, flower and produce
economic yield with minimum yield loss under a water-deficit condition related to the well
water management (Gupta, 1975; Kafi et al., 2012; Levitt, 1980; Taiz and Zeiger, 2010).
2.2 Mechanism of drought resistance
In plants, the mechanisms of drought resistance can be categorized into three groups, i.e.
drought escape, drought avoidance and drought tolerance (Mitra, 2001). However, crop
plants use more than one mechanism at a time to resist drought (Belhassen, 1997; Blum,
1996; Kafi et al., 2012; Mitra, 2001; Rosielle and Hamblin, 1981).
2.2.1 Drought escape
Drought escape is defined as the ability of a plant to complete its life cycle or growing
period before serious soil and plant water deficits develop (Mitra, 2001). This mechanism
involves a rapid phenological development (early flowering and early maturity),
developmental plasticity (variation in the duration of growth period depending on the extent
of water-deficit) and remobilization of assimilates (Kafi et al., 2012; Mitra, 2001; Taiz and
Zeiger, 2010). Duration to flowering is an important trait related to drought adaptation,
whereby a short life cycle can lead to drought escape (Araus et al., 2002).
Chapter 2
23
2.2.2 Drought avoidance
Drought avoidance is the ability of plants to maintain relatively high tissue water potential
despite a shortage of soil-moisture (Mitra, 2001). Drought avoidance is performed by the
maintenance of turgor through increased rooting depth, efficient root system and increased
hydraulic conductance and by reduction of water loss through reduced epidermal (stomatal
and lenticular) conductance, reduced absorption of radiation by leaf rolling or folding (Levitt,
1980; Mitra, 2001) and reduced evaporation of the surface (leaf area) (Levitt, 1980; Turner,
1986a). Plants growing under drought conditions survive by doing a balancing act between
maintenance of turgor and reduction of water loss (Levitt, 1980; Mitra, 2001).
Root morphological characteristics such as total biomass, length, density and depth are the
main drought avoidance traits that contribute to final yield in severe drought stress (Subbarao
et al., 1995; Turner et al., 2001). A deep and thickened taproot is helpful for extracting water
from considerable depths (Kavar et al., 2008). The response of isohydric plants to water
shortage is a form of drought avoidance, as there is little initial relationship between soil
water potential and leaf water potential (Limpus, 2009) .
2.2.3 Drought tolerance
Drought tolerance is the ability to withstand water-deficit conditions with low tissue water
potential. The response of plants to tissue water-deficit determines their level of drought
tolerance (Beck et al., 2007; Farooq et al., 2009b; Kafi et al., 2012; Levitt, 1980; Mitra,
2001). The mechanisms of drought tolerance are turgor maintenance through osmotic
adjustment, maintenance of membrane integrity and metabolite accumulation (Chaves and
Oliveira, 2004; Van Damme, 1990). As leaf water potential of anisohydric plants decreases
under water shortage conditions, these plants apply tolerance mechanisms to cope with
drought conditions (Limpus, 2009).
Hydraulic failure phenomena happen in plants, when reduced water availability alters both
soil–root and leaf–atmosphere interfaces, and threatens the liquid phase from soil to leaves,
thereby reducing the capacity of plants to take up water from the soil. Consequently
cavitation occurs, which is a phenomenon by which xylem vessels become air filled and loses
their functionality for sap conduction (Barigah et al., 2013; Hsiao and Xu, 2000; McDowell
et al., 2008; Mitchell et al., 2013). Mortality may directly occur by hydraulic failure for
isohydric seedlings or trees near their maximum height. Although anisohydric plants are
Litrature review
24
relatively drought-tolerant, they are predisposed to hydraulic failure because they operate
with narrower hydraulic safety margins during drought (McDowell et al., 2008) .
Isohydric plants maintain a constant midday leaf water potential (ѱ leaf) under drought
conditions, by reducing stomatal conductance as necessary to limit transpiration (Sade et al.,
2012). Examples of woody plants that displayed isohydric characteristics are wild pistachio
(Pistacia spp.) (Fardooei, 2001) and African baobab (Adansonia digitata L.) (De Smedt et
al., 2012; Van den Bilcke et al., 2013).
Anisohydric species, by contrast, allow midday Ψl to decline as soil Ψ declines with
drought (McDowell et al., 2008; Sade et al., 2012). In anisohydric behavior, there is a good
initial relationship between soil water potential and leaf water potential (Limpus, 2009).
Apple (Malus domestica Borkh.), eggplant (Solanum melongena L.), poplar (Populus spp. L.)
and cowpea (Vigna unguiculata L. Walp.) are classified as anisohydric plants (Limpus,
2009).
2.3 Plant responses to drought stress
Drought stress is affected by climatic, edaphic and agronomic factors. The susceptibility
of plants to drought stress varies with stress intensity, factors that accompany stress, the
nature of the plant species, and their developmental stages (Demirevska et al., 2009).
Drought stress influences plant growth and yield, membrane integrity, pigment content,
osmotic adjustment, water relations and photosynthetic activity (Benjamin and Nielsen, 2006;
Praba et al., 2009). According to Anjum et al. (2011), these effects can be divided in three
main categories:
2.3.1 Effect of drought stress on morphological plant characteristics
Plants living in arid and semi-arid regions tend to have special morphological adaptations
to reduce water losses. Plant leaves tend to develop xeromorphic characteristics when they
grow under dry conditions, in order to prevent excessive water loss.
Van Damme (1990) mentioned morphological adaptations at leaf level tend to reduce
transpiration. The latter effect can be obtained through a lowering of the transpiring leaf
surface area or by changes at stomatal level. Most important morphological features that can
be affected by water deficit are described hereafter.
Chapter 2
25
2.3.1.1 Leaf characteristics
Water availability is an important factor affecting leaf dimension, leaf area, leaf number
and leaf coating of plants. The development of an optimal leaf area is important in relation to
photosynthesis and dry matter yield. Water deficiency stresses mostly reduce leaf expansion.
Consequently, the total leaf area of the plant is reduced (Farooq et al., 2009b; Yang et al.,
2004). Water deficit stimulates leaf abscission and leaf wax deposition but decreases leaf area
and above ground plant growth (Fulda et al., 2011).
Environmental stresses such as drought stress have important effects on leaf traits (Dong
and Zhang, 2000). The leaf is the organ most responsive to environmental conditions; its
structure reflects the effects of drought stress more clearly than stems or roots (Fardooei,
2001; Liu and Stützel, 2004). Perennial plants in arid and semi-arid areas tend to have smaller
leaves, an adaptation that enables them to conserve water (Ludlow and Ng, 1974).
At plant level, leaf expansion is one of the processes most sensitive to drought stress. In
fact, reduced leaf area is probably the more obvious mechanism by which plants and crops
will defend themselves against drought stress (Hsiao and Xu, 2000). Water stress greatly
suppresses cell expansion and cell growth due to low turgor pressure (Shao et al., 2008).
Under low water availability conditions, leaf area rates significantly decreased in olive
(Olea europaea L) (Bacelar et al., 2007), peanuts (Arachis hypogaea) (Rucker et al., 1995),
maize (Zea mays) (Khan et al., 2001) and Sabina vulgaris (Dong and Zhang, 2000).
Van den Bilcke et al. (2013) mentioned that baobab (Adansonia digitata L.) seedlings are
leafless during most of the dry season, suggesting a drought avoidance strategy. In many
plants that are living in semi-arid and arid zones, drought adaptation is achieved by a
reduction of the transpiring area through leaf shedding (Orshan et al., 1989). For instance,
leaf shedding is a drought stress coping strategy in Zygophyllum dumosum (Sundberg, 1985),
wild almond (Prunus spp.) (Rouhi et al., 2007) and baobab (Adansonia digitata L.) (Van den
Bilcke et al., 2013). A number of drought resistant plants even shed their leaves several times
a year. Each time, shedding is followed by regrowth of new leaves, which are often smaller
and more xerophytic than those just shed (Sundberg, 1985) cited in (Fardooei, 2001; Van
Damme, 1990). In Ziziphus trees, leaf shedding occurred more in trees after rapid stress
treatment compared to gradual stress treatment (Arndt et al., 2001).
There is much mucilage in leaf epidermal cells of baobab seedlings that may help in
maintaining a high leaf water potential (Ψl) in this plant (Van den Bilcke et al., 2013). Leaf
mucilaginous substances increased during drought stress in Brunella grandiflia (Jeremias,
Litrature review
26
1966), whereas leaves of Ziziphus plants do not show any significant difference exposed to
drought stress treatments (Clifford et al., 2002).
Drought tolerance of wild pistachio species can be related to a deep taproot, high water
conservation ability through stomatal adjustment, stomatal features, leaf characteristics, and
leaf shedding (Fardooei, 2001; Germana, 1996; Spiegel-Roy et al., 1977).
Leaf area was significantly lower for drought-stressed than for well-watered pistachio
(Pistacia vera) seedlings (Abbaspour et al., 2012b). Drought stress induced a reduction in
evaporation and stomatal conductance in Pistacia vera and P. atlantica (Behboudian et al.,
1986; Goldhamer et al., 1985; Sepaskhah and Maftoun, 1982; Spiegel-Roy et al., 1977).
2.3.1.2 Stomata
Most water loss from plants occurs through the stomata whereas most of the carbon
dioxide used in photosynthesis enters through the same structures. Thus, stomatal behavior
plays a very important role in plant physiology (Kramer and Boyer, 1995). Stomata can occur
on the epidermis of all plant organs, except roots. In dry conditions, stomata in mesophytic
species are usually smaller and more numerous than those for species growing in a more
humid environment (Kramer, 1969). There are different ideas about stomatal density in plants
that are adapted to dry conditions, whereas it surely depends on the kind of plant species (C3,
C4 or CAM). Some authors mentioned that a low stomatal density is typical for these plants
whereas others claimed that this parameter increases with drought (Van Damme, 1990).
One of the first responses of almost all plants to severe water deficit is the closure of their
stomata to prevent transpiration water loss (Ali et al., 2008; Farooq et al., 2009b; Maroco et
al., 1997; Sharkey and Seemann, 1989; Tezara et al., 1999). Stomatal closure is generally
accepted to be the main determinant for decreased photosynthesis under mild to moderate
drought (Cornic and Massacci, 1996; Yokota et al., 2002). When the amount of available soil
water is moderately or severely limiting, one option for plants is to close their stomata
(Cornic and Massacci, 1996). Stomatal characteristics, such as density and size, are greatly
affected by species type and environmental factors (Dong and Zhang, 2000; Munir et al.,
2011). Drought stress increased stomatal density and decreased stomatal size in olive
varieties (Guerfel et al., 2009) while, drought stress decreased stomatal density and size in
strawberry (Klamkowski and Treder, 2007). Olive plants grown under drought conditions
exhibited a significant increase in number of stomata and trichomes in different varieties
when compared to well-watered control plants (Bacelar et al., 2007).
Chapter 2
27
Evaluation of epidermal leaf cells of four pistachio rootstocks (Pistacia vera, cv. Badami
Zarand, Sarakhs, Ghazvini and Pistacia mutica) which are grown under three irrigational
levels (100%, 65% and 30% ETc) showed that the highest stomatal density and the lowest
stomatal length and width values were obtained with severe drought stress (30% ETc)
treatment (Arzani et al., 2013).
Several reports suggested that plant metabolic processes are in fact more sensitive to
turgor and cell volume than to absolute water potential, with maintenance of inter-molecular
distances critical for continued metabolic activity (Clifford et al., 1998; Jones and Corlett,
1992). Maintenance of cell turgor, which is a hydraulically mediated process, plays an
important role in regulating the carbon balance of plants. Growth is particularly sensitive to
changes in cell turgor and often declines before reductions in leaf photosynthesis in response
to drought are observed (Mitchell et al., 2013; Taiz and Zeiger, 2010).
Cell growth is one of the most drought-sensitive physiological processes due to the
reduction in turgor pressure (Taiz and Zeiger, 2010). Therefore, any loss in turgor pressure as
a consequence of the imbalance in the plant water content could result in reduced growth and
even in the total absence of growth under dry environmental conditions.
Under severe water deficiency, cell elongation of higher plants can be inhibited by
interruption of water flow from the xylem to the surrounding elongating cells (Farooq et al.,
2009a; Nonami, 1998). Under water deficit and as a result of solute accumulation, the
osmotic potential of the cell is lowered, which attracts water into the cell and helps with the
maintenance of turgor (Farooq et al., 2009a; Taiz and Zeiger, 2010) .
2.3.1.3 Stem elongation and plant height
In vascular plants, one of the main functions of the stem is transferring water and
dissolved minerals from roots to other plant parts and vice versa (Solomon et al., 2008).
Drought stress adversely affects growth, stem extension, dry mass, and productivity of plants
(Anjum et al., 2011; Blum, 2005; Farooq et al., 2009b; Hussain et al., 2008) and causes a
higher rate of impairment than any other environmental factor (Cechin et al., 2008; Shao et
al., 2009).
Shoot length is considerably depressed due to drought stress in cowpea and soybean
(Wien, 1977) and apple rootstocks (Fernandez et al., 1997). Drought stress caused a
significant reduction in plant height, leaf area and stem diameter in maize (Khan et al., 2001)
and Dalbergia sissoo and D. latifolia (Ashraf et al., 2004). Plant height decreased with
Litrature review
28
drought stress in vetch (Vicia narbonensis, V. sativa and V. villosa) species (Haffani et al.,
2014) and citrus seedlings (Jaleel et al., 2009; Wu et al., 2008).
Reduction in plant height and leaf area under drought stress may be associated with a
decline in cell enlargement and faster leaf senescence in the plant (Bhatt and Srinivasa Rao,
2005; Manivannan et al., 2007; Shao et al., 2009). A significant decrease in stem length of
‘Badami’ and ‘Ghazvini’ pistachio was observed with increasing irrigation intervals, while
that of ‘Sarakhs’ was not significantly affected (Tajabadipour et al., 2006). Plant height of
different pistachio cultivars was reduced with increasing salinity stress; this reduction was
more pronounced in Ohadi and Kaleghochi cultivars under moderate and high salinities
(Abbaspour et al., 2012a).
2.3.1.4 Fresh and dry biomass
Plant growth may be evaluated by monitoring fresh or dry biomass increase or elongation
(changes in length). Both parameters may depend more directly on osmotic adaptation and on
the maintenance of a positive water balance. Drought severely affects plant growth and
development with significant reductions in growth rate and biomass accumulation (Bacelar et
al., 2007; Maraghni et al., 2011; Sanders and Arndt, 2012; Shao et al., 2008).
In alfalfa (Medicago sativa), shoot and root fresh and dry weight was reduced by
polyethylene glycol-induced water deficit, while root length was increased (Zeid and
Shedeed, 2006).
Shoot and root dry weight of pistachio seedlings were significantly depressed with
increasing salinity stress (Bastam et al., 2013; Hajiboland et al., 2014; Karimi et al., 2009).
Saadatmand et al. (2007) indicated that salinity stress had more negative influence than
drought stress on plant height, shoot and root dry weights. With increase in salinity stress, dry
weight of shoots decreased in Akbari, Kaleghochi and Ohadi pistachio cultivars (Abbaspour
et al., 2012a).
Shoot dry weights were reduced in Badami, Qazvini and Sarakhs pistachio cultivars with
increasing irrigation intervals (Tajabadipour et al., 2006). The fresh and dry weight of
Pistacia vera L. ‘Ahmadaghaii’ seedlings decreased significantly under drought stress
conditions in both with and without silicon treatments in the soil (Habibi and Hajiboland,
2013) .
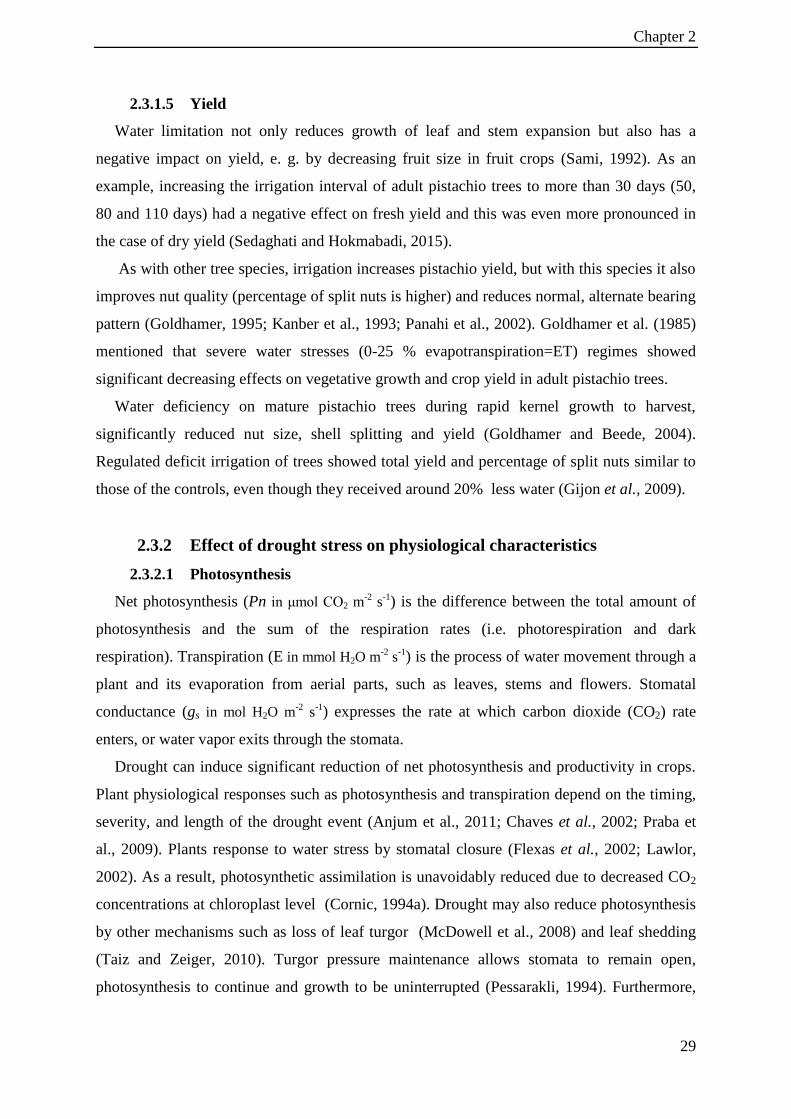
Chapter 2
29
2.3.1.5 Yield
Water limitation not only reduces growth of leaf and stem expansion but also has a
negative impact on yield, e. g. by decreasing fruit size in fruit crops (Sami, 1992). As an
example, increasing the irrigation interval of adult pistachio trees to more than 30 days (50,
80 and 110 days) had a negative effect on fresh yield and this was even more pronounced in
the case of dry yield (Sedaghati and Hokmabadi, 2015).
As with other tree species, irrigation increases pistachio yield, but with this species it also
improves nut quality (percentage of split nuts is higher) and reduces normal, alternate bearing
pattern (Goldhamer, 1995; Kanber et al., 1993; Panahi et al., 2002). Goldhamer et al. (1985)
mentioned that severe water stresses (0-25 % evapotranspiration=ET) regimes showed
significant decreasing effects on vegetative growth and crop yield in adult pistachio trees.
Water deficiency on mature pistachio trees during rapid kernel growth to harvest,
significantly reduced nut size, shell splitting and yield (Goldhamer and Beede, 2004).
Regulated deficit irrigation of trees showed total yield and percentage of split nuts similar to
those of the controls, even though they received around 20% less water (Gijon et al., 2009).
2.3.2 Effect of drought stress on physiological characteristics
2.3.2.1 Photosynthesis
Net photosynthesis (Pn in μmol CO2 m-2
s-1) is the difference between the total amount of
photosynthesis and the sum of the respiration rates (i.e. photorespiration and dark
respiration). Transpiration (E in mmol H2O m-2
s-1) is the process of water movement through a
plant and its evaporation from aerial parts, such as leaves, stems and flowers. Stomatal
conductance (gs in mol H2O m-2
s-1) expresses the rate at which carbon dioxide (CO2) rate
enters, or water vapor exits through the stomata.
Drought can induce significant reduction of net photosynthesis and productivity in crops.
Plant physiological responses such as photosynthesis and transpiration depend on the timing,
severity, and length of the drought event (Anjum et al., 2011; Chaves et al., 2002; Praba et
al., 2009). Plants response to water stress by stomatal closure (Flexas et al., 2002; Lawlor,
2002). As a result, photosynthetic assimilation is unavoidably reduced due to decreased CO2
concentrations at chloroplast level (Cornic, 1994a). Drought may also reduce photosynthesis
by other mechanisms such as loss of leaf turgor (McDowell et al., 2008) and leaf shedding
(Taiz and Zeiger, 2010). Turgor pressure maintenance allows stomata to remain open,
photosynthesis to continue and growth to be uninterrupted (Pessarakli, 1994). Furthermore,
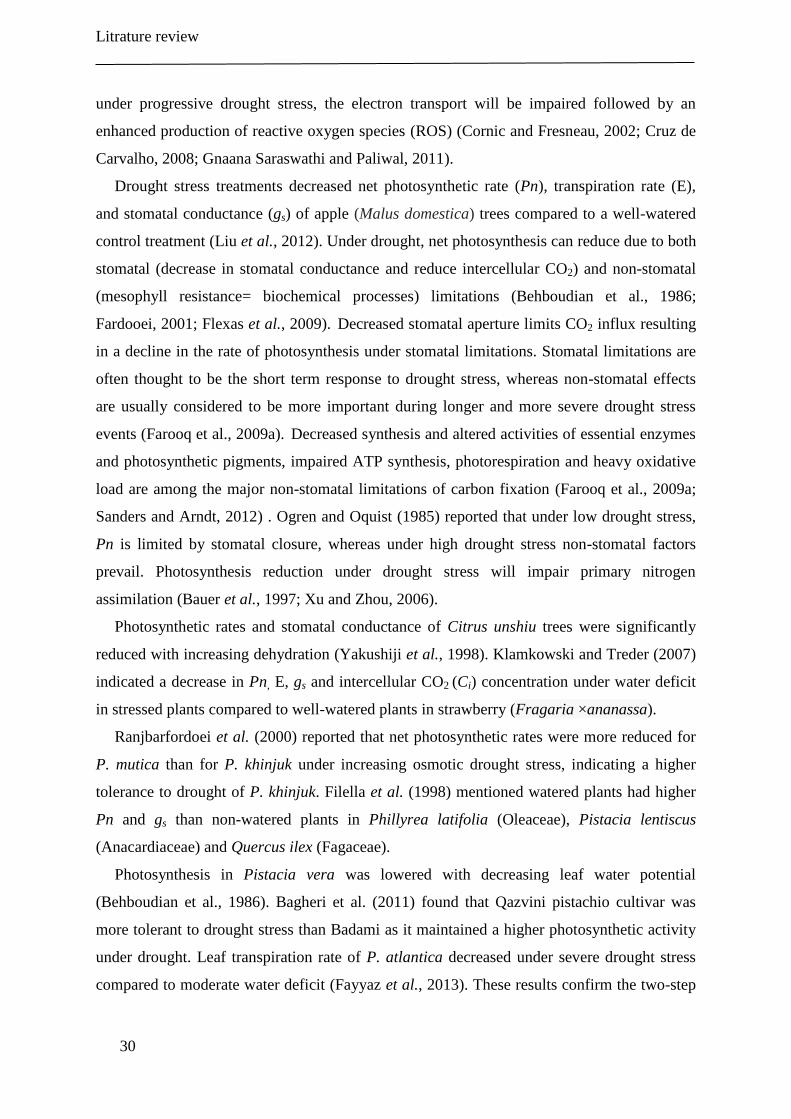
Litrature review
30
under progressive drought stress, the electron transport will be impaired followed by an
enhanced production of reactive oxygen species (ROS) (Cornic and Fresneau, 2002; Cruz de
Carvalho, 2008; Gnaana Saraswathi and Paliwal, 2011).
Drought stress treatments decreased net photosynthetic rate (Pn), transpiration rate (E),
and stomatal conductance (gs) of apple (Malus domestica) trees compared to a well-watered
control treatment (Liu et al., 2012). Under drought, net photosynthesis can reduce due to both
stomatal (decrease in stomatal conductance and reduce intercellular CO2) and non-stomatal
(mesophyll resistance= biochemical processes) limitations (Behboudian et al., 1986;
Fardooei, 2001; Flexas et al., 2009). Decreased stomatal aperture limits CO2 influx resulting
in a decline in the rate of photosynthesis under stomatal limitations. Stomatal limitations are
often thought to be the short term response to drought stress, whereas non-stomatal effects
are usually considered to be more important during longer and more severe drought stress
events (Farooq et al., 2009a). Decreased synthesis and altered activities of essential enzymes
and photosynthetic pigments, impaired ATP synthesis, photorespiration and heavy oxidative
load are among the major non-stomatal limitations of carbon fixation (Farooq et al., 2009a;
Sanders and Arndt, 2012) . Ogren and Oquist (1985) reported that under low drought stress,
Pn is limited by stomatal closure, whereas under high drought stress non-stomatal factors
prevail. Photosynthesis reduction under drought stress will impair primary nitrogen
assimilation (Bauer et al., 1997; Xu and Zhou, 2006).
Photosynthetic rates and stomatal conductance of Citrus unshiu trees were significantly
reduced with increasing dehydration (Yakushiji et al., 1998). Klamkowski and Treder (2007)
indicated a decrease in Pn, E, gs and intercellular CO2 (Ci) concentration under water deficit
in stressed plants compared to well-watered plants in strawberry (Fragaria ×ananassa).
Ranjbarfordoei et al. (2000) reported that net photosynthetic rates were more reduced for
P. mutica than for P. khinjuk under increasing osmotic drought stress, indicating a higher
tolerance to drought of P. khinjuk. Filella et al. (1998) mentioned watered plants had higher
Pn and gs than non-watered plants in Phillyrea latifolia (Oleaceae), Pistacia lentiscus
(Anacardiaceae) and Quercus ilex (Fagaceae).
Photosynthesis in Pistacia vera was lowered with decreasing leaf water potential
(Behboudian et al., 1986). Bagheri et al. (2011) found that Qazvini pistachio cultivar was
more tolerant to drought stress than Badami as it maintained a higher photosynthetic activity
under drought. Leaf transpiration rate of P. atlantica decreased under severe drought stress
compared to moderate water deficit (Fayyaz et al., 2013). These results confirm the two-step
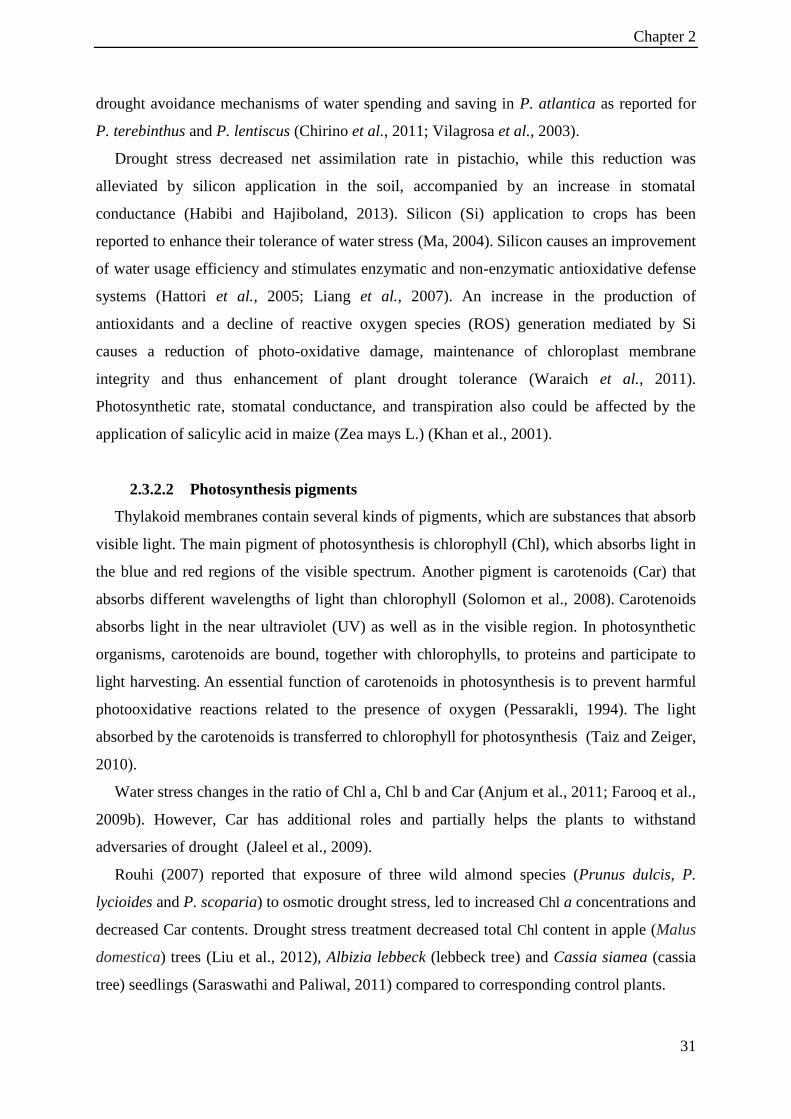
Chapter 2
31
drought avoidance mechanisms of water spending and saving in P. atlantica as reported for
P. terebinthus and P. lentiscus (Chirino et al., 2011; Vilagrosa et al., 2003).
Drought stress decreased net assimilation rate in pistachio, while this reduction was
alleviated by silicon application in the soil, accompanied by an increase in stomatal
conductance (Habibi and Hajiboland, 2013). Silicon (Si) application to crops has been
reported to enhance their tolerance of water stress (Ma, 2004). Silicon causes an improvement
of water usage efficiency and stimulates enzymatic and non-enzymatic antioxidative defense
systems (Hattori et al., 2005; Liang et al., 2007). An increase in the production of
antioxidants and a decline of reactive oxygen species (ROS) generation mediated by Si
causes a reduction of photo-oxidative damage, maintenance of chloroplast membrane
integrity and thus enhancement of plant drought tolerance (Waraich et al., 2011).
Photosynthetic rate, stomatal conductance, and transpiration also could be affected by the
application of salicylic acid in maize (Zea mays L.) (Khan et al., 2001).
2.3.2.2 Photosynthesis pigments
Thylakoid membranes contain several kinds of pigments, which are substances that absorb
visible light. The main pigment of photosynthesis is chlorophyll (Chl), which absorbs light in
the blue and red regions of the visible spectrum. Another pigment is carotenoids (Car) that
absorbs different wavelengths of light than chlorophyll (Solomon et al., 2008). Carotenoids
absorbs light in the near ultraviolet (UV) as well as in the visible region. In photosynthetic
organisms, carotenoids are bound, together with chlorophylls, to proteins and participate to
light harvesting. An essential function of carotenoids in photosynthesis is to prevent harmful
photooxidative reactions related to the presence of oxygen (Pessarakli, 1994). The light
absorbed by the carotenoids is transferred to chlorophyll for photosynthesis (Taiz and Zeiger,
2010).
Water stress changes in the ratio of Chl a, Chl b and Car (Anjum et al., 2011; Farooq et al.,
2009b). However, Car has additional roles and partially helps the plants to withstand
adversaries of drought (Jaleel et al., 2009).
Rouhi (2007) reported that exposure of three wild almond species (Prunus dulcis, P.
lycioides and P. scoparia) to osmotic drought stress, led to increased Chl a concentrations and
decreased Car contents. Drought stress treatment decreased total Chl content in apple (Malus
domestica) trees (Liu et al., 2012), Albizia lebbeck (lebbeck tree) and Cassia siamea (cassia
tree) seedlings (Saraswathi and Paliwal, 2011) compared to corresponding control plants.
Litrature review
32
Ranjbarfordoei et al. (2002) reported that exposure of two pistachio species (P. khinjuk
and P. mutica) to osmotic drought stress led to lower chlorophyll a and b contents.
Arbuscular mycorrhiza (AM) colonization and plant growth and total chlorophyll were higher
for well-watered than for drought stressed plants in pistachio Badami (Abbaspour et al.,
2011).
Impact of salinity on reduction of chlorophyll content was significant in all three pistachio
cultivars i.e. Akbari, Kaleghochi and Ohadi tested by Abbaspour et al. (2012a). Chlorophyll
pigment concentrations were increased with mild drought stress compared with control, and
then decreased with increasing stress intensity in pistachio rootstocks. Carotenoid content
increased significantly in all drought-stress levels (Bagheri et al., 2011). Bastam et al. (2013)
reported salicylic acid (SA) increased relative leaf chlorophyll content and photosynthetic
capacity as compared with control in salt stress conditions. The relatively higher leaf
chlorophyll content values of SA-treated pistachio leaves may be related to the influence of
salicylic acid on endogenous cytokinin contents. SA-treated plants synthesized more
cytokinin (Sakhabutdinova et al., 2003) which, in turn, enhanced chloroplast differentiation,
chlorophyll biosynthesis, and prevented chlorophyll degradation (Fletcher and Arnold, 1986).
2.3.2.3 Chlorophyll fluorescence
The principle of chlorophyll fluorescence measurements is based on the fact that a fraction
of the absorbed photon energy is released as a photon with a lower energy content (higher
wavelength) (Maxwell and Johnson, 2000). For example, Chl a absorbs photons in the blue
and red regions of the spectrum whereas emission is in the red region of the spectrum. This
phenomenon is called chlorophyll fluorescence (Hall and Rao, 1999; Maxwell and Johnson,
2000). Chlorophyll fluorescence emission provides a fast indicator of the primary
photochemistry of photosynthesis and reflects the primary processes that takes place in the
chloroplast such as light absorption, excitation of energy transfer and the photochemical
reaction in PSII (DeEll et al., 1999). The perturbations of photosynthetic metabolism which
are induced by drought stress will significantly modify the fluorescence emission and kinetic
characteristics of plants. Therefore, chlorophyll fluorescence provides useful information
about leaf photosynthetic performance under drought stress (Baker and Rosenqvist, 2004).
There are different types of apparatus to measure chlorophyll fluorescence. In recent
years, this technique is used as a tool for studying many aspects of plant physiology related to
photosynthesis (DeEll et al., 1999; Ganago, 1998; Maxwell and Johnson, 2000; Oliveira and
Peñuelas, 2000). It is a rapid, powerful and non-destructive technique, with the potential to
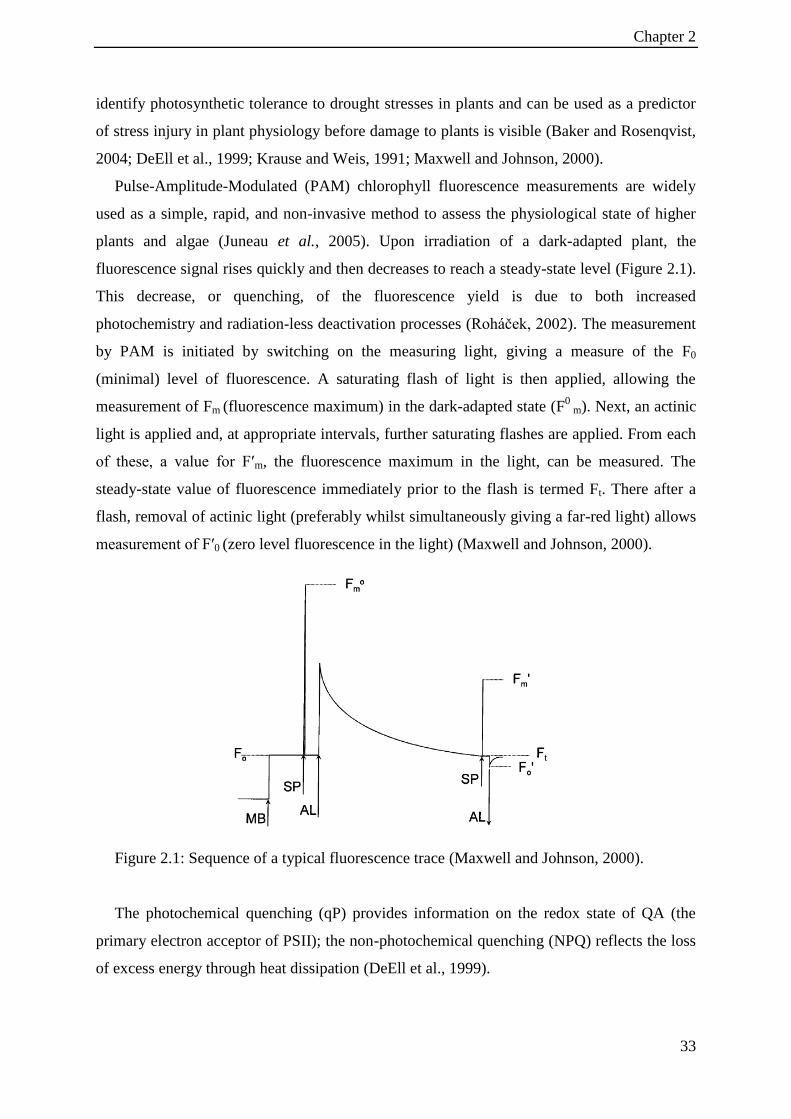
Chapter 2
33
identify photosynthetic tolerance to drought stresses in plants and can be used as a predictor
of stress injury in plant physiology before damage to plants is visible (Baker and Rosenqvist,
2004; DeEll et al., 1999; Krause and Weis, 1991; Maxwell and Johnson, 2000).
Pulse-Amplitude-Modulated (PAM) chlorophyll fluorescence measurements are widely
used as a simple, rapid, and non-invasive method to assess the physiological state of higher
plants and algae (Juneau et al., 2005). Upon irradiation of a dark-adapted plant, the
fluorescence signal rises quickly and then decreases to reach a steady-state level (Figure 2.1).
This decrease, or quenching, of the fluorescence yield is due to both increased
photochemistry and radiation-less deactivation processes (Roháček, 2002). The measurement
by PAM is initiated by switching on the measuring light, giving a measure of the F0
(minimal) level of fluorescence. A saturating flash of light is then applied, allowing the
measurement of Fm (fluorescence maximum) in the dark-adapted state (F0
m). Next, an actinic
light is applied and, at appropriate intervals, further saturating flashes are applied. From each
of these, a value for Fʹm, the fluorescence maximum in the light, can be measured. The
steady-state value of fluorescence immediately prior to the flash is termed Ft. There after a
flash, removal of actinic light (preferably whilst simultaneously giving a far-red light) allows
measurement of Fʹ0 (zero level fluorescence in the light) (Maxwell and Johnson, 2000).
Figure 2.1: Sequence of a typical fluorescence trace (Maxwell and Johnson, 2000).
The photochemical quenching (qP) provides information on the redox state of QA (the
primary electron acceptor of PSII); the non-photochemical quenching (NPQ) reflects the loss
of excess energy through heat dissipation (DeEll et al., 1999).
Litrature review
34
Well-known fluorescence parameters for assessing the functional integrity of PSII
include:
*. Fv/Fm (maximum quantum yield of PSII photochemistry after dark adaptation);
Ratio of variable fluorescence (Fv) to maximum fluorescence (Fm) is used as maximal
quantum yield of PSII photochemistry (Fv/Fm). The chlorophyll fluorescence ratio (Fv/Fm)
was calculated as:
Fv/Fm = (Fm –F0) / Fm
Where Fm and F0 are the maximum and minimum (basal) chlorophyll fluorescence yields
of dark-adapted leaves respectively. Also, Fv is the maximum variable chlorophyll
fluorescence yield in the dark-adapted state. Fv/Fm provides information about the underlying
processes. A change in Fv/Fm is due to a change in the efficiency of non-photochemical
quenching. Dark adapted values of Fv/Fm reflect the potential quantum efficiency of PSII and
are used as a sensitive indicator of plant photosynthetic performance. The Fv/Fm in plants
which were grown in suitable conditions is around 0.8. Values lower than 0.8, will be seen
when the plant has been exposed to stress, hence, indicating in particular the phenomenon of
photoinhibition (Maxwell and Johnson, 2000; Roháček, 2002). Therefore, in order to
demonstrate the tolerance of plants to water stress, Fv/Fm is a very good parameter.
*. YII (effective quantum yield of PSII electron transport); this is calculated as:
YII= (Fʹm −Fs) / Fʹm
Where Fʹm is the maximum chlorophyll fluorescence in leaves submitted to ambient light
and Fs is the steady fluorescence in leaves acclimated to ambient light. This parameter (YII)
measures the proportion of the light absorbed by chlorophyll associated with PSII that is used
in photochemistry. Therefore, it can give a measuring rate of linear electron transport and so
an indication of overall photosynthesis (Maxwell and Johnson, 2000; Roháček, 2002).
*. qP (photochemical quenching) is another widely used fluorescence parameter
measuring photochemistry, and it is calculated as:
qP= (Fʹm −Fs) / (Fʹm −Fʹ0)
Where Fʹm is the maximum fluorescence in leaves submitted to ambient light, Fs is the
steady fluorescence in leaves acclimated to ambient light and Fʹ0 is initial fluorescence in
leaves submitted to ambient light. Although qP seems superficially very similar to YII, the
significance of this parameter is somewhat different. YII is the proportion of absorbed energy
being used in photochemistry, while qP gives an indication of the proportion of photosystem
II (PSII) reaction centers that are open (Maxwell and Johnson, 2000; Roháček, 2002).
Photochemical quenching (qP) indicates the ability of PSII to transfer electrons to various
Chapter 2
35
acceptors within the chloroplast. A change in qP is due to closure of reaction centers,
resulting from a saturation of photosynthesis by light. qP values may vary between 1and 0
under control and stress conditions. When qP is high, it shows reaction centers are open and
electron transport will go easily. When qP is low and decreased compared to control plants, it
indicates that relative closure of reaction centers and a decreased electron transport.
*. NPQ (non-photochemical quenching of chlorophyll fluorescence);
The most straightforward way of quantifying non-photochemical quenching is by
measuring the ratio of a change in Fm to the final value of Fm:
(F0
m− Fʹm ) / Fʹm
Non-photochemical quenching is one of the mechanisms that prevents or alleviate damage
to the photosynthetic apparatus. In this mechanism, excess radiation energy is dissipated as
heat in the light harvesting antenna of PSII (Müller et al., 2001). NPQ is related to heat
dissipation and lies on a scale from zero till infinity. In a typical plant, values might be
expected in the range 0.5–3.5 at saturating light intensities; however, this varies markedly
among species and also varies on the previous history of the plant (Maxwell and Johnson,
2000).
Since YII is the effective quantum yield of PSII photochemistry, it can be used to calculate
linear electron transport rate and, therefore, overall photosynthetic capacity in vivo (Genty et
al., 1989). The electron transport rate (ETR) was calculated as YII PAR 0.84 0.5,
where the absorbed photon energy (PAR= Photosynthetic active radiation) is assumed to be
equally distributed between PSI and PSII and 0.84 is the assumed light absorptance of the
leaf (Maxwell and Johnson, 2000).
Based on the type of physiological stress and its effect on the photosynthesis pathway, one
or all fluorescence parameters could be critical and sensitive indicators (DeEll et al., 1999;
Kooten and Snel, 1990; Maxwell and Johnson, 2000).
Chlorophyll fluorescence features (Fv/Fm and qP) of wheat (Triticum aestivum) under
drought (Hassan, 2006) and barley (Hordeum vulgare) under saline stress conditions (Jiang et
al., 2006; Li et al., 2006) significantly decreased compared to control plants. In strawberry
(Fragaria ×ananassa) a gradual reduction in photochemical quenching (qP) and quantum
efficiency (YII) was observed under drought stress while non-photochemical quenching
(NPQ) increased (Razavi et al., 2008).
Salicylic acid treatment increased the maximum quantum yield of PSII (Fv/Fm ) of
pistachio seedlings significantly, compared with control plants under salt stress conditions
(Bastam et al., 2013), indicating that salicylic acid reduced salt-induced photoinhibition by
Litrature review
36
protecting photosystem II. Salicylic acid is known as an important factor in the plant defense
system during pathogen attack. It is also involved with osmotic stress and can amplify the
effects of osmotic stress by increasing the ROS production during photosynthesis; this ROS
acts as a signal which might improve the systemic resistance (Bartoli et al. 2012).
Ranjbarfordoei et al. (2002) reported that the heat dissipation (NPQ) only significantly
increased at the highest level of drought stress (-1.55 MPa) in Pistacia khinjuk and P. mutica.
Fv/Fm was adversely affected by drought stress in pistachio cultivar Qazvini while in Badami
cultivar, increasing drought-stress intensity had no significant effect on this parameter
(Bagheri et al., 2011). The soil application of silicon in pistachio seedlings showed that Fv/Fm
improved under drought stress compared with non-treated silicon seedlings. Providing
optimum CO2 concentration for carbon reactions may prevent photo-inhibition, which was
clearly reflected in the significantly higher Fv/Fm values in the presence of silicon in drought-
stressed pistachio plants (Habibi and Hajiboland, 2013).
2.3.2.4 Water relations
Plant–water relations concern how plants control the hydration of their cells, including the
collection of water from the soil, its transport within the plant and its loss by transpiration
from the leaves.
It is well-known that most (95% or more) of the water absorbed from the soil by the roots
of a tree is not retained in the tree, but evaporates through stomatal pores located on the leaf
surface; a process which is referred to as transpiration (Ridge, 2002). Each day, water must
move from the roots to the leaves to replace the quantity lost by transpiration. Furthermore,
this flow of water also promotes the transport to leaves of mineral nutrients absorbed by the
roots.
Soil water enters the root through small root hairs that are located on the epidermal cells of
the roots. It moves radially across the root cortex to the central cylinder which includes the
vascular tissue. The water conducting elements of the vascular tissue are primarily the non-
living and heavily thickened and lignified tracheids and xylem vessels. They act as a network
of tubes connecting one to another, tubes which the water can ascent from the roots up to the
small veins in the leaves. At the veins' ends, the water is released from the xylem. After
crossing some mesophyll cells and/or cell walls, it reaches the substomatal cavity (an
intercellular air space) from where it finally diffuses through the stomatal pores into the
atmosphere as water vapor. The ascent of liquid water through the tree induced by this
transpiration process is defined as sap flow (or transpiration stream) (Steppe, 2004).
Chapter 2
37
The water status of plants is usually expressed as water potential. The driving force which
governs the water transport in trees originates from the difference in total water potential
whereby water will flow spontaneously from a region of higher water potential (less
negative) to one of a lower water potential (more negative).
According to the different forces which can act on water molecules, the total water
potential (Ѱw, MPa) can be written as (Nobel, 1999):
Ѱw= ѰP + Ѱm+Ѱs +Ѱg
In this equation, Ѱp is the hydrostatic potential or pressure potential (MPa), Ѱm is the
matrix potential (MPa), Ѱs is the osmotic or solute potential (MPa) and Ѱg is the gravitational
potential (MPa). The water potential is zero in pure and free water at standard atmospheric
pressure, and at a temperature of 2 8 (25 C) (Passioura, 2010).
The components of the total water potential can have a positive and/or negative value,
depending on the type of physical and chemical forces which interfere with the mobility of
water molecules in the system (Steppe, 2004).
The pressure potential (Ѱp), referring to the physical pressure exerted on water in the
system, can be positive or negative. For example, water in the turgid root cortical cells or leaf
mesophyll cells are under positive turgor pressure that exerted pressure against the cell walls
(Ѱp˃ 0), whereas water in the dead xylem vessels of a transpiring plant is under tension or
suction (negative hydrostatic pressure; Ѱp< 0). The positive hydrostatic pressure within cells
is the pressure which is referred to as turgor pressure. The value of Ѱp can also be negative,
as is the case in the xylem and in the walls between cells, where a tension, or negative
hydrostatic pressure, can develop. Negative pressures outside cells are very important in
moving water long distances through the plant (Munns et al., 2000; Taiz and Zeiger, 2010).
The matrix potential (Ѱm), dealing explicitly with interactions occurring at the numerous
air-water interfaces of a cell wall, is always negative. Large negative pressures on water in
cell wall interstices arise because of capillary effects due to the attraction between water and
the hydrophilic cell wall surface at an air-water interface.
Osmotic potential (Ѱs) represents the effect of dissolved solutes on water potential.
Solutes reduce the free energy of water by diluting the water (Lichtfouse et al., 2009; Taiz
and Zeiger, 2010).
Gravity causes water to move downward unless the force of gravity is opposed by an equal
and opposite force. The term Ѱg depends on the height (h) of the water above the reference-
state water, the density of water, and the acceleration due to gravity (g) (Taiz and Zeiger,
2010).
Litrature review
38
Cell growth, photosynthesis, and crop productivity are all strongly influenced by water
potential and its components (Comstock and Mencuccini, 1998; Taiz and Zeiger, 2010). Like
the body temperature of humans, water potential is a good overall indicator of plant health
(Taiz and Zeiger, 2010).
Plant water relations during drought stress play a critical role in the activation or
regulation of different metabolic defense mechanisms (Sánchez-Rodríguez et al., 2010).
Plants continuously absorb and lose water during their life (Taiz and Zeiger, 2010). Important
characteristics to evaluate the plant water relations are as follow (Farooq et al., 2009b):
2.3.2.4.1 Relative Water Content (RWC)
RWC is the water content per unit leaf mass that is related to its fully hydrated or fully
turgid state. It indicates the hydration state of the leaf. RWC is calculated as RWC = (fresh
weight -dry weight)/ (turgid weight -dry weight) (Flower and Ludlow, 1986). Relative water
content is often used as an index to measure dehydration tolerance (Anjum et al., 2011; Blum,
1996; Flower and Ludlow, 1986).
Drought tolerance of a plant is related to its ability to maintain high RWC in their leaves
under water deficit conditions (Bohnert and Jensen, 1996; Rampino et al., 2006; Suprunova
et al., 2004). Relative water content is related to water uptake by the roots and water loss by
transpiration. When plants are subjected to drought stress treatments, relative water content
decreased in wide variety of plants (Anjum et al., 2011; Nayyar and Walia, 2003).
High relative water content (RWC) was maintained by stomata closure and leaf area
reduction under water deficit conditions in cowpea (Vigna unguiculata) (Anyia and Herzog,
2004). Relative water content and leaf water potential ( ψw) of olive (Olea europaea L.) trees
decreased with increasing drought stress levels (Boussadia et al., 2008). Relative water
content, leaf water potential and transpiration were decreased under drought stress on wheat
(Triticum aestivum) and rice (Oryza sativa L.) (Siddique et al., 2000) and Hibiscus rosa-
sinensis (Egilla et al., 2005).
In pistachio (P. vera), RWC and water use efficiency (WUE) values vary with different
fruit growth stages and cultivars (Sajjadinia et al., 2010). The highest RWC among pistachio
cultivars were in Ohadi, Kaleghochi and Ahmadaghaii cultivars (Fotohi Ghazvini et al.,
2007). Under drought conditions, silicon (Si) supplementation improved plant growth and
increased relative water content in pistachio (Habibi and Hajiboland, 2013).
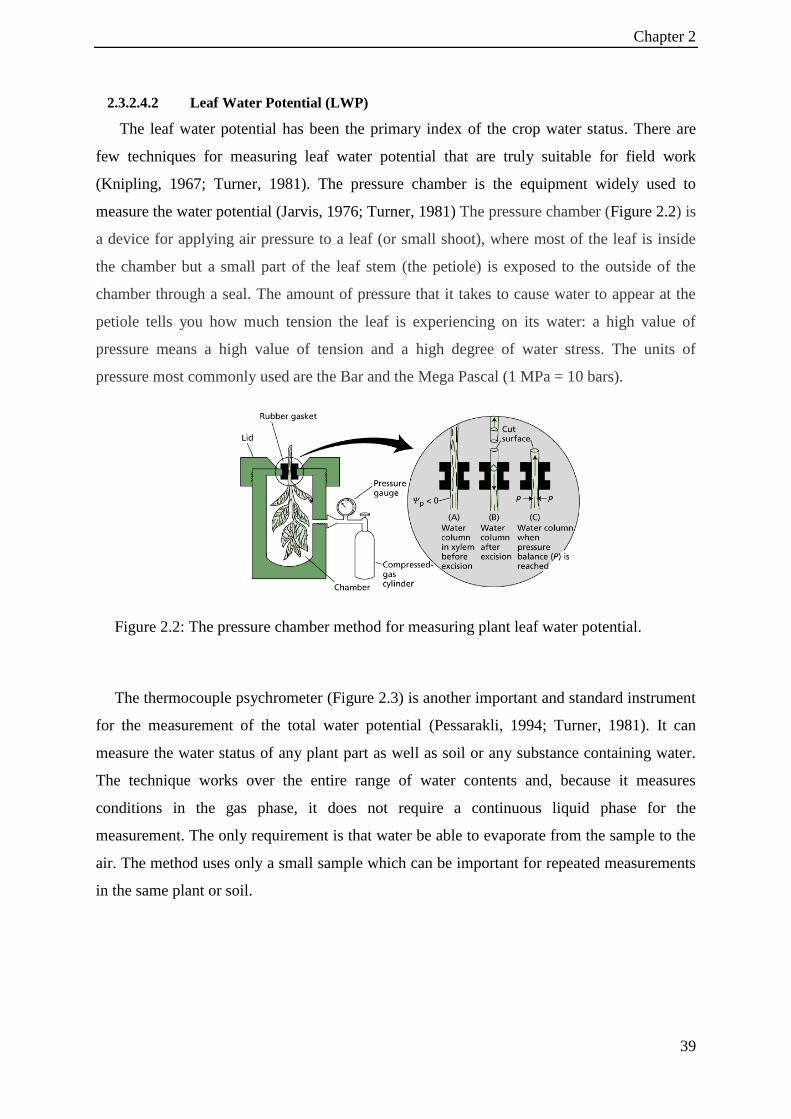
Chapter 2
39
2.3.2.4.2 Leaf Water Potential (LWP)
The leaf water potential has been the primary index of the crop water status. There are
few techniques for measuring leaf water potential that are truly suitable for field work
(Knipling, 1967; Turner, 1981). The pressure chamber is the equipment widely used to
measure the water potential (Jarvis, 1976; Turner, 1981) The pressure chamber (Figure 2.2) is
a device for applying air pressure to a leaf (or small shoot), where most of the leaf is inside
the chamber but a small part of the leaf stem (the petiole) is exposed to the outside of the
chamber through a seal. The amount of pressure that it takes to cause water to appear at the
petiole tells you how much tension the leaf is experiencing on its water: a high value of
pressure means a high value of tension and a high degree of water stress. The units of
pressure most commonly used are the Bar and the Mega Pascal (1 MPa = 10 bars).
Figure 2.2: The pressure chamber method for measuring plant leaf water potential.
The thermocouple psychrometer (Figure 2.3) is another important and standard instrument
for the measurement of the total water potential (Pessarakli, 1994; Turner, 1981). It can
measure the water status of any plant part as well as soil or any substance containing water.
The technique works over the entire range of water contents and, because it measures
conditions in the gas phase, it does not require a continuous liquid phase for the
measurement. The only requirement is that water be able to evaporate from the sample to the
air. The method uses only a small sample which can be important for repeated measurements
in the same plant or soil.
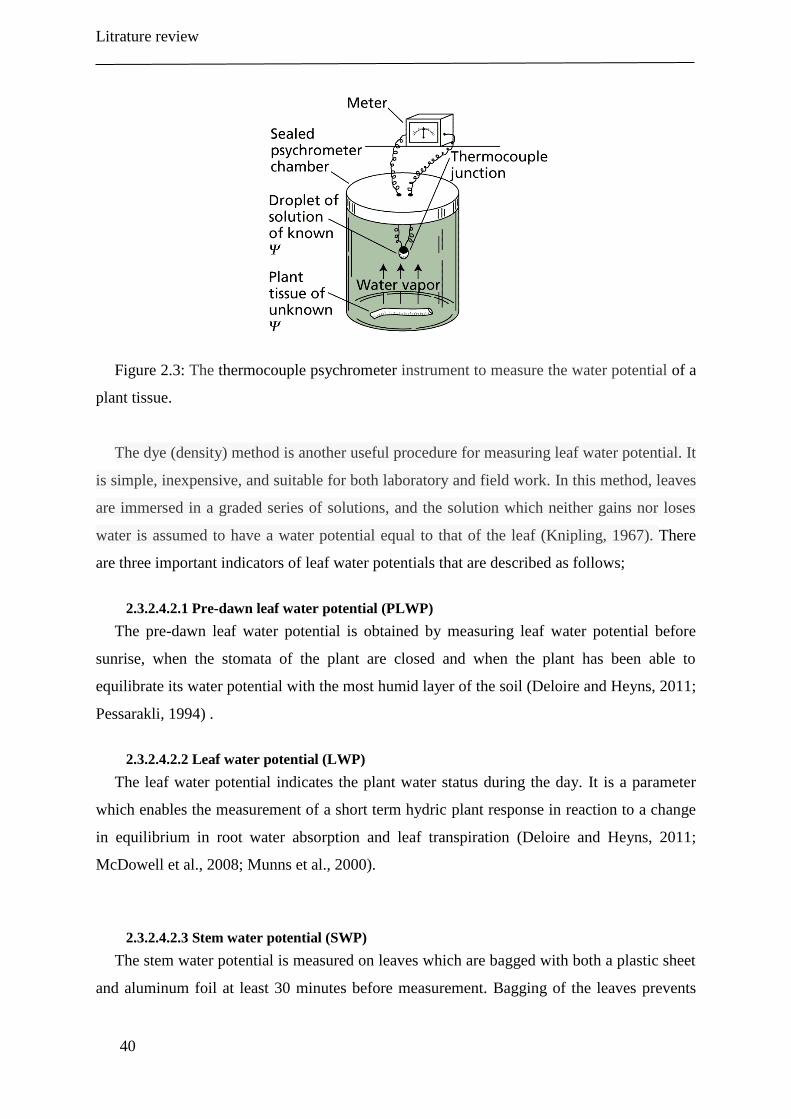
Litrature review
40
Figure 2.3: The thermocouple psychrometer instrument to measure the water potential of a
plant tissue.
The dye (density) method is another useful procedure for measuring leaf water potential. It
is simple, inexpensive, and suitable for both laboratory and field work. In this method, leaves
are immersed in a graded series of solutions, and the solution which neither gains nor loses
water is assumed to have a water potential equal to that of the leaf (Knipling, 1967). There
are three important indicators of leaf water potentials that are described as follows;
2.3.2.4.2.1 Pre-dawn leaf water potential (PLWP)
The pre-dawn leaf water potential is obtained by measuring leaf water potential before
sunrise, when the stomata of the plant are closed and when the plant has been able to
equilibrate its water potential with the most humid layer of the soil (Deloire and Heyns, 2011;
Pessarakli, 1994) .
2.3.2.4.2.2 Leaf water potential (LWP)
The leaf water potential indicates the plant water status during the day. It is a parameter
which enables the measurement of a short term hydric plant response in reaction to a change
in equilibrium in root water absorption and leaf transpiration (Deloire and Heyns, 2011;
McDowell et al., 2008; Munns et al., 2000).
2.3.2.4.2.3 Stem water potential (SWP)
The stem water potential is measured on leaves which are bagged with both a plastic sheet
and aluminum foil at least 30 minutes before measurement. Bagging of the leaves prevents
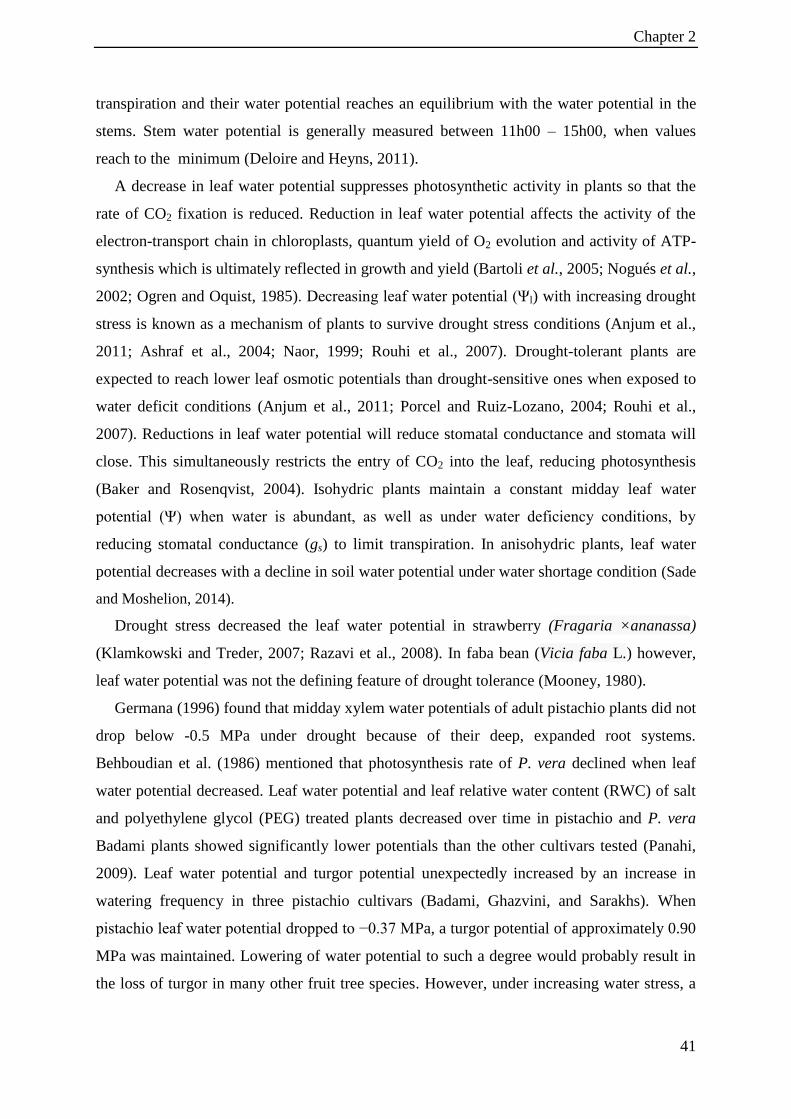
Chapter 2
41
transpiration and their water potential reaches an equilibrium with the water potential in the
stems. Stem water potential is generally measured between 11h00 – 15h00, when values
reach to the minimum (Deloire and Heyns, 2011).
A decrease in leaf water potential suppresses photosynthetic activity in plants so that the
rate of CO2 fixation is reduced. Reduction in leaf water potential affects the activity of the
electron-transport chain in chloroplasts, quantum yield of O2 evolution and activity of ATP-
synthesis which is ultimately reflected in growth and yield (Bartoli et al., 2005; Nogués et al.,
2002; Ogren and Oquist, 1985). Decreasing leaf water potential (Ψl) with increasing drought
stress is known as a mechanism of plants to survive drought stress conditions (Anjum et al.,
2011; Ashraf et al., 2004; Naor, 1999; Rouhi et al., 2007). Drought-tolerant plants are
expected to reach lower leaf osmotic potentials than drought-sensitive ones when exposed to
water deficit conditions (Anjum et al., 2011; Porcel and Ruiz-Lozano, 2004; Rouhi et al.,
2007). Reductions in leaf water potential will reduce stomatal conductance and stomata will
close. This simultaneously restricts the entry of CO2 into the leaf, reducing photosynthesis
(Baker and Rosenqvist, 2004). Isohydric plants maintain a constant midday leaf water
potential (Ψ) when water is abundant, as well as under water deficiency conditions, by
reducing stomatal conductance (gs) to limit transpiration. In anisohydric plants, leaf water
potential decreases with a decline in soil water potential under water shortage condition (Sade
and Moshelion, 2014).
Drought stress decreased the leaf water potential in strawberry (Fragaria ×ananassa)
(Klamkowski and Treder, 2007; Razavi et al., 2008). In faba bean (Vicia faba L.) however,
leaf water potential was not the defining feature of drought tolerance (Mooney, 1980).
Germana (1996) found that midday xylem water potentials of adult pistachio plants did not
drop below -0.5 MPa under drought because of their deep, expanded root systems.
Behboudian et al. (1986) mentioned that photosynthesis rate of P. vera declined when leaf
water potential decreased. Leaf water potential and leaf relative water content (RWC) of salt
and polyethylene glycol (PEG) treated plants decreased over time in pistachio and P. vera
Badami plants showed significantly lower potentials than the other cultivars tested (Panahi,
2009). Leaf water potential and turgor potential unexpectedly increased by an increase in
watering frequency in three pistachio cultivars (Badami, Ghazvini, and Sarakhs). When
pistachio leaf water potential dropped to −0.37 MPa, a turgor potential of approximately 0.90
MPa was maintained. Lowering of water potential to such a degree would probably result in
the loss of turgor in many other fruit tree species. However, under increasing water stress, a
Litrature review
42
significant decline in osmotic potential values was observed for all pistachio cultivars
(Tajabadipour et al., 2006).
2.3.2.4.3 Water Use Efficiency (WUE)
Water use efficiency is defined in many ways, depending on the scale of measurement and
the main purpose of the study. For plant physiologists, the basic unit of reduction could be
moles of carbon gained in photosynthesis (A) in relation to water used in transpiration (E) or
to stomatal conductance (gs), which permits the calculation of instantaneous WUE leaf (A/E)
or intrinsic WUE leaf (A/gs) (Monclus et al., 2006; Ricardo, 2012). Plants with higher WUE
are expected to better tolerate water-deficit conditions (Bartels and Sunkar, 2005; Larcher,
2003; Razavi, 2012; Taiz and Zeiger, 2010).
Drought stress considerably increased water-use efficiency compared to well-watered
plants in wheat (Abbate et al., 2004), although it had the opposite effect in maize (Zea mays)
(Anjum et al., 2011). Intrinsic water use efficiency, increased for Prunus dulcis with
increasing drought stress, while a different pattern was observed for P. lycioides and P.
scoparia, indicating non-stomatal processes prevail over stomatal limitations of the
assimilation process (Rouhi et al., 2007).
Ranjbarfordoei et al. (2002) reported that leaf water potential, leaf osmotic potential, net
photosynthetic rate, stomatal conductance and water use efficiency in two wild pistachio
species (Pistacia khinjuk and P. mutica) decreased as osmotic potential of the nutrient
solution decreased. Net assimilation rate (A), transpiration rate (E) and stomatal conductance
(gs) all were inhibited by exposure of pistachio plants to drought stress. Under silicon (Si)
application, water use efficiency (WUE) remained unchanged. Although application of
silicon on pistachio plants did not have a conservative effect on water loss because of
elevated stomatal conductance, Si might help plants to maintain their water balance despite
greater water loss, which might be due to a higher water uptake by stimulation of deeper and
stronger root system (Ahmed et al., 2011; Habibi and Hajiboland, 2013). It has been
demonstrated that the application of Si improves the water status of stressed plants (Shen et
al., 2010). Tavallali et al. (2009) mentioned that water use efficiency decreased under salinity
stress and zinc deficiency due to a decline in gs.
2.3.2.5 Osmolyte accumulation
Under drought, leaf turgor maintenance may be achieved by osmotic adjustment the
accumulation of proline, sucrose, soluble carbohydrates, glycine betaine, and other solutes in
Chapter 2
43
cytoplasm that improve water uptake from a drying soil (Anjum et al., 2011; Rhodes and
Samaras, 1994; Serraj and Sinclair, 2002). These compatible solutes not only help to maintain
turgor pressure but also to protect cell enzymes and macro molecules from the damaging
effects of reactive oxygen species (ROS) (Farooq et al., 2009b; Ricardo, 2012).
Osmotic stress in plants can result from many environmental conditions, including
drought, saline soil, low temperature, pathogen attack and mechanical wounding. These
undesirable conditions interfere with plant growth and development, leading to the reduction
in crop productivity (Luan, 2002). The accumulation of soluble carbohydrates in plants has
been widely reported as a response to salinity or drought, often accompanied by a significant
decrease in net CO2 assimilation rate (Popp and Smirnoff, 1995; Murakeozy et al., 2003).
Osmotic adjustment is a mechanism to maintain water relations under osmotic stress
(Farooq et al., 2009b), a key adaptation of plants to minimize the effects of drought-induced
damage (Blum, 2005) and helps plants under drought in two ways: it (1) helps maintain leaf
turgor to improve stomatal conductance for efficient intake of CO2 (Kiani et al., 2007), and
(2) promotes the root’s ability to take up more water (Chimenti et al., 2006). Effective control
of water loss through stomatal closure, leaf drop or water uptake by enhanced root growth
can improve plant water status. Osmotic adjustment through the active accumulation of
solutes in the cell sap, rather than through passive solute accumulation, resulting from
reduced cell volume can also contribute to turgor maintenance, and this is a precondition for
continued growth during drought (Clifford et al., 1998; Hsiao et al., 1976).
2.3.2.5.1 Proline
Proline is a multifunctional metabolite and functions as an osmolyte in osmotic
adjustment. It also acts as a stabilizer of sub-cellular structures; non-enzymatic antioxidant;
protect proteins and DNA by scavenging ROS; an energy sink; a source for carbon and
nitrogen and a stress-related signal under drought stress (Bartels and Sunkar, 2005; Matysik
et al., 2002; Nanjo et al., 1999; Zhu, 2002).
There are several reports that underline the significant effects of proline in stress tolerance.
Proline accumulation is a very common response of plants exposed to a water-deficit stress in
order to reduce cell injury (Anjum et al., 2011; Pérez-Pérez et al., 2009; Singh et al., 2000;
Wahid et al., 2007). Accumulation of proline under stress in many plant species has been
correlated with stress tolerance, and its concentration has been shown to be generally higher
in stress-tolerant than in stress-sensitive plants (Krasensky and Jonak, 2012; Szabados and
Savoure, 2010).
Litrature review
44
Proline contents increased under drought stress in pea (Pisum sativum) (Alexieva et al.,
2001), petunia (Petunia inflata) (Yamada et al., 2005), canola (Brassica napus L.) (Mirzaei et
al., 2013), maize (Zea mays) (Mohammadkhani and Heidari, 2008), jujube (Ziziphus
rotundifolia) (Arndt et al., 2001) and strawberry (Fragaria ananasa) (Razavi, 2012; Zhang
and Archbold, 1993). Fulda et al. (2011) reported the accumulation of inositol, glucose,
proline, fructose and sucrose in leaves of drought-stressed sunflower (Helianthus annuus).
Total free amino acids such as; proline, glutamic acid, glycine and lysine changed under
severe drought stress. Proline, which is often used as stress indicator, was not related to
drought stress in potted apple (Malus domestica) trees (Šircelj et al., 2005).
Drought stress increased proline content of arbuscular mycorrhiza (AM)-inoculated and
non-AM-inoculated pistachio plants compared with well-watered conditions (Abbaspour et
al., 2011). Free proline increased significantly with increasing salinity in leaves of Pistacia
atlantica subsp. atlantica (Benhassaini et al., 2012) and P. vera cv. Ghazvini rootstock
(Hokmabadi et al., 2005).
2.3.2.5.2 Carbohydrate
During drought stress, soluble sugars accumulate and starch levels decrease in leaves of
many plant species (Ingram and Bartels, 1996; Kempa et al., 2008), despite the reduction in
carbon fixation during drought stress due to both stomatal closure and down-regulation of the
Calvin cycle (Bartels and Sunkar, 2005; Xue et al., 2008).
In general, sugars can function as osmolytes to preserve cell turgor whereas they also have
the capacity to protect membranes and proteins from stress damage (Black and Pritchard,
2002; Krasensky and Jonak, 2012; Roitsch and González, 2004). Increased sucrose
concentration in drought-stressed leaves were accompanied by decreases in leaf starch
concentration in strawberry (Fragaria ananasa) (Razavi, 2012) and Ziziphus rotundifolia
seedlings (Arndt et al., 2001). In soybean (Glycine max), drought stress decreased leaf
sucrose and starch concentrations but increased hexose (glucose and fructose) concentrations
(Liu et al., 2004). Soluble sugar concentration increased in roots and shoots of maize
varieties when subjected to drought stress, but starch content significantly decreased in all
evaluated varieties (Mohammadkhani and Heidari, 2008). The contents of soluble sugars,
proteins, flavonoid and proline were higher in mycorrhizal than non-mycorrhizal plants under
whole-water regime in pistachio seedlings (Abbaspour et al., 2011).
Chapter 2
45
2.3.2.6 Root signaling under drought stress
Under drought stress conditions, roots induce a signal cascade to the shoots via xylem
causing physiological changes eventually determining the level of stress adaptation. Root-
shoot signals resulting from drought stress include abscisic acid (ABA), cytokinins, ethylene,
malate and other unidentified factors (Anjum et al., 2011; Jaleel et al., 2009; Sacks et al.,
1997; Wu and Cosgrove, 2000). Panahi (2009) reported that ABA-levels in Pistacia atlantica
subsp. mutica and P. vera Badami increased about 2-fold above the controls in drought-
exposed plants, whereas in P. vera Sarakhs it showed a 1.5-fold increase.
2.3.3 Effect of drought stress on biochemical characteristics
2.3.3.1 Reactive Oxygen Species (ROS)
The production of ROS in plants is an early event of plant defense response to biotic and
abiotic stress (Anjum et al., 2011; Hossain et al., 2011; Mittler et al., 2004), that generated
ROS in chloroplasts, mitochondria and peroxisomes in the cells (Gill and Tuteja, 2010;
Miller et al., 2010).
Under progressive drought stress, electron transport will be impaired followed by an
enhanced production of reactive oxygen species (Cornic and Fresneau, 2002; Cruz de
Carvalho, 2008; Gnaana Saraswathi and Paliwal, 2011). Overproduction of ROS in plant
cells under stress causes damage to proteins, lipids, carbohydrates and DNA which ultimately
results in oxidative stress (Gill and Tuteja, 2010; Rejeb et al., 2014), and leads to destruction
of photosynthetic pigments (Yordanov et al., 2000). Proline protects cell membranes against
the negative effects of ROS (Claussen, 2005; Matysik et al., 2002). Scavenging of ROS by
enzymatic and non-enzymatic systems, cell membrane stability, expression of aquaporin and
stress proteins are vital mechanisms of drought tolerance (Anjum et al., 2011; Farooq et al.,
2009b; Ricardo, 2012).
2.3.3.2 Antioxidant defense system
Inadequate water supply under drought stress conditions promotes oxidative stress with
overproduction of reactive oxygen species (ROS) (Apel and Hirt, 2004; Mittler et al., 2004).
There is an internal defensive system (antioxidant defense system) in plants to avoid ROS
injuries, thus guaranteeing normal cellular functioning (Apel and Hirt, 2004; Horváth et al.,
2007). Plants balance ROS through their antioxidant defense system with enzymatic and non-
enzymatic components (Apel and Hirt, 2004; Hussain et al., 2008; Simova-Stoilova et al.,
Litrature review
46
2008). Non-enzymatic antioxidants cooperate to maintain the integrity of the photosynthetic
membranes under oxidative stress. The enzymatic components may directly scavenge ROS or
may act by producing a non-enzymatic antioxidant (Anjum et al., 2011; Apel and Hirt, 2004;
Gill and Tuteja, 2010; Li, 2008; Scandalios, 2005).
Osmotic stress which is caused by water shortage conditions is often accompanied by
compatible solutes accumulation and ionic toxicity. Osmotic stress under saline conditions,
subjects plants to dehydration. Ionic toxicity results from the accumulation of specific ions,
such as Na and Cl, in the cytoplasm or apoplast which interferes with plant metabolic
functions. Under low to moderate salinity plants are adjusted osmotically by using part of
their photosynthetic products to increase internal solute concentrations and thus do not show
dehydration symptoms. Also, plants regulate their ionic balance to maintain normal
metabolism (Pessarakli, 1994; Taiz and Zeiger, 2010).
Pistachio seedlings evaluation showed that arbuscular mycorrhiza colonization improved
drought tolerance of P. vera seedlings by increasing the accumulation of osmotic adjustment
compounds, and nutritional and antioxidant enzyme activity (Abbaspour et al., 2011). With
the accumulation of solutes (soluble sugars, proteins, flavonoid, proline, phosphorous and
potassium), the osmotic potential of the cell is lowered, which attracts water into the cell and
helps with turgor maintenance. Osmotic adjustment helps to maintain the cell water balance
with the active accumulation of solutes in the cytoplasm, thereby minimizing the harmful
effects of drought (Maraghni et al., 2014; Rouhi, 2007; Taiz and Zeiger, 2010).
Silicon treatment increased catalase (CAT), and superoxide dismutase (SOD) activities
and decreased lipid peroxidation in leaves of drought-stressed pistachio plants (Habibi and
Hajiboland, 2013). Antioxidant enzymes (CAT and SOD) protect plant structural and
molecular components from the effects of ROS accumulated during drought stress (Apel and
Hirt, 2004).
2.3.3.3 Nutrient relations
Nutrients elements such as nitrogen (N), phosphorous (P), potassium (K+), calcium (Ca
2+)
and magnesium (Mg2+
) ions play multiple essential roles in plant metabolism (Alam, 1999;
Lahaye and Epstein, 1971). However, each of these nutrients must be maintained at an
optimum concentration range for suitable growth (Ali et al., 2008; Ashraf et al., 2013; Farooq
et al., 2009b).
Decreasing water availability under drought generally results in limited total nutrient
uptake and diminished tissue concentrations in crop plants (Farooq et al., 2009b). Normally,
Chapter 2
47
decrease in nutrient uptake under water-deficit conditions takes place due to a reduction in
transpiration rate (Ali et al., 2008; Jabeen et al., 2008; Tanguilig et al., 1987) and impaired
active transport and membrane permeability resulting in reduced root absorbing power
(Tanguilig et al., 1987).
Under drought stress conditions, available soil N (NO3- and NH4
+) and N2 fixation is
greatly reduced, and such reduction leads to low N accumulation and consequently low dry
matter production and low crop yield as was shown in peanut (Arachis hypogaea L.)
(Pimratch et al., 2008). Nutrient uptake in the latter plant was lower under drought stress
conditions compared to control condition (Junjittakarn et al., 2013).
Drought stress significantly decreased accumulation of essential nutrients (K+, Ca
2+, N,
and P) both in roots and shoots of canola (Brassica napus L.) cultivars (Ashraf et al., 2013)
and maize (Zea mays). However, exogenous application of proline promoted the uptake of
K+, Ca
2+, N and P in maize (Zea mays) cultivars (Ali et al., 2008).
Drought stress decreased N content in plants, root and shoot dry weight of Lactuca sativa
(Ruiz-Lozano and Azcón, 1996). Water stress caused a decrease in shoot biomass, nitrate
reductase activity and an increase in nitrate content in the roots of Vigna unguiculata (da
Silva et al., 2011; Silveira et al., 2001). Singh and Singh (2004) reported that calcium (Ca)
contents increased around 200% and 270 % in roots and leaves, respectively, in Dalbergia
sissoo seedlings under severe drought stress condition.
Fisher (1980) evaluated the responses of Stylosanthes humilis to water stress and found
that phosphorus concentration was greatly reduced by water stress; P concentration in stems
was more sensitive to stress than in leaves; and the P level returned to the same level as the
control after the relief of stress.
Arbuscular mycorrhiza (AM) colonization increased pistachio P content under drought
conditions. Results of Bagheri et al. (2012) also illustrated that AM symbiosis had a positive
role in Zn and Mn uptake, while Fe and Cu were not affected in this study. In a glasshouse
experiment, Ghasemi et al. (2015) reported that uptake of most of the mineral elements in
pistachio leaves and roots was reduced by drought stress.
In a glasshouse experiment, Afrousheh et al. (2010) showed that height, leaf area and leaf
number of pistachio seedlings decreased at various levels of nutrient element deficiencies.
They also revealed that fractions of chlorophyll, transpiration, stomata conduction and
stomatal resistance in treated seedlings, particularly N-deficient seedlings, significantly
declined.
Litrature review
48
In summary, drought stress reduces the availability, uptake, translocation and metabolism
of nutrients. A reduced transpiration rate due to water deficit reduces nutrient absorption and
efficiency of their utilization (Farooq et al., 2009b).
2.3.3.4 Carbon isotope discrimination
Carbon isotope discrimination (∆13
C) is a measure of the 13
C/12
C ratio in plant material
relative to the value of the same ratio in the air on which plants feed. The overall abundance
of 13
C relative to 12
C in plant tissue is commonly less than in the carbon of atmospheric
carbon dioxide, indicating that carbon isotope discrimination occurs in the incorporation of
CO2 into plant biomass (Condon et al., 2004; Farquhar et al., 1989). The carbon isotope
composition (δ13
C) is estimated by measurement of the 13
C/12
C ratio in a plant sample related
to the value of the same ratio in an accepted international standard, the limestone Pee Dee
Belemnite (PDB).
The dominant processes leading to carbon isotope discrimination are fractionations
associated with CO2 diffusion into leaf intracellular air spaces and with CO2 carboxylation by
the enzyme ribulose-1,5-bisphosphate carboxylase/ oxygenase (Rubisco= that catalysis CO2
fixation in the Calvin cycle) and during the diffusion of CO2 from the atmosphere to the
chloroplast (Farquhar and Sharkey, 1982). Discrimination against 13
C in leaves during
photosynthesis decreases with water stress, mainly because of the lowered stomatal
conductance (Farquhar and Richards, 1984; Farquhar et al., 1989; Yousfi et al., 2012b).
Plants show a positive discrimination (∆) against 13
C. Typically C3 plants have a
discrimination of 20 10-3, which is normally presented in the literature as 20 ‰ (per mil).
The discrimination factor of Rubisco is 29–30 per mil (‰), whereas discrimination during
diffusion in air and the liquid phase are 4.4 and 1.8‰, respectively. The advantage of
reporting ∆ is that it directly expresses the consequences of biological processes, whereas
composition, δp, is the result of both source isotopic composition and carbon isotope
discrimination (Farquhar et al., 1989). Some authors predicted a strong linear relationship
between carbon isotope discrimination (Δ) and the ratio of intercellular to ambient CO2
partial pressure (Ci/Ca). However, internal diffusion of the CO2 from the substomatal cavity
to site of Rubisco carboxylation in the chloroplast stroma also affects discrimination and
results in a dependency of Δ on photosynthetic rates. For example, Δ can vary by 6–8 ‰ with
variation in rates of photosynthesis driven by changes in light intensity (Evans, 1989;
Farquhar et al., 1989).
Chapter 2
49
Carbon isotope discrimination resolution (∆13
C) and carbon isotope composition (δ13
C) are
two commonly used indices in the stable carbon isotope discrimination. ∆13
C can reflect the
change of Ci/Ca [the ratio of leaf intercellular CO2 concentration (Ci) to the ambient
atmospheric CO2 concentration (Ca)] in a time interval and it can indirectly express the
deviation of the leaf intercellular 13
C/12
C related to the ambient atmosphere 13
C/12
C on the
basis of plant dry mass. Such carbon isotope discrimination can directly reflect the impendent
difference in carboxylation reaction of ribulose diphosphate carboxylase (RUBPC) and
phosphoenolpyruvate carboxylase (PEPC) as well as the diffusion of CO2 in the interior of
leaf (Dawson et al., 2002; Farquhar and Sharkey, 1982).
Negative correlations between ∆13
C and water use efficiency have been demonstrated in
many species (Farquhar et al., 1989). Carbon isotope discrimination has become a tool to
help us understand photosynthesis and its coordination with water use in ecological and
physiological studies of C3 species (Del Amor and Cuadra-Crespo, 2011; Farquhar et al.,
1989). These observations point to ∆13
C as a potential candidate for use in breeding for
greater agronomic water use efficiency (Condon et al., 2004).
The δ13
C of plant samples which is analyzed by an isotope mass-spectrometer can
integrate the carbon absorption of all organs and the change of photosynthetic characteristics
and physiological indices in the plant growth, so it can be used as a suitable parameter to
reveal the water stress effects. Thus it can evaluate the accuracy of mean leaf WUE
determined by the gas exchange (Cui et al., 2009; Su et al., 2004). Carbon isotope
composition (δ13
C) is measured by use of a mass spectrometer, which yields the following
ratio:
R= 13
CO2/12
CO2
The isotope composition of plants, δ13
C, is quantified on a per mil (‰) basis:
δ13
C ‰= (Rsample/Rstandard-1) ×1000
Where the standard represents the carbon isotopes contained in a fossil belemnite from the
Pee Dee limestone formation of South Carolina. The δ13
C of atmospheric CO2 has a value of
–8 ‰, meaning that there is less 13
C in the atmospheric CO2 than the one which is found in
the carbonate of the belemnite standard (Farquhar and Richards, 1984). C3 plants have a δ13
C
of about –28 ‰; C4 plants have an average value of –14 ‰ (Farquhar et al. 1 8 ). Both C3
and C4 plants have less
13C than the isotope standard, which means that there has been a
discrimination against 13
C during the photosynthetic process. Plants also fractionate other
isotopes, such as 15
N/14
N and 18
O/16
O, and the various patterns of isotope enrichment or
Litrature review
50
depletion can be used as indicators of particular metabolic pathways or features (Cernusak et
al., 2008).
The analysis of the natural abundances of stable carbon isotopes in plant dry matter (δ13
C)
provides information on the long-term water use efficiency of plants, and values of δ13
C are
determined mainly by three processes: diffusion of CO2 through stomata, CO2 assimilation by
carboxylase, and metabolism of compounds (Farquhar et al., 1989).
The carbon isotope discrimination (∆13
C) of shoots is calculated as:
∆13C (‰) = (δ
13Ca- δ
13Cp)/ [1+ (δ
13Cp) /1000]
Where the subscripts a and p refer to air and the plant, respectively (Farquhar et al., 1989).
Root and shoot carbon isotope composition (δ13
C) levels increased in drought stress
treatments compared with control in durum wheat (Triticum turgidum L.). Livingston et al.
(1999) demonstrated there was a positive relation between δ13
C, WUE and dry matter
production, so that it should be possible to use δ13
C as a surrogate for WUE, and to select for
increased WUE without compromising yield, even in nitrogen deficient environments in
irrigated and dry land white spruce (Picea glauca (Moench) Voss) seedlings. Results of a
greenhouse experiment on Populus deltoids clones under water stress conditions showed that
there was a good positive correlation between δ13
C and leaf WUE (WUEL) in the same
water treatment, and that a high WUEL always coincided with a high δ13
C. Therefore, the
authors concluded that carbon isotope composition (δ13
C) might be a reliable indirect index
to estimate WUEL among P. deltoids clones (Zhao et al., 2006a).
Carbon isotope discrimination (Δ) decreased with increasing salinity in leaves, stems and
roots of pistachio (P. vera) seedlings. However, there was no significant difference in carbon
isotope discrimination between three P. vera (Sarakhs, Badami-Zarand, and Ghazvini)
rootstocks under the same treatments (Hokmabadi et al., 2005). Carbon isotope ratios of
Pistacia lentiscus, Quercus ilex and Phillyrea argustifoli showed similar δ13
C values, while
two deciduous oak species, had lower δ13
C values in a Mediterranean ecosystem (Valentini et
al., 1992), therefore these results show that the carbon isotope discrimination values can vary
in different plant species.
2.3.3.5 Nitrogen isotope discrimination
Nitrogen exists as two naturally occurring stable isotopes, 15
N and 14
N. Variation in the
absolute abundance of 15
N is small, therefore, nitrogen isotope composition is expressed
using δ notation in parts per thousand (per mil):
δ15
N= (Rsample/Rstandard -1) × 1000 ‰
Chapter 2
51
Where δ15
N is the isotope ratio related to the atmospheric air standard, and R sample and
R standard are the molar ratios of the heavier to the lighter isotope. Atmospheric nitrogen is
the internationally recognized standard with an R value of (15
N/14
N)std of 0.0036765 (Poupin
et al., 2014). Differences in δ15
N between a substrate and product will occur when 15
N and
14N react at different rates.
The nitrogen isotope discrimination (∆15
N) is calculated as:
∆15N (‰) = (δ
15Na- δ
15Np)/ (1+ (δ
15Np) /1000)
Where the subscripts a and p refer to air (standard) and the plant (sample), respectively
(Farquhar et al., 1989).
The natural variation in plant N isotope composition (δ15
N) is potentially useful for
genotypic screening under drought or salinity because it is linked to N metabolism, even
though a complete knowledge of the underlying biochemical mechanisms is lacking
(Cernusak et al., 2008). Isotope fractionation may occur during enzymatic assimilation of
nitrate or ammonium into other N forms.
Discrimination is positive in most biological systems; therefore, the product should have a
lower δ15
N value than the substrate (Farquhar 1989). Water availability is the primary
environmental factor controlling the variability of plant δ13C and δ
15N and soil δ
13C in the
arid and semi-arid regions (Ma et al., 2012). The stable nitrogen isotope ratio (δ15
N) in the
fruit mesocarp of peach trees (Prunus persica) was significantly related to the amount of N
applied and the origin of this N. The nitrogen isotope ratio did not, however, exhibit a good
discriminative capacity when they evaluated the influence of water and nitrogen on plant
response (Pascual et al., 2013).
Root δ15
N increased in all stress treatments in dry matter of durum wheat (Triticum
aestivum), showing the highest values in the two most stressful treatments. By contrast, stress
treatments significantly decreased shoot δ15
N (Yousfi et al., 2012b).
Moreover, root nitrogen isotope composition (δ15
N) increased in stressed treatments,
although stress treatments significantly decreased shoot δ15
N in durum wheat (Yousfi et al.,
2012a). High salt concentrations significantly decreased nitrogen isotope discrimination in
leaf dry matter of broccoli (Brassica oleracea L.) (Del Amor and Cuadra-Crespo, 2011).
Effects of osmotic drought stress on physiological responses, growth characteristics, mineral
elements and carbon isotope composition of three pistachio (Pistacia spp.) rootstocks
52
Effects of osmotic drought stress on physiological Chapter 3.
responses, growth characteristics, mineral elements and
carbon isotope composition of three pistachio (Pistacia spp.)
rootstocks
Adapted from:
Esmaeilpour, A., M.C. Van Labeke, R. Samson, P. Boeckx and P. Van Damme. 2015. Impact
of osmotic drought stress on carbon isotope discrimination and growth parameters in three
pistachio rootstocks. XVI GREMPA Meeting on Almonds and Pistachios. May 12-14,
Meknes, Morocco.
Esmaeilpour, A., M. C. Van Labeke, R. Samson, P. Boeckx and P. Van Damme. 2017.
Effects of osmotic drought stress on physiological responses, growth characteristics, mineral
elements and carbon isotope composition of three pistachio rootstocks (submitted to journal).
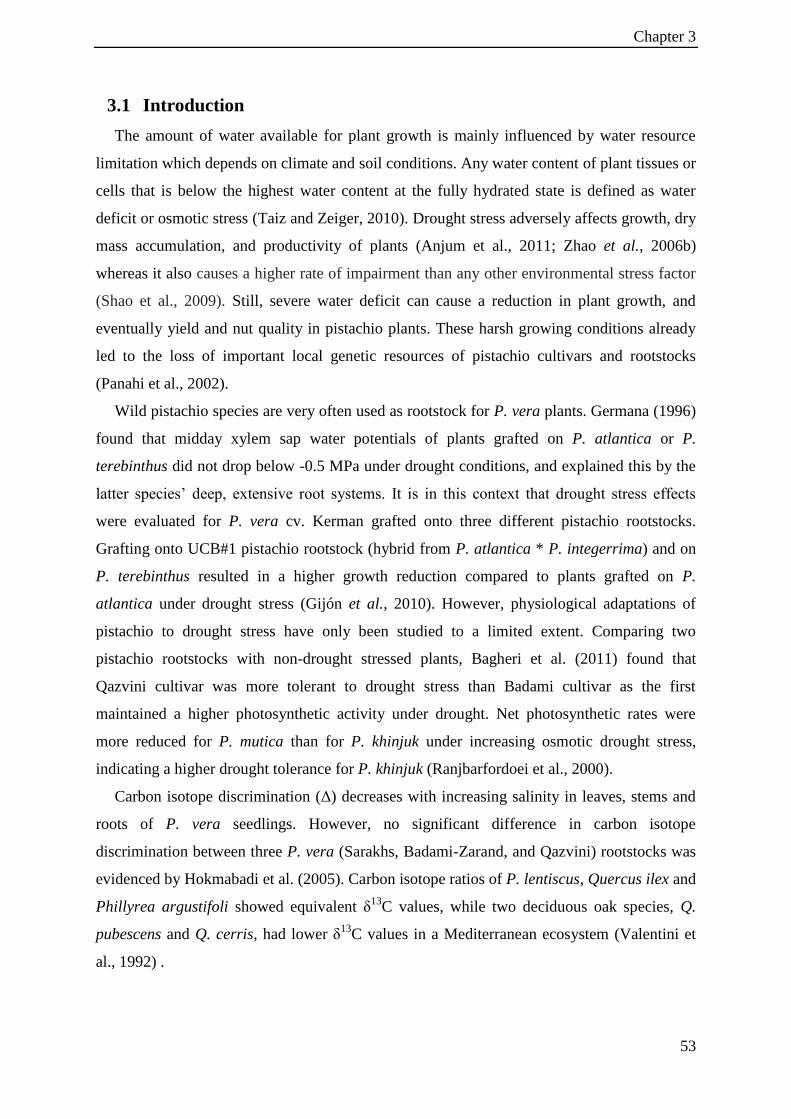
Chapter 3
53
3.1 Introduction
The amount of water available for plant growth is mainly influenced by water resource
limitation which depends on climate and soil conditions. Any water content of plant tissues or
cells that is below the highest water content at the fully hydrated state is defined as water
deficit or osmotic stress (Taiz and Zeiger, 2010). Drought stress adversely affects growth, dry
mass accumulation, and productivity of plants (Anjum et al., 2011; Zhao et al., 2006b)
whereas it also causes a higher rate of impairment than any other environmental stress factor
(Shao et al., 2009). Still, severe water deficit can cause a reduction in plant growth, and
eventually yield and nut quality in pistachio plants. These harsh growing conditions already
led to the loss of important local genetic resources of pistachio cultivars and rootstocks
(Panahi et al., 2002).
Wild pistachio species are very often used as rootstock for P. vera plants. Germana (1996)
found that midday xylem sap water potentials of plants grafted on P. atlantica or P.
terebinthus did not drop below -0.5 MPa under drought conditions, and explained this by the
latter species’ deep, extensive root systems. It is in this context that drought stress effects
were evaluated for P. vera cv. Kerman grafted onto three different pistachio rootstocks.
Grafting onto UCB#1 pistachio rootstock (hybrid from P. atlantica * P. integerrima) and on
P. terebinthus resulted in a higher growth reduction compared to plants grafted on P.
atlantica under drought stress (Gijón et al., 2010). However, physiological adaptations of
pistachio to drought stress have only been studied to a limited extent. Comparing two
pistachio rootstocks with non-drought stressed plants, Bagheri et al. (2011) found that
Qazvini cultivar was more tolerant to drought stress than Badami cultivar as the first
maintained a higher photosynthetic activity under drought. Net photosynthetic rates were
more reduced for P. mutica than for P. khinjuk under increasing osmotic drought stress,
indicating a higher drought tolerance for P. khinjuk (Ranjbarfordoei et al., 2000).
Carbon isotope discrimination (Δ) decreases with increasing salinity in leaves, stems and
roots of P. vera seedlings. However, no significant difference in carbon isotope
discrimination between three P. vera (Sarakhs, Badami-Zarand, and Qazvini) rootstocks was
evidenced by Hokmabadi et al. (2005). Carbon isotope ratios of P. lentiscus, Quercus ilex and
Phillyrea argustifoli showed equivalent δ13
C values, while two deciduous oak species, Q.
pubescens and Q. cerris, had lower δ13
C values in a Mediterranean ecosystem (Valentini et
al., 1992) .
Effects of osmotic drought stress on physiological responses, growth characteristics, mineral
elements and carbon isotope composition of three pistachio (Pistacia spp.) rootstocks
54
Root and shoot δ13
C values increased in stress treatments compared with those of full-
irrigation plants in durum wheat (Triticum turgidum L.), but in the latter case, the highest
values were observed under the most stressful conditions (Yousfi et al., 2012a).
Stable carbon isotope ratio (δ13
C) in fruit of peach trees (Prunus persica L.) proved a
reliable indicator of plant water status and physiological water use efficiency (WUE). Leaf
carbon isotope ratio was not affected by either irrigation or nitrogen (N) treatments (Pascual
et al., 2013). Salinity significantly increased carbon isotope discrimination in dry leaf matter
of broccoli (Brassica oleracea L.) (Del Amor and Cuadra-Crespo, 2011).
There are three pistachio species (P. vera, P. khinjuk and P. atlantica subspecies mutica)
in Iran (Esmaeilpour and Khezri, 2006) which are growing under different environmental
conditions (altitude 900-2000 m; latitude 24-37 N; temperatures ranging between −20 °C in
winter and 42 °C in summer, low to moderate humidity, and long, hot summers). Response to
osmotic drought stress of two of these three species (P. khinjuk and P. atlantica subspecies
mutica) have been investigated by Fardooei (2001). Pistacia vera L. is the country’s most
common rootstock. Yet, physiological responses of this rootstock to drought stress and
comparison with other recommended rootstocks have not been studied extensively.
The aim of the present study was to evaluate the effects of osmotic drought stress
treatment and subsequent recovery period on physiological performance of P. vera cv.
Badami, P. vera cv. Sarakhs (native), and P. terebinthus rootstocks (used in Turkey). Plant
responses were assessed via chlorophyll fluorescence, mineral element content, carbon
isotope composition and a number of growth characteristics. We hypothesized that
chlorophyll fluorescence, and carbon isotope composition could be used as indices for the
selection of drought-tolerant pistachio rootstocks.
3.2 Materials and methods
3.2.1 Plant material and experimental set-up
This study was carried out in a glasshouse of the Faculty of Bioscience Engineering,
Ghent University (51°3' N, 3°42' E). Certified seeds of Pistacia vera L. cv. Badami (BA) and
P. vera L. cv. Sarakhs (SA) (Figure 3.1, A and B) were obtained from the Iranian Pistachio
Research Institute (IPRI), Rafsanjan, Iran. P. terebinthus (TER) seeds were obtained from the
pistachio production areas in Gaziantep, Turkey (Figure 3.1, C). Badami and Sarakhs seeds
were first soaked in water for 12 hours and then pre-treated for 20 minutes with 0.01% captan
(N-trichloromethyl-thio-tetrahydro phthalimide) solution, a broad-spectrum fungicide (Panahi
Chapter 3
55
et al., 2002). Seeds of P. terebinthus were scarified with sulfuric acid for 10 min and
subsequently washed three times in distilled water. In June 2010, seeds were sown in 4-L
pots containing sand and organic material. Planting were managed according to good
agricultural management as described by Panahi et al. (2002) during the first growing season.
In March 2011, seedlings were transplanted to 5-L pots filled with vermiculite. Transplanted
1-year-old seedlings were grown hydroponically in a controlled glasshouse environment
using standard Hoagland (See Appendix 3- chapter 3) solution (Picchioni et al., 1991) for
fertigation (Figure 3.2). Averages of minimum and maximum temperatures in the glasshouse
were 15 ºC and 36 ºC, respectively.
Figure 3.1: Seeds of different pistachio rootstocks (A- Pistacia vera cv. Badami; B- P.
vera cv. Sarakhs and C- P. terebinthus) to study the response of pistachio seedlings to water
deficit induced by PEG at varying water potentials in nutrient solution under glasshouse
conditions.
In May 2011, osmotic drought treatments were applied. They consisted of a control
(osmotic potential of the nutrient solution (Ψs) = -0.10 MPa) and three drought stress levels
(mild stress, Ψs= -0. 5 MPa, moderate stress Ψs= - 1.0 MPa and severe stress, Ψs= -1.5 MPa)
using PEG 6000 (Ranjbarfordoei et al., 2002). The concentration of PEG 6000 (g kg -1
water)
was determined for each drought stress treatment according to the Michel BE and Kaufmann
(1973) equation which is as follows:
(3.1)
Effects of osmotic drought stress on physiological responses, growth characteristics, mineral
elements and carbon isotope composition of three pistachio (Pistacia spp.) rootstocks
56
Where:
Ѱs is osmotic potential of aqueous solution in bar, C is concentration of PEG in g/kg water,
T is temperature of the aqueous solution, in C (here 23 to 25 C). Final water potential for
each treatment was calculated using the following equation according to Michel BE and
Kaufmann (1973).
(3.2)
(3.3)
Where:
Ѱs is osmotic potential of irrigation water, ѰPEG is osmotic potential of PEG 6000 in pure
water, Ѱf is osmotic potential of fertilizer (Here, Hoagland solution), Ѱsy is synergy effect
potential between PEG 6000 and fertilizer. The osmotic potential of Hoagland solution in the
tap water was -0.08 MPa. For example, water potential of 180 g PEG in one kg water at 25 C
with Hoagland solution is:
ѰPEG= -0.41 MPa potential of PEG 6000 in pure water, Ѱf = -0.08 MPa potential produced
by fertilizer, Ѱsy = 0.07 × [(-0.41) + (-0.08)] = -0.343 MPa potential of synergistic effect, Ѱs =
(-0.41) + (-0.08) + (-0.0343) = -0.52 MPa final water potential.
Stress levels were maintained for two weeks; then all solutions were replaced by the
control treatment, and this level was maintained for two recovery weeks.
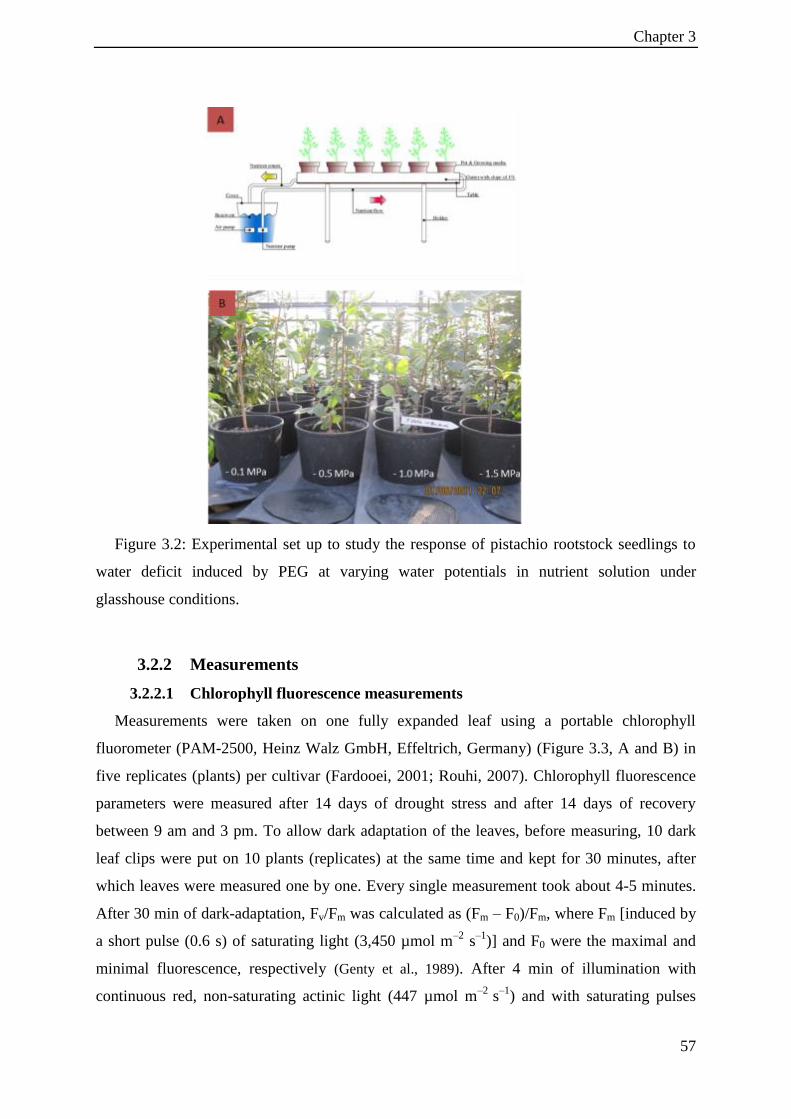
Chapter 3
57
Figure 3.2: Experimental set up to study the response of pistachio rootstock seedlings to
water deficit induced by PEG at varying water potentials in nutrient solution under
glasshouse conditions.
3.2.2 Measurements
3.2.2.1 Chlorophyll fluorescence measurements
Measurements were taken on one fully expanded leaf using a portable chlorophyll
fluorometer (PAM-2500, Heinz Walz GmbH, Effeltrich, Germany) (Figure 3.3, A and B) in
five replicates (plants) per cultivar (Fardooei, 2001; Rouhi, 2007). Chlorophyll fluorescence
parameters were measured after 14 days of drought stress and after 14 days of recovery
between 9 am and 3 pm. To allow dark adaptation of the leaves, before measuring, 10 dark
leaf clips were put on 10 plants (replicates) at the same time and kept for 30 minutes, after
which leaves were measured one by one. Every single measurement took about 4-5 minutes.
After 30 min of dark-adaptation, Fv/Fm was calculated as (Fm – F0)/Fm, where Fm [induced by
a short pulse (0.6 s) of saturating light (3,450 µmol m–2
s–1
)] and F0 were the maximal and
minimal fluorescence, respectively (Genty et al., 1989). After 4 min of illumination with
continuous red, non-saturating actinic light (447 µmol m–2
s–1
) and with saturating pulses
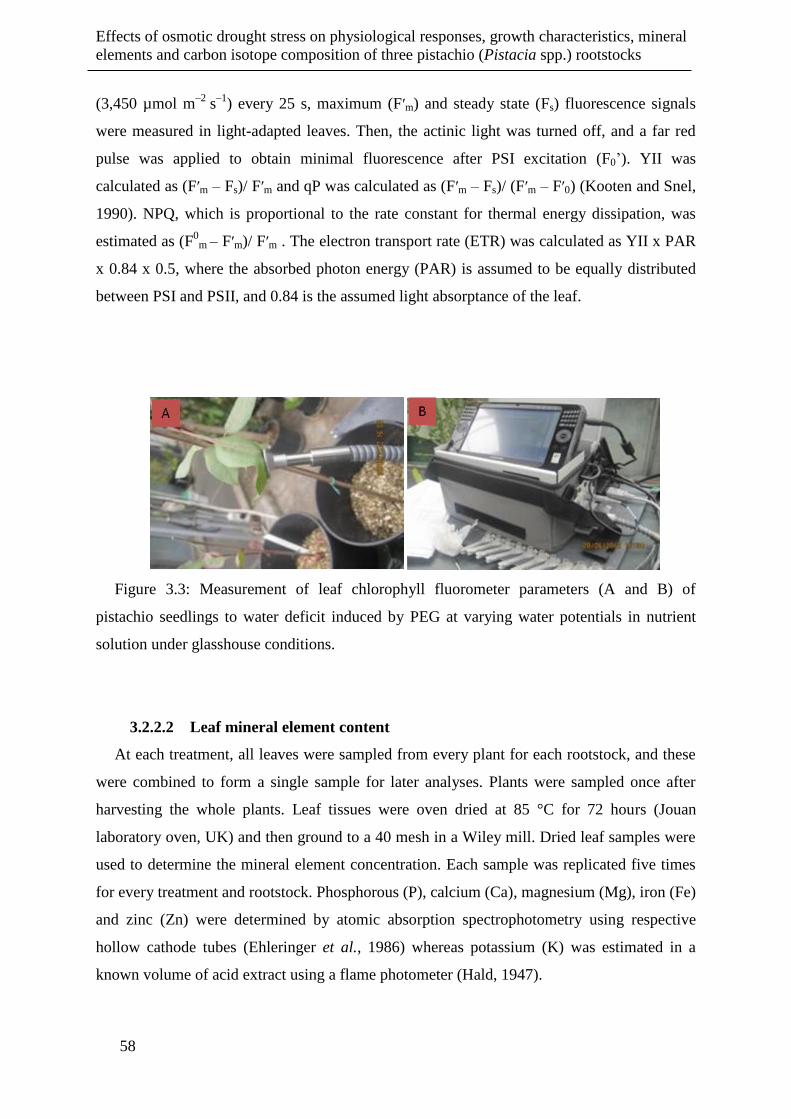
Effects of osmotic drought stress on physiological responses, growth characteristics, mineral
elements and carbon isotope composition of three pistachio (Pistacia spp.) rootstocks
58
(3,450 µmol m–2
s–1
) every 25 s, maximum (Fʹm) and steady state (Fs) fluorescence signals
were measured in light-adapted leaves. Then, the actinic light was turned off, and a far red
pulse was applied to obtain minimal fluorescence after PSI excitation (F0’). YII was
calculated as (Fʹm – Fs)/ Fʹm and qP was calculated as (Fʹm – Fs)/ (Fʹm – Fʹ0) (Kooten and Snel,
1990). NPQ, which is proportional to the rate constant for thermal energy dissipation, was
estimated as (F0
m – Fʹm)/ Fʹm . The electron transport rate (ETR) was calculated as YII x PAR
x 0.84 x 0.5, where the absorbed photon energy (PAR) is assumed to be equally distributed
between PSI and PSII, and 0.84 is the assumed light absorptance of the leaf.
Figure 3.3: Measurement of leaf chlorophyll fluorometer parameters (A and B) of
pistachio seedlings to water deficit induced by PEG at varying water potentials in nutrient
solution under glasshouse conditions.
3.2.2.2 Leaf mineral element content
At each treatment, all leaves were sampled from every plant for each rootstock, and these
were combined to form a single sample for later analyses. Plants were sampled once after
harvesting the whole plants. Leaf tissues were oven dried at 85 °C for 72 hours (Jouan
laboratory oven, UK) and then ground to a 40 mesh in a Wiley mill. Dried leaf samples were
used to determine the mineral element concentration. Each sample was replicated five times
for every treatment and rootstock. Phosphorous (P), calcium (Ca), magnesium (Mg), iron (Fe)
and zinc (Zn) were determined by atomic absorption spectrophotometry using respective
hollow cathode tubes (Ehleringer et al., 1986) whereas potassium (K) was estimated in a
known volume of acid extract using a flame photometer (Hald, 1947).
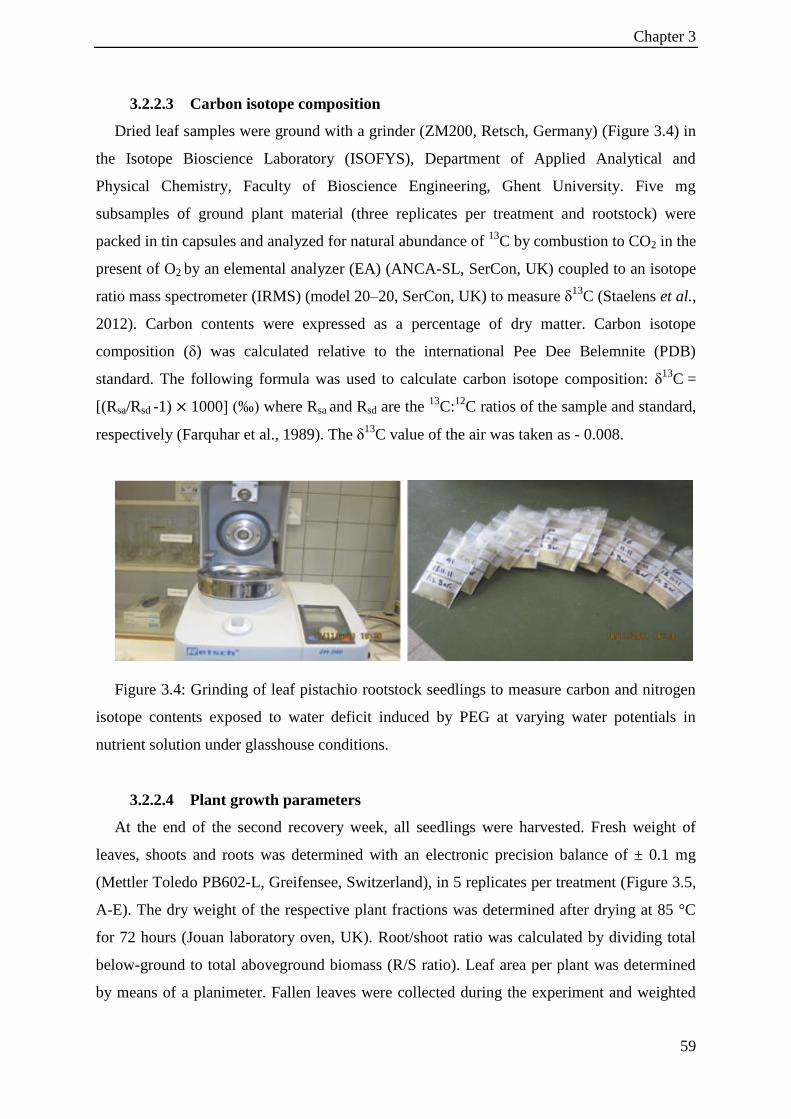
Chapter 3
59
3.2.2.3 Carbon isotope composition
Dried leaf samples were ground with a grinder (ZM200, Retsch, Germany) (Figure 3.4) in
the Isotope Bioscience Laboratory (ISOFYS), Department of Applied Analytical and
Physical Chemistry, Faculty of Bioscience Engineering, Ghent University. Five mg
subsamples of ground plant material (three replicates per treatment and rootstock) were
packed in tin capsules and analyzed for natural abundance of 13
C by combustion to CO2 in the
present of O2 by an elemental analyzer (EA) (ANCA-SL, SerCon, UK) coupled to an isotope
ratio mass spectrometer (IRMS) (model 20–20, SerCon, UK) to measure δ13
C (Staelens et al.,
2012). Carbon contents were expressed as a percentage of dry matter. Carbon isotope
composition (δ) was calculated relative to the international Pee Dee Belemnite (PDB)
standard. The following formula was used to calculate carbon isotope composition: δ13
C =
[(Rsa/Rsd -1) 1000] (‰) where Rsa and Rsd are the 13
C:12
C ratios of the sample and standard,
respectively (Farquhar et al., 1989). The δ13
C value of the air was taken as - 0.008.
Figure 3.4: Grinding of leaf pistachio rootstock seedlings to measure carbon and nitrogen
isotope contents exposed to water deficit induced by PEG at varying water potentials in
nutrient solution under glasshouse conditions.
3.2.2.4 Plant growth parameters
At the end of the second recovery week, all seedlings were harvested. Fresh weight of
leaves, shoots and roots was determined with an electronic precision balance of ± 0.1 mg
(Mettler Toledo PB602-L, Greifensee, Switzerland), in 5 replicates per treatment (Figure 3.5,
A-E). The dry weight of the respective plant fractions was determined after drying at 85 °C
for 72 hours (Jouan laboratory oven, UK). Root/shoot ratio was calculated by dividing total
below-ground to total aboveground biomass (R/S ratio). Leaf area per plant was determined
by means of a planimeter. Fallen leaves were collected during the experiment and weighted
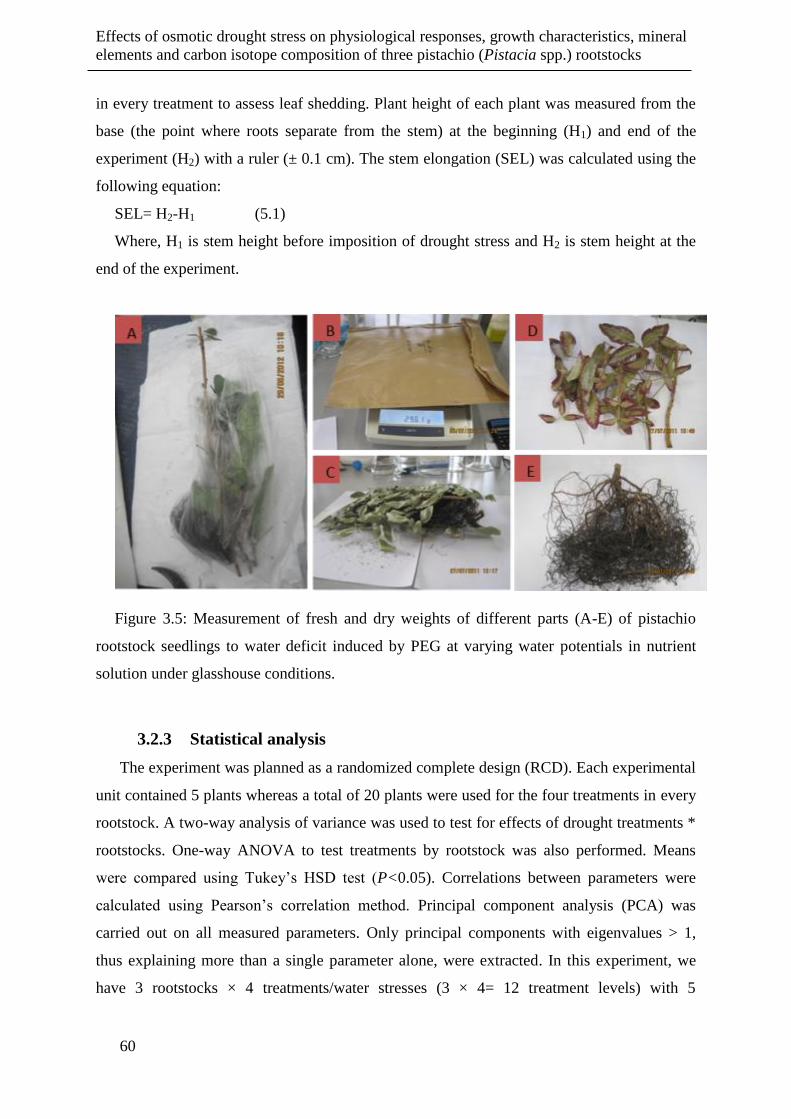
Effects of osmotic drought stress on physiological responses, growth characteristics, mineral
elements and carbon isotope composition of three pistachio (Pistacia spp.) rootstocks
60
in every treatment to assess leaf shedding. Plant height of each plant was measured from the
base (the point where roots separate from the stem) at the beginning (H1) and end of the
experiment (H2) with a ruler (± 0.1 cm). The stem elongation (SEL) was calculated using the
following equation:
SEL= H2-H1 (5.1)
Where, H1 is stem height before imposition of drought stress and H2 is stem height at the
end of the experiment.
Figure 3.5: Measurement of fresh and dry weights of different parts (A-E) of pistachio
rootstock seedlings to water deficit induced by PEG at varying water potentials in nutrient
solution under glasshouse conditions.
3.2.3 Statistical analysis
The experiment was planned as a randomized complete design (RCD). Each experimental
unit contained 5 plants whereas a total of 20 plants were used for the four treatments in every
rootstock. A two-way analysis of variance was used to test for effects of drought treatments *
rootstocks. One-way ANOVA to test treatments by rootstock was also performed. Means
were compared using Tukey’s HSD test (P<0.05). Correlations between parameters were
calculated using Pearson’s correlation method. Principal component analysis (PCA) was
carried out on all measured parameters. Only principal components with eigenvalues > 1,
thus explaining more than a single parameter alone, were extracted. In this experiment, we
have 3 rootstocks × 4 treatments/water stresses (3 × 4= 12 treatment levels) with 5
Chapter 3
61
replications and 21 variables/vectors. Therefore, we applied PCA to a 60 × 21 matrix. In the
biplot the mean values of the replications were inserted, while all data were used for PCA and
all other statistical analyses. Multivariate analysis of variance (MANOVA) was conducted for
all cultivars and measured parameters. A normality test of data distribution was conducted
using descriptive statistical parameters and a homogeneity test was done to see diverse data
using Levene’s test of equality of error variance by SPSS software. All analyses were
performed in SPSS 20 (IBM Corporation, USA).
3.3 Results
3.3.1 Multivariate analysis of variance (MANOVA)
The MANOVA analysis (Table 3.1) revealed significant differences among three
rootstocks indicating the presence of genotypic variability. There are significant differences
among four drought stress conditions (treatments) by considering all parameters. Interaction
effect of rootstock * treatment was significant, indicating different responses of genotypes to
water stress condition and possible selection of drought tolerant genotypes under water
deficit.
Table 3.1: Multivariate analysis of variance (MANOVA) for all measured parameters
under different environmental conditions in three pistachio rootstocks.
3.3.2 Chlorophyll fluorescence
Increasing osmotic drought stress significantly decreased quantum yield of photosystem II
(YII) and photochemical quenching (qP) during drought stage in all three rootstocks, but
differences were not significant between drought stress treatments (Table 3.2). No significant
Effect Test Value F Hypothesis df Error df Sig.
Rootstock Roy's Largest Root 561.22 51.02 22 2 0.019
Treatment Roy's Largest Root 134.41 18.33 22 3 0.017
Rootstock* Treatment Roy's Largest Root 651.90 177.79 22 6 <0.001
Block Roy's Largest Root 217.02 19.73 22 2 0.05
Effects of osmotic drought stress on physiological responses, growth characteristics, mineral
elements and carbon isotope composition of three pistachio (Pistacia spp.) rootstocks
62
differences in maximum quantum yield of PSII (Fv/Fm,) and non-photochemical quenching
(NPQ) under increasing stress were observed for the three rootstocks compared with control
plants (Table 3.2). At drought stage, values for YII and qP in Badami were higher (P< 0.01)
than Sarakhs and P. terebinthus rootstocks, while NPQ was higher in P. terebinthus
compared to the other two rootstocks (Table 3.2).
During recovery, Fv/Fm ratios and YII remained lower compared to the parameters levels
in control plants in Terebinthus and Sarakhs, although there were no significant differences
between the applied drought stress treatments. Values of qP in exposed plants also were
lower than corresponding control plants in P. terebinthus rootstock (Table 3.2). Overall, the
effects of drought stress treatments on the above-measured parameters (Fv/Fm ratios, YII and
qP) were significantly lower after two weeks of recovery, as values of YII and qP were the
highest in Badami, NPQ was highest in P. terebinthus and Fv/Fm was highest in Sarakhs in
recovery stage (data not shown).
ANOVA analysis showed that rootstock effects on all chlorophyll fluorescence parameters
were significant during both drought and recovery stages (except Fv/Fm in drought). Effects
of treatments on YII, qP (P< 0.01) in drought stage and on Fv/Fm, YII (P< 0.01) and qP (P<
0.05) were significant in recovery stage. Rootstocks x treatments interaction were not
significant for any parameters (except NPQ) during drought and recovery stages (Table 3.2).
3.3.3 Plant growth parameters
Drought stress significantly decreased plant fresh weight (PFW), plant dry weight (PDW),
shoot dry weight (SDW) and leaf dry weight (LDW) compared to the control plants in P.
terebinthus rootstock, though differences between drought stress treatments were not
significant (Table 3.3). There were no significant differences between drought stress
treatments and the control treatment for these parameters in Badami and Sarakhs rootstocks.
Although root dry weights were not affected by osmotic stress treatments, root/shoot ratio
increased in all three rootstocks and it was significant in Badami rootstock (Table 3.3).
Plant’s leaf area was significantly decreased by drought stress treatments in Badami and P.
terebinthus, though there was no significant difference between control and drought-exposed
plants in Sarakhs. Control plants showed stem elongation during the experimental period, but
significant growth arrest were noted under drought stress treatments in all three rootstocks
(Table 3.3). Decreasing osmotic potential of the nutrient solution increased leaf shedding
contents, although differences were not significant (Table 3.3). Effects of rootstocks were
Chapter 3
63
significant for all growth parameters, while treatment effects were significant for PFW,
PDW, SDW, LDW, R/S ratio, leaf area and stem elongation. ANOVA analysis showed that
interaction effects were not significant for any parameter, except for leaf area and stem
elongation (Table 3.3). Terebinthus rootstock showed the highest values for the considered
biomass parameters, leaf area and stem elongation, whereas Badami had the most pronounced
leaf shedding compared to the other rootstocks (data not shown).
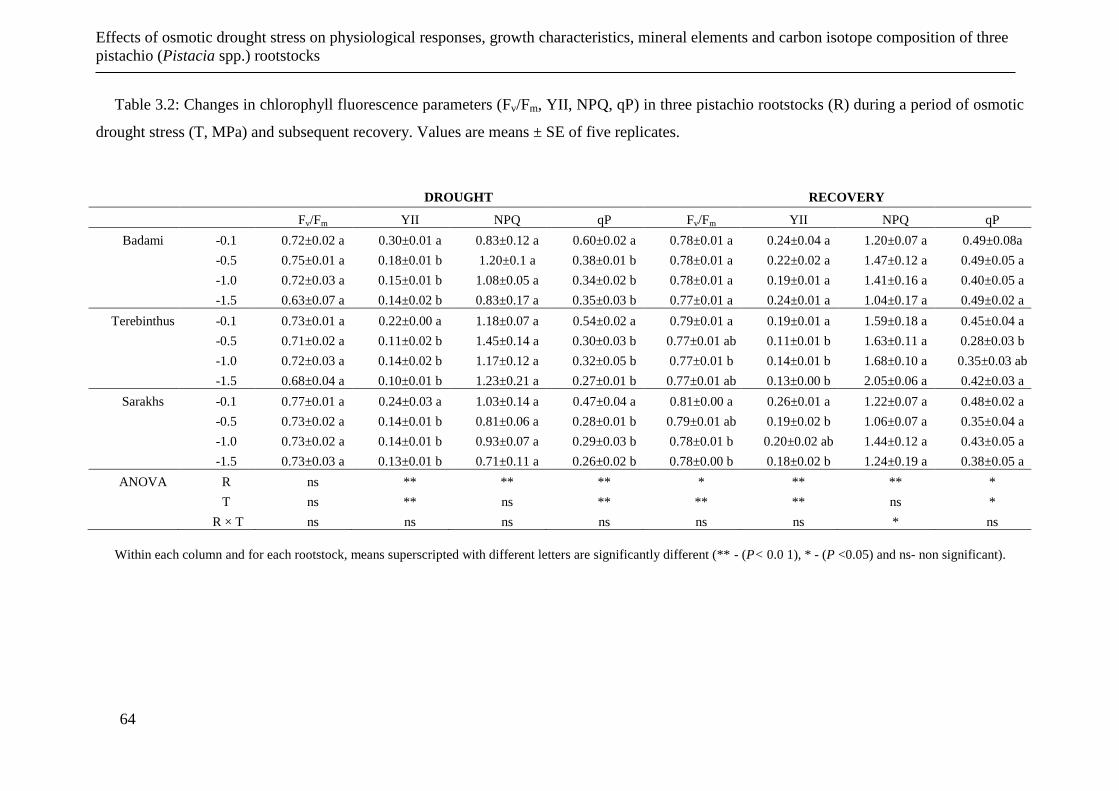
Effects of osmotic drought stress on physiological responses, growth characteristics, mineral elements and carbon isotope composition of three
pistachio (Pistacia spp.) rootstocks
64
Table 3.2: Changes in chlorophyll fluorescence parameters (Fv/Fm, YII, NPQ, qP) in three pistachio rootstocks (R) during a period of osmotic
drought stress (T, MPa) and subsequent recovery. Values are means ± SE of five replicates.
DROUGHT RECOVERY
Fv/Fm YII NPQ qP Fv/Fm YII NPQ qP
Badami -0.1 0.72±0.02 a 0.30±0.01 a 0.83±0.12 a 0.60±0.02 a 0.78±0.01 a 0.24±0.04 a 1.20±0.07 a 0.49±0.08a
-0.5 0.75±0.01 a 0.18±0.01 b 1.20±0.1 a 0.38±0.01 b 0.78±0.01 a 0.22±0.02 a 1.47±0.12 a 0.49±0.05 a
-1.0 0.72±0.03 a 0.15±0.01 b 1.08±0.05 a 0.34±0.02 b 0.78±0.01 a 0.19±0.01 a 1.41±0.16 a 0.40±0.05 a
-1.5 0.63±0.07 a 0.14±0.02 b 0.83±0.17 a 0.35±0.03 b 0.77±0.01 a 0.24±0.01 a 1.04±0.17 a 0.49±0.02 a
Terebinthus -0.1 0.73±0.01 a 0.22±0.00 a 1.18±0.07 a 0.54±0.02 a 0.79±0.01 a 0.19±0.01 a 1.59±0.18 a 0.45±0.04 a
-0.5 0.71±0.02 a 0.11±0.02 b 1.45±0.14 a 0.30±0.03 b 0.77±0.01 ab 0.11±0.01 b 1.63±0.11 a 0.28±0.03 b
-1.0 0.72±0.03 a 0.14±0.02 b 1.17±0.12 a 0.32±0.05 b 0.77±0.01 b 0.14±0.01 b 1.68±0.10 a 0.35±0.03 ab
-1.5 0.68±0.04 a 0.10±0.01 b 1.23±0.21 a 0.27±0.01 b 0.77±0.01 ab 0.13±0.00 b 2.05±0.06 a 0.42±0.03 a
Sarakhs -0.1 0.77±0.01 a 0.24±0.03 a 1.03±0.14 a 0.47±0.04 a 0.81±0.00 a 0.26±0.01 a 1.22±0.07 a 0.48±0.02 a
-0.5 0.73±0.02 a 0.14±0.01 b 0.81±0.06 a 0.28±0.01 b 0.79±0.01 ab 0.19±0.02 b 1.06±0.07 a 0.35±0.04 a
-1.0 0.73±0.02 a 0.14±0.01 b 0.93±0.07 a 0.29±0.03 b 0.78±0.01 b 0.20±0.02 ab 1.44±0.12 a 0.43±0.05 a
-1.5 0.73±0.03 a 0.13±0.01 b 0.71±0.11 a 0.26±0.02 b 0.78±0.00 b 0.18±0.02 b 1.24±0.19 a 0.38±0.05 a
ANOVA R ns ** ** ** * ** ** *
T ns ** ns ** ** ** ns *
R × T ns ns ns ns ns ns * ns
Within each column and for each rootstock, means superscripted with different letters are significantly different (** - (P< 0.0 1), * - (P <0.05) and ns- non significant).
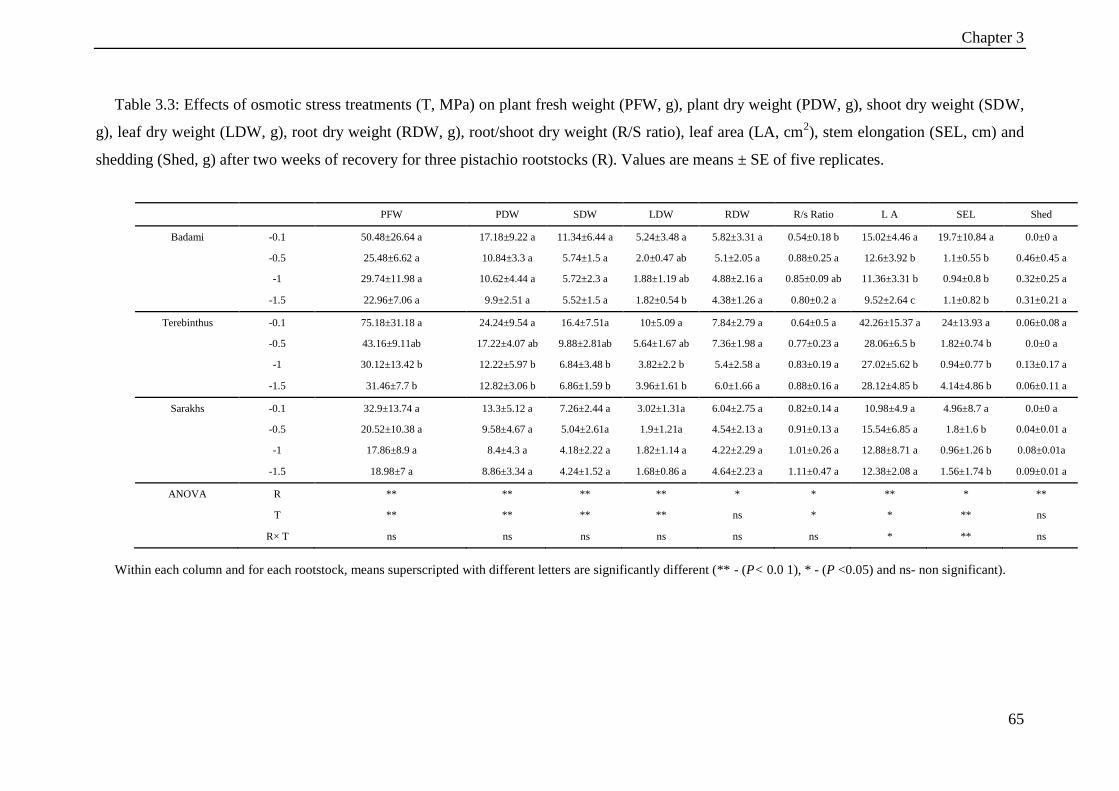
Chapter 3
65
Table 3.3: Effects of osmotic stress treatments (T, MPa) on plant fresh weight (PFW, g), plant dry weight (PDW, g), shoot dry weight (SDW,
g), leaf dry weight (LDW, g), root dry weight (RDW, g), root/shoot dry weight (R/S ratio), leaf area (LA, cm2), stem elongation (SEL, cm) and
shedding (Shed, g) after two weeks of recovery for three pistachio rootstocks (R). Values are means ± SE of five replicates.
PFW PDW SDW LDW RDW R/s Ratio L A SEL Shed
Badami -0.1 50.48±26.64 a 17.18±9.22 a 11.34±6.44 a 5.24±3.48 a 5.82±3.31 a 0.54±0.18 b 15.02±4.46 a 19.7±10.84 a 0.0±0 a
-0.5 25.48±6.62 a 10.84±3.3 a 5.74±1.5 a 2.0±0.47 ab 5.1±2.05 a 0.88±0.25 a 12.6±3.92 b 1.1±0.55 b 0.46±0.45 a
-1 29.74±11.98 a 10.62±4.44 a 5.72±2.3 a 1.88±1.19 ab 4.88±2.16 a 0.85±0.09 ab 11.36±3.31 b 0.94±0.8 b 0.32±0.25 a
-1.5 22.96±7.06 a 9.9±2.51 a 5.52±1.5 a 1.82±0.54 b 4.38±1.26 a 0.80±0.2 a 9.52±2.64 c 1.1±0.82 b 0.31±0.21 a
Terebinthus -0.1 75.18±31.18 a 24.24±9.54 a 16.4±7.51a 10±5.09 a 7.84±2.79 a 0.64±0.5 a 42.26±15.37 a 24±13.93 a 0.06±0.08 a
-0.5 43.16±9.11ab 17.22±4.07 ab 9.88±2.81ab 5.64±1.67 ab 7.36±1.98 a 0.77±0.23 a 28.06±6.5 b 1.82±0.74 b 0.0±0 a
-1 30.12±13.42 b 12.22±5.97 b 6.84±3.48 b 3.82±2.2 b 5.4±2.58 a 0.83±0.19 a 27.02±5.62 b 0.94±0.77 b 0.13±0.17 a
-1.5 31.46±7.7 b 12.82±3.06 b 6.86±1.59 b 3.96±1.61 b 6.0±1.66 a 0.88±0.16 a 28.12±4.85 b 4.14±4.86 b 0.06±0.11 a
Sarakhs -0.1 32.9±13.74 a 13.3±5.12 a 7.26±2.44 a 3.02±1.31a 6.04±2.75 a 0.82±0.14 a 10.98±4.9 a 4.96±8.7 a 0.0±0 a
-0.5 20.52±10.38 a 9.58±4.67 a 5.04±2.61a 1.9±1.21a 4.54±2.13 a 0.91±0.13 a 15.54±6.85 a 1.8±1.6 b 0.04±0.01 a
-1 17.86±8.9 a 8.4±4.3 a 4.18±2.22 a 1.82±1.14 a 4.22±2.29 a 1.01±0.26 a 12.88±8.71 a 0.96±1.26 b 0.08±0.01a
-1.5 18.98±7 a 8.86±3.34 a 4.24±1.52 a 1.68±0.86 a 4.64±2.23 a 1.11±0.47 a 12.38±2.08 a 1.56±1.74 b 0.09±0.01 a
ANOVA R ** ** ** ** * * ** * **
T ** ** ** ** ns * * ** ns
R× T ns ns ns ns ns ns * ** ns
Within each column and for each rootstock, means superscripted with different letters are significantly different (** - (P< 0.0 1), * - (P <0.05) and ns- non significant).
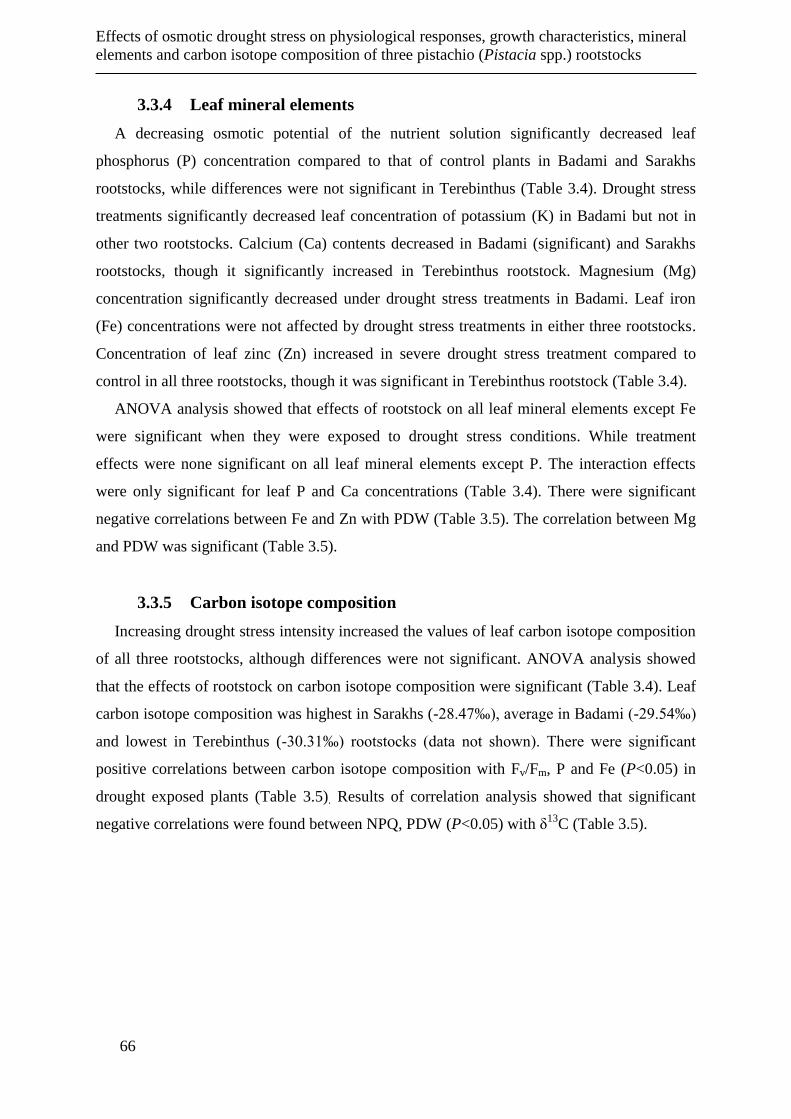
Effects of osmotic drought stress on physiological responses, growth characteristics, mineral
elements and carbon isotope composition of three pistachio (Pistacia spp.) rootstocks
66
3.3.4 Leaf mineral elements
A decreasing osmotic potential of the nutrient solution significantly decreased leaf
phosphorus (P) concentration compared to that of control plants in Badami and Sarakhs
rootstocks, while differences were not significant in Terebinthus (Table 3.4). Drought stress
treatments significantly decreased leaf concentration of potassium (K) in Badami but not in
other two rootstocks. Calcium (Ca) contents decreased in Badami (significant) and Sarakhs
rootstocks, though it significantly increased in Terebinthus rootstock. Magnesium (Mg)
concentration significantly decreased under drought stress treatments in Badami. Leaf iron
(Fe) concentrations were not affected by drought stress treatments in either three rootstocks.
Concentration of leaf zinc (Zn) increased in severe drought stress treatment compared to
control in all three rootstocks, though it was significant in Terebinthus rootstock (Table 3.4).
ANOVA analysis showed that effects of rootstock on all leaf mineral elements except Fe
were significant when they were exposed to drought stress conditions. While treatment
effects were none significant on all leaf mineral elements except P. The interaction effects
were only significant for leaf P and Ca concentrations (Table 3.4). There were significant
negative correlations between Fe and Zn with PDW (Table 3.5). The correlation between Mg
and PDW was significant (Table 3.5).
3.3.5 Carbon isotope composition
Increasing drought stress intensity increased the values of leaf carbon isotope composition
of all three rootstocks, although differences were not significant. ANOVA analysis showed
that the effects of rootstock on carbon isotope composition were significant (Table 3.4). Leaf
carbon isotope composition was highest in Sarakhs (-28.47‰), average in Badami (-2 .54‰)
and lowest in Terebinthus (-30.31‰) rootstocks (data not shown). There were significant
positive correlations between carbon isotope composition with Fv/Fm, P and Fe (P<0.05) in
drought exposed plants (Table 3.5). Results of correlation analysis showed that significant
negative correlations were found between NPQ, PDW (P<0.05) with δ13
C (Table 3.5).
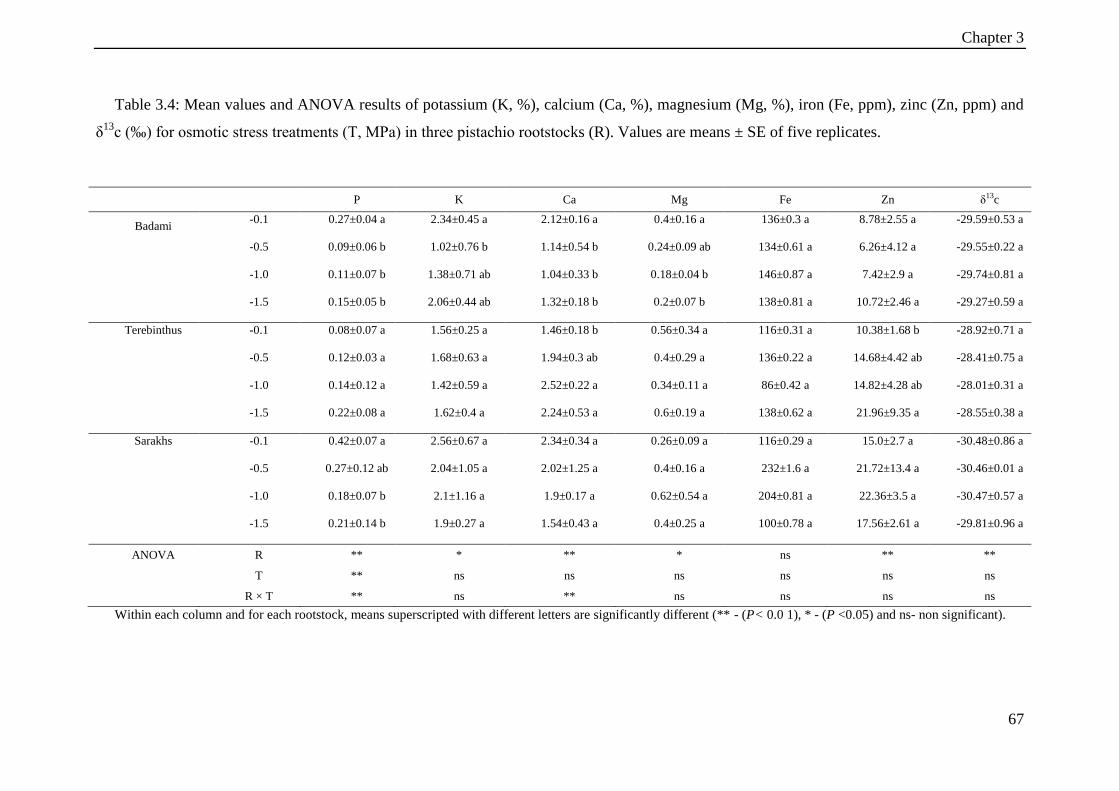
Chapter 3
67
Table 3.4: Mean values and ANOVA results of potassium (K, %), calcium (Ca, %), magnesium (Mg, %), iron (Fe, ppm), zinc (Zn, ppm) and
δ13c (‰) for osmotic stress treatments (T, MPa) in three pistachio rootstocks (R). Values are means ± SE of five replicates.
P K Ca Mg Fe Zn δ13c
Badami -0.1 0.27±0.04 a 2.34±0.45 a 2.12±0.16 a 0.4±0.16 a 136±0.3 a 8.78±2.55 a -29.59±0.53 a
-0.5 0.09±0.06 b 1.02±0.76 b 1.14±0.54 b 0.24±0.09 ab 134±0.61 a 6.26±4.12 a -29.55±0.22 a
-1.0 0.11±0.07 b 1.38±0.71 ab 1.04±0.33 b 0.18±0.04 b 146±0.87 a 7.42±2.9 a -29.74±0.81 a
-1.5 0.15±0.05 b 2.06±0.44 ab 1.32±0.18 b 0.2±0.07 b 138±0.81 a 10.72±2.46 a -29.27±0.59 a
Terebinthus -0.1 0.08±0.07 a 1.56±0.25 a 1.46±0.18 b 0.56±0.34 a 116±0.31 a 10.38±1.68 b -28.92±0.71 a
-0.5 0.12±0.03 a 1.68±0.63 a 1.94±0.3 ab 0.4±0.29 a 136±0.22 a 14.68±4.42 ab -28.41±0.75 a
-1.0 0.14±0.12 a 1.42±0.59 a 2.52±0.22 a 0.34±0.11 a 86±0.42 a 14.82±4.28 ab -28.01±0.31 a
-1.5 0.22±0.08 a 1.62±0.4 a 2.24±0.53 a 0.6±0.19 a 138±0.62 a 21.96±9.35 a -28.55±0.38 a
Sarakhs -0.1 0.42±0.07 a 2.56±0.67 a 2.34±0.34 a 0.26±0.09 a 116±0.29 a 15.0±2.7 a -30.48±0.86 a
-0.5 0.27±0.12 ab 2.04±1.05 a 2.02±1.25 a 0.4±0.16 a 232±1.6 a 21.72±13.4 a -30.46±0.01 a
-1.0 0.18±0.07 b 2.1±1.16 a 1.9±0.17 a 0.62±0.54 a 204±0.81 a 22.36±3.5 a -30.47±0.57 a
-1.5 0.21±0.14 b 1.9±0.27 a 1.54±0.43 a 0.4±0.25 a 100±0.78 a 17.56±2.61 a -29.81±0.96 a
ANOVA R ** * ** * ns ** **
T ** ns ns ns ns ns ns
R × T ** ns ** ns ns ns ns
Within each column and for each rootstock, means superscripted with different letters are significantly different (** - (P< 0.0 1), * - (P <0.05) and ns- non significant).
Effects of osmotic drought stress on physiological responses, growth characteristics, mineral elements and carbon isotope composition of three
pistachio (Pistacia spp.) rootstocks
68
Table 3.5: Correlation coefficient analysis results of Fv/Fm, YII, NPQ, qP, PDW, P, K, Ca, Mg, Fe, Zn and δ13
c in three pistachio rootstocks
under drought stress conditions. Asterisks indicate significant correlation between two variables (* P <0.05 or ** P< 0.0 1).
Fv/Fm YII NPQ qP PDW P K Ca Mg Fe Zn δ13c
Fv/Fm 1
YII 0.41** 1
NPQ -0.09 -0.30* 1
qP 0.16 0.83** 0.18 1
PDW -0.04 -0.06 0.24 0.06 1
P 0.20 0.29* -0.21 0.13 -0.00 1
K -0.03 0.27* -0.08 0.21 0.14 0.52** 1
Ca -0.03 -0.13 0.13 -0.10 0.08 0.50** 0.34** 1
Mg -0.24 -0.15 0.13 -0.06 0.32* 0.09 0.33* 0.17 1
Fe -0.09 -0.08 -0.34** -0.20 -0.26* 0.07 -0.09 -0.10 0.16 1
Zn -0.04 -0.30* 0.05 -0.31* -0.28* 0.20 0.11 0.29* 0.34** 0.54** 1
δ13c 0.33* 0.25 -0.42* 0.03 -0.37* 0.39* -0.01 0.12 -0.03 0.41* 0.33 1
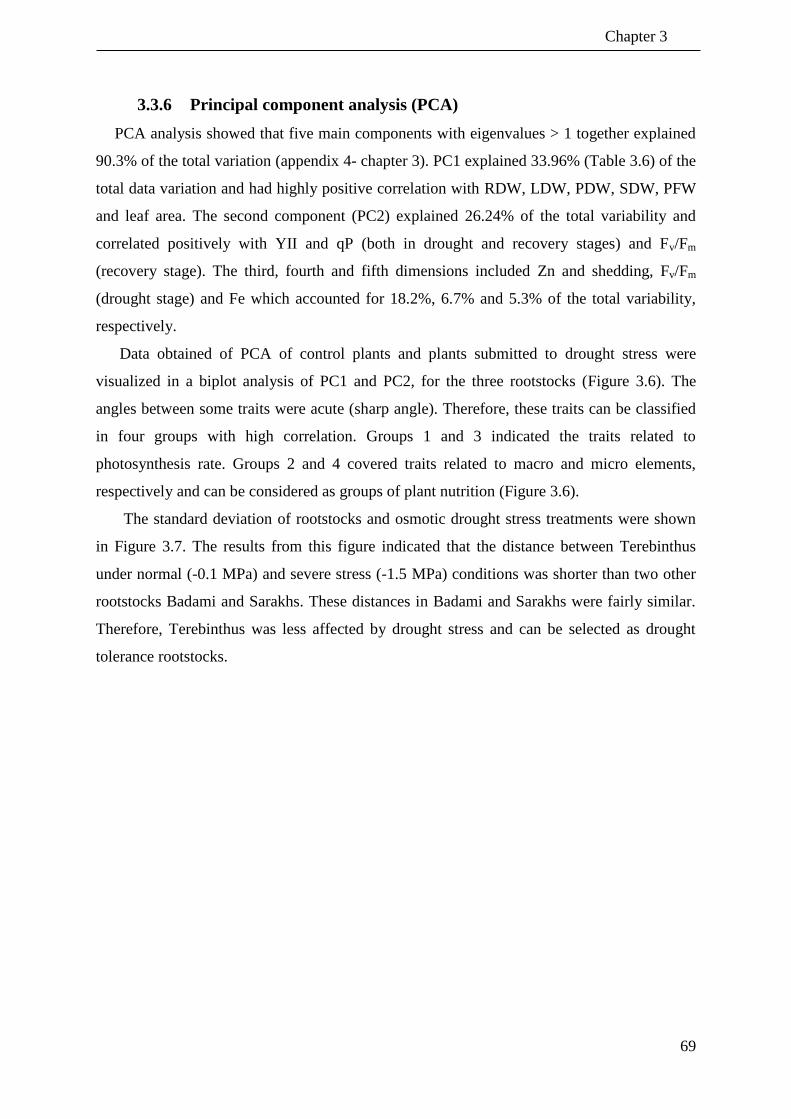
Chapter 3
69
3.3.6 Principal component analysis (PCA)
PCA analysis showed that five main components with eigenvalues > 1 together explained
90.3% of the total variation (appendix 4- chapter 3). PC1 explained 33.96% (Table 3.6) of the
total data variation and had highly positive correlation with RDW, LDW, PDW, SDW, PFW
and leaf area. The second component (PC2) explained 26.24% of the total variability and
correlated positively with YII and qP (both in drought and recovery stages) and Fv/Fm
(recovery stage). The third, fourth and fifth dimensions included Zn and shedding, Fv/Fm
(drought stage) and Fe which accounted for 18.2%, 6.7% and 5.3% of the total variability,
respectively.
Data obtained of PCA of control plants and plants submitted to drought stress were
visualized in a biplot analysis of PC1 and PC2, for the three rootstocks (Figure 3.6). The
angles between some traits were acute (sharp angle). Therefore, these traits can be classified
in four groups with high correlation. Groups 1 and 3 indicated the traits related to
photosynthesis rate. Groups 2 and 4 covered traits related to macro and micro elements,
respectively and can be considered as groups of plant nutrition (Figure 3.6).
The standard deviation of rootstocks and osmotic drought stress treatments were shown
in Figure 3.7. The results from this figure indicated that the distance between Terebinthus
under normal (-0.1 MPa) and severe stress (-1.5 MPa) conditions was shorter than two other
rootstocks Badami and Sarakhs. These distances in Badami and Sarakhs were fairly similar.
Therefore, Terebinthus was less affected by drought stress and can be selected as drought
tolerance rootstocks.
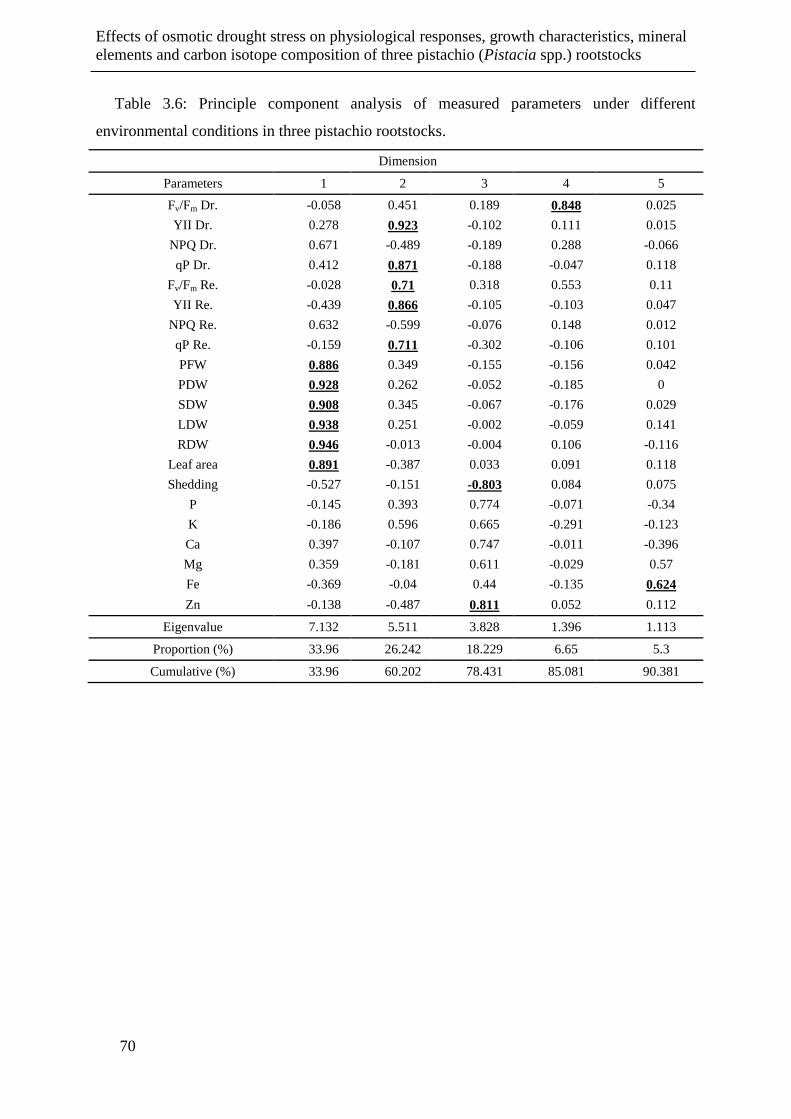
Effects of osmotic drought stress on physiological responses, growth characteristics, mineral
elements and carbon isotope composition of three pistachio (Pistacia spp.) rootstocks
70
Table 3.6: Principle component analysis of measured parameters under different
environmental conditions in three pistachio rootstocks.
Dimension
Parameters 1 2 3 4 5
Fv/Fm Dr. -0.058 0.451 0.189 0.848 0.025
YII Dr. 0.278 0.923 -0.102 0.111 0.015
NPQ Dr. 0.671 -0.489 -0.189 0.288 -0.066
qP Dr. 0.412 0.871 -0.188 -0.047 0.118
Fv/Fm Re. -0.028 0.71 0.318 0.553 0.11
YII Re. -0.439 0.866 -0.105 -0.103 0.047
NPQ Re. 0.632 -0.599 -0.076 0.148 0.012
qP Re. -0.159 0.711 -0.302 -0.106 0.101
PFW 0.886 0.349 -0.155 -0.156 0.042
PDW 0.928 0.262 -0.052 -0.185 0
SDW 0.908 0.345 -0.067 -0.176 0.029
LDW 0.938 0.251 -0.002 -0.059 0.141
RDW 0.946 -0.013 -0.004 0.106 -0.116
Leaf area 0.891 -0.387 0.033 0.091 0.118
Shedding -0.527 -0.151 -0.803 0.084 0.075
P -0.145 0.393 0.774 -0.071 -0.34
K -0.186 0.596 0.665 -0.291 -0.123
Ca 0.397 -0.107 0.747 -0.011 -0.396
Mg 0.359 -0.181 0.611 -0.029 0.57
Fe -0.369 -0.04 0.44 -0.135 0.624
Zn -0.138 -0.487 0.811 0.052 0.112
Eigenvalue 7.132 5.511 3.828 1.396 1.113
Proportion (%) 33.96 26.242 18.229 6.65 5.3
Cumulative (%) 33.96 60.202 78.431 85.081 90.381
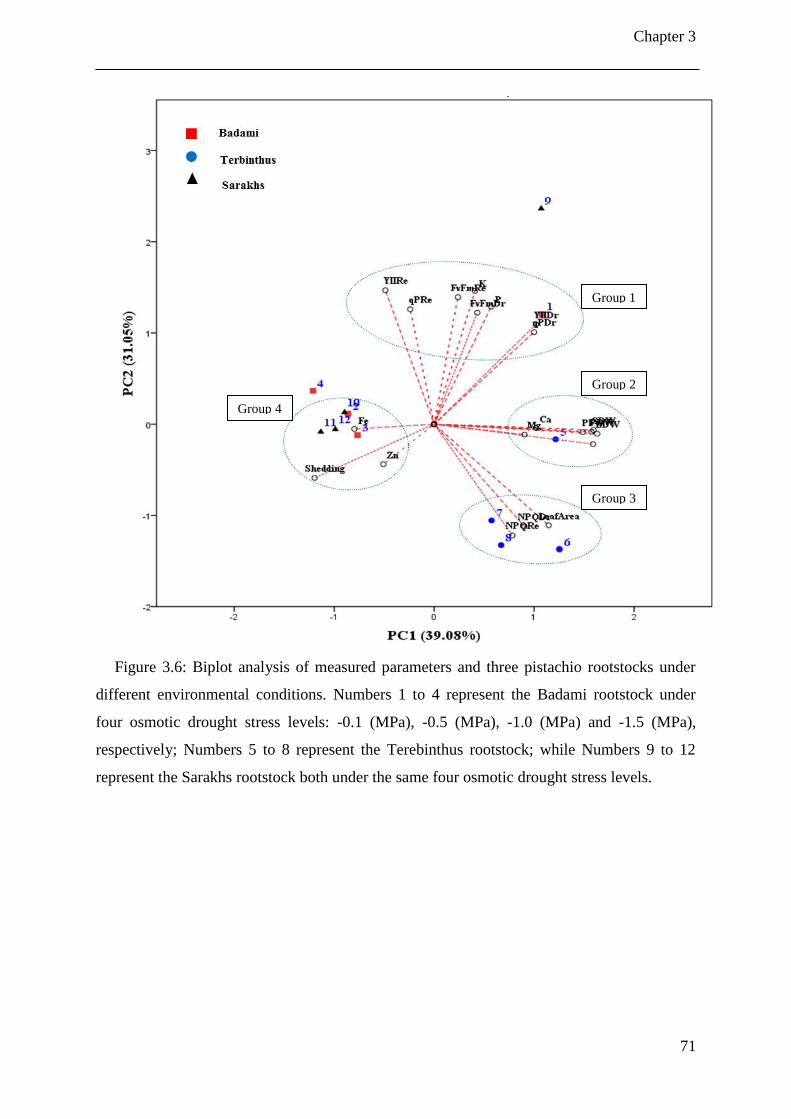
Chapter 3
71
Figure 3.6: Biplot analysis of measured parameters and three pistachio rootstocks under
different environmental conditions. Numbers 1 to 4 represent the Badami rootstock under
four osmotic drought stress levels: -0.1 (MPa), -0.5 (MPa), -1.0 (MPa) and -1.5 (MPa),
respectively; Numbers 5 to 8 represent the Terebinthus rootstock; while Numbers 9 to 12
represent the Sarakhs rootstock both under the same four osmotic drought stress levels.
Group 1
Group 2
Group 3
Group 4
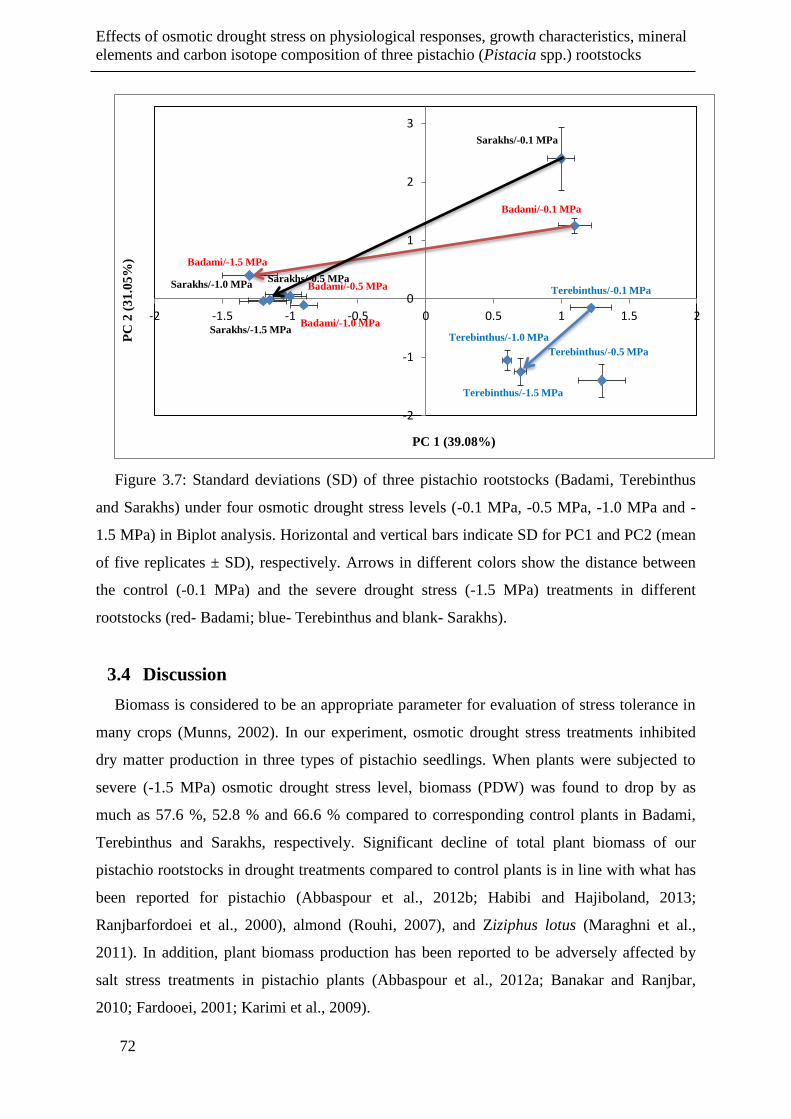
Effects of osmotic drought stress on physiological responses, growth characteristics, mineral
elements and carbon isotope composition of three pistachio (Pistacia spp.) rootstocks
72
Figure 3.7: Standard deviations (SD) of three pistachio rootstocks (Badami, Terebinthus
and Sarakhs) under four osmotic drought stress levels (-0.1 MPa, -0.5 MPa, -1.0 MPa and -
1.5 MPa) in Biplot analysis. Horizontal and vertical bars indicate SD for PC1 and PC2 (mean
of five replicates ± SD), respectively. Arrows in different colors show the distance between
the control (-0.1 MPa) and the severe drought stress (-1.5 MPa) treatments in different
rootstocks (red- Badami; blue- Terebinthus and blank- Sarakhs).
3.4 Discussion
Biomass is considered to be an appropriate parameter for evaluation of stress tolerance in
many crops (Munns, 2002). In our experiment, osmotic drought stress treatments inhibited
dry matter production in three types of pistachio seedlings. When plants were subjected to
severe (-1.5 MPa) osmotic drought stress level, biomass (PDW) was found to drop by as
much as 57.6 %, 52.8 % and 66.6 % compared to corresponding control plants in Badami,
Terebinthus and Sarakhs, respectively. Significant decline of total plant biomass of our
pistachio rootstocks in drought treatments compared to control plants is in line with what has
been reported for pistachio (Abbaspour et al., 2012b; Habibi and Hajiboland, 2013;
Ranjbarfordoei et al., 2000), almond (Rouhi, 2007), and Ziziphus lotus (Maraghni et al.,
2011). In addition, plant biomass production has been reported to be adversely affected by
salt stress treatments in pistachio plants (Abbaspour et al., 2012a; Banakar and Ranjbar,
2010; Fardooei, 2001; Karimi et al., 2009).
Badami/-0.1 MPa
Sarakhs/-1.5 MPa Badami/-1.0 MPa
Badami/-1.5 MPa
Terebinthus/-0.1 MPa
Terebinthus/-0.5 MPa
Terebinthus/-1.0 MPa
Terebinthus/-1.5 MPa
Sarakhs/-0.1 MPa
Badami/-0.5 MPa Sarakhs/-1.0 MPa Sarakhs/-0.5 MPa
-2
-1
0
1
2
3
-2 -1.5 -1 -0.5 0 0.5 1 1.5 2
PC
2 (
31
.05
%)
PC 1 (39.08%)
Chapter 3
73
Both stomatal and non-stomatal limitations can reduce net photosynthesis (Behboudian et
al., 1986). Drought stress limits CO2 availability following a drought induced stomatal
closure. It may lead to reduced photosynthesis (Munns and Tester, 2008) and consequently
reduced growth. In addition, non-stomatal factors also affect photosynthesis in severe drought
stress conditions (Ogren and Oquist, 1985; Stępień and łbus, 2006). To evaluate the direct
effect of drought stress on PSII photochemistry, chlorophyll fluorescence parameters were
measured in our three pistachio rootstocks.
PSII activity and its regulation are best characterized by YII (Maxwell and Johnson,
2000). In the evaluated pistachio rootstocks, growth inhibition was correlated to a lowered
YII. Drought stress levels induced a significant reduction of YII, evidencing decrease in
electron transport through PSII in pistachio rootstocks, which is in agreement with the
findings of Habibi and Hajiboland (2013). This is also reflected in the decrease of qP in these
rootstocks under increasing drought stress compared to the corresponding control plants.
These results, however, are in contrast with the findings of Habibi and Hajiboland (2013)
who reported that photochemical quenching (qP) was not influenced in drought-stressed
pistachio plants under field conditions. The latter parameter gives an indication of PSII ability
to reduce primary electron acceptor QA under the applied drought stress as well as of the
number of photons used by photochemical reactions per number of absorbed photons
(Maxwell and Johnson, 2000). In our study, down-regulation of YII and qP was quite clear
during drought and recovery phases.
The qP was hardly affected by increasing drought stress in these rootstocks, because there
were no significant differences between the three applied drought stress levels.
Photochemical quenching (qP) can contribute to the protection of the photosynthetic
apparatus by transferring electrons to O2 under drought or salt stress (Maxwell and Johnson,
2000). Cornic (1994b) showed that oxygenation of ribulose-1, 5-bisphosphate in C3 plants
can efficiently replace carboxylation when stomata close. We could assume a reduced CO2
assimilation due to drought stress as dry weight decreased in all rootstocks.
Fv/Fm is generally considered to be a parameter that does not change with stress
conditions. A decline in Fv/Fm values indicates serious damage to PSII (Maxwell and
Johnson, 2000). Results of our study show that Fv/Fm values were not significantly affected
by drought stress, while it significantly decreased during the recovery period. This can be
related to drought-exposed plants; the entire photosynthetic apparatus had to be reconstructed
during rehydration which can require several hours or even days. Indeed after recovery, the
Effects of osmotic drought stress on physiological responses, growth characteristics, mineral
elements and carbon isotope composition of three pistachio (Pistacia spp.) rootstocks
74
water content increased in the cell, while the chlorophyll biosynthesis probably did not
increase at a similar rate.
Indeed, the decline in Fv/Fm for pistachio rootstocks indicates damage to PSII (Maxwell
and Johnson, 2000). Similar results were found with P. vera cv. Ahmadaghaii under drought
stress (Habibi and Hajiboland, 2013) whereas Fv/Fm was not affected in P. vera cv. Badami
and cv. Qazvini (Bagheri et al. (2011). Thermal dissipation as evidenced by NPQ was not
influenced by different osmotic drought levels for none of the three rootstocks. On the other
hand, Ranjbarfordoei et al. (2000) found that thermal dissipation increased under drought
stress in P. mutica and P. khinjuk.
A recovery phase of 14 days was insufficient to restore the plant’s full photosynthetic
capacity. Romero et al. (2004b) found a range of responses in drought-stressed almond, going
from partial to rapid recovery of photosynthetic capacity clearly showing varietal differences.
Overall, these results are inconsistent with results of Ranjbarfardooei et al. (2002) who
reported that chlorophyll fluorescence only significantly changed at the highest level of
drought stress (-1.55 MPa) in Pistacia khinjuk and P. mutica.
Osmotic stress resulted in growth arrest for all rootstocks, and no regrowth was observed
after 2 weeks of recovery. Under severe water deficiency, cell elongation of higher plants will
be inhibited by an interruption in water flow from the xylem to the surrounding elongating
cells (Nonami, 1998). Overall growth reduction observed in our experiment is attributed to a
decrease in shoot and leaf biomass, but not to lower root biomass. Decrease in total fresh and
dry weight of pistachio rootstocks with increasing drought is in line with those obtained in
other research on different pistachio species (Abbaspour et al., 2012b; Ranjbarfordoei et al.,
2000; Zhao et al., 2006b).
Root growth is generally less sensitive to drought stress than other biomass components
(Hsiao and Xu, 2000). An increase in root/shoot ratio has been proposed as one of the
mechanisms involved in the adaptation of plants to drought stress (Turner, 1997). In our
study, increasing root/shoot ratios under osmotic stress are only related to a decrease in
aboveground biomass (Table 3.3).
In general, P. terebinthus maintained the highest plant dry weight (PDW) compared to
both other rootstocks (Table 3.3) under drought stress conditions. At the same time, δ13
C in
this rootstock was lower compared to that of the other two (data not shown) that can be a
good indicator for P. terebinthus tolerance to drought conditions (Yousfi et al., 2012b).
Although osmotic stress limits nutrient uptake (Farooq et al., 2009a), an osmotic stress
treatment of 14 days seems too short for the observed reduction in leaf nutrients. Nutrient
Chapter 3
75
concentrations have noticeable effects on shoot growth of pistachio seedlings. Afrousheh et
al. (2010) reported leaf chlorophyll content was greatly influenced by the deficiency of
various nutrient elements. All the fractions of chlorophyll of treated seedlings, particularly N-
deficient and Mn-deficient seedlings, reduced considerably. This was because of inadequate
supply of N for chloroplast protein synthesis. N deficiency had a noticeable effect on the
growth of seedlings particularly with regard to shoot growth. The affected plant has little or
no ability to manufacture carbohydrates through photosynthesis and may die unless the cause
of its chlorophyll insufficiency is treated. Shanker Dubey (2005) represented deficiency of
different nutrient elements in leaves presumably due to earlier break of chloroplast, older
leaves, decreasing of chlorophyll and finally decrease of photosynthesis. Also limiting of
nutrient elements due to starch synthesis and accumulation of sugar had a limiting effect on
photosynthetic chemical reactions. Thus, drought-induced P, K, and Ca loss in Badami and
Sarakhs, could be another factor that induced growth arrest in these rootstocks.
Concentrations of Ca and Zn significantly increased by increasing drought stress in
Terebinthus (Table 3.4). On the other hand, this rootstock had the highest values for growth
parameters. It has been noted that calcium could participate in the regulating mechanism in
plants adjusting to adverse conditions such as drought (Bowler and Fluhr, 2000), and salt
stress (Cramer et al., 1985). Inorganic ions for osmotic adjustment are mainly Na+, K
+, Ca
2+,
and Cl–. Inorganic ions make great contribution in osmotic adjustment by ion transport
processes with related ion antiporters and ion channels (Chen and Jiang, 2010). Also,
cytosolic Ca2+
is a second messenger for a number of extracellular signals in plants and more
specifically calcium serves as a second messenger when ABA triggers the closing of guard
cells. ABA is produced under water stress conditions in vegetative tissues and controls
stomatal closure and gene expression related to dehydration tolerance (Finkelstein and Rock,
2002; Rock et al., 2009). Therefore, increasing calcium concentration in Terebinthus
rootstock under drought stress condition regulates plant water level by controlling
transpiration rate; and act as an inorganic ion for osmotic adjustment.
Zinc is required to make auxin, the plant hormone responsible for cell elongation and
growth. Zinc is also needed in the biosynthesis of chloroplasts, the leaf component that
contains chlorophyll (Beede et al., 2005). Therefore, these two elements (Ca and Zn) can play
important role to maintain growth and induce tolerance under drought stress conditions in
pistachio Terebinthus.
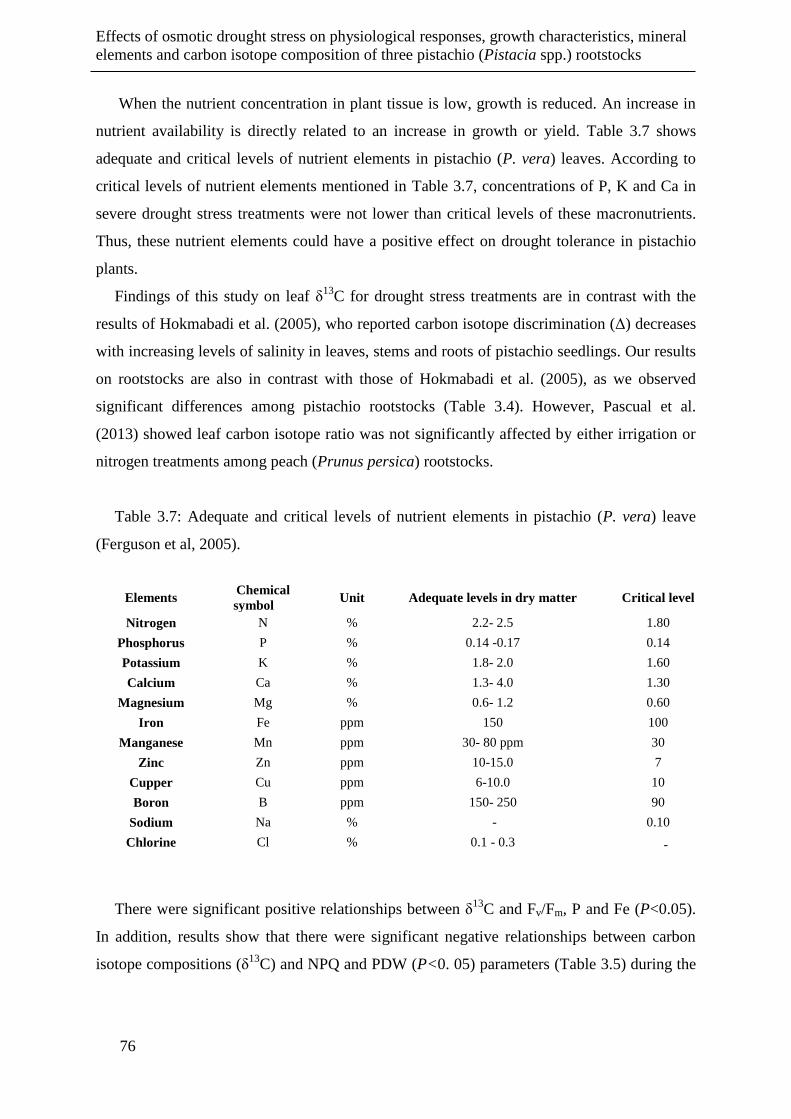
Effects of osmotic drought stress on physiological responses, growth characteristics, mineral
elements and carbon isotope composition of three pistachio (Pistacia spp.) rootstocks
76
When the nutrient concentration in plant tissue is low, growth is reduced. An increase in
nutrient availability is directly related to an increase in growth or yield. Table 3.7 shows
adequate and critical levels of nutrient elements in pistachio (P. vera) leaves. According to
critical levels of nutrient elements mentioned in Table 3.7, concentrations of P, K and Ca in
severe drought stress treatments were not lower than critical levels of these macronutrients.
Thus, these nutrient elements could have a positive effect on drought tolerance in pistachio
plants.
Findings of this study on leaf δ13
C for drought stress treatments are in contrast with the
results of Hokmabadi et al. (2005), who reported carbon isotope discrimination (Δ) decreases
with increasing levels of salinity in leaves, stems and roots of pistachio seedlings. Our results
on rootstocks are also in contrast with those of Hokmabadi et al. (2005), as we observed
significant differences among pistachio rootstocks (Table 3.4). However, Pascual et al.
(2013) showed leaf carbon isotope ratio was not significantly affected by either irrigation or
nitrogen treatments among peach (Prunus persica) rootstocks.
Table 3.7: Adequate and critical levels of nutrient elements in pistachio (P. vera) leave
(Ferguson et al, 2005).
Elements
Chemical
symbol Unit Adequate levels in dry matter Critical level
Nitrogen N % 2.2- 2.5 1.80
Phosphorus P % 0.14 -0.17 0.14
Potassium K % 1.8- 2.0 1.60
Calcium Ca % 1.3- 4.0 1.30
Magnesium Mg % 0.6- 1.2 0.60
Iron Fe ppm 150 100
Manganese Mn ppm 30- 80 ppm 30
Zinc Zn ppm 10-15.0 7
Cupper Cu ppm 6-10.0 10
Boron B ppm 150- 250 90
Sodium Na % - 0.10
Chlorine Cl % 0.1 - 0.3 -
There were significant positive relationships between δ13
C and Fv/Fm, P and Fe (P<0.05).
In addition, results show that there were significant negative relationships between carbon
isotope compositions (δ13
C) and NPQ and PDW (P<0. 05) parameters (Table 3.5) during the
Chapter 3
77
experiment. Based on these correlations, carbon isotope composition is a good indicator for
pistachio rootstocks to screen the genotypes.
According to data of Table 3.6, the PC1 can be named as a biomass component. In other
words, this component was able to separate the rootstocks with high biomass production
under different drought stress conditions. The second component (PC2) indicates the
photosynthesis. It means with apply some chlorophyll fluorescence parameters (YII and qP)
that related to photosynthesis, this component was able to separate the pistachio rootstocks
with high photosynthesis. Thus, selection of rootstocks that have high PC1 and high PC2 are
suitable for different stress conditions because these rootstocks have a high growth along
with high photosynthesis rate.
From the biplot, rootstock Sarakhs (9), Badami (1) and Terebinthus (5) with high PC1 had
high photosynthesis rate, respectively under non stress condition. Biplot depicted that
Terebinthus (6 and 7) as compared with Badami (2 and 3) and Sarakhs (10 and 11)
represented higher PC1 under moderate drought stress condition (-0.5 and -1.0 MPa) and was
selected as tolerant rootstock with high growth in these conditions. Under severe stress
condition (-1.5 MPa), Terebinthus (8) with higher PC1 values was selected as tolerant
rootstock compared with Badami (4) and Sarakhs (12). Generally, these results of biplot
identified Terebinthus and Sarakhs as the most tolerant and susceptible rootstock under
different stress conditions, respectively.
The results of PCA and biplot analysis selected RDW, LDW, PDW, SDW, PFW,YII, qP,
Fv/Fm and shedding as the suitable indicators for screening and classification of pistachio
rootstocks under different stress conditions. These results also indicated that rootstocks
belonging to the P. vera species (Badami and Sarakhs) with close distance were located in the
same group under drought stress conditions, while P. terebinthus was located in the other
group. Terebinthus with highest PC1 under drought stress conditions (6, 7 and 8) was
identified as the most tolerant rootstock. The biplot revealed that plant nutrients including Fe,
Zn, Ca and Mg cannot be ideal for evaluating genetic diversity and screening pistachio
rootstocks under normal and stress conditions.
3.5 Conclusion
Pistachio trees are considered to be drought-tolerant, yet the applied osmotic drought
stress conditions induced significant reductions in chlorophyll fluorescence parameters (YII
and qP), decline in fresh and dry plant weights and reduction in leaf nutrient contents. The
Effects of osmotic drought stress on physiological responses, growth characteristics, mineral
elements and carbon isotope composition of three pistachio (Pistacia spp.) rootstocks
78
period of recovery from the applied stress was longer than expected, as after two weeks of
recovery negative effects of the stress were still evident at chlorophyll fluorescence
parameters.
YII could be used to distinguish the different responses to drought stress in the studied
pistachio rootstocks. Consequently, light-adapted responses could be considered as an early
indicator of drought-induced disturbances in pistachio. As YII remained to be affected after a
drought stress period, this parameter has a potential to be an early and non-destructive tool to
screen pistachio rootstocks for drought stress.
Terebinthus rootstock had better tolerated the applied drought stress as shown by the better
growth parameters performance in drought stress conditions and the lower carbon isotope
composition (more negative) value when compared with Badami and Sarakhs rootstocks.
Based on increase in δ13
c, Badami is moderately tolerant to drought stress, whereas Sarakhs
seems more sensitive to the applied drought stress. Resistance of Terebinthus with highest
PC1 under drought stress conditions was identified by Biplot presentation. However, further
research in field conditions is needed to confirm this survey’s research results.
Chapter 4
79
Osmotic stress affects physiological responses and Chapter 4.
growth characteristics of three pistachio (Pistacia vera L.)
cultivars
Adapted from:
Esmaeilpour, Ali; Van Labeke, Marie-Christine; R. Samson, P. Boeckx; Van Damme,
Patrick. 2015. Osmotic stress affects physiological responses and growth characteristics of
three pistachio cultivars. Acta Physiologiae Plantarum 37(6):1-14.
Esmaeilpour, A. and P. Van Damme. 2014. Evaluation of Seed Soaking Times on
Germination Percentage, Germination Rate and Growth Characteristics of Pistachio
Seedlings. The 29th
international horticultural congress (IHC2014). Brisbane, Australia.
Esmaeilpour, A., M. C. Van Labeke, R. Samson and P. Van Damme. 2014. Chlorophyll
fluorescence as a tool for evaluation of drought stress tolerance in Iranian pistachio cultivars.
International conference on research on food security, natural resource management and rural
development (Tropendag 2014). September 17-19. Prague, Czech Republic.
Osmotic stress affects physiological responses and growth characteristics of three pistachio
(Pistacia vera L.) cultivars.
80
4.1 Introduction
Drought is a common and serious problem to plants in arid or semi-arid areas. Plants have
developed different morphological, physiological and biochemical mechanisms to withstand
drought stress. Drought stress limits plant growth and development as well as a wide range of
physiological processes such as photosynthesis (Anjum et al., 2011; Blum, 2005; Farooq et
al., 2009b) and causes a higher rate of impairment than any other environmental factors
(Cechin et al., 2008; Shao et al., 2009). Plant responses to drought stress depend on timing,
severity, and length of the drought event (Anjum et al., 2011; Chaves et al., 2002; Praba et
al., 2009). Maintenance of cell turgor plays an important role in regulating the carbon balance
of plants. Water stress greatly suppresses cell expansion and cell growth as a result of the low
turgor pressure (Shao et al., 2008). Turgor pressure maintenance allows stomata to remain
open, photosynthesis to continue and growth to be uninterrupted (Pessarakli, 1994).
Furthermore, under progressive drought stress, electron transport will be impaired followed
by an enhanced production of reactive oxygen species (Cornic and Fresneau, 2002; Cruz de
Carvalho, 2008; Gnaana Saraswathi and Paliwal, 2011). Moreover, a reduced leaf area and
decreased transpiration rate are found to occur under drought stress (Dong and Zhang, 2000;
Liu and Stützel, 2004). One of the most common stress responses in plants is an enhanced
biosynthesis of different types of compatible organic solutes (Serraj and Sinclair, 2002).
Compatible solutes are low molecular weight, highly soluble compounds that are usually
nontoxic at high cellular concentrations. Generally, they protect plants from stress trough
different ways, including contribution to cellular osmotic adjustment, detoxification of
reactive oxygen species, protection of membrane integrity, and stabilization of
enzymes/proteins (Bohnert and Jensen, 1996; Yancey et al., 1982). Proline is one of the most
common compatible solutes in drought-stressed plants (Ashraf and Foolad, 2007; Matysik et
al., 2002; Yoshiba et al., 1997). Proline is not only an important molecule in redox signaling,
but also an effective hydroxyl radical scavenger (Miller et al., 2010). Proline also protects
cell membranes against the negative effects of ROS (Claussen, 2005; Matysik et al., 2002).
The osmo-protective function of proline accumulation under drought stress is well-
documented (Blum, 2005; Matysik et al., 2002; Miller et al., 2010). Enhanced synthesis of
proline under drought or salt stress is a mechanism to alleviate cytoplasmic acidosis and to
maintain NADP at values compatible with metabolism (Miller et al., 2010; Saradhi, 1991).
An additional NADPH advantage of the refilling of NADP supplied by proline synthesis may
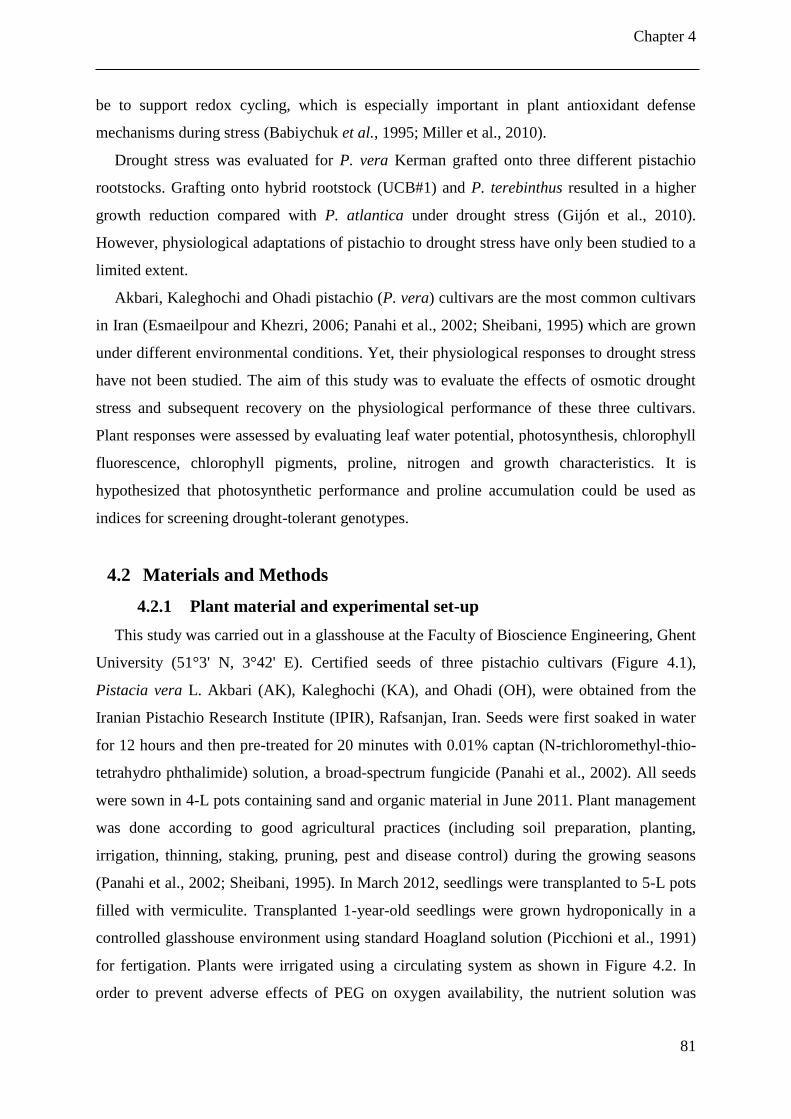
Chapter 4
81
be to support redox cycling, which is especially important in plant antioxidant defense
mechanisms during stress (Babiychuk et al., 1995; Miller et al., 2010).
Drought stress was evaluated for P. vera Kerman grafted onto three different pistachio
rootstocks. Grafting onto hybrid rootstock (UCB#1) and P. terebinthus resulted in a higher
growth reduction compared with P. atlantica under drought stress (Gijón et al., 2010).
However, physiological adaptations of pistachio to drought stress have only been studied to a
limited extent.
Akbari, Kaleghochi and Ohadi pistachio (P. vera) cultivars are the most common cultivars
in Iran (Esmaeilpour and Khezri, 2006; Panahi et al., 2002; Sheibani, 1995) which are grown
under different environmental conditions. Yet, their physiological responses to drought stress
have not been studied. The aim of this study was to evaluate the effects of osmotic drought
stress and subsequent recovery on the physiological performance of these three cultivars.
Plant responses were assessed by evaluating leaf water potential, photosynthesis, chlorophyll
fluorescence, chlorophyll pigments, proline, nitrogen and growth characteristics. It is
hypothesized that photosynthetic performance and proline accumulation could be used as
indices for screening drought-tolerant genotypes.
4.2 Materials and Methods
4.2.1 Plant material and experimental set-up
This study was carried out in a glasshouse at the Faculty of Bioscience Engineering, Ghent
University (51°3' N, 3°42' E). Certified seeds of three pistachio cultivars (Figure 4.1),
Pistacia vera L. Akbari (AK), Kaleghochi (KA), and Ohadi (OH), were obtained from the
Iranian Pistachio Research Institute (IPIR), Rafsanjan, Iran. Seeds were first soaked in water
for 12 hours and then pre-treated for 20 minutes with 0.01% captan (N-trichloromethyl-thio-
tetrahydro phthalimide) solution, a broad-spectrum fungicide (Panahi et al., 2002). All seeds
were sown in 4-L pots containing sand and organic material in June 2011. Plant management
was done according to good agricultural practices (including soil preparation, planting,
irrigation, thinning, staking, pruning, pest and disease control) during the growing seasons
(Panahi et al., 2002; Sheibani, 1995). In March 2012, seedlings were transplanted to 5-L pots
filled with vermiculite. Transplanted 1-year-old seedlings were grown hydroponically in a
controlled glasshouse environment using standard Hoagland solution (Picchioni et al., 1991)
for fertigation. Plants were irrigated using a circulating system as shown in Figure 4.2. In
order to prevent adverse effects of PEG on oxygen availability, the nutrient solution was
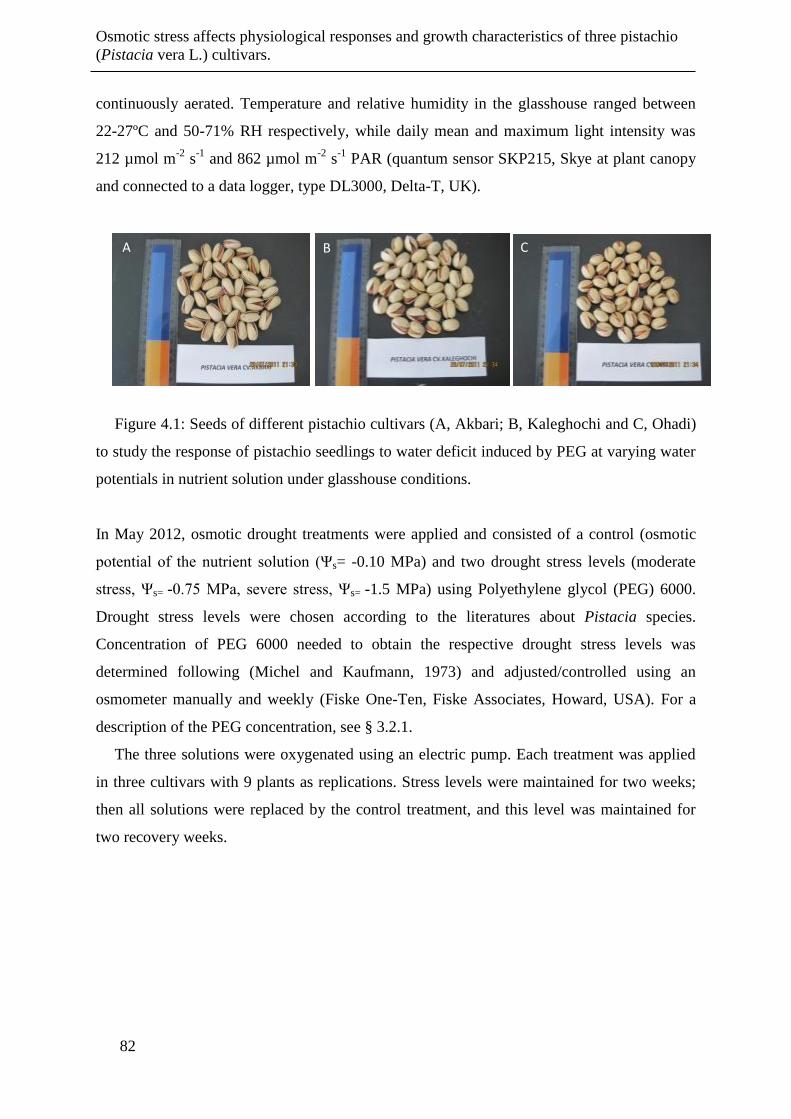
Osmotic stress affects physiological responses and growth characteristics of three pistachio
(Pistacia vera L.) cultivars.
82
continuously aerated. Temperature and relative humidity in the glasshouse ranged between
22-27ºC and 50-71% RH respectively, while daily mean and maximum light intensity was
212 µmol m-2
s-1
and 862 µmol m-2
s-1
PAR (quantum sensor SKP215, Skye at plant canopy
and connected to a data logger, type DL3000, Delta-T, UK).
Figure 4.1: Seeds of different pistachio cultivars (A, Akbari; B, Kaleghochi and C, Ohadi)
to study the response of pistachio seedlings to water deficit induced by PEG at varying water
potentials in nutrient solution under glasshouse conditions.
In May 2012, osmotic drought treatments were applied and consisted of a control (osmotic
potential of the nutrient solution (Ψs= -0.10 MPa) and two drought stress levels (moderate
stress, Ψs= -0.75 MPa, severe stress, Ψs= -1.5 MPa) using Polyethylene glycol (PEG) 6000.
Drought stress levels were chosen according to the literatures about Pistacia species.
Concentration of PEG 6000 needed to obtain the respective drought stress levels was
determined following (Michel and Kaufmann, 1973) and adjusted/controlled using an
osmometer manually and weekly (Fiske One-Ten, Fiske Associates, Howard, USA). For a
description of the PEG concentration, see § 3.2.1.
The three solutions were oxygenated using an electric pump. Each treatment was applied
in three cultivars with 9 plants as replications. Stress levels were maintained for two weeks;
then all solutions were replaced by the control treatment, and this level was maintained for
two recovery weeks.
A B C
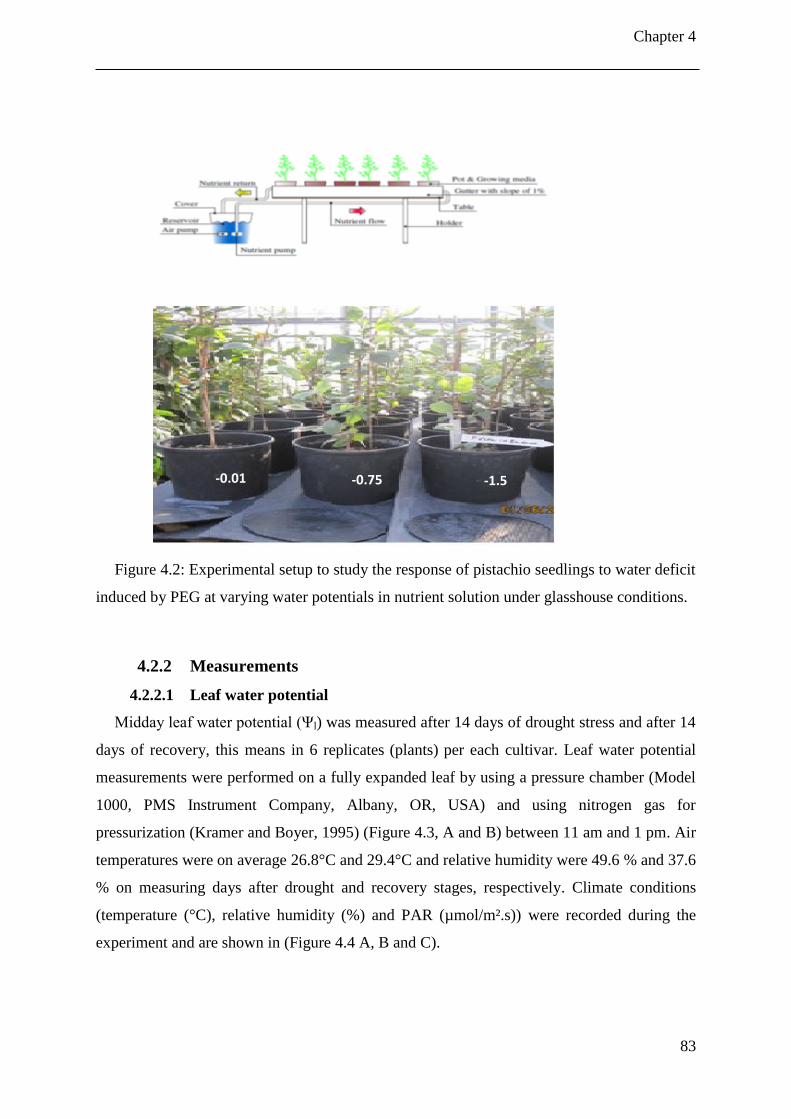
Chapter 4
83
Figure 4.2: Experimental setup to study the response of pistachio seedlings to water deficit
induced by PEG at varying water potentials in nutrient solution under glasshouse conditions.
4.2.2 Measurements
4.2.2.1 Leaf water potential
Midday leaf water potential (Ψl) was measured after 14 days of drought stress and after 14
days of recovery, this means in 6 replicates (plants) per each cultivar. Leaf water potential
measurements were performed on a fully expanded leaf by using a pressure chamber (Model
1000, PMS Instrument Company, Albany, OR, USA) and using nitrogen gas for
pressurization (Kramer and Boyer, 1995) (Figure 4.3, A and B) between 11 am and 1 pm. Air
temperatures were on average 26.8°C and 29.4°C and relative humidity were 49.6 % and 37.6
% on measuring days after drought and recovery stages, respectively. Climate conditions
(temperature (°C), relative humidity (%) and PAR (µmol/m².s)) were recorded during the
experiment and are shown in (Figure 4.4 A, B and C).
-0.01 -0.75 -1.5
- 0.75 MPa - 1.5 MPa
Osmotic stress affects physiological responses and growth characteristics of three pistachio
(Pistacia vera L.) cultivars.
84
4.2.2.2 Photosynthesis measurements
Gas exchange measurements were done on the eighth leaf from the apex using a CO2 and
H2O infrared gas analyzer (LI-6400, LI-COR Inc., Lincoln, USA) (Figure 4.3, C and D) in
five replicates (plants) per cultivar. Net photosynthetic rate (Pn), stomatal conductance (gs),
intercellular CO2 concentration (Ci) and leaf transpiration rate (E) were measured after 14
days of drought stress and after 14 days of recovery. All measurements were made under
standard environmental conditions (light intensity of 1500 µmol.m-2
s-1
, ambient CO2
concentration (Ca) of 400 µmol CO2 mol-1
, leaf temperature (Tl) = 26.9ºC, leaf vapor pressure
deficit (VPDl) = 1.1-2.2 kPa) between 10 am and 3 pm. The chamber temperature of the
fluorescence head was set to match the actual temperature measured in the treatment
environment at the start of the measurements (25°C). Every plant measurement lasted for 4-5
minutes. Intrinsic water use efficiency (WUE) was estimated as Pn/gs (Mediavilla et al.,
2002).
4.2.2.3 Chlorophyll fluorescence measurements
For a description of the chlorophyll fluorescence measurements, see § 3.2.2.1
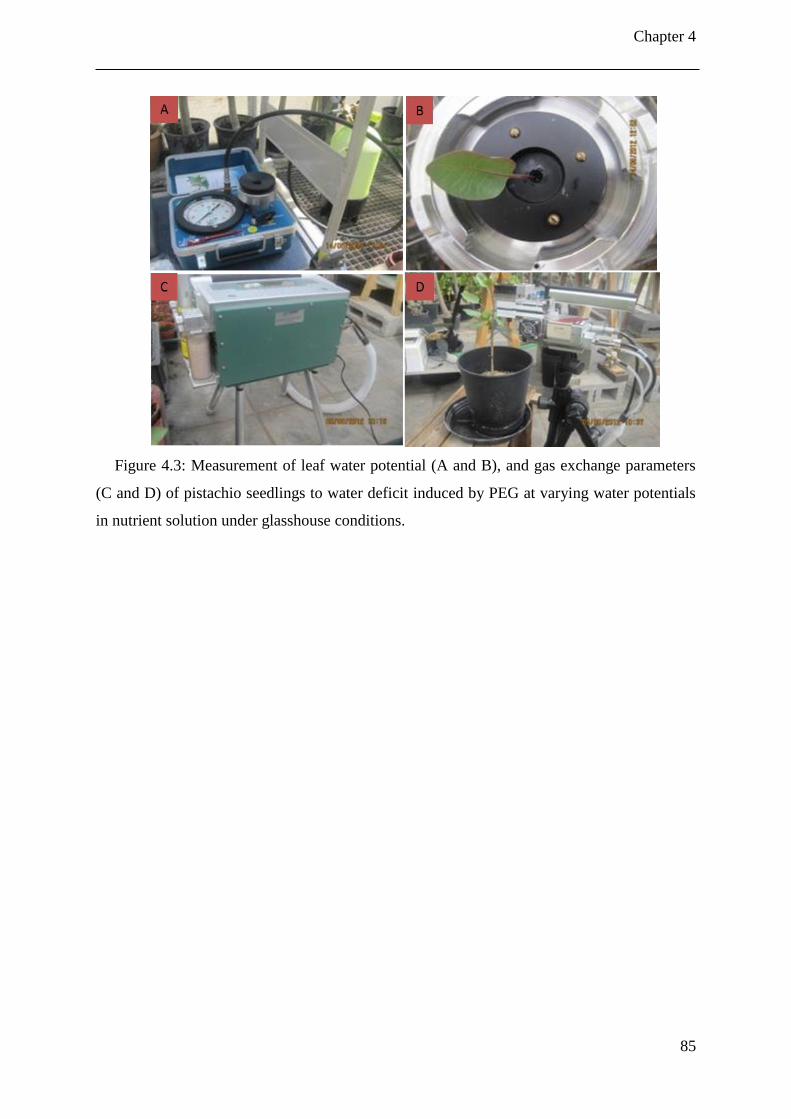
Chapter 4
85
Figure 4.3: Measurement of leaf water potential (A and B), and gas exchange parameters
(C and D) of pistachio seedlings to water deficit induced by PEG at varying water potentials
in nutrient solution under glasshouse conditions.
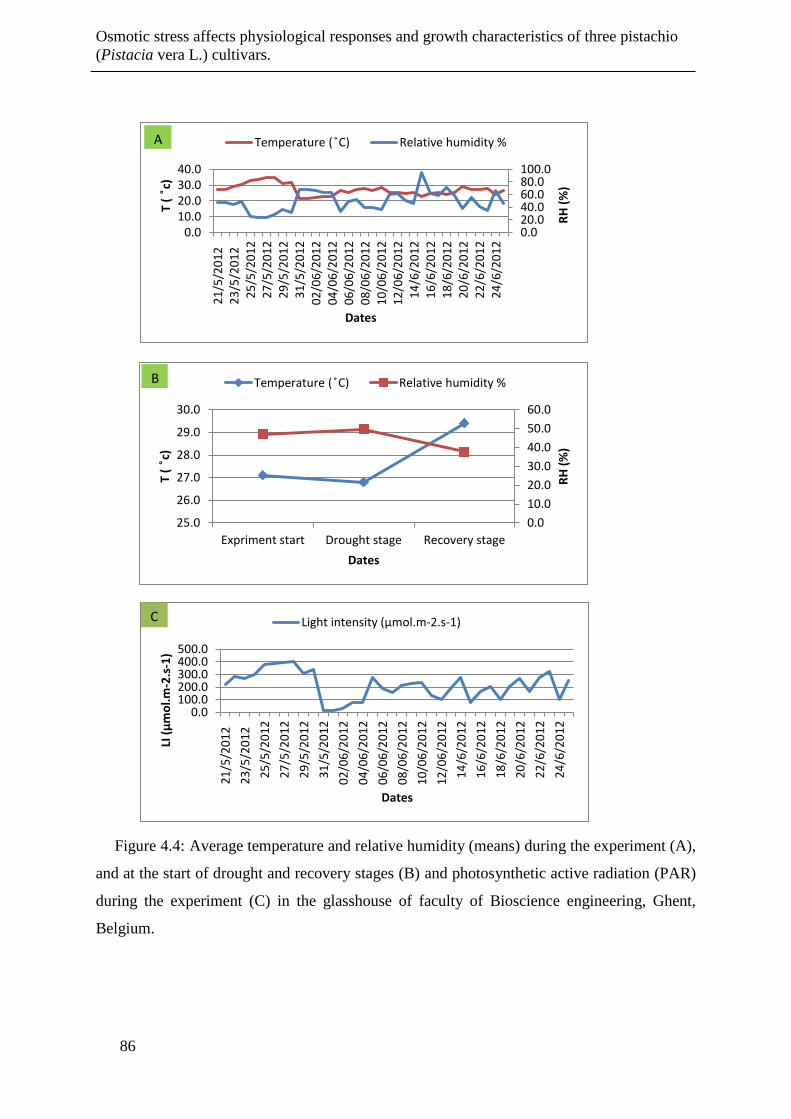
Osmotic stress affects physiological responses and growth characteristics of three pistachio
(Pistacia vera L.) cultivars.
86
Figure 4.4: Average temperature and relative humidity (means) during the experiment (A),
and at the start of drought and recovery stages (B) and photosynthetic active radiation (PAR)
during the experiment (C) in the glasshouse of faculty of Bioscience engineering, Ghent,
Belgium.
0.0
10.0
20.0
30.0
40.0
50.0
60.0
25.0
26.0
27.0
28.0
29.0
30.0
Expriment start Drought stage Recovery stage
RH
(%
)
T (
c)
Dates
Temperature ( C) Relative humidity %B
0.020.040.060.080.0100.0
0.010.020.030.040.0
21
/5/2
01
22
3/5
/20
12
25
/5/2
01
22
7/5
/20
12
29
/5/2
01
23
1/5
/20
12
02
/06
/20
12
04
/06
/20
12
06
/06
/20
12
08
/06
/20
12
10
/06
/20
12
12
/06
/20
12
14
/6/2
01
21
6/6
/20
12
18
/6/2
01
22
0/6
/20
12
22
/6/2
01
22
4/6
/20
12
RH
(%
)
T (
c)
Dates
Temperature ( C) Relative humidity %A
0.0100.0200.0300.0400.0500.0
21
/5/2
01
2
23
/5/2
01
2
25
/5/2
01
2
27
/5/2
01
2
29
/5/2
01
2
31
/5/2
01
2
02
/06
/20
12
04
/06
/20
12
06
/06
/20
12
08
/06
/20
12
10
/06
/20
12
12
/06
/20
12
14
/6/2
01
2
16
/6/2
01
2
18
/6/2
01
2
20
/6/2
01
2
22
/6/2
01
2
24
/6/2
01
2
LI (
µm
ol.
m-2
.s-1
)
Dates
Light intensity (µmol.m-2.s-1)C
Chapter 4
87
4.2.2.4 Chlorophyll content
Leaf material (150 mg fresh weight) was ground with liquid nitrogen. After extraction in
80% acetone, samples were shaken and then stored at -20ºC for 24 hours. Pigments were
measured spectrophotometrically (UVIKONXL, BIO-TEK Instrument, USA) (Figure 4.5, A &
B), in nine replicates (plants). Chlorophyll a (Chl a), chlorophyll b (Chl b), and carotenoids
(Car) (μg g-1
FW) were calculated according to Lichtenthaler (1987):
Chl a = 12.25 A663.2 - 2.79 A646.8,
Chl b = 21.5 A646.8 - 5.1A663.2, and
Car = (1000 A470 - 1.82 Chl a - 85.02 Chl b) /198.
4.2.2.5 Proline content
For proline two leaves per plant were collected after two weeks of drought stress and two
weeks of recovery, in 6 replicates (plants). Leaf samples (±500 mg FW) were extracted with
3% aqueous sulfosalicylic acid. Concentration of free proline was determined by the acid
ninhydrin method according to Bates et al. (1973) and measured spectrophotometrically at λ
= 520 nm (Nanoquant Infinite M200, TECAN Austria GmbH, 5082 Grodig, Austria)
(Figure 4.5, C & D).
4.2.2.6 Leaf nitrogen content
Dried leaf samples were ground by a grinder (ZM200, Retsch, Germany). Three plants per
treatment were analyzed with an elemental analyzer (ANCA-SL, PDZ-Europe, Northwick,
UK) coupled to an isotope ratio mass spectrometer (model 20–20, Sercon, Crewe, UK) to
measure total C and N content (Roobroeck et al., 2010).
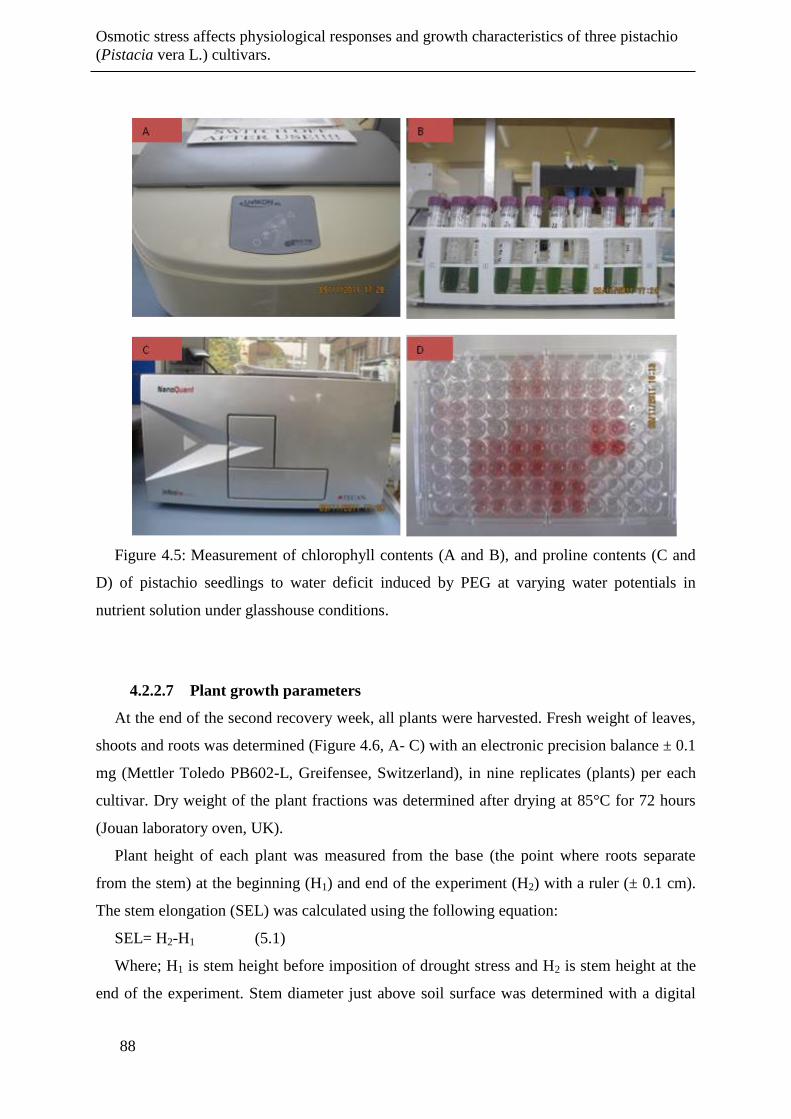
Osmotic stress affects physiological responses and growth characteristics of three pistachio
(Pistacia vera L.) cultivars.
88
Figure 4.5: Measurement of chlorophyll contents (A and B), and proline contents (C and
D) of pistachio seedlings to water deficit induced by PEG at varying water potentials in
nutrient solution under glasshouse conditions.
4.2.2.7 Plant growth parameters
At the end of the second recovery week, all plants were harvested. Fresh weight of leaves,
shoots and roots was determined (Figure 4.6, A- C) with an electronic precision balance ± 0.1
mg (Mettler Toledo PB602-L, Greifensee, Switzerland), in nine replicates (plants) per each
cultivar. Dry weight of the plant fractions was determined after drying at 85°C for 72 hours
(Jouan laboratory oven, UK).
Plant height of each plant was measured from the base (the point where roots separate
from the stem) at the beginning (H1) and end of the experiment (H2) with a ruler (± 0.1 cm).
The stem elongation (SEL) was calculated using the following equation:
SEL= H2-H1 (5.1)
Where; H1 is stem height before imposition of drought stress and H2 is stem height at the
end of the experiment. Stem diameter just above soil surface was determined with a digital
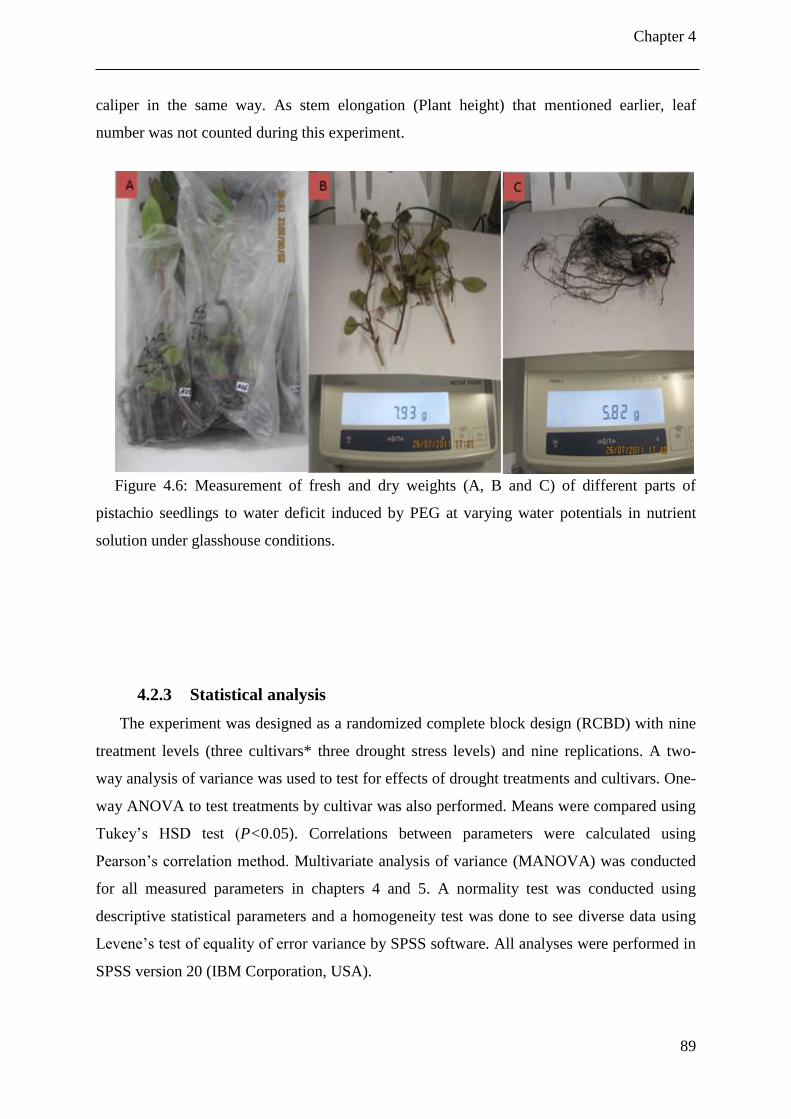
Chapter 4
89
caliper in the same way. As stem elongation (Plant height) that mentioned earlier, leaf
number was not counted during this experiment.
Figure 4.6: Measurement of fresh and dry weights (A, B and C) of different parts of
pistachio seedlings to water deficit induced by PEG at varying water potentials in nutrient
solution under glasshouse conditions.
4.2.3 Statistical analysis
The experiment was designed as a randomized complete block design (RCBD) with nine
treatment levels (three cultivars* three drought stress levels) and nine replications. A two-
way analysis of variance was used to test for effects of drought treatments and cultivars. One-
way ANOVA to test treatments by cultivar was also performed. Means were compared using
Tukey’s HSD test (P<0.05). Correlations between parameters were calculated using
Pearson’s correlation method. Multivariate analysis of variance (MANOVA) was conducted
for all measured parameters in chapters 4 and 5. A normality test was conducted using
descriptive statistical parameters and a homogeneity test was done to see diverse data using
Levene’s test of equality of error variance by SPSS software. All analyses were performed in
SPSS version 20 (IBM Corporation, USA).
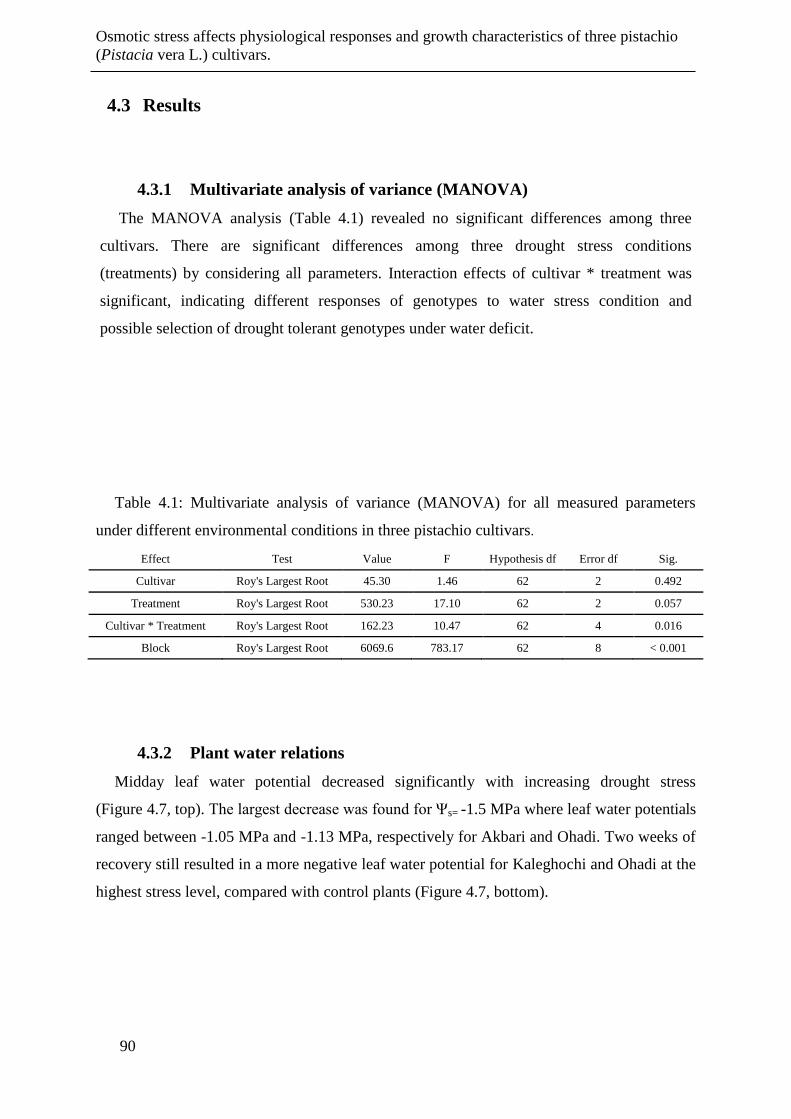
Osmotic stress affects physiological responses and growth characteristics of three pistachio
(Pistacia vera L.) cultivars.
90
4.3 Results
4.3.1 Multivariate analysis of variance (MANOVA)
The MANOVA analysis (Table 4.1) revealed no significant differences among three
cultivars. There are significant differences among three drought stress conditions
(treatments) by considering all parameters. Interaction effects of cultivar * treatment was
significant, indicating different responses of genotypes to water stress condition and
possible selection of drought tolerant genotypes under water deficit.
Table 4.1: Multivariate analysis of variance (MANOVA) for all measured parameters
under different environmental conditions in three pistachio cultivars.
Effect Test Value F Hypothesis df Error df Sig.
Cultivar Roy's Largest Root 45.30 1.46 62 2 0.492
Treatment Roy's Largest Root 530.23 17.10 62 2 0.057
Cultivar * Treatment Roy's Largest Root 162.23 10.47 62 4 0.016
Block Roy's Largest Root 6069.6 783.17 62 8 < 0.001
4.3.2 Plant water relations
Midday leaf water potential decreased significantly with increasing drought stress
(Figure 4.7, top). The largest decrease was found for Ψs= -1.5 MPa where leaf water potentials
ranged between -1.05 MPa and -1.13 MPa, respectively for Akbari and Ohadi. Two weeks of
recovery still resulted in a more negative leaf water potential for Kaleghochi and Ohadi at the
highest stress level, compared with control plants (Figure 4.7, bottom).
Chapter 4
91
4.3.3 Gas exchange parameters and WUE
Drought stress significantly decreased Pn, gs, Ci, and E, whereas WUE increased for the
three cultivars (Table 4.2). Effects remained visible after a recovery phase of 14 days. These
parameters showed no significant differences between drought stress levels after rewatering.
Pn was reduced by 60%, 33% and 34 % for Akbari, Kaleghochi, and Ohadi, respectively,
after two weeks at -1.5 MPa compared with control plants (Table 4.2), while stomatal
conductance was reduced by 50%, 66%, and 52% for Akbari, Kaleghochi, and Ohadi,
respectively, after two weeks at -1.5 MPa (Table 4.2). Leaf transpiration rates also decreased
significantly under severe drought stress compared with their respective controls for Akbari,
Kaleghochi, and Ohadi (Table 4.2).
Ohadi better maintained a high Pn, Ci, and E after 2 weeks of severe osmotic stress
compared with the other two cultivars (P < 0.5) (Table 4.2). Intrinsic water use efficiency
increased significantly when the solution’s osmotic potential was decreased, although for
Ohadi, the highest WUE was obtained after two weeks at -0.75 MPa (Table 4.2). After two
weeks of recovery, Pn, gs, Ci, and E were still significantly lower than for the control, while
WUE was higher (Table 4.2).
In short, effects of different drought stress treatments were significant on Pn, gs, Ci, E, and
WUE in both drought and recovery stages (P < 0.01). No significant interactions between
cultivar and treatments were found for the studied parameters under drought or after
rewatering (Table 4.2). Figure 4.8 shows the response of Ci/Ca to decreasing gs under drought
stress. The lowest value of Ci/Ca (0.16) occurred at gs of about 0.03 mol m-2
s-1
.
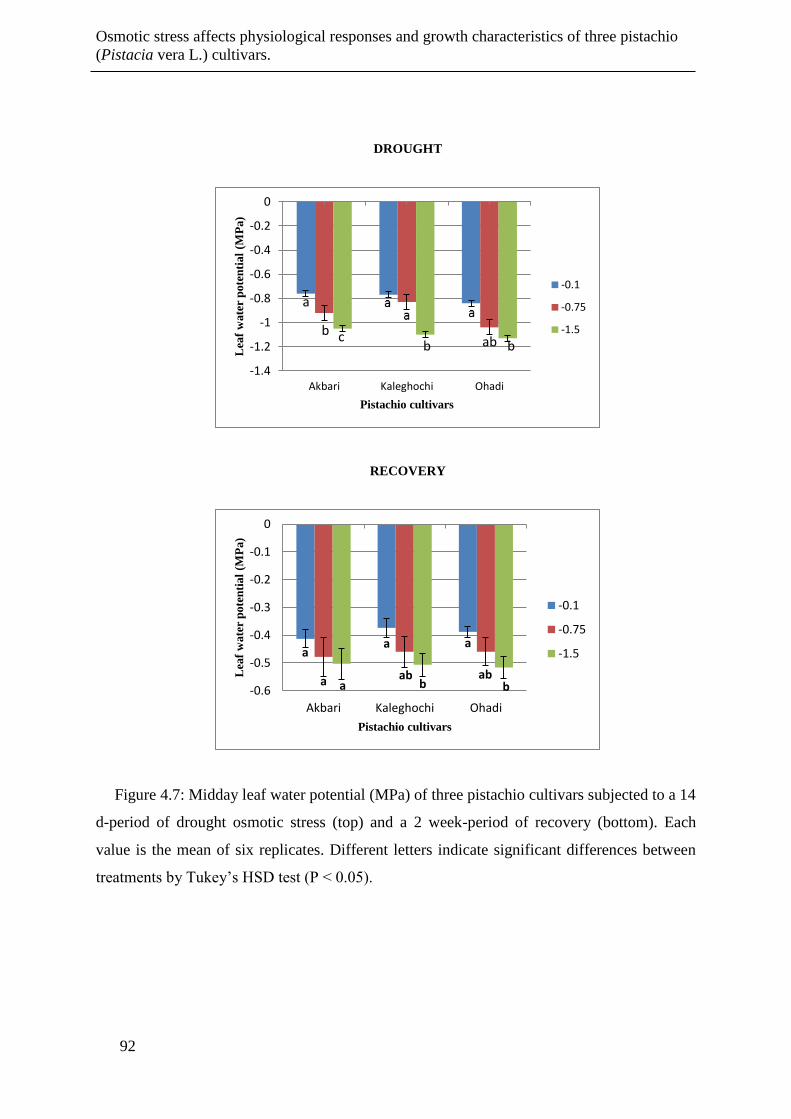
Osmotic stress affects physiological responses and growth characteristics of three pistachio
(Pistacia vera L.) cultivars.
92
DROUGHT
RECOVERY
Figure 4.7: Midday leaf water potential (MPa) of three pistachio cultivars subjected to a 14
d-period of drought osmotic stress (top) and a 2 week-period of recovery (bottom). Each
value is the mean of six replicates. Different letters indicate significant differences between
treatments by Tukey’s HSD test (P < 0.05).
-1.4
-1.2
-1
-0.8
-0.6
-0.4
-0.2
0
Akbari Kaleghochi Ohadi
Lea
f w
ate
r p
ote
nti
al
(MP
a)
Pistachio cultivars
-0.1
-0.75
-1.5
a
b c b ab b
a a a
a ab ab a b b -0.6
-0.5
-0.4
-0.3
-0.2
-0.1
0
Akbari Kaleghochi Ohadi
Lea
f w
ate
r p
ote
nti
al
(MP
a)
Pistachio cultivars
-0.1
-0.75
-1.5
Chapter 4
93
4.3.4 Chlorophyll fluorescence
Increasing osmotic drought stress decreased Fv/Fm in Akbari, yet no effect was observed
for the other cultivars. No significant differences in YII under increasing stress were observed
for the three cultivars, while qP decreased in drought-stressed Akbari and Ohadi (Table 4.3).
During recovery, effects of cultivar and interaction effects were non-significant for all
chlorophyll fluorescence parameters (Table 4.3). Overall, the effect of drought stress on NPQ
was not significant after two weeks of drought, although NPQ decreased for the severe stress
level in Akbari (Table 4.3). Significant effects were found in the recovery stage (P < 0.01);
NPQ increased in Kaleghochi and Ohadi (Table 4.3). An overall negative effect for electron
transport rate (ETR) was found after 2 weeks of drought stress whereas 2 weeks of recovery
were insufficient to restore electron transport rate (Table 4.3).
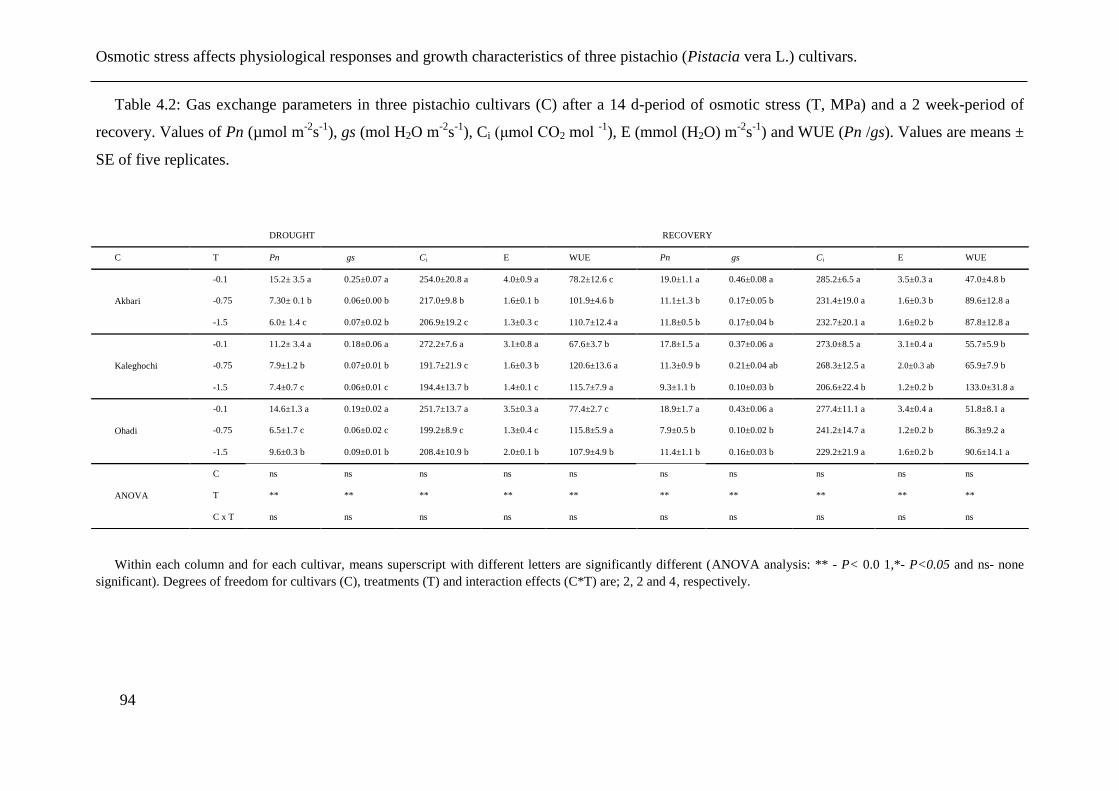
Osmotic stress affects physiological responses and growth characteristics of three pistachio (Pistacia vera L.) cultivars.
94
Table 4.2: Gas exchange parameters in three pistachio cultivars (C) after a 14 d-period of osmotic stress (T, MPa) and a 2 week-period of
recovery. Values of Pn (µmol m-2
s-1
), gs (mol H2O m-2
s-1
), Ci (μmol CO2 mol -1
), E (mmol (H2O) m-2
s-1
) and WUE (Pn /gs). Values are means ±
SE of five replicates.
Within each column and for each cultivar, means superscript with different letters are significantly different (ANOVA analysis: ** - P< 0.0 1,*- P<0.05 and ns- none
significant). Degrees of freedom for cultivars (C), treatments (T) and interaction effects (C*T) are; 2, 2 and 4, respectively.
DROUGHT RECOVERY
C T Pn gs Ci E WUE Pn gs Ci E WUE
Akbari
-0.1 15.2± 3.5 a 0.25±0.07 a 254.0±20.8 a 4.0±0.9 a 78.2±12.6 c 19.0±1.1 a 0.46±0.08 a 285.2±6.5 a 3.5±0.3 a 47.0±4.8 b
-0.75 7.30± 0.1 b 0.06±0.00 b 217.0±9.8 b 1.6±0.1 b 101.9±4.6 b 11.1±1.3 b 0.17±0.05 b 231.4±19.0 a 1.6±0.3 b 89.6±12.8 a
-1.5 6.0± 1.4 c 0.07±0.02 b 206.9±19.2 c 1.3±0.3 c 110.7±12.4 a 11.8±0.5 b 0.17±0.04 b 232.7±20.1 a 1.6±0.2 b 87.8±12.8 a
Kaleghochi
-0.1 11.2± 3.4 a 0.18±0.06 a 272.2±7.6 a 3.1±0.8 a 67.6±3.7 b 17.8±1.5 a 0.37±0.06 a 273.0±8.5 a 3.1±0.4 a 55.7±5.9 b
-0.75 7.9±1.2 b 0.07±0.01 b 191.7±21.9 c 1.6±0.3 b 120.6±13.6 a 11.3±0.9 b 0.21±0.04 ab 268.3±12.5 a 2.0±0.3 ab 65.9±7.9 b
-1.5 7.4±0.7 c 0.06±0.01 c 194.4±13.7 b 1.4±0.1 c 115.7±7.9 a 9.3±1.1 b 0.10±0.03 b 206.6±22.4 b 1.2±0.2 b 133.0±31.8 a
Ohadi
-0.1 14.6±1.3 a 0.19±0.02 a 251.7±13.7 a 3.5±0.3 a 77.4±2.7 c 18.9±1.7 a 0.43±0.06 a 277.4±11.1 a 3.4±0.4 a 51.8±8.1 a
-0.75 6.5±1.7 c 0.06±0.02 c 199.2±8.9 c 1.3±0.4 c 115.8±5.9 a 7.9±0.5 b 0.10±0.02 b 241.2±14.7 a 1.2±0.2 b 86.3±9.2 a
-1.5 9.6±0.3 b 0.09±0.01 b 208.4±10.9 b 2.0±0.1 b 107.9±4.9 b 11.4±1.1 b 0.16±0.03 b 229.2±21.9 a 1.6±0.2 b 90.6±14.1 a
ANOVA
C ns ns ns ns ns ns ns ns ns ns
T ** ** ** ** ** ** ** ** ** **
C x T ns ns ns ns ns ns ns ns ns ns
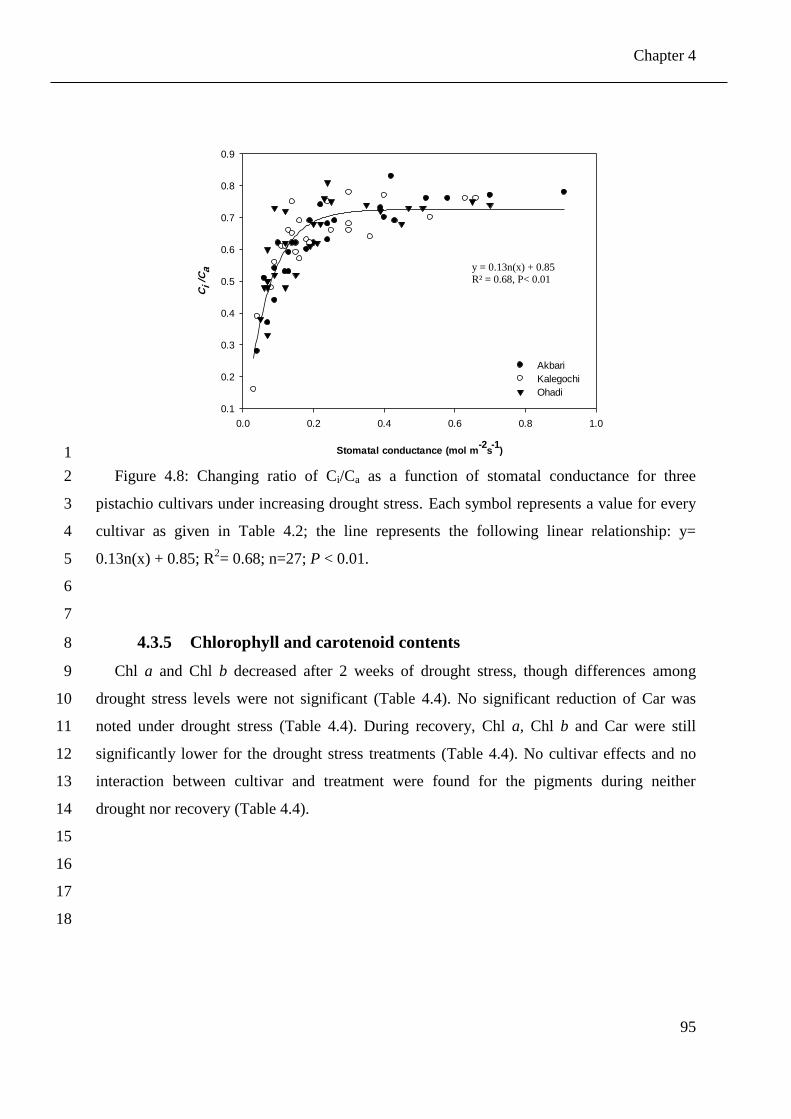
Chapter 4
95
Stomatal conductance (mol m-2
s-1
)
0.0 0.2 0.4 0.6 0.8 1.0
Ci
/Ca
0.1
0.2
0.3
0.4
0.5
0.6
0.7
0.8
0.9
Akbari
Kalegochi
Ohadi
1
Figure 4.8: Changing ratio of Ci/Ca as a function of stomatal conductance for three 2
pistachio cultivars under increasing drought stress. Each symbol represents a value for every 3
cultivar as given in Table 4.2; the line represents the following linear relationship: y= 4
0.13n(x) + 0.85; R2= 0.68; n=27; P < 0.01. 5
6
7
4.3.5 Chlorophyll and carotenoid contents 8
Chl a and Chl b decreased after 2 weeks of drought stress, though differences among 9
drought stress levels were not significant (Table 4.4). No significant reduction of Car was 10
noted under drought stress (Table 4.4). During recovery, Chl a, Chl b and Car were still 11
significantly lower for the drought stress treatments (Table 4.4). No cultivar effects and no 12
interaction between cultivar and treatment were found for the pigments during neither 13
drought nor recovery (Table 4.4). 14
15
16
17
18
y = 0.13n(x) + 0.85 R² = 0.68, P< 0.01
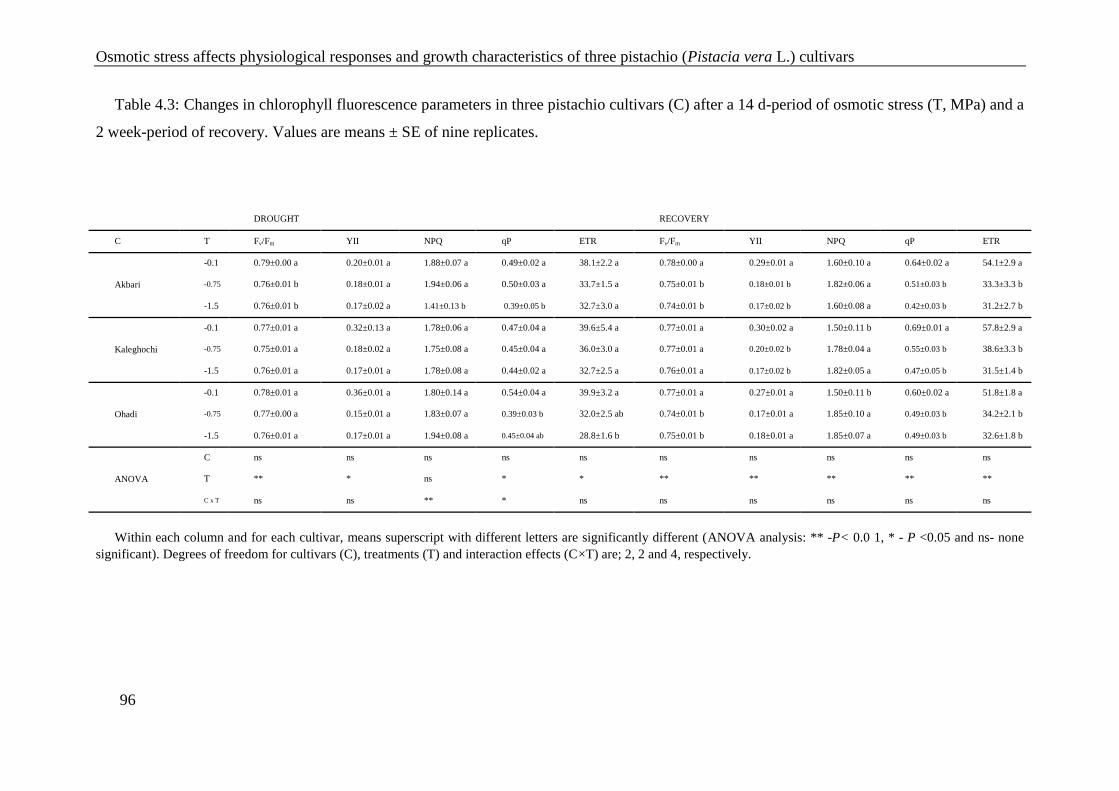
Osmotic stress affects physiological responses and growth characteristics of three pistachio (Pistacia vera L.) cultivars
96
Table 4.3: Changes in chlorophyll fluorescence parameters in three pistachio cultivars (C) after a 14 d-period of osmotic stress (T, MPa) and a
2 week-period of recovery. Values are means ± SE of nine replicates.
Within each column and for each cultivar, means superscript with different letters are significantly different (ANOVA analysis: ** -P< 0.0 1, * - P <0.05 and ns- none
significant). Degrees of freedom for cultivars (C), treatments (T) and interaction effects (C×T) are; 2, 2 and 4, respectively.
DROUGHT RECOVERY
C T Fv/Fm YII NPQ qP ETR Fv/Fm YII NPQ qP ETR
Akbari
-0.1 0.79±0.00 a 0.20±0.01 a 1.88±0.07 a 0.49±0.02 a 38.1±2.2 a 0.78±0.00 a 0.29±0.01 a 1.60±0.10 a 0.64±0.02 a 54.1±2.9 a
-0.75 0.76±0.01 b 0.18±0.01 a 1.94±0.06 a 0.50±0.03 a 33.7±1.5 a 0.75±0.01 b 0.18±0.01 b 1.82±0.06 a 0.51±0.03 b 33.3±3.3 b
-1.5 0.76±0.01 b 0.17±0.02 a 1.41±0.13 b 0.39±0.05 b 32.7±3.0 a 0.74±0.01 b 0.17±0.02 b 1.60±0.08 a 0.42±0.03 b 31.2±2.7 b
Kaleghochi
-0.1 0.77±0.01 a 0.32±0.13 a 1.78±0.06 a 0.47±0.04 a 39.6±5.4 a 0.77±0.01 a 0.30±0.02 a 1.50±0.11 b 0.69±0.01 a 57.8±2.9 a
-0.75 0.75±0.01 a 0.18±0.02 a 1.75±0.08 a 0.45±0.04 a 36.0±3.0 a 0.77±0.01 a 0.20±0.02 b 1.78±0.04 a 0.55±0.03 b 38.6±3.3 b
-1.5 0.76±0.01 a 0.17±0.01 a 1.78±0.08 a 0.44±0.02 a 32.7±2.5 a 0.76±0.01 a 0.17±0.02 b 1.82±0.05 a 0.47±0.05 b 31.5±1.4 b
Ohadi
-0.1 0.78±0.01 a 0.36±0.01 a 1.80±0.14 a 0.54±0.04 a 39.9±3.2 a 0.77±0.01 a 0.27±0.01 a 1.50±0.11 b 0.60±0.02 a 51.8±1.8 a
-0.75 0.77±0.00 a 0.15±0.01 a 1.83±0.07 a 0.39±0.03 b 32.0±2.5 ab 0.74±0.01 b 0.17±0.01 a 1.85±0.10 a 0.49±0.03 b 34.2±2.1 b
-1.5 0.76±0.01 a 0.17±0.01 a 1.94±0.08 a 0.45±0.04 ab 28.8±1.6 b 0.75±0.01 b 0.18±0.01 a 1.85±0.07 a 0.49±0.03 b 32.6±1.8 b
ANOVA
C ns ns ns ns ns ns ns ns ns ns
T ** * ns * * ** ** ** ** **
C x T ns ns ** * ns ns ns ns ns ns
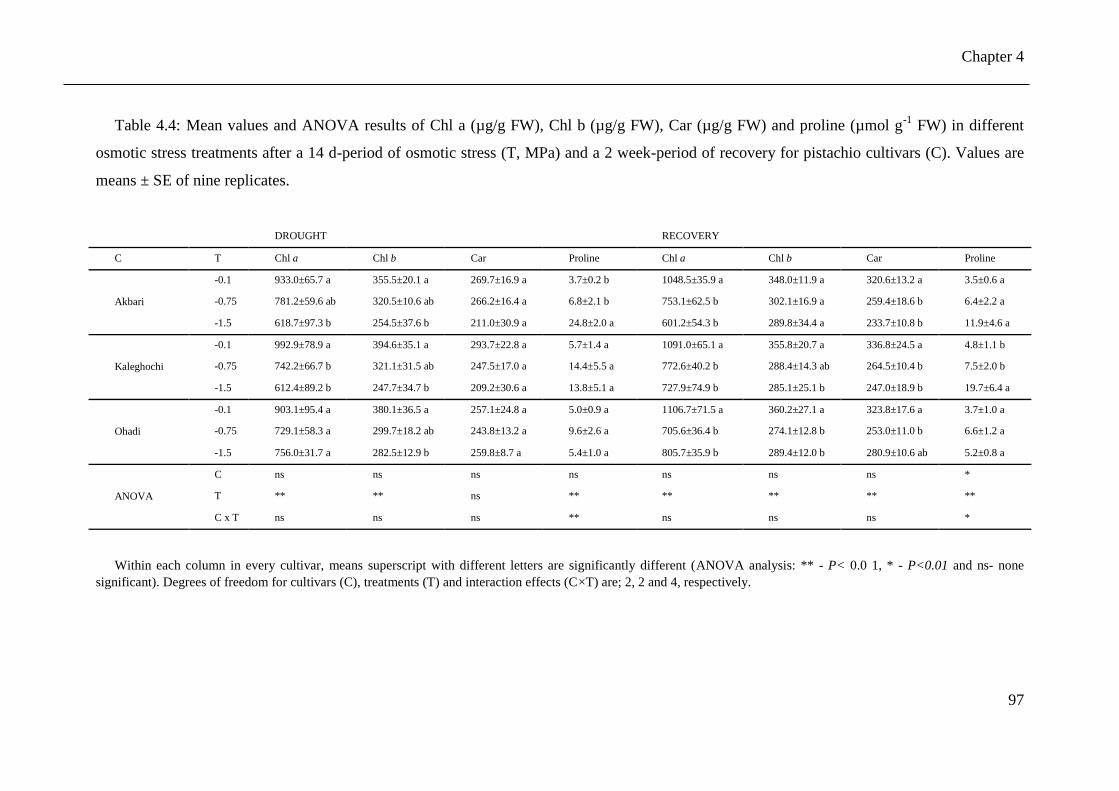
Chapter 4
97
Table 4.4: Mean values and ANOVA results of Chl a (µg/g FW), Chl b (µg/g FW), Car (µg/g FW) and proline (µmol g-1
FW) in different
osmotic stress treatments after a 14 d-period of osmotic stress (T, MPa) and a 2 week-period of recovery for pistachio cultivars (C). Values are
means ± SE of nine replicates.
DROUGHT RECOVERY
C T Chl a Chl b Car Proline Chl a Chl b Car Proline
Akbari
-0.1 933.0±65.7 a 355.5±20.1 a 269.7±16.9 a 3.7±0.2 b 1048.5±35.9 a 348.0±11.9 a 320.6±13.2 a 3.5±0.6 a
-0.75 781.2±59.6 ab 320.5±10.6 ab 266.2±16.4 a 6.8±2.1 b 753.1±62.5 b 302.1±16.9 a 259.4±18.6 b 6.4±2.2 a
-1.5 618.7±97.3 b 254.5±37.6 b 211.0±30.9 a 24.8±2.0 a 601.2±54.3 b 289.8±34.4 a 233.7±10.8 b 11.9±4.6 a
Kaleghochi
-0.1 992.9±78.9 a 394.6±35.1 a 293.7±22.8 a 5.7±1.4 a 1091.0±65.1 a 355.8±20.7 a 336.8±24.5 a 4.8±1.1 b
-0.75 742.2±66.7 b 321.1±31.5 ab 247.5±17.0 a 14.4±5.5 a 772.6±40.2 b 288.4±14.3 ab 264.5±10.4 b 7.5±2.0 b
-1.5 612.4±89.2 b 247.7±34.7 b 209.2±30.6 a 13.8±5.1 a 727.9±74.9 b 285.1±25.1 b 247.0±18.9 b 19.7±6.4 a
Ohadi
-0.1 903.1±95.4 a 380.1±36.5 a 257.1±24.8 a 5.0±0.9 a 1106.7±71.5 a 360.2±27.1 a 323.8±17.6 a 3.7±1.0 a
-0.75 729.1±58.3 a 299.7±18.2 ab 243.8±13.2 a 9.6±2.6 a 705.6±36.4 b 274.1±12.8 b 253.0±11.0 b 6.6±1.2 a
-1.5 756.0±31.7 a 282.5±12.9 b 259.8±8.7 a 5.4±1.0 a 805.7±35.9 b 289.4±12.0 b 280.9±10.6 ab 5.2±0.8 a
ANOVA
C ns ns ns ns ns ns ns *
T ** ** ns ** ** ** ** **
C x T ns ns ns ** ns ns ns *
Within each column in every cultivar, means superscript with different letters are significantly different (ANOVA analysis: ** - P< 0.0 1, * - P<0.01 and ns- none
significant). Degrees of freedom for cultivars (C), treatments (T) and interaction effects (C×T) are; 2, 2 and 4, respectively.
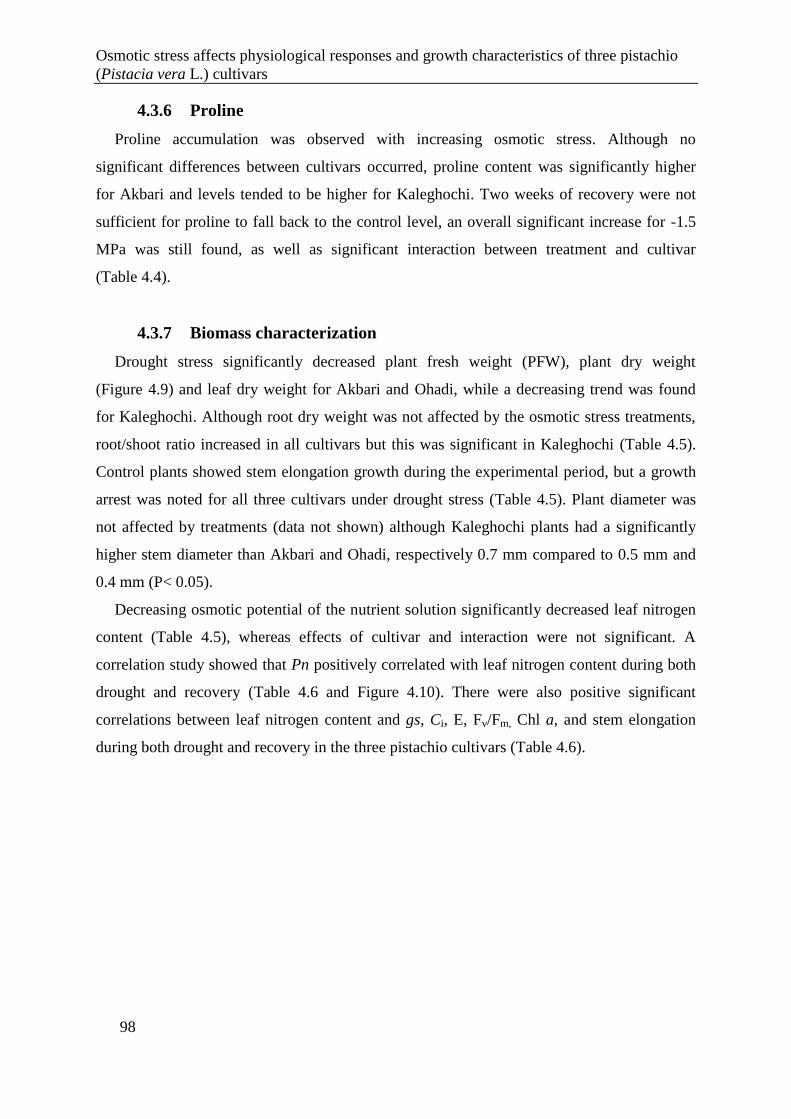
Osmotic stress affects physiological responses and growth characteristics of three pistachio
(Pistacia vera L.) cultivars
98
4.3.6 Proline
Proline accumulation was observed with increasing osmotic stress. Although no
significant differences between cultivars occurred, proline content was significantly higher
for Akbari and levels tended to be higher for Kaleghochi. Two weeks of recovery were not
sufficient for proline to fall back to the control level, an overall significant increase for -1.5
MPa was still found, as well as significant interaction between treatment and cultivar
(Table 4.4).
4.3.7 Biomass characterization
Drought stress significantly decreased plant fresh weight (PFW), plant dry weight
(Figure 4.9) and leaf dry weight for Akbari and Ohadi, while a decreasing trend was found
for Kaleghochi. Although root dry weight was not affected by the osmotic stress treatments,
root/shoot ratio increased in all cultivars but this was significant in Kaleghochi (Table 4.5).
Control plants showed stem elongation growth during the experimental period, but a growth
arrest was noted for all three cultivars under drought stress (Table 4.5). Plant diameter was
not affected by treatments (data not shown) although Kaleghochi plants had a significantly
higher stem diameter than Akbari and Ohadi, respectively 0.7 mm compared to 0.5 mm and
0.4 mm (P< 0.05).
Decreasing osmotic potential of the nutrient solution significantly decreased leaf nitrogen
content (Table 4.5), whereas effects of cultivar and interaction were not significant. A
correlation study showed that Pn positively correlated with leaf nitrogen content during both
drought and recovery (Table 4.6 and Figure 4.10). There were also positive significant
correlations between leaf nitrogen content and gs, Ci, E, Fv/Fm, Chl a, and stem elongation
during both drought and recovery in the three pistachio cultivars (Table 4.6).
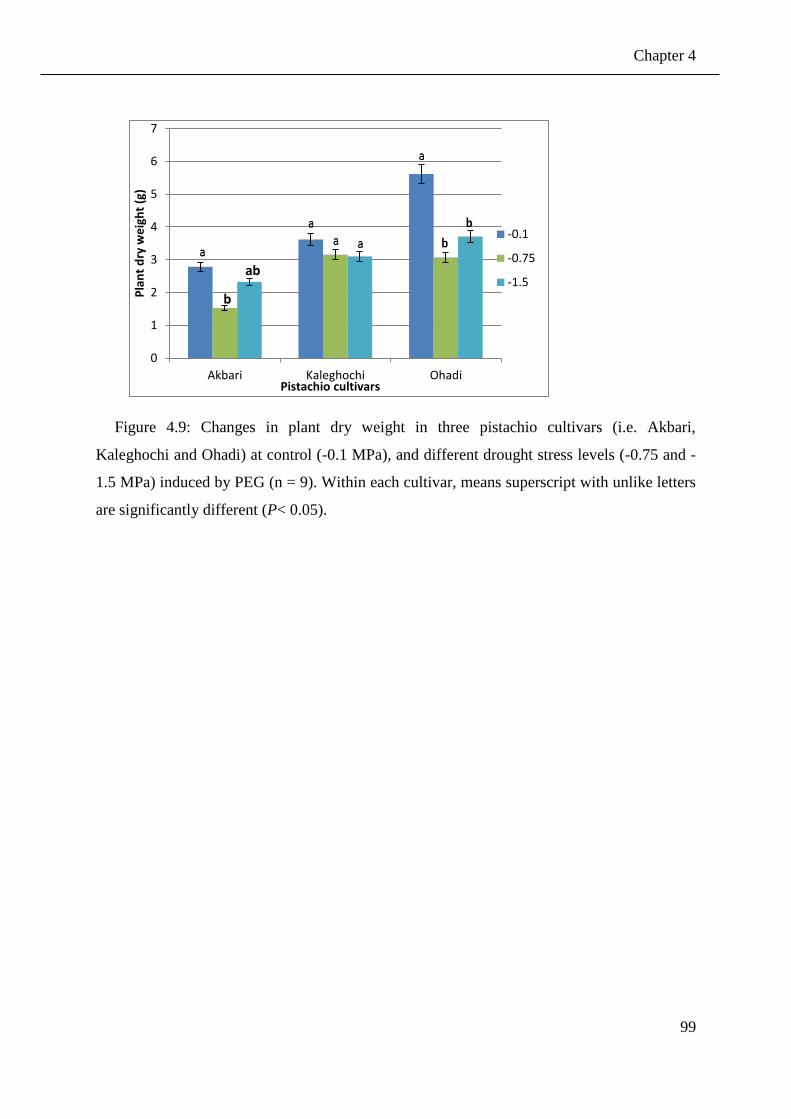
Chapter 4
99
Figure 4.9: Changes in plant dry weight in three pistachio cultivars (i.e. Akbari,
Kaleghochi and Ohadi) at control (-0.1 MPa), and different drought stress levels (-0.75 and -
1.5 MPa) induced by PEG (n = 9). Within each cultivar, means superscript with unlike letters
are significantly different (P< 0.05).
a
0
1
2
3
4
5
6
7
Akbari Kaleghochi Ohadi
Pla
nt
dry
we
igh
t (g
)
Pistachio cultivars
-0.1
-0.75
-1.5
b
ab
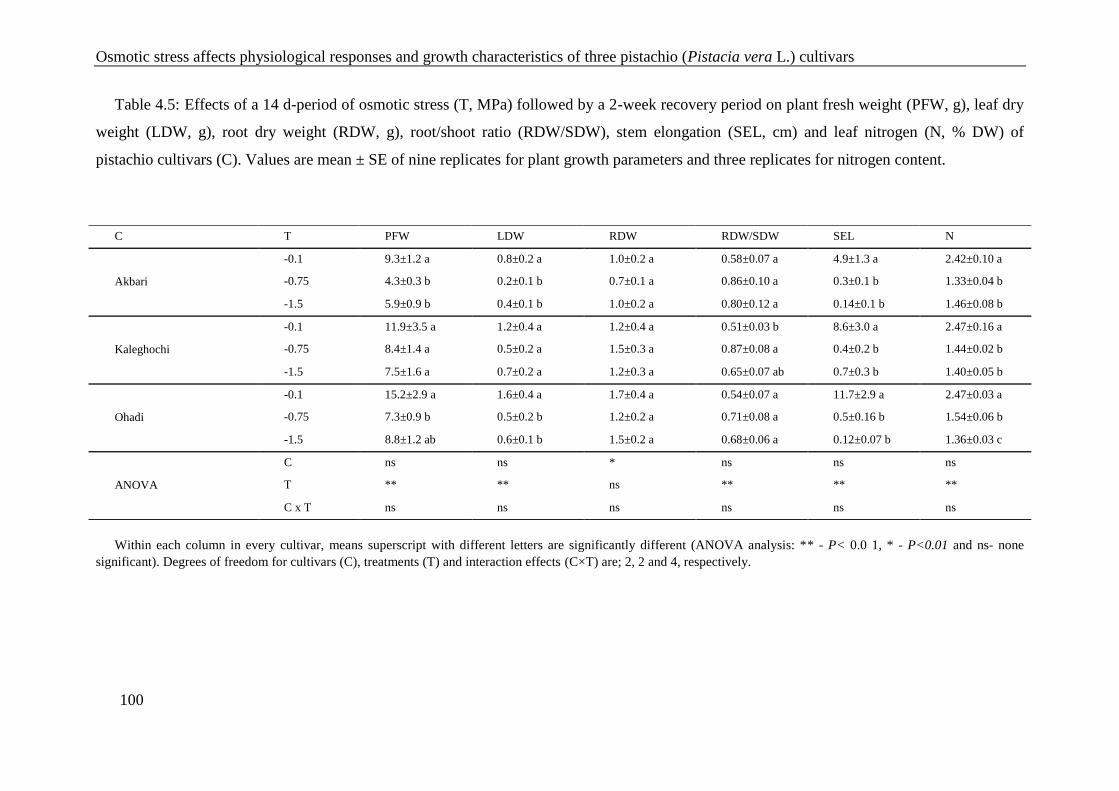
Osmotic stress affects physiological responses and growth characteristics of three pistachio (Pistacia vera L.) cultivars
100
Table 4.5: Effects of a 14 d-period of osmotic stress (T, MPa) followed by a 2-week recovery period on plant fresh weight (PFW, g), leaf dry
weight (LDW, g), root dry weight (RDW, g), root/shoot ratio (RDW/SDW), stem elongation (SEL, cm) and leaf nitrogen (N, % DW) of
pistachio cultivars (C). Values are mean ± SE of nine replicates for plant growth parameters and three replicates for nitrogen content.
Within each column in every cultivar, means superscript with different letters are significantly different (ANOVA analysis: ** - P< 0.0 1, * - P<0.01 and ns- none
significant). Degrees of freedom for cultivars (C), treatments (T) and interaction effects (C×T) are; 2, 2 and 4, respectively.
C T PFW LDW RDW RDW/SDW SEL N
Akbari
-0.1 9.3±1.2 a 0.8±0.2 a 1.0±0.2 a 0.58±0.07 a 4.9±1.3 a 2.42±0.10 a
-0.75 4.3±0.3 b 0.2±0.1 b 0.7±0.1 a 0.86±0.10 a 0.3±0.1 b 1.33±0.04 b
-1.5 5.9±0.9 b 0.4±0.1 b 1.0±0.2 a 0.80±0.12 a 0.14±0.1 b 1.46±0.08 b
Kaleghochi
-0.1 11.9±3.5 a 1.2±0.4 a 1.2±0.4 a 0.51±0.03 b 8.6±3.0 a 2.47±0.16 a
-0.75 8.4±1.4 a 0.5±0.2 a 1.5±0.3 a 0.87±0.08 a 0.4±0.2 b 1.44±0.02 b
-1.5 7.5±1.6 a 0.7±0.2 a 1.2±0.3 a 0.65±0.07 ab 0.7±0.3 b 1.40±0.05 b
Ohadi
-0.1 15.2±2.9 a 1.6±0.4 a 1.7±0.4 a 0.54±0.07 a 11.7±2.9 a 2.47±0.03 a
-0.75 7.3±0.9 b 0.5±0.2 b 1.2±0.2 a 0.71±0.08 a 0.5±0.16 b 1.54±0.06 b
-1.5 8.8±1.2 ab 0.6±0.1 b 1.5±0.2 a 0.68±0.06 a 0.12±0.07 b 1.36±0.03 c
ANOVA
C ns ns * ns ns ns
T ** ** ns ** ** **
C x T ns ns ns ns ns ns
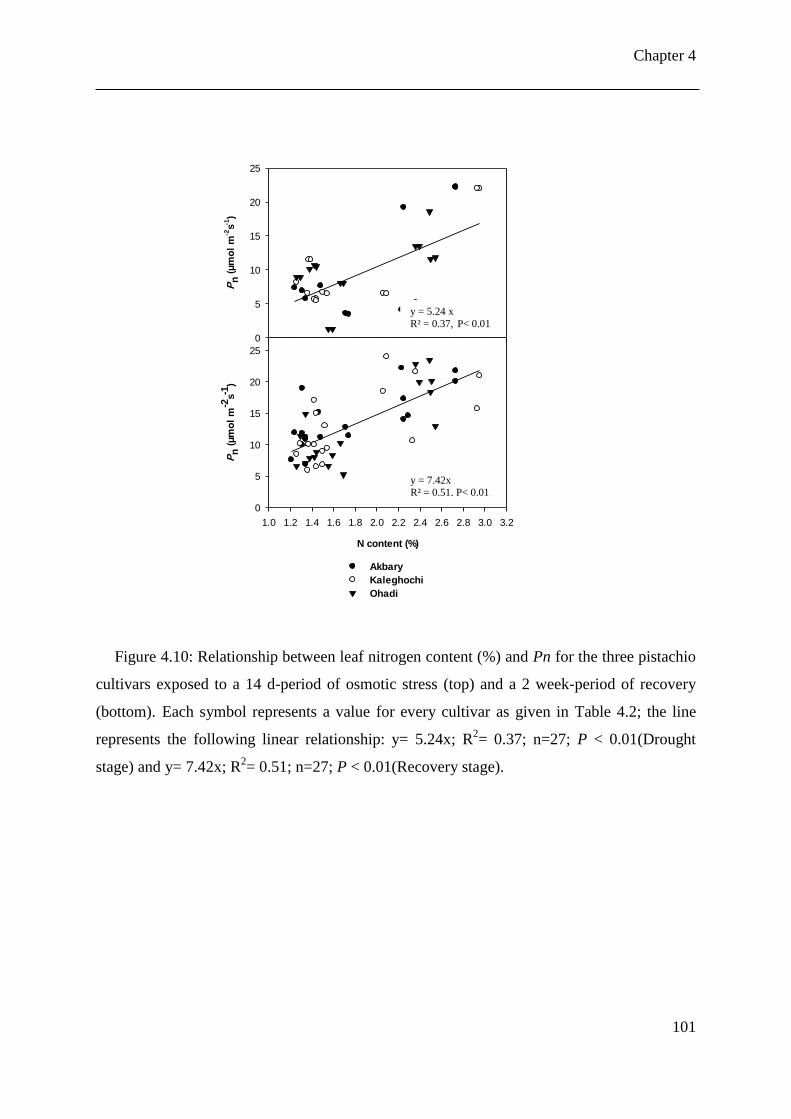
Chapter 4
101
Figure 4.10: Relationship between leaf nitrogen content (%) and Pn for the three pistachio
cultivars exposed to a 14 d-period of osmotic stress (top) and a 2 week-period of recovery
(bottom). Each symbol represents a value for every cultivar as given in Table 4.2; the line
represents the following linear relationship: y= 5.24x; R2= 0.37; n=27; P < 0.01(Drought
stage) and y= 7.42x; R2= 0.51; n=27; P < 0.01(Recovery stage).
Pn(µmolm
-2s-1
)
0
5
10
15
20
25
N content (%)
1.0 1.2 1.4 1.6 1.8 2.0 2.2 2.4 2.6 2.8 3.0 3.2
Pn(µmolm
-2s-1
)
0
5
10
15
20
25
Akbary
Kaleghochi
Ohadi
y = 5.24 x
R² = 0.37, P< 0.01
y = 7.42x R² = 0.51, P< 0.01
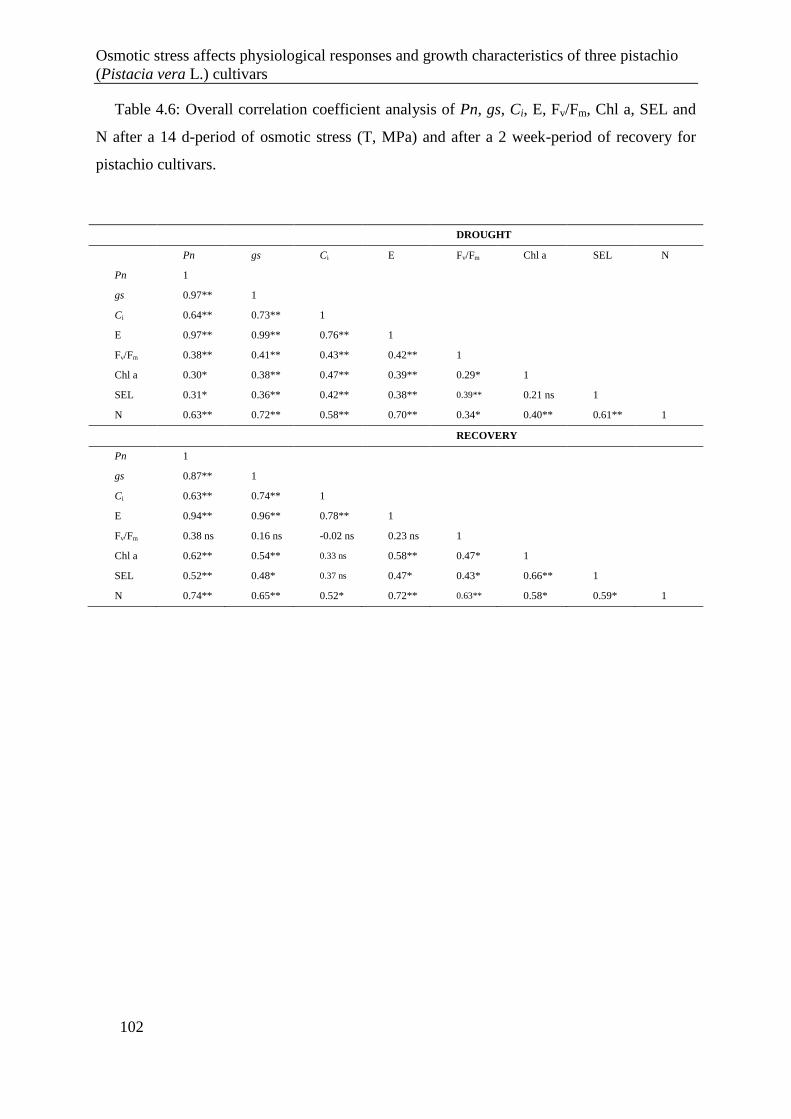
Osmotic stress affects physiological responses and growth characteristics of three pistachio
(Pistacia vera L.) cultivars
102
Table 4.6: Overall correlation coefficient analysis of Pn, gs, Ci, E, Fv/Fm, Chl a, SEL and
N after a 14 d-period of osmotic stress (T, MPa) and after a 2 week-period of recovery for
pistachio cultivars.
DROUGHT
Pn gs Ci E Fv/Fm Chl a SEL N
Pn 1
gs 0.97** 1
Ci 0.64** 0.73** 1
E 0.97** 0.99** 0.76** 1
Fv/Fm 0.38** 0.41** 0.43** 0.42** 1
Chl a 0.30* 0.38** 0.47** 0.39** 0.29* 1
SEL 0.31* 0.36** 0.42** 0.38** 0.39** 0.21 ns 1
N 0.63** 0.72** 0.58** 0.70** 0.34* 0.40** 0.61** 1
RECOVERY
Pn 1
gs 0.87** 1
Ci 0.63** 0.74** 1
E 0.94** 0.96** 0.78** 1
Fv/Fm 0.38 ns 0.16 ns -0.02 ns 0.23 ns 1
Chl a 0.62** 0.54** 0.33 ns 0.58** 0.47* 1
SEL 0.52** 0.48* 0.37 ns 0.47* 0.43* 0.66** 1
N 0.74** 0.65** 0.52* 0.72** 0.63** 0.58* 0.59* 1
Chapter 4
103
4.4 Discussion
Midday leaf water potential (Ψl) is a sensitive indicator of drought stress (Naor, 1999).
Decreasing leaf water potential with increasing drought stress is known as a mechanism of
plants to survive drought stress conditions (Anjum et al., 2011; Ashraf et al., 2004; Rouhi et
al., 2007). Drought-tolerant plants are expected to reach lower leaf osmotic potentials than
drought-sensitive ones when exposed to water deficit conditions (Anjum et al., 2011; Porcel
and Ruiz-Lozano, 2004; Rouhi et al., 2007). In this study, midday leaf water potential
became more negative with increasing osmolality of the nutrient solution. Under severe
osmotic stress Ψl reached -1.05, -1.10 and -1.13 MPa for Akbari, Kaleghochi and Ohadi,
respectively (Figure 4.7) indicating that osmotic adjustment is present in the three cultivars.
Yet, the decrease compared with the control (ΔΨl) was limited, and averaged 0.29-0.30 MPa
for the three cultivars. This reflects the isohydric behavior of the cultivars as already shown
by Fardooei (2001) for P. khinjuk and P. mutica. Tardieu and Simonneau (1998) classified
plant species as isohydric if midday Ψl remains similar across varying soil water deficits and
a tight stomatal control is present. Stomatal closure protected against water loss and resulted
in a higher intrinsic WUE under drought stress (Table 4.2); though no cultivar differences
were found. A recovery of two weeks reduced ΔΨl to 0.09-0.14 MPa suggesting that some
osmotic adjustment was still operational.
Net photosynthesis under well-watered conditions was higher in leaves of Akbari and
Ohadi than that of Kaleghochi. Furthermore, photosynthetic rates in this study (Table 4.2)
were higher than those found for P. khinjuk and P. mutica which ranged from 9.7 to 11.7
µmol CO2 m-2
s-1
, respectively (Ranjbarfordoei et al., 2000). Exposure to a 14-d drought stress
period significantly declined photosynthesis and gs for the three studied pistachio cultivars,
although photosynthetic rates remained higher in Ohadi than in the two other cultivars under
severe drought. These results are in agreement with previous work on Pistachio species
(Bagheri et al., 2011; Behboudian et al., 1986; Germana, 1996; Goldhamer et al., 1985). A
recovery phase of 14 days, however, was insufficient for restoring the plant’s photosynthetic
capacity. The gs of these plants remained at a lower level than that of well-watered control
plants after 2 weeks of recovery (Table 4.2) (Flexas et al., 2009; Gallé and Feller, 2007). This
indicates that the photosynthetic performance of pistachio cultivars did not recover fast from
the applied osmotic stress. Romero et al. (2004a) found a range of responses in drought-
stressed almond (Prunus dulcis) varieties, going from partial recovery to rapid recovery of
Osmotic stress affects physiological responses and growth characteristics of three pistachio
(Pistacia vera L.) cultivars
104
photosynthetic capacity clearly showing varietal differences. In general, plants submitted to
mild drought stress recover fast, after within one day (Chaves et al., 2009), whereas plants
submitted to severe drought stress regain only 40-60 % of their maximum photosynthesis
ability during the day after re-watering, and recovery continues during the following days.
Sometimes maximum photosynthesis rates are not recovered even after a number of days
(Chaves et al., 2009), which was also the case for all three pistachio cultivars in our
experiment.
Both stomatal and non-stomatal limitations can reduce net photosynthesis (Behboudian et
al., 1986; Fardooei, 2001; Flexas et al., 2009). In our test, the reductions in Pn and gs were
accompanied by a reduction in Ci (Table 4.2). The cultivars responded very similarly with a
strong reduction in Ci at Ψs= -0.75 MPa. This decrease in Ci indicates that stomatal
limitations dominate with moderate osmotic drought stress, irrespective of any metabolic
impairment. This can also be concluded from the relation between Ci/Ca and gs (Figure 4.8)
as no inflection point [where the ratio increases again at low gs] were found. In most cases,
the point at which Ci starts to increase occurs at a gs value of around 0.050 mol H2O m–2
s–1
(Flexas et al., 2002). Such low gs values were hardly reached in our experiment; thus,
stomatal conductance could be the dominating factor limiting photosynthesis in the studied
pistachio cultivars.
Yet, non-stomatal factors can also affect photosynthesis. Ogren and Oquist (1985)
reported that the degree of drought stress defines how Pn is affected: under low drought
stress, Pn is limited by stomatal closure, whereas under more severe drought stress non-
stomatal factors prevail. Slow recovery of photosynthesis in our pistachio cultivars might
indicate that oxidative stress occurred. Overproduction of ROS in plant cells under stress can
damage cellular components, including DNA, proteins and membrane lipids (Gill and Tuteja,
2010; Rejeb et al., 2014), and lead to destruction of photosynthetic pigments (Yordanov et
al., 2000).
Moreover, gs remained relatively low with values between 0.10 and 0.20 mol H2O m-2
s-1
after 2 weeks of recovery. Indeed, the decline in Fv/Fm for Akbari both under drought
treatment and after recovery indicates damage to PSII (Maxwell and Johnson, 2000). We also
found significant correlations between photosynthetic rates and Fv/Fm during drought stress
(P< 0.01). Similar results were found with P. vera Ahmadaghaii under drought stress (Habibi
and Hajiboland, 2013), although Fv/Fm was not affected for P.vera Badami and Qazvini
(Bagheri et al., 2011). In our study, the down-regulation of YII and qP was more apparent
Chapter 4
105
during the recovery phase. Thermal dissipation as indicated by higher NPQ values led to
removal of excess excitation energy at this point for all three cultivars. Ranjbarfordoei et al.
(2000) also found that thermal dissipation increased under drought stress in P. mutica and P.
khinjuk. This excess excited energy favors high production rates of ROS and might be partly
responsible for the degradation of chlorophyll pigments in the three cultivars. Photosynthetic
pigments play a major role in maintaining photosynthetic ability of most plants. There were
significant correlations between photosynthetic rates with Chl a contents in both drought (P<
0.05) and recovery (P< 0.01) stages. Farghali (1998) linked the decrease in chlorophyll
pigments under drought stress not only to degradation, but also to an increase in soluble stress
proteins which in turn led to decreased chlorophyll content due to inhibition of proto-
chlorophyll synthesis. This decrease in photosynthetic pigments was also observed for
cultivated and wild pistachio species under drought conditions (Abbaspour et al., 2012b;
Bagheri et al., 2011; Ranjbarfordoei et al., 2000). In the present research, leaf nitrogen
content was significantly lower under osmotic stress (Table 4.5) and this reduction correlated
well with reduced Pn and Chl a content during drought and recovery (Table 4.6, Figure 4.10).
Photosynthetic rate is generally closely correlated to leaf nitrogen. This close correlation has
been attributed to the large fraction of total organic nitrogen allocated to chloroplasts (Evans,
1989). Decreasing photosynthesis under drought stress will in turn impair primary nitrogen
assimilation (Bauer et al., 1997; Xu and Zhou, 2006). Lower leaf nitrogen levels are probably
also linked to chloroplast degradation under increasing stress as also chlorophyll content
decreased (Table 4.4). Reduced leaf nitrogen levels might thus be an early signal for the onset
of gradual leaf abscission under drought. Indeed, gradual leaf abscission is an adaptation to
drought stress in many plants and Del Arco et al. (1991) calculated a N retranslocation
percentage averaging 45.6 % for deciduous trees prior to leaf abscission. During the initial
but still reversible phase of leaf senescence stromal enzymes are degraded which also leads to
the observed photosynthesis decline. Amino acids derived from this enzyme degradation can
be exported via the phloem and are translocated to the root system in woody plants
(Hörtensteiner and Feller, 2002). In other plant species, such as tomato, remobilization of
nitrogen under drought stress occurs to meet the requirements of rapidly developing fruits.
The leaf nitrogen pool was 1.5 times higher under drought stress than in control plants, and
this was mainly due to an increase of glutamate and aspartate (Bauer et al., 1997).
Under osmotic stress, proline is synthesized mainly from glutamate (Rejeb et al., 2014).
Increased accumulation of proline has been correlated with improved tolerance to various
Osmotic stress affects physiological responses and growth characteristics of three pistachio
(Pistacia vera L.) cultivars
106
abiotic stresses especially salt and drought (Rejeb et al., 2014; Signorelli et al., 2013). Proline
accumulation in plants acts as an osmotic adjustment mediator as well as a component of the
non-enzymatic antioxidative defense system (Rejeb et al., 2014; Saradhi, 1991). In this study,
proline concentration increased with increasing osmotic stress. Akbari showed even a 6-fold
increase for the highest osmotic stress, whereas proline accumulation did not play any
significant role in Ohadi and Kaleghochi (Table 4.4). We observed a reduced electron
transport rate (ETR) in pistachio under increasing osmotic stress, which would indicate a
reduced redox potential regulation (Table 4.3). Proline metabolism is linked to NAD (P)
H/NAD (P)+ redox balance (Miller et al., 2010; Rejeb et al., 2014). Increased proline in
biosynthesis in chloroplasts during stress can maintain a low NADPH:NADP+ ratio,
contributes to sustain the electron flow between photosynthetic excitation centers (ETR),
stabilizes the redox balance, and reduces photoinhibition and damage to the photosynthetic
apparatus (Hare and Cress, 1997; Rejeb et al., 2014).
Free proline is also an osmoprotectant and will under decreasing leaf water potential-
accumulate in the cytosol although vacuolar accumulation of carbohydrates will also
contribute. Proline will thus also contribute to the osmotic adjustment of pistachio in our
case, especially in Akbari, and will help to maintain leaf turgor pressure. These results are
consistent with the results of Panahi (2009) and Ranjbarfordoei et al. (2000) on cultivated and
wild pistachio species and Rouhi et al. (2007) on almond species. However, it must be noted
that although proline accumulation has been shown to occur in conjunction with osmotic
adjustment in drought-tolerant species, it may also be accumulated in drought-susceptible
cultivars as a symptom of stress as in cassava (Manihot esculenta crantz) (Sundaresan and
Sudhakaran, 1996) and Phaseolus spp. (Andrade et al., 1995). A higher proline accumulation
is not always indicative for a greater drought tolerance (Sánchez-Rodríguez et al., 2010). For
instance, a significant rise in proline content was reported under moderate drought stress in
cherry tomato, though the lowest level of proline was found in ‘Zarin’ a drought tolerant
cultivar. As for the other studied parameters, a recovery period of two weeks was insufficient
to return to basal proline levels for the highest osmotic stress.
Osmotic stress resulted in growth arrest for all cultivars, and no regrowth was observed
after 2 weeks of recovery. Under severe water deficiency, cell elongation of higher plants will
be inhibited by an interruption in water flow from the xylem to the surrounding elongating
cells (Nonami, 1998), but nitrogen content also has noticeable effects on shoot growth of
pistachio seedlings (Afrousheh et al., 2010). Thus, in this experiment drought induced
Chapter 4
107
nitrogen reallocation could be another factor that induced growth arrest. Overall growth
reduction observed in our experiment can be attributed to a decrease in leaf biomass
formation, not to shoot or root biomass production. Decrease in total fresh weight of pistachio
cultivars tested with increasing drought is in line with those of other pistachio species
(Abbaspour et al., 2012b; Ranjbarfordoei et al., 2000).
Root growth is generally less sensitive to drought stress compared to other biomass
components (Hsiao and Xu, 2000). The capacity of osmotic adjustment and turgor
maintenance in roots may influence root (root partitioning patterns and root growth) and leaf
responses to water deficits through indirect effects of root-produced plant growth (Ranney et
al., 1991; Turner, 1986b). An increase in root/shoot ratio has been proposed as one of the
mechanisms involved in the adaptation of plants to drought stress (Turner, 1997). In our
study, increasing root/shoot ratios under osmotic stress are only related to a decrease in
aboveground biomass and more specifically, leaf biomass (Table 4.5).
Under control conditions, Ohadi maintained the highest leaf and root dry weight compared
to both other cultivars (Table 4.5) but this cultivar showed the largest decrease for all plant
growth parameters in reaction to drought stress. Despite this strong decrease in biomass, the
photosynthetic rate of Ohadi plants remained significantly higher under severe osmotic stress
compared to the other two cultivars. For plants that grow mainly in semi-arid areas, such as
pistachio, a well-developed root system is effective in exploiting deep soil water (Ferguson et
al., 2005; Panahi et al., 2002). Ohadi had a higher root mass both in control and osmotic
stress treatments, which suggests a better adaptation to semi-arid environments.
4.5 Conclusions
Pistachio trees are considered to be drought-tolerant, yet the applied osmotic drought
stress induced significant changes in gas exchange parameters (decreased Pn accompanied by
decreased gs, Ci, and E), reductions in chlorophyll fluorescence parameters (Fv/Fm and qP),
reduction in chlorophyll pigments and nitrogen content of leaves and an increase in proline
levels. The recovery period from the applied stress was longer than expected as after two
weeks of recovery, negative effects of the stress were still present in photosynthesis and
chlorophyll fluorescence parameters. Although, MANOVA analysis (Table 4.1) indicated
that the results were not significantly different for the three tested cultivars, while interaction

Osmotic stress affects physiological responses and growth characteristics of three pistachio
(Pistacia vera L.) cultivars
108
effects between cultivars and treatment was significant. Therefore, there is a possibility of
differences between different cultivars and treatments in some measured variables.
Based on the reduction in photosynthesis and increase in proline content, Akbari seems
more sensitive to the applied drought stress than Ohadi and Kaleghochi cultivars. However,
some caution must be exercised as the results were obtained using PEG and further research
in field conditions is needed to confirm this survey’s research.
Chapter 5
109
Impact of osmotic drought stress on the biochemical Chapter 5.
characteristics, water relations, and nitrogen and carbon
isotope composition of pistachio (Pistacia vera L.) cultivars
Adapted from:
Esmaeilpour, A., M. C. Van Labeke, R. Samson and P. Van Damme. 2014. Variation of
Relative Water Content, Water Use Efficiency and Stomatal Density during Drought Stress
and Subsequent Recovery in Pistachio Cultivars (Pistacia vera L.). The 29th
international
horticultural congress (IHC2014). Brisbane, Australia.
Esmaeilpour, Ali; Van Labeke, Marie-Christine; Samson, Roeland; P. Boeckx; Van Damme,
Patrick. 2016. Variation in biochemical characteristics, water status, stomata features, leaf
carbon isotope composition and its relationship to water use efficiency in pistachio (Pistacia
vera L.) cultivars under drought stress condition. Scientia Horticulturae 211, 158-166.
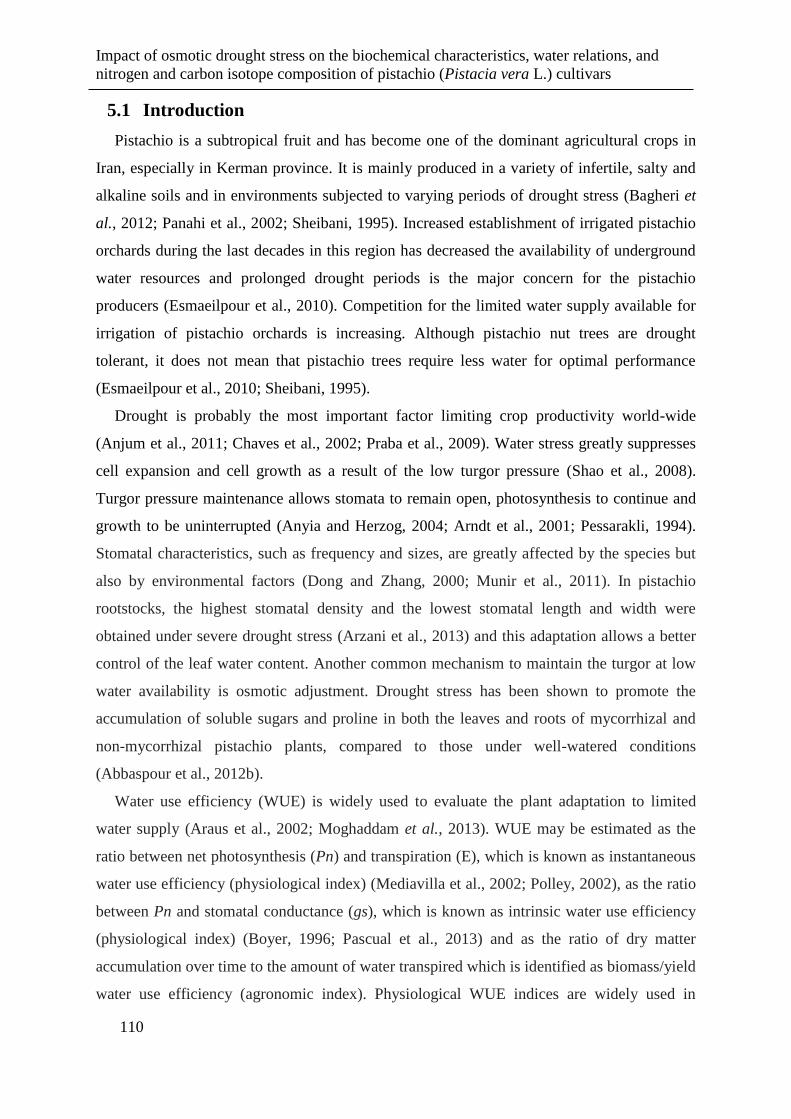
Impact of osmotic drought stress on the biochemical characteristics, water relations, and
nitrogen and carbon isotope composition of pistachio (Pistacia vera L.) cultivars
110
5.1 Introduction
Pistachio is a subtropical fruit and has become one of the dominant agricultural crops in
Iran, especially in Kerman province. It is mainly produced in a variety of infertile, salty and
alkaline soils and in environments subjected to varying periods of drought stress (Bagheri et
al., 2012; Panahi et al., 2002; Sheibani, 1995). Increased establishment of irrigated pistachio
orchards during the last decades in this region has decreased the availability of underground
water resources and prolonged drought periods is the major concern for the pistachio
producers (Esmaeilpour et al., 2010). Competition for the limited water supply available for
irrigation of pistachio orchards is increasing. Although pistachio nut trees are drought
tolerant, it does not mean that pistachio trees require less water for optimal performance
(Esmaeilpour et al., 2010; Sheibani, 1995).
Drought is probably the most important factor limiting crop productivity world-wide
(Anjum et al., 2011; Chaves et al., 2002; Praba et al., 2009). Water stress greatly suppresses
cell expansion and cell growth as a result of the low turgor pressure (Shao et al., 2008).
Turgor pressure maintenance allows stomata to remain open, photosynthesis to continue and
growth to be uninterrupted (Anyia and Herzog, 2004; Arndt et al., 2001; Pessarakli, 1994).
Stomatal characteristics, such as frequency and sizes, are greatly affected by the species but
also by environmental factors (Dong and Zhang, 2000; Munir et al., 2011). In pistachio
rootstocks, the highest stomatal density and the lowest stomatal length and width were
obtained under severe drought stress (Arzani et al., 2013) and this adaptation allows a better
control of the leaf water content. Another common mechanism to maintain the turgor at low
water availability is osmotic adjustment. Drought stress has been shown to promote the
accumulation of soluble sugars and proline in both the leaves and roots of mycorrhizal and
non-mycorrhizal pistachio plants, compared to those under well-watered conditions
(Abbaspour et al., 2012b).
Water use efficiency (WUE) is widely used to evaluate the plant adaptation to limited
water supply (Araus et al., 2002; Moghaddam et al., 2013). WUE may be estimated as the
ratio between net photosynthesis (Pn) and transpiration (E), which is known as instantaneous
water use efficiency (physiological index) (Mediavilla et al., 2002; Polley, 2002), as the ratio
between Pn and stomatal conductance (gs), which is known as intrinsic water use efficiency
(physiological index) (Boyer, 1996; Pascual et al., 2013) and as the ratio of dry matter
accumulation over time to the amount of water transpired which is identified as biomass/yield
water use efficiency (agronomic index). Physiological WUE indices are widely used in
Chapter 5
111
comparative studies involving plant responses to changes in water supply and demand
(Cabrera-Bosquet et al., 2009; Condon et al., 2004) and provide information about the
physiological performance in response to short-term changes in the plant water status
(Centritto et al., 2002). In pistachio, WUE varies with different fruit growth stages and
cultivars (Sajjadinia et al., 2010). It was shown that intrinsic WUE values increased in wild
almonds (Prunus dulcis) (Rouhi et al., 2007) and Ziziphus rotundifolia Lamk. (Rhamnaceae)
(Arndt et al., 2001) by increasing drought stress. In contrast, WUE was not affected under
drought in two wild pistachio species (P. mutica and P. khinjuk) (Ranjbarfordoei et al., 2002).
A decreasing stomatal conductance results in increasing WUE and declining leaf
intercellular CO2 (Ci) and consequently decreasing carbon isotope discrimination (Δ).
Therefore, there should be a negative relation between WUE and Δ due to the independent
relation between Ci and Δ or WUE (Farquhar et al., 1989; Farquhar and Sharkey, 1982;
Saugier et al., 2012). In breeding programs, the variation in the CO2 assimilation to stomatal
conductance or water transpiration ratio can be exploited by indirect selection for WUE via Δ
(Moghaddam et al., 2013). Carbon isotope discrimination (Δ) decreased with increasing
salinity in the leaves, stems and roots of pistachio (P. vera) seedlings (Hokmabadi et al.,
2005). Yet, carbon isotope discrimination values can vary in different plant species.
Alternatively the leaf carbon isotope composition (δ13
C) can be measured. The latter
parameter is positively linked to instantaneous WUE and intrinsic WUE in C3 plants
(Farquhar et al., 1989) especially in wheat (Cabrera-Bosquet et al., 2009), and grapevine (de
Souza et al., 2005). Carbon isotope ratios of Pistacia lentiscus, Quercus ilex and Phillyrea
argustifoli showed similar δ13
C values, while two deciduous oak species, Q. pubescens and
Q. cerris, had lower δ13
C values in a Mediterranean ecosystem (Valentini et al., 1992).
Decreasing water availability will also reduce the N availability and use and this could be
assessed by nitrogen isotope composition (δ15
N). In durum wheat (Triticum durum) root δ15
N
increased under drought stress while the same stress treatments significantly decreased shoot
δ15
N (Yousfi et al., 2012). In broccoli (Brassica oleracea), it was found that high salinity
significantly decreased nitrogen isotope discrimination and increased carbon isotope
discrimination in leaf dry matter (Del Amor and Cuadra-Crespo, 2011). Carbon and nitrogen
isotope ratios constitute a tool that is widely used to detect environmental effects especially in
forests and herbaceous plants and to link these effects to water stress, WUE and N
availability (Pascual et al., 2013). However, to our knowledge, uses of C and N isotope ratios
to assess drought stress in fruit trees are very limited.
Impact of osmotic drought stress on the biochemical characteristics, water relations, and
nitrogen and carbon isotope composition of pistachio (Pistacia vera L.) cultivars
112
There is a wide genetic variation of edible pistachio (P. vera) cultivars in Iran
(Esmaeilpour et al., 2010; Esmaeilpour and Khezri, 2006; Sheibani, 1995). They have
originated from natural pistachio forests in the northeast part of the country and are grown in
different environmental conditions. Although pistachio is well-known for its drought
tolerance (Abbaspour et al., 2012b; Bagheri et al., 2011; Esmaeilpour et al., 2015; Fardooei,
2001; Habibi and Hajiboland, 2013; Khoyerdi et al., 2016; Panahi, 2009; Tajabadipour et al.,
2006), limited evidence is available on the underlying mechanisms of drought tolerance
associated with the plant’s water relations, and especially carbon and nitrogen isotope
composition.
The objectives of this investigation were: (1) to evaluate the effects of osmotic drought
stress on RWC, carbohydrate content and stomatal characteristics of three pistachio cultivars;
(2) to determine the effect of drought stress on WUE, δ13C and δ
15N under drought stress
conditions; (3) to study the relationship between WUE and δ13
C; (4) to assess the use of
carbone isotope composition in pistachio trees as an indicator of water use efficiency (WUE)
under drought stress.
5.2 Materials and methods
5.2.1 Plant material and experimental set-up
Plants and experimental conditions are similar to those presented in 4.2.1
5.2.2 Measurements
5.2.2.1 Carbohydrate analysis
Pistachio leaf samples were taken from the top of each plant at the end of the drought
stress and the recovery, respectively. Leaf samples were kept in an icebox to minimize
evapotranspiration and were immediately transferred to the laboratory. Then leaves were
grinded with liquid nitrogen (N2) (Figure 5.1, A & B) and kept at -80 ºC until analysis
(Figure 5.1, C). Sugars were extracted from 300 mg of fresh leaf material with 80% ethanol
following Van Labeke and Degeyter (2004). Soluble carbohydrates (glucose, fructose and
sucrose) contents were analysed (nine replicates) by high pH anion-exchange
chromatography with pulsed amperometric detection (Waters; column CarboPac PA100 with
companion guard column, eluent: 50 mM NaOH, temperature: 22 ºC). The remaining
Chapter 5
113
ethanol-insoluble material was washed twice with ethanol 80 % and the residual pellet was
treated with HCl 1 M for 2 h at 95 ºC for starch hydrolysis. Starch concentrations were
determined by spectrophotometer at 340 nm by the enzymatic reduction of NADP+ (Uvikon
XL, Bio-Tek Instrument, Winooski, USA).
Figure 5.1: Pulverization of pistachio leaves with liquid nitrogen (A and B) and keeping
them at -80 ºC (C).
5.2.2.2 Relative Water Content (RWC)
RWC was determined on fully expanded leaves (nine replicates) according to the method
of Merino et al. (1976). From each plant, one leaf at the end of the second drought stress and
recovery week was sampled and immediately transferred to the laboratory in an icebox. There
we determined fresh leaf weight (FW) by digital balance (Mettler Toledo PB602-L,
Greifensee, Switzerland). In order to obtain turgid weight (TW), leaf disks were floated in
distilled water inside a closed Petri dish and kept in a fridge for 24 h. Subsequently, the water
was gently wiped from the leaf surface with tissue paper and the turgid weight measured.
Afterward, leaf samples were placed in an electric oven at 85 ºC for 48 h in order to obtain
leaf dry weight (DW). Values of FW, TW, and DW were then used to calculate RWC, using
the following equation: RWC (%) = [(FW - DW)/ (TW - DW)] × 100 %, where FW, DW and
TW are fresh, dry and turgid weight (g), respectively.
5.2.2.3 Water Use Efficiency (WUE)
Gas exchange measurements were done in this experiment as already described in 4.3.3.
Following Ashraf (2002) and Mediavilla et al. (2002), Pn /E ratio was taken as an estimate of
instantaneous water use efficiency (WUE), and the ratio between Pn/gs, which is known as
intrinsic water use efficiency (Boyer, 1996; Pascual et al., 2013).
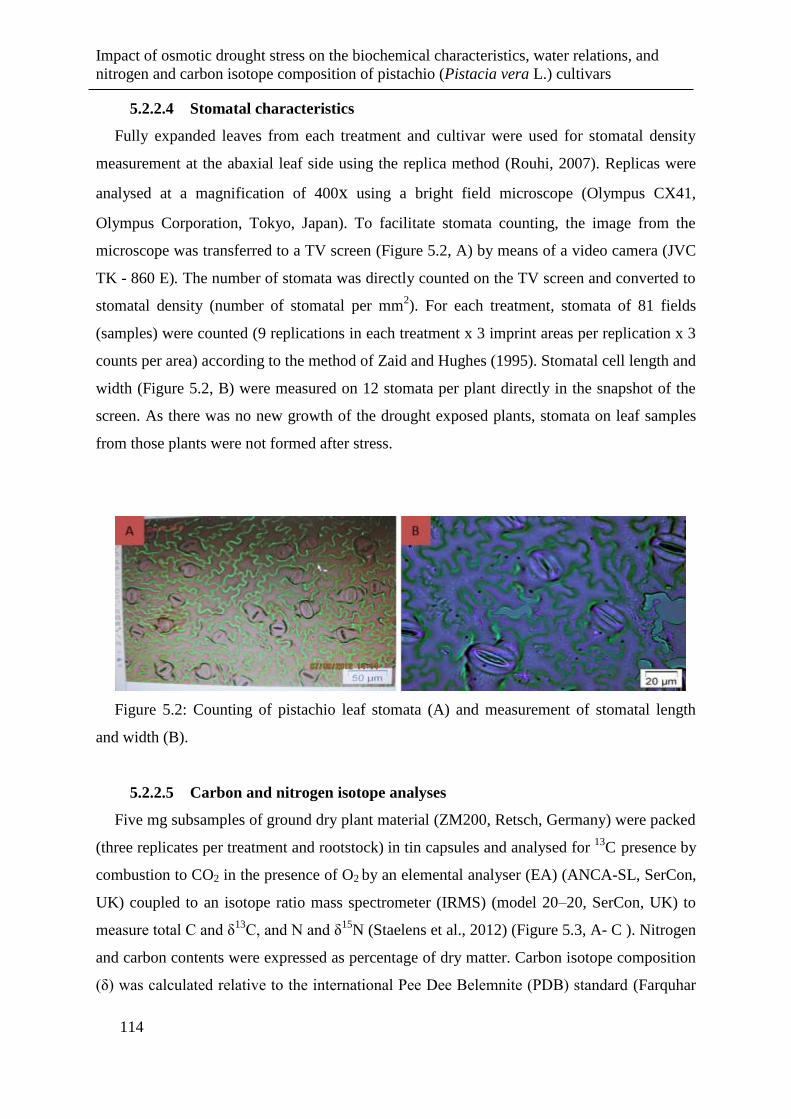
Impact of osmotic drought stress on the biochemical characteristics, water relations, and
nitrogen and carbon isotope composition of pistachio (Pistacia vera L.) cultivars
114
5.2.2.4 Stomatal characteristics
Fully expanded leaves from each treatment and cultivar were used for stomatal density
measurement at the abaxial leaf side using the replica method (Rouhi, 2007). Replicas were
analysed at a magnification of 400x using a bright field microscope (Olympus CX41,
Olympus Corporation, Tokyo, Japan). To facilitate stomata counting, the image from the
microscope was transferred to a TV screen (Figure 5.2, A) by means of a video camera (JVC
TK - 860 E). The number of stomata was directly counted on the TV screen and converted to
stomatal density (number of stomatal per mm2). For each treatment, stomata of 81 fields
(samples) were counted (9 replications in each treatment x 3 imprint areas per replication x 3
counts per area) according to the method of Zaid and Hughes (1995). Stomatal cell length and
width (Figure 5.2, B) were measured on 12 stomata per plant directly in the snapshot of the
screen. As there was no new growth of the drought exposed plants, stomata on leaf samples
from those plants were not formed after stress.
Figure 5.2: Counting of pistachio leaf stomata (A) and measurement of stomatal length
and width (B).
5.2.2.5 Carbon and nitrogen isotope analyses
Five mg subsamples of ground dry plant material (ZM200, Retsch, Germany) were packed
(three replicates per treatment and rootstock) in tin capsules and analysed for 13
C presence by
combustion to CO2 in the presence of O2 by an elemental analyser (EA) (ANCA-SL, SerCon,
UK) coupled to an isotope ratio mass spectrometer (IRMS) (model 20–20, SerCon, UK) to
measure total C and δ13C, and N and δ
15N (Staelens et al., 2012) (Figure 5.3, A- C ). Nitrogen
and carbon contents were expressed as percentage of dry matter. Carbon isotope composition
(δ) was calculated relative to the international Pee Dee Belemnite (PDB) standard (Farquhar
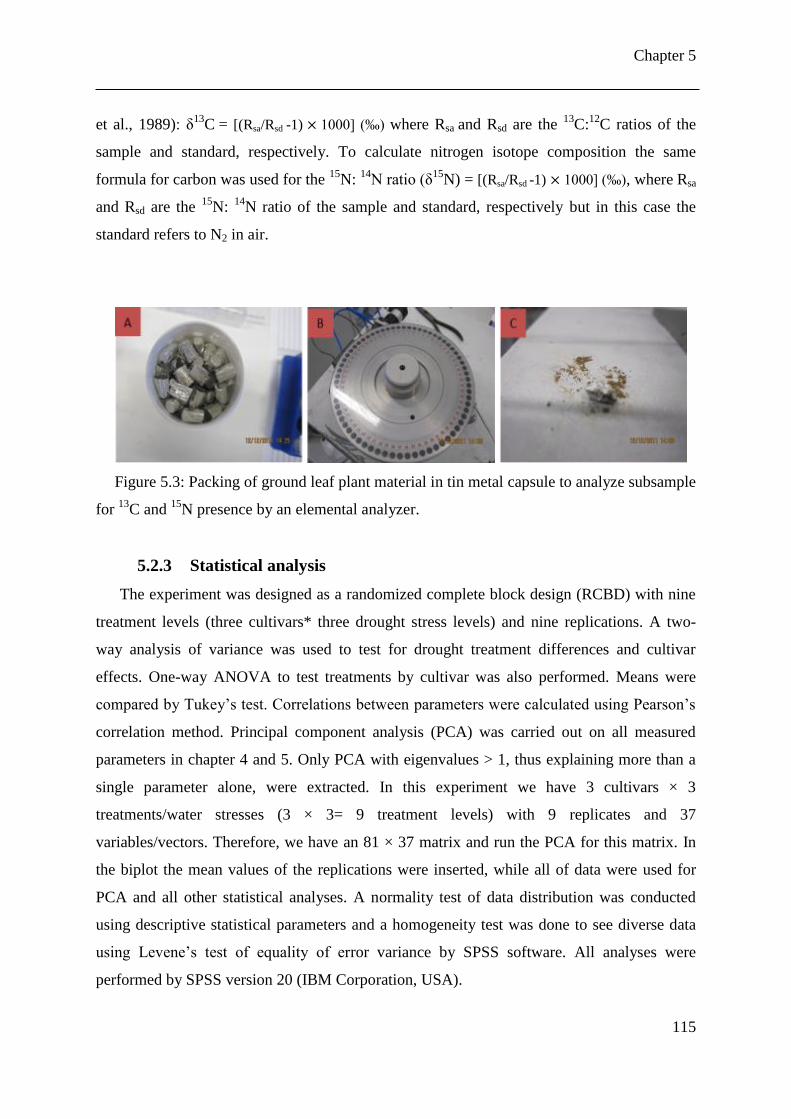
Chapter 5
115
et al., 1989): δ13
C = [(Rsa/Rsd -1) 1000] (‰) where Rsa and Rsd are the 13
C:12
C ratios of the
sample and standard, respectively. To calculate nitrogen isotope composition the same
formula for carbon was used for the 15
N: 14N ratio (δ
15N) = [(Rsa/Rsd -1) 1000] (‰), where Rsa
and Rsd are the 15
N: 14
N ratio of the sample and standard, respectively but in this case the
standard refers to N2 in air.
Figure 5.3: Packing of ground leaf plant material in tin metal capsule to analyze subsample
for 13
C and 15
N presence by an elemental analyzer.
5.2.3 Statistical analysis
The experiment was designed as a randomized complete block design (RCBD) with nine
treatment levels (three cultivars* three drought stress levels) and nine replications. A two-
way analysis of variance was used to test for drought treatment differences and cultivar
effects. One-way ANOVA to test treatments by cultivar was also performed. Means were
compared by Tukey’s test. Correlations between parameters were calculated using Pearson’s
correlation method. Principal component analysis (PCA) was carried out on all measured
parameters in chapter 4 and 5. Only PCA with eigenvalues > 1, thus explaining more than a
single parameter alone, were extracted. In this experiment we have 3 cultivars × 3
treatments/water stresses (3 × 3= 9 treatment levels) with 9 replicates and 37
variables/vectors. Therefore, we have an 81 × 37 matrix and run the PCA for this matrix. In
the biplot the mean values of the replications were inserted, while all of data were used for
PCA and all other statistical analyses. A normality test of data distribution was conducted
using descriptive statistical parameters and a homogeneity test was done to see diverse data
using Levene’s test of equality of error variance by SPSS software. All analyses were
performed by SPSS version 20 (IBM Corporation, USA).
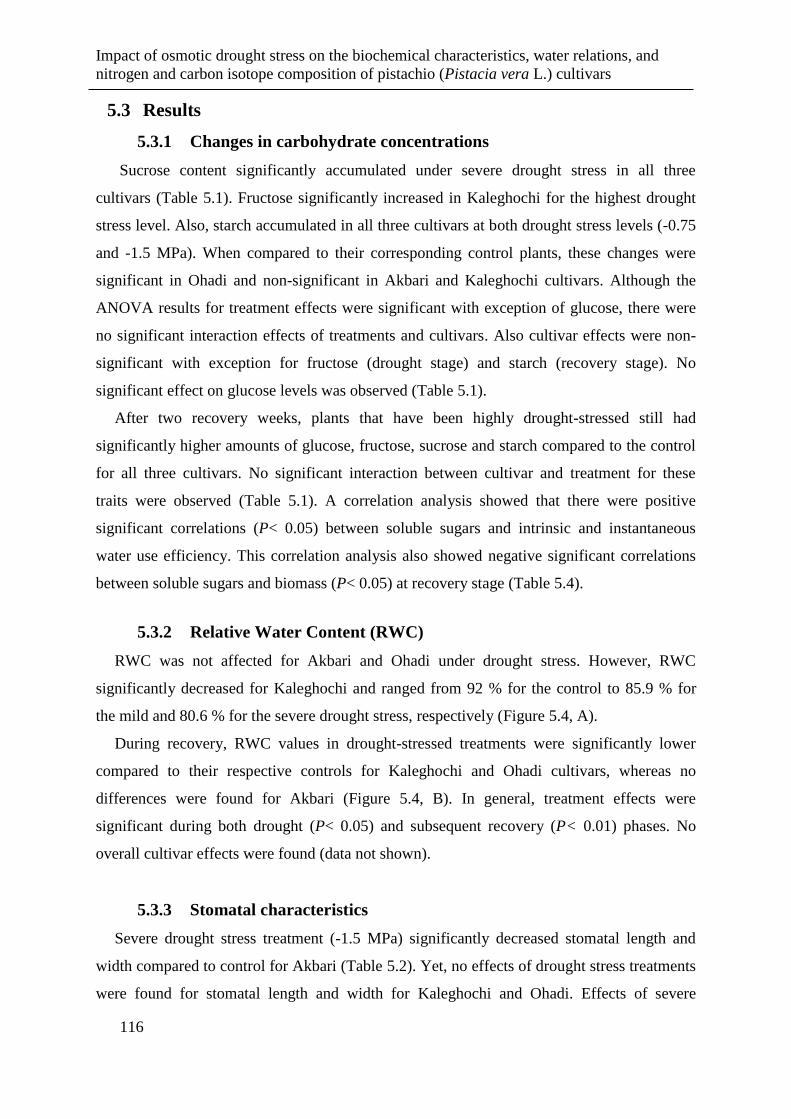
Impact of osmotic drought stress on the biochemical characteristics, water relations, and
nitrogen and carbon isotope composition of pistachio (Pistacia vera L.) cultivars
116
5.3 Results
5.3.1 Changes in carbohydrate concentrations
Sucrose content significantly accumulated under severe drought stress in all three
cultivars (Table 5.1). Fructose significantly increased in Kaleghochi for the highest drought
stress level. Also, starch accumulated in all three cultivars at both drought stress levels (-0.75
and -1.5 MPa). When compared to their corresponding control plants, these changes were
significant in Ohadi and non-significant in Akbari and Kaleghochi cultivars. Although the
ANOVA results for treatment effects were significant with exception of glucose, there were
no significant interaction effects of treatments and cultivars. Also cultivar effects were non-
significant with exception for fructose (drought stage) and starch (recovery stage). No
significant effect on glucose levels was observed (Table 5.1).
After two recovery weeks, plants that have been highly drought-stressed still had
significantly higher amounts of glucose, fructose, sucrose and starch compared to the control
for all three cultivars. No significant interaction between cultivar and treatment for these
traits were observed (Table 5.1). A correlation analysis showed that there were positive
significant correlations (P< 0.05) between soluble sugars and intrinsic and instantaneous
water use efficiency. This correlation analysis also showed negative significant correlations
between soluble sugars and biomass (P< 0.05) at recovery stage (Table 5.4).
5.3.2 Relative Water Content (RWC)
RWC was not affected for Akbari and Ohadi under drought stress. However, RWC
significantly decreased for Kaleghochi and ranged from 92 % for the control to 85.9 % for
the mild and 80.6 % for the severe drought stress, respectively (Figure 5.4, A).
During recovery, RWC values in drought-stressed treatments were significantly lower
compared to their respective controls for Kaleghochi and Ohadi cultivars, whereas no
differences were found for Akbari (Figure 5.4, B). In general, treatment effects were
significant during both drought (P< 0.05) and subsequent recovery (P< 0.01) phases. No
overall cultivar effects were found (data not shown).
5.3.3 Stomatal characteristics
Severe drought stress treatment (-1.5 MPa) significantly decreased stomatal length and
width compared to control for Akbari (Table 5.2). Yet, no effects of drought stress treatments
were found for stomatal length and width for Kaleghochi and Ohadi. Effects of severe
Chapter 5
117
drought stress treatments on stomatal density were not significant compared to the control
treatment in all three cultivars; whereas mild drought stress treatment decreased the stomatal
density in the Kaleghochi cultivar (Table 5.2). Akbari had the highest stomata density,
whereas Ohadi had the lowest stomatal density in the control treatment (Table 5.2). The
effect of cultivar and interaction effects differed significantly for the stomatal density
( , although treatment effects were not significant. There was a weak negative
relationship between stomatal density with stomatal width (R2= 0.22) and length (R
2= 0.14)
(Figure 5.5).
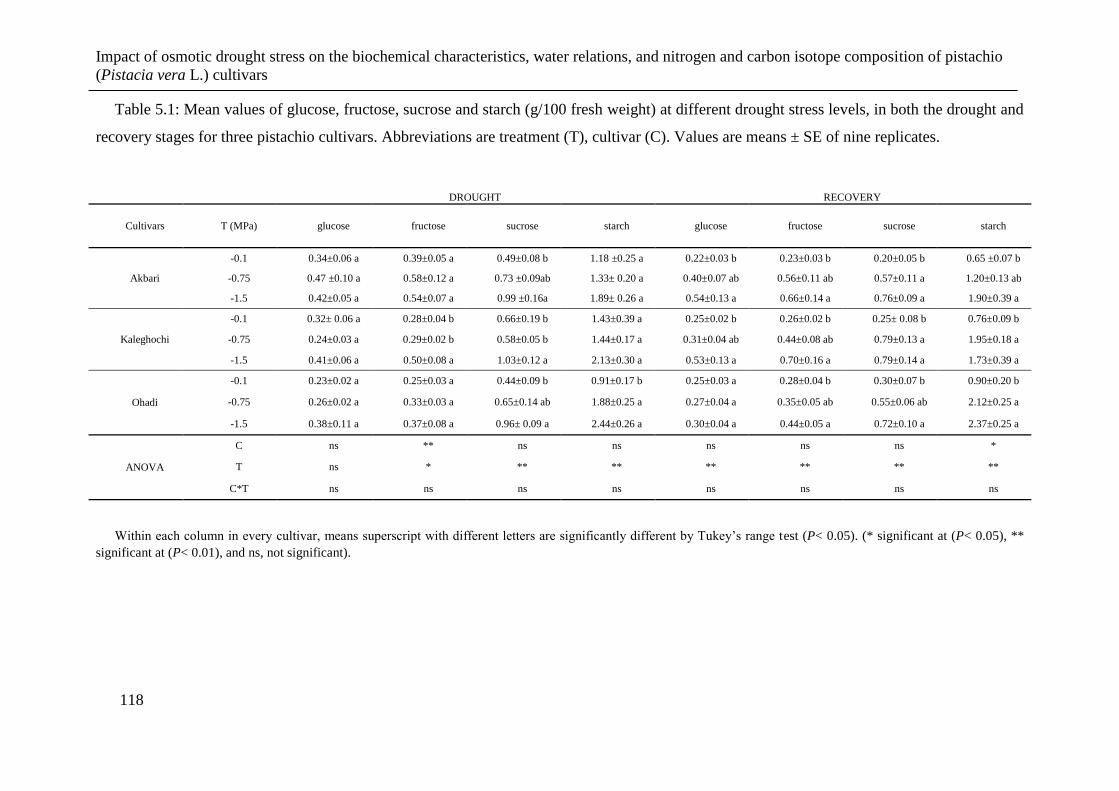
Impact of osmotic drought stress on the biochemical characteristics, water relations, and nitrogen and carbon isotope composition of pistachio
(Pistacia vera L.) cultivars
118
Table 5.1: Mean values of glucose, fructose, sucrose and starch (g/100 fresh weight) at different drought stress levels, in both the drought and
recovery stages for three pistachio cultivars. Abbreviations are treatment (T), cultivar (C). Values are means ± SE of nine replicates.
DROUGHT RECOVERY
Cultivars T (MPa) glucose fructose sucrose starch glucose fructose sucrose starch
Akbari
-0.1 0.34±0.06 a 0.39±0.05 a 0.49±0.08 b 1.18 ±0.25 a 0.22±0.03 b 0.23±0.03 b 0.20±0.05 b 0.65 ±0.07 b
-0.75 0.47 ±0.10 a 0.58±0.12 a 0.73 ±0.09ab 1.33± 0.20 a 0.40±0.07 ab 0.56±0.11 ab 0.57±0.11 a 1.20±0.13 ab
-1.5 0.42±0.05 a 0.54±0.07 a 0.99 ±0.16a 1.89± 0.26 a 0.54±0.13 a 0.66±0.14 a 0.76±0.09 a 1.90±0.39 a
Kaleghochi
-0.1 0.32± 0.06 a 0.28±0.04 b 0.66±0.19 b 1.43±0.39 a 0.25±0.02 b 0.26±0.02 b 0.25± 0.08 b 0.76±0.09 b
-0.75 0.24±0.03 a 0.29±0.02 b 0.58±0.05 b 1.44±0.17 a 0.31±0.04 ab 0.44±0.08 ab 0.79±0.13 a 1.95±0.18 a
-1.5 0.41±0.06 a 0.50±0.08 a 1.03±0.12 a 2.13±0.30 a 0.53±0.13 a 0.70±0.16 a 0.79±0.14 a 1.73±0.39 a
Ohadi
-0.1 0.23±0.02 a 0.25±0.03 a 0.44±0.09 b 0.91±0.17 b 0.25±0.03 a 0.28±0.04 b 0.30±0.07 b 0.90±0.20 b
-0.75 0.26±0.02 a 0.33±0.03 a 0.65±0.14 ab 1.88±0.25 a 0.27±0.04 a 0.35±0.05 ab 0.55±0.06 ab 2.12±0.25 a
-1.5 0.38±0.11 a 0.37±0.08 a 0.96± 0.09 a 2.44±0.26 a 0.30±0.04 a 0.44±0.05 a 0.72±0.10 a 2.37±0.25 a
ANOVA
C ns ** ns ns ns ns ns *
T ns * ** ** ** ** ** **
C*T ns ns ns ns ns ns ns ns
Within each column in every cultivar, means superscript with different letters are significantly different by Tukey’s range test (P< 0.05). (* significant at (P< 0.05), **
significant at (P< 0.01), and ns, not significant).
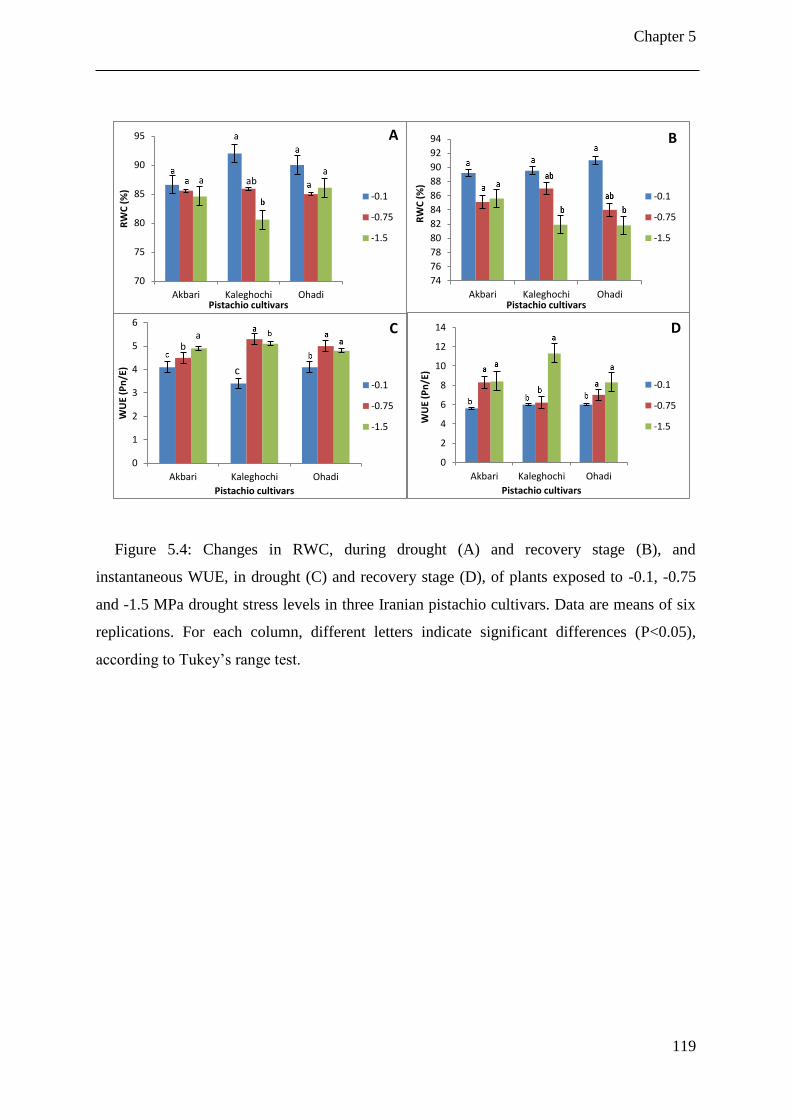
Chapter 5
119
Figure 5.4: Changes in RWC, during drought (A) and recovery stage (B), and
instantaneous WUE, in drought (C) and recovery stage (D), of plants exposed to -0.1, -0.75
and -1.5 MPa drought stress levels in three Iranian pistachio cultivars. Data are means of six
replications. For each column, different letters indicate significant differences (P<0.05),
according to Tukey’s range test.
70
75
80
85
90
95
Akbari Kaleghochi Ohadi
RW
C (
%)
Pistachio cultivars
-0.1
-0.75
-1.5
ab
74
76
78
80
82
84
86
88
90
92
94
Akbari Kaleghochi Ohadi
RW
C (
%)
Pistachio cultivars
-0.1
-0.75
-1.5
B
0
1
2
3
4
5
6
Akbari Kaleghochi Ohadi
WU
E (P
n/E
)
Pistachio cultivars
-0.1
-0.75
-1.5
a b
c
C
0
2
4
6
8
10
12
14
Akbari Kaleghochi Ohadi
WU
E (P
n/E
)
Pistachio cultivars
-0.1
-0.75
-1.5
D
A
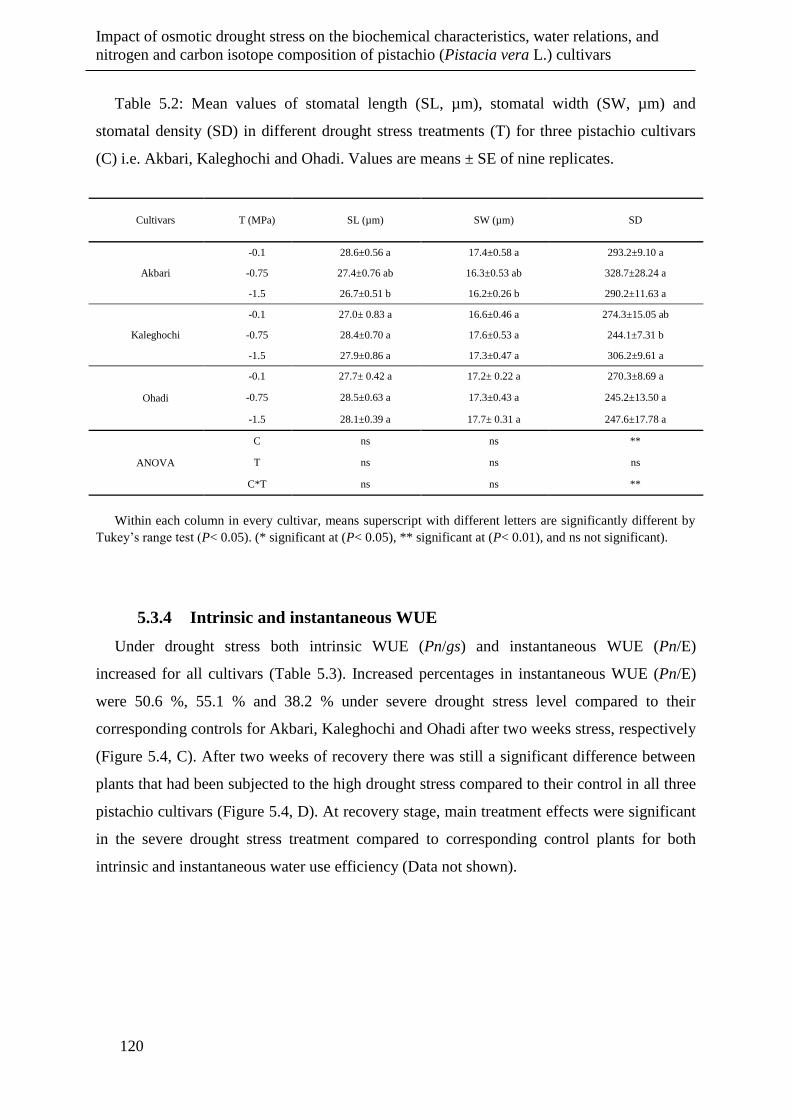
Impact of osmotic drought stress on the biochemical characteristics, water relations, and
nitrogen and carbon isotope composition of pistachio (Pistacia vera L.) cultivars
120
Table 5.2: Mean values of stomatal length (SL, µm), stomatal width (SW, µm) and
stomatal density (SD) in different drought stress treatments (T) for three pistachio cultivars
(C) i.e. Akbari, Kaleghochi and Ohadi. Values are means ± SE of nine replicates.
Cultivars T (MPa) SL (µm) SW (µm) SD
Akbari
-0.1 28.6±0.56 a 17.4±0.58 a 293.2±9.10 a
-0.75 27.4±0.76 ab 16.3±0.53 ab 328.7±28.24 a
-1.5 26.7±0.51 b 16.2±0.26 b 290.2±11.63 a
Kaleghochi
-0.1 27.0± 0.83 a 16.6±0.46 a 274.3±15.05 ab
-0.75 28.4±0.70 a 17.6±0.53 a 244.1±7.31 b
-1.5 27.9±0.86 a 17.3±0.47 a 306.2±9.61 a
Ohadi
-0.1 27.7± 0.42 a 17.2± 0.22 a 270.3±8.69 a
-0.75 28.5±0.63 a 17.3±0.43 a 245.2±13.50 a
-1.5 28.1±0.39 a 17.7± 0.31 a 247.6±17.78 a
ANOVA
C ns ns **
T ns ns ns
C*T ns ns **
Within each column in every cultivar, means superscript with different letters are significantly different by
Tukey’s range test (P< 0.05). (* significant at (P< 0.05), ** significant at (P< 0.01), and ns not significant).
5.3.4 Intrinsic and instantaneous WUE
Under drought stress both intrinsic WUE (Pn/gs) and instantaneous WUE (Pn/E)
increased for all cultivars (Table 5.3). Increased percentages in instantaneous WUE (Pn/E)
were 50.6 %, 55.1 % and 38.2 % under severe drought stress level compared to their
corresponding controls for Akbari, Kaleghochi and Ohadi after two weeks stress, respectively
(Figure 5.4, C). After two weeks of recovery there was still a significant difference between
plants that had been subjected to the high drought stress compared to their control in all three
pistachio cultivars (Figure 5.4, D). At recovery stage, main treatment effects were significant
in the severe drought stress treatment compared to corresponding control plants for both
intrinsic and instantaneous water use efficiency (Data not shown).
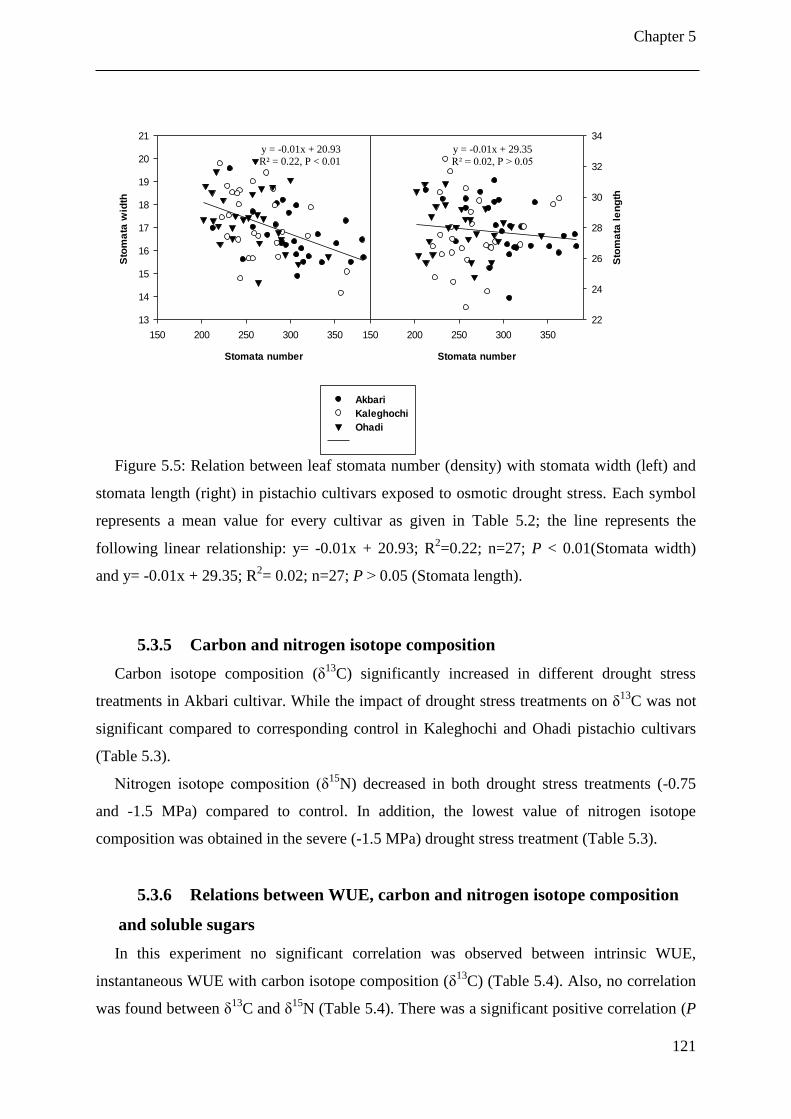
Chapter 5
121
Stomata number
150 200 250 300 350
Sto
ma
ta w
idth
13
14
15
16
17
18
19
20
21
Akbari
Kaleghochi
Ohadi
Stomata number
150 200 250 300 350
Sto
ma
ta l
en
gth
22
24
26
28
30
32
34
Figure 5.5: Relation between leaf stomata number (density) with stomata width (left) and
stomata length (right) in pistachio cultivars exposed to osmotic drought stress. Each symbol
represents a mean value for every cultivar as given in Table 5.2; the line represents the
following linear relationship: y= -0.01x + 20.93; R2=0.22; n=27; P < 0.01(Stomata width)
and y= -0.01x + 29.35; R2= 0.02; n=27; P ˃ 0.05 (Stomata length).
5.3.5 Carbon and nitrogen isotope composition
Carbon isotope composition (δ13
C) significantly increased in different drought stress
treatments in Akbari cultivar. While the impact of drought stress treatments on δ13
C was not
significant compared to corresponding control in Kaleghochi and Ohadi pistachio cultivars
(Table 5.3).
Nitrogen isotope composition (δ15
N) decreased in both drought stress treatments (-0.75
and -1.5 MPa) compared to control. In addition, the lowest value of nitrogen isotope
composition was obtained in the severe (-1.5 MPa) drought stress treatment (Table 5.3).
5.3.6 Relations between WUE, carbon and nitrogen isotope composition
and soluble sugars
In this experiment no significant correlation was observed between intrinsic WUE,
instantaneous WUE with carbon isotope composition (δ13
C) (Table 5.4). Also, no correlation
was found between δ13
C and δ15
N (Table 5.4). There was a significant positive correlation (P
y = -0.01x + 20.93 R² = 0.22, P < 0.01
y = -0.01x + 29.35
R² = 0.02, P ˃ 0.05
Impact of osmotic drought stress on the biochemical characteristics, water relations, and
nitrogen and carbon isotope composition of pistachio (Pistacia vera L.) cultivars
122
< 0.03) between leaf soluble sugars and intrinsic water use efficiency (Pn/gs) (Figure 5.6) in
the pistachio cultivars. There was no significant correlation between nitrogen isotope
composition and intrinsic and instantaneous WUE under drought stress in the pistachio
cultivars (Table 5.4).
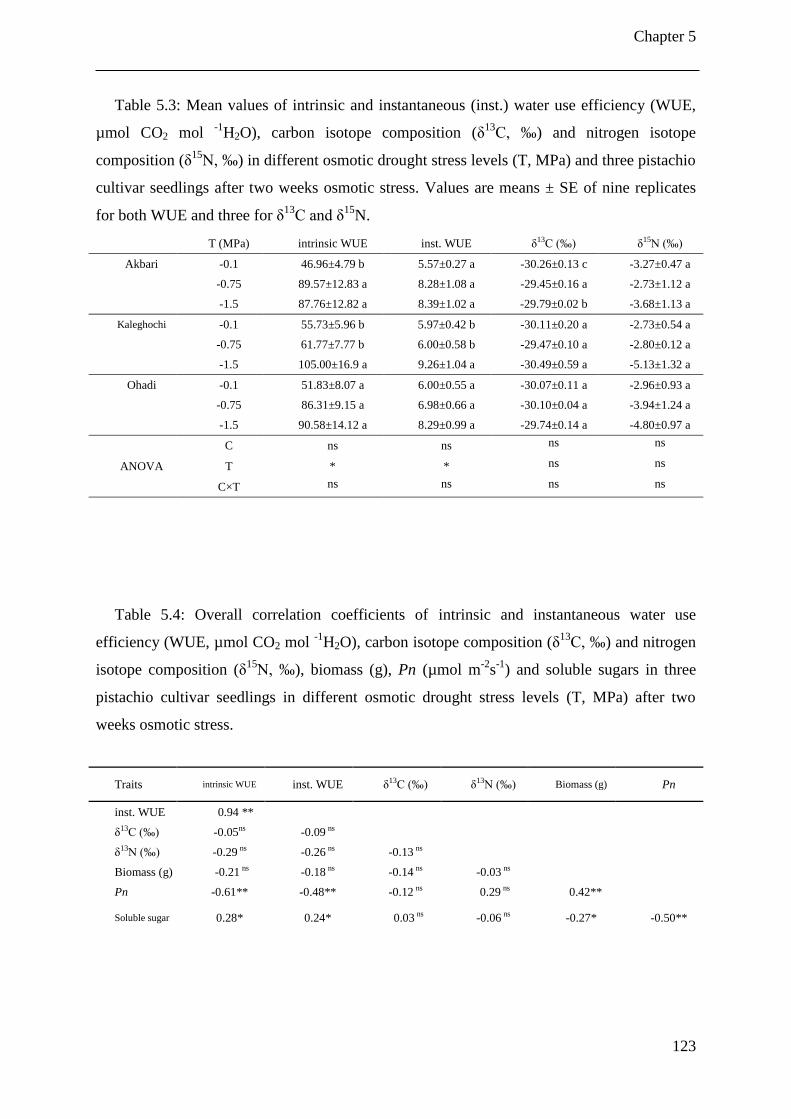
Chapter 5
123
Table 5.3: Mean values of intrinsic and instantaneous (inst.) water use efficiency (WUE,
µmol CO2 mol -1
H2O), carbon isotope composition (δ13C, ‰) and nitrogen isotope
composition (δ15N, ‰) in different osmotic drought stress levels (T, MPa) and three pistachio
cultivar seedlings after two weeks osmotic stress. Values are means ± SE of nine replicates
for both WUE and three for δ13C and δ
15N.
T (MPa) intrinsic WUE inst. WUE δ13C (‰) δ15N (‰)
Akbari -0.1 46.96±4.79 b 5.57±0.27 a -30.26±0.13 c -3.27±0.47 a
-0.75 89.57±12.83 a 8.28±1.08 a -29.45±0.16 a -2.73±1.12 a
-1.5 87.76±12.82 a 8.39±1.02 a -29.79±0.02 b -3.68±1.13 a
Kaleghochi -0.1 55.73±5.96 b 5.97±0.42 b -30.11±0.20 a -2.73±0.54 a
-0.75 61.77±7.77 b 6.00±0.58 b -29.47±0.10 a -2.80±0.12 a
-1.5 105.00±16.9 a 9.26±1.04 a -30.49±0.59 a -5.13±1.32 a
Ohadi -0.1 51.83±8.07 a 6.00±0.55 a -30.07±0.11 a -2.96±0.93 a
-0.75 86.31±9.15 a 6.98±0.66 a -30.10±0.04 a -3.94±1.24 a
-1.5 90.58±14.12 a 8.29±0.99 a -29.74±0.14 a -4.80±0.97 a
ANOVA
C ns ns ns ns
T * * ns ns
C×T ns ns ns ns
Table 5.4: Overall correlation coefficients of intrinsic and instantaneous water use
efficiency (WUE, µmol CO2 mol -1
H2O), carbon isotope composition (δ13C, ‰) and nitrogen
isotope composition (δ15N, ‰), biomass (g), Pn (µmol m
-2s
-1) and soluble sugars in three
pistachio cultivar seedlings in different osmotic drought stress levels (T, MPa) after two
weeks osmotic stress.
Traits intrinsic WUE inst. WUE δ13C (‰) δ13N (‰) Biomass (g) Pn
inst. WUE 0.94 **
δ13C (‰) -0.05ns -0.09 ns
δ13N (‰) -0.29 ns -0.26 ns -0.13 ns
Biomass (g) -0.21 ns -0.18 ns -0.14 ns -0.03 ns
Pn -0.61** -0.48** -0.12 ns 0.29 ns 0.42**
Soluble sugar 0.28* 0.24* 0.03 ns -0.06 ns -0.27* -0.50**
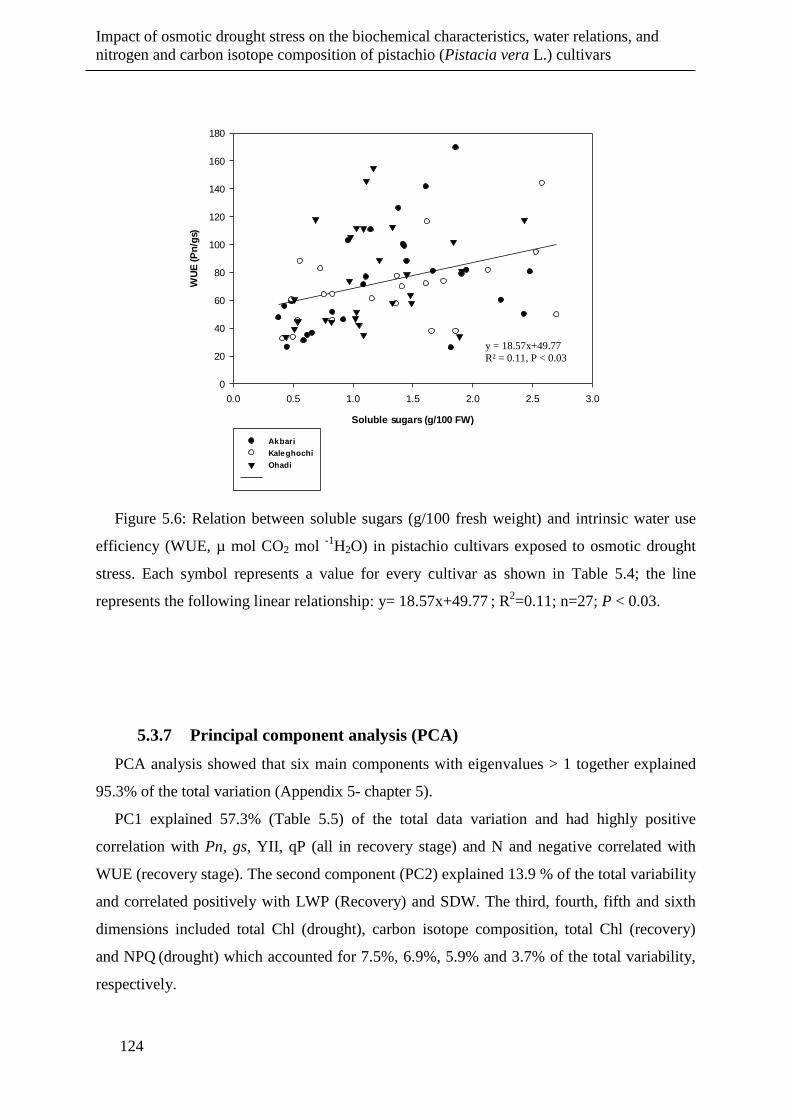
Impact of osmotic drought stress on the biochemical characteristics, water relations, and
nitrogen and carbon isotope composition of pistachio (Pistacia vera L.) cultivars
124
Soluble sugars (g/100 FW)
0.0 0.5 1.0 1.5 2.0 2.5 3.0
WU
E (
Pn
/gs)
0
20
40
60
80
100
120
140
160
180
Akbari
Kaleghochi
Ohadi
Figure 5.6: Relation between soluble sugars (g/100 fresh weight) and intrinsic water use
efficiency (WUE, µ mol CO2 mol -1
H2O) in pistachio cultivars exposed to osmotic drought
stress. Each symbol represents a value for every cultivar as shown in Table 5.4; the line
represents the following linear relationship: y= 18.57x+49.77 ; R2=0.11; n=27; P < 0.03.
5.3.7 Principal component analysis (PCA)
PCA analysis showed that six main components with eigenvalues > 1 together explained
95.3% of the total variation (Appendix 5- chapter 5).
PC1 explained 57.3% (Table 5.5) of the total data variation and had highly positive
correlation with Pn, gs, YII, qP (all in recovery stage) and N and negative correlated with
WUE (recovery stage). The second component (PC2) explained 13.9 % of the total variability
and correlated positively with LWP (Recovery) and SDW. The third, fourth, fifth and sixth
dimensions included total Chl (drought), carbon isotope composition, total Chl (recovery)
and NPQ (drought) which accounted for 7.5%, 6.9%, 5.9% and 3.7% of the total variability,
respectively.
y = 18.57x+49.77
R² = 0.11, P < 0.03
Chapter 5
125
Data obtained of PCA of control plants and plants submitted to increasing drought stress
were visualized in a biplot analysis of PC1 and PC2, for the three cultivars (Figure 5.7). The
angles between some measured parameters were acute (sharp angle). Therefore, these traits
can be classified in two groups with high correlation. Group 1 indicated the traits related to
photosynthesis rate and group 2 covered the traits related to osmotic adjustments.
The standard deviation of cultivars and osmotic drought stress treatments were shown in
Figure 5.8. The results from this figure showed that the distances between normal (-0.1 MPa)
and severe stress (-1.5 MPa) conditions for cultivars Akbari and Ohadi were biggest and
smallest rates, respectively. Therefore, Akbari and Ohadi were less and more affected by
drought stress and can be selected as susceptible and tolerant cultivars, respectively.
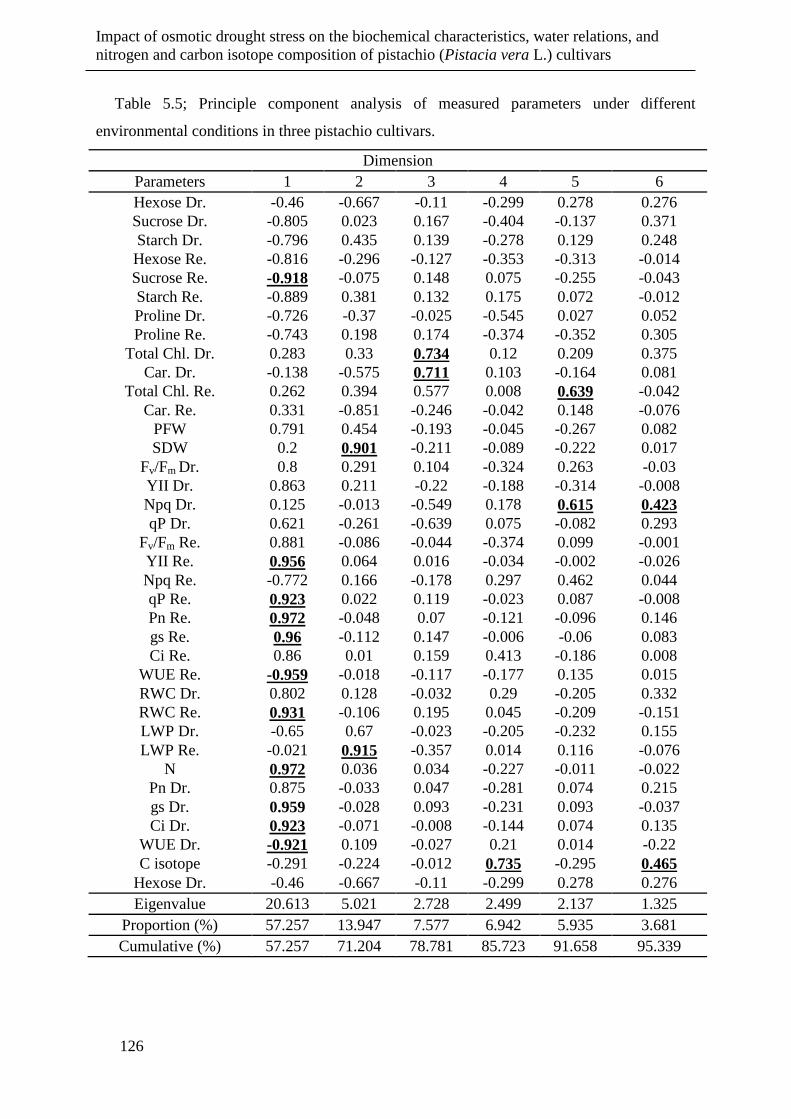
Impact of osmotic drought stress on the biochemical characteristics, water relations, and
nitrogen and carbon isotope composition of pistachio (Pistacia vera L.) cultivars
126
Table 5.5; Principle component analysis of measured parameters under different
environmental conditions in three pistachio cultivars.
Dimension
Parameters 1 2 3 4 5 6
Hexose Dr. -0.46 -0.667 -0.11 -0.299 0.278 0.276
Sucrose Dr. -0.805 0.023 0.167 -0.404 -0.137 0.371
Starch Dr. -0.796 0.435 0.139 -0.278 0.129 0.248
Hexose Re. -0.816 -0.296 -0.127 -0.353 -0.313 -0.014
Sucrose Re. -0.918 -0.075 0.148 0.075 -0.255 -0.043
Starch Re. -0.889 0.381 0.132 0.175 0.072 -0.012
Proline Dr. -0.726 -0.37 -0.025 -0.545 0.027 0.052
Proline Re. -0.743 0.198 0.174 -0.374 -0.352 0.305
Total Chl. Dr. 0.283 0.33 0.734 0.12 0.209 0.375
Car. Dr. -0.138 -0.575 0.711 0.103 -0.164 0.081
Total Chl. Re. 0.262 0.394 0.577 0.008 0.639 -0.042
Car. Re. 0.331 -0.851 -0.246 -0.042 0.148 -0.076
PFW 0.791 0.454 -0.193 -0.045 -0.267 0.082
SDW 0.2 0.901 -0.211 -0.089 -0.222 0.017
Fv/Fm Dr. 0.8 0.291 0.104 -0.324 0.263 -0.03
YII Dr. 0.863 0.211 -0.22 -0.188 -0.314 -0.008
Npq Dr. 0.125 -0.013 -0.549 0.178 0.615 0.423
qP Dr. 0.621 -0.261 -0.639 0.075 -0.082 0.293
Fv/Fm Re. 0.881 -0.086 -0.044 -0.374 0.099 -0.001
YII Re. 0.956 0.064 0.016 -0.034 -0.002 -0.026
Npq Re. -0.772 0.166 -0.178 0.297 0.462 0.044
qP Re. 0.923 0.022 0.119 -0.023 0.087 -0.008
Pn Re. 0.972 -0.048 0.07 -0.121 -0.096 0.146
gs Re. 0.96 -0.112 0.147 -0.006 -0.06 0.083
Ci Re. 0.86 0.01 0.159 0.413 -0.186 0.008
WUE Re. -0.959 -0.018 -0.117 -0.177 0.135 0.015
RWC Dr. 0.802 0.128 -0.032 0.29 -0.205 0.332
RWC Re. 0.931 -0.106 0.195 0.045 -0.209 -0.151
LWP Dr. -0.65 0.67 -0.023 -0.205 -0.232 0.155
LWP Re. -0.021 0.915 -0.357 0.014 0.116 -0.076
N 0.972 0.036 0.034 -0.227 -0.011 -0.022
Pn Dr. 0.875 -0.033 0.047 -0.281 0.074 0.215
gs Dr. 0.959 -0.028 0.093 -0.231 0.093 -0.037
Ci Dr. 0.923 -0.071 -0.008 -0.144 0.074 0.135
WUE Dr. -0.921 0.109 -0.027 0.21 0.014 -0.22
C isotope -0.291 -0.224 -0.012 0.735 -0.295 0.465
Hexose Dr. -0.46 -0.667 -0.11 -0.299 0.278 0.276
Eigenvalue 20.613 5.021 2.728 2.499 2.137 1.325
Proportion (%) 57.257 13.947 7.577 6.942 5.935 3.681
Cumulative (%) 57.257 71.204 78.781 85.723 91.658 95.339
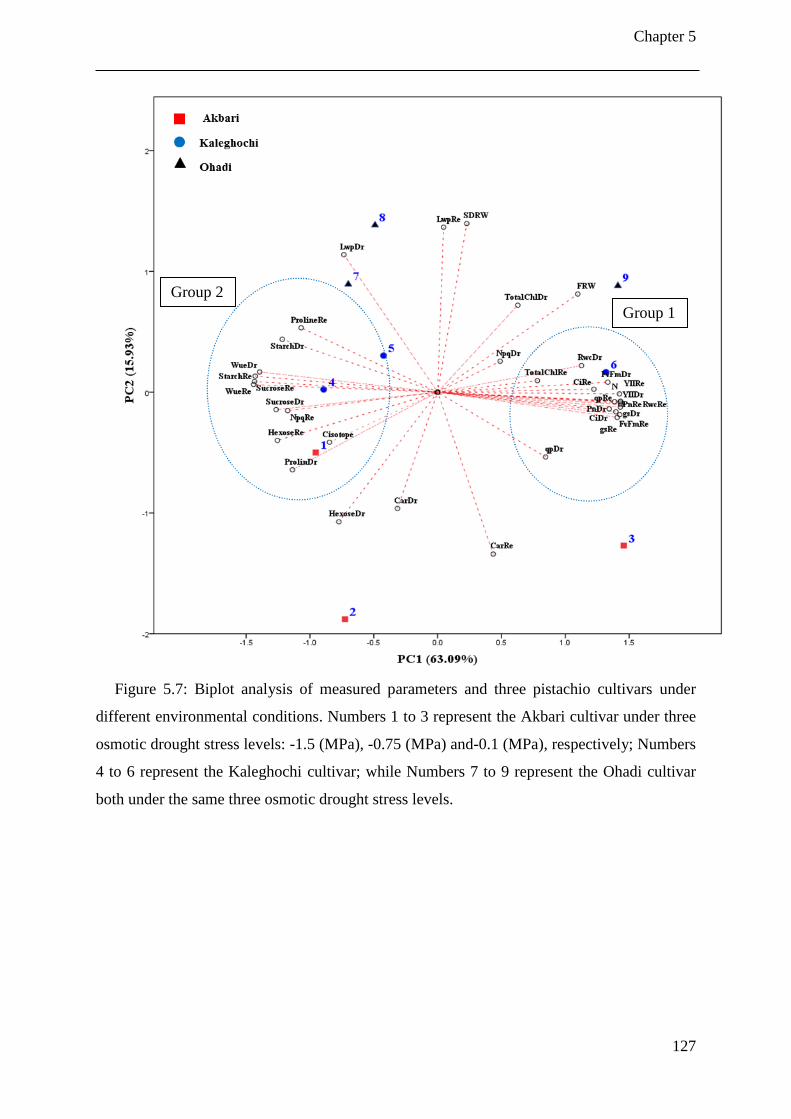
Chapter 5
127
Figure 5.7: Biplot analysis of measured parameters and three pistachio cultivars under
different environmental conditions. Numbers 1 to 3 represent the Akbari cultivar under three
osmotic drought stress levels: -1.5 (MPa), -0.75 (MPa) and-0.1 (MPa), respectively; Numbers
4 to 6 represent the Kaleghochi cultivar; while Numbers 7 to 9 represent the Ohadi cultivar
both under the same three osmotic drought stress levels.
Group 1
Group 2
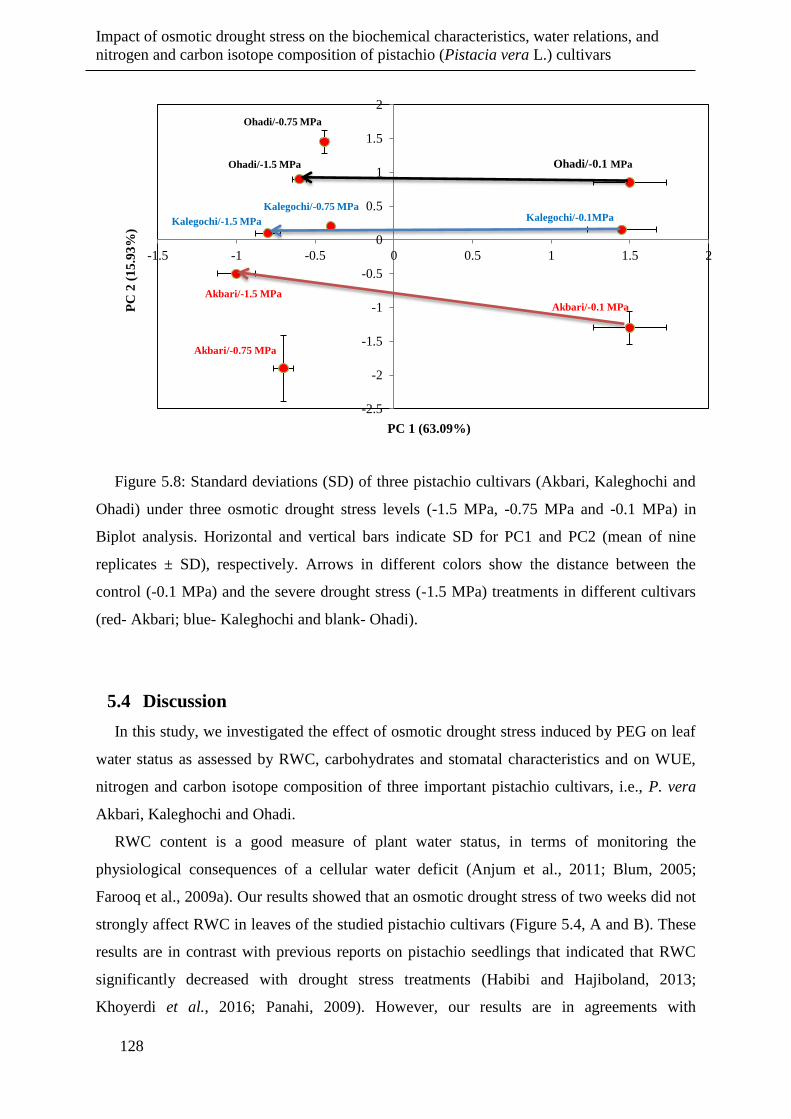
Impact of osmotic drought stress on the biochemical characteristics, water relations, and
nitrogen and carbon isotope composition of pistachio (Pistacia vera L.) cultivars
128
Figure 5.8: Standard deviations (SD) of three pistachio cultivars (Akbari, Kaleghochi and
Ohadi) under three osmotic drought stress levels (-1.5 MPa, -0.75 MPa and -0.1 MPa) in
Biplot analysis. Horizontal and vertical bars indicate SD for PC1 and PC2 (mean of nine
replicates ± SD), respectively. Arrows in different colors show the distance between the
control (-0.1 MPa) and the severe drought stress (-1.5 MPa) treatments in different cultivars
(red- Akbari; blue- Kaleghochi and blank- Ohadi).
5.4 Discussion
In this study, we investigated the effect of osmotic drought stress induced by PEG on leaf
water status as assessed by RWC, carbohydrates and stomatal characteristics and on WUE,
nitrogen and carbon isotope composition of three important pistachio cultivars, i.e., P. vera
Akbari, Kaleghochi and Ohadi.
RWC content is a good measure of plant water status, in terms of monitoring the
physiological consequences of a cellular water deficit (Anjum et al., 2011; Blum, 2005;
Farooq et al., 2009a). Our results showed that an osmotic drought stress of two weeks did not
strongly affect RWC in leaves of the studied pistachio cultivars (Figure 5.4, A and B). These
results are in contrast with previous reports on pistachio seedlings that indicated that RWC
significantly decreased with drought stress treatments (Habibi and Hajiboland, 2013;
Khoyerdi et al., 2016; Panahi, 2009). However, our results are in agreements with
Akbari/-1.5 MPa
Akbari/-0.75 MPa
Akbari/-0.1 MPa
Kalegochi/-1.5 MPa
Kalegochi/-0.75 MPa Kalegochi/-0.1MPa
Ohadi/-1.5 MPa
Ohadi/-0.75 MPa
Ohadi/-0.1 MPa
-2.5
-2
-1.5
-1
-0.5
0
0.5
1
1.5
2
-1.5 -1 -0.5 0 0.5 1 1.5 2
PC
2 (
15
.93
%)
PC 1 (63.09%)
Chapter 5
129
Behboudian et al. (1986), Hokmabadi et al. (2005) and Karimi et al. (2009) who reported that
increasing salinity did not significantly affect RWC in different pistachio cultivars. Although
the observed RWC indicated that plants could maintain relatively well their water balance by
increasing the osmotic potential of the nutritive solution, decreasing Ψl of pistachio cultivars
(Chapter 4).
In this study, leaf solute carbohydrates increased in response to both drought stress
treatments (Table 5.1). This accumulation of low molecular-mass organic solutes, such as
soluble sugars, proline or other amino acids, regulate the osmotic potential of cells to improve
absorption of water under drought stress (Hessini et al., 2009; Sánchez-Rodríguez et al.,
2010; Zhang et al., 2010). The three cultivars revealed differences in their accumulation of
soluble sugars with increasing drought stress (Table 5.1) but the interaction effects were not
significant. Accumulation of sucrose levels was 2; 1.6; and 2.2 times higher than controls for
Akbari, Kaleghochi and Ohadi, respectively. This confirms the role of sucrose in osmotic
adjustment under severe drought stress, which is consistent with previous observations in
pistachio (Hajiboland et al., 2014) and other plant species (Arndt et al., 2001; Maraghni et al.,
2014; Šircelj et al., 2005). Although slight increases for hexoses (glucose and fructose) were
observed in all three cultivars, only for Kaleghochi fructose significantly increased under
severe drought stress (-1.5 MPa, 1.8 x). Based on the results obtained in chapter 4 and this
chapter, plant water status was maintained by leaf stomatal closure, which increased water
use efficiency (WUE). Soluble carbohydrate accumulation helped to maintain leaf turgor and
stomatal conductance for efficient intake of CO2 and promotes the root’s ability to take up
more water. Consequently, all of these parameters affected leaf water potential of pistachio
plants under drought conditions.
Surprisingly also leaf starch increased under drought stress (significantly for Ohadi; 2.7
times more than in control) contents (Table 5.1). This is in agreement with the results of
Vilagrosa et al. (2003) who reported shoot starch concentration increased with increasing
water stress in Aleppo pine (Pinus halepensis Mill.) seedlings. Moderate (-1.8 MPa) and
strong (-2.2 MPa) water stress treatments exhibited the highest concentrations, accumulating
55% more starch than control plants. This response can be explained because growth is
depressed earlier by drought (decrease in turgor pressure due to water loss) then are
photosynthesis, or nutrient absorption (Trubat et al., 2006; Vilagrosa et al., 2003). While, our
results are in contrast with observations of starch decrease under drought stress in leaves of
many other fruit trees (Ziziphus mauritiana and Prunus persica) (Arndt et al., 2000). Thus,
Impact of osmotic drought stress on the biochemical characteristics, water relations, and
nitrogen and carbon isotope composition of pistachio (Pistacia vera L.) cultivars
130
for the above pistachio cultivars, osmotic adjustment is achieved by increasing the number of
osmotically active molecules, i.e. proline (chapter 4) and soluble sugars, these increase was
still present after a recovery of two weeks. This allows leaf turgor pressure to be maintained
for a longer period during drought stress (Abbaspour et al., 2012a; Anjum et al., 2011; Arndt
et al., 2000) and was also observed by Panahi (2009) on different pistachio species. Also
Khoyerdi et al. (2016) found that pistachio cultivars maintained their turgor pressure through
osmoregulation and increase of their sugar contents.
Controlling the plant water balance is also strongly regulated by its stomatal control,
which is also influenced by density and morphology (Hetherington and Woodward, 2003).
These characteristics are affected by the genotype and by environmental factors (Dong and
Zhang, 2000; Munir et al., 2011). Changes in stomatal density are important as they can
affect both the uptake of CO2 and the rate of water loss (Alam, 1999). Stomatal density did
not show clear changes in our experiments because all studied pistachio cultivars were
exposed to drought stress for only a relatively short period (two weeks). Stomatal density can
change clearly when plants are exposed to longer drought periods, i.e. leaf stomatal density
can be adapted when new leaves are formed (Rouhi, 2007; Sanders and Arndt, 2012; Taiz
and Zeiger, 2010). Severe drought stress significantly decreased stomatal length and width
for Akbari plants. This was also observed in other edible pistachio cultivars under drought
stress (Arzani et al., 2013), as well as in drought-stressed olive trees (Olea europaea)
(Bosabalidis and Kofidis (2002). All drought stress treatments significantly decreased
stomatal conductance, while severe drought stress declined the stomatal length and width in
Akbari and the mild drought stress decreased stomatal density in Kaleghochi cultivar. There
were no significant correlations between stomatal length, width and stomatal density with
stomatal conductance (data not shown). A negative relationship, between stomatal length and
width with stomatal density, suggests that stomata can adopt a coping mechanism to deal
with excessive drought stress (data not shown). This is also observed in forest tree species
where species with larger stomata were slower to close and more sensitive to increasing
drought (Hetherington and Woodward, 2003). However, also genotypic differences were
observed as stomatal density for the studied cultivars was lower than those reported for wild
pistachio rootstocks (Ranjbarfordoei et al., 2002) and other edible cultivars (Arzani et al.,
2013).
Under drought stress plants change to a more efficient water use by partial closure of their
stomata. Indeed, both instantaneous WUE (Pn/E) and intrinsic WUE (Pn/gs) increased with
increasing osmotic stress (Table 5.3), as Pn, E and gs decreased by increasing drought stress
Chapter 5
131
(chapter 4). Enhanced WUE was still present after a 2-week recovery phase (Table 4.2). Our
results are consistent with the report of Behboudian et al. (1986) on pistachio (P. vera L.),
and Arndt et al. (2001) on common jujube (Ziziphus rotundifolia), Rouhi et al. (2007) on
almond (Prunus spp.) rootstocks. However, in two wild pistachio species (P. mutica and P.
khinjuk) photosynthesis and transpiration evolved in a similar way under increasing osmotic
stress (up to -1.4 MPa) resulting in an unaffected WUE (Ranjbarfordoei et al., 2000). This
difference may be related to genetic effects of the different pistachio species. Another aspect
of genetic differences is found in the absolute values of the instantaneous WUE: we found on
average 7 to 7.3 µmol CO2 mol-1
H2O while 18.6 to 23.4 µmol CO2 mol-1
H2O was found for
P. mutica and P. khinjuk (Ranjbarfordoei et al., 2000) indicating a better drought tolerance of
the wild species. We also observed a strong negative correlation between the intrinsic WUE
and photosynthesis (Table 5.4). On a long term this would also result in a negative correlation
between WUE and productivity (Li, 1999). Yet, this correlation was not observed in our 2-
weeks experiment.
This is the first report to our knowledge that investigates effects of drought stress
treatments on carbon and nitrogen isotope composition in pistachio seedlings. The observed
leaf δ13
C of control plants are within the range of -30.07 to -30.26‰, these values are also
reported for different Eucalyptus populations (Li, 1999). The applied moderate (-0.75 MPa)
and severe (-1.5 MPa) drought stress treatments did not result in any change of the leaf δ13
C
despite the observed changes in WUE, this irrespective of the cultivar. Hokmabadi et al.
(2005), however, found carbon isotope discrimination (Δ) decrease with increasing salinity in
leaves, stems and roots pistachio seedlings though RWC was not affected. Differences might
be attributed to the time scale of observations, two weeks in our experiment and four to eight
weeks in the salt stress experiment. However, Pascual et al. (2013) showed leaf carbon
isotope ratio was not significantly affected by either irrigation or nitrogen treatments with
different rootstocks of adult peach trees (Prunus persica).
In general, no significant correlations between δ13C with δ
15N and Pn (Table 5.4) and no
correlation between intrinsic and instantaneous WUE with carbon isotope composition
(Table 5.4) were found. This is in agreement with results on sunflower (Helianthus spp.)
(Lambrides et al., 2004) and agrees with the model of Farquhar and Richards (1984)
developed for wheat, though our results are in contrast with Arndt et al. (2001) in Ziziphus
rotundifoli and de Souza et al. (2005) in grapevines. The lack of a significant correlation
between intrinsic WUE and carbon isotope composition for the studied pistachio cultivars
Impact of osmotic drought stress on the biochemical characteristics, water relations, and
nitrogen and carbon isotope composition of pistachio (Pistacia vera L.) cultivars
132
exposed to drought stress (Table 5.4), indicates that this relation may not be used to
determine pistachio cultivars with appropriate WUE through leaf carbon isotope composition
in short term experiments.
Yousfi et al. (2012a) reported different plant parts may have a different reaction for δ15
N,
when plants are exposed to drought stress conditions. Root δ15
N increased under drought
stress condition; in contrast drought treatments significantly decreased shoot δ15
N in durum
wheat (Triticum durum). In our experiment, leaf δ15
N values under drought stress treatments
were, however, none significant compared to controls. A more negative shoot δ15
N therefore
suggests reduced nitrate assimilation under increasing osmotic stress which might be
reflected in reduced leaf nitrogen content as found in chapter 4. Isotope fractionation of
nitrogen may occur during uptake from the medium into root cells, or during subsequent
enzymatic assimilation into other N forms. Further fractionation may also occur if
biochemical components of varying isotopic composition are lost through translocation,
efflux, or emission (Evans, 2001; Pritchard and Guy, 2005). Furthermore nitrogen deficiency
in drought stress conditions will result in the reduction of photosynthetic rate, which would
affect growth rate and biomass production.
According to data of Table 5.5, the PC1 can be considered as a component related to
photosynthesis and WUE. In other words, this component was able to separate the plants with
high photosynthesis and WUE under different drought stress conditions. The second
component can be named as LWP and SDW dimension and it separates the drought tolerant
cultivars with high growth and water retention capacity.
The results indicated that biplot of PCA clearly separated three cultivars which were
grown under three water stress conditions. Thus, selection of cultivars that have high PC1 and
PC2 is suitable for different stress conditions because these cultivars have a high
photosynthesis rate along with high growth and water retention capacity. From the biplot,
cultivars Ohadi (9) with high PC1 and PC2 had high photosynthesis rate along with high
growth and water retention capacity under non stress conditions. Biplot depicted that cultivar
Ohadi (8) as compared with Akbari (2) and Kaleghochi (5) represented higher PC1 and PC2
under moderate drought stress condition (-0.75 MPa) and were selected as tolerant cultivar in
this conditions.
Under severe stress condition (-1.5 MPa), Ohadi (7) with higher PC1 and PC2 was
selected as tolerant cultivar compared to Akbari (1) and Kaleghochi (4). Generally, the biplot
indicated Ohadi as more tolerant and Akbari as more susceptible cultivars, respectively,
under drought stress conditions.
Chapter 5
133
5.5. Conclusion
Under osmotic stress conditions, pistachio cultivars developed an active drought tolerance
mechanism to cope with water deficiency. The present study has shown that drought stress
treatments increased soluble sugars and starch levels in our pistachio cultivars, although
relative water content was only moderately affected. WUE increased with the higher content
of osmotically active molecules, i.e. soluble sugars and proline, this increase was still present
after a recovery of two weeks. The observed lower stomatal density (Kaleghochi) and/or
reduced stomatal sizes (Akbari) can be considered as an anatomical adaptation at leaf level to
reduce its transpiration.
The applied moderate and severe drought stress conditions did not result in any change of
the leaf δ13
C despite the observed changes in WUE. This indicates that this relation may not
be used to determine pistachio cultivars with appropriate WUE through leaf carbon isotope
composition. In contrast leaf δ15
N indicated reduced nitrogen assimilation under increasing
drought stress.
According to the results of this experiment (Chapter 4 and 5), Akbari seems to be a
drought susceptible cultivar, while Kaleghochi and Ohadi seems to be drought tolerant
cultivars.

General conclusions and perspectives
134
General conclusions and perspectives Chapter 6.
Chapter 6
135
6.1 General conclusion
Water resources in arid and semi-arid regions are limited and are subjected to increasing
competition between agricultural, domestic and industrial uses. Climate warming will even
increase the need for irrigation. However, increased evapotranspiration rates and reduced
rainfall will limit water resources for irrigation. The progression of drought is increasingly
threatening agricultural production.
Arid and semi-arid climates prevail in approximately 80% of Iran’s land surface. Water
deficiency and poor water quality are the most common factors that affect the quality and
quantity of the crop production in these areas. Iran is the largest pistachio producer and
exporter in the world. However, high salinity of agricultural water and inadequate irrigation
are the main restrictions which farmers are facing (Sedaghat, 2010). Recently, pistachio
orchards productivity has declined and also Iran's share in the global pistachio market has
decreased significantly (Abdolahi, 2016; Sedaghat, 2010). Because arid and semi-arid areas
are not suitable to produce other crops in profitable way, pistachio cultivation remains the
only crop for farmers.
Increasing pistachio yield (quality and quantity) is one of the most important strategies in
order to maintain the country’s share in global markets. There are two ways to achieve a
higher pistachio production: i) extension of pistachio plantations in new areas; and ii)
increasing pistachio nut production per hectare. The first way is the most common in Iran.
Local farmers use the traditional rootstock (P. vera cv. Badami) to establish new pistachio
orchards in new areas although no advanced rootstock strategies are used in Iran. Another
strategy includes searching for more tolerant genotypes against abiotic and biotic stresses like
drought, salinity, cold, heat, pests and diseases. In this PhD research we have focused on
drought acclimation strategies in pistachio cultivars. Human and natural selection lead to a
wide genetic diversity among cultivated and wild species of pistachios. The search for
rootstocks and cultivars which are more tolerant to abiotic factors is urgent and crucial as
breeding for drought tolerance is a long-term process in fruit crops.
According to the results obtained in the rootstock experiment, there were some
considerable variations among pistachio rootstocks evaluated (Table 6.1 and appendix 6-
chapter 6). Taking all ecophysiological and biochemical parameters obtained in this study
into consideration, it can be concluded that Terebinthus (P. terebinthus) rootstock is more
tolerant to lower water availability in comparison with the other two evaluated rootstocks
namely Badami and Sarakhs (P. vera) that can be considered to be moderately drought

General conclusions and perspectives
136
tolerant and sensitive to drought, respectively. Consequently, pistachios growers have to
consider the use of this rootstock instead the others that may be more susceptible to drought
condition in new plantation areas.
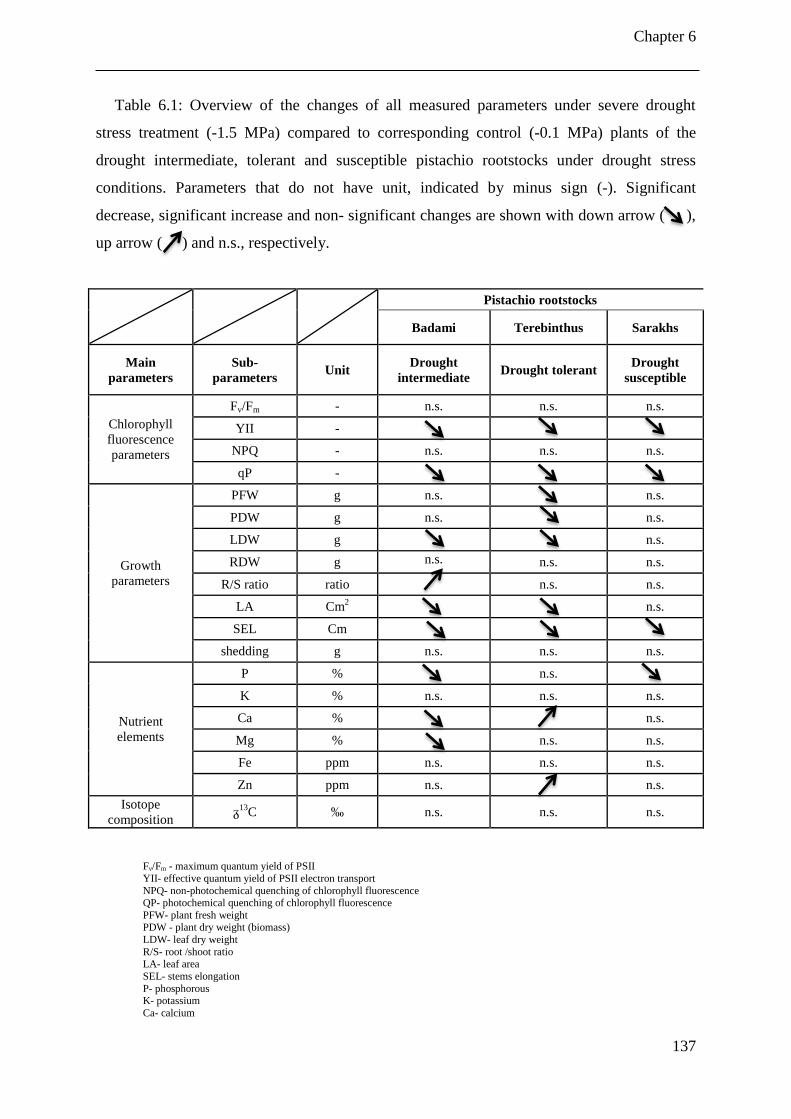
Chapter 6
137
Table 6.1: Overview of the changes of all measured parameters under severe drought
stress treatment (-1.5 MPa) compared to corresponding control (-0.1 MPa) plants of the
drought intermediate, tolerant and susceptible pistachio rootstocks under drought stress
conditions. Parameters that do not have unit, indicated by minus sign (-). Significant
decrease, significant increase and non- significant changes are shown with down arrow ( ),
up arrow ( ) and n.s., respectively.
Pistachio rootstocks
Badami Terebinthus Sarakhs
Main
parameters
Sub-
parameters Unit
Drought
intermediate Drought tolerant
Drought
susceptible
Chlorophyll
fluorescence
parameters
Fv/Fm - n.s. n.s. n.s.
YII -
NPQ - n.s. n.s. n.s.
qP -
Growth
parameters
PFW g n.s.
n.s.
PDW g n.s.
n.s.
LDW g
n.s.
RDW g n.s. n.s. n.s.
R/S ratio ratio
n.s. n.s.
LA Cm2
n.s.
SEL Cm
shedding g n.s. n.s. n.s.
Nutrient
elements
P %
n.s.
K % n.s. n.s. n.s.
Ca %
n.s.
Mg %
n.s. n.s.
Fe ppm n.s. n.s. n.s.
Zn ppm n.s.
n.s.
Isotope
composition ᵹ
13C ‰ n.s. n.s. n.s.
Fv/Fm - maximum quantum yield of PSII
YII- effective quantum yield of PSII electron transport
NPQ- non-photochemical quenching of chlorophyll fluorescence QP- photochemical quenching of chlorophyll fluorescence
PFW- plant fresh weight PDW - plant dry weight (biomass)
LDW- leaf dry weight
R/S- root /shoot ratio LA- leaf area
SEL- stems elongation
P- phosphorous K- potassium
Ca- calcium
General conclusions and perspectives
138
Mg- magnesium
Fe- iron Zn - zinc
δ13C- carbon isotope composition
Drought stress had a suppressing effect on the studied parameters in all pistachio cultivars
including Akbari, Kaleghochi and Ohadi, although its degree depended on the cultivar and
stress intensity. Some remarkable variation was observed between the three studied cultivars
(Table 6.2 and appendix 7- chapter 6). The observed responses lead to a better understanding
of drought-tolerant mechanisms in pistachio cultivars.
Based on our results obtained in chapters 4, 5 and mentioned in Table 6.2, Ohadi
pistachio, the most common cultivar in most pistachio plantation areas in Iran (Kerman
province), shows better capability to cope with drought conditions than Kaleghochi and
Akbari which have only recently been distributed in these areas. This recommendation is also
supported by drought tolerance of Ohadi cultivar under field conditions that are not irrigated
for long times (more than 5 years). These results can be important when farmers want to
extend plantation areas for new pistachio orchards in arid and semi-arid regions. Therefore,
farmers are recommended to use of this cultivar instead the others that may be more
susceptible to drought condition in new plantation areas.
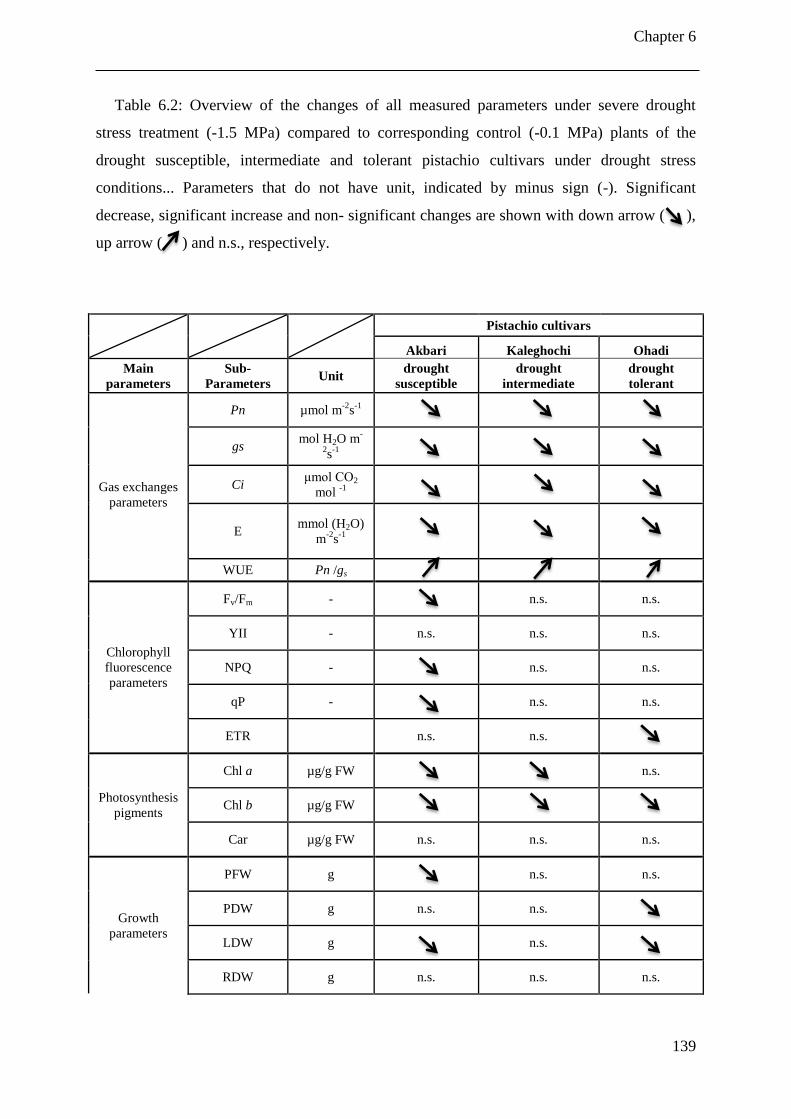
Chapter 6
139
Table 6.2: Overview of the changes of all measured parameters under severe drought
stress treatment (-1.5 MPa) compared to corresponding control (-0.1 MPa) plants of the
drought susceptible, intermediate and tolerant pistachio cultivars under drought stress
conditions... Parameters that do not have unit, indicated by minus sign (-). Significant
decrease, significant increase and non- significant changes are shown with down arrow ( ),
up arrow ( ) and n.s., respectively.
Pistachio cultivars
Akbari Kaleghochi Ohadi
Main
parameters
Sub-
Parameters Unit
drought
susceptible
drought
intermediate
drought
tolerant
Gas exchanges
parameters
Pn µmol m-2
s-1
gs mol H2O m
-
2s
-1
Ci μmol CO2
mol -1
E mmol (H2O)
m-2
s-1
WUE Pn /gs
Chlorophyll
fluorescence
parameters
Fv/Fm -
n.s. n.s.
YII - n.s. n.s. n.s.
NPQ -
n.s. n.s.
qP -
n.s. n.s.
ETR
n.s. n.s.
Photosynthesis
pigments
Chl a µg/g FW
n.s.
Chl b µg/g FW
Car µg/g FW n.s. n.s. n.s.
Growth
parameters
PFW g
n.s. n.s.
PDW g n.s. n.s.
LDW g
n.s.
RDW g n.s. n.s. n.s.
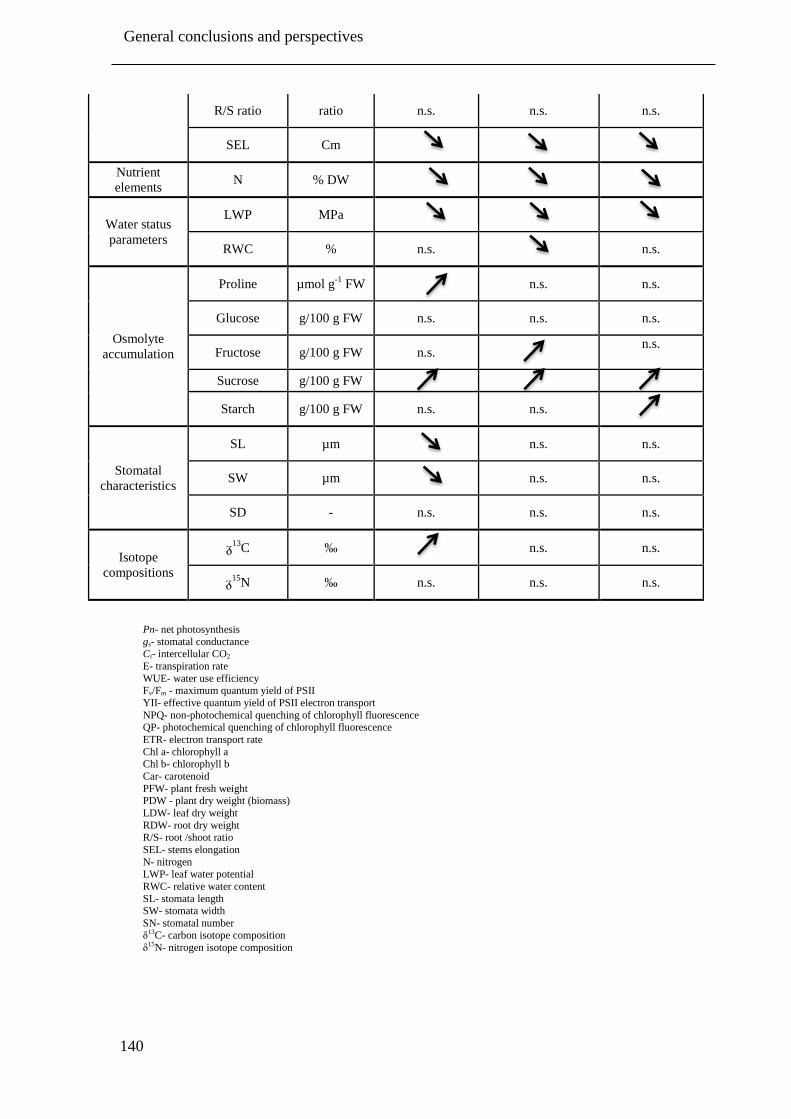
General conclusions and perspectives
140
R/S ratio ratio n.s. n.s. n.s.
SEL Cm
Nutrient
elements N % DW
Water status
parameters
LWP MPa
RWC % n.s.
n.s.
Osmolyte
accumulation
Proline µmol g-1
FW
n.s. n.s.
Glucose g/100 g FW n.s. n.s. n.s.
Fructose g/100 g FW n.s.
n.s.
Sucrose g/100 g FW
Starch g/100 g FW n.s. n.s.
Stomatal
characteristics
SL µm
n.s. n.s.
SW µm
n.s. n.s.
SD - n.s. n.s. n.s.
Isotope
compositions
ᵹ13
C ‰
n.s. n.s.
ᵹ15
N ‰ n.s. n.s. n.s.
Pn- net photosynthesis
gs- stomatal conductance Ci- intercellular CO2
E- transpiration rate
WUE- water use efficiency Fv/Fm - maximum quantum yield of PSII
YII- effective quantum yield of PSII electron transport
NPQ- non-photochemical quenching of chlorophyll fluorescence QP- photochemical quenching of chlorophyll fluorescence
ETR- electron transport rate
Chl a- chlorophyll a Chl b- chlorophyll b
Car- carotenoid
PFW- plant fresh weight PDW - plant dry weight (biomass)
LDW- leaf dry weight
RDW- root dry weight R/S- root /shoot ratio
SEL- stems elongation
N- nitrogen LWP- leaf water potential
RWC- relative water content
SL- stomata length SW- stomata width
SN- stomatal number δ13C- carbon isotope composition
δ15N- nitrogen isotope composition
Chapter 6
141
Our results demonstrate that different pistachio genotype use different mechanisms to deal
with drought stress. Evaluated pistachio rootstocks (Terebinthus (P. terebinthus) and Badami
and Sarakhs (P. vera)) and pistachio cultivars (Akbari, Kaleghochi and Ohadi (P. vera))
seedlings apply drought avoidance (the maintenance of turgor through increased root system
efficiency and water loss reduction through reduced stomatal conductance) (Levitt, 1980;
Mitra, 2001; Turner, 1986a), and drought-tolerance (maintenance of turgor through osmotic
adjustment and metabolite accumulation) (Chaves and Oliveira, 2004; Van Damme, 1990)
mechanisms. These mechanisms (drought avoidance and tolerance) were also shown for other
pistachio cultivars such as; Badami-riz, Ghazvini, Sarakhsi, Ahmadaghaii and Abareghi
(Bagheri et al., 2012; Habibi and Hajiboland, 2013; Khoyerdi et al., 2016) and Pistacia
mutica and Pistacia khinjuk rootstocks (Ranjbarfordoei et al., 2002). Although, drought
avoidance and drought tolerance have also been reported for other arid and semi-arid crops
that were exposed to drought stress conditions such as; Ziziphus lotus (Maraghni et al., 2014),
Olea europaea L. (Boussadia et al., 2013) and Prunus scoparia (Rouhi et al., 2007).
6.2 Perspectives for future research
In Iran, there will be continuous research efforts by government research centers to
introduce more tolerant pistachio cultivars and rootstocks to abiotic stress conditions.
Because of the high pistachio genetic diversity in Iran (more than 150 cultivars and 3
species), and limited information about foreign rootstocks, only a few farmers are interested
to use foreign rootstocks (those which are not originally from Iran) in their new orchards.
Increased knowledge about the drought tolerance of both domestic and foreign pistachio
rootstocks is critical for farmers to select the most appropriate rootstock.
This experiment was done under glasshouse conditions with exposing the plants only
under the drought stress condition, but influences of others abiotic and biotic stress conditions
such as; salinity, hot stress (over temperature), cold, nutrition elements, heavy metal, pests
and diseases were not determined. According to the results of this study most of
physiological responses to drought stress conditions are accompanied with the changes in
biochemical characteristics, while there was no combined instrument to measure these
parameters at the same time.
The period of drought stress (two weeks) was insufficient to provide real response for
some measured parameters especially for gas exchange and chlorophyll florescence
characteristics, osmolyte accumulations and carbon and nitrogen isotope compositions. On
General conclusions and perspectives
142
the other hand, the recovery stage (two weeks) also was inadequate for drought exposed
seedlings to be restored to a state similar to untreated conditions. Different pistachio
seedlings were evaluated under juvenile stage, so recommendation about the effects of
drought stress treatments on flowering time, fruit set, fruit ripening, yield qualitative and
quantitative characteristics and alternate bearing habit for adult trees are not expected.
Due to the high experimental efforts, time limitations and no previous planning in this
Ph.D. study, we did not evaluate the drought tolerance and drought susceptibility of pistachio
rootstocks and cultivars by molecular markers that give better and more strategies. P.
terebinthus rootstock is not originated from Iran region that is why there is limitation of
scientific resources to indicate the response of this species to most biotic and abiotic stresses
that are very common in Iran’s pistachio production regions.
The most perspectives for future research are described as follows;
According to the evaluated parameters in this study including morphological,
ecophysiological and biochemical parameters, we were able to select the most sensitive
parameters to evaluate and screen interesting cultivars and rootstocks. Terebinthus (P.
terebinthus) species and the native pistachio Ohadi (P. Vera L.) cultivar, now well-
studied during the first (Chapter 3) and second (Chapter 4 and 5) drought stress
experiments, respectively, could be used as the recommended rootstocks for new
pistachio orchards.
Our first experiment revealed that effective screening trials to study drought tolerance of
pistachio rootstocks i, e. Badami (P. vera L.) Terebinthus (P. terebinthus) and Sarakhs (P.
vera L.) (Chapter 3) can be based on biomass parameters (SDW, PFW, PDW, LDW, R/S
ratio), Fv/Fm and YII as suitable indicators for the screening and classification of pistachio
rootstocks under different drought stress conditions. The results obtained in our second
experiment revealed that efficient screening procedures for evaluating pistachio cultivars
i.e. Akbari (P. vera L.), Kaleghochi (P. vera L.) and Ohadi (P. vera L.) (Chapter 4 and 5)
could be based on the Pn, gs, YII, N, LWP and SDW as suitable indicators to classify
pistachio cultivars under different drought stress conditions. δ13
C and N values have, to
our knowledge, not been used earlier as drought stress parameters in pistachio, although
they responses are frequently used in salt stress response research in pistachio (Afrousheh
et al., 2010; Hokmabadi et al., 2005).
Our study clearly illustrates that variations in the drought tolerance of pistachio cultivars
is associated with variation in different physiological traits such as chlorophyll
fluorescence and metabolite compositions. Consequently, the latter physiological
Chapter 6
143
parameters also need to be investigated to understand how drought tolerance is
established in pistachio cultivars and to discriminate their relative drought-tolerant levels.
For a good understanding, combined physiological and biochemical traits are required to
screen drought tolerance of pistachio genotypes rather than analyzing a single trait. The
developed toolbox of chlorophyll fluorescence and metabolites, combined with
photosynthesis and respiration would further provide useful information on abiotic
tolerance in pistachio.
Although our study gives a good insight into the responses of pistachio rootstocks and
cultivars to drought stress, experiments were conducted in controlled glasshouse
conditions where the interaction with other abiotic variables was limited. Future research
should therefore study the behavior of the same rootstocks and cultivars in field
conditions and interaction effects of rootstocks and cultivars with high light intensities
and/or elevated temperature on biochemical and physiological parameters.
It will also be interesting to investigate the plant’s adaptive strategy if they are exposed to
the same or even more severe water deficit conditions during a longer period (e.g. 4-8
weeks) followed by a longer recovery period (4-8 weeks) in both tolerant and sensitive
pistachio genotypes.
Although during the juvenile stage, a clear distinction between tolerance levels can be
made, further research should also investigate the effect of drought stress on the
production potentiality of the same adult pistachio cultivars. Such research must involve
assessing the impact of drought stress on flowering, fruit development stages, ripening
and more specifically, on kernel growth of developing young fruits during summer which
could adversely affect yield under water scarcity.
More in-depth studies could assess the impact of drought on pollen tube growth, stigma
receptivity and fruit set, as fruit set percentage decrease following drought stress during
the flowering period. A better understanding of precocious flowering under moderate
drought stress is relevant in relation to spring frost damage which affects productivity in
adult trees.
The study of yield components (amount of nuts per tree/ha, kernel percentage) is
economically important as it will allow identifying the reduction in production of nuts
caused by drought in tolerant and susceptible cultivars. In addition, not only total
production but also fruit quality parameters such as percentage of split nuts, blank nuts,
General conclusions and perspectives
144
fruit color and average fruit weight (g) should be evaluated under drought stress
conditions.
It was shown that the three investigated rootstocks (chapter 3) clearly differed in their
response to drought. As a result, due to the drought avoidance mechanism of Badami by
leaf shedding (Chapter 3), this rootstock seems to be less suited as a rootstock compared
to Terebinthus, because it might cause leaf shedding in scions (Chatterjee, 1979; Taiz and
Zeiger, 2010). Although, and as an alternative for the commonly used Terebinthus,
Badami also seems to have some potential as rootstock. However, further research is
needed to support this statement.
We suggest examining the effects of exogenous application of osmolytes (such as proline)
on pistachio plant species/cultivars growing under stress conditions to enhance their
tolerance on adult tress.
Identifying differences among the considered genotypes in regard to nut production under
drought stress conditions would be an important step forward in the development of
cultivars with a reduced alternate bearing intensity.
Field studies on the interaction between soil nutrients (Ca, K and Zn) and drought stress
interactions are recommended.
Results recommend further research on long-term drought experiments and water
requirements of pistachio plants in the field. Moreover, further research on drought stress,
scion and rootstock compatibility are recommended.
A pistachio breeding program is needed to develop new cultivars/rootstocks for Iran's
pistachio industry. The program can begin by developing tolerant rootstocks and cultivars
to abiotic stress such as drought (Hasheminasab and Assad, 2017), salinity, cold and
excessive temperature during the juvenile stage. This breeding program should be
followed by evaluation of biotic stress against very common pistachio diseases
(Phytophthora spp., Aspergillus spp. and Verticilium spp.) and pests (Agonoscena
pistaciae, Kermania pistaciella, and Brachenema spp.). Later, pistachio rootstocks and
cultivars selected during the juvenile stage should be tested in field conditions against
different biotic and abiotic stress. Finally, the best cultivars and rootstocks combinations
should be promoted as a commercial combination with high drought tolerance and good
product performance. Combinations are best tested in the same field conditions. There are
possibilities to use three domestic rootstocks (P.vera, P. mutica and P. khinjuk) and one
foreign rootstock (P. terebinthus) combined with ten commercial cultivars (Akbari,
Kaleghochi, Ahmadaghai, Ohadi, Momtaz, Fandoghi 48, Abbasali, Shahpasand, Kalebozi
Chapter 6
145
and Badami-Safid) as suitable combinations for new pistachio plantation areas in Iran.
We will need to evaluate the drought stress responses under field conditions for all
rootstock x scion combinations.
Terebinthus pistachio rootstock used in this experiment, is not originally from Iran and
research on Iran’s biotic (disease and pests) and abiotic stress (salinity, cold and over
temperature) responses for the latter rootstock, is scarce. Therefore, researchers have to
evaluate and compare this rootstock with Iranian common pistachio rootstocks such as
P.vera cvs Badami, Sarakhs and Ghazvini, P. mutica and P. khinjuk that is needed to
examine against others biotic and abiotic parameters except drought stress.
For any breeding program, the choice of parents to be used in the crossing program is of
paramount importance and constitutes the basis for the success. Our results indicate that
Terebinthus and Ohadi can be used directly as suitable rootstock and cultivar/scion,
respectively, to extend pistachio plantation in arid and semi-arid regions of Iran and other
countries. These genotypes also can be used as ideal parents for improvements of
pistachio drought tolerance (major objective in pistachio breeding programs in Iran) in the
crossing program. Although, the photosynthesis parameters can be used as suitable
indices to screen drought tolerant pistachio cultivars in pistachio breeding programs,
application of molecular markers is expected to facilitate breeding programs. A more
fundamental perspective could be provided by studying molecular markers for effective
genes that induce drought tolerance in pistachio cultivars. Effective genes could be
revealed by e.g. genetic linkage mapping and qualitative trait loci (QTL).
6.3 Recommendations for farmers, researchers, and government
Farmers are advised to use the mentioned recommended rootstock and cultivar (P.
terebinthou and P. vera L. cv. Ohadi.) to extend pistachio plantation areas in new orchards.
Even in harsh drought stress conditions, it is best to use the combination of Terebinthus as a
rootstock and Ohadi as scion grafted on the latter rootstock in these areas.
There are laws on plant material exchange between countries, limiting access to pistachio
genetic material to researchers. Governments should therefore strive to establish an
international agreement on plant material exchange. In arid regions, one of the priorities
should be to encourage farmers to invest in pistachio planting.
Over the past few years, climate change in Iran has caused substantial weather
fluctuations, affecting many plant species. Some plant species such as pistachio, can more
General conclusions and perspectives
146
easily adapt to climate change because of the wide range of their optimum growth conditions.
This adaptation has led to the extension of plantation areas, where in some cases of other
species these climatic changes have resulted in the reduction of plantation areas. According to
what has been observed in pistachio plantation areas in Kerman province (Iran), climatic
change is forcing large-scale replacement of sensitive cultivars by cultivars that are more
resistant against or adapted to drought and salinity conditions. Because tolerant pistachio
cultivars could adopt themselves with changes of climate more easily. The Iranian
agricultural extension service plays a very significant role in enhancing agricultural
production in the country. At present, extension should focus on the replacement of old
pistachio cultivars and rootstocks with new genotypes and tolerant cultivars. Increased
extension staff numbers and budgets are needed to identify and distribute new pistachio
tolerant rootstocks and cultivars to the different pistachio growing region of Iran.
References
147
References
Abbaspour H, Afshari H and Abdel-Wahhab A (2012a) Influence of salt stress on growth,
pigments, soluble sugars and ion accumulation in three pistachio cultivars. JOURNAL OF
MEDICINAL PLANTS RESEARCH 6:2468-2473.
Abbaspour H, Saeidi-Sar S and Afshari H (2011) Improving drought tolerance of Pistacia
vera L. seedlings by arbuscular mycorrhiza under greenhouse conditions. JOURNAL OF
MEDICINAL PLANTS RESEARCH 5:7065-7072.
Abbaspour H, Saeidi-Sar S, Afshari H and Abdel-Wahhab M (2012b) Tolerance of
mycorrhiza infected pistachio (Pistacia vera L.) seedling to drought stress under glasshouse
conditions. JOURNAL OF PLANT PHYSIOLOGY 169:704-709.
Abbate PE, Dardanelli JL, Cantarero MG, Maturano M, Melchiori RJM and Suero EE
(2004) Climatic and water availability effects on water-use efficiency in wheat. CROP
SCIENCE 44:474-483.
Abdolahi M (2016) The study of input's temporal management on productivity increasing
in pistachio orchards in anar and rafsanjan cities. FINAL REORT published by Pistachio
Research Institute, Rafsanjan, Iran. Pp. 54 (Persian).
Abrishami MH (1995) Persian pistachio: a comprehensive history (in persian). University
publication center. Tehran, Iran. pp.375.
Adiredjo AL, Navaud O, Lamaze T and Grieu P (2014) Leaf Carbon Isotope
Discrimination as an Accurate Indicator of Water-Use Efficiency in Sunflower Genotypes
Subjected to Five Stable Soil Water Contents. JOURNAL OF AGRONOMY AND CROP
SCIENCE 200:416-424.
Afrousheh M, Ardalan M, Hokmabadi H and Afrousheh M (2010) Nutrient deficiency
disorders in Pistacia vera seedling rootstock in relation to eco-physiological, biochemical
characteristics and uptake pattern of nutrients. SCIENTIA HORTICULTURAE 124:141-148.
Afzadi MA, Tabatabaei BES, Mohammadi S and Tajabadipur A (2007) Comparison of
genetic diversity in species and cultivars of pistachio (Pistacia sp. L.) based on Amplified
Fragment Length Polymorphism (AFLP) markers. IRANIAN JOURNAL OF
BIOTECHNOLOGY 5:147-152.
Ahmed M, Qadeer U and Aslam MA (2011) Silicon application and drought tolerance
mechanism of sorghum. AFRICAN JOURNAL OF AGRICULTURAL RESEARCH 6: 594-
607.
Alam SM (1999) Nutrient uptake by plants under stress conditions. Handbook of plant and
crop stress 2:285-313.
Albouchi A, Bejaoui Z and El Aouni M (2003) Influence of moderate or severe water
stress on the growth of Casuarina glauca Sieb. seedlings. SÉCHERESSE (France).
Alexieva V, Sergiev I, Mapelli S and Karanov E (2001) The effect of drought and
ultraviolet radiation on growth and stress markers in pea and wheat. PLANT, CELL &
ENVIRONMENT 24:1337-1344.
Ali Q, Ashraf M, Shahbaz M and Humera H (2008) Ameliorating effect of foliar applied
proline on nutrient uptake in water stressed maize (Zea mays L.) plants. PAKISTAN
JOURNAL OF BOTANY 40:211-219.
References
148
Al-Saghir MG, Porter DM (2012) Taxonomic revision of the genus Pistacia L.
(Anacardiaceae). AMERICAN JOURNAL OF PLANT SCIENCES 3(1):12-32.
Anjum SA, Xie XY, Wang LC, Saleem MF, Man C and Lei W (2011) Morphological,
physiological and biochemical responses of plants to drought stress. AFRICAN JOURNAL
OF AGRICULTURAL RESEARCH 6:2026-2032.
Anonyme (2014) Iran,s agriculture stastical annual report, Ministry of agriculture jihad,
Tehran, Iran. pp 151.
Anonymous (2015) Iran map- Iran sattelate images, http://geology.com/world/iran-
satellite-image.shtml.
Anyia A and Herzog H (2004) Water-use efficiency, leaf area and leaf gas exchange of
cowpeas under mid-season drought. EUROPEAN JOURNAL OF AGRONOMY 20:327-339.
Apel K and Hirt H (2004) Reactive oxygen species: metabolism, oxidative stress, and
signal transduction. ANNUAL REVIW PLANT BIOLOGY 55:373-399.
Araus J, Slafer G, Reynolds M and Royo C (2002) Plant breeding and drought in C3
cereals: what should we breed for? ANNALS OF BOTANY 89:925-940.
Arndt S, Clifford S, Wanek W, Jones H and Popp M (2001) Physiological and
morphological adaptations of the fruit tree Ziziphus rotundifolia in response to progressive
drought stress. TREE PHYSIOLOGY 21:705-715.
Arndt SK, Wanek W, Clifford SC and Popp M (2000) Contrasting adaptations to drought
stress in field-grown Ziziphus mauritiana and Prunus persica trees: water relations, osmotic
adjustment and carbon isotope composition. FUNCTIONAL PLANT BIOLOGY 27:985-996.
Arzani K, Ghasemi M, Yadollahi A and Hokmabadi H (2013) Estudio de la anatomía
foliar epidermal de cuatro rizomas de pistacho bajo estrés hídrico. IDESIA (Arica) 31:101-
107.
Ashraf M (2002) Salt tolerance of cotton: some new advances. CRITICAL REVIEWS IN
PLANT SCIENCES 21:1-30.
Ashraf M, Ashraf MY, Khaliq A and Rha ES (2004) Growth and leaf gas exchange
characteristics in Dalbergia sissoo Roxb. and D. latifolia Roxb. under water deficit.
PHOTOSYNTHETICA 42:157-160.
Ashraf M and Foolad M (2007) Roles of glycine betaine and proline in improving plant
abiotic stress resistance. ENVIRONMENTAL AND EXPERIMENTAL BOTANY 59:206-
216.
Ashraf M, Shahbaz M and Ali Q (2013) Drought-induced modulation in growth and
mineral nutrients in canola (Brassica napus L.). PAKISTAN JOURNAL OF BOTANY
45:93-98.
Atli HS, Arpaci S, Kaska N and Ayanoglu H (1998) Wild Pistacia species in Turkey, in
TOWARDS A COMPREHENSIVE DOCUMENTATION AND USE OF PISTACHIO
DIVERSITY IN CENTRAL AND WEST ASIA, NORTH AFRICA AND EUROPE
(Padulosi S and Hadj-Hassan A eds), International Plant Genetic Resource Institute, Rome,
Italy. pp 35-40.
Babiychuk E, Kushnir S, Belles-Boix E, Van Montagu M and Inzé D (1995) Arabidopsis
thaliana NADPH oxidoreductase homologs confer tolerance of yeasts toward the thiol-
oxidizing drug diamide. JOURNAL OF BIOLOGICAL CHEMISTRY 270:26224-26231.
References
149
Bacelar EA, Moutinho-Pereira JM, Goncalves BC, Ferreira HF and Correia CA (2007)
Changes in growth, gas exchange, xylem hydraulic properties and water use efficiency of
three olive cultivars under contrasting water availability regimes. ENVIRONMENTAL AND
EXPERIMENTAL BOTANY 60:183-192.
Bagheri V, Shamshiri MH, Shirani H and Roosta HR (2011) Effect of mycorrhizal
inoculation on ecophysiological responses of pistachio plants grown under different water
regimes. PHOTOSYNTHETICA 49:531-538.
Baker NR and Rosenqvist E (2004) Applications of chlorophyll fluorescence can improve
crop production strategies: an examination of future possibilities. JOURNAL OF
EXPERIMENTAL BOTANY 55:1607-1621.
Banakar M and Ranjbar G (2010) Evaluation of salt tolerance of pistachio cultivars at
seedling stage. AMERICAN-EURASIAN JOURNAL OF AGRICULTURAL &
ENVIRONMENTAL SCIENCES 9 (2):112-115.
Bartels D and Sunkar R (2005) Drought and salt tolerance in plants. CRITICAL
REVIEWS IN PLANT SCIENCES 24:23-58.
Bartoli CG, Gomez F, Gergoff G, Guiamét JJ and Puntarulo S (2005) Up-regulation of the
mitochondrial alternative oxidase pathway enhances photosynthetic electron transport under
drought conditions. JOURNAL OF EXPERIMENTAL BOTANY 56:1269-1276.
Bastam N, Baninasab B and Ghobadi C (2013) Improving salt tolerance by exogenous
application of salicylic acid in seedlings of pistachio. PLANT GROWTH REGULATION
69:275-284.
Bates, Waldren RP and ID T (1973) Rapid determination of free proline for water stress
studies. PLANT AND SOIL 39::205-207.
Bauer D, Biehler K, Fock H, Carrayol E, Hirel B, Migge A and Becker TW (1997) A role
for cytosolic glutamine synthetase in the remobilization of leaf nitrogen during water stress in
tomato. PHYSIOLOGIA PLANTARUM 99:241-248.
Beck EH, Fettig S, Knake C, Hartig K and Bhattarai T (2007) Specific and unspecific
responses of plants to cold and drought stress. JOURNAL OF BIOSCIENCES 32:501-510.
Behboudian M, Walker R and Törökfalvy E (1986) Effects of water stress and salinity on
photosynthesis of pistachio. SCIENTIA HORTICULTURAE 29:251-261.
Belhadj S, Derridj A, Moriana A, Gijon M, Mevy J and Gauquelin T (2011) Comparative
analysis of stomatal characters in eight wild atlas pistachio populations (Pistacia atlantica
Desf.; Anacardiaceae). INTERNATIONAL RESEARCH JOURNAL OF PLANT SCIENCE
2:060-069.
Belhassen E (1997) Drought tolerance in higher plants: genetical, physiological and
molecular biological analysis. Kluwer Academic Publishers, Springer.
Benhassaini H, Fetati A, Hocine AK and Belkhodja M (2012) Effect of salt stress on
growth and accumulation of proline and soluble sugars on plantlets of Pistacia atlantica
Desf. subsp. atlantica used as rootstocks. BIOTECHNOLOGIE, AGRONOMIE, SOCIÉTÉ
ET ENVIRONNEMENT 16(2):159-165.
Benjamin J and Nielsen D (2006) Water deficit effects on root distribution of soybean,
field pea and chickpea. FIELD CROPS RESEARCH 97:248-253.
References
150
Bhatt R and Srinivasa Rao N (2005) Influence of pod load on response of okra to water
stress. INDIAN JOURNAL OF PLANT PHYSIOLOGY 10:54-59.
Black M and Pritchard HW (2002) Desiccation and survival in plants: drying without
dying. Cabi. pp. 416.
Blum A (1996) Crop responses to drought and the interpretation of adaptation. PLANT
GROWTH REGULATION 20:135-148.
Blum A (2005) Drought resistance, water-use efficiency, and yield potential—are they
compatible, dissonant, or mutually exclusive? CROP AND PASTURE SCIENCE 56:1159-
1168.
Bohnert and Jensen R (1996) Strategies for engineering water-stress tolerance in plants.
TRENDS IN BIOTECHNOLOGY 14: 89-97.
Bosabalidis AM and Kofidis G (2002) Comparative effects of drought stress on leaf
anatomy of two olive cultivars. PLANT SCIENCE 163:375-379.
Boussadia O, Mariem FB, Mechri B, Boussetta W, Braham M and Hadj SBE (2008)
Response to drought of two olive tree cultivars (cv Koroneki and Meski). SCIENTIA
HORTICULTURAE 116:388-393.
Boyer JS (1996) Advances in drought tolerance in plants. ADVANCES IN AGRONOMY
(USA).
Cabrera-Bosquet L, Molero G, Nogués S and Araus JL (2009) Water and nitrogen
conditions affect the relationships of Δ13
C and Δ18
O to gas exchange and growth in durum
wheat. JOURNAL OF EXPERIMENTAL BOTANY 60:1633-1644.
Cechin I, Corniani N, Fumis TD and Cataneo AC (2008) Ultraviolet-B and water stress
effects on growth, gas exchange and oxidative stress in sunflower plants. RADIATION AND
ENVIRONMENTAL BIOPHYSICS 47:405-413.
Centritto M, Lucas ME and Jarvis PG (2002) Gas exchange, biomass, whole-plant water-
use efficiency and water uptake of peach (Prunus persica) seedlings in response to elevated
carbon dioxide concentration and water availability. TREE PHYSIOLOGY 22:699-706.
Cernusak LA, Winter K, Aranda J and Turner BL (2008) Conifers, angiosperm trees, and
lianas: growth, whole-plant water and nitrogen use efficiency, and stable isotope composition
(δ13
C and δ18
O) of seedlings grown in a tropical environment. PLANT PHYSIOLOGY
148:642-659.
Chaves M, Flexas J and Pinheiro C (2009) Photosynthesis under drought and salt stress:
regulation mechanisms from whole plant to cell. ANNALS OF BOTANY 103:551-560.
Chaves M and Oliveira M (2004) Mechanisms underlying plant resilience to water
deficits: prospects for water-saving agriculture. JOURNAL OF EXPERIMENTAL BOTANY
55:2365-2384.
Chaves MM, Pereira JS, Maroco J, Rodrigues ML, Ricardo CPP, Osório ML, Carvalho I,
Faria T and Pinheiro C (2002) How plants cope with water stress in the field? Photosynthesis
and growth. ANNALS OF BOTANY 89:907-916.
Cheraghi SAM (2004) Institutional and scientific profiles of organizations working on
saline agriculture in Iran., in Prospects of saline agriculure in the Arabian Peninsula (Taha F,
Esmail K and Jaradat A eds), Amherst Scientific Publishers, U.S.A. pp 399-412.
References
151
Chimenti CA, Marcantonio M and Hall A (2006) Divergent selection for osmotic
adjustment results in improved drought tolerance in maize (Zea mays L.) in both early growth
and flowering phases. FIELD CROPS RESEARCH 95:305-315.
Claussen W (2005) Proline as a measure of stress in tomato plants. PLANT SCIENCE
168:241-248.
Clifford S, Arndt S, Popp M and Jones H (2002) Mucilages and polysaccharides in
Ziziphus species (Rhamnaceae): localization, composition and physiological roles during
drought‐stress. JOURNAL OF EXPERIMENTAL BOTANY 53:131-138.
Condon A, Richards R, Rebetzke G and Farquhar G (2004) Breeding for high water-use
efficiency. JOURNAL OF EXPERIMENTAL BOTANY 55:2447-2460.
Cornic G (1994a) Drought stress and high light effects on leaf photosynthesis, in
Photoinhibition of photosynthesis; from molecular mechanisms to the field (Baker HR,
Bowyer, J.R. ed), Bio Scientific publishers, Oxford, Uk. pp 297-313.
Cornic G and Fresneau C (2002) Photosynthetic carbon reduction and carbon oxidation
cycles are the main electron sinks for photosystem II activity during a mild drought.
ANNALS OF BOTANY 89:887-894.
Cornic G and Massacci A (1996) Leaf photosynthesis under drought stress, in
Photosynthesis and the Environment. Springer. pp. 347-366.
Cruz de Carvalho MH (2008) Drought stress and reactive oxygen species: production,
scavenging and signaling. PLANT SIGNALING & BEHAVIOR 3:156-165.
Cui N, Du T, Kang S, Li F, Hu X, Wang M and Li Z (2009) Relationship between stable
carbon isotope discrimination and water use efficiency under regulated deficit irrigation of
pear-jujube tree. AGRICULTURAL WATER MANAGEMENT 96:1615-1622.
de Souza CR, Maroco JP, dos Santos TP, Rodrigues ML, Lopes CM, Pereira JS and
Chaves MM (2005) Impact of deficit irrigation on water use efficiency and carbon isotope
composition (delta13
C) of field-grown grapevines under Mediterranean climate. JOURNAL
OF EXPERIMENTAL BOTANY 56:2163-2172.
DeEll JR, van Kooten O, Prange RK and Murr DP (1999) Applications of chlorophyll
fluorescence techniques in postharvest physiology. HORTICULTURE REVIEW 23:69-107.
Del Amor F and Cuadra-Crespo P (2011) Alleviation of salinity stress in broccoli using
foliar urea or methyl-jasmonate: analysis of growth, gas exchange, and isotope composition.
PLANT GROWTH REGULATION 63:55-62.
Del Arco JM, Escudero A and Garrido MV (1991) Effects of site characteristics on
nitrogen retranslocation from senescing leaves. ECOLOGY:701-708.
Demirevska K, Zasheva D, Dimitrov R, Simova-Stoilova L, Stamenova M and Feller U
(2009) Drought stress effects on Rubisco in wheat: changes in the Rubisco large subunit.
ACTA PHYSIOLOGY PLANARUMT 31:1129-1138.
Dong X and Zhang X (2000a) Special stomatal distribution in Sabina vulgaris in relation
to its survival in a desert environment. TREES 14:369-375.
Egilla J, Davies Jr F and Boutton T (2005) Drought stress influences leaf water content,
photosynthesis, and water-use efficiency of Hibiscus rosa-sinensis at three potassium
concentrations. PHOTOSYNTHETICA 43:135-140.
References
152
Ehleringer J, Hall A and Farquhar G (1993) Carbon and water relations in desert plants: an
isotopic perspective, in Stable isotopes and plant carbon-water relations, Academic Press Inc.
pp 155-172.
Ehleringer JR, Field C, Lin Z-f and Kuo C-y (1986) Leaf carbon isotope and mineral
composition in subtropical plants along an irradiance cline. OECOLOGIA 70:520-526.
Esmaeilpour A (1996) Effects of heading back on branching, flowering and pistachio
yielding, in Horticulture department, MSc thesis, Shiraz university. Shiraz, Iran. pp 122.
Esmaeilpour A (1998) Distribution, use and conservation of pistachio in Iran. , in Towards
a comprehensive documentation and use of Pistachio diversity in central and west Asia,
North Africa and Europe (Padolosi S and Hadj-Hassan A eds), International Plant Genetic
Resource Institute. Rome, Italy. pp 16-26
Esmaeilpour A, Javanshah A, Hokmabadi H, Panahi Ba and Alipour H (2010) Pistachio
horticulture research chapter. , in The strategie framework for developing and promoting
pistachio research in Iran (Mehrnejad MR and Javanshah as eds), Jomhori publication.
Tehran, Iran. Pp. 245.
Esmaeilpour A and Khezri M (2006) Abscission of inflorescence buds as affected by
genetic characteristics in some Iranian commercial pistachio cultivars. INTERNATIONAL
JOURNAL OF AGRICULTURE AND BIOLOGY 8:360-362.
Esmaeilpour A, Van Labeke M-C, Samson R and Van Damme P (2015) Osmotic stress
affects physiological responses and growth characteristics of three pistachio cultivars. ACTA
PHYSIOLOGY PLANTARUM 37:1-14.
Evans JR (1989) Photosynthesis and nitrogen relationships in leaves of C3 plants.
OECOLOGIA 78:9-19.
FAO (2012) http://faostat.fao.org/site/339/default.aspx.
Fardooei AR (2001) Evaluation of salt and drought resistance of two pistachio species
(Pistacia khinjuk and P. mutica) in terms of ecophysiological and growth characteristics, in
Plant production department, PhD thesis, Ghent university, Ghent, Belgium,pp. 187.
Farghali K (1998) Chlorophyll content and its stability in native species inhabiting the
Egyptian Desert. JOURNAL OF ARID ENVIRONMENTS 40:163-175.
Farooq M, Wahid A, Kobayashi N, Fujita D and Basra S (2009a) Plant drought stress:
effects, mechanisms and management, in Sustainable Agriculture Springer, pp.153-188.
Farooq M, Wahid A, Kobayashi N, Fujita D and Basra SMA (2009b) Plant drought stress:
effects, mechanisms and management. AGRONOMY FOR SUSTAINABLE
DEVELOPMENT 29:185-212.
Farquhar G and Richards R (1984) Isotopic composition of plant carbon correlates with
water-use efficiency of wheat genotypes. FUNCTIONAL PLANT BIOLOGY 11:539-552.
Farquhar GD, Ehleringer JR and Hubick KT (1989) Carbon isotope discrimination and
photosynthesis. ANNUAL REVIEW OF PLANT BIOLOGY 40:503-537.
Farquhar GD and Sharkey TD (1982) Stomatal conductance and photosynthesis.
ANNUAL REVIEW OF PLANT PHYSIOLOGY 33:317-345.
Fayyaz P, Etemadi E, Julaiee-Manesh N and Zolfaghari R (2013) Sodium and potassium
allocation under drought stress in Atlas mastic tree (Pistacia atlantica subsp. mutica).
IFOREST-BIOGEOSCIENCES AND FORESTRY 6:90.
References
153
Ferguson L, Poss J, Grattan S, Grieve C, Wang D, Wilson C, Donovan T and Chao C-T
(2002) Pistachio rootstocks influence scion growth and ion relations under salinity and boron
stress. JOURNAL OF THE AMERICAN SOCIETY FOR HORTICULTURAL SCIENCE
127:194-199.
Ferguson L, Sanden B, Grattan S, Epstein L and Krueger B (2005) Pistachio rootstocks, in
Pistachio Production Manual, forth Edition (Ferguson L , Beed RH, Freeman M W, Haviland
D R, Holtz B A and C E Kallsen, eds) University of Davis, California. Pp. 251.
Fernandez RT, Perry RL and Flore JA (1997) Drought response of young apple trees on
three rootstocks: growth and development. JOURNAL OF THE AMERICAN SOCIETY
FOR HORTICULTURAL SCIENCE 122:14-19.
Filella I, Llusia J, Piñol J and Peñuelas J (1998) Leaf gas exchange and fluorescence of
Phillyrea latifolia, Pistacia lentiscus and Quercus ilex saplings in severe drought and high
temperature conditions. ENVIRONMENTAL AND EXPERIMENTAL BOTANY 39:213-
220.
Flexas J, Barón M, Bota J, Ducruet J-M, Gallé A, Galmés J, Jiménez M, Pou A, Ribas-
Carbó M and Sajnani C (2009) Photosynthesis limitations during water stress acclimation and
recovery in the drought-adapted Vitis hybrid Richter-110 (V. berlandieri× V. rupestris).
JOURNAL OF EXPERIMENTAL BOTANY 60:2361-2377.
Flexas J, Bota J, Escalona JM, Sampol B and Medrano H (2002) Effects of drought on
photosynthesis in grapevines under field conditions: an evaluation of stomatal and mesophyll
limitations. FUNCTIONAL PLANT BIOLOGY 29:461-471.
Flower D and Ludlow M (1986) Contribution of osmotic adjustment to the dehydration
tolerance of water‐stressed pigeon pea (Cajanus cajan (L.) millsp.) leaves. PLANT, CELL &
ENVIRONMENT 9:33-40.
Fotohi Ghazvini R, Sajadian H, Hokmabadi H and A. S (2007) Effects of Pistachio
Rootstocks on Ecophysiological Characteristics of Commercial Pistachio Cultivars
INTERNATIONAL JOURNAL OF AGRICULTURE AND BIOLOGY 1560–
8530/2007/09–2:3 pages.
Fulda S, Mikkat S, Stegmann H and Horn R (2011) Physiology and proteomics of drought
stress acclimation in sunflower (Helianthus annuus L.). PLANT BIOLOGY 13:632-642.
Gallé A and Feller U (2007) Changes of photosynthetic traits in beech saplings (Fagus
sylvatica) under severe drought stress and during recovery. PHYSIOLOGIA PLANTARUM
131:412-421.
Ganago I (1998) The chlorophyll fluorescence quenching and changes of absorbance in
pea chloroplasts. PHOTOSYNTHETICA 34:281-291.
Germana C (1996) The response of pistachio trees to water stress as affected by two
different rootstocks, in II International Symposium on Irrigation of Horticultural Crops 449.
pp 513-520.
Ghazvini RF, Sajadian H, Hokmabadi H and Ahmad S (2007) Effects of pistachio
rootstocks on ecophysiological characteristics of commercial pistachio cultivars.
INTERNATIONAL JOUNAL OF AGRICULTURE AND BIOLOGY 9:352-354.
Gijón M, Gimenez C, Perez-López D, Guerrero J, Couceiro JF and Moriana A (2010)
Rootstock influences the response of pistachio (Pistacia vera L. cv. Kerman) to water stress
and rehydration. SCIENTIA HORTICULTURAE 125:666-671.
References
154
Gijon MC, Guerrero J, Couceiro JF and Moriana A (2009) Deficit irrigation without
reducing yield or nut splitting in pistachio (Pistacia vera cv Kerman on Pistacia terebinthus
L.). AGRICULTURAL WATER MANAGEMENT 96:12-22.
Gill SS and Tuteja N (2010) Reactive oxygen species and antioxidant machinery in abiotic
stress tolerance in crop plants. PLANT PHYSIOLOGY AND BIOCHEMISTRY 48:909-930.
Gnaana Saraswathi S and Paliwal K (2011) Drought induced changes in growth, leaf gas
exchange and biomass production in Albizia lebbeck and Cassia siamea seedlings.
JOURNAL OF ENVIRONMENTAL BIOLOGY 32:173.
Goldhamer DA (1995) Irrigation management, in Pistachio production manual (Ferguson
L ed), Center for fruit and nut research and information, Davise. pp 71-81.
Goldhamer DA and Beede RH (2004) Regulated deficit irrigation effects on yield, nut
quality and water-use efficiency of mature pistachio trees. JOURNAL OF
HORTICULTURAL SCIENCE & BIOTECHNOLOGY 79:538-545.
Goldhamer DA, Kjelgren RB, Lane J, Weinberger G and Menezes Jr J (1985) Water use
requirements of pistachio trees and response to water stress. ANNUAL REPORT OF THE
CALIFORNIA PISTACHIO COMMISION, CROP YEAR:85-92.
Guerfel M, Baccouri O, Boujnah D, Chaibi W and Zarrouk M (2009) Impacts of water
stress on gas exchange, water relations, chlorophyll content and leaf structure in the two main
Tunisian olive (Olea europaea L.) cultivars. SCIENTIA HORTICULTURAE 119:257-263.
Gupta U (1975) Physiological aspects of dryland farming. Physiological aspects of
dryland farming Oxford and IBH Publishers Co New Delhi.
Habibi G and Hajiboland R (2013) Alleviation of drought stress by silicon
supplementation in pistachio (Pistacia vera L.) plants. FOLIA HORTICULTURAE 25:21-
29.
Haffani S, Mezni M, Slama I, Ksontini M and Chaïbi W (2014) Plant growth, water
relations and proline content of three vetch species under water‐limited conditions. GRASS
AND FORAGE SCIENCE 69(2):323-333.
Hajiboland R, Norouzi F and Poschenrieder C (2014) Growth, physiological, biochemical
and ionic responses of pistachio seedlings to mild and high salinity. TREES 28:1065-1078.
Hald PM (1947) The flame photometer for the measurement of sodium and potassium in
biological materials. JOURNAL OF BIOLOGICAL CHEMISTRY 167:499-510.
Hare P and Cress W (1997) Metabolic implications of stress-induced proline accumulation
in plants. PLANT GROWTH REGULATION 21:79-102.
Hasheminasab H and Assad MT (2017) Genetic and multivariate phenotypic analyses of
some selection indices in pistachio (Pistacia vera L.) cultivars under drought stress
conditions. GENETIKA 49(2): 705-715.
Hassan IA (2006) Effects of water stress and high temperature on gas exchange and
chlorophyll fluorescence in Triticum aestivum L. PHOTOSYNTHETICA 44:312-315.
Hessini K, Martínez JP, Gandour M, Albouchi A, Soltani A and Abdelly C (2009) Effect
of water stress on growth, osmotic adjustment, cell wall elasticity and water-use efficiency in
Spartina alterniflora. ENVIRONMENTAL AND EXPERIMENTAL BOTANY 67:312-319.
References
155
Hokmabadi H, Arzani K and Grierson P (2005) Growth, chemical composition, and
carbon isotope discrimination of pistachio (Pistacia vera L.) rootstock seedlings in response
to salinity. CROP AND PASTURE SCIENCE 56:135-144.
Hörtensteiner S and Feller U (2002) Nitrogen metabolism and remobilization during
senescence. JOURNAL OF EXPERIMENTAL BOTANY 53:927-937.
Horváth E, Pál M, Szalai G, Páldi E and Janda T (2007) Exogenous 4-hydroxybenzoic
acid and salicylic acid modulate the effect of short-term drought and freezing stress on wheat
plants. BIOLOGIA PLANTARUM 51:480-487.
Hossain Z, Nouri M-Z and Komatsu S (2011) Plant cell organelle proteomics in response
to abiotic stress. JOURNAL OF PROTEOME RESEARCH 11:37-48.
Hsiao TC and Xu LK (2000) Sensitivity of growth of roots versus leaves to water stress:
biophysical analysis and relation to water transport. JOURNAL OF EXPERIMENTAL
BOTANY 51:1595-1616.
Hussain M, Malik M, Farooq M, Ashraf M and Cheema M (2008) Improving drought
tolerance by exogenous application of glycinebetaine and salicylic acid in sunflower.
JOURNAL OF AGRONOMY AND CROP SCIENCE 194:193-199.
Ingram J and Bartels D (1996) The molecular basis of dehydration tolerance in plants.
ANNUAL REVIEW OF PLANT BIOLOGY 47:377-403.
Jaafarzade E (1998) Climatology. Tehran university. Tehran, Iran.
Jabeen F, Shahbaz M and Ashraf M (2008) Discriminating some prospective cultivars of
maize (Zea mays L.) for drought tolerance using gas exchange characteristics and proline
contents as physiological markers. PAKISTAN JOURNAL OF BOTANY 40:2329-2343.
Jaleel CA, Manivannan P, Wahid A, Farooq M, Al-Juburi HJ, Somasundaram R and
Panneerselvam R (2009) Drought stress in plants: a review on morphological characteristics
and pigments composition. INTERNATIONAL JOURNAL OF AGRICULTURE AND
BIOLOGY 11:100-105.
Jeremias K (1966) Der Einfluß der Bodentrockenheit auf den Zuckergehalt vegetativer
Pflanzenteile, Gustav Fischer Verlag Villengang 2, D-07745 Jena, Germany. pp 237-239.
Jiang Q, Roche D, Monaco TA and Durham S (2006) Gas exchange, chlorophyll
fluorescence parameters and carbon isotope discrimination of 14 barley genetic lines in
response to salinity. FIELD CROPS RESEARCH 96:269-278.
Johnson DA and Rumbaugh MD (1995) Genetic variation and inheritance characteristics
for carbon isotope discrimination in alfalfa. JOURNAL OF RANGE MANAGEMENT:126-
131.
Junjittakarn J, Pimratch S, Jogloy S, Htoon W, Singkham N, Vorasoot N, Toomsan B,
Holbrook C and Patanothai A (2013) Nutrient uptake of peanut genotypes under different
water regimes. INTERNATIONAL JOURNAL OF PLANT PRODUCTION 7: 677-692.
Kafi M, Borzoee A, Salehi M, Kamandi A, Masoumi A and Nabati J (2012) Physiology of
environmental stresses in plants (Persian). Mashhad Jihade University press, Mashhad, Iran,
pp. 235.
Kanber R, Yazar A, Önder S and Köksal H (1993) Irrigation response of pistachio
(Pistacia vera L.). IRRIGATION SCIENCE 14:7-14.
References
156
Karimi S, Rahemi M, Maftoun M and Tavallali V (2009) Effects of long-term salinity on
growth and performance of two pistachio (Pistacia L.) rootstocks. AUSTRALIAN
JOURNAL OF BASIC AND APPLIED SCIENCES 3:1630-1639.
avar T, Maras M, idrič M, Šuštar-Vozlič J and Meglič V (2008) Identification of genes
involved in the response of leaves of Phaseolus vulgaris to drought stress. MOLECULAR
BREEDING 21:159-172.
Kempa S, Krasensky J, Dal Santo S, Kopka J and Jonak C (2008) A central role of
abscisic acid in stress-regulated carbohydrate metabolism. Plos one 3:e3935.
Khan MB, Hussain N and Iqbal M (2001) Effect of water stress on growth and yield
components of maize variety YHS 202. JOURNAL OF RESEARCH (SCIENCE) 12:15-18.
Khatamsaz M (1988) Flora of Iran No. 30: Anacardiaceae. Research Institute of Forests
and Rangelands, Tehran, Iran.
Kiani SP, Talia P, Maury P, Grieu P, Heinz R, Perrault A, Nishinakamasu V, Hopp E,
Gentzbittel L and Paniego N (2007) Genetic analysis of plant water status and osmotic
adjustment in recombinant inbred lines of sunflower under two water treatments. PLANT
SCIENCE 172:773-787.
Klamkowski K and Treder W (2007) Morphological and physiological responses of
strawberry plants to water stress. AGRICULTURAE CONSPECTUS SCIENTIFICUS (ACS)
71:159-165.
Kooten O and Snel JF (1990) The use of chlorophyll fluorescence nomenclature in plant
stress physiology. PHOTOSYNTHESIS RESEARCH 25:147-150.
Kousari MR and Ahani H (2012) An investigation on reference crop evapotranspiration
trend from 1975 to 2005 in Iran. INTERNATIONAL JOURNAL OF CLIMATOLOGY
32:2387-2402.
Kramer PJ (1969) Plant and soil water relationships: a modern synthesis. Mc Gravel-Hill
series in organismic biology.
Kramer PPJ and Boyer JS (1995) Water Relations of Plants and Soils. Academic press.
Krasensky J and Jonak C (2012) Drought, salt, and temperature stress-induced metabolic
rearrangements and regulatory networks. JOURNAL OF EXPERIMENTAL BOTANY
63:1593-1608.
Krause G and Weis E (1991) Chlorophyll fluorescence and photosynthesis: the basics.
ANNUAL REVIEW OF PLANT BIOLOGY 42:313-349.
Lahaye PA and Epstein E (1971) Calcium and salt toleration by bean plants.
PHYSIOLOGIA PLANTARUM. 25:213-218.
Lambrides C, Chapman S and Shorter R (2004) Genetic Variation for Carbon Isotope
Discrimination in Sunflower. CROP SCIENCE 44:1642-1653.
Larcher W (2003) Physiological plant ecology: ecophysiology and stress physiology of
functional groups. Springer Science & Business Media.
Lawlor D and Cornic G (2002) Photosynthetic carbon assimilation and associated
metabolism in relation to water deficits in higher plants. PLANT, CELL & ENVIRONMENT
25:275-294.
Lawlor DW (2002) Limitation to Photosynthesis in Water‐stressed Leaves: Stomata vs.
Metabolism and the Role of ATP. ANNALS OF BOTANY 89:871-885.
References
157
Levitt J (1980) Responses of plants to environmental stresses. Volume II. Water, radiation,
salt, and other stresses. Academic Press, London.
Li R-H, Guo P-G, Michael B, Stefania G and Salvatore C (2006) Evaluation of
chlorophyll content and fluorescence parameters as indicators of drought tolerance in barley.
AGRICULTURAL SCIENCES IN CHINA 5:751-757.
Li Y (2008) Kinetics of the antioxidant response to salinity in the halophyte Limonium
bicolor. PLANT SOIL AND ENVIRONMENT JOURNAL 54:493-497.
Lichtenthaler HK (1987) Chlorophylls and carotenoids: Pigments of photosynthetic
biomembranes. METHODS IN ENZYMOLOGY 148:350-382.
Liu BH, Cheng L, Liang D, Zou YJ and Ma FW (2012) Growth, gas exchange, water-use
efficiency, and carbon isotope composition of 'Gale Gala' apple trees grafted onto 9 wild
Chinese rootstocks in response to drought stress. PHOTOSYNTHETICA 50:401-410.
Liu F, Jensen CR and Andersen MN (2004) Drought stress effect on carbohydrate
concentration in soybean leaves and pods during early reproductive development: its
implication in altering pod set. FIELD CROPS RESEARCH 86:1-13.
Liu F and Stützel H (2004) Biomass partitioning, specific leaf area, and water use
efficiency of vegetable amaranth (Amaranthus spp.) in response to drought stress. SCIENTIA
HORTICULTURAE 102:15-27.
Ludlow M and Ng T (1974) Water stress suspends leaf ageing. PLANT SCIENCE
LETTERS 3:235-240.
Manivannan P, Jaleel CA, Sankar B, Kishorekumar A, Somasundaram R, Lakshmanan
GMA and Panneerselvam R (2007) Growth, biochemical modifications and proline
metabolism in Helianthus annuus L. as induced by drought stress. COLLOID SURFACE B
59:141-149.
Maraghni M, Gorai M and Neffati M (2011) The influence of water-deficit stress on
growth, water relations and solute accumulation in wild jujube (Ziziphus lotus). JOURNAL
OF ORNAMENTAL AND HORTICULTURAL PLANTS 1:63-72.
Maraghni M, Gorai M, Neffati M and Van Labeke MC (2014) Differential responses to
drought stress in leaves and roots of wild jujube, Ziziphus lotus. ACTA PHYSIOLOGY
PLANTARUM 36:945-953.
Marcińska I, Czyczyło-Mysza I, Skrzypek E, Filek M, Grzesiak S, Grzesiak MT,
Janowiak F, Hura T, Dziurka M and Dziurka K (2013) Impact of osmotic stress on
physiological and biochemical characteristics in drought-susceptible and drought-resistant
wheat genotypes. ACTA PHYSIOLOGY PLANTARUM 35:451-461.
Maroco JP, Pereira JS and Chaves MM (1997) Stomatal responses to leaf-to-air vapour
pressure deficit in Sahelian species. FUNCTIONAL PLANT BIOLOGY 24:381-387.
Matysik J, Bhalu B and Mohanty P (2002) Molecular mechanisms of quenching of
reactive oxygen species by proline under stress in plants. CURRENT SCIENCE 82:525-532.
Maxwell K and Johnson GN (2000) Chlorophyll fluorescence—a practical guide.
JOURNAL OF EXPERIMENTAL BOTANY 51(345):659-668.
Mediavilla S, Santiago H and Escudero A (2002) Stomatal and mesophyll limitations to
photosynthesis in one evergreen and one deciduous Mediterranean oak species.
PHOTOSYNTHETICA 40:553-559.
References
158
Merino J, García-Novo F and Sanchez-Díaz M (1976) Annual fluctuation of water
potential in the xerophytic shrub of the Doñana Biological Reserve (Spain). Oecoogical Plant.
Michel BE and Kaufmann MR (1973) The osmotic potential of polyethylene glycol 6000.
PLANT PHYSIOLOGY 51:914-916.
Miller G, Suzuki N, Ciftci‐Yilmaz S and Mittler R (2010) Reactive oxygen species
homeostasis and signalling during drought and salinity stresses. PLANT, CELL &
ENVIRONMENT 33:453-467.
Mirzaei M, Moeini A and Ghanati F (2013) Effect of drought stress on proline and soluble
sugar content in canola (Brassica napus L.) seedlings. IRANIAN BIOLOGY JOURNAL
26:90-98.
Mittler R, Vanderauwera S, Gollery M and Van Breusegem F (2004) Reactive oxygen
gene network of plants. TRENDS IN PLANT SCIENCE 9:490-498.
Moghaddam A, Raza A, Vollmann J, Ardakani MR, Wanek W, Gollner G and Friedel JK
(2013) Carbon isotope discrimination and water use efficiency relationships of alfalfa
genotypes under irrigated and rain-fed organic farming. EUROPEAN JOURNAL OF
AGRONOMY 50:82-89.
Mohammadkhani N and Heidari R (2008) Drought-induced accumulation of soluble
sugars and proline in two maize varieties. WORLD APPLIED SCIENCES JOURNAL 3:448-
453.
Monclus R, Dreyer E, Villar M, Delmotte FM, Delay D, Petit JM, Barbaroux C, Le Thiec
D, Bréchet C and Brignolas F (2006) Impact of drought on productivity and water use
efficiency in 29 genotypes of Populus deltoides× Populus nigra. NEW PHYTOLOGIST
169:765-777.
Mooney H (1980) Seasonality and gradients in the study of stress adaptation.
ADAPTATION OF PLANTS TO WATER AND HIGH TEMPERATURE STRESS (NC
TURNER AND PJ KRAMER, EDITORS). 279-294.
Munir M, Khan MA, Ahmed M, Bano A, Ahmed SN, Tariq K, Tabassum S, Mukhtar T,
Ambreen M and Bashir S (2011) Foliar epidermal anatomy of some ethnobotanically
important species of wild edible fruits of northern Pakistan. JOURNAL OF MEDICINAL
PLANTS RESEARCH 5:5873-5880.
Munns R (2002) Comparative physiology of salt and water stress. PLANT, CELL &
ENVIRONMENT 25:239-250.
Munns R and Tester M (2008) Mechanisms of salinity tolerance. ANNUAL REVIEW OF
PLANT BIOLOGY 59:651-681.
Muradoğlu F and Gündoğdu M (2011) Stomata size and frequency in some walnut
(Juglans regia) cultivars. INTERNATIONAL JOURNAL OF AGRICULTURE &
BIOLOGY 13(6), pp. 1011-1015.
Nanjo T, Kobayashi M, Yoshiba Y, Sanada Y, Wada K, Tsukaya H, Kakubari Y,
Yamaguchi‐Shinozaki K and Shinozaki K (1999) Biological functions of proline in
morphogenesis and osmotolerance revealed in antisense transgenic Arabidopsis thaliana.
THE PLANT JOURNAL 18:185-193.
Naor A (1999) Midday stem water potential as a plant water stress indicator for irrigation
scheduling in fruit trees, in III International Symposium on Irrigation of Horticultural Crops,
ACTA HORTICULTURE 537, pp. 447-454.
References
159
Nayyar H and Walia D (2003) Water stress induced proline accumulation in contrasting
wheat genotypes as affected by calcium and abscisic acid. BIOLOGIA PLANTARUM
46:275-279.
Nepomuceno A, Oosterhuis D and Stewart J (1998) Physiological responses of cotton
leaves and roots to water deficit induced by polyethylene glycol. ENVIRONMENTAL AND
EXPERIMENTAL BOTANY 40:29-41.
Nogués S, Cotxarrera L, Alegre L and Trillas MI (2002) Limitations to photosynthesis in
tomato leaves induced by Fusarium wilt. NEW PHYTOLOGIST 154:461-470.
Nonami H (1998) Plant water relations and control of cell elongation at low water
potentials. JOURNAL OF PLANT RESEARCH 111:373-382.
Nooghi F and Mozafari V (2012) Effects of calcium on eliminating the negative effects of
salinity in pistachio (Pistacia veraL.) seedlings. AUSTRALIAN JOURNAL OF CROP
SCIENCE 6:711-716.
Ogren E and Oquist G (1985) Effects of drought on photosynthesis, chlorophyll
fluorescence and photoinhibition susceptibility in intact willow leaves. PLANTA 166:380-
388.
Oliveira G and Peñuelas J (2000) Comparative photochemical and phenomorphological
responses to winter stress of an evergreen (Quercus ilex L.) and a semi-deciduous (Cistus
albidus L.) Mediterranean woody species. ACTA OECOLOGICA 21:97-107.
Orshan G, Floret C, Le Floc’h E, Le Roux A, Montenegro G and Romane F (1989)
General synthesis, in Plant pheno-morphological studies in mediterranean type ecosystems,
Springer , pp 389-399.
Panahi B (2009) Effects of osmotic and salt stresses on water relation parameters of
pistachio seedlings. JOURNAL OF PLANT ECOPHYSIOLOGY 1:1-8.
Panahi B, Esmaeilpour A, Farbood F, Moazenpour M and and Farivar-mahin H (2002)
Pistachio handbook (Planting, proccesing and harvesting). Agriculture training publication,
Tehran, Iran (In persian).
Pascual M, Lordan J, Villar JM, Fonseca F and Rufat J (2013) Stable carbon and nitrogen
isotope ratios as indicators of water status and nitrogen effects on peach trees. SCIENTIA
HORTICULTURAE 157:99-107.
Pazouki L, Mardi M, Shanjani PS, Hagidimitriou M, Pirseyedi SM, Naghavi MR,
Avanzato D, Vendramin E, Kafkas S and Ghareyazie B (2010) Genetic diversity and
relationships among Pistacia species and cultivars. CONSERVATION GENETICS 11:311-
318.
Peel MC, Finlayson BL, and and McMahon TA (2013) Climate map of Iran, using the
Köppen-Geiger climate classification, University of Melbourne,
http://commons.wikimedia.org/wiki/File:Climate_maps_of_Iran_(K%C3%B6ppen-
Geiger).png.
Pérez-Pérez J, Robles J, Tovar J and Botía P (2009) Response to drought and salt stress of
lemon ‘Fino 4 ’under field conditions: Water relations, osmotic adjustment and gas
exchange. SCIENTIA HORTICULTURAE 122:83-90.
Picchioni G, Miyamoto S and Storey J (1991) Rapid testing of salinity effects on pistachio
seedling rootstock. JOURNAL OF THE AMERICAN SOCIETY FOR HORTICULTURAL
SCIENCE 116:555-559.
References
160
Pimratch S, Jogloy S, Vorasoot N, Toomsan B, Kesmala T, Patanothai A and Holbrook
CC (2008) Effect of drought stress on traits related to N2 fixation in eleven peanut (Arachis
hypogaea L.) genotypes differing in degrees of resistance to drought. ASIAN JOURNAL OF
PLANT SCIENCES 7:334-342.
Polley HW (2002) Implications of atmospheric and climatic change for crop yield and
water use efficiency. CROP SCIENCE 42:131-140.
Porcel R and Ruiz-Lozano JM (2004) Arbuscular mycorrhizal influence on leaf water
potential, solute accumulation, and oxidative stress in soybean plants subjected to drought
stress. JOURNAL OF EXPERIMENTAL BOTANY 55:1743-1750.
Praba ML, Cairns J, Babu R and Lafitte H (2009) Identification of physiological traits
underlying cultivar differences in drought tolerance in rice and wheat. JOURNAL OF
AGRONOMY AND CROP SCIENCE 195:30-46.
Rampino P, Pataleo S, Gerardi C, Mita G and Perrotta C (2006) Drought stress response in
wheat: physiological and molecular analysis of resistant and sensitive genotypes. PLANT,
CELL & ENVIRONMENT 29:2143-2152.
Ranjbarfordoei A, Samson R, Lemeur R and Van Damme P (2002) Effects of osmotic
drought stress induced by a combination of NaCl and polyethylene glycol on leaf water
status, photosynthetic gas exchange, and water use efficiency of Pistacia khinjuk and P.
mutica. PHOTOSYNTHETICA 40:165-169.
Ranjbarfordoei A, Samson R, Van Damme P and Lemeur R (2000) Effects of drought
stress induced by polyethylene glycol on pigment content and photosynthetic gas exchange of
Pistacia khinjuk and P. mutica. PHOTOSYNTHETICA 38:443-447.
Razavi F, Pollet B, Steppe K and Van Labeke M-C (2008) Chlorophyll fluorescence as a
tool for evaluation of drought stress in strawberry. PHOTOSYNTHETICA 46:631-633.
Razavi Hosseinabadi F (2012) Molecular and physiological responses to drought stress in
Fragaria sp, in Plant production department, PhD thesis, Ghent university. Ghent, Belgium,
pp 261.
Razavi S (2010) Pistachio production : Iran vs the world, in Options Méditerranéennes :
Série A Sémin aires Méditerranéens; n 94 (Meeting IZGeXG and Almonds oPa eds),
Zaragoza, Spain, pp 275-279.
Rejeb KB, Abdelly C and Savouré A (2014) How reactive oxygen species and proline face
stress together. PLANT PHYSIOLOGY AND BIOCHEMISTRY 80:278-284.
Rhodes D and Samaras Y (1994) Genetic control of osmoregulation in plants. Cellular and
molecular physiology of cell volume regulation:347-361.
Ricardo A (2012) Plant Responses to Drought Stress, From Morphological to Molecular
Features. Departamento de Microbiología del Suelo, Sistemas Simbióticos ,Estación
Experimental del Zaidín (CSIC), Granada, Spain.
Roitsch T and González M-C (2004) Function and regulation of plant invertases: sweet
sensations. TRENDS IN PLANT SCIENCE 9:606-613.
Romero P, Navarro JM, Garcia F and Ordaz PB (2004) Effects of regulated deficit
irrigation during the pre-harvest period on gas exchange, leaf development and crop yield of
mature almond trees. TREE PHYSIOLOGY 24:303-312.
References
161
Roobroeck D, Butterbach‐Bahl K, Brueggemann N and Boeckx P (2010) Dinitrogen and
nitrous oxide exchanges from an undrained monolith fen: short‐term responses following
nitrate addition. EUROPEAN JOURNAL OF SOIL SCIENCE 61(5):662-670.
Rosielle A and Hamblin J (1981) Theoretical aspects of selection for yield in stress and
non-stress environment. CROP SCIENCE 21:943-946.
Rouhi V (2007) Seed germination of Prunus scoparia (Spach) C.K. Schneider and drought
stress evaluation based on ecophysiological parameters and growth characteristics for three
contrasting almond species (P. dulcis (Miller) D. Webb, P. lycioides (Spach) C.K. Schneider
and P. scoparia (Spach) C.K. Schneider, in Plant production department, PhD thesis, Ghent
university. Ghent, Belgium, pp 227.
Rouhi V, Samson R, Lemeur R and Damme PV (2007) Photosynthetic gas exchange
characteristics in three different almond species during drought stress and subsequent
recovery. ENVIRONMENTAL AND EXPERIMENTAL BOTANY 59 (2):117-129.
Rucker K, Kvien C, Holbrook C and Hook J (1995) Identification of peanut genotypes
with improved drought avoidance traits. PEANUT SCIENCE 22:14-18.
Saadatmand A, Banihashemi Z, Maftoun M and Sepaskhah A (2007) Interactive effect of
soil salinity and water stress on growth and chemical compositions of pistachio nut tree.
JOURNAL OF PLANT NUTRITION 30:2037-2050.
Sabeti H (1979) Plant synecology. Dehkhoda Publications. Tehran, Iran.
Sacks MM, Silk WK and Burman P (1997) Effect of water stress on cortical cell division
rates within the apical meristem of primary roots of maize. PLANT PHYSIOLOGY 114:519-
527.
Sajjadinia A, Ershadi A, Hokmabadi H, Khayyat M and Gholami M (2010) Gas exchange
activities and relative water content at different fruit growth and developmental stages of on
and off cultivated pistachio trees. AUSTRALIAN JOURNAL OF AGRICULTURAL
ENGINEERING 1:1-6.
Sami K (1992) Evaluation of drought and salt resistance of several tomato varieties in
term of production, growth and ecophysiological characteristics, in Plant production
department, PhD thesis, Ghent university. Ghent, Belgium, pp. 64-65.
Sánchez-Rodríguez E, Rubio-Wilhelmi MM, Cervilla LM, Blasco B, Rios JJ, Rosales
MA, Romero L and Ruiz JM (2010) Genotypic differences in some physiological parameters
symptomatic for oxidative stress under moderate drought in tomato plants. PLANT
SCIENCE 178:30-40.
Sanders GJ and Arndt SK (2012) Osmotic adjustment under drought conditions, in Plant
Responses to Drought Stress,Springer, pp. 199-229.
Saradhi PP (1991) Proline accumulation under heavy metal stress. JOURNAL OF PLANT
PHYSIOLOGY 138 (5):554-558.
Saraswathi SG and Paliwal K (2011) Drought induced changes in growth, leaf gas
exchange and biomass production in Albizia lebbeck and Cassia siamea seedlings.
JOURNAL OF ENVIRONMENTAL BIOLOGY 32 (2):173-178.
Saugier B, Ehleringer JR, Hall AE and Farquhar GD (1993) Stable isotopes and plant
carbon-water relations. Elsevier.
References
162
Saugier B, Ehleringer JR, Hall AE and Farquhar GD (2012) Stable isotopes and plant
carbon-water relations. Elsevier.
Scandalios J (2005) Oxidative stress: molecular perception and transduction of signals
triggering antioxidant gene defenses. BRAZILIAN JOURNAL OF MEDICAL AND
BIOLOGICAL RESEARCH 38:995-1014.
Sedaghat R (2010) Export Growth and Export Competitiveness of Iran‘s Pistachio.
AGRICULTURA TROPICA ET SUBTROPICA 43:148-152.
Sedaghati N and Hokmabadi H (2015) Optimizing Pistachio Irrigation Management Using
the Relationship between Echo-physiological Characteristics and Water Stress. JOURNAL
OF AGRICULTURAL SCIENCE AND TECHNOLOGY 17: 189-200.
Serraj R and Sinclair T (2002) Osmolyte accumulation: can it really help increase crop
yield under drought conditions? PLANT, CELL & ENVIRONMENT 25:333-341.
Shakerardekani A and Karim R (2013) Effect of different types of plastic packaging films
on the moisture and aflatoxin contents of pistachio nuts during storage. JOURNAL OF
FOOD SCIENCE AND TECHNOLOGY 50:409-411.
Shao H-B, Chu L-Y, Jaleel CA, Manivannan P, Panneerselvam R and Shao M-A (2009)
Understanding water deficit stress-induced changes in the basic metabolism of higher plants-
biotechnologically and sustainably improving agriculture and the ecoenvironment in arid
regions of the globe. CRITICAL REVIEWS IN BIOTECHNOLOGY 29 (2):131-151.
Shao H-B, Chu L-Y, Jaleel CA and Zhao C-X (2008) Water-deficit stress-induced
anatomical changes in higher plants. COMPTES RENDUS BIOLOGIES 331:215-225.
Sharkey TD and Seemann JR (1989) Mild water stress effects on carbon-reduction-cycle
intermediates, ribulose bisphosphate carboxylase activity, and spatial homogeneity of
photosynthesis in intact leaves. PLANT PHYSIOLOGY 89:1060-1065.
Sheibani A (1995) Pistachio production in Iran. ACTA HORTICULTURE 419:165-174.
Siddique M, Hamid A and Islam M (2000) Drought stress effects on water relations of
wheat. BOTANICAL BULLETIN OF ACADEMIA SINICA 41:35-39.
Signorelli S, Arellano JB, Melø TB, Borsani O and Monza J (2013) Proline does not
quench singlet oxygen: evidence to reconsider its protective role in plants. PLANT
PHYSIOLOGY AND BIOCHEMISTRY 64:80-83.
Simova-Stoilova L, Demirevska K, Petrova T, Tsenov N and Feller U (2008)
Antioxidative protection in wheat varieties under severe recoverable drought at seedling
stage. PLANT, SOIL AND ENVIRONMENT 54:529-536.
Singh DK, Sale PW, Pallaghy CK and Singh V (2000) Role of proline and leaf expansion
rate in the recovery of stressed white clover leaves with increased phosphorus concentration.
NEW PHYTOLOGIST 146:261-269.
Šircelj H, Tausz M, Grill D and Batič F (2005) Biochemical responses in leaves of two
apple tree cultivars subjected to progressing drought. JOURNAL OF PLANT
PHYSIOLOGY 162:1308-1318.
Solomon EP, Berg LR and Martin DW (2008) Biology, Life Science. Yolanda Cossio
publishing, USA, pp. 1411.
References
163
Spiegel-Roy, Nazigh D and M E (1977) Response of pistachio to low soil moisture
conditions. JOURNAL OF THE AMERICAN SOCIETY OF HORTICULTURAL SCIENCE
102:470-473.
Staelens J, Rütting T, Huygens D, De Schrijver A, Müller C, Verheyen K and Boeckx P
(2012) In situ gross nitrogen transformations differ between temperate deciduous and
coniferous forest soils. BIOGEOCHEMISTRY 108:259-277.
Statistical center of Iran (2014) Iran population, (organization Map ed),
http://www.amar.org.ir/Default.aspx?tabid=133.
Stępień P and łbus G (2006) Water relations and photosynthesis in Cucumis sativus L.
leaves under salt stress. BIOLOGIA PLANTARUM 50:610-616.
Subbarao G, Johansen C, Slinkard A, Nageswara Rao R, Saxena N, Chauhan Y and Lawn
R (1995) Strategies for improving drought resistance in grain legumes. CRITICAL
REVIEWS IN PLANT SCIENCES 14:469-523.
Sundberg M (1985) Trends in distribution and size of stomata in desert plants. DESERT
PLANTS 7:154-157.
Suprunova T, Krugman T, Fahima T, Chen G, Shams I, Korol A and Nevo E (2004)
Differential expression of dehydrin genes in wild barley, Hordeum spontaneum, associated
with resistance to water deficit. PLANT, CELL & ENVIRONMENT 27:1297-1308.
Szabados L and Savoure A (2010) Proline: a multifunctional amino acid. TRENDS IN
PLANT SCIENCE 15:89-97.
Taiz L and Zeiger E (2010) Plant Physiology (4th ed.). Sinauer Associates, Inc.,
Sunderland, USA, pp. 674.
Tajabadipour A (1997) Identification of Pistachio cultivars, in Horticulture Department,
MSc thesis, Tehran university. Tehran, Iran, pp. 210.
Tajabadipour A, Sepaskhah AR and Maftoun M (2006) Plant water relations and seedling
growth of three pistachio cultivars as influenced by irrigation frequency and applied
potassium, in Proceedings of the IVth International Symposium on Pistachios and Almonds
(Javanshah A, Facelli E and Wirthensohn M eds). pp 317-324.
Tanguilig V, Yambao E, O’toole J and De Datta S (1 87) Water stress effects on leaf
elongation, leaf water potential, transpiration, and nutrient uptake of rice, maize, and
soybean. PLANT AND SOIL 103:155-168.
Tardieu F and Simonneau T (1998) Variability among species of stomatal control under
fluctuating soil water status and evaporative demand: modelling isohydric and anisohydric
behaviours. JOURNAL OF EXPERIMENTAL BOTANY 49:419-432.
Tavallali V, Rahemi M, Maftoun M, Panahi B, Karimi S, Ramezanian A and Vaezpour M
(2009) Zinc influence and salt stress on photosynthesis, water relations, and carbonic
anhydrase activity in pistachio. SCIENTIA HORTICULTURAE 123:272-279.
Tezara W, Mitchell V, Driscoll S and Lawlor D (1999) Water stress inhibits plant
photosynthesis by decreasing coupling factor and ATP. NATURE 401:914-917.
Tilkat E and Onay A (2009) Direct shoot organogenesis from in vitro-derived mature leaf
explants of pistachio. IN VITRO CELLULAR & DEVELOPMENTAL BIOLOGY-PLANT
45:92-98.
References
164
Turner NC (1997) Further progress in crop water relations. ADVANCES IN
AGRONOMY 58:293-338.
Turner NC, Wright GC and Siddique K (2001) Adaptation of grain legumes (pulses) to
water-limited environments. ADVANCES IN AGRONOMY 71:194-233.
Valentini R, Mugnozza GS and Ehleringer J (1992) Hydrogen and carbon isotope ratios of
selected species of a Mediterranean macchia ecosystem. FUNCTIONAL ECOLOGY:627-
631.
Van Damme P (1990) Adaptation to drought stress in plants. part I: Typology of drought
tolerance and resistance, Med. Fac. Landbouww. Rijksuninv, Gent, pp. 121-126.
Van den Bilcke N, De Smedt S, Simbo DJ and Samson R (2013) Sap flow and water use
in African baobab (Adansonia digitata L.) seedlings in response to drought stress. SOUTH
AFRICAN JOURNAL OF BOTANY 88:438-446.
Van Labeke M-C and Degeyter L (2004) Non-structural carbohydrate content as an aid for
interpreting quality testing of nursery stock plants. ACTA HORTICULTURAE 630:191-198.
Wahid A, Gelani S, Ashraf M and Foolad MR (2007) Heat tolerance in plants: an
overview. ENVIRONMENTAL AND EXPERIMENTAL BOTANY 61:199-223.
Wien H (1977) Drought stress of cowpea on soybean under tropical conditions in: mussell,
h. And staples, r. C. (eds.), stress physiology in crop plants. Wiley Interscience, New York.
Wu Q-S, Xia R-X and Zou Y-N (2008) Improved soil structure and citrus growth after
inoculation with three arbuscular mycorrhizal fungi under drought stress. EUROPEAN
JOURNAL OF SOIL BIOLOGY 44:122-128.
Wu Y and Cosgrove DJ (2000) Adaptation of roots to low water potentials by changes in
cell wall extensibility and cell wall proteins. JOURNAL OF EXPERIMENTAL BOTANY
51:1543-1553.
Xu ZZ and Zhou GS (2006) Combined effects of water stress and high temperature on
photosynthesis, nitrogen metabolism and lipid peroxidation of a perennial grass Leymus
chinensis. PLANTA 224:1080-1090.
Xue G-P, McIntyre CL, Glassop D and Shorter R (2008) Use of expression analysis to
dissect alterations in carbohydrate metabolism in wheat leaves during drought stress. PLANT
MOLECULAR BIOLOGY 67:197-214.
Yakushiji H, Morinaga K and Nonami H (1998) Sugar accumulation and partitioning in
Satsuma mandarin tree tissues and fruit in response to drought stress. JOURNAL OF THE
AMERICAN SOCIETY FOR HORTICULTURAL SCIENCE 123:719-726.
Yamada M, Morishita H, Urano K, Shiozaki N, Yamaguchi-Shinozaki K, Shinozaki K and
Yoshiba Y (2005) Effects of free proline accumulation in petunias under drought stress.
JOURNAL OF EXPERIMENTAL BOTANY 56:1975-1981.
Yancey PH, Clark ME, Hand SC, Bowlus RD and Somero GN (1982) Living with water
stress: evolution of osmolyte systems. SCIENCE 217:1214-1222.
Yokota A, Kawasaki S, Iwano M, Nakamura C, Miake C and Akashi K (2002) Citrulline
and DRIP‐1 protein (ArgE homologue) in drought tolerance of wild watermelon. ANNALS
OF BOTANY 89:825-832.
Yordanov I, Velikova V and Tsonev T (2000) Plant responses to drought, acclimation, and
stress tolerance. PHOTOSYNTHETICA 38:171-186.
References
165
Yoshiba Y, Kiyosue T, Nakashima K, Yamaguchi-Shinozaki K and Shinozaki K (1997)
Regulation of levels of proline as an osmolyte in plants under water stress. PLANT AND
CELL PHYSIOLOGY 38:1095-1102.
Yousfi S, Serret MD, Marquez AJ, Voltas J and Araus JL (2012) Combined use of
delta13
C, delta18
O and delta15
N tracks nitrogen metabolism and genotypic adaptation of
durum wheat to salinity and water deficit. NEW PHYTOLOGIST 194:230-244.
Zaid A and Hughes H (1995) A comparison of stomatal function and frequency of in vitro
, in vitro polyethylene glycol treated, and greenhouse-grown plants of date palm, Phoenix
dactylifera L. TROPICAL AGRICULTURE 72:130-134.
Zeid I and Shedeed Z (2006) Response of alfalfa to putrescine treatment under drought
stress. BIOLOGIA PLANTARUM 50:635-640.
Zhang B and Archbold DD (1993) Solute accumulation in leaves of a Fragaria chiloensis
and a F. virginiana selection responds to water deficit stress. JOURNAL OF THE
AMERICAN SOCIETY FOR HORTICULTURAL SCIENCE 118:280-285.
Zhang H, Mao X, Wang C and Jing R (2010) Overexpression of a common wheat gene
TaSnRK2.8 enhances tolerance to drought, salt and low temperature in Arabidopsis. PLOS
ONE 5:e16041.
Zhao T-J, Sun S, Liu Y, Liu J-M, Liu Q, Yan Y-B and Zhou H-M (2006) Regulating the
drought-responsive element (DRE)-mediated signaling pathway by synergic functions of
trans-active and trans-inactive DRE binding factors in Brassica napus. JOURNAL OF
BIOLOGICAL CHEMISTRy 281:10752-10759.
Zhu J-K (2002) Salt and drought stress signal transduction in plants. ANNUAL REVIEW
OF PLANT BIOLOGY 53:247-273.
Zohary D (1996) Taxonomy of Pistacia L. genus, in Taxonomy, Distribution,
conservation and use of Pistacia Genetic Resources (Padulosi s, Caruso T and Barone E eds),
IPGRI, Italy, pp. 1-11.
Zohary M (1952) A monographical study of the genus Pistacia. PALESTINE JOURNAL
OF BOTANY (Jerusalem Series) 5:187-228.
Curriculum Vitae
166
Curriculum Vitae
Personal information
Full name: Ali Esmaeilpour
Date of birth: 20/02/1968, Rafsanjan, Iran
Nationality: Iranian
Affiliation: 1) Department of Plant production, Faculty of Bioscience
Engineering, Ghent University, 9000 Ghent, Belgium;
2) Scientific Board of Horticulture, Iranian Pistachio Research
Institute (IPRI). P.O.Box 77175.435, Rafsanjan, Iran.
Contact
details:
Tel: +3292643532 (Gent office),+983434225202,
Cell phone: +32489106751,
E-mail: [email protected]; [email protected]
Education and training
2010- now PhD Candidate in Bioscience Engineering, Ghent University,
9000 Ghent, Belgium
Thesis: Osmotic drought stress influence on physiological and
biochemical characteristics of pistachio (Pistacia spp.) seedlings.
Supervisors: Patrick Van Damme and Roeland Samson
1995-2010 Reasercher: Iranian Pistachio Research Institute (IPRI) Rafsanjan,
Iran.
1991-1995 Master in Horticulture engineering: Faculty of Agriculture, Shiraz
University. Shiraz, Iran.
Thesis: Effect of heading back pruning and chemical substance on
branching and cropping of pistachio trees. Supervisors: Majid Rahemi
1987-1991 Bachelor in Horticulture Science: Faculty of Agriculture, Guilan
University. Rasht, Iran.
Curriculum Vitae
167
Papers Presented in International Conference
Esmailpour, Ali. 1998. Distribution, use and conservation of pistachio in
IRAN. Submitted to: Pistachio genetic resources. Irbid, JORDAN.
Esmailpour, Ali and A. Shibani. 1999. Identification of best pistachio
cultivars in -IRAN.XI G. R. E. M. P. A. meeting on pistachio and almond.
Sanliorfa, TURKEY.
Alipour, H.; Vatanpour, A. A. And A., Esmailpour. 2001. Introducing
suitable pollinizer for Ahmad-Aghai pistachio (An Iranian commercial cultivar).
III international symposium on pistachio and almond. Zaragoza, SPAIN.
Esmailpour, Ali. 2001. Ahmad- Aghai pistachio as the best commercial
cultivar in Kerman province, Rafsanjan (IRAN). III international symposium on
pistachio and almond. Zaragoza, SPAIN.
Alipour, H. and A., Esmailpour. 2001. Multivariate analysis and
determination of pistachio yield indexes. III international symposium on pistachio
and almond. Zaragoza, SPAIN.
Esmailpour, Ali. 2001. Male pistachio diversity and appropriate
pollinizers for commercial cultivar in Rafsanjan (IRAN). III international
symposium on pistachio and almond. Zaragoza, SPAIN.
Ghorbani,A.M.; A. V. Azghandi; D. Abosaidi; A. Esmailpour; H. Farivar-
Mehin; M. Moradi And R. Zadeh-Parizi. 2001. Selection of some new hybrid
pistachio rootstocks resistance to phytophthora. III international symposium on
pistachio and almond. Zaragoza, SPAIN.
Esmailpour, A. and A. Tajabadipour; 2002; Pistachio new resources in
IRAN; first international symposium on rootstocks for deciduous fruit tree
species. Zaragoza, SPAIN.
Esmailpour, A.; 2002; Effects of different rootstocks on qualitative and
quantitative characteristics of yield in commercial Iranian pistachio cultivars. First
international symposium on rootstocks for deciduous fruit tree species. Zaragoza,
SPAIN.
Esmailpour, A.; 2002; Pruning effects on apical dominance and yield of
pistachio trees. XXVI international horticultural congress and exhibition
(IHC2002).Toronto, CANADA.
Esmailpour, A. and F. Mirdamadiha; 2002; Effects of harvest time on
quantitative characteristics on pistachio nuts. XXVI international horticultural
congress and exhibition IHC 2002). Toronto, CANADA.
Esmailpour, A.; 2003; Evaluation of alternate bearing intensity in Iranian
pistachio cultivars. XIII GREMPA Meeting on pistachio and almond. 1-5 June,
Mirandela, Portugal.
Esmailpour, A.; 2003; Effects of vegetative and reproductive characters
on flower bud abscission pistachio cultivars. XIII GREMPA Meeting on pistachio
and almond. 1-5 June, Mirandela, Portugal.
Curriculum Vitae
168
Esmailpour, A and M. Khezri; 2005; Abscission of inflorescence buds as
affected by different cultivars in four Iranian commercial pistachio. IV
international Symposium on Pistachio and Almond. Tehran, IRAN.
Esmailpour, A. and F. Mirdamadiha; 2005; Effects of harvest time and
processing delay on aflatoxin in pistachio. IV international Symposium on
Pistachio and Almond. Tehran, IRAN.
Esmailpour, A.; 2009; Effects of Different Plantation Distance in
Pistachio Trees (Pistacia vera). 5Th
International symposium on pistachio and
almond. Sunliorfa, Turkey.
Javanshah, A and Esmailpour, A.; 2009; Identification of The Best
Methods for Early Splitting Nuts In orchard And Scientific Evaluation of Early
Split Nuts Collecting Prior of Harvest on Aflatoxin Contamination. 5Th
International symposium on pistachio and almond. Sunliorfa, Turkey.
Hokmabadi, H.; M. Moazenpour Kermani; A. Haidarinezhad, A.
Esmailpour, S.Y. Emami, M. Basirat; S. Mahmoodi and A.Javanshah.2009.
Determination of Pistachio Production Function in Kerman (IRAN) Area of
Pistachio Growing, 5Th
International symposium on pistachio and almond.
Sunliorfa, Turkey.
Esmaeilpour, A. and P. Van Damme. 2014. Evaluation of Seed Soaking
Times on Germination Percentage, Germination Rate and Growth Characteristics
of Pistachio Seedlings. The 29th
international horticultural congress (IHC2014).
Brisbane, Australia.
Esmaeilpour, A., Marie-Christine Van Labeke, R. Samson and P. Van
Damme. 2014. Variation of Relative Water Content, Water Use Efficiency and
Stomatal Density during Drought Stress and Subsequent Recovery in Pistachio
Cultivars (Pistacia vera L.). The 29th
international horticultural congress
(IHC2014). Brisbane, Australia.
Esmaeilpour, A., Marie-Christine Van Labeke, R. Samson and P. Van
Damme. 2014. Chlorophyll fluorescence as a tool for evaluation of drought stress
tolerance in Iranian pistachio cultivars. International conference on research on
food security, natural resource management and rural development (Tropendag
2014). September 17-19, 2014. Prague, Czech Republic.
Esmaeilpour, A., M.C. Van Labeke, P. Boeckx and P. Van Damme. 2015.
Impact of osmotic drought stress on carbon isotope discrimination and growth
parameters in three pistachio rootstocks. XVI GREMPA Meeting on Almonds and
Pistachios. May 12-14, 2015. Meknes, Morocco.
Papers Presented in National Conference
Esmailpour, A. and M. Rahemi. 1996. Study the effect of heading back and
plant grow regulators on branching, yielding and flowering the ohadi and kaleghochi
cultivars. First research education and extension pistachio workshop. Rafsanjan,
IRAN.
Curriculum Vitae
169
Esmailpour, A. and M. Rahemi. 1997. Study the effect of heading back on
grow and yielding of pistachio trees. Research seminar of pistachio. Kerman, IRAN.
Esmailpour, A.; A. shibani and A. vatanpour azghandi. 1997. Studying,
recognizing and collecting male pistachio cultivars. First Iranian congress of
horticulture sciences. Karaj, IRAN.
Shibani, A.; A. Esmailpour and N. Rohani. 1997. Selection the suitable
pistachio cultivars. First Iranian congress of horticulture sciences. Karaj, IRAN.
Esmailpour, A. 2000. Principles of establish and maintenance pistachio
orchards to preventing and reduce the infection to agent of aflatoxin. First pistachio
aflatoxin congress. Kerman (Baghin), IRAN.
Alipour, H.; A. Esmailpour and M. parsai. 2001. Multi alternative analysis
and determining index yielding in pistachio nuts. Second Iranian congress horticulture
sciences. Karaj, IRAN.
Esmailpour, A.; F. Mirdamadiha and A. Esmaili Ranjbar. 2001. The effect of
delaying in harvest time and hull process on quantity and quality characteristics of
pistachio nuts. Second Iranian congress on horticulture sciences. Karaj, IRAN.
Esmailpour, A. and M. parsai. 2001. Study the effect of heading back on
apical dominance and yield of pistachio trees. Second Iranian Congress on
horticulture sciences. Karaj, IRAN.
Esmailpour, A. 2001. The effects of environmental factors on produce and
crop increasing of pistachio trees. Seminar of increasing the pistachio crops. Kerman
(Baghin), IRAN.
Esmailpour, A.; H. Dehghani and F. Mirdamadiha. 2001. Study the effect of
harvest time and delaying hull process on infection of aflatoxin rate. Fourteenth
Iranian plant protection congress. Isfahan, IRAN.
Esmailpour, A. 2002. The effects of rootstock on quality and quantity
characteristics of commercial pistachio cultivars. Second national congress Baneh
(Pistacia mutica) or green morvarid. Shiraz, IRAN.
Rezai, H.; M. J. Arvin; B. Panahi and A. Esmailpour. 2002. Different
concentration effects of indol botric acid (IBA) in different cuttings ages of pistachio
seedlings. Third of Iran biology conference. Shiraz, IRAN.
Esmailpour, A. 2003. Methods of increasing the pistachio orchards crops
(theory and real experiences). First application scientific gathering sirjan pistachio.
Sirjan, IRAN.
Esmailpour, A. and M. Rahemi. 2003. Effects of pruning on crops increasing
in pistachio trees. First application scientific gathering sirjan pistachio. Sirjan, IRAN.
Esmailpour, A. and M. Rahemi. 2004. Effect of some grows regulators on
branching and flowering in pistachio orchards. Third Iranian horticulture science
congress. 1-3 Sep. Karaj, IRAN.
Esmailpour, A. and M. H. Shamshiri. 2004. Effect of indol botric acid (IBA)
and naftalin acetic acid (NAA) on pistachio cuttings. Third of Iranian horticulture
science congress. 1-3 Sep. Karaj, IRAN
Curriculum Vitae
170
Esmailpour, A. 2004. Study between abscission and survival number of fruit
in cluster high and low load orchard condition. Third Iranian horticulture science
congress. 1-3 Sep. Karaj, IRAN
Esmailpour, A. 2004. Introducing adequate early ripen pistachio cultivars for
short grow period climate (cold regions). First national congress on nuts. Tabriz,
IRAN.
Esmailpour, A. and A. R. Saberi. 2004. Identifying pistachio genetic
resources in Sistan and Baluchistan province. First native knowledge and hereditary
natural sources and agriculture resources gathering. 12-13 Oct. Zahedan, IRAN.
Esmailpour, A. and S. Bondehi. 2004. Study the genetic resources in Sistan
and Baluchistan province and application them in research program. First native
knowledge and hereditary national sources and agriculture resources gathering. 12-13
Oct. Zahedan, IRAN
Khezri, M. and A. Esmailpour. 2006. Apical dominance and it's relation with
abscission flower buds in Iranian pistachio commercial cultivars. Fourth Iranian
horticulture science congress. 7-9 Nov. Mashhad, IRAN.
Esmailpour, A. 2006. Effect of delay harvest time on splitting percentage,
sparing, early split and pistachio nut size. Fourth Iranian horticulture science
congress. 7-9 Nov. Mashhad, IRAN.
Javanshah, A.; Esmailpour, A. and M. Abdullah. 2006. Determination the
best sampling method of early split pistachio in orchard and economic and technical
assessment of their collection effects in different times before harvesting on aflatoxin
infection rate. Fourth Iranian horticulture science congress. 7-9 Nov. Mashhad, IRAN.
Esmailpour, A.; Shakerardekani, A. and M. Abdullah. 2015. Effects of early
harvesting time on nut quality and physiology of pistachio (Pistacia vera) trees.
National conference of scientific approach in green gold, pistachio. December 17-18,
2015. Damghan, Iran.
Member of National & International Societies
Member of international society of horticulture science (ISHS)
Member of Iranian society of horticulture science
Research M.Sc. & Ph.D. Students Supervised
Saba, M.1998. Designing and manufacturing method of manure dispersal
machine. M.Sc. thesis. Tehran University, Tehran, IRAN.
Courses Taught
Pistachio production 1 (undergraduate)
Pistachio production 2 (undergraduate)
Horticulture (undergraduate)
Curriculum Vitae
171
Small Fruits in horticulture (undergraduate)
Books and booklets in Persian
Panahi, B.; Esmailpour, A.; Farbood, F.; Moazenpour, M. and H. Farivar-
Mehin. Pistachio handbook (Planting, processing and harvesting) 2002. Agriculture
training publication. ISBN 964-6598-70-6.
Panahi, B.; Esmailpour, A.; Farbood, F.; Moazenpour, M. and H. Farivar-
Mehin. Pistachio book (Volume 1). 2002. Agriculture training publication. ISBN.
964-6598-73-0.
Panahi, B.; Esmailpour, A.; Farbood, F.; Moazenpour, M. and H. Farivar-
Mehin. Pistachio book. (Volume 2). 2002. Agriculture training publication. ISBN
964-6598-81-1.
Abosaidi, D. Esmailpour, A.; Gorbani, A.M.; Tajabadi, A.; Farbood, F and
Rostami, M.A. 2000. Pistachio aflatoxin. Extension assistance publication of
agriculture extension, training and research organization.
Esmailpour, A. 2001.Pistachio horticulture management (Booklet).
Horticulture assistance publication of agriculture jihad ministry.
Esmailpour, A. Gorbani, A.M.; Tajabadi, A. and B. Panahi. 2001. Study the
reasons of pistachio flowering buds abscission of Akbary cultivar in Kerman
province. Extension publication of Kerman agriculture jihad organization.
Esmailpour, A. 2006. Characteristics of some Iranian pistachio cultivars.
Iranian pistachio research institute publication.
Javanshah, A.; Mirdamadiha, F.; Tajabadi, A; Esmailpour, A and A.
Mohamadi .2004. Management calendar of pistachio orchards. Iranian Pistachio
Research Institute publication and Rafsanjan Pistachio cooperative company.
Esmailpour, A. and A. Mohamadi. 2009. Characteristics of some pistachio
rootstocks. Iranian pistachio research institute publication.
Esmailpour, A.; Javanshah, A.; Hokmabadi, H.; Panahi, B. and Alipour, H.
2010 .Pistachio horticulture research chapter. In. Mehrnejad, M.R. and A. Javanshah
(eds).The strategy framework for developing and promoting pistachio research in
IRAN. Jomhori publication. ISBN 978-600-5687-25-5.
Esmailpour, A. 2011. Pruning of pistachio trees. In. Hokmabadi, H. (eds).
Diagnosis of environmental and none-environmental damaging factors incoming to
pistachio product. Agriculture education and extension publication. ISBN 978-600-
5898-72-2. 314 pages.
Esmaeilpour, A.; Emami, Y.; Basirat, M.; Panahi, B.; Tajabadipour, A. et.al.
2015. Pistachio handbook (planting, maintaining and harvesting). Agriculture
education publishing. Tehran, Iran. ISBN: 978-964-520-291-8.
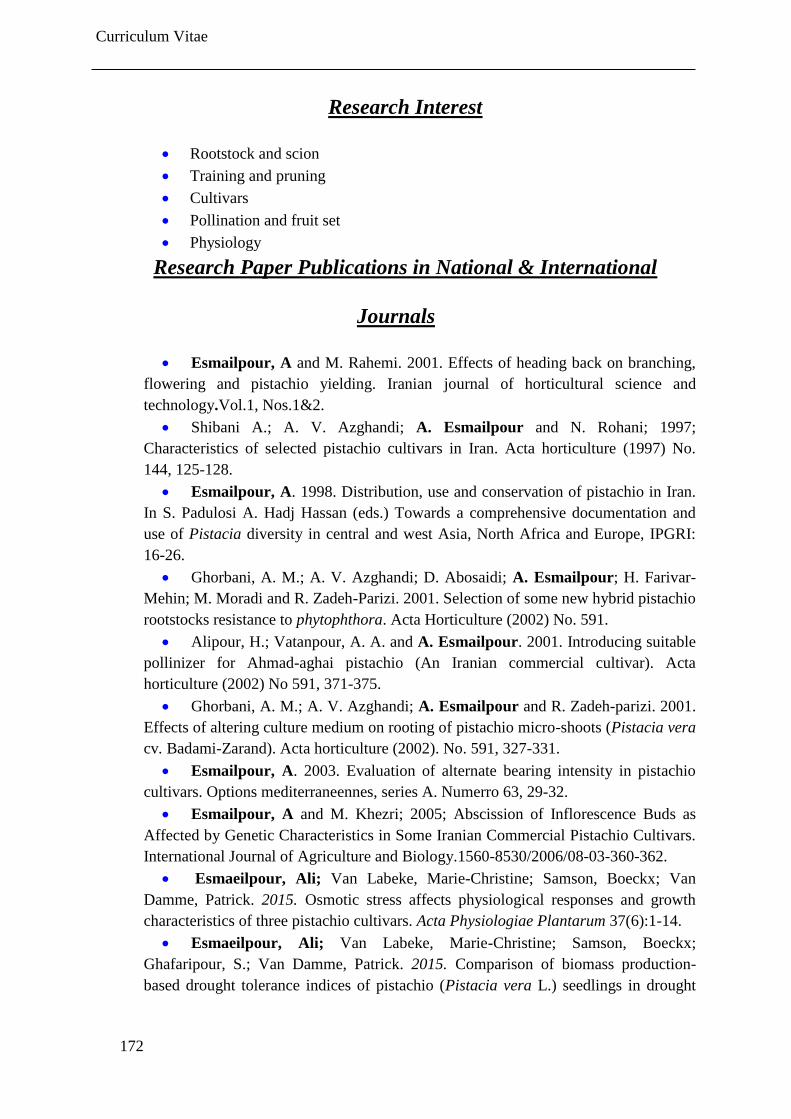
Curriculum Vitae
172
Research Interest
Rootstock and scion
Training and pruning
Cultivars
Pollination and fruit set
Physiology
Research Paper Publications in National & International
Journals
Esmailpour, A and M. Rahemi. 2001. Effects of heading back on branching,
flowering and pistachio yielding. Iranian journal of horticultural science and
technology.Vol.1, Nos.1&2.
Shibani A.; A. V. Azghandi; A. Esmailpour and N. Rohani; 1997;
Characteristics of selected pistachio cultivars in Iran. Acta horticulture (1997) No.
144, 125-128.
Esmailpour, A. 1998. Distribution, use and conservation of pistachio in Iran.
In S. Padulosi A. Hadj Hassan (eds.) Towards a comprehensive documentation and
use of Pistacia diversity in central and west Asia, North Africa and Europe, IPGRI:
16-26.
Ghorbani, A. M.; A. V. Azghandi; D. Abosaidi; A. Esmailpour; H. Farivar-
Mehin; M. Moradi and R. Zadeh-Parizi. 2001. Selection of some new hybrid pistachio
rootstocks resistance to phytophthora. Acta Horticulture (2002) No. 591.
Alipour, H.; Vatanpour, A. A. and A. Esmailpour. 2001. Introducing suitable
pollinizer for Ahmad-aghai pistachio (An Iranian commercial cultivar). Acta
horticulture (2002) No 591, 371-375.
Ghorbani, A. M.; A. V. Azghandi; A. Esmailpour and R. Zadeh-parizi. 2001.
Effects of altering culture medium on rooting of pistachio micro-shoots (Pistacia vera
cv. Badami-Zarand). Acta horticulture (2002). No. 591, 327-331.
Esmailpour, A. 2003. Evaluation of alternate bearing intensity in pistachio
cultivars. Options mediterraneennes, series A. Numerro 63, 29-32.
Esmailpour, A and M. Khezri; 2005; Abscission of Inflorescence Buds as
Affected by Genetic Characteristics in Some Iranian Commercial Pistachio Cultivars.
International Journal of Agriculture and Biology.1560-8530/2006/08-03-360-362.
Esmaeilpour, Ali; Van Labeke, Marie-Christine; Samson, Boeckx; Van
Damme, Patrick. 2015. Osmotic stress affects physiological responses and growth
characteristics of three pistachio cultivars. Acta Physiologiae Plantarum 37(6):1-14.
Esmaeilpour, Ali; Van Labeke, Marie-Christine; Samson, Boeckx;
Ghafaripour, S.; Van Damme, Patrick. 2015. Comparison of biomass production-
based drought tolerance indices of pistachio (Pistacia vera L.) seedlings in drought
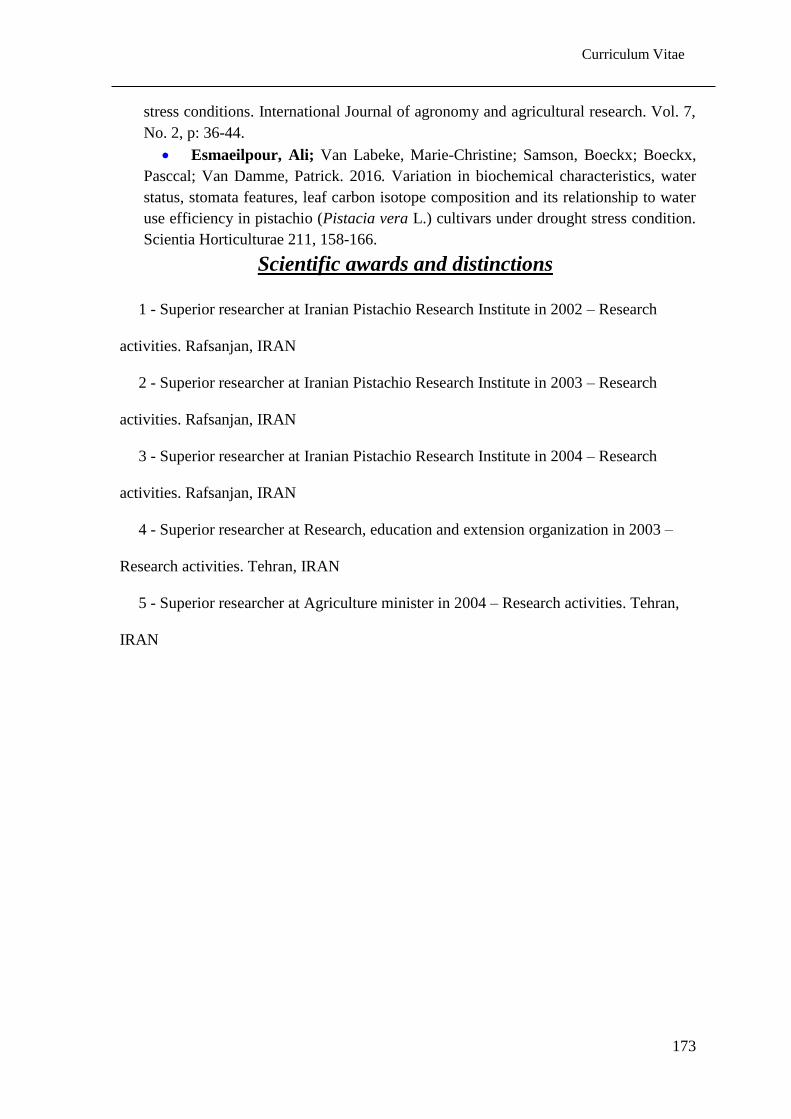
Curriculum Vitae
173
stress conditions. International Journal of agronomy and agricultural research. Vol. 7,
No. 2, p: 36-44.
Esmaeilpour, Ali; Van Labeke, Marie-Christine; Samson, Boeckx; Boeckx,
Pasccal; Van Damme, Patrick. 2016. Variation in biochemical characteristics, water
status, stomata features, leaf carbon isotope composition and its relationship to water
use efficiency in pistachio (Pistacia vera L.) cultivars under drought stress condition. Scientia Horticulturae 211, 158-166.
Scientific awards and distinctions
1 - Superior researcher at Iranian Pistachio Research Institute in 2002 – Research
activities. Rafsanjan, IRAN
2 - Superior researcher at Iranian Pistachio Research Institute in 2003 – Research
activities. Rafsanjan, IRAN
3 - Superior researcher at Iranian Pistachio Research Institute in 2004 – Research
activities. Rafsanjan, IRAN
4 - Superior researcher at Research, education and extension organization in 2003 –
Research activities. Tehran, IRAN
5 - Superior researcher at Agriculture minister in 2004 – Research activities. Tehran,
IRAN

Appendices
174
Appendices
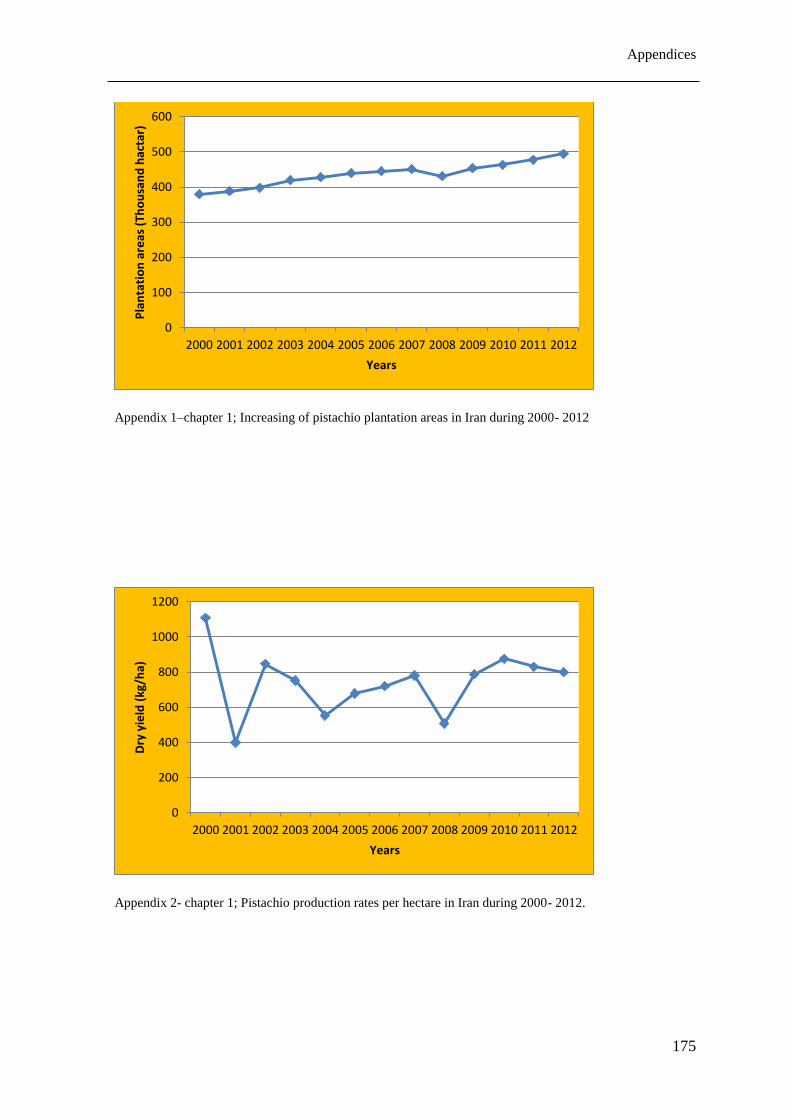
Appendices
175
Appendix 1–chapter 1; Increasing of pistachio plantation areas in Iran during 2000- 2012
Appendix 2- chapter 1; Pistachio production rates per hectare in Iran during 2000- 2012.
0
100
200
300
400
500
600
2000 2001 2002 2003 2004 2005 2006 2007 2008 2009 2010 2011 2012
Pla
nta
tio
n a
reas
(Th
ou
san
d h
acta
r)
Years
0
200
400
600
800
1000
1200
2000 2001 2002 2003 2004 2005 2006 2007 2008 2009 2010 2011 2012
Dry
yie
ld (
kg/h
a)
Years
Appendices
176
Appendix 3- chapter 3: Composition of Hoagland solution which used in pistachios seedlings experiments
(Ranjbar et al. 2002).
Row Stock
name Elements Amounts Dissolve in
Amounts used for
10 distilled water
1 A KNO3,
KH2PO4
100 g
50 g 1 liter distilled water 27.4 ml
2 B MgSO4.7H2o,
(NH4)2SO4
100 g
50 g 1 liter distilled water 27.4 ml
3 C Ca(NO3)2.4H2o,
EDTA NaFe
400 g
15 g 1 liter distilled water 27.4 ml
4 D
KCl,
H3PO3,
MnSo4.H2o,
ZnSo4,
NH4Mo,
CuSo4,
H2So4,
1 g
1.1 g
0.62 g
0.1 g
0.1 g
0.5 g
50 µm
100 ml distilled water 2.74 ml
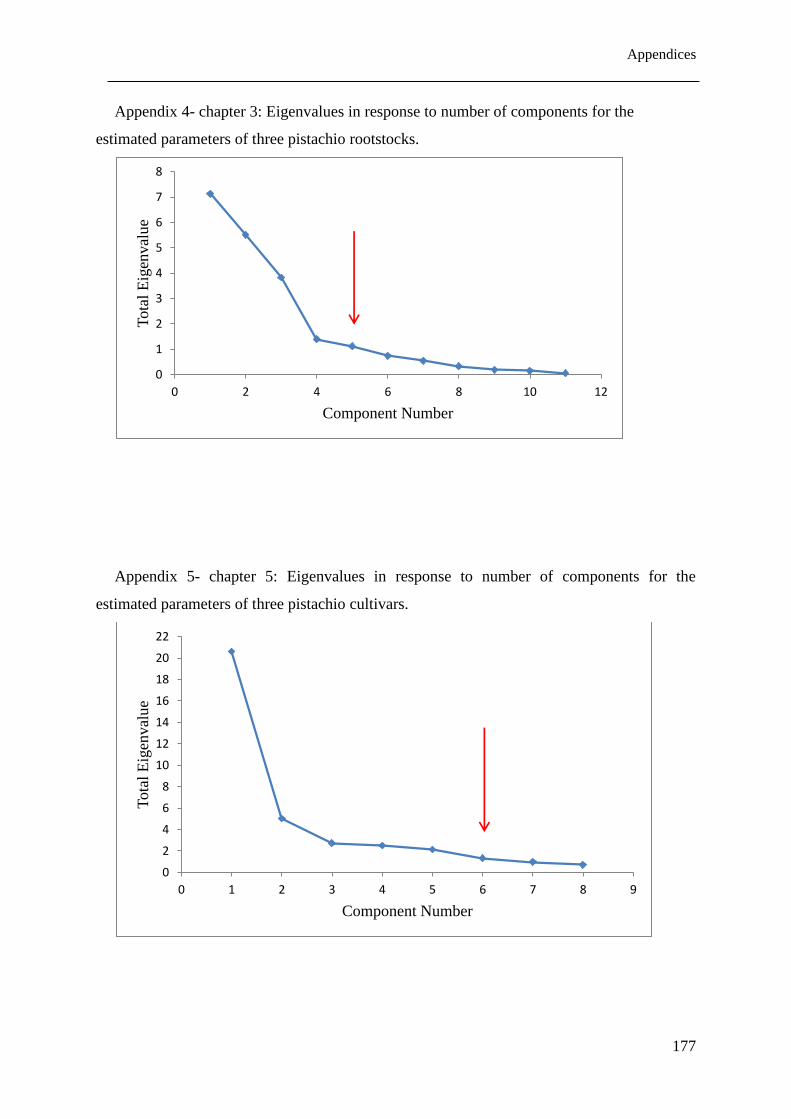
Appendices
177
Appendix 4- chapter 3: Eigenvalues in response to number of components for the
estimated parameters of three pistachio rootstocks.
Appendix 5- chapter 5: Eigenvalues in response to number of components for the
estimated parameters of three pistachio cultivars.
0
1
2
3
4
5
6
7
8
0 2 4 6 8 10 12
Tota
l E
igen
val
ue
Component Number
0
2
4
6
8
10
12
14
16
18
20
22
0 1 2 3 4 5 6 7 8 9
Tota
l E
igen
val
ue
Component Number
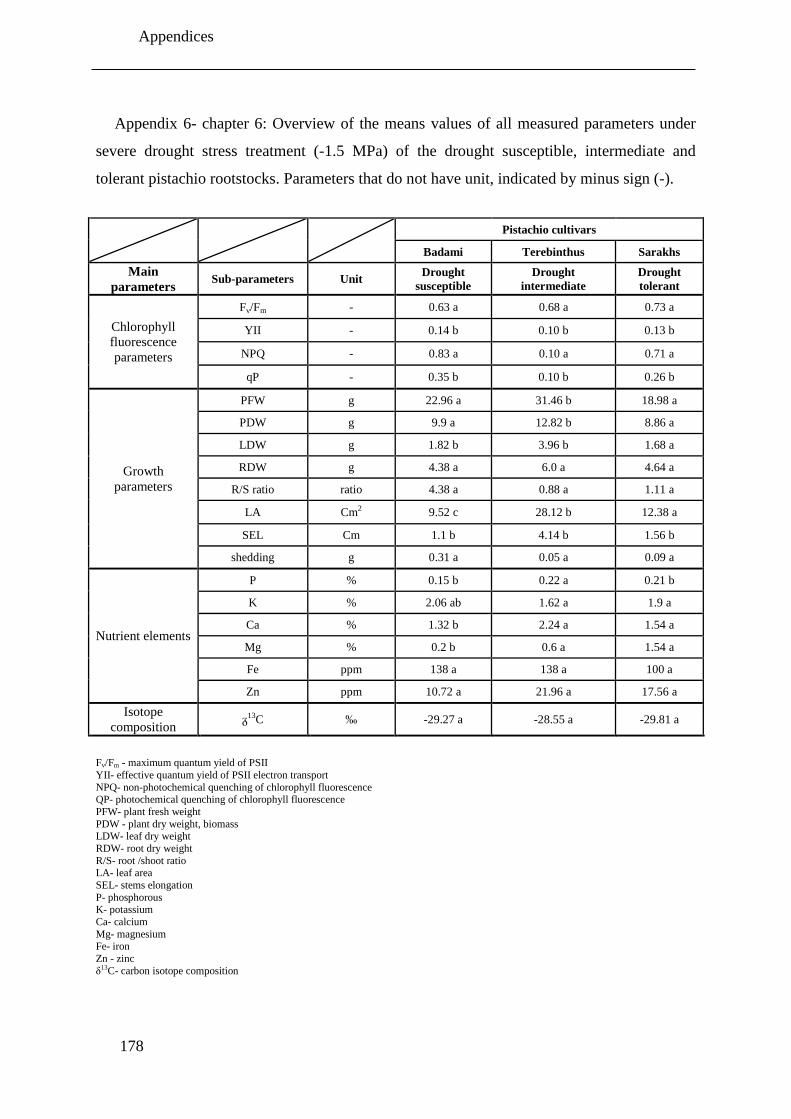
Appendices
178
Appendix 6- chapter 6: Overview of the means values of all measured parameters under
severe drought stress treatment (-1.5 MPa) of the drought susceptible, intermediate and
tolerant pistachio rootstocks. Parameters that do not have unit, indicated by minus sign (-).
Pistachio cultivars
Badami Terebinthus Sarakhs
Main
parameters Sub-parameters Unit
Drought
susceptible
Drought
intermediate
Drought
tolerant
Chlorophyll
fluorescence
parameters
Fv/Fm - 0.63 a 0.68 a 0.73 a
YII - 0.14 b 0.10 b 0.13 b
NPQ - 0.83 a 0.10 a 0.71 a
qP - 0.35 b 0.10 b 0.26 b
Growth
parameters
PFW g 22.96 a 31.46 b 18.98 a
PDW g 9.9 a 12.82 b 8.86 a
LDW g 1.82 b 3.96 b 1.68 a
RDW g 4.38 a 6.0 a 4.64 a
R/S ratio ratio 4.38 a 0.88 a 1.11 a
LA Cm2 9.52 c 28.12 b 12.38 a
SEL Cm 1.1 b 4.14 b 1.56 b
shedding g 0.31 a 0.05 a 0.09 a
Nutrient elements
P % 0.15 b 0.22 a 0.21 b
K % 2.06 ab 1.62 a 1.9 a
Ca % 1.32 b 2.24 a 1.54 a
Mg % 0.2 b 0.6 a 1.54 a
Fe ppm 138 a 138 a 100 a
Zn ppm 10.72 a 21.96 a 17.56 a
Isotope
composition ᵹ13C ‰ -29.27 a -28.55 a -29.81 a
Fv/Fm - maximum quantum yield of PSII
YII- effective quantum yield of PSII electron transport
NPQ- non-photochemical quenching of chlorophyll fluorescence QP- photochemical quenching of chlorophyll fluorescence
PFW- plant fresh weight
PDW - plant dry weight, biomass LDW- leaf dry weight
RDW- root dry weight
R/S- root /shoot ratio LA- leaf area
SEL- stems elongation
P- phosphorous K- potassium
Ca- calcium
Mg- magnesium Fe- iron
Zn - zinc
δ13C- carbon isotope composition
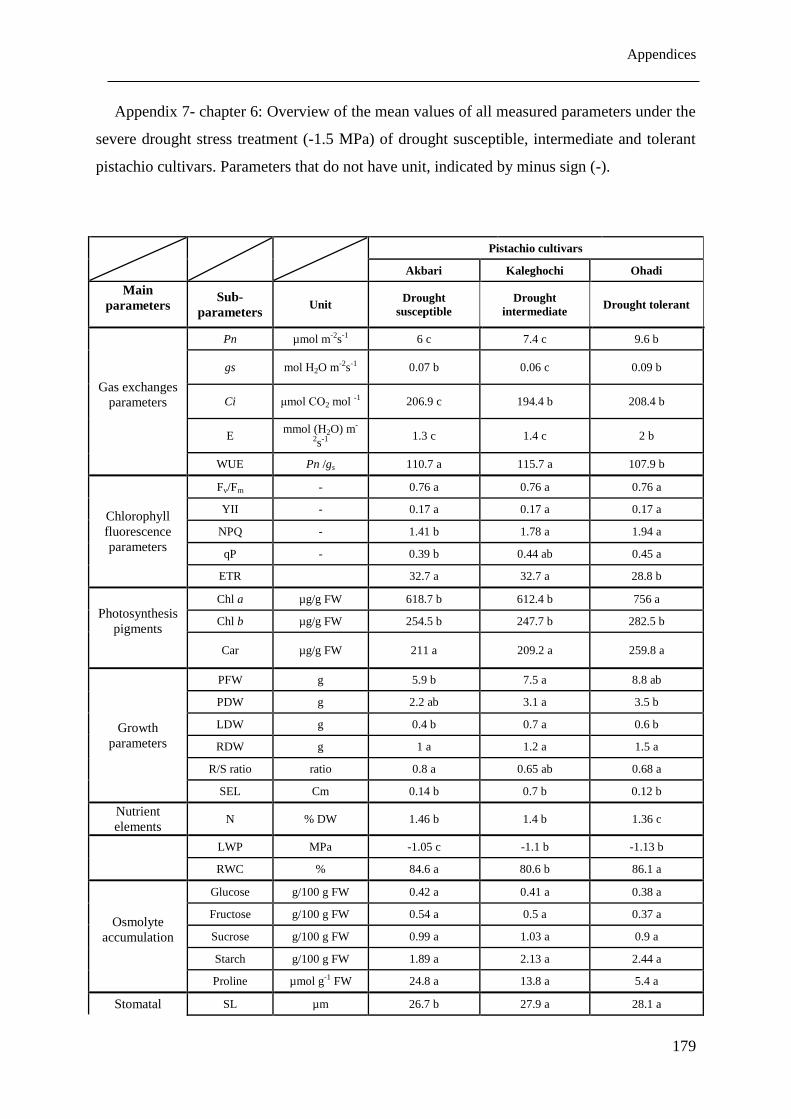
Appendices
179
Appendix 7- chapter 6: Overview of the mean values of all measured parameters under the
severe drought stress treatment (-1.5 MPa) of drought susceptible, intermediate and tolerant
pistachio cultivars. Parameters that do not have unit, indicated by minus sign (-).
Pistachio cultivars
Akbari Kaleghochi Ohadi
Main
parameters
Sub-
parameters Unit
Drought
susceptible
Drought
intermediate Drought tolerant
Gas exchanges
parameters
Pn µmol m-2s-1 6 c 7.4 c 9.6 b
gs mol H2O m-2s-1 0.07 b 0.06 c 0.09 b
Ci μmol CO2 mol -1 206.9 c 194.4 b 208.4 b
E mmol (H2O) m-
2s-1 1.3 c 1.4 c 2 b
WUE Pn /gs 110.7 a 115.7 a 107.9 b
Chlorophyll
fluorescence
parameters
Fv/Fm - 0.76 a 0.76 a 0.76 a
YII - 0.17 a 0.17 a 0.17 a
NPQ - 1.41 b 1.78 a 1.94 a
qP - 0.39 b 0.44 ab 0.45 a
ETR 32.7 a 32.7 a 28.8 b
Photosynthesis
pigments
Chl a µg/g FW 618.7 b 612.4 b 756 a
Chl b µg/g FW 254.5 b 247.7 b 282.5 b
Car µg/g FW 211 a 209.2 a 259.8 a
Growth
parameters
PFW g 5.9 b 7.5 a 8.8 ab
PDW g 2.2 ab 3.1 a 3.5 b
LDW g 0.4 b 0.7 a 0.6 b
RDW g 1 a 1.2 a 1.5 a
R/S ratio ratio 0.8 a 0.65 ab 0.68 a
SEL Cm 0.14 b 0.7 b 0.12 b
Nutrient
elements N % DW 1.46 b 1.4 b 1.36 c
LWP MPa -1.05 c -1.1 b -1.13 b
RWC % 84.6 a 80.6 b 86.1 a
Osmolyte
accumulation
Glucose g/100 g FW 0.42 a 0.41 a 0.38 a
Fructose g/100 g FW 0.54 a 0.5 a 0.37 a
Sucrose g/100 g FW 0.99 a 1.03 a 0.9 a
Starch g/100 g FW 1.89 a 2.13 a 2.44 a
Proline µmol g-1 FW 24.8 a 13.8 a 5.4 a
Stomatal SL µm 26.7 b 27.9 a 28.1 a
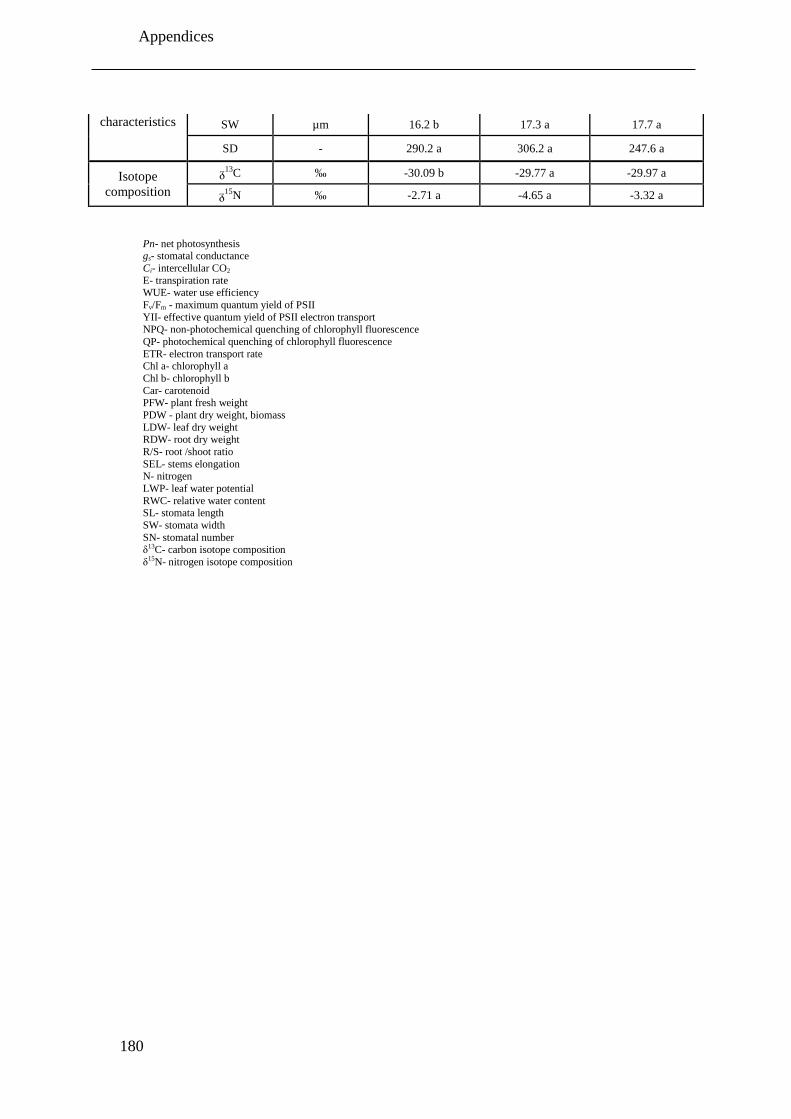
Appendices
180
characteristics
SW µm 16.2 b 17.3 a 17.7 a
SD - 290.2 a 306.2 a 247.6 a
Isotope
composition
ᵹ13C ‰ -30.09 b -29.77 a -29.97 a
ᵹ15N ‰ -2.71 a -4.65 a -3.32 a
Pn- net photosynthesis gs- stomatal conductance
Ci- intercellular CO2
E- transpiration rate WUE- water use efficiency
Fv/Fm - maximum quantum yield of PSII
YII- effective quantum yield of PSII electron transport NPQ- non-photochemical quenching of chlorophyll fluorescence
QP- photochemical quenching of chlorophyll fluorescence
ETR- electron transport rate Chl a- chlorophyll a
Chl b- chlorophyll b
Car- carotenoid PFW- plant fresh weight
PDW - plant dry weight, biomass
LDW- leaf dry weight RDW- root dry weight
R/S- root /shoot ratio
SEL- stems elongation N- nitrogen
LWP- leaf water potential
RWC- relative water content SL- stomata length
SW- stomata width
SN- stomatal number δ13C- carbon isotope composition
δ15N- nitrogen isotope composition
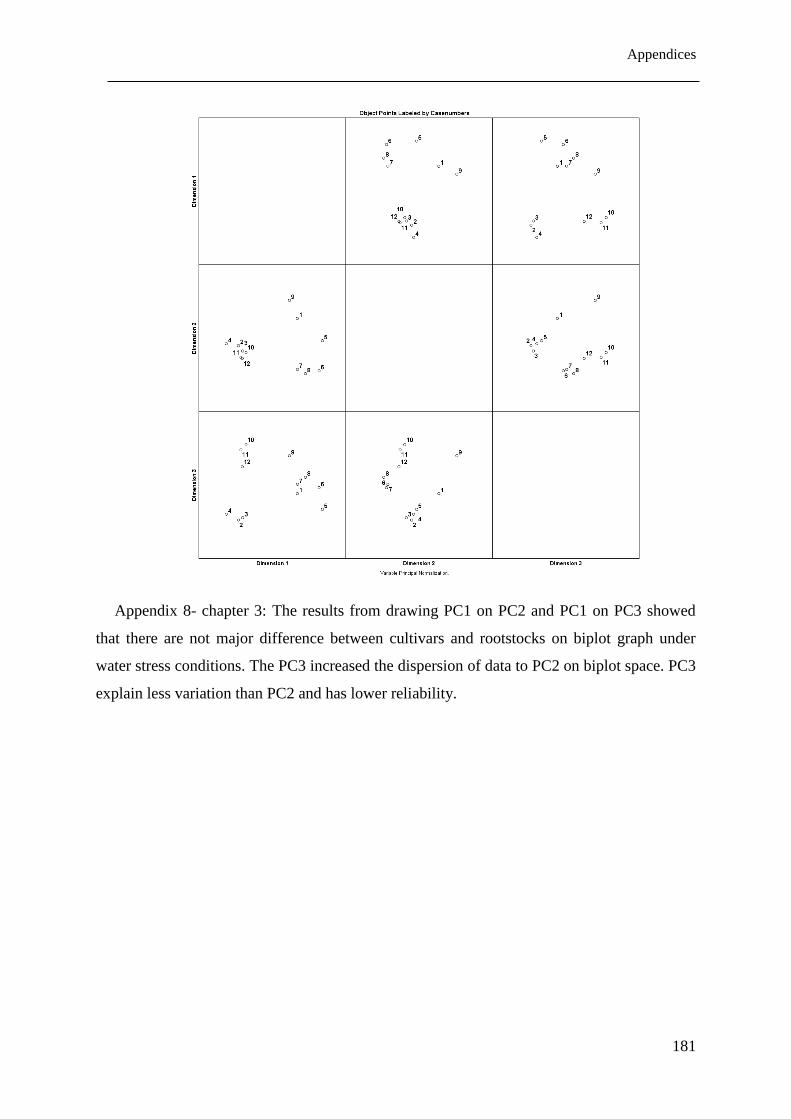
Appendices
181
Appendix 8- chapter 3: The results from drawing PC1 on PC2 and PC1 on PC3 showed
that there are not major difference between cultivars and rootstocks on biplot graph under
water stress conditions. The PC3 increased the dispersion of data to PC2 on biplot space. PC3
explain less variation than PC2 and has lower reliability.


