Embed Size (px)
Citation preview
Out-of-Home Food & Drink Consumption
Trends Vietnam
D A T A P E R I O D : Q 2 2 0 1 6
Content
Introduction
How to improve your business with data
Methodology & Access
Out-of-home market overview
What do Vietnamese eat & drink in restaurants?
How is the food & drink offer changing?
How can chains stay ahead?
Keys to Success in Today’s Competitive Market
Out-of-home Food & Drink Consumption Trends

The Authors
KATRIN [email protected]
Katrin has spent the last 13 years researching food & drink trends in Europe, Africa and Asia where she held various roles at EuromonitorInternational, the NPD Group, KantarWorldpanel, TNS and now Decision Lab.
She has advised major multinationals such as Unilever, Nestlé, Pepsi, Heineken on their in-home and out-of-home brand strategies and restaurant operators such as KFC, Pizza Hut, Burger King on increasing customer traffic strategies.
Since 2015, she has led the planning, design and set-up of Decision Lab’s Foodservice Monitor in Vietnam.
THUE QUIST [email protected]
With more than 14 years’ experience in marketing, business development and market research, Thue has a fearless approach to business and leadership.
He helped grow Decision Lab’s predecessor, Epinion from a bold idea into a successful and thriving business.
A graduate of both Copenhagen and HKUST Business Schools, Thue’s passion for new business concepts and entrepreneurship is clear in all of his work.
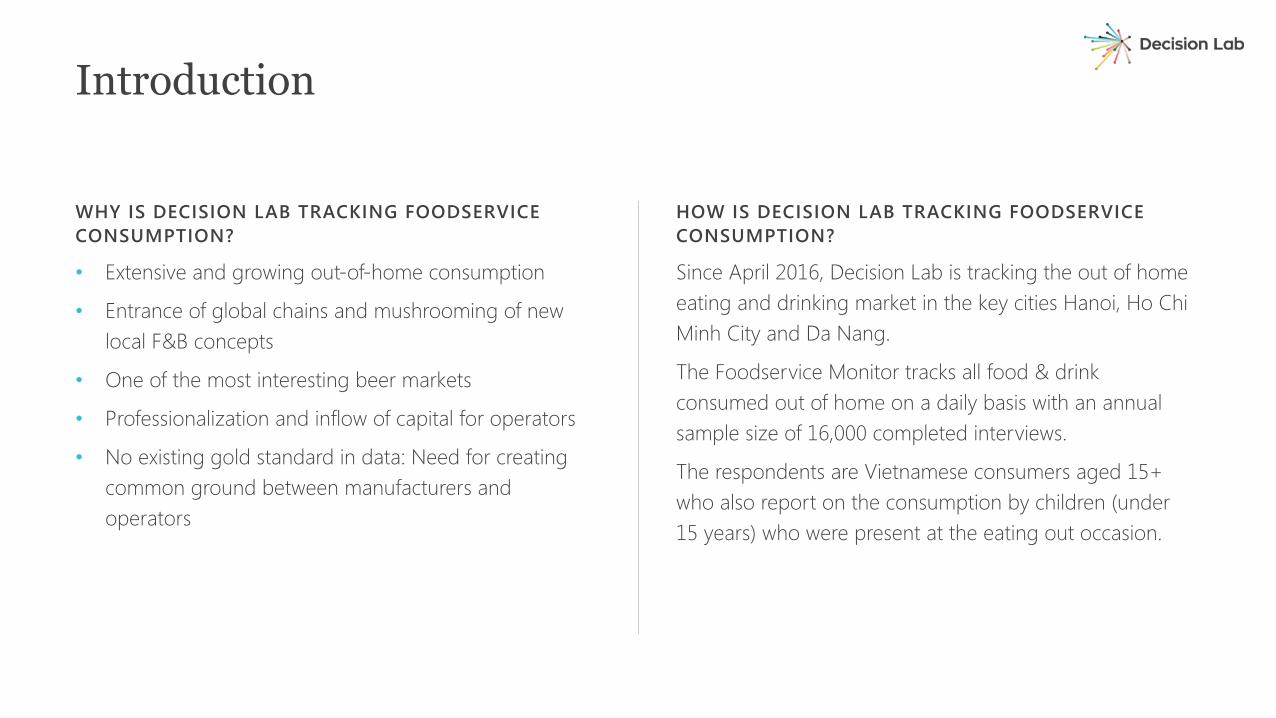
WHY IS DECISION LAB TRACKING FOODSERVICE CONSUMPTION?
• Extensive and growing out-of-home consumption
• Entrance of global chains and mushrooming of new local F&B concepts
• One of the most interesting beer markets
• Professionalization and inflow of capital for operators
• No existing gold standard in data: Need for creating common ground between manufacturers and operators
HOW IS DECISION LAB TRACKING FOODSERVICE CONSUMPTION?
Since April 2016, Decision Lab is tracking the out of home eating and drinking market in the key cities Hanoi, Ho Chi Minh City and Da Nang.
The Foodservice Monitor tracks all food & drink consumed out of home on a daily basis with an annual sample size of 16,000 completed interviews.
The respondents are Vietnamese consumers aged 15+ who also report on the consumption by children (under 15 years) who were present at the eating out occasion.
Introduction

How to improve your business with data
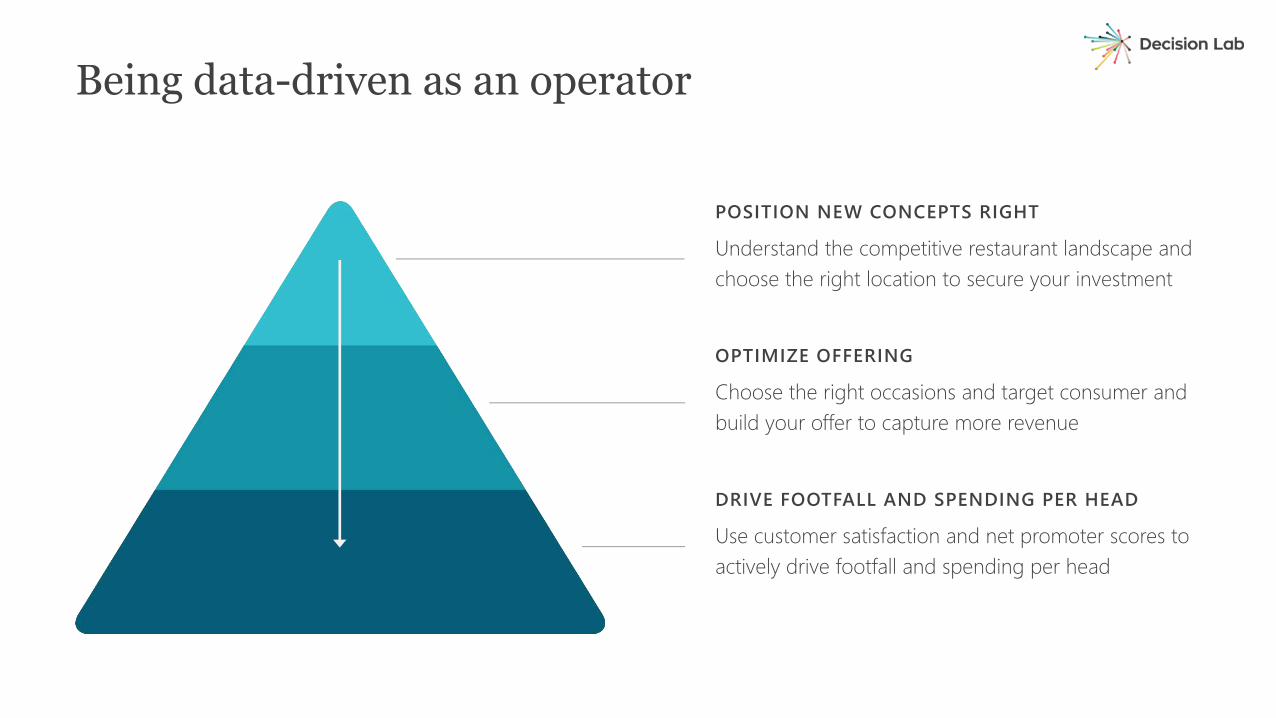
POSITION NEW CONCEPTS RIGHT
Understand the competitive restaurant landscape and choose the right location to secure your investment
Being data-driven as an operator
OPTIMIZE OFFERING
Choose the right occasions and target consumer and build your offer to capture more revenue
DRIVE FOOTFALL AND SPENDING PER HEAD
Use customer satisfaction and net promoter scores to actively drive footfall and spending per head
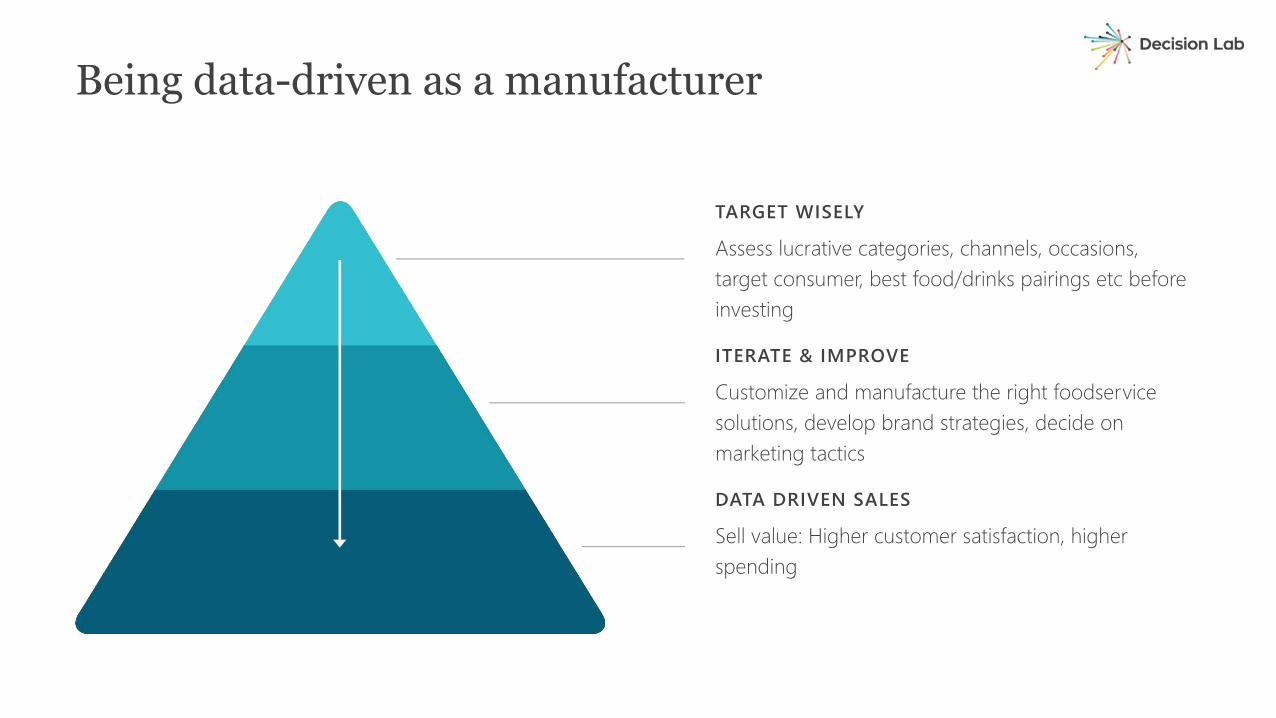
TARGET WISELY
Assess lucrative categories, channels, occasions, target consumer, best food/drinks pairings etc before investing
Being data-driven as a manufacturer
ITERATE & IMPROVE
Customize and manufacture the right foodservice solutions, develop brand strategies, decide on marketing tactics
DATA DRIVEN SALES
Sell value: Higher customer satisfaction, higher spending

Methodology & Access
H O W W E T R A C K O U T - O F - H O M E C O N S U M P T I O N
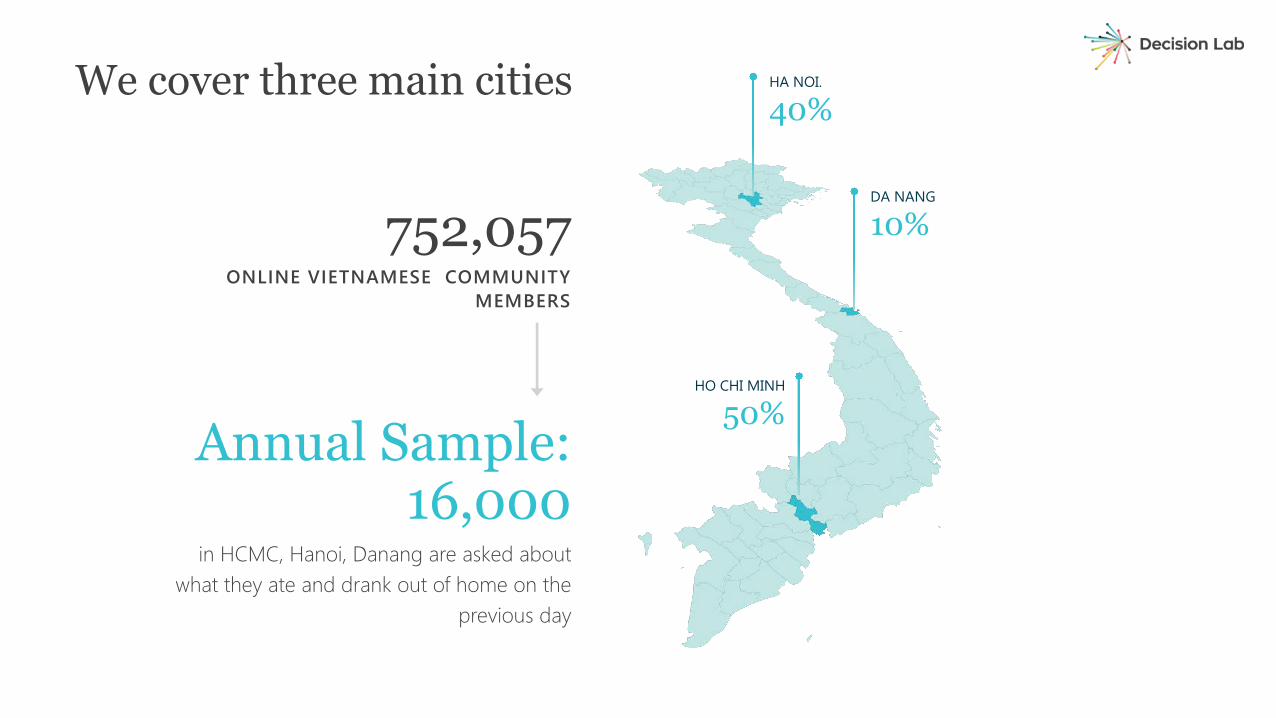
752,057ONLINE VIETNAMESE COMMUNITY
MEMBERS
Annual Sample: 16,000
in HCMC, Hanoi, Danang are asked about what they ate and drank out of home on the
previous day
We cover three main cities HA NOI.
40%
HO CHI MINH
50%
DA NANG
10%
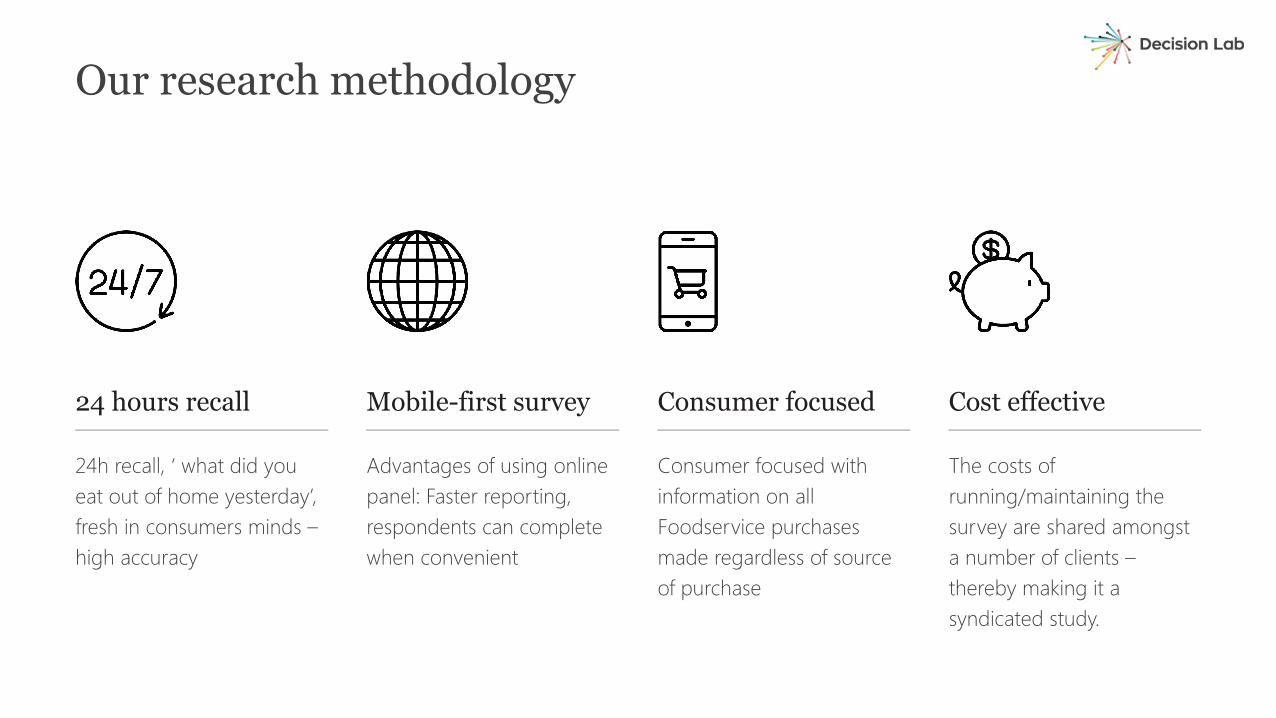
Our research methodology
24h recall, ‘ what did you eat out of home yesterday’, fresh in consumers minds –high accuracy
24 hours recall
Advantages of using online panel: Faster reporting, respondents can complete when convenient
Mobile-first survey
Consumer focused with information on all Foodservice purchases made regardless of source of purchase
Consumer focused Cost effective
The costs of running/maintaining the survey are shared amongst a number of clients –thereby making it a syndicated study.
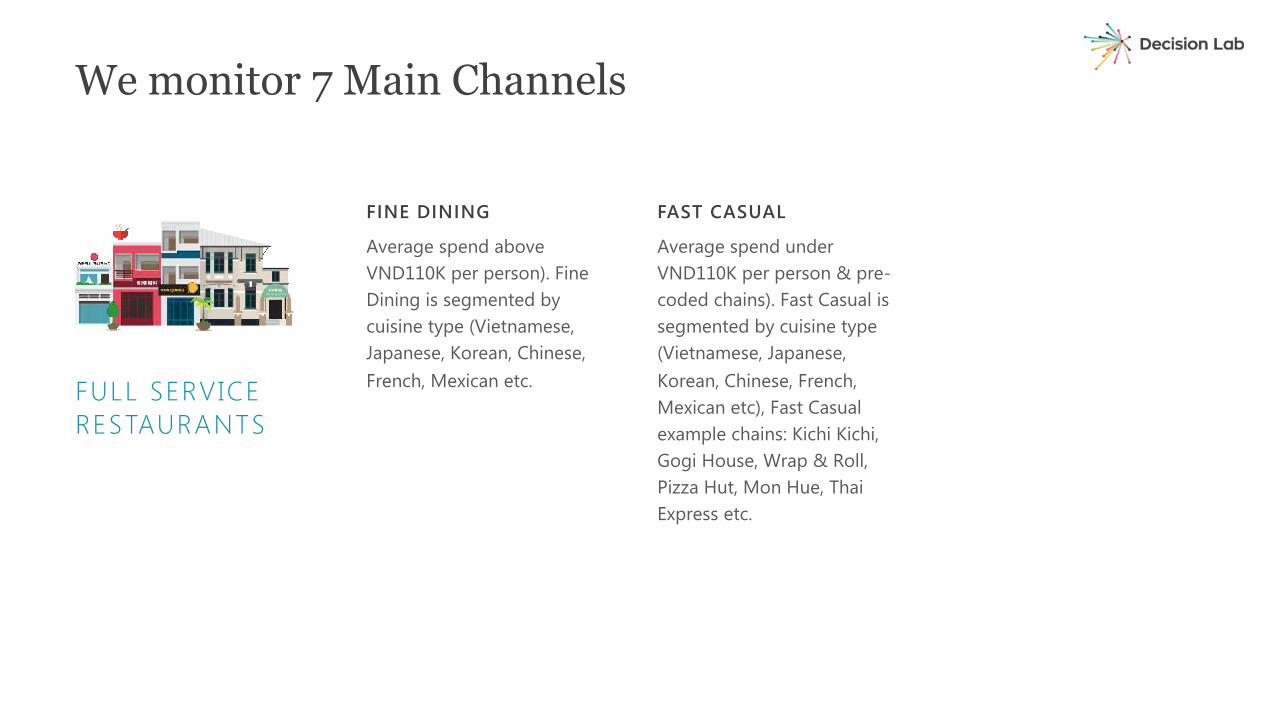
FULL SERVICE RESTAURANTS
FINE DINING
Average spend above VND110K per person). Fine Dining is segmented by cuisine type (Vietnamese, Japanese, Korean, Chinese, French, Mexican etc.
FAST CASUAL
Average spend under VND110K per person & pre-coded chains). Fast Casual is segmented by cuisine type (Vietnamese, Japanese, Korean, Chinese, French, Mexican etc), Fast Casual example chains: Kichi Kichi, Gogi House, Wrap & Roll, Pizza Hut, Mon Hue, Thai Express etc.
We monitor 7 Main Channels
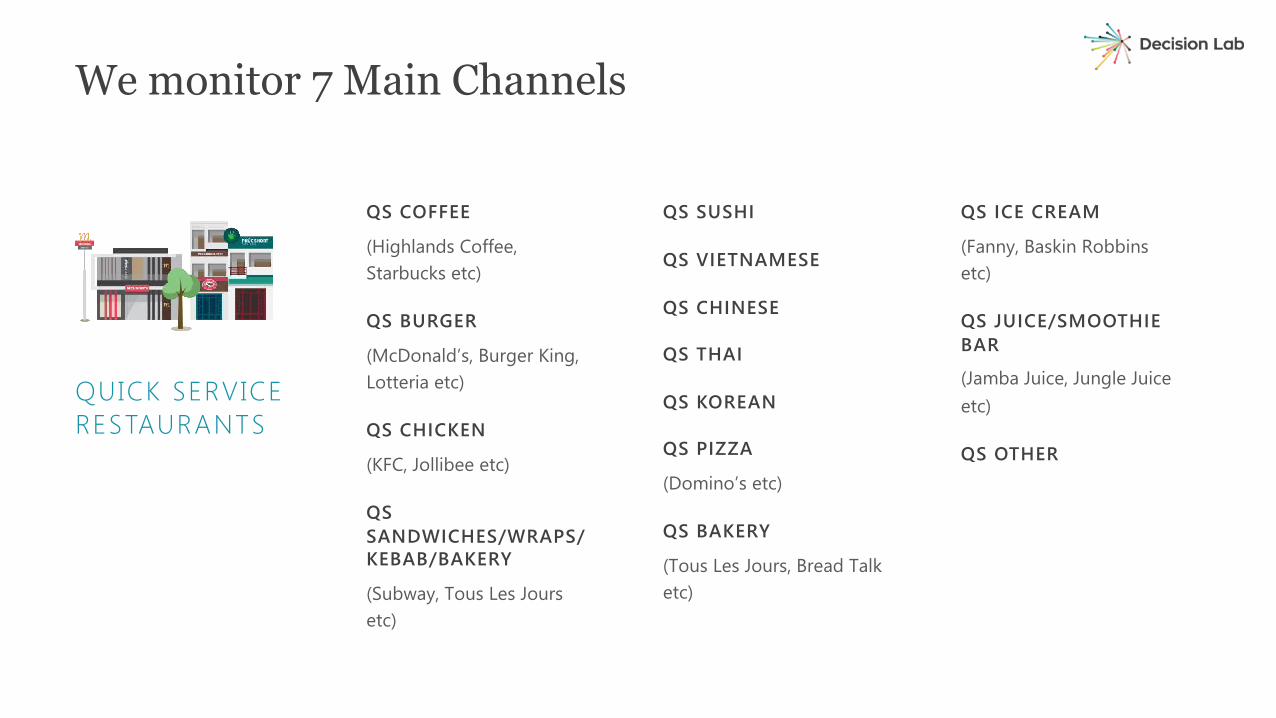
QUICK SERVICE RESTAURANTS
QS COFFEE
(Highlands Coffee, Starbucks etc)
QS BURGER
(McDonald’s, Burger King, Lotteria etc)
QS CHICKEN
(KFC, Jollibee etc)
QS SANDWICHES/WRAPS/KEBAB/BAKERY
(Subway, Tous Les Joursetc)
QS SUSHI
QS VIETNAMESE
QS CHINESE
QS THAI
QS KOREAN
QS PIZZA
(Domino’s etc)
QS BAKERY
(Tous Les Jours, Bread Talk etc)
QS ICE CREAM
(Fanny, Baskin Robbins etc)
QS JUICE/SMOOTHIE BAR
(Jamba Juice, Jungle Juice etc)
QS OTHER
We monitor 7 Main Channels
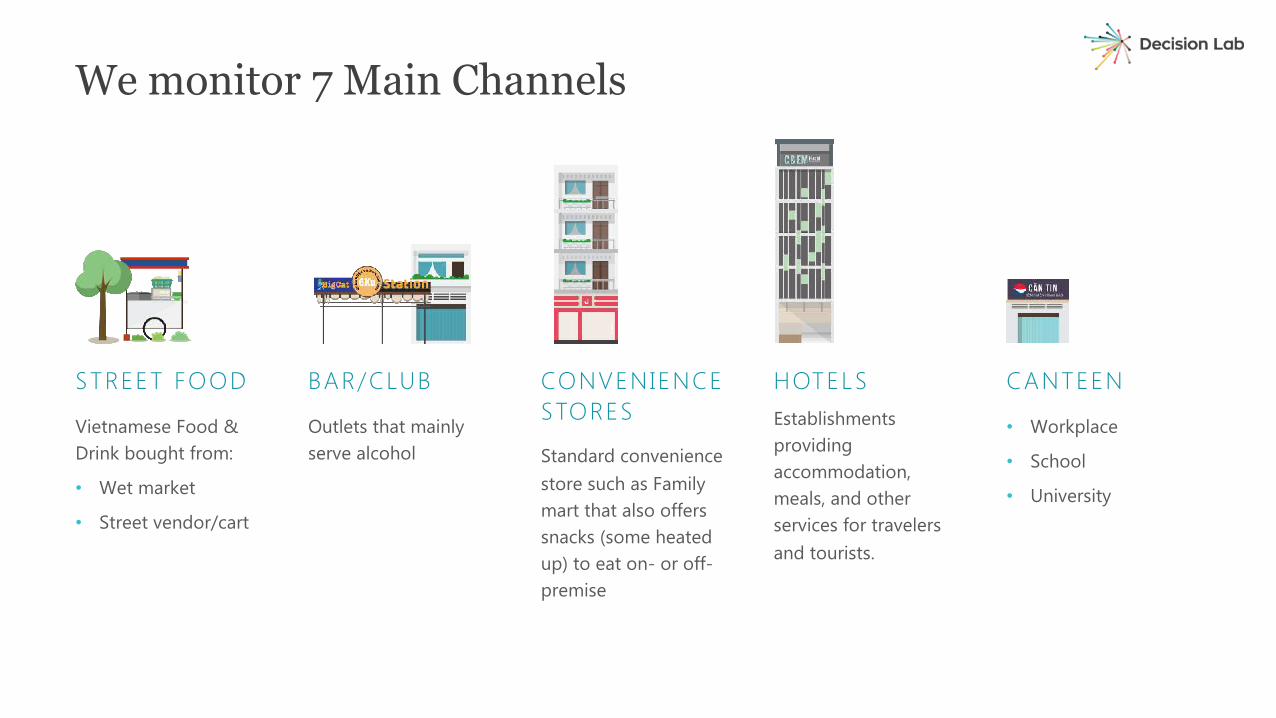
STREET FOOD
Vietnamese Food & Drink bought from:
• Wet market
• Street vendor/cart
BAR/CLUB
Outlets that mainly serve alcohol
CONVENIENCE STORES
Standard convenience store such as Family mart that also offers snacks (some heated up) to eat on- or off-premise
HOTELSEstablishments providing accommodation, meals, and other services for travelers and tourists.
CANTEEN
• Workplace
• School
• University
We monitor 7 Main Channels
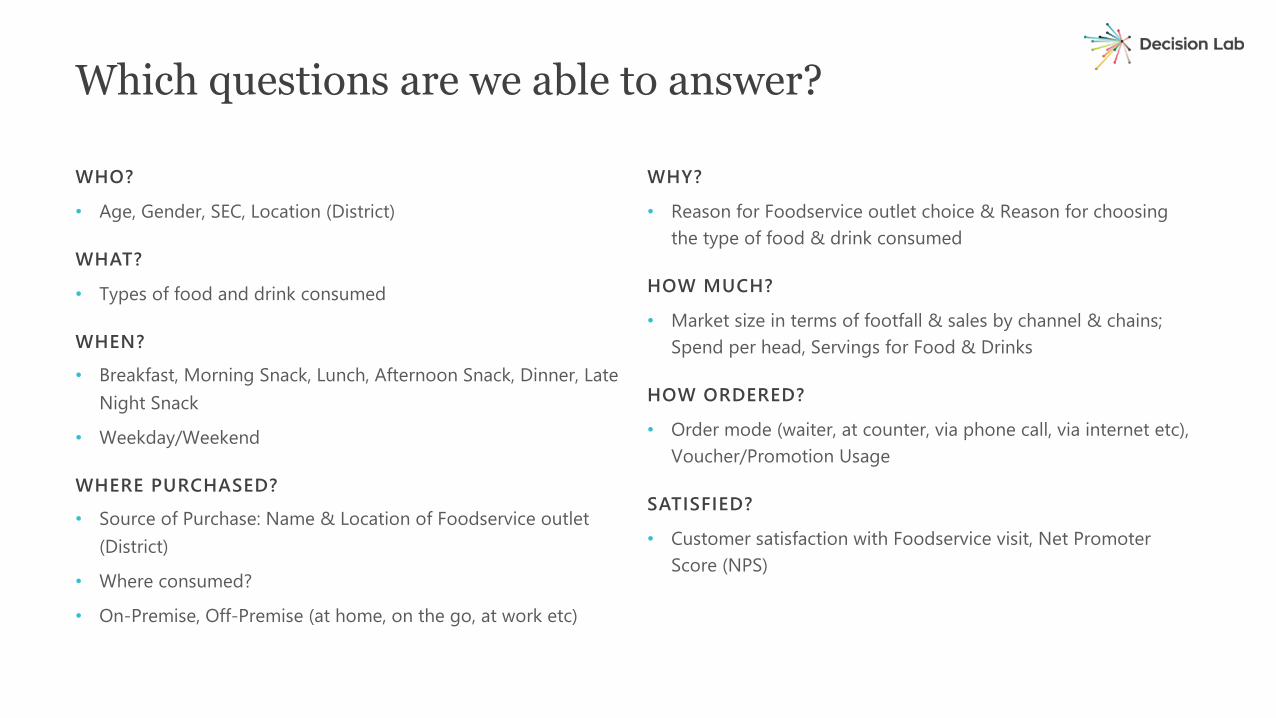
WHO?
• Age, Gender, SEC, Location (District)
WHAT?
• Types of food and drink consumed
WHEN?
• Breakfast, Morning Snack, Lunch, Afternoon Snack, Dinner, Late Night Snack
• Weekday/Weekend
WHERE PURCHASED?
• Source of Purchase: Name & Location of Foodservice outlet (District)
• Where consumed?
• On-Premise, Off-Premise (at home, on the go, at work etc)
WHY?
• Reason for Foodservice outlet choice & Reason for choosing the type of food & drink consumed
HOW MUCH?
• Market size in terms of footfall & sales by channel & chains; Spend per head, Servings for Food & Drinks
HOW ORDERED?
• Order mode (waiter, at counter, via phone call, via internet etc), Voucher/Promotion Usage
SATISFIED?
• Customer satisfaction with Foodservice visit, Net Promoter Score (NPS)
Which questions are we able to answer?
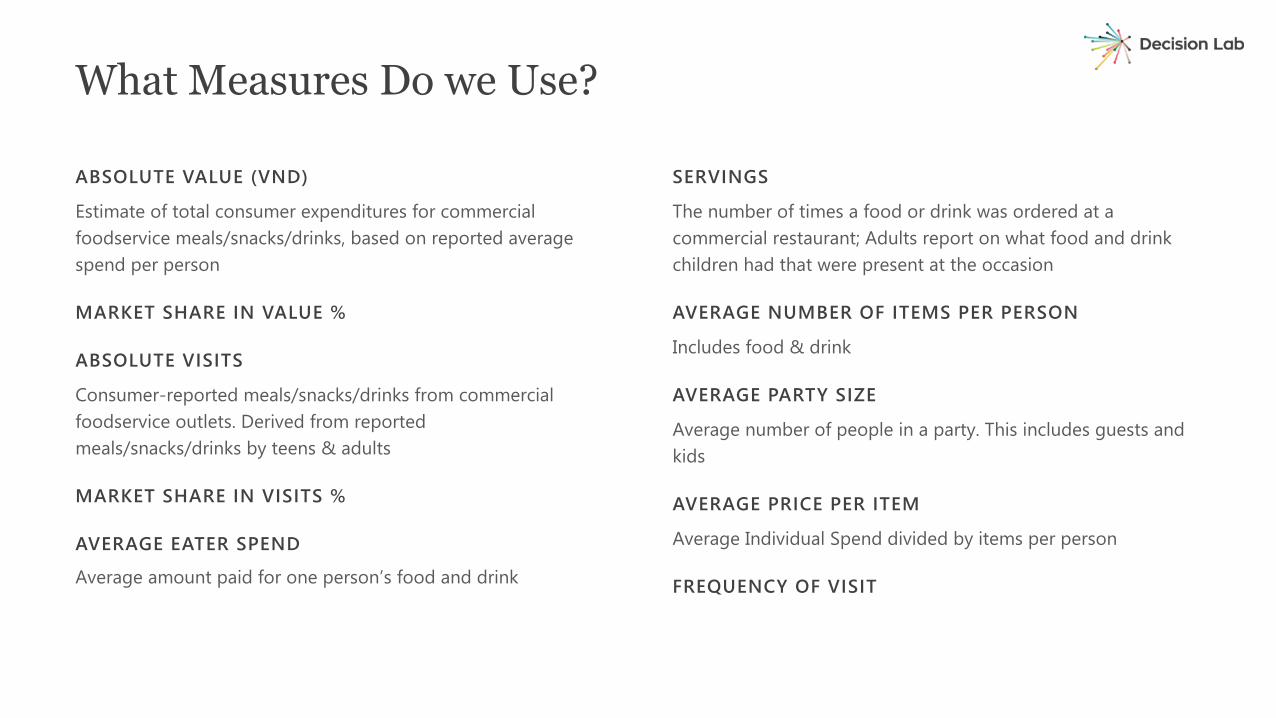
ABSOLUTE VALUE (VND)
Estimate of total consumer expenditures for commercial foodservice meals/snacks/drinks, based on reported average spend per person
MARKET SHARE IN VALUE %
ABSOLUTE VISITS
Consumer-reported meals/snacks/drinks from commercial foodservice outlets. Derived from reported meals/snacks/drinks by teens & adults
MARKET SHARE IN VISITS %
AVERAGE EATER SPEND
Average amount paid for one person’s food and drink
SERVINGS
The number of times a food or drink was ordered at a commercial restaurant; Adults report on what food and drink children had that were present at the occasion
AVERAGE NUMBER OF ITEMS PER PERSON
Includes food & drink
AVERAGE PARTY SIZE
Average number of people in a party. This includes guests and kids
AVERAGE PRICE PER ITEM
Average Individual Spend divided by items per person
FREQUENCY OF VISIT
What Measures Do we Use?
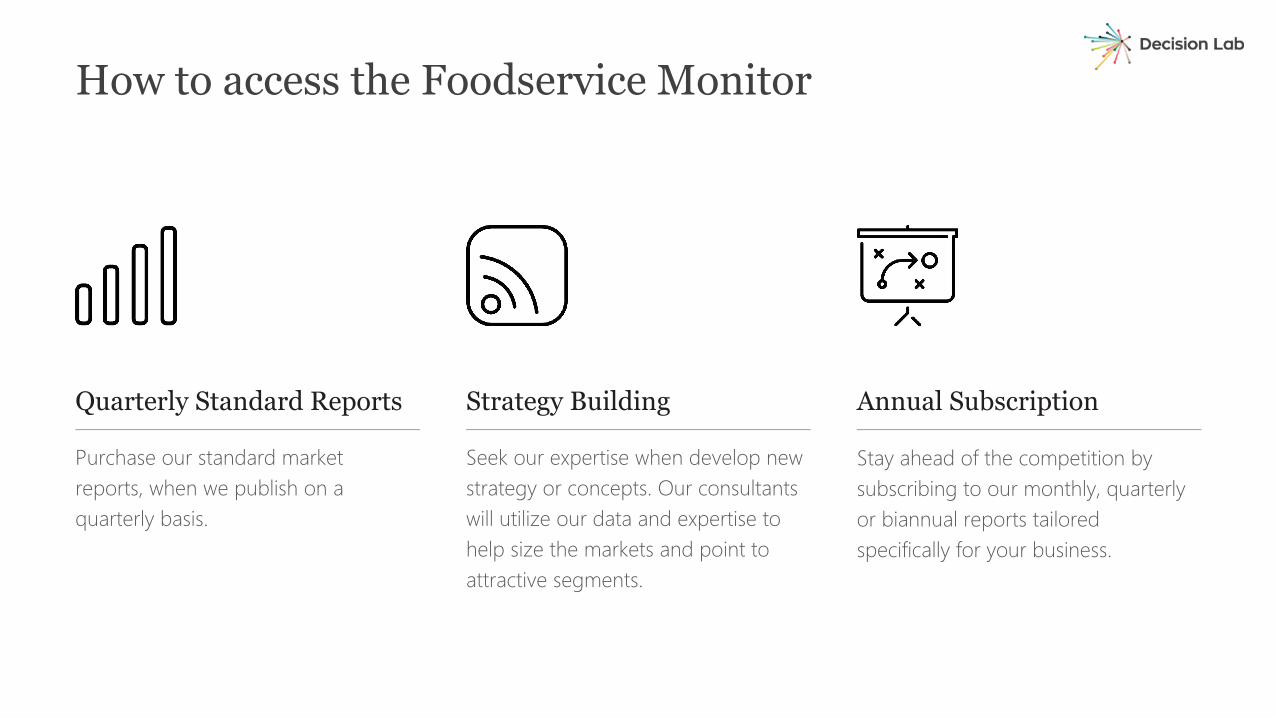
How to access the Foodservice Monitor
Purchase our standard market reports, when we publish on a quarterly basis.
Quarterly Standard Reports
Seek our expertise when develop new strategy or concepts. Our consultants will utilize our data and expertise to help size the markets and point to attractive segments.
Strategy Building
Stay ahead of the competition by subscribing to our monthly, quarterly or biannual reports tailored specifically for your business.
Annual Subscription
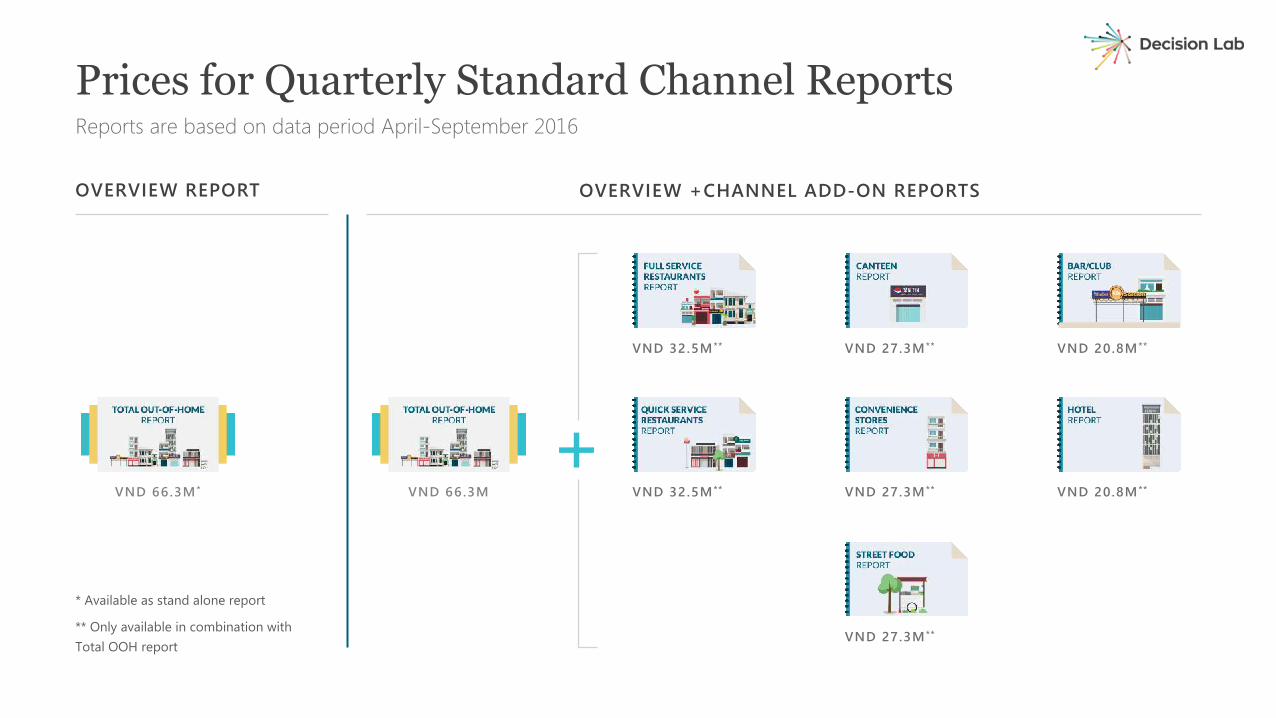
OVERVIEW REPORT
* Available as stand alone report
** Only available in combination with Total OOH report
OVERVIEW +CHANNEL ADD-ON REPORTS
Prices for Quarterly Standard Channel ReportsReports are based on data period April-September 2016
VND 27.3M**
VND 27.3M**VND 32.5M** VND 20.8M**
VND 27.3M**VND 32.5M** VND 20.8M**
VND 66.3MVND 66.3M*
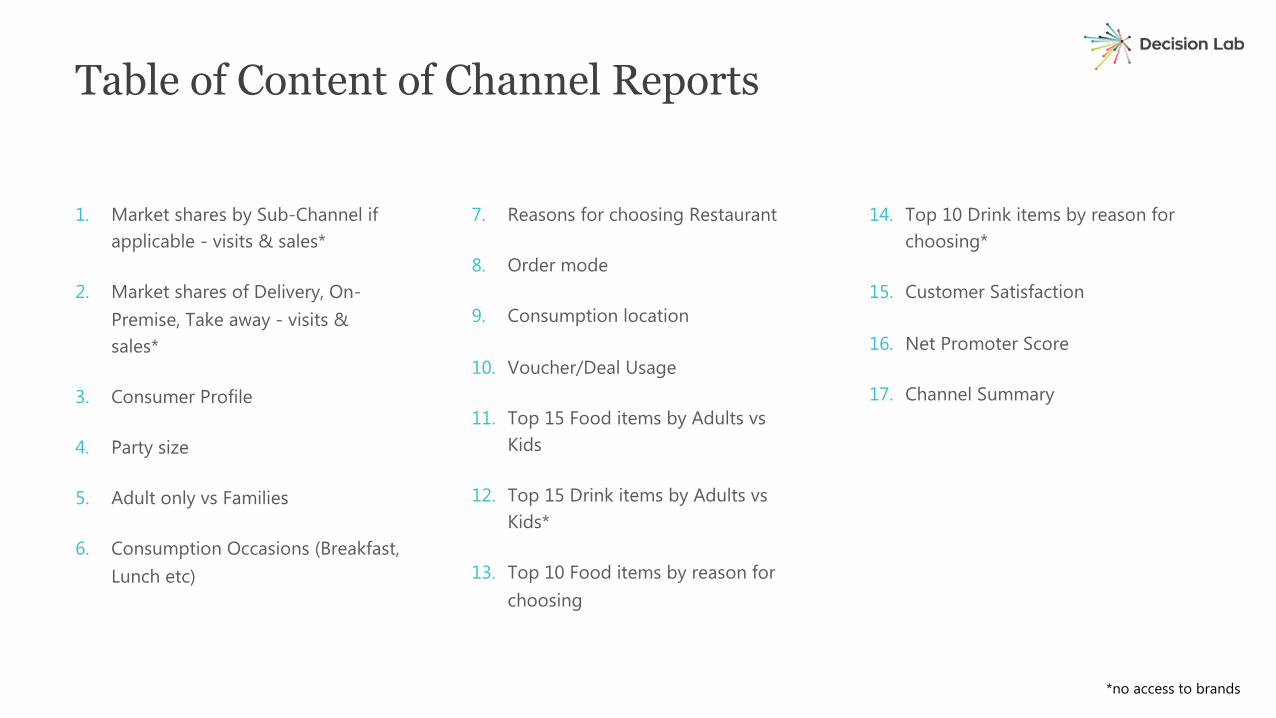
1. Market shares by Sub-Channel if applicable - visits & sales*
2. Market shares of Delivery, On-Premise, Take away - visits & sales*
3. Consumer Profile
4. Party size
5. Adult only vs Families
6. Consumption Occasions (Breakfast, Lunch etc)
7. Reasons for choosing Restaurant
8. Order mode
9. Consumption location
10. Voucher/Deal Usage
11. Top 15 Food items by Adults vs Kids
12. Top 15 Drink items by Adults vs Kids*
13. Top 10 Food items by reason for choosing
14. Top 10 Drink items by reason for choosing*
15. Customer Satisfaction
16. Net Promoter Score
17. Channel Summary
Table of Content of Channel Reports
*no access to brands

Out of Home market overview
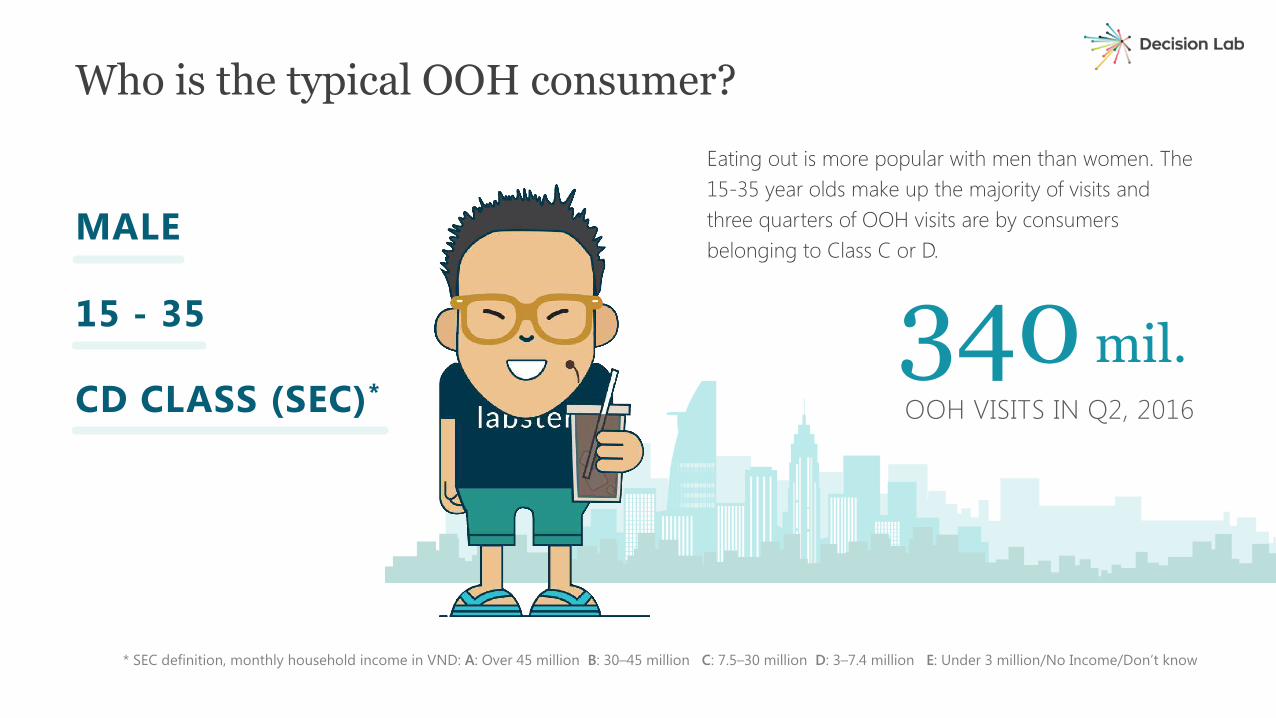
Eating out is more popular with men than women. The 15-35 year olds make up the majority of visits and three quarters of OOH visits are by consumers belonging to Class C or D.
Who is the typical OOH consumer?
MALE
15 - 35
CD CLASS (SEC)* OOH VISITS IN Q2, 2016
340 mil.
* SEC definition, monthly household income in VND: A: Over 45 million B: 30–45 million C: 7.5–30 million D: 3–7.4 million E: Under 3 million/No Income/Don’t know
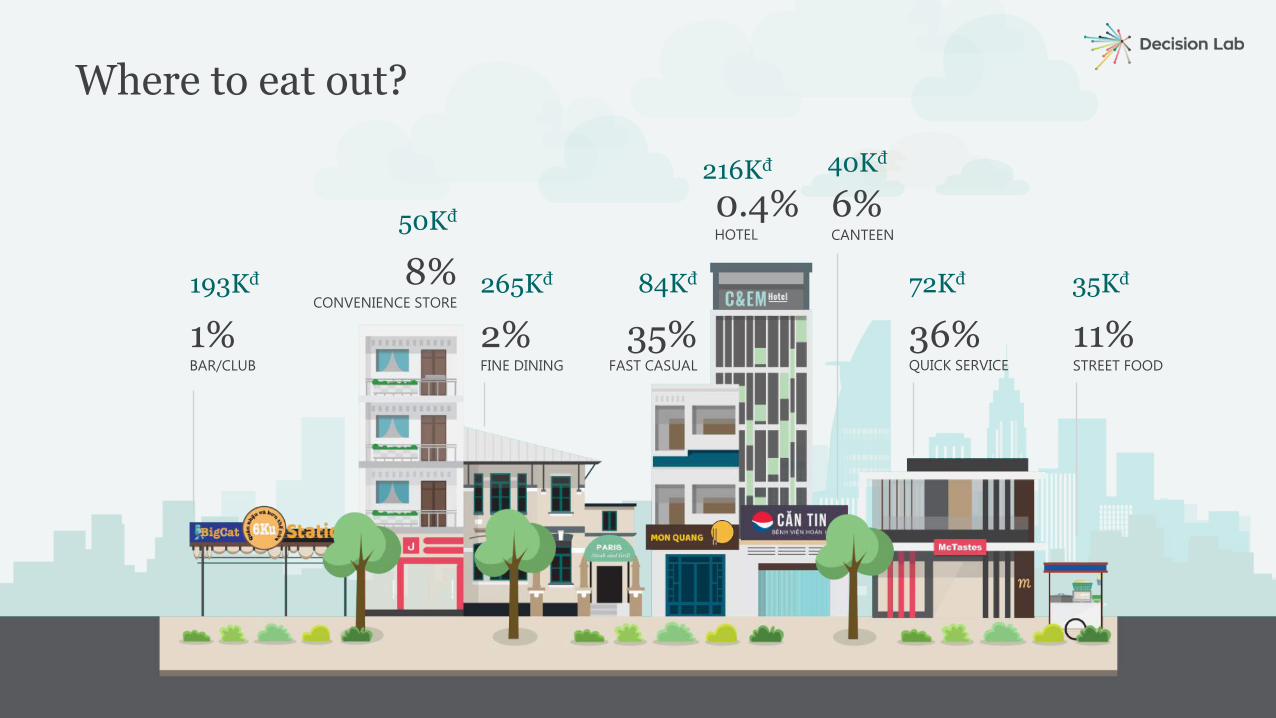
Where to eat out?
0.4%HOTEL
216Kđ
2%FINE DINING
265Kđ
36%QUICK SERVICE
35%FAST CASUAL
72Kđ84Kđ
1%BAR/CLUB
193Kđ 8%CONVENIENCE STORE
50Kđ 6%CANTEEN
40Kđ
11%STREET FOOD
35Kđ
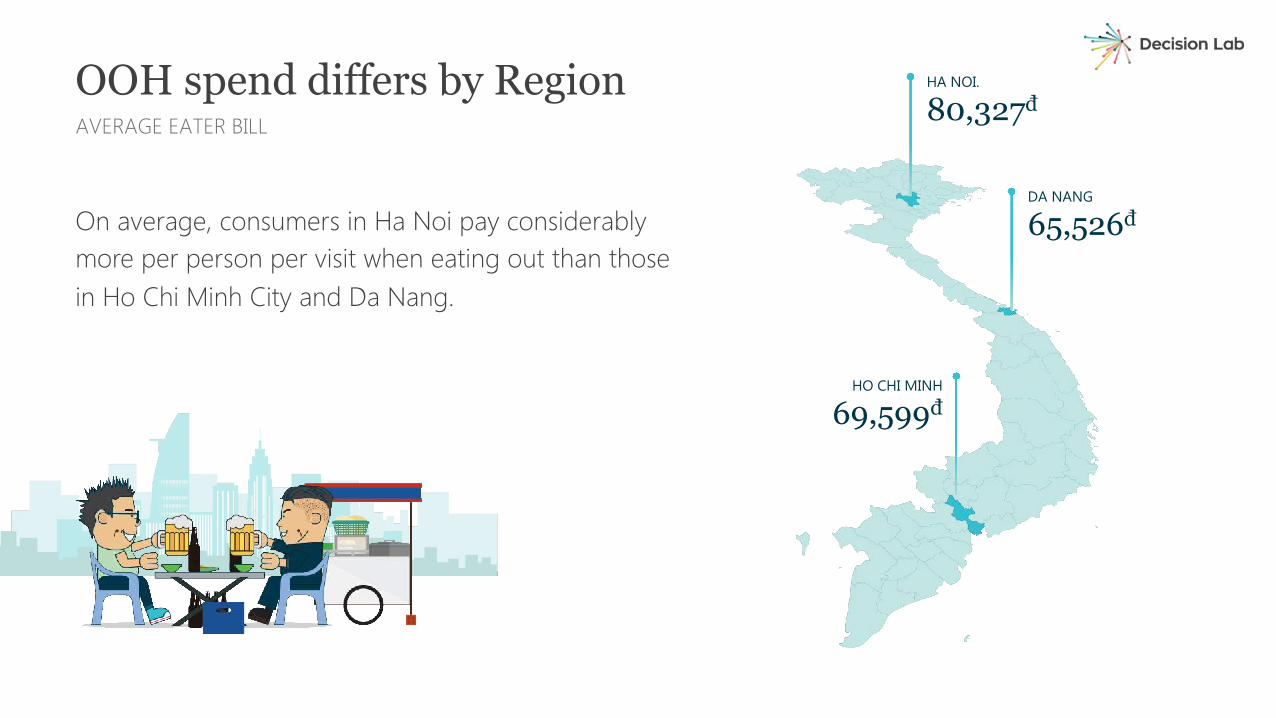
On average, consumers in Ha Noi pay considerably more per person per visit when eating out than those in Ho Chi Minh City and Da Nang.
OOH spend differs by RegionAVERAGE EATER BILL
HA NOI.
80,327đ
HO CHI MINH
69,599đ
DA NANG
65,526đ
What do Vietnamese eat & drink in restaurants?Healthy or unhealthy?
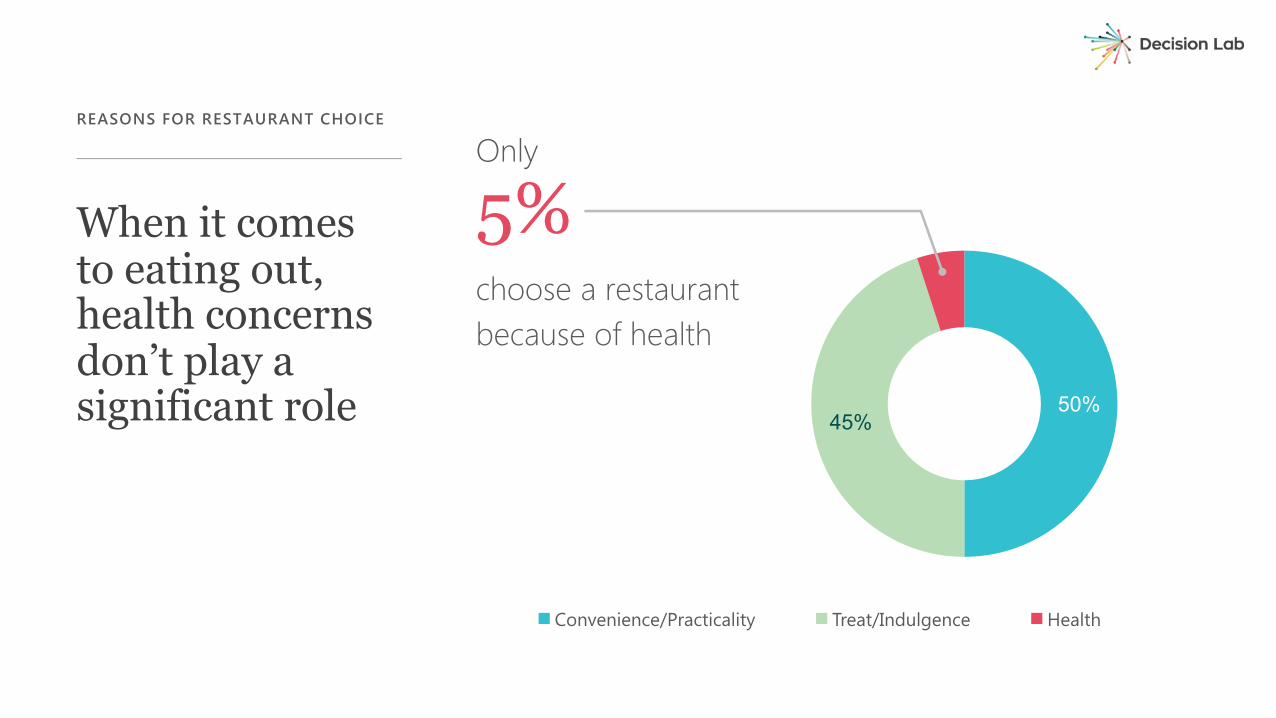
When it comes to eating out, health concerns don’t play a significant role
REASONS FOR RESTAURANT CHOICE
50%45%
Convenience/Practicality Treat/Indulgence Health
5%Only
choose a restaurantbecause of health
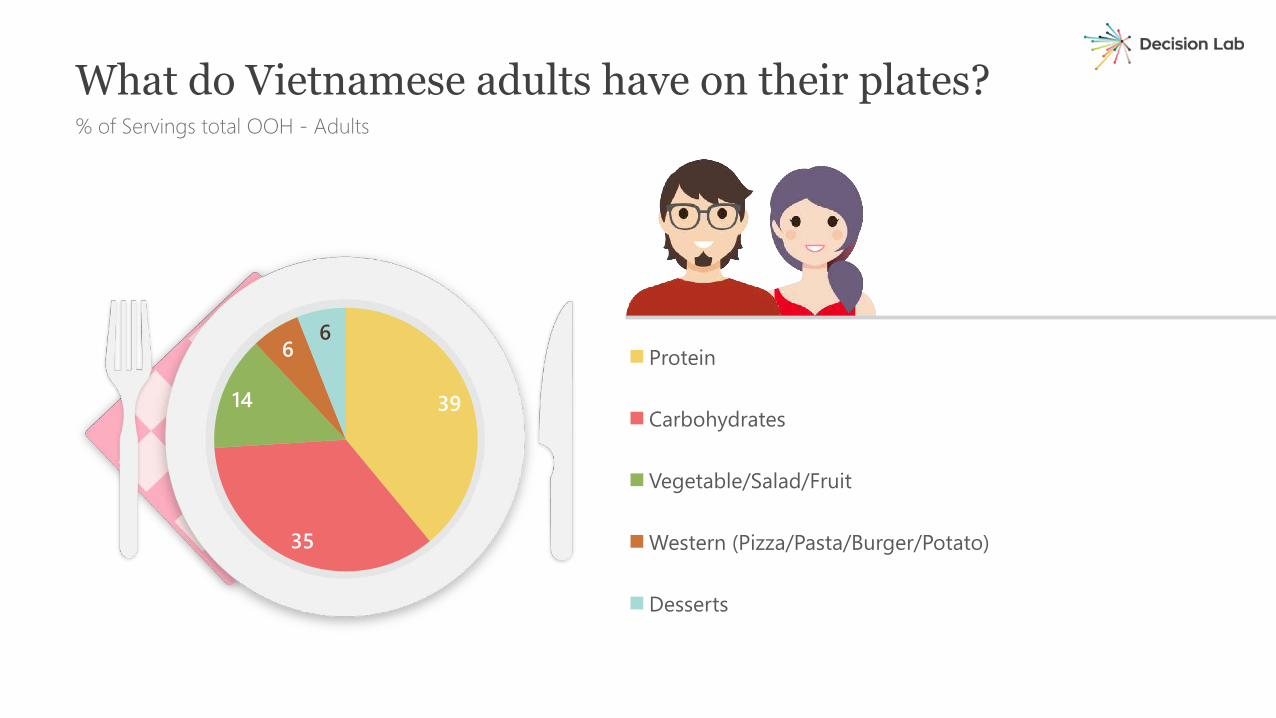
39
35
14
66
Protein
Carbohydrates
Vegetable/Salad/Fruit
Western (Pizza/Pasta/Burger/Potato)
Desserts
% of Servings total OOH - Adults
What do Vietnamese adults have on their plates?
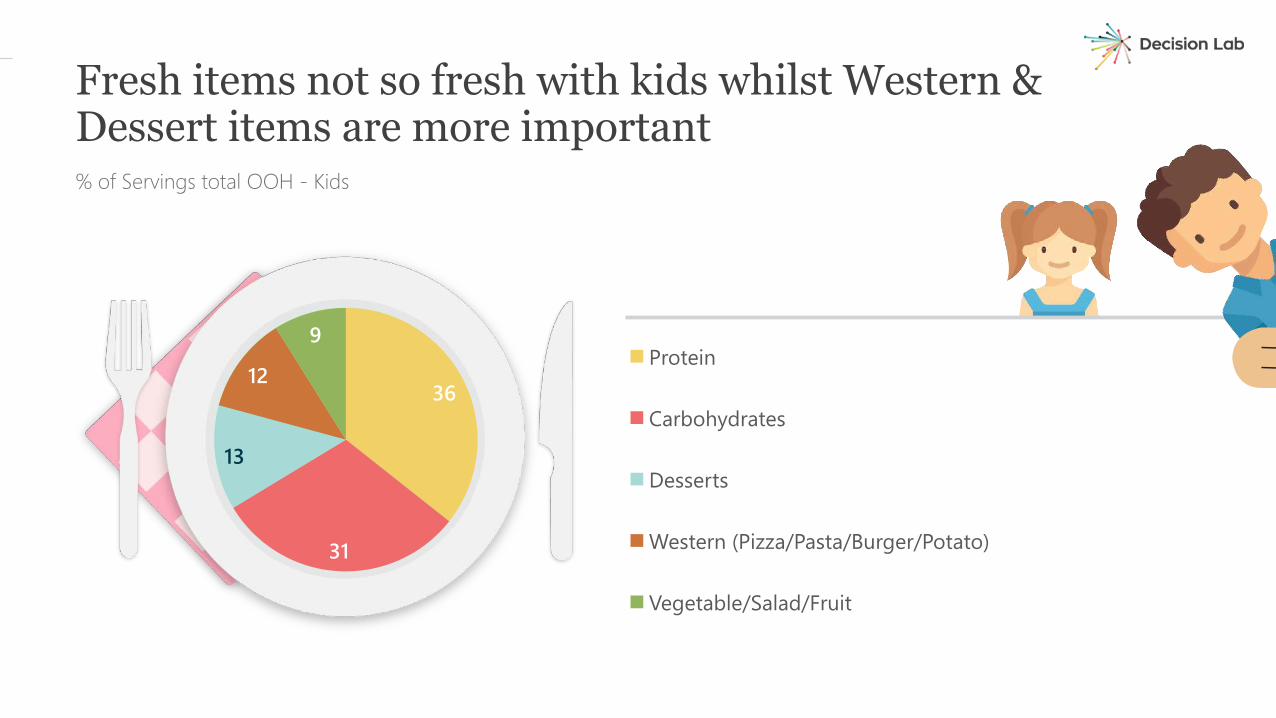
36
31
13
12
9Protein
Carbohydrates
Desserts
Western (Pizza/Pasta/Burger/Potato)
Vegetable/Salad/Fruit
% of Servings total OOH - Kids
Fresh items not so fresh with kids whilst Western & Dessert items are more important
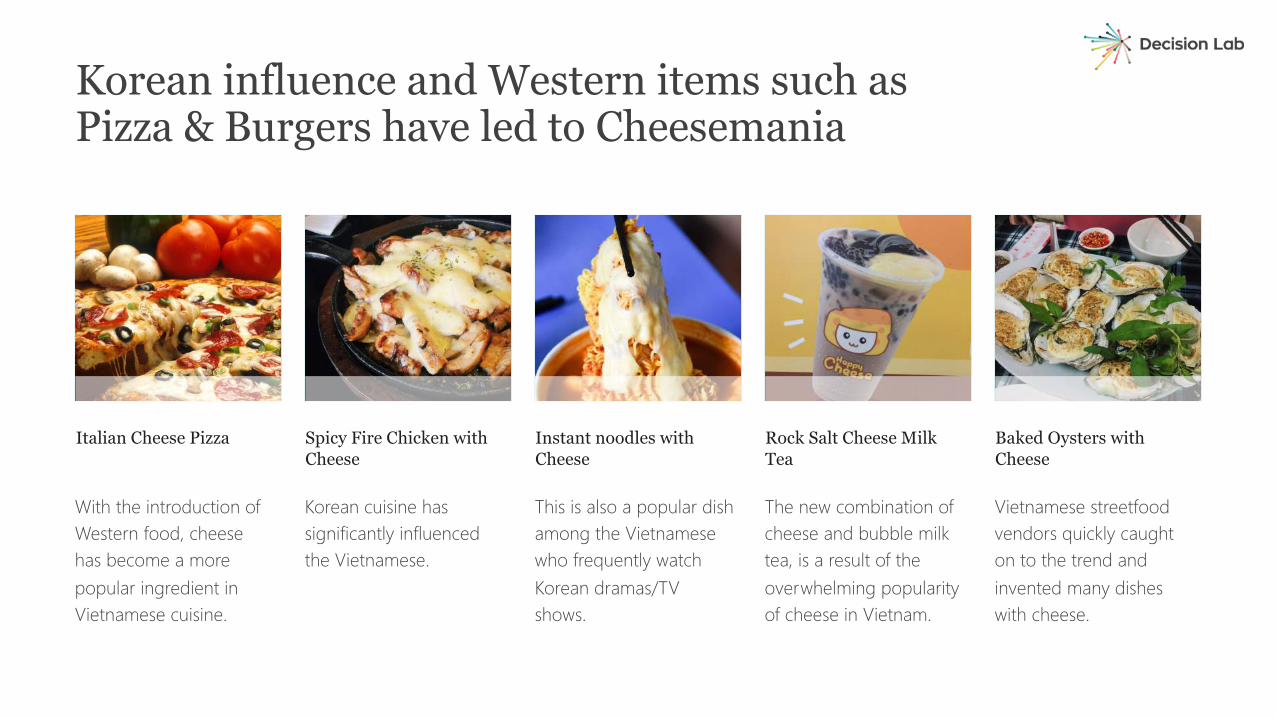
Italian Cheese Pizza Baked Oysters with Cheese
Spicy Fire Chicken with Cheese
Instant noodles with Cheese
Rock Salt Cheese Milk Tea
With the introduction of Western food, cheese has become a more popular ingredient in Vietnamese cuisine.
Korean cuisine has significantly influenced the Vietnamese.
This is also a popular dish among the Vietnamese who frequently watch Korean dramas/TV shows.
The new combination of cheese and bubble milk tea, is a result of the overwhelming popularity of cheese in Vietnam.
Vietnamese streetfoodvendors quickly caught on to the trend and invented many dishes with cheese.
Korean influence and Western items such as Pizza & Burgers have led to Cheesemania
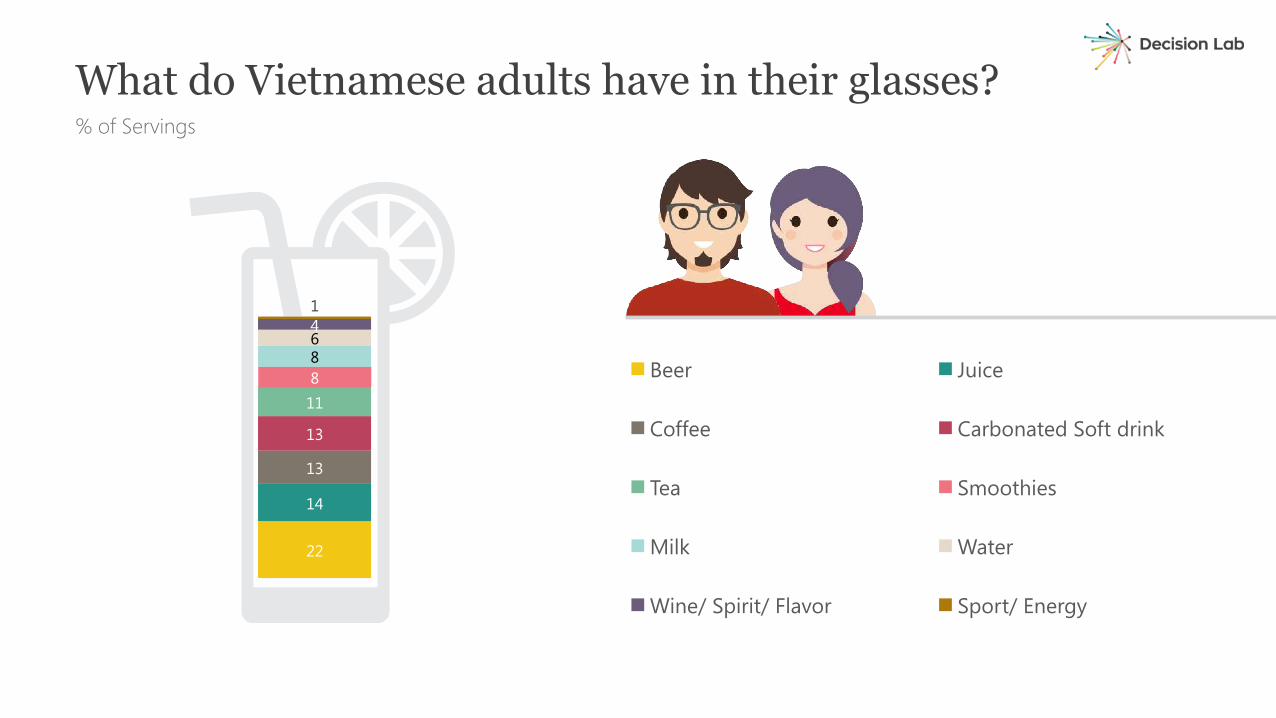
% of Servings
What do Vietnamese adults have in their glasses?
22
14
13
13
1188641
Beer Juice
Coffee Carbonated Soft drink
Tea Smoothies
Milk Water
Wine/ Spirit/ Flavor Sport/ Energy
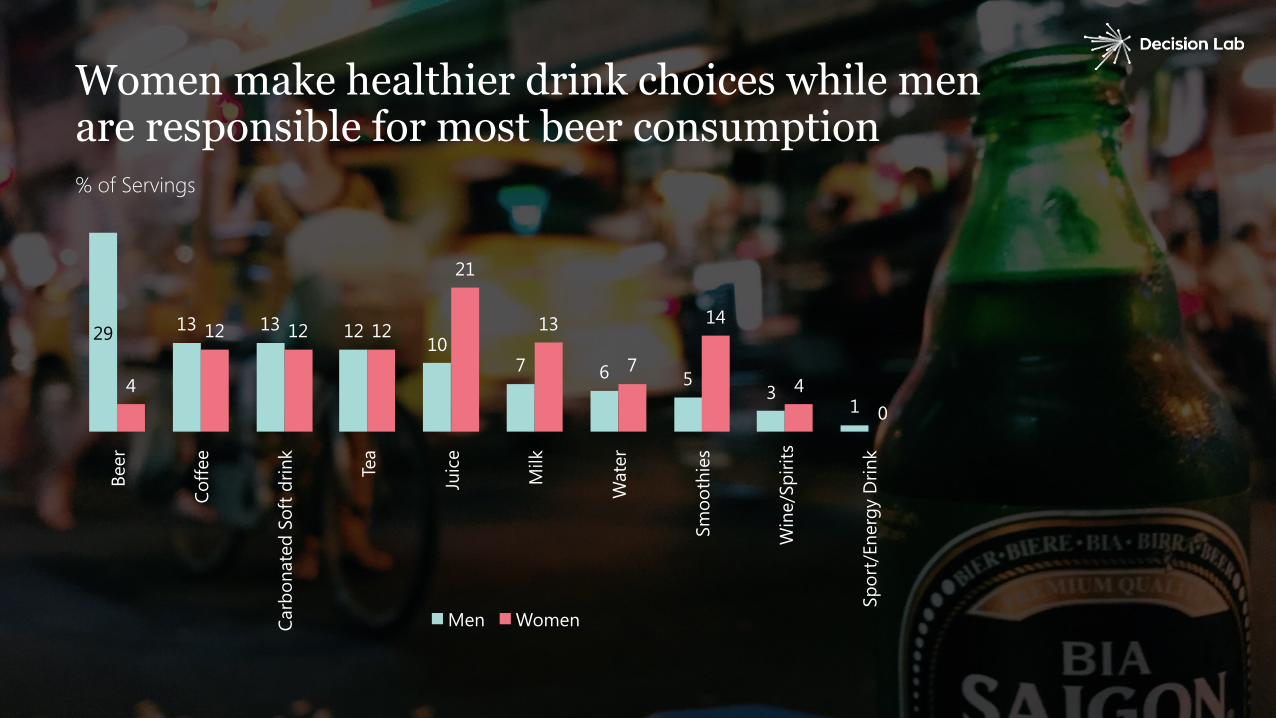
Women make healthier drink choices while men are responsible for most beer consumption% of Servings
29 13 13 1210
7 6 53
14
12 12 12
21
13
7
14
40
Beer
Coffe
e
Carb
onat
ed S
oft d
rink
Tea
Juic
e
Milk
Wat
er
Smoo
thie
s
Win
e/Sp
irits
Spor
t/En
ergy
Drin
k
Men Women
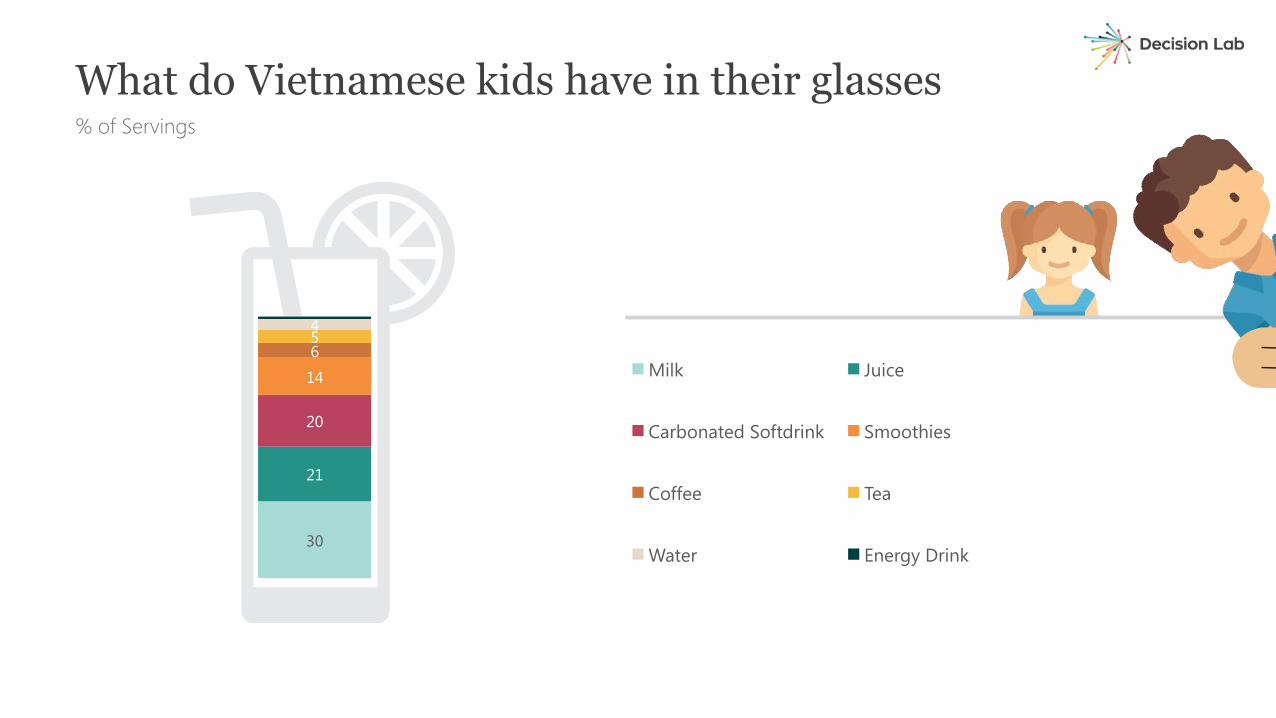
% of Servings
What do Vietnamese kids have in their glasses
30
21
20
14
654
Milk Juice
Carbonated Softdrink Smoothies
Coffee Tea
Water Energy Drink
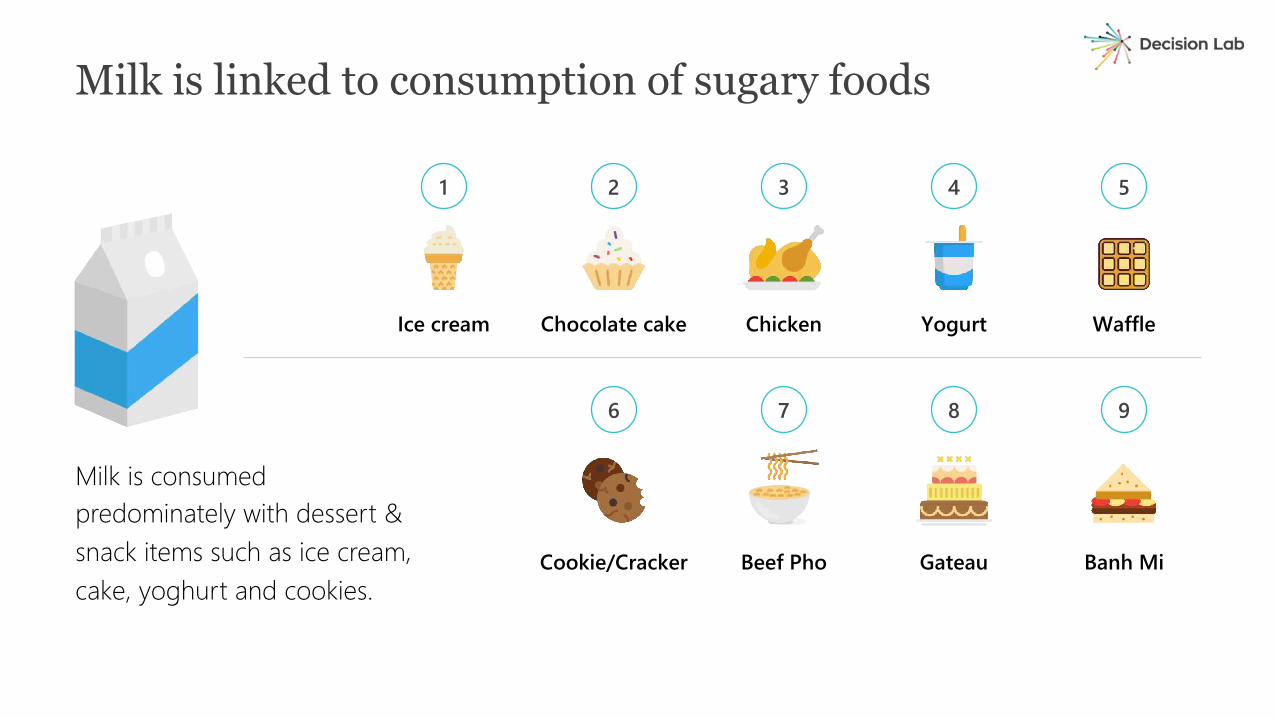
Milk is consumed predominately with dessert & snack items such as ice cream, cake, yoghurt and cookies.
Milk is linked to consumption of sugary foods
1 2 3 4 5
Ice cream Chocolate cake Chicken Yogurt Waffle
6 7 8 9
Banh MiBeef Pho GateauCookie/Cracker
How is the food & drink offer changing?
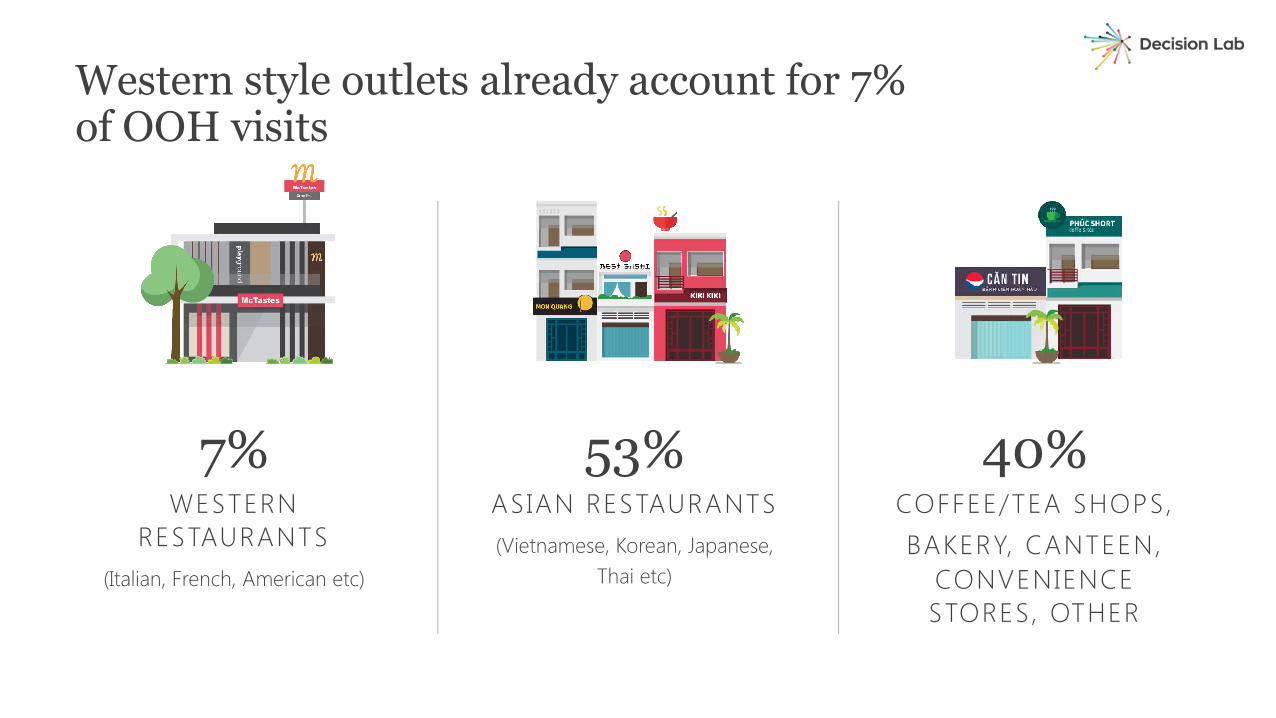
7%WESTERN
RESTAURANTS(Italian, French, American etc)
53%ASIAN RESTAURANTS(Vietnamese, Korean, Japanese,
Thai etc)
40%COFFEE/TEA SHOPS, BAKERY, CANTEEN,
CONVENIENCE STORES, OTHER
Western style outlets already account for 7% of OOH visits
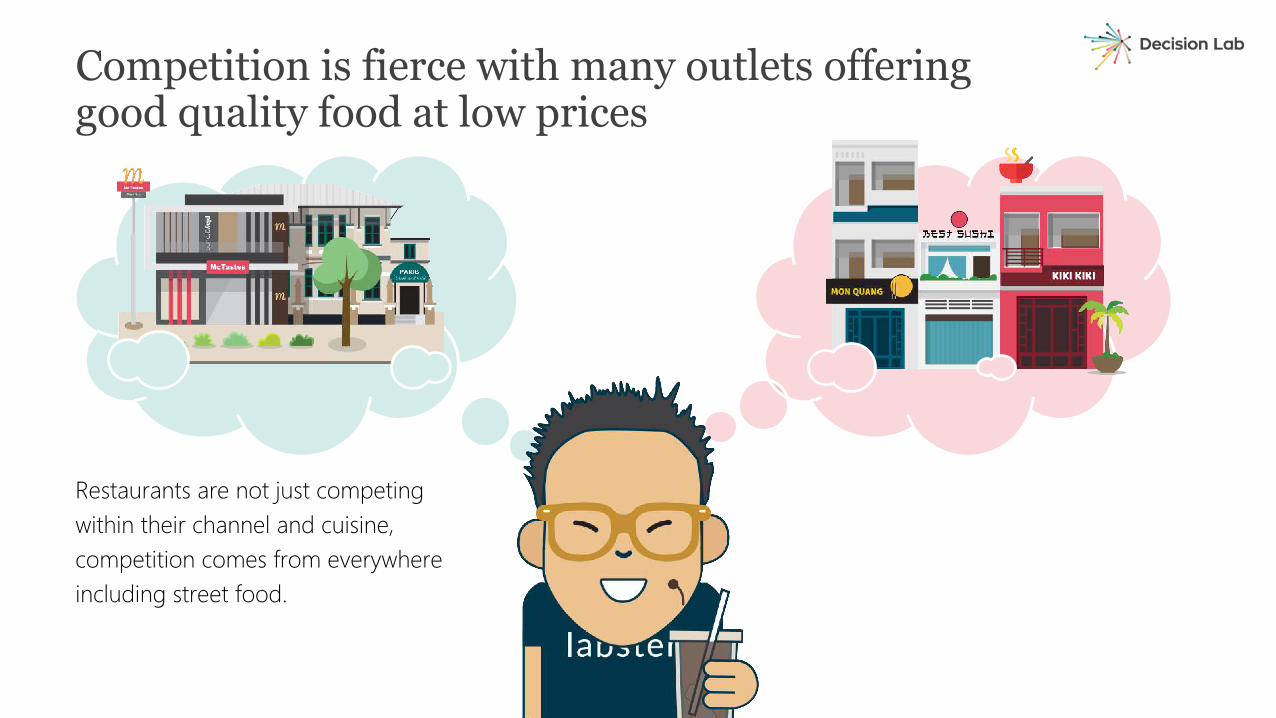
Competition is fierce with many outlets offering good quality food at low prices
Restaurants are not just competing within their channel and cuisine, competition comes from everywhere including street food.

How can chains stay ahead?
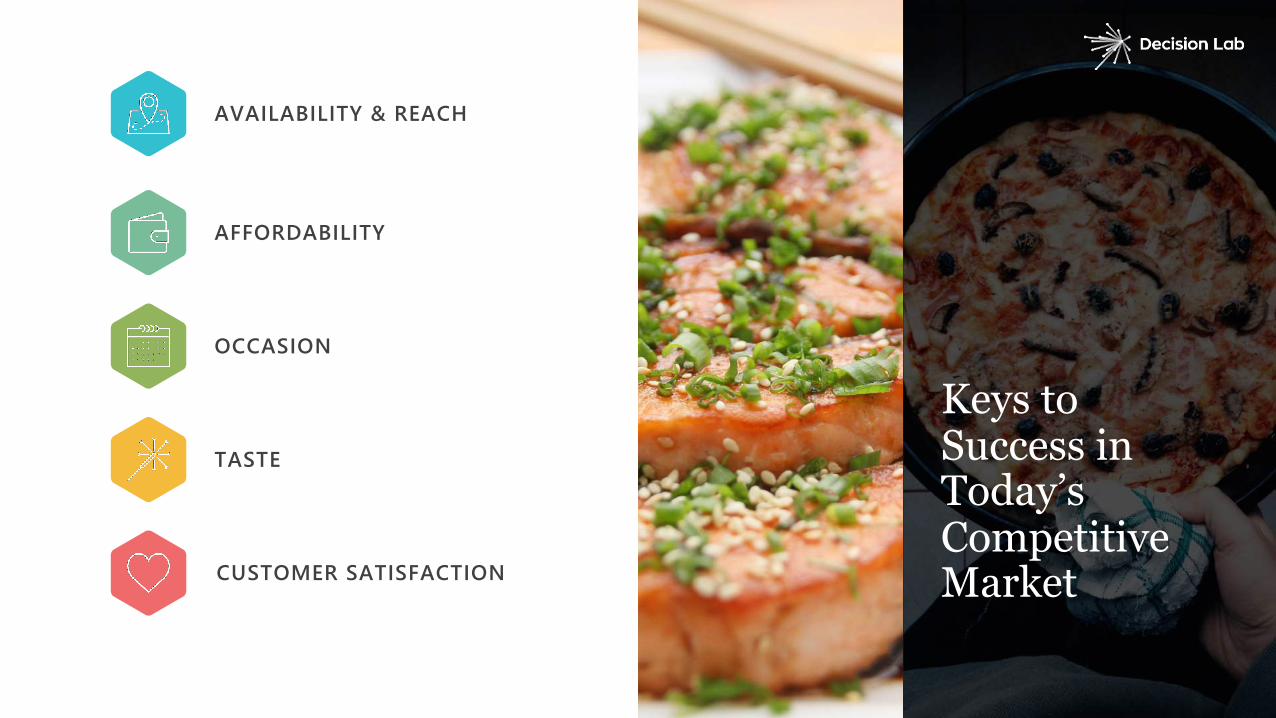
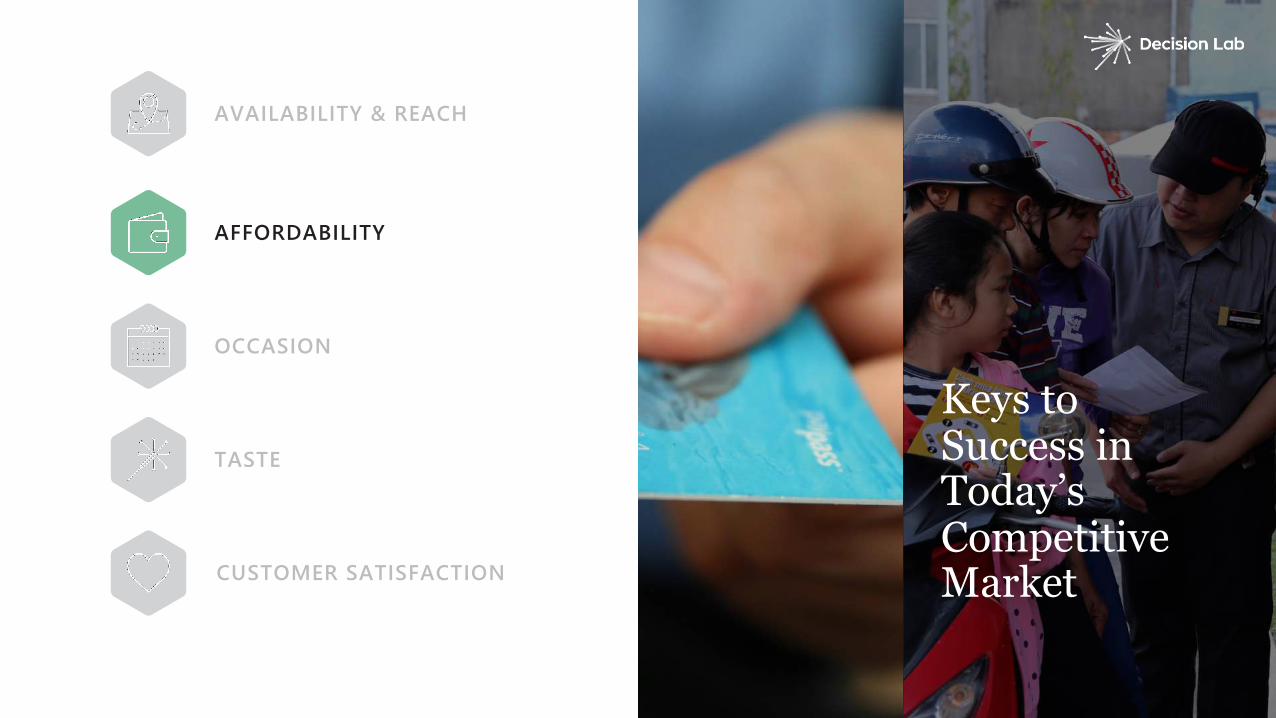
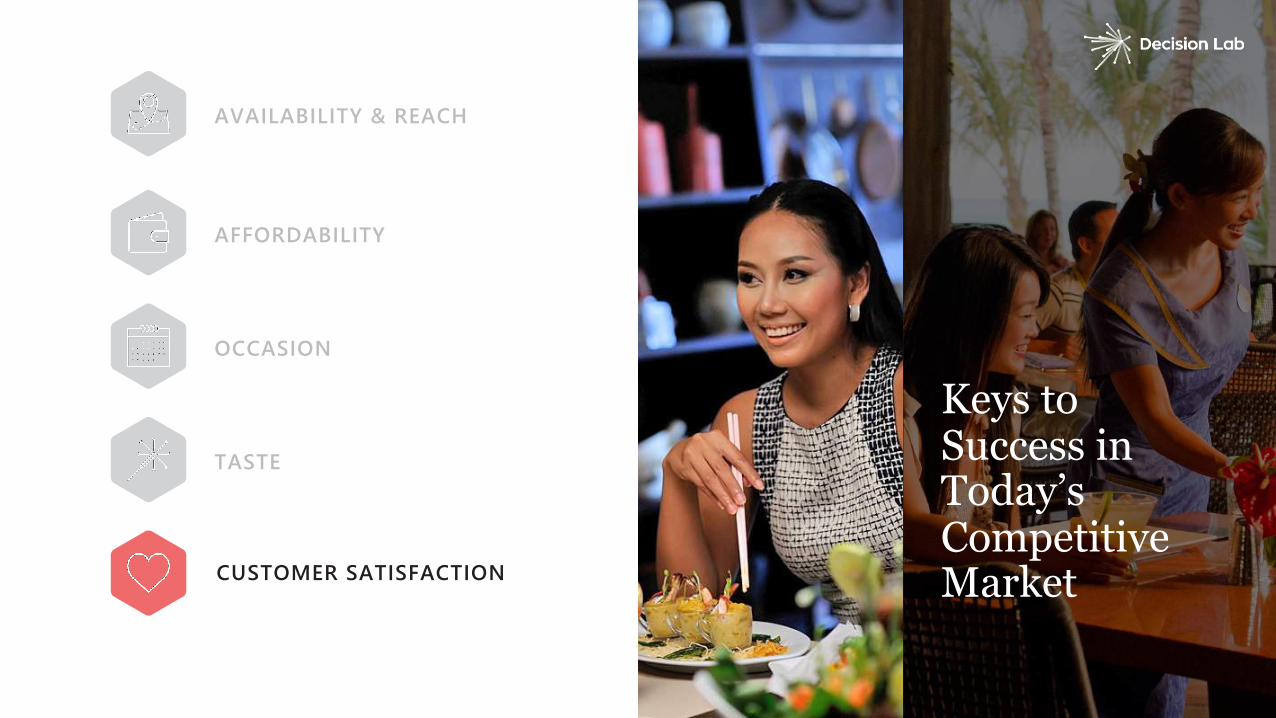
AVAILABILITY & REACH
Keys to Success in Today’s Competitive Market
TASTE
AFFORDABILITY
CUSTOMER SATISFACTION
OCCASION
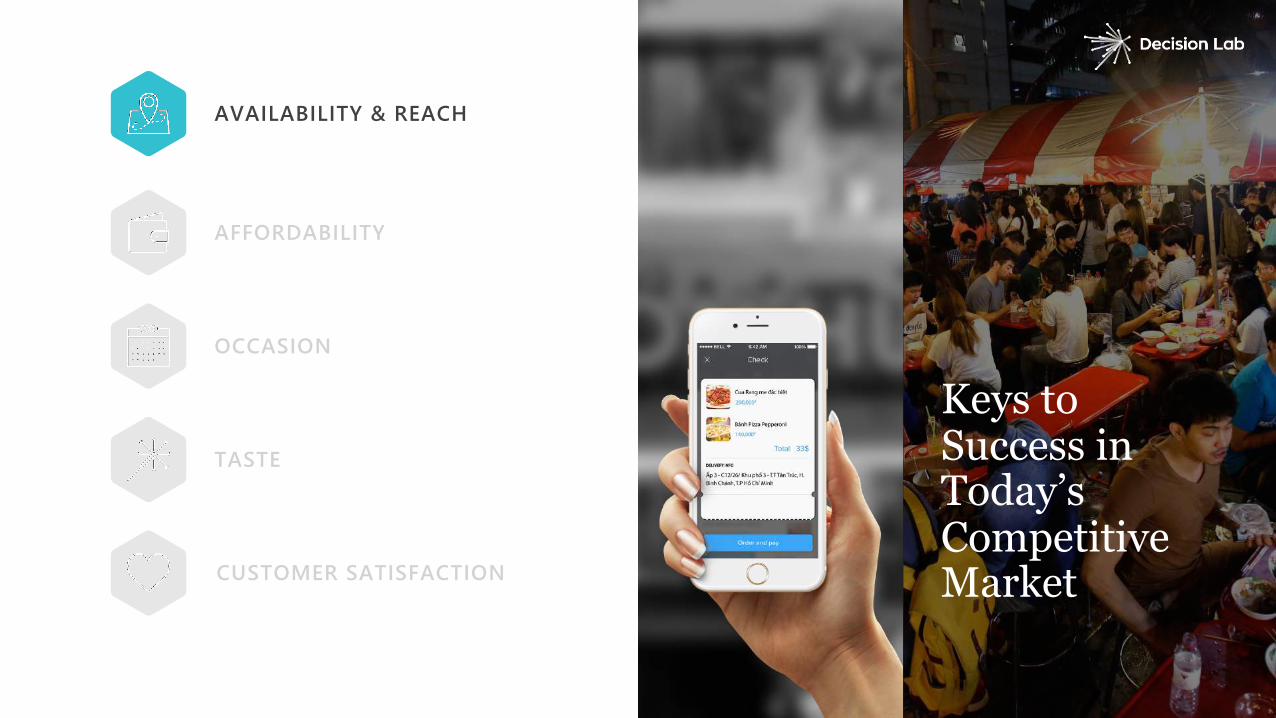
AVAILABILITY & REACH
Keys to Success in Today’s Competitive Market
TASTE
AFFORDABILITY
CUSTOMER SATISFACTION
OCCASION
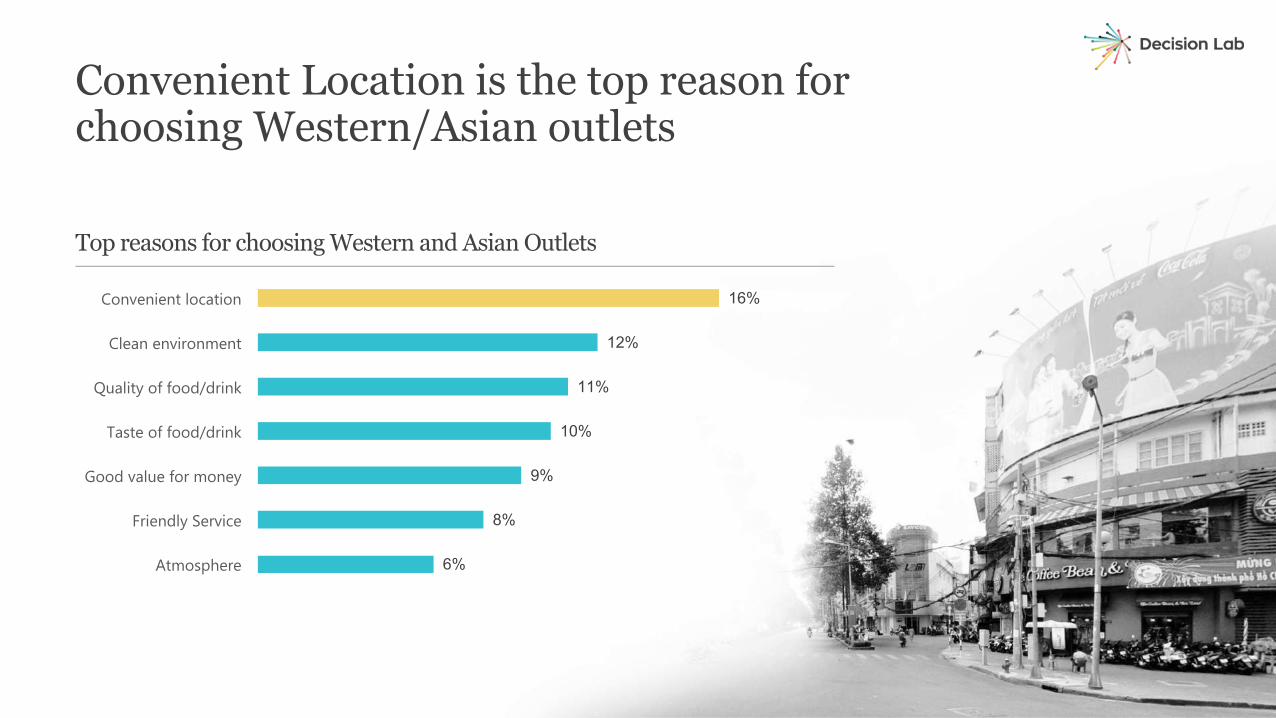
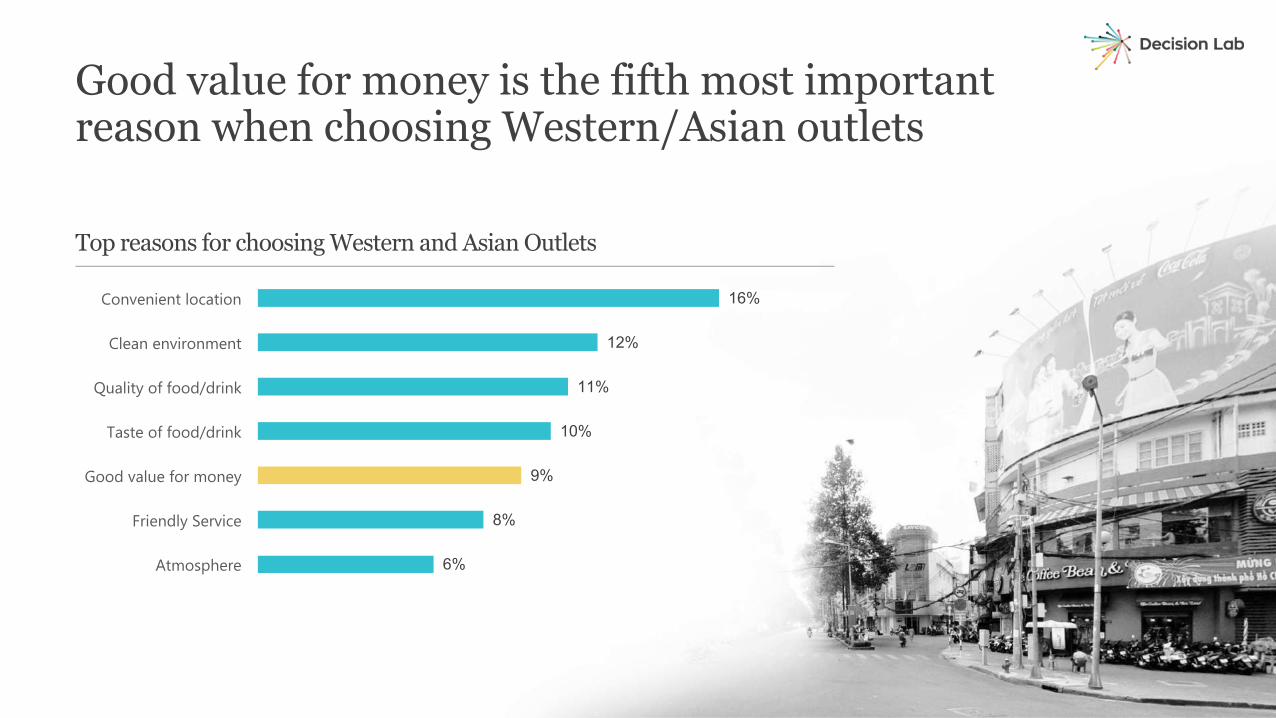
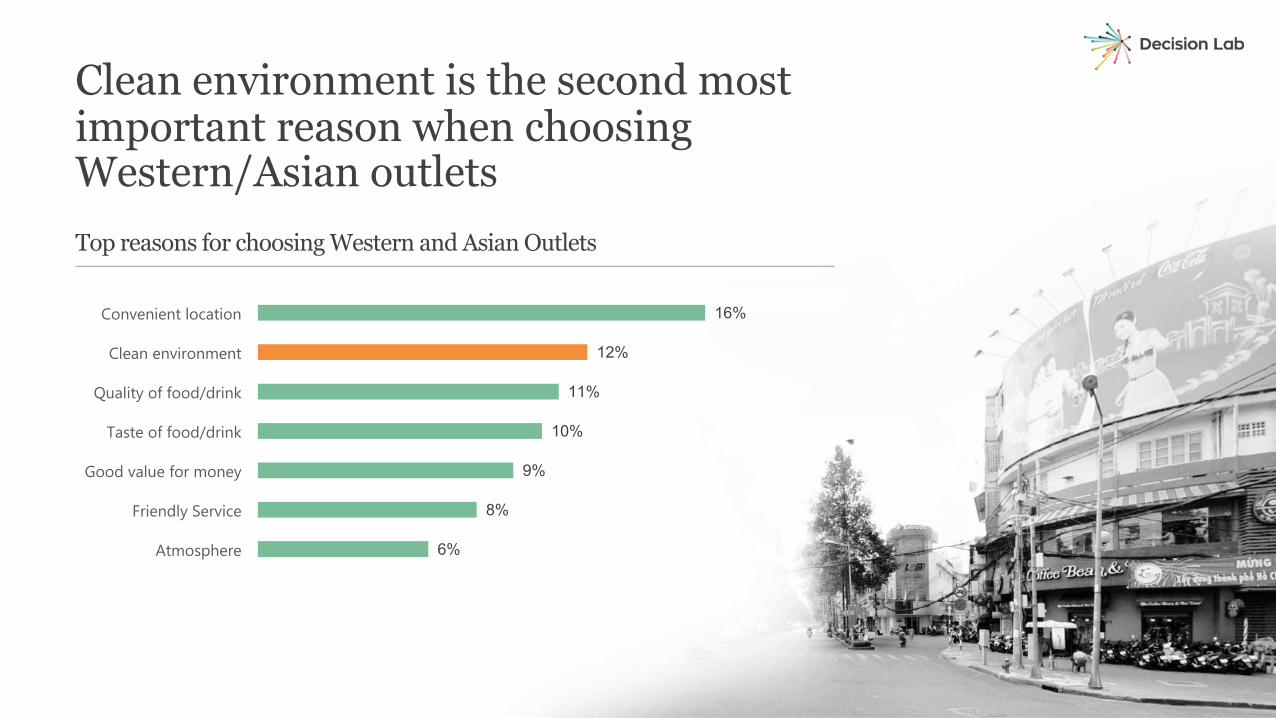
Top reasons for choosing Western and Asian Outlets
Convenient Location is the top reason for choosing Western/Asian outlets
6%
8%
9%
10%
11%
12%
16%
Atmosphere
Friendly Service
Good value for money
Taste of food/drink
Quality of food/drink
Clean environment
Convenient location
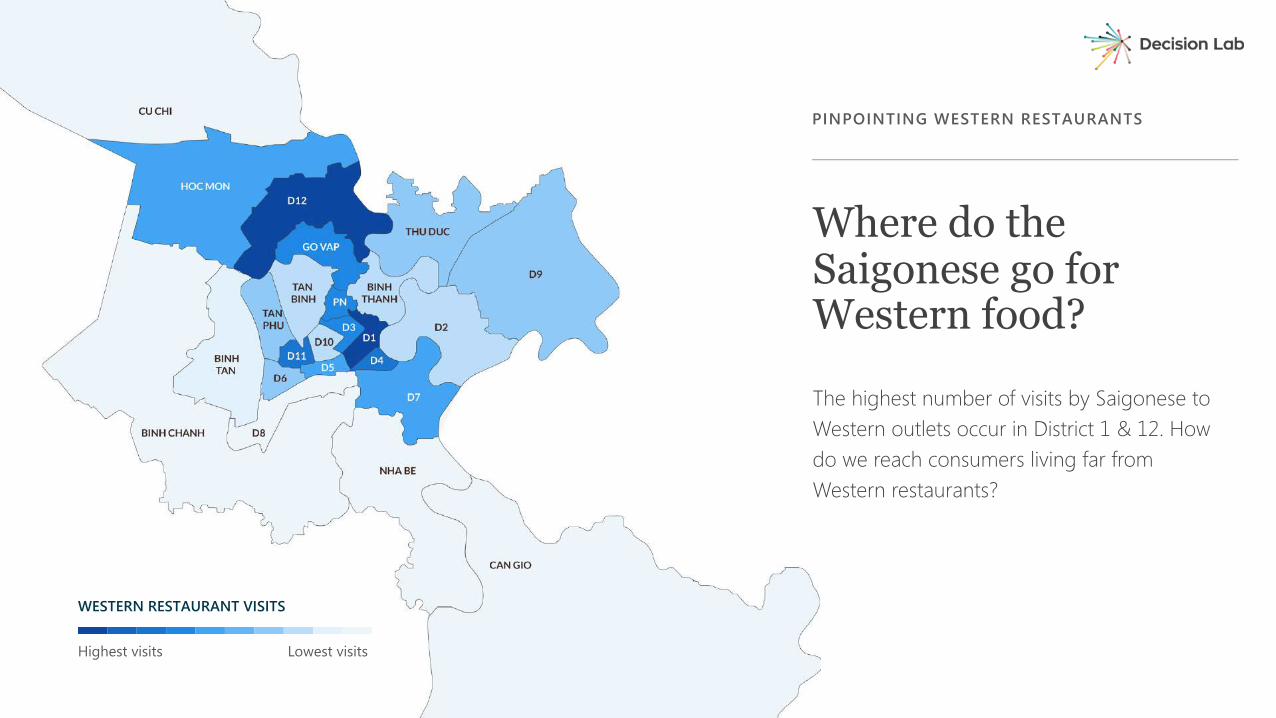
Where do the Saigonese go for Western food?
PINPOINTING WESTERN RESTAURANTS
Highest visits Lowest visits
WESTERN RESTAURANT VISITS
The highest number of visits by Saigonese to Western outlets occur in District 1 & 12. How do we reach consumers living far from Western restaurants?
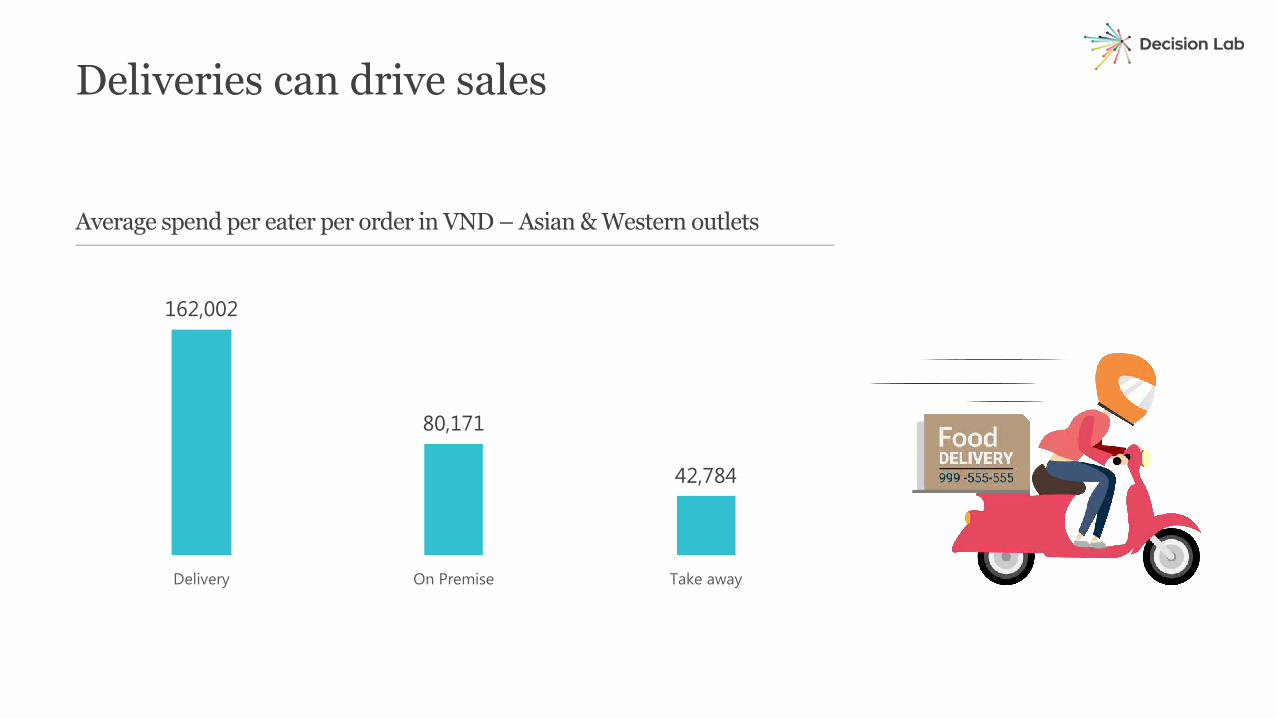
162,002
80,171
42,784
Delivery On Premise Take away
Average spend per eater per order in VND – Asian & Western outlets
Deliveries can drive sales
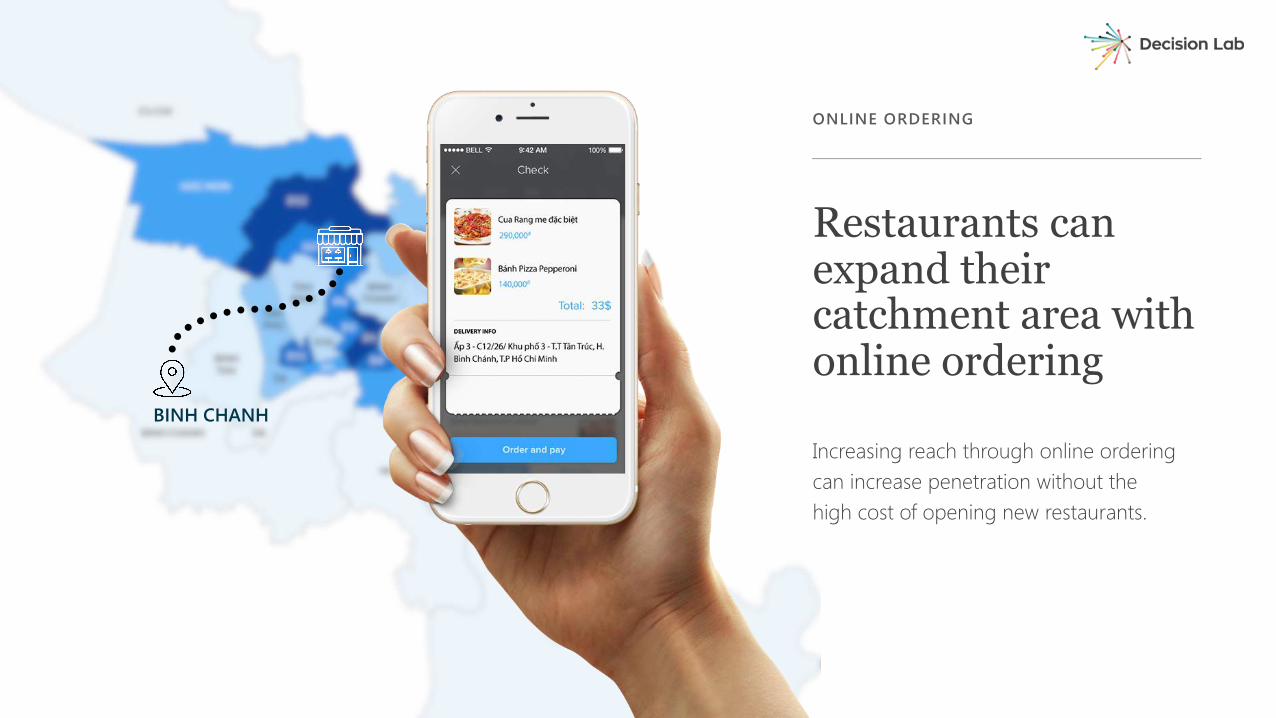
Restaurants can expand their catchment area with online ordering
ONLINE ORDERING
BINH CHANH
Increasing reach through online ordering can increase penetration without the high cost of opening new restaurants.
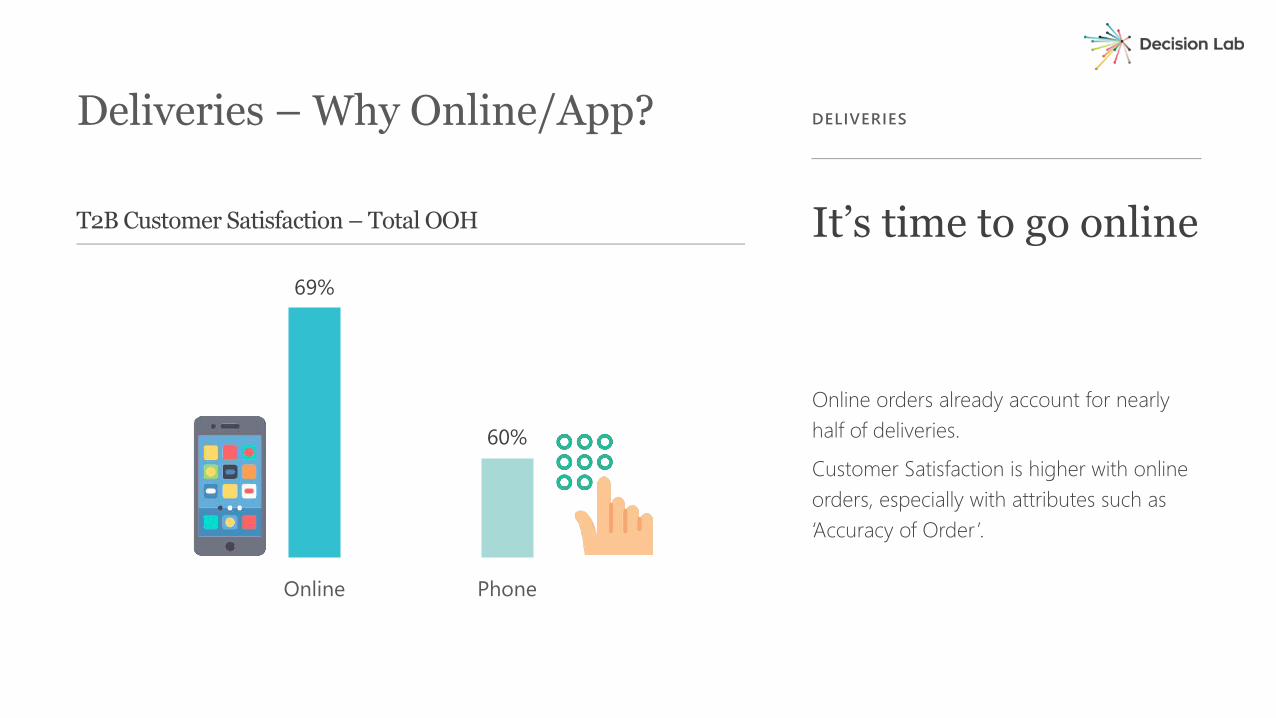
Online orders already account for nearly half of deliveries.
Customer Satisfaction is higher with online orders, especially with attributes such as ‘Accuracy of Order’.
It’s time to go online
DELIVERIESDeliveries – Why Online/App?
69%
60%
Online Phone
T2B Customer Satisfaction – Total OOH
AVAILABILITY & REACH
Keys to Success in Today’s Competitive Market
TASTE
AFFORDABILITY
CUSTOMER SATISFACTION
OCCASION
6%
8%
9%
10%
11%
12%
16%
Atmosphere
Friendly Service
Good value for money
Taste of food/drink
Quality of food/drink
Clean environment
Convenient location
Top reasons for choosing Western and Asian Outlets
Good value for money is the fifth most important reason when choosing Western/Asian outlets
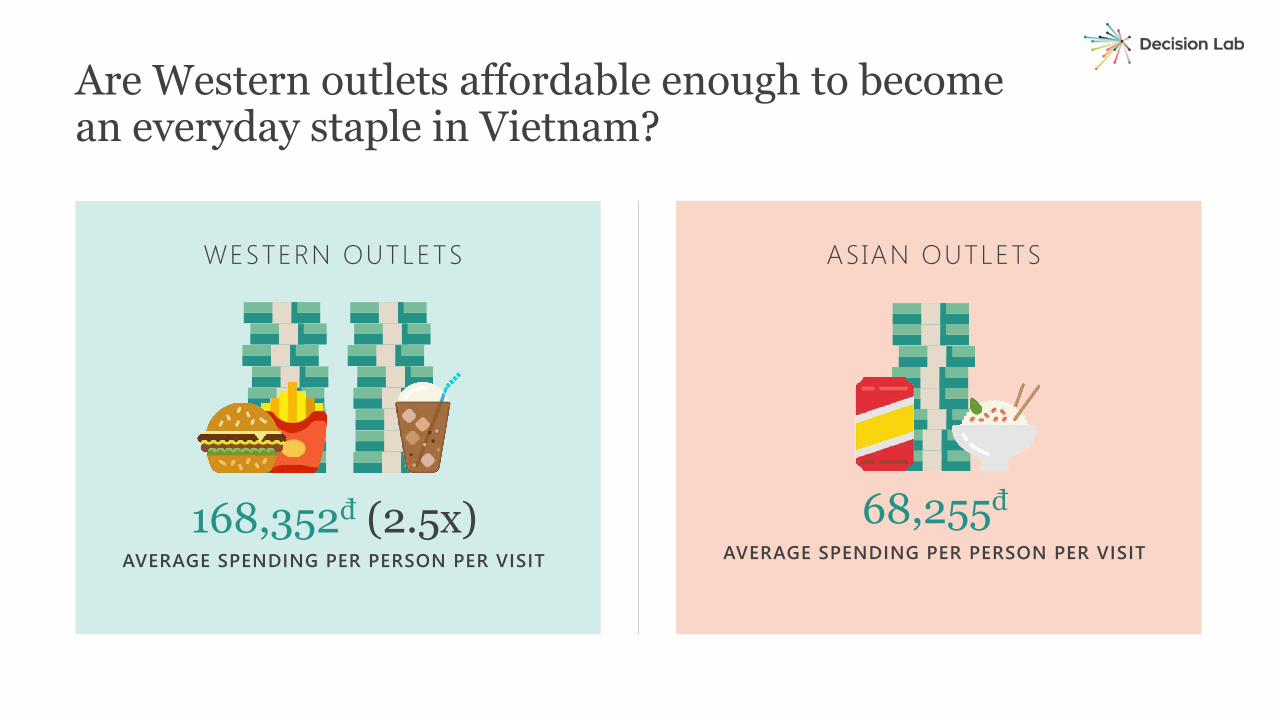
WESTERN OUTLETS
168,352đ (2.5x)AVERAGE SPENDING PER PERSON PER VISIT
ASIAN OUTLETS
68,255đAVERAGE SPENDING PER PERSON PER VISIT
Are Western outlets affordable enough to become an everyday staple in Vietnam?
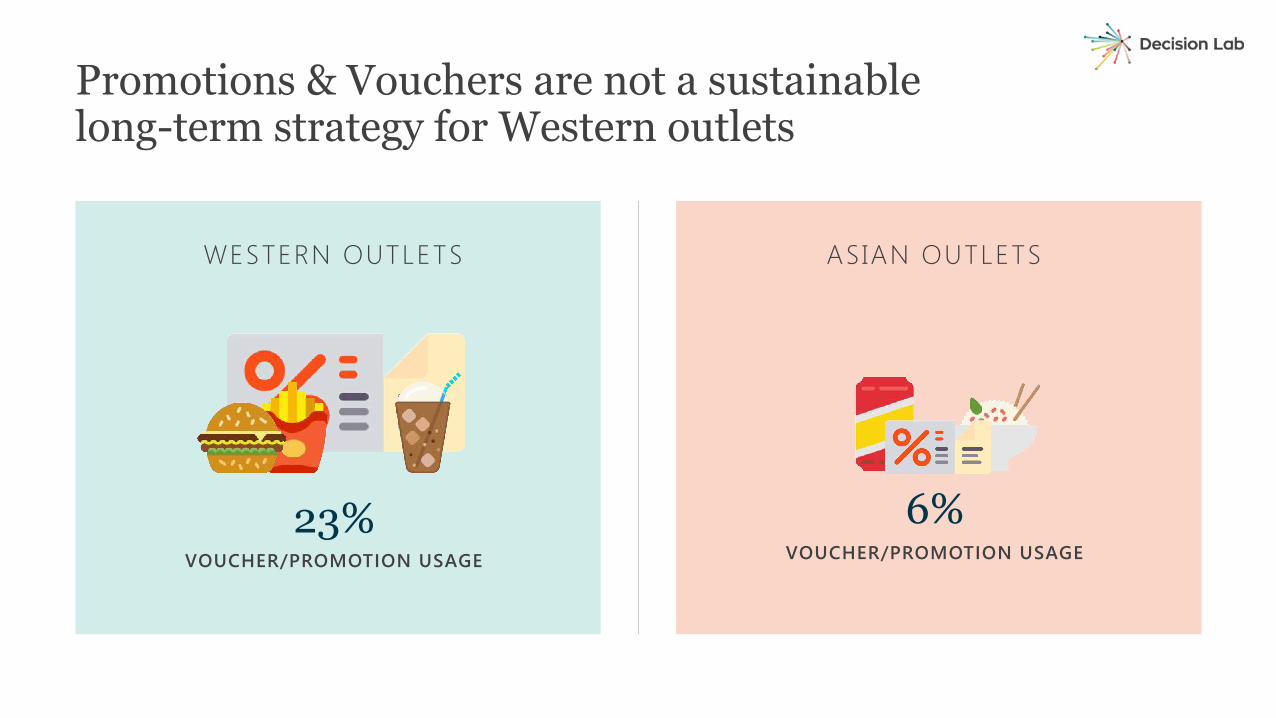
ASIAN OUTLETS
6%VOUCHER/PROMOTION USAGE
WESTERN OUTLETS
23%VOUCHER/PROMOTION USAGE
Promotions & Vouchers are not a sustainable long-term strategy for Western outlets
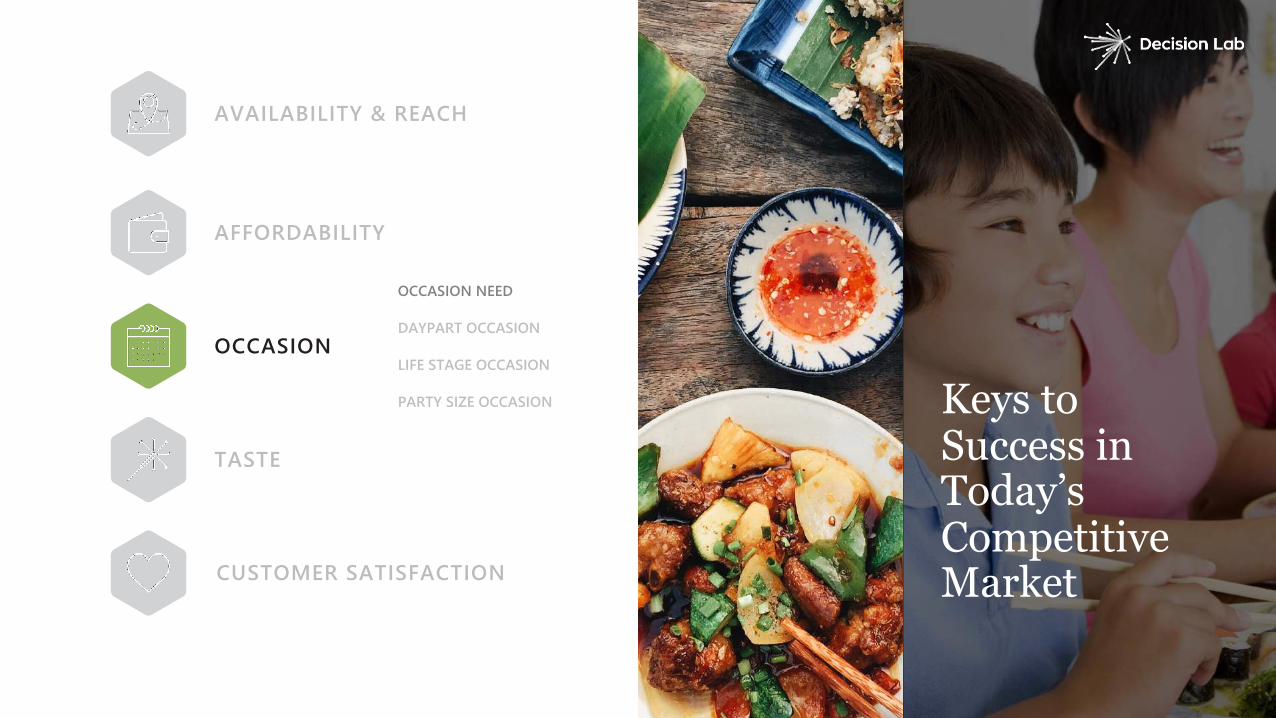
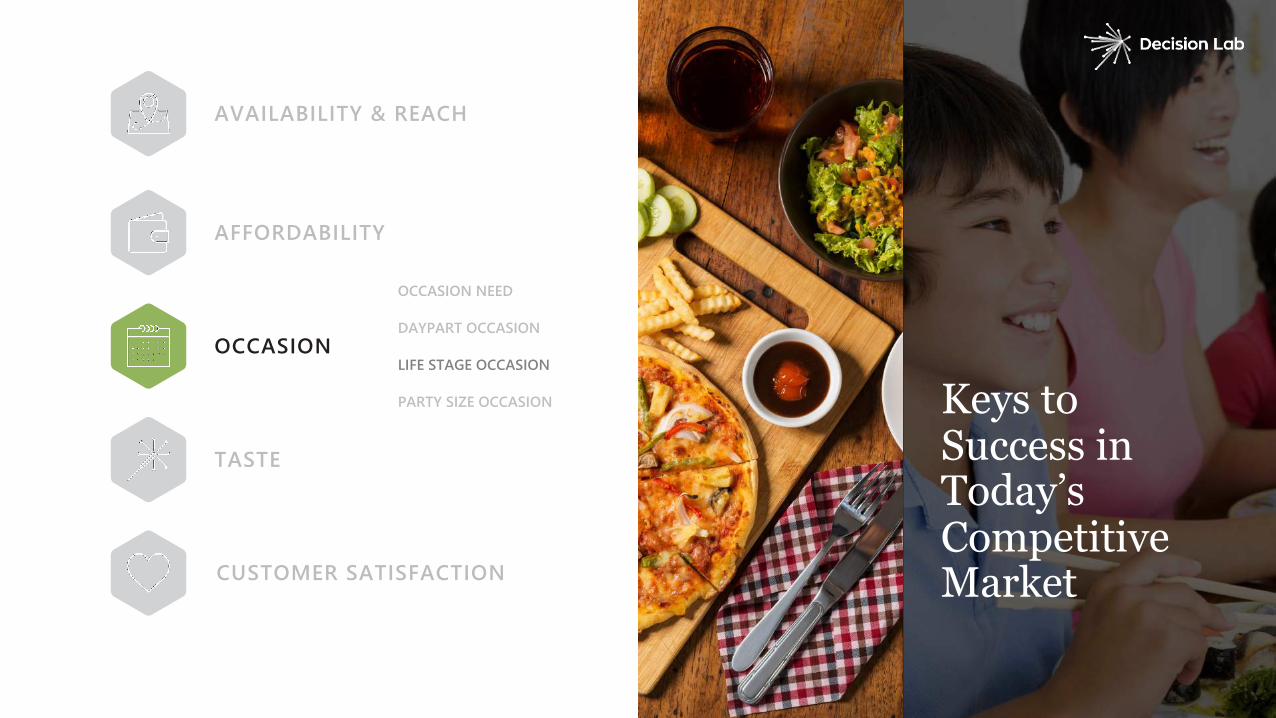
AVAILABILITY & REACH
Keys to Success in Today’s Competitive Market
TASTE
AFFORDABILITY
CUSTOMER SATISFACTION
OCCASION
OCCASION NEED
DAYPART OCCASION
LIFE STAGE OCCASION
PARTY SIZE OCCASION
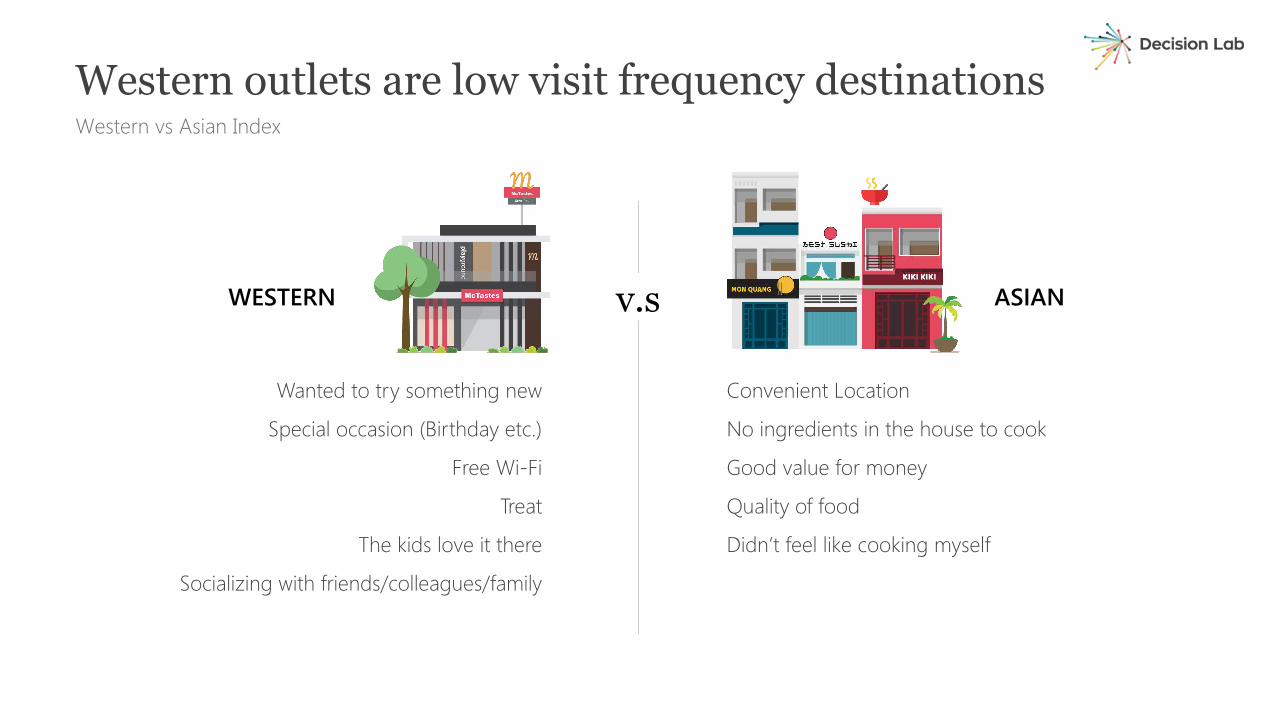
Wanted to try something new
Special occasion (Birthday etc.)
Free Wi-Fi
Treat
The kids love it there
Socializing with friends/colleagues/family
Western vs Asian Index
Convenient Location
No ingredients in the house to cook
Good value for money
Quality of food
Didn’t feel like cooking myself
Western outlets are low visit frequency destinations
v.sWESTERN ASIAN
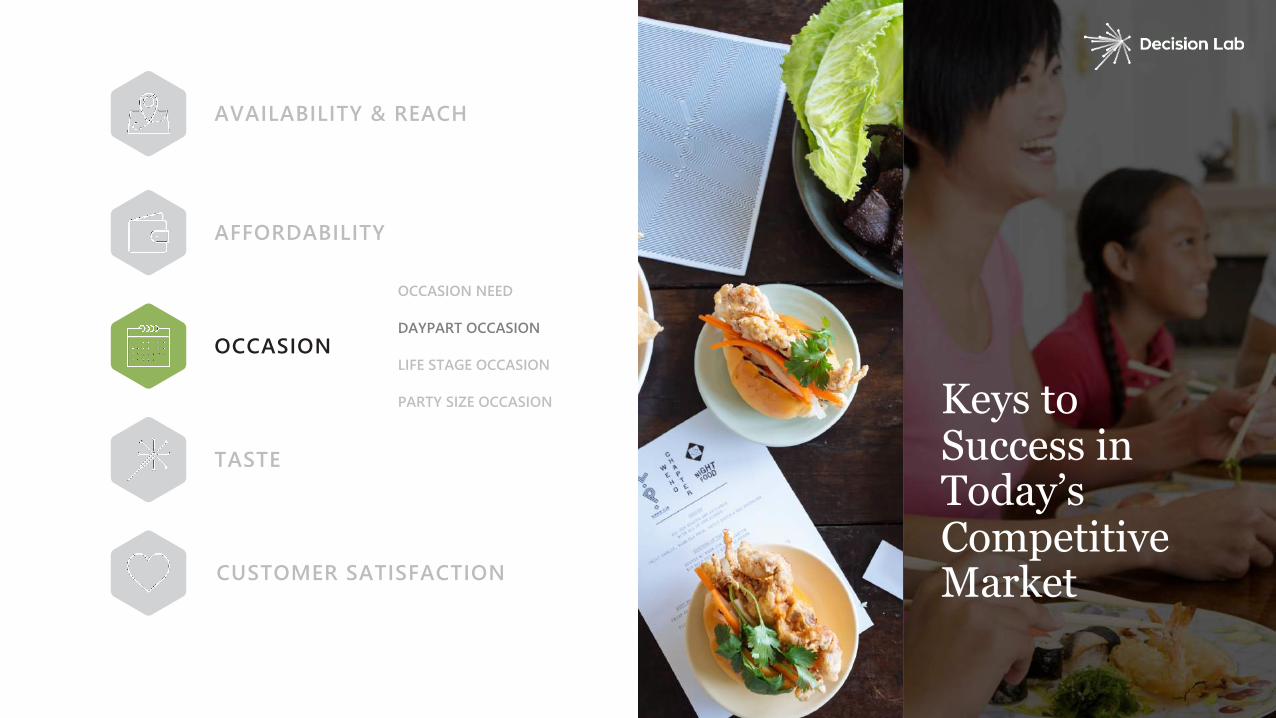
AVAILABILITY & REACH
Keys to Success in Today’s Competitive Market
TASTE
AFFORDABILITY
CUSTOMER SATISFACTION
OCCASION
OCCASION NEED
DAYPART OCCASION
LIFE STAGE OCCASION
PARTY SIZE OCCASION
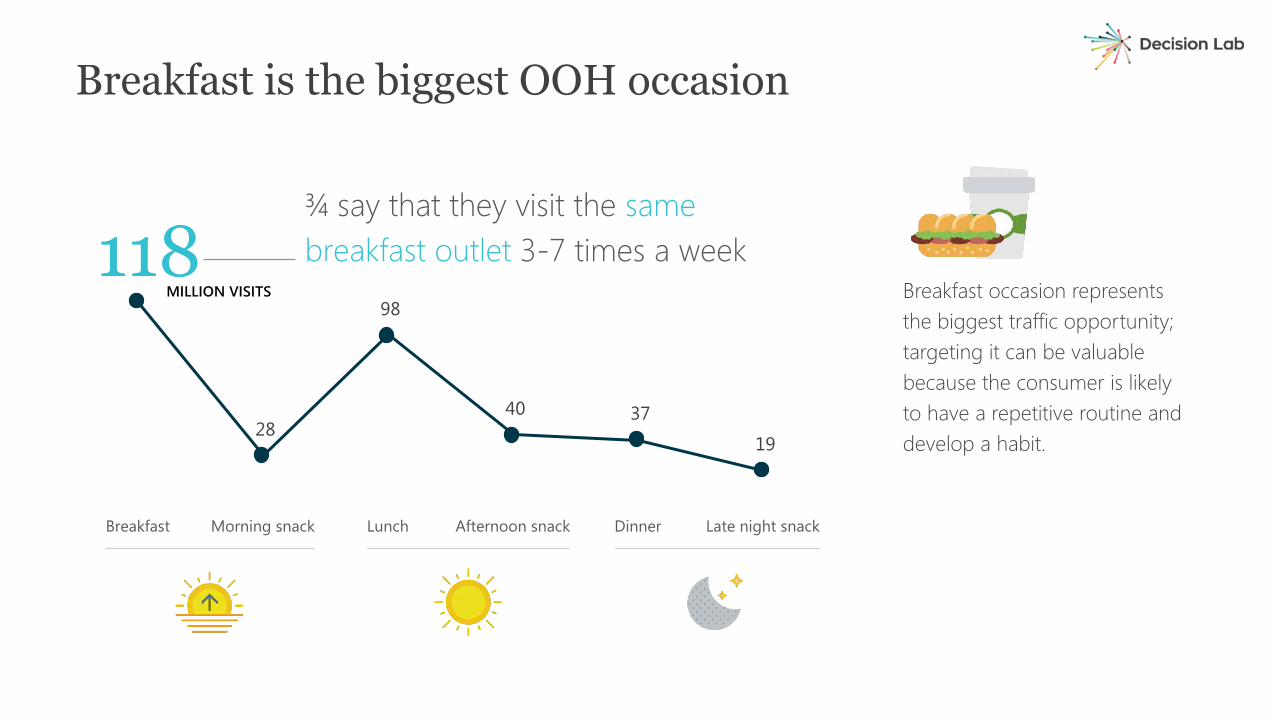
118
28
98
40 37
19
Breakfast Morning snack Lunch Afternoon snack Dinner Late night snack
Breakfast is the biggest OOH occasion
Breakfast occasion represents the biggest traffic opportunity; targeting it can be valuable because the consumer is likely to have a repetitive routine and develop a habit.
¾ say that they visit the same breakfast outlet 3-7 times a week
MILLION VISITS
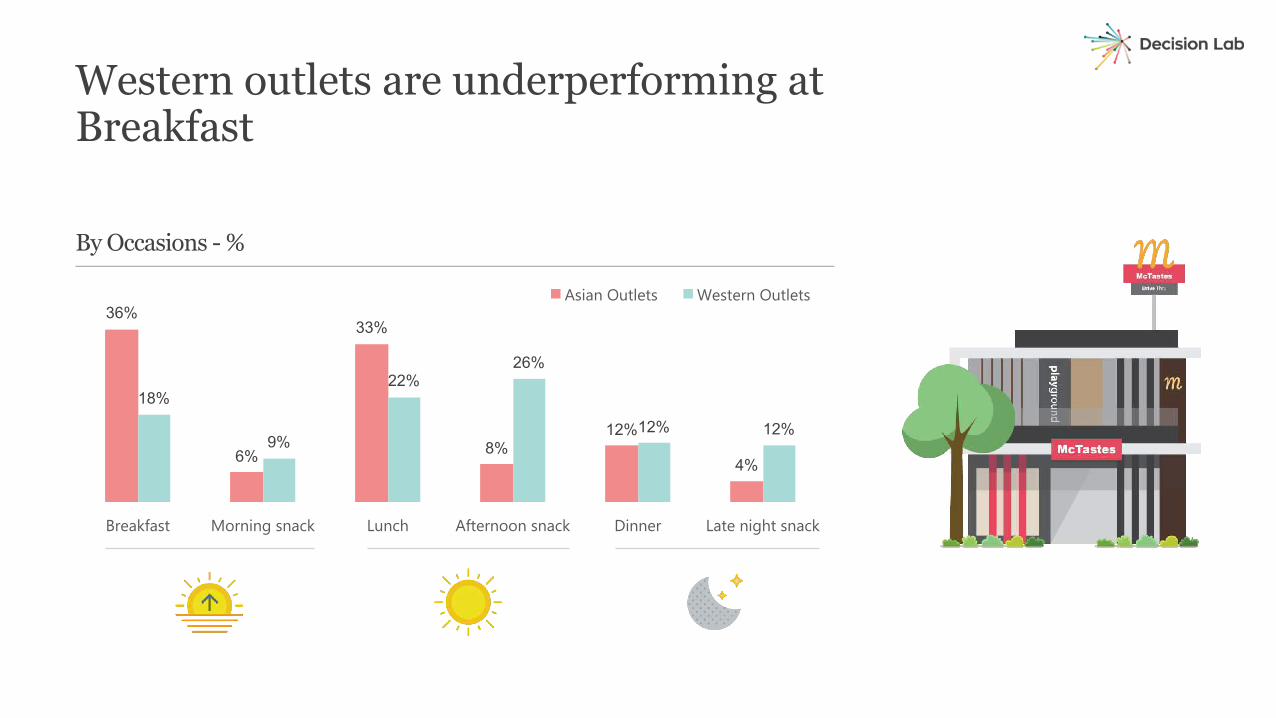
36%
6%
33%
8%12%
4%
18%
9%
22%26%
12% 12%
Breakfast Morning snack Lunch Afternoon snack Dinner Late night snack
Asian Outlets Western Outlets
By Occasions - %
Western outlets are underperforming at Breakfast
AVAILABILITY & REACH
Keys to Success in Today’s Competitive Market
TASTE
AFFORDABILITY
CUSTOMER SATISFACTION
OCCASION
OCCASION NEED
DAYPART OCCASION
LIFE STAGE OCCASION
PARTY SIZE OCCASION
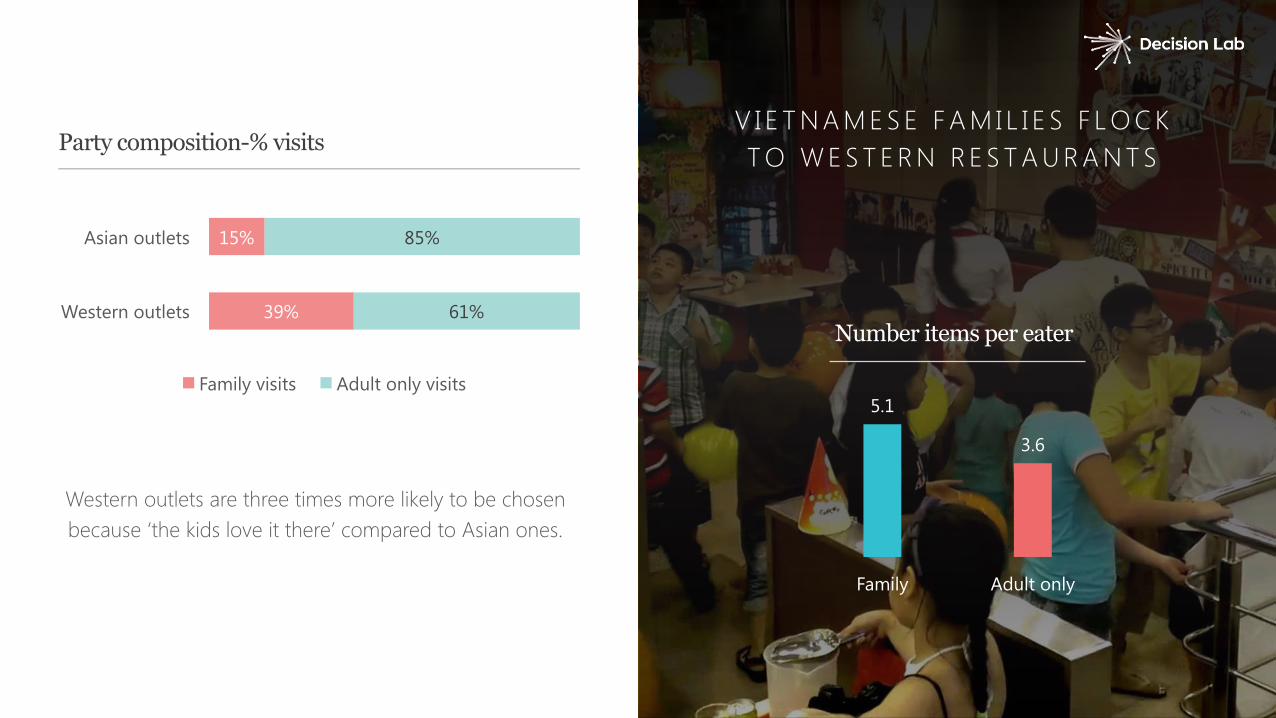
V I E T N A M E S E F A M I L I E S F L O C K T O W E S T E R N R E S T A U R A N T S
Western outlets are three times more likely to be chosen because ‘the kids love it there’ compared to Asian ones.
Party composition-% visits
39%
15%
61%
85%
Western outlets
Asian outlets
Family visits Adult only visits5.1
3.6
Family Adult only
Number items per eater
AVAILABILITY & REACH
Keys to Success in Today’s Competitive Market
TASTE
AFFORDABILITY
CUSTOMER SATISFACTION
OCCASION
OCCASION NEED
DAYPART OCCASION
LIFE STAGE OCCASION
PARTY SIZE OCCASION
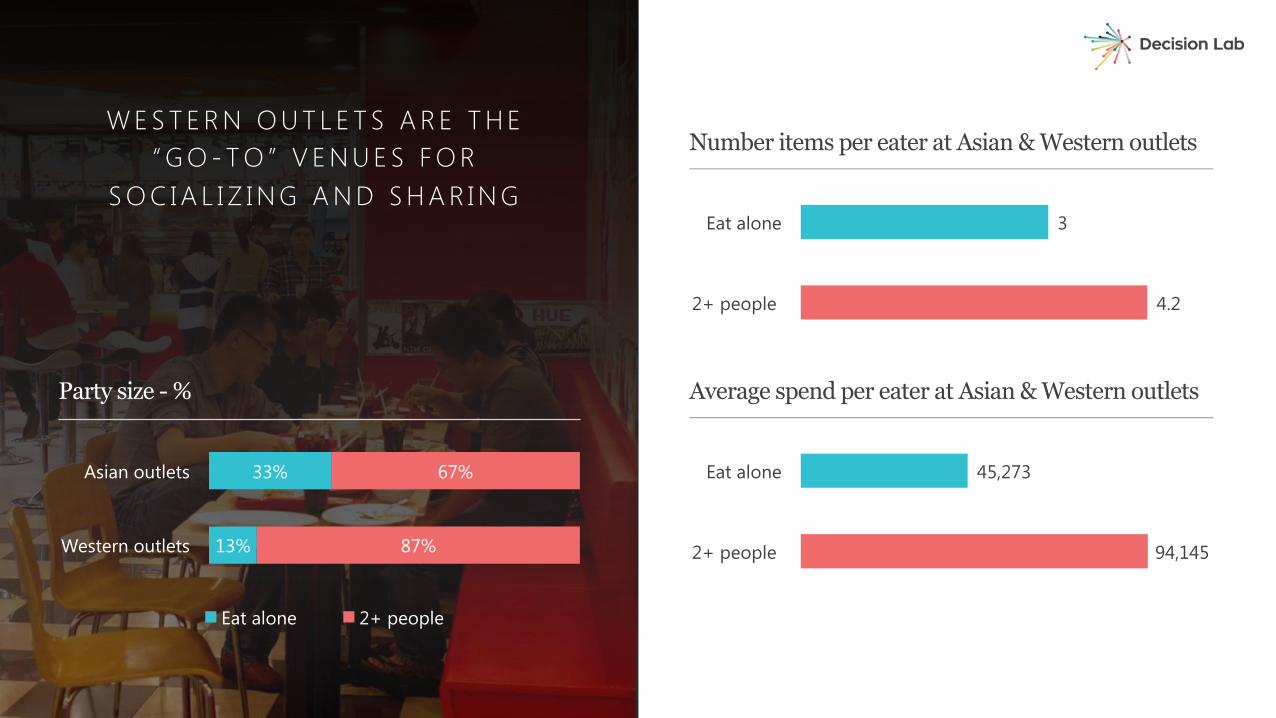
W E S T E R N O U T L E T S A R E T H E “ G O - T O ” V E N U E S F O R
S O C I A L I Z I N G A N D S H A R I N G
Number items per eater at Asian & Western outlets
Party size - %
13%
33%
87%
67%
Western outlets
Asian outlets
Eat alone 2+ people
4.2
3
2+ people
Eat alone
Average spend per eater at Asian & Western outlets
94,145
45,273
2+ people
Eat alone
AVAILABILITY & REACH
Keys to Success in Today’s Competitive Market
TASTE
AFFORDABILITY
CUSTOMER SATISFACTION
OCCASION
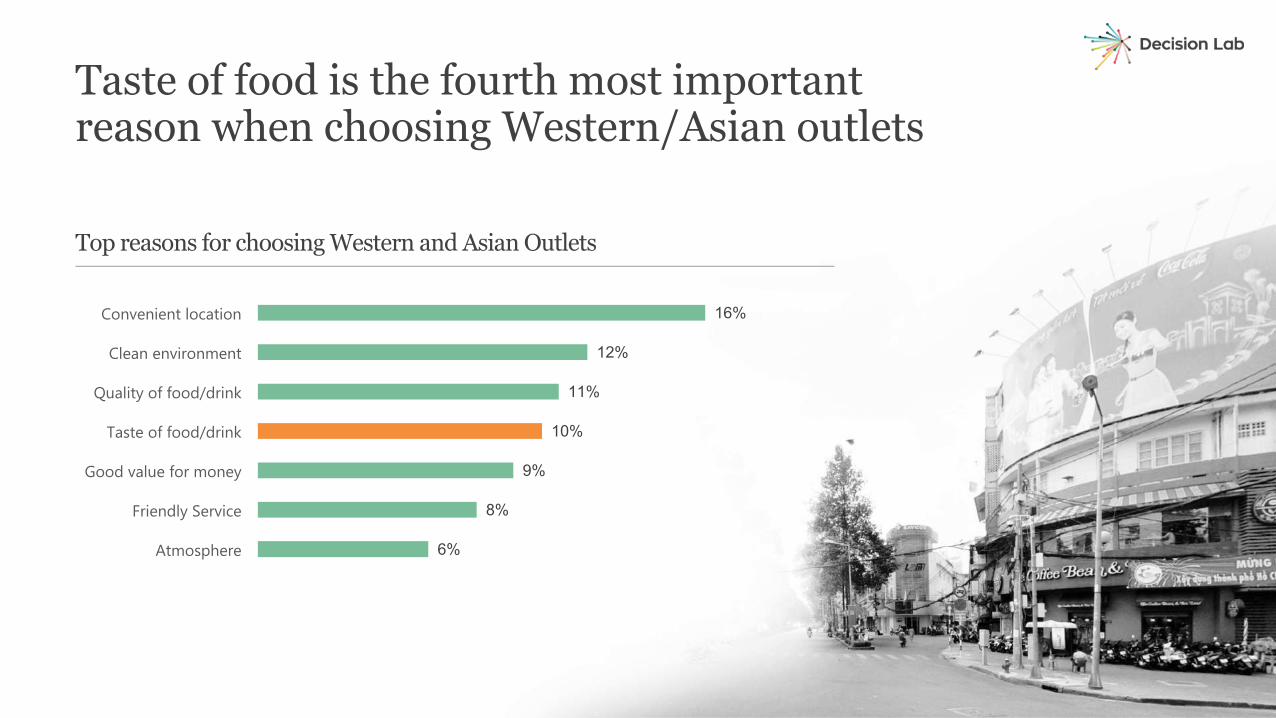
Top reasons for choosing Western and Asian Outlets
Taste of food is the fourth most important reason when choosing Western/Asian outlets
6%
8%
9%
10%
11%
12%
16%
Atmosphere
Friendly Service
Good value for money
Taste of food/drink
Quality of food/drink
Clean environment
Convenient location
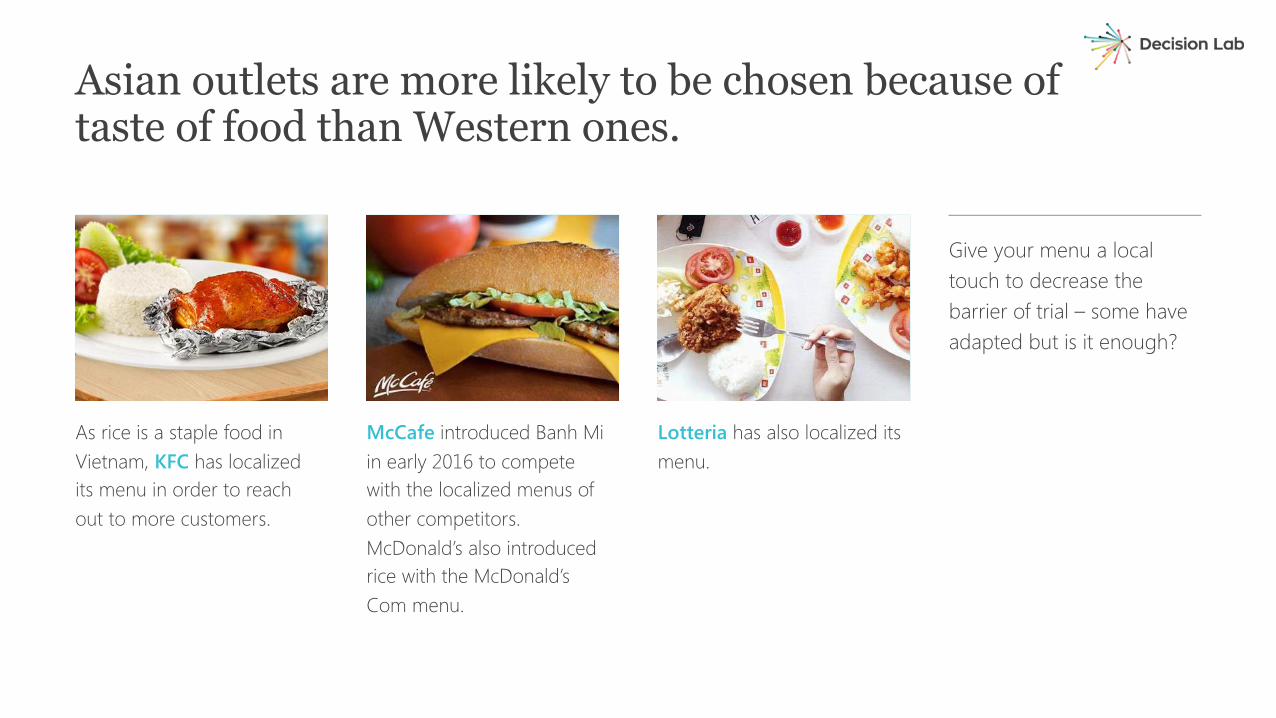
Asian outlets are more likely to be chosen because of taste of food than Western ones.
As rice is a staple food in Vietnam, KFC has localized its menu in order to reach out to more customers.
McCafe introduced Banh Miin early 2016 to compete with the localized menus of other competitors. McDonald’s also introduced rice with the McDonald’s Com menu.
Lotteria has also localized its menu.
Give your menu a local touch to decrease the barrier of trial – some have adapted but is it enough?
AVAILABILITY & REACH
Keys to Success in Today’s Competitive Market
TASTE
AFFORDABILITY
CUSTOMER SATISFACTION
OCCASION
Top reasons for choosing Western and Asian Outlets
Clean environment is the second most important reason when choosing Western/Asian outlets
6%
8%
9%
10%
11%
12%
16%
Atmosphere
Friendly Service
Good value for money
Taste of food/drink
Quality of food/drink
Clean environment
Convenient location
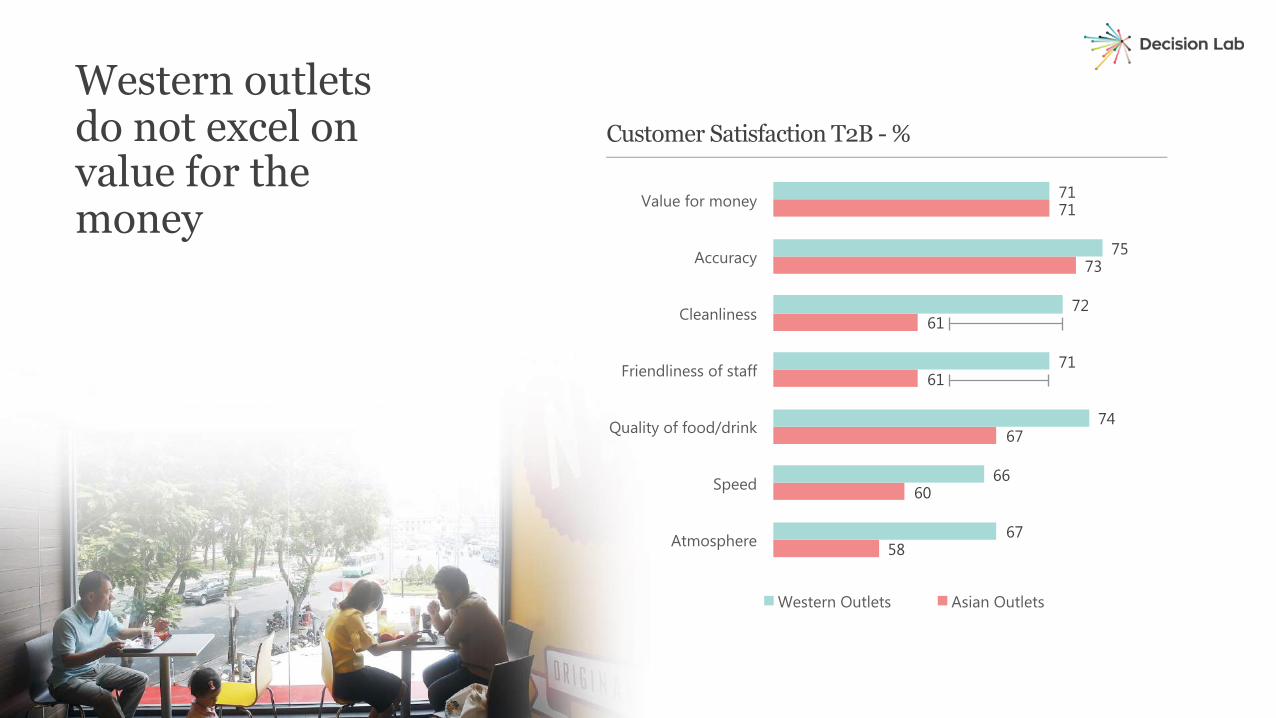
Customer Satisfaction T2B - %
Western outlets do not excel on value for the money
58
60
67
61
61
73
71
67
66
74
71
72
75
71
Atmosphere
Speed
Quality of food/drink
Friendliness of staff
Cleanliness
Accuracy
Value for money
Western Outlets Asian Outlets
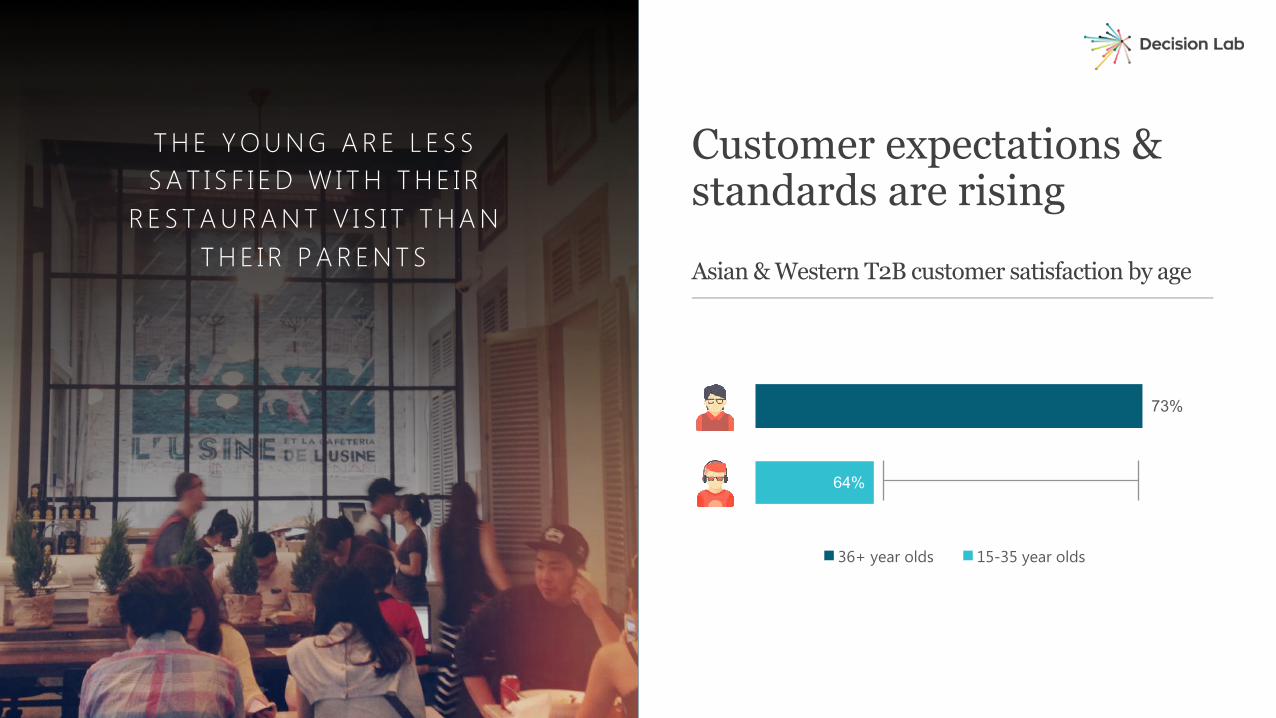
Customer expectations & standards are rising
T H E Y O U N G A R E L E S S S A T I S F I E D W I T H T H E I R
R E S T A U R A N T V I S I T T H A N T H E I R P A R E N T S Asian & Western T2B customer satisfaction by age
64%
73%
36+ year olds 15-35 year olds
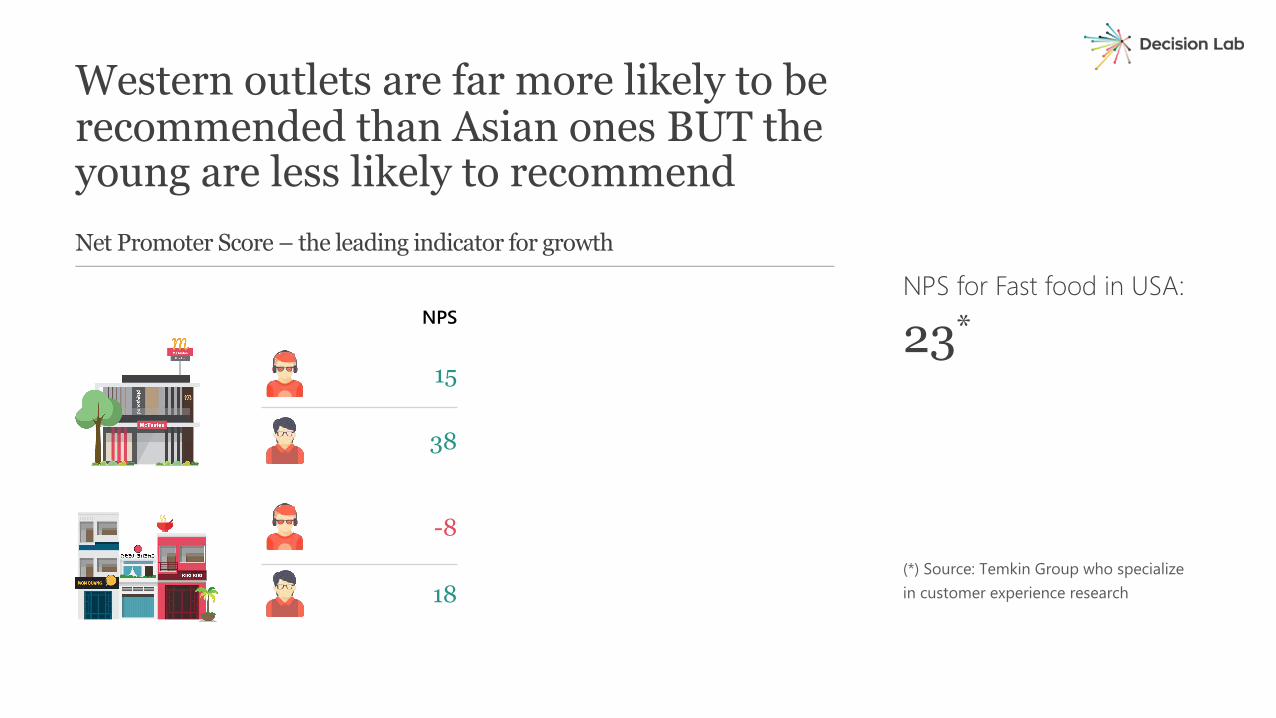
Net Promoter Score – the leading indicator for growth
Western outlets are far more likely to be recommended than Asian ones BUT the young are less likely to recommend
NPS for Fast food in USA:
23*
(*) Source: Temkin Group who specialize in customer experience research
38
NPS
18
15
-8
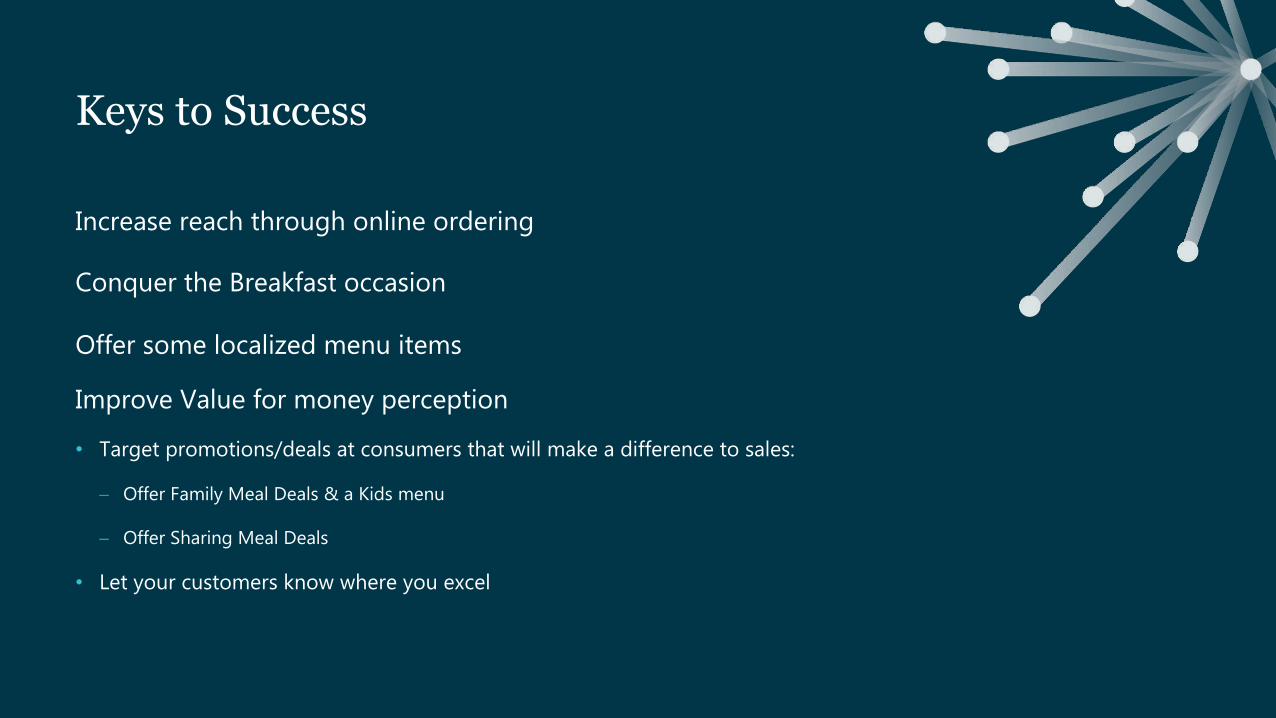
Keys to Success
Increase reach through online ordering
Conquer the Breakfast occasion
Offer some localized menu items
Improve Value for money perception
• Target promotions/deals at consumers that will make a difference to sales:
- Offer Family Meal Deals & a Kids menu
- Offer Sharing Meal Deals
• Let your customers know where you excel
Reach out to us4 4 F L O O R - B I T E X C O F I N A N C I A L T O W E R2 H A I T R I E U , D I S T R I C T 1H O C H I M I N H C I T Y , V I E T N A M
+ 8 4 8 3 9 1 5 1 9 1 9 | D E C I S I O N @ D E C I S I O N L A B . C O W W W . D E C I S I O N L A B . C O


