Embed Size (px)
Citation preview

Outcomes Management, Expected Treatment Response,and Severity-Adjusted Provider Profilingin Outpatient Psychotherapy
�
Wolfgang Lutz
University of Berne
�
Zoran Martinovich
Northwestern University Medical School
�
Kenneth I. Howard
Northwestern University
�
Scott C. Leon
Northwestern University Medical School
To make use of psychotherapy research in practice, therapists need real-time access to valid clinically relevant information about patients. Thedose–effect and phase models of psychotherapy provide a theoreticalbackground for empirically based psychotherapy management by describ-ing the systematic nature of progress in therapy and guiding the selectionof outcome criteria. Given this theoretical background, it is possible toderive appropriate models for monitoring cases in ongoing therapies (patientprofiling) and identifying therapists’ relative strengths and weaknesses(severity-adjusted provider profiling). These applied methods may be used
Parts of this paper were presented at the 17th World Congress of Psychotherapy, Warsaw, Poland, August, 1998and at the 30th annual meeting of the Society for Psychotherapy Research, Braga, Portugal, 1999.This work was supported partially by grants RO1 MH42901 and KO5 MH00924 from the National Institute ofMental Health and by grants from the German Research Foundation (DFG) - LU 66011–1 and the SwissNational Science Foundation, Nr. 83R-062710 and Nr. 1114-064 884.01 (to WL).We are grateful for the counsel of Dr. Grant Grissom, and for the statistical work of Bruce Briscoe and LauraDietzen.Correspondence concerning this article should be addressed to: Wolfgang Lutz, Department of Psychology,University of Berne, Muesmattstr. 45, CH-3012 Berne 9, Switzerland; e-mail: [email protected].
JOURNAL OF CLINICAL PSYCHOLOGY, Vol. 58(10), 1291–1304 (2002) © 2002 Wiley Periodicals, Inc.
Published online in Wiley InterScience (www.interscience.wiley.com). DOI: 10.1002/jclp.10070
to inform decision making in ongoing psychotherapies and to supportsupervision and clinical training. © 2002 Wiley Periodicals, Inc. J ClinPsychol 58: 1291–1304, 2002.
Keywords: patient-focused research; growth curve models; outcomesmanagement; expected treatment response; therapist performance
Approaches to Psychotherapy Research
Current approaches in psychotherapy research may be described broadly as either treat-ment focused or patient focused (Howard, Moras, Brill, Martinovich, & Lutz, 1996).Treatment-focused research is intended to provide information that can guide initial treat-ment selection. The treatment-focused research strategy commonly referred to as efficacyresearch is concerned with demonstrating that a treatment can be shown to work undercontrolled circumstances. The preferred efficacy methodology is the randomized clinicaltrial, in which cases randomly assigned to a treatment group are demonstrated to showbetter outcomes, on average, than cases assigned to an appropriate control group. Byconvention, given independent replications of positive clinical trial results, a treatmentmay be described as empirically supported.
A second form of treatment-focused research is called effectiveness research. Effec-tiveness research is concerned with demonstrating that a treatment actually works inclinical practice. The preferred research methodology is a systematic, naturalistic, quasi-experimental design in which patients and therapists usually are free to select their owntreatments.
Patient-focused research, by contrast, is concerned with the question, “Is this patient’scondition responding to the treatment that is being applied?” In practice, given that thepatient has sought amelioration of some (appropriate) malady, it is the clinician’s profes-sional responsibility to provide a treatment that will provide this amelioration. It is notsufficient for the practitioner to know that a particular treatment can work (efficacy) ordoes work (effectiveness) on the average. The practitioner needs to select the most prom-ising treatment for the particular patient (e.g., at least one to which the patient is notallergic) and then determine whether the selected treatment is providing sufficient ben-efit to that patient. In order to make such assessments, the clinician must have access tovalid, systematic, and relevant information about the patient’s condition (i.e., informationabout the clinical characteristics and status of the patient’s condition during the course oftreatment)—in other words, information based on patient-focused research (Howard et al.,1996).
Patient-focused research has its theoretical origin in the dosage and the phase modelsof psychotherapy. These two models also constitute a background for quality assurance inpsychotherapy and for an empirically based psychotherapy management. Patient-focusedresearch evolved over three stages:
1. The development of a theoretical model to describe progress in therapy;
2. The development of measurement strategies to assess psychotherapeutic progressaccording to the theoretical models; and
3. The development of appropriate statistical techniques for predicting the individ-ual patient’s response to treatment (Howard et al., 1996; Lutz, Martinovich, &Howard, 1999).
1292 Journal of Clinical Psychology, October 2002
In the present work, these three steps are discussed, and then a new application for theseconcepts—data-based provider profiling—is described.
Stage 1: The Development of Models of Change
Two models—the dosage and phase models—comprise the theoretical backbone of patientprofiling. In the dosage model, patient improvement is hypothesized to occur as a log-linear function of treatment sessions, with greater improvement occurring earlier in ther-apy and then slowly decelerating over time. On the basis of a meta-analysis, Howard andcolleagues (Howard, Kopta, Krause, & Orlinsky, 1986) empirically validated the dosagemodel of psychotherapeutic effectiveness by demonstrating a positive relationship withdiminishing returns between the log of the number of sessions (dose) and the normalizedprobability of patient improvement (effect). In subsequent research, the dose–effect rela-tionship was observed for different symptoms (Barkham, Rees, & Stiles, 1996; Kopta,Howard, Lowry, & Beutler, 1994), interpersonal problems (Maling, Gurtman, & How-ard, 1995), and diagnoses (Howard et al., 1986; Pilkonis & Frank, 1988). The dosagemodel also may be taken to explain the spontaneous remission rate reported by Eysenck(1952). A re-analysis of Eysenck’s data based on the dosage model (McNeilly & Howard,1991) showed that the impact of a few months of psychotherapy was equal to the impactof two years of all other forms of help available to an individual (arguably, spontaneousremission was defined effectively as such in Eysenck’s controversial report).
The phase model of psychotherapeutic improvement emerged as an explanation ofthe dosage model. This model hypothesized that recovery occurs over three distinct andsequential phases (Howard, Lueger, Mailing, & Martinovich, 1993). First, the remoral-ization phase occurs as the patient experiences greater well being. In the remediationphase, symptoms begin to ameliorate. Finally, in the rehabilitation phase, patients expe-rience an improvement in domains of life functioning. An early and rapid remoralizingresponse may be seen as driving the often seen log-linear response pattern in psychother-apy. Because most outcome measures are influenced to varying degrees by individualdifferences in acute distress, the log-linear pattern occurs with varying strength amongmeasures differing on the number of items primarily tapping acute distress and wellbeing.
Stage 2: The Development of Measurement Strategies toAssess Psychotherapeutic Progress
The COMPASS tracking system (Howard, Brill, Lueger, O’Mahoney, & Grissom, 1995;Sperry, Brill, Howard, & Grissom, 1996; Lueger et al., 2001) is one of a number ofcomprehensive-assessment batteries that has been used to measure progress in outpatientmental-health treatment. The tracking system includes both patient and clinician assess-ments of a range of phase-relevant outcomes and has been applied to a diverse nationalsample of therapists and psychotherapy patients to support the monitoring and manage-ment of their treatments. Validity and reliability coefficients for the COMPASS scales aresatisfactory (Howard et al., 1995; Sperry et al., 1996). The tracking system includes aglobal outcome criterion, the Mental Health Index (MHI), which consists of the sum ofthe Subjective Well-being scale, the Current Symptoms scale, and the Current Life-Functioning scale. On the Subjective Well-being scale, patients rate their overall distresslevel, health, energy level, emotional adjustment, life satisfaction, and everyday func-tioning. This scale was developed to capture the progress in the remoralization phase.The Current Symptoms scale is a 40-item scale in which subjects rate the frequency of
Outcomes Management 1293
symptoms experienced over the past two weeks. It reflects the DSM-III-R diagnoses ofadjustment disorder, anxiety, bipolar, depression, obsessive compulsive, phobia, and sub-stance abuse. This scale was designed to measure progress in the remediation phase. TheCurrent Life-Functioning scale is a 24-item inventory in which subjects rate the extent towhich emotional and psychological difficulties are interfering with functioning in sixmain areas (e.g., work, family, self-management). This scale was developed to assessprogress in the rehabilitation phase.
The Mental Health Index is T-score scaled, with a mean of 50 and a standard devi-ation of 10 at a first psychotherapy appointment. People with MHI T-scores below 60 areconsiderably more likely to have scores representative of a patient population rather thana non-patient population (i.e., would be considered to be outside the normal range, thusmeeting a treatment criterion of medical necessity—see Jacobson & Truax, 1991).
Stage 3: The Development of a Model of Expected Treatment Response(Patient Profiling)
The dosage and phase models represent the process of recovery in psychotherapy for anaverage patient. These models rely on group data to provide outcome information for anaverage patient. However, research has shown that patterns of improvement for individ-uals vary greatly from the general trend (Barkham, Stiles, & Shapiro, 1993; Kadera,Lambert, & Andrews, 1996; Krause, Howard, & Lutz, 1998; Martinovich, 1998;). Obvi-ously, not every patient has the same expected outcome or expected course of treatment.In order to accommodate this individuality, patient profiling was developed to estimatean expected course of recovery for individual patients based on their initial clinicalcharacteristics.
If we assume an underlying log-linear course of recovery from illness, each patient’scourse over treatment can be modeled as a function of session number. More specifically,patient profiling uses a hierarchical linear-modeling strategy (Bryk & Raudenbush, 1992;Lutz et al., 1999) to model a patient’s change over treatment as a log-linear function ofsession number. Seven pretreatment clinical characteristics were used to predict a patient’scourse of treatment. The seven pretreatment predictors were:
1. Subjective Well Being;
2. Current Symptoms;
3. Current Life Functioning;
4. Global Assessment of Functioning (GAF; Endicott, Spitzer, Fleiss, & Cohen, 1976);
5. Past use of therapy;
6. Duration of problem; and
7. Treatment Expectations (Lutz et al., 1999; Lutz, Lowry, Kopta, Einstein, & How-ard, 2001; Leon, Kopta, Howard, & Lutz, 1999).
Using the results (prediction weights) of such an individualized growth-curve analysisfor a large sample of outpatients in psychotherapy, a single patient’s course of treatmentcan be predicted as soon as his/her intake information is available. By using an ipsativeapproach to outcomes management, therapy expectations and effectiveness can be assessedfor a single patient by tracking the patient’s actual progress in comparison to his/herexpected progress based on the seven pretreatment clinical characteristics.
Figures 1 and 2 present sample cases, with observed data—the 25th percentile fail-ure boundary, and normal range boundary represented as percentile ranks based on patient
1294 Journal of Clinical Psychology, October 2002
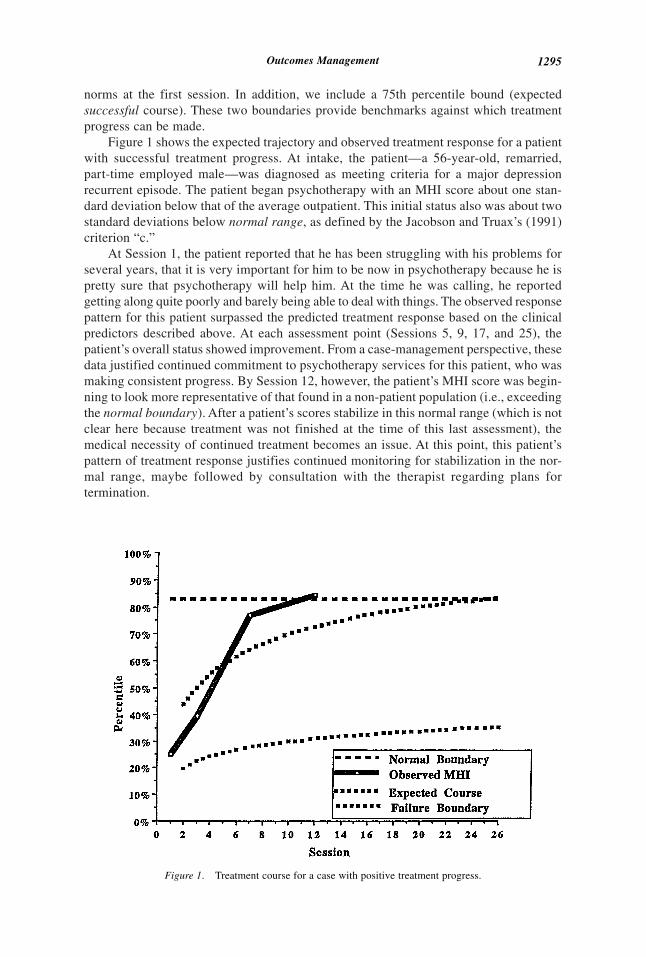
norms at the first session. In addition, we include a 75th percentile bound (expectedsuccessful course). These two boundaries provide benchmarks against which treatmentprogress can be made.
Figure 1 shows the expected trajectory and observed treatment response for a patientwith successful treatment progress. At intake, the patient—a 56-year-old, remarried,part-time employed male—was diagnosed as meeting criteria for a major depressionrecurrent episode. The patient began psychotherapy with an MHI score about one stan-dard deviation below that of the average outpatient. This initial status also was about twostandard deviations below normal range, as defined by the Jacobson and Truax’s (1991)criterion “c.”
At Session 1, the patient reported that he has been struggling with his problems forseveral years, that it is very important for him to be now in psychotherapy because he ispretty sure that psychotherapy will help him. At the time he was calling, he reportedgetting along quite poorly and barely being able to deal with things. The observed responsepattern for this patient surpassed the predicted treatment response based on the clinicalpredictors described above. At each assessment point (Sessions 5, 9, 17, and 25), thepatient’s overall status showed improvement. From a case-management perspective, thesedata justified continued commitment to psychotherapy services for this patient, who wasmaking consistent progress. By Session 12, however, the patient’s MHI score was begin-ning to look more representative of that found in a non-patient population (i.e., exceedingthe normal boundary). After a patient’s scores stabilize in this normal range (which is notclear here because treatment was not finished at the time of this last assessment), themedical necessity of continued treatment becomes an issue. At this point, this patient’spattern of treatment response justifies continued monitoring for stabilization in the nor-mal range, maybe followed by consultation with the therapist regarding plans fortermination.
Figure 1. Treatment course for a case with positive treatment progress.
Outcomes Management 1295
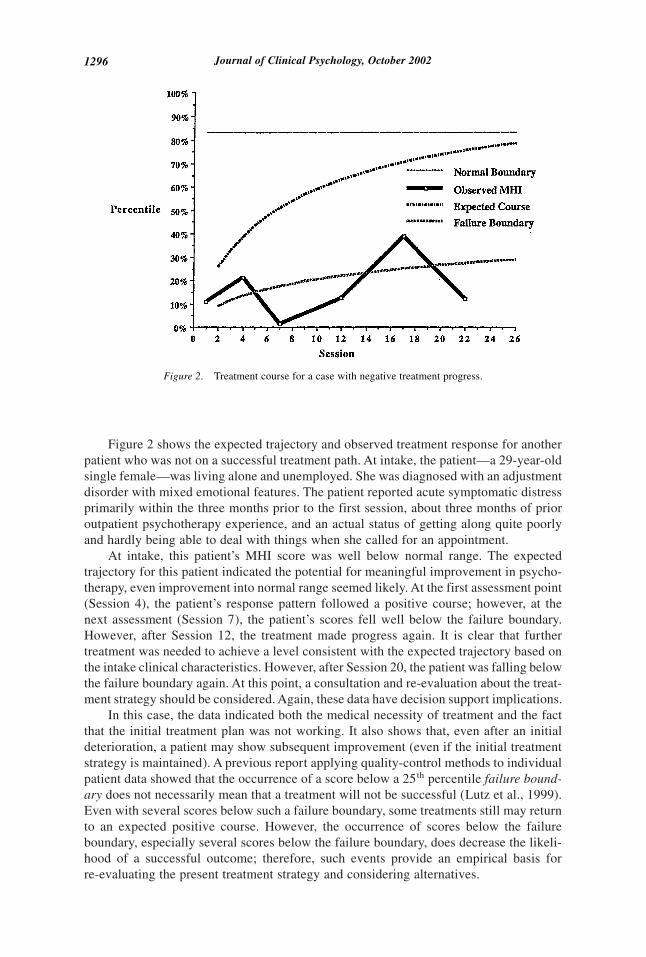
Figure 2 shows the expected trajectory and observed treatment response for anotherpatient who was not on a successful treatment path. At intake, the patient—a 29-year-oldsingle female—was living alone and unemployed. She was diagnosed with an adjustmentdisorder with mixed emotional features. The patient reported acute symptomatic distressprimarily within the three months prior to the first session, about three months of prioroutpatient psychotherapy experience, and an actual status of getting along quite poorlyand hardly being able to deal with things when she called for an appointment.
At intake, this patient’s MHI score was well below normal range. The expectedtrajectory for this patient indicated the potential for meaningful improvement in psycho-therapy, even improvement into normal range seemed likely. At the first assessment point(Session 4), the patient’s response pattern followed a positive course; however, at thenext assessment (Session 7), the patient’s scores fell well below the failure boundary.However, after Session 12, the treatment made progress again. It is clear that furthertreatment was needed to achieve a level consistent with the expected trajectory based onthe intake clinical characteristics. However, after Session 20, the patient was falling belowthe failure boundary again. At this point, a consultation and re-evaluation about the treat-ment strategy should be considered. Again, these data have decision support implications.
In this case, the data indicated both the medical necessity of treatment and the factthat the initial treatment plan was not working. It also shows that, even after an initialdeterioration, a patient may show subsequent improvement (even if the initial treatmentstrategy is maintained). A previous report applying quality-control methods to individualpatient data showed that the occurrence of a score below a 25th percentile failure bound-ary does not necessarily mean that a treatment will not be successful (Lutz et al., 1999).Even with several scores below such a failure boundary, some treatments still may returnto an expected positive course. However, the occurrence of scores below the failureboundary, especially several scores below the failure boundary, does decrease the likeli-hood of a successful outcome; therefore, such events provide an empirical basis forre-evaluating the present treatment strategy and considering alternatives.
Figure 2. Treatment course for a case with negative treatment progress.
1296 Journal of Clinical Psychology, October 2002
The present patient-profiling strategy represents an important improvement in out-comes management because the individual’s response to treatment is compared with anexpected course tailored to his/her own unique characteristics. When patients are respond-ing below expectations, strategies can be implemented early to improve their course oftreatment. From a provider perspective, therapists can be evaluated by determining theaverage difference between expected and observed courses of treatment. This sort of datahas the potential to improve patient–therapist or patient–treatment matching and to assistin the evaluation and supervision of therapists-in-training.
Exploring Patient–Therapist Interactions
Differences between expected and observed rates of change in MHI scores across ses-sions yield a residual change rate for a particular case. Averaging these difference scoresacross a particular therapist’s patients gives us an indication of the relative effectivenessof that therapist. In other words, using these average deviations for each case, we are ableto obtain a summary appraisal (single score) indicating the relative effectiveness of thattherapist (adjusted for caseload severity).
One approach to constructing an empirical basis for case assignment would be sim-ply to refer patients to the best therapist, overall. The question is, “Are some therapistsjust better than others, regardless of case mix?” The research evidence we have suggeststhat the answer is “No.” We found no significant differences in the average effectivenessof various therapists. It seems that professional training and experience lead to the devel-opment of therapists who are more or less equally competent across their diverse caseloads; however, there is tremendous variation in outcomes within a therapist’s case load.
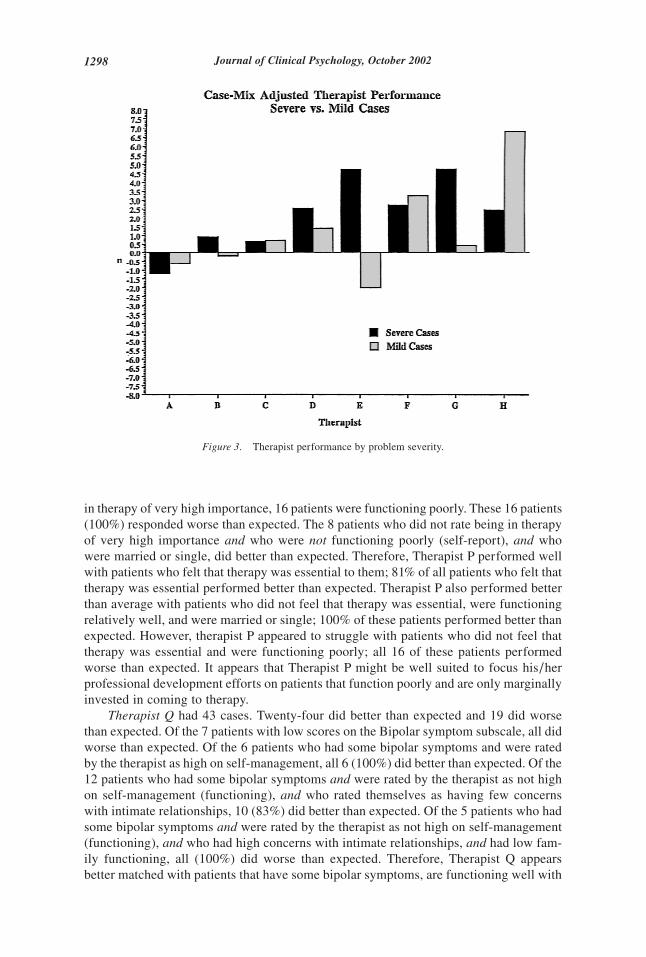
Does this mean that we are unable to construct an empirical basis for case assign-ment? Again, the answer is, “No.” We can provide such an empirical basis, but it has to bebased on matching specific therapists to specific patients. For example, we have found(Fig. 3) that some therapists are much better than others with severe cases (intake MHIless than a T-score of 50), while others are better (more effective) with less-severe cases(intake MHI score above 50).
Using the growth-curve analyses used to develop patient profiling, we went furtherand examined strengths and weaknesses in therapists’ case loads. The goal was to exploretheir performance, as well as to provide additional information for supervision and train-ing. First, we used differences between observed and expected trajectories derived fromthe growth-curve analyses to split patients into one of two categories. The first categorycomprises patients who achieved more benefit than expected in therapy, defined by thedifference between observed and expected courses of improvement. The second categorycomprises patients whose observed scores fell below (on average) their model-derivedexpected scores. We then used tree-based methods (Venables & Ripley, 1994; Yarnold,1996) to discriminate for each therapist the patients with whom they did better or worse.This method splits the data in iterative steps to determine sets of variables that bestdiscriminate between two defined groups (Ostrander, Weinfurt, Yarnold, & August, 1998).The data are sorted into smaller disjunctive and best discriminating subsets until eachobservation is classified. The following case examples of two therapists demonstrate theusefulness of this explorative method as a potential feedback method for training andsupervision purposes.
Therapist P provided data on 53 cases. Twenty-eight did better than expected, and 25did worse than expected. Of the 21 patients who rated being in therapy of very highimportance, 17 (83%) did better than expected. Of the 32 patients who did not rate being
Outcomes Management 1297
in therapy of very high importance, 16 patients were functioning poorly. These 16 patients(100%) responded worse than expected. The 8 patients who did not rate being in therapyof very high importance and who were not functioning poorly (self-report), and whowere married or single, did better than expected. Therefore, Therapist P performed wellwith patients who felt that therapy was essential to them; 81% of all patients who felt thattherapy was essential performed better than expected. Therapist P also performed betterthan average with patients who did not feel that therapy was essential, were functioningrelatively well, and were married or single; 100% of these patients performed better thanexpected. However, therapist P appeared to struggle with patients who did not feel thattherapy was essential and were functioning poorly; all 16 of these patients performedworse than expected. It appears that Therapist P might be well suited to focus his/herprofessional development efforts on patients that function poorly and are only marginallyinvested in coming to therapy.
Therapist Q had 43 cases. Twenty-four did better than expected and 19 did worsethan expected. Of the 7 patients with low scores on the Bipolar symptom subscale, all didworse than expected. Of the 6 patients who had some bipolar symptoms and were ratedby the therapist as high on self-management, all 6 (100%) did better than expected. Of the12 patients who had some bipolar symptoms and were rated by the therapist as not highon self-management (functioning), and who rated themselves as having few concernswith intimate relationships, 10 (83%) did better than expected. Of the 5 patients who hadsome bipolar symptoms and were rated by the therapist as not high on self-management(functioning), and who had high concerns with intimate relationships, and had low fam-ily functioning, all (100%) did worse than expected. Therefore, Therapist Q appearsbetter matched with patients that have some bipolar symptoms, are functioning well with
Figure 3. Therapist performance by problem severity.
1298 Journal of Clinical Psychology, October 2002
regard to self-management (100% did better than expected), but did not match well withpatients who presented with some bipolar symptoms and were not functioning well in thefamily area (100% did worse than expected).
Using Patient Profiling and Cluster Analyses to Examine Therapist Differences:Exploring Therapist’s Caseloads
In order to extend the usefulness of the expected treatment-response model for clinicaldecision making, we searched for homogeneous patient symptom clusters, optimized bytheir ability to discriminate between outcome groups. We further applied this concept toevaluate therapist performance. Participants were 625 patients receiving outpatient psy-chotherapy in a variety of clinical settings around the country. The therapist sampleincluded 288 therapists in the national provider network of a managed-care company. Wehave little specific information about these therapists, but we know they varied in pro-fessional background and theoretical orientation. All patients were participants in a man-aged mental-health-care system using the COMPASS Information System to assess andmonitor treatments. Patients and therapists completed the COMPASS questionnaire atintake and at a minimum of two subsequent sessions during treatment. Seventy-threepercent of the patients were female. The average age was 37.0 (SD � 9.8), 56.6% weremarried, 25.1% were single, and 18.2% were separated, divorced, or widowed. Seventy-two percent were employed full-time.
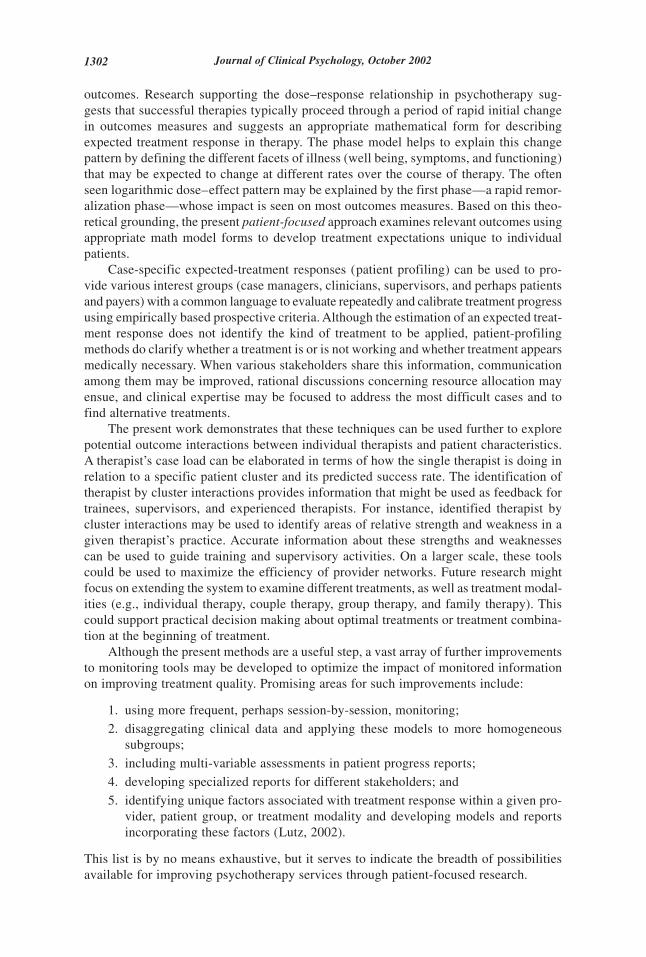
First, patients were categorized into two outcome groups. The first group comprisedpatients that achieved reliable improvement. Using the COMPASS data, a regressionslope [regressing outcome on log (base 10) of session number] of at least 4.5 is necessaryto achieve reliable improvement (a change of more than 1.25 standard errors of measure-ment) over 10 sessions (cf., Howard et al., 1996). The second group comprised patientsthat failed to achieve a slope of at least 4.5, and therefore failed to achieve reliableimprovement (Howard, Orlinsky, & Lueger, 1995; Martinovich, Howard, & Saunders,1996). A discriminant analysis then was used with 68 intake variables. Results showedthat 11 items had a loading on the discriminant function of at least .4. These 11 itemsappeared to be the most powerful discriminators of outcome for our sample and mea-surement system. Table 1 shows 11 items that best discriminated between intake groupsin terms of their improvement.
Using the 11 items, we then employed a cluster analysis to differentiate patient groups.The Ward method of agglomeration was applied to Euclidean distances. A 4-cluster solu-tion was deemed optimal. Table 1 (Patient clusters A–D) reports averages within clusters.Patient cluster A (n � 57) included seriously impaired patients in terms of their wellbeing, psychological symptoms, and functional status. These patients tended to reportserious problems with routine tasks and with being comfortable with other people. Clus-ter B (n � 247) included patients who were moderately impaired with respect to wellbeing, symptoms, and functioning. These patients were able to accomplish routine tasksand feel comfortable being with others. Cluster C (n � 257) included patients who werealso moderately impaired, but consistently less impaired by psychological symptomsthan cluster B patients. These patients reported being slightly satisfied with their livesand reported functioning problems specific to interpersonal relationships. With respect towell being, these patients were less distressed than were patients in clusters A and B.Patients in cluster D (n � 64) were only slightly distressed by psychological problems,reporting some slight problems with daily accomplishments. These problems caused mod-erate interference with their capacity to feel comfortable with other people.
Outcomes Management 1299
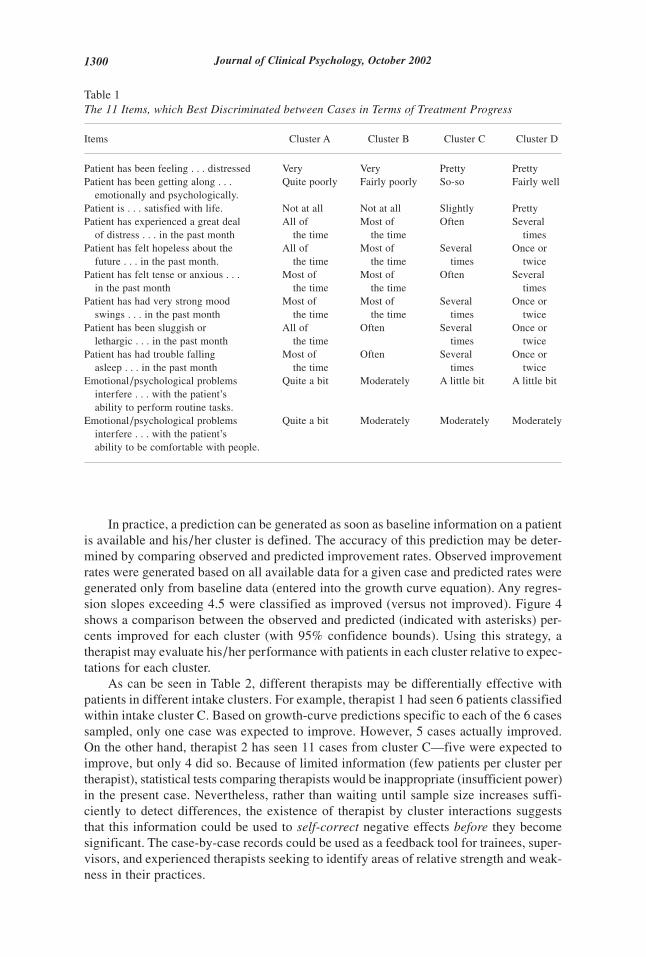
In practice, a prediction can be generated as soon as baseline information on a patientis available and his/her cluster is defined. The accuracy of this prediction may be deter-mined by comparing observed and predicted improvement rates. Observed improvementrates were generated based on all available data for a given case and predicted rates weregenerated only from baseline data (entered into the growth curve equation). Any regres-sion slopes exceeding 4.5 were classified as improved (versus not improved). Figure 4shows a comparison between the observed and predicted (indicated with asterisks) per-cents improved for each cluster (with 95% confidence bounds). Using this strategy, atherapist may evaluate his/her performance with patients in each cluster relative to expec-tations for each cluster.
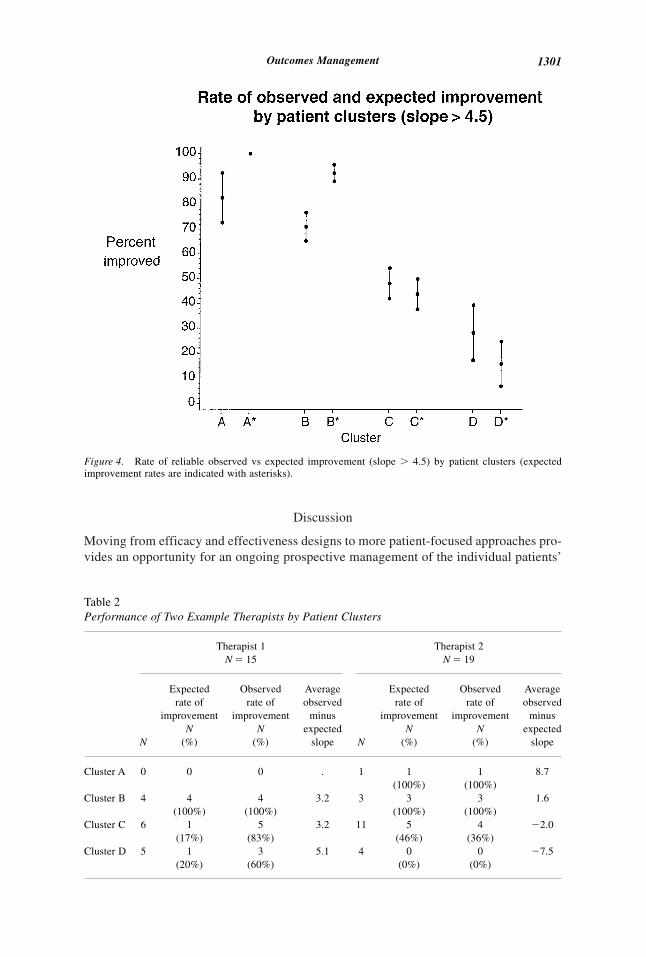
As can be seen in Table 2, different therapists may be differentially effective withpatients in different intake clusters. For example, therapist 1 had seen 6 patients classifiedwithin intake cluster C. Based on growth-curve predictions specific to each of the 6 casessampled, only one case was expected to improve. However, 5 cases actually improved.On the other hand, therapist 2 has seen 11 cases from cluster C—five were expected toimprove, but only 4 did so. Because of limited information (few patients per cluster pertherapist), statistical tests comparing therapists would be inappropriate (insufficient power)in the present case. Nevertheless, rather than waiting until sample size increases suffi-ciently to detect differences, the existence of therapist by cluster interactions suggeststhat this information could be used to self-correct negative effects before they becomesignificant. The case-by-case records could be used as a feedback tool for trainees, super-visors, and experienced therapists seeking to identify areas of relative strength and weak-ness in their practices.
Table 1The 11 Items, which Best Discriminated between Cases in Terms of Treatment Progress
Items Cluster A Cluster B Cluster C Cluster D
Patient has been feeling . . . distressed Very Very Pretty PrettyPatient has been getting along . . .
emotionally and psychologically.Quite poorly Fairly poorly So-so Fairly well
Patient is . . . satisfied with life. Not at all Not at all Slightly PrettyPatient has experienced a great deal
of distress . . . in the past monthAll of
the timeMost of
the timeOften Several
timesPatient has felt hopeless about the
future . . . in the past month.All of
the timeMost of
the timeSeveral
timesOnce or
twicePatient has felt tense or anxious . . .
in the past monthMost of
the timeMost of
the timeOften Several
timesPatient has had very strong mood
swings . . . in the past monthMost of
the timeMost of
the timeSeveral
timesOnce or
twicePatient has been sluggish or
lethargic . . . in the past monthAll of
the timeOften Several
timesOnce or
twicePatient has had trouble falling
asleep . . . in the past monthMost of
the timeOften Several
timesOnce or
twiceEmotional/psychological problems
interfere . . . with the patient’sability to perform routine tasks.
Quite a bit Moderately A little bit A little bit
Emotional/psychological problemsinterfere . . . with the patient’sability to be comfortable with people.
Quite a bit Moderately Moderately Moderately
1300 Journal of Clinical Psychology, October 2002
Discussion
Moving from efficacy and effectiveness designs to more patient-focused approaches pro-vides an opportunity for an ongoing prospective management of the individual patients’
Figure 4. Rate of reliable observed vs expected improvement (slope � 4.5) by patient clusters (expectedimprovement rates are indicated with asterisks).
Table 2Performance of Two Example Therapists by Patient Clusters
Therapist 1N � 15
Therapist 2N � 19
N
Expectedrate of
improvementN
(%)
Observedrate of
improvementN
(%)
Averageobserved
minusexpected
slope N
Expectedrate of
improvementN
(%)
Observedrate of
improvementN
(%)
Averageobserved
minusexpected
slope
Cluster A 0 0 0 . 1 1(100%)
1(100%)
8.7
Cluster B 4 4(100%)
4(100%)
3.2 3 3(100%)
3(100%)
1.6
Cluster C 6 1(17%)
5(83%)
3.2 11 5(46%)
4(36%)
�2.0
Cluster D 5 1(20%)
3(60%)
5.1 4 0(0%)
0(0%)
�7.5
Outcomes Management 1301
outcomes. Research supporting the dose–response relationship in psychotherapy sug-gests that successful therapies typically proceed through a period of rapid initial changein outcomes measures and suggests an appropriate mathematical form for describingexpected treatment response in therapy. The phase model helps to explain this changepattern by defining the different facets of illness (well being, symptoms, and functioning)that may be expected to change at different rates over the course of therapy. The oftenseen logarithmic dose–effect pattern may be explained by the first phase—a rapid remor-alization phase—whose impact is seen on most outcomes measures. Based on this theo-retical grounding, the present patient-focused approach examines relevant outcomes usingappropriate math model forms to develop treatment expectations unique to individualpatients.
Case-specific expected-treatment responses (patient profiling) can be used to pro-vide various interest groups (case managers, clinicians, supervisors, and perhaps patientsand payers) with a common language to evaluate repeatedly and calibrate treatment progressusing empirically based prospective criteria. Although the estimation of an expected treat-ment response does not identify the kind of treatment to be applied, patient-profilingmethods do clarify whether a treatment is or is not working and whether treatment appearsmedically necessary. When various stakeholders share this information, communicationamong them may be improved, rational discussions concerning resource allocation mayensue, and clinical expertise may be focused to address the most difficult cases and tofind alternative treatments.
The present work demonstrates that these techniques can be used further to explorepotential outcome interactions between individual therapists and patient characteristics.A therapist’s case load can be elaborated in terms of how the single therapist is doing inrelation to a specific patient cluster and its predicted success rate. The identification oftherapist by cluster interactions provides information that might be used as feedback fortrainees, supervisors, and experienced therapists. For instance, identified therapist bycluster interactions may be used to identify areas of relative strength and weakness in agiven therapist’s practice. Accurate information about these strengths and weaknessescan be used to guide training and supervisory activities. On a larger scale, these toolscould be used to maximize the efficiency of provider networks. Future research mightfocus on extending the system to examine different treatments, as well as treatment modal-ities (e.g., individual therapy, couple therapy, group therapy, and family therapy). Thiscould support practical decision making about optimal treatments or treatment combina-tion at the beginning of treatment.
Although the present methods are a useful step, a vast array of further improvementsto monitoring tools may be developed to optimize the impact of monitored informationon improving treatment quality. Promising areas for such improvements include:
1. using more frequent, perhaps session-by-session, monitoring;
2. disaggregating clinical data and applying these models to more homogeneoussubgroups;
3. including multi-variable assessments in patient progress reports;
4. developing specialized reports for different stakeholders; and
5. identifying unique factors associated with treatment response within a given pro-vider, patient group, or treatment modality and developing models and reportsincorporating these factors (Lutz, 2002).
This list is by no means exhaustive, but it serves to indicate the breadth of possibilitiesavailable for improving psychotherapy services through patient-focused research.
1302 Journal of Clinical Psychology, October 2002

References
Barkham, M., Rees, A., & Stiles, W.B. (1996). Dose-effect relations in time-unlimited psychother-apy. Journal of Consulting and Clinical Psychology, 64, 927–935.
Barkham, M., Stiles, W.B., & Shapiro, D.A. (1993). The shape of change in psychotherapy: Lon-gitudinal assessment of personal problems. Journal of Consulting and Clinical Psychology, 61,667– 677.
Bryk, A.S., & Raudenbush, S.W. (1992). Hierarchical linear models: applications and data analysismethods. Newbury Park, CA: Sage.
Endicott, J., Spitzer, R.L., Fleiss, J.L., & Cohen, J. (1976). The global assessment scale: Procedurefor measuring overall severity of psychiatric disturbance. Archives of General Psychiatry, 33,766–771.
Eysenck, H.J. (1952). The effects of psychotherapy: An evaluation. Journal of Consulting Psychol-ogy, 16, 319–324.
Howard, K.I., Brill, P.L., Lueger, R.J., O’Mahoney, M.T., & Grissom, G.R. (1995). Integra outpa-tient tracking system. Philadelphia, PA: Integra Inc.
Howard, K.I., Kopta, S.M., Krause, M.S., & Orlinsky, D.E. (1986). The dose-response relationshipin psychotherapy. American Psychologist, 41, 159–164.
Howard, K.I., Lueger, R.J., Maling, M.S., & Martinovich, Z. (1993). A phase model of psycho-therapy: Causal mediation of outcome. Journal of Consulting and Clinical Psychology, 61,678– 685.
Howard, K.I., Moras, K., Brill, P.L., Martinovich, Z., & Lutz, W. (1996). The evaluation of psy-chotherapy: Efficacy, effectiveness, and patient progress. American Psychologist, 51, 1059–1064.
Howard, K.I., Orlinsky, D., & Lueger, R.J. (1995). The design of clinically relevant outcome research:Some considerations and an example. In M. Aveline & D.A. Shapiro (Eds.). Research foun-dations for psychotherapy practice (pp. 3– 47). Sussex, England: Wiley.
Jacobson, N.S., & Truax, P. (1991). Clinical significance: A statistical approach to defining mean-ingful change in psychotherapy research. Journal of Consulting and Clinical Psychology, 59,12–19.
Kadera, S.W., Lambert, M.J., & Andrews, A.A. (1996). How much therapy is really enough: Asession-by-session analysis of the psychotherapy dose-effect relationship. Journal of Psycho-therapy Practice and Research, 5, 132–151.
Kopta, S.M., Howard, K.I., Lowry, J.L., & Beutler, L.E. (1994). Patterns of symptomatic recoveryin time-unlimited psychotherapy. Journal of Consulting and Clinical Psychology, 62, 1009–1016.
Krause, M. S., Howard, K. I., & Lutz, W. (1998). Exploring individual change. Journal of Consult-ing and Clinical Psychology, 66, 838–845.
Leon, S.C., Kopta, S.M., Howard, K.I., & Lutz, W. (1999). Predicting patients’ responses to psy-chotherapy: Are some more predictable than others? Journal of Consulting and Clinical Psy-chology, 67, 698–704.
Lueger, R.J., Howard, K.I., Martinovich, Z., Lutz, W., Anderson, E., & Grissom, G. (2001). Assess-ing treatment progress with individualized models of predicted response. Journal of Consult-ing and Clinical Psychology, 69, 150–158.
Lutz, W. (2002). Patient-focused psychotherapy research and individual treatment progress as sci-entific groundwork for an empirical based clinical practice. Psychotherapy Research, 12, 251–272.
Lutz, W., Lowry, J., Kopta, M., Einstein, A.D., & Howard, K.I. (2001). Prediction of dose-responserelations based on patient characteristics. Journal of Clinical Psychology, 57, 889–900.
Lutz, W., Martinovich, Z., & Howard, K.I. (1999). Patient profiling: An application of randomcoefficient regression models to depicting the response of a patient to outpatient psychother-apy. Journal of Consulting and Clinical Psychology, 67, 571–577.
Outcomes Management 1303

Maling, M.S., Gurtman, M.B., & Howard, K.I. (1995). The response of interpersonal problems tovarying doses of psychotherapy. Psychotherapy Research, 5, 63–75.
Martinovich, Z. (1998). Evaluating a phase model of psychotherapy outcome: An application ofhierarchical logistic modeling. Unpublished doctoral dissertation, Northwestern University,Evanston, IL.
Martinovich, Z., Howard, K.I., & Saunders, S. (1996). Some comments on “Assessing ClinicalSignificance.” Psychotherapy Research, 6, 124–132.
McNeilly, C.L., & Howard, K.I. (1991). The effects of psychotherapy: A reevaluation based ondosage. Psychotherapy Research, 1, 74–78.
Ostrander, R., Weinfurt, K.P., Yarnold, P.R., & August, G.J. (1998). Diagnosing attention deficitdisorders with the behavioral assessment system for children and the child behavior checklist:Test and construct validity analyses using optimal discrimination classification trees. Journalof Consulting and Clinical Psychology, 66, 660– 672.
Pilkonis, P.A., & Frank, E. (1988). Personality pathology in recurrent depression: Nature, preva-lence, and relationship to treatment response. American Journal of Psychiatry, 145, 435– 441.
Sperry, L., Brill, P., Howard, K.I., & Grissom, G. (1996). Treatment outcomes in psychotherapyand psychiatric interventions. New York: Brunner/Mazel.
Venables, B.N., & Ripley, B.D. (1994). Modern applied statistics in Splus. New York: Springer.
Yarnold, P.R. (1996). Discriminating geriatric versus non-geriatric ambulatory patients on the basisof functional status information: An example of classification tree analysis via UniODA. Edu-cational and Psychological Measurement, 56, 656– 667.
1304 Journal of Clinical Psychology, October 2002


