Embed Size (px)
Citation preview

Tectonophysics 653 (2015) 127–139
Contents lists available at ScienceDirect
Tectonophysics
j ourna l homepage: www.e lsev ie r .com/ locate / tecto
Outer rise seismicity boosted by the Maule 2010 Mw 8.8megathrust earthquake
Javier A. Ruiz ⁎, Eduardo Contreras-Reyes 1
Departamento de Geofísica, Facultad de Ciencias Físicas y Matemáticas, Universidad de Chile, Santiago, ChileBlanco Encalada 2002, Santiago, Chile
⁎ Corresponding author at: Departamento de GeofísicMatemáticas Universidad de Chile Blanco Encalada 2002978 0690; fax: +56 2 2696 8686.
1 Tel.: +56 2 2978 0690; fax: +56 2 2696 8686.
http://dx.doi.org/10.1016/j.tecto.2015.04.0070040-1951/© 2015 Elsevier B.V. All rights reserved.
a b s t r a c t
a r t i c l e i n f oArticle history:Received 9 August 2014Received in revised form 7 April 2015Accepted 9 April 2015Available online 23 April 2015
Keywords:Regional moment tensorSubduction zoneOuter riseEarthquake cycleOceanic plate
The Maule 2010 megathrust earthquake Mw 8.8 has been characterized by two coseismic high-slip patches(asperities) north and south of the epicenter, separated by a region of lower slip. Here, we invert full broadbandwaveforms to obtain regional moment tensors, yielding precise centroid depth and source parameters of outerrise events (Mw N 4.5), including a large Mw 7.4 event that occurred just 1.5 h after the Maule mainshock.Outer rise seismicity occurred mainly in two clusters: (1) a large number of outer rise events in the subductingplate located just seaward of the northern asperity of the Maule earthquake, and (2) a second cluster withfewer events seaward of the southern edge of theMaule rupture area. Thus, the outer rise seismicity is correlatedwith the coseismic rupture of theMaule earthquake, reflecting the stress state of the interplate coupled zone. Themoment tensor results indicate similar extensional focal mechanisms for all outer rise events in the northernzone. In the southern region, most of the outer rise events are also extensional, except for one strike slip eventlocated near the oceanicMocha Fracture Zone. The centroid depths vary from 5 to 20 kmdepth, and present sim-ilar magnitudes. Many of the outer rise events nucleated near the Mocha Fracture Zone, including the Mw 7.4event and one strike–slip event. The calculated yield strength envelope for the oceanic Nazca lithospheresuggests that the centroid depths of intraplate tensional events span almost the entire upper-brittle part of theoceanic lithosphere.
© 2015 Elsevier B.V. All rights reserved.
1. Introduction
The outer rise, or outer trench slope, is a broad, gentle upwarping ofthe seafloor where an incoming/subducting oceanic plate begins to flexand descends into the trench. Large extensional earthquakes withinthe outer rise of the subducting plate are rare compared to largeinterplate thrust events on the subduction interface. Althoughsome large extensional faulting events, such as the 1977 Sumbawa,Indonesia, Mw 8.4 (Spence, 1986) and 2009 Samoa–Tonga Mw 8.1 (Layet al., 2010) earthquakes, do not follow soon after plate boundary thrustevents, may do [for example, the 1933 Sanriku–Oki, Mw 8.6 (Kanamori,1971) and the 2007 Kuril Mw 8.1 (Ammon et al., 2008) earthquakes].Studies conducted on outer rise seismicity suggest that it is strongly cor-relatedwith spatial and temporal variations of the seismic coupling alongmegathrust, reflecting the stress state of the interplate coupled zone (e.g.Christensen and Ruff, 1988). These events are not onlymechanically, butalso spatially and temporally, related to the distribution of large thrustearthquakes, and are thus an integral part of the earthquake cycle.
a Facultad de Ciencias Físicas y2, Santiago, Chile. Tel.: +56 2
Outer rise seismicity along subduction zones occurs mainly atshallow depths (b30 km) within the oceanic plate with normal faultingmechanisms; deeper events are less common (e.g. Christensen and Ruff,1988). The focal depth variation and faulting type are usually explainedby elastic stresses within the subducting slab that undergoes bending.Some basic models (e.g. Chapple and Forsyth, 1979) consider a bendingelastic plate, which results in tensional stress in the upper part of theplate and compressional stress in the lower part of the plate. Thesestress regimes are separated at somedepth by a neutral plane. Statisticalstudies of outer-rise intraplate events suggest that the transition depthfrom tensional to compressional stress regimes within the subductingoceanic lithosphere is located approximately at the depth of the400 °C–450 °C isotherm (e.g. Seno and Yamanaka, 1996).
The spatial and temporal occurrence of outer rise events can also beexplained by stress fluctuations related to megathrust earthquakes cy-cles, based on simulation of great earthquakes with mechanical models(e.g. Dmowska et al., 1988; Taylor et al., 1996; Dmowska et al., 1996). Inparticular, model simulations show extensional outer rise earthquakesand compressional ones in the early and late phase of the megathrustearthquake cycle, respectively, which agrees rather well with seismicityobservations from coupled subduction zones (e.g. Dmowska et al.,1988). For instance, Christensen and Ruff (1988) argued that tensionalouter rise events follow large underthrusting earthquakes in strongly

128 J.A. Ruiz, E. Contreras-Reyes / Tectonophysics 653 (2015) 127–139
coupled zones, whereas compressional outer rise earthquakes aretriggered seaward of locked sections of the interplate zone. On theother hand, the same authors have proposed that in weakly-coupledsubduction zones, only tensional outer rise earthquakes occur, whichindicates that the outer rise is dominated by tensional stresses associat-ed with plate bending stresses and/or slab pull forces.
On February 27, 2010, anMw 8.8 mega-thrust earthquake nucleatedat 06:34:08 UTC, with a hypocenter located at 73.239°S, 36.290°W and30 km depth, according to the Servicio Sismológico Nacional (SSN) ofthe Universidad de Chile. This earthquake broke an approximately450-km long segment of the south-central Chile subduction zone (e.g.Delouis et al., 2010; Moreno et al., 2012; Vigny et al., 2011). A devastat-ing tsunami followed this event (e.g. Fritz et al., 2011; Vargas et al.,2011). Preceding the Maule 2010 earthquake, the south-centralChilean subduction zone had been identified as a likely mature seismicgap (Madariaga et al., 2010; Ruegg et al., 2009) because no largesubduction earthquake had occurred in this zone since 1835. Thecoseismic slip imaged by several groups (e.g. Delouis et al., 2010;Lorito et al., 2011; Moreno et al., 2012; Vigny et al., 2011; Hayes et al.,2013) shows similar large-scale spatial slip patterns in the rupturearea. Most of the published co-seismic slip models show two patchesof large slip with the largest slip located north of the epicenter. Therupture propagated predominantly bilaterally, but most of theseismic moment occurred in the northern rupture area, with peakslip on the order of 15–20 m. The total seismic moment was about1.8–2.6 × 10²² N·m (e.g. Delouis et al., 2010; Hayes et al., 2013).
Intense aftershock activity followed the 2010Maule earthquake, andthe spatial distribution of the seismicity has been located and analyzedby few groups. Characteristic features include a shallow concentrationof events between 10 and 35 km depth and a group of deeper eventslying at 40–50 km depth (e.g. Hayes et al., 2013; Lange et al., 2012;Rietbrock et al., 2012). Despite the diverse focal mechanisms and mag-nitudes, most of the aftershock seismicity was located in the northernpart of the rupture area. Also shallow intraplate coastal events weretriggered at the northern edge of the rupture zone (e.g. Farías et al.,2011; Lange et al., 2012) and two large normal faulting earthquakesoccurred near Pichilemu (~34°S) on March 11, 2010, with magnitudesMw 7.0 and Mw 6.9 (Ruiz et al., 2014; Ryder et al., 2012).
In the oceanic plate, outer rise seismic activity following the 2010Maule earthquake was distributed spatially in two main areas. To thenorth (~34.5°S), outer rise events were distributed at the outer trenchslope zone adjacent to the northern largest coseismic slip patch. A sec-ond cluster of outer rise seismicity was concentrated at ~38°S, seawardof the southern edge of theMaule rupture area (Moscoso andContreras-Reyes, 2012). A large Mw 7.4 outer rise normal faulting event occurredjust 1.5 h after the great Mw 8.8 Maule earthquake and was reportedby some seismological agencies, such as, GCMT (Global Centroid-Moment-Tensor, http://www.globalcmt.org/) and NEIC (NationalEarthquake Information Center). For instance, NEIC estimated the origintime of the event at 08:01:23 UTC and located it beneath the outertrench slope zone with an epicenter at 37.773°S, 75.048°W and adepth of 35 km. Similar large outer rise aftershocks followed the 2011,Mw 9.1, Tohoku megathrust earthquake, along the subduction zone inJapan, where about 40 min after the mainshock, an Mw 7.6 earthquakeoccurred beneath the outer trench slope (e.g. Asano et al., 2011; Layet al., 2011; Obana et al., 2012). These earthquakes reflect the tensionalstresses that take place in the outer rise zone after a megathrustearthquake, and the fluctuation of the stress–strain transferred fromcoseismic thrust earthquake ruptures may play an important role inthe occurrence of large normal faulting earthquakes.
Another remarkable seismic event triggered by a megathrustearthquake is the intraplate event of April 2012 off Sumatra, Mw 8.6.This is the largest strike–slip and intraplate earthquake ever recorded,and it had a complex rupture and was followed approximately 2 hlater by a strike–slip Mw 8.2 aftershock (e.g. Yue et al., 2012). Theseevents occurred ~7 years after the 2004 Sumatra–Andamanmegathrust
earthquake Mw 9.2. The 2012 intraplate seismicity occurred along thefossil fabric of the extinct Wharton basin off Sumatra, and according tocoseismic slip and Coloumb stress change calculations and seismologi-cal studies, before the April 2012 and after the Sumatra events therewas virtually no seismicity along the Wharton basin (Delescluse et al.,2012;Menget al., 2012). TheNazca plate of central Chile hosted a prom-inent oceanic fracture zone: the Mocha Fracture Zone (FZ) that trendsN55°E, and is currently subducting at ~38°S (Contreras-Reyes et al.,2008). In this paper, we also explore and discuss possible reactivationof this fossil transform fault in terms of the stress transfer triggered bythe Maule megathrust earthquake.
The main aim of this study is to characterize earthquake sourceparameters of the outer rise seismicity following the 2010 Mw 8.8Maule earthquake by modeling regional seismic moment tensors tobetter determine precise centroid source depths, and to relate them tothe megathrust zone and surrounding areas. We invert the waveformsto obtain regional moment tensors and we compute the best sourcedepth for a large dataset (M N 4.5) of outer rise events compared tothose reported by seismological agencies using teleseismic data. Be-cause the largest Mw 7.4 outer trench slope earthquake was triggeredabout 1.5 h after the mainshock, waveforms are affected by seismicwaves from the mainshock. Consequently an accurate seismic-to-noise ratio analysis was done prior to running the inversion. Finally,we discuss the interplay between the outer rise seismicity and thecoseismic slip distribution of the 2010 megathrust earthquake interms of the geodynamic setting of the incoming oceanic Nazca plate.
2. Seismotectonic setting
The study area spans from 32°S to 39°S along the south-centralChilean subduction zone, where the oceanic Nazca plate subductsbeneath South America in a N78°E direction with a converge rate ofabout 6.7 cm/year (Khazaradze and Klotz, 2003). In the study area, theseafloor spreading fabric of the oceanic Nazca plate trends oblique tothe trench axis. However, the seafloor spreading fabric is perturbed/modified in the outer rise region due to existence of cross-cuttingnormal faults caused by plate bending (e.g. Contreras-Reyes et al.,2008; Moscoso and Contreras-Reyes, 2012). The study area is boundedby the presence of two prominent bathymetric features: the JuanFernández Ridge (JFR) and the oceanic Mocha FZ in the north andsouth, respectively (Fig. 1). North of the Mocha FZ, the plate age at thetrench axis is ~30 Ma, whereas south of it the seafloor is about 24 Ma(Tebbens et al., 1997).
The 2010, Mw 8.8, Maule earthquake broke a previously identifiedseismic gap in the zone (Ruegg et al., 2009) that had not rupturedsince 1835. The 1835 event, summarized by Charles Darwin, had an es-timated magnitude of about M 8.5 (Lomnitz, 2004). Hayes et al. (2013)analyzed the aftershock sequence of the Maule earthquake and foundthat most of the aftershocks are interplate thrust events located awayfrom regions of largest coseismic slip; they also identified clusters ofseismic events located in the oceanic plate at the ends of the mainrupture area, impling internal deformation of the subducting slab inresponse to a large amount of slip on the plate interface.
Outer rise seismicity in the study area since 1976 and prior to theMaule earthquake is summarized in Fig. 1A. Events (M N 4.0) weredownloaded from NEIC (http://earthquake.usgs.gov/neic). We selectedthose with epicenters located westward of the trench axis. Using thesame location criteria, centroid moment tensors (M N 5.0) from GCMTwere selected in the same region. Noting that both datasetsmaypresentuncertainties in hypocenter and centroid locations, some events maynot correspond to outer rise events. Nonetheless, one can observethree clusters of events located at the northern (~33°S) and southernparts of the study area (~39°S). The region seaward of Valparaíso expe-rienced two large outer rise events, in 1981 and 2001. The 1981, Ms 7.2,was a compressional event with a source depth of 30 km (Korrat andMadariaga, 1986) which occurred south of Juan Fernandez Ridge

0 50 100
Santiag
Valparaiso
Talcahuano
Lebu
Concepcion Chillan
Los Angeles
Temuco
Valdivia
Pichilemu
Curico
Cauquenes
Tirua
Constitucion
Cobquecura
Arauco
1981/09/19
1981/10/16
1985/04/28
1987/01/27
1988/03/13
1989/04/13
1990/04/02
1993/03/17
1994/04/28
1995/09/17
2000/12/20
2001/03/03
2001/04/09
2005/04/13
2009/11/22
Bathymetry
Depth
A B
-77˚
-77˚
-76˚
-76˚
-75˚
-75˚
-74˚
-74˚
-73˚
-73˚
-72˚
-72˚
-71˚
-71˚
-70˚
-70˚
-40˚
-39˚
-38˚
-37˚
-36˚
-35˚
-34˚
-33˚
-32˚
0102030405060
(km)
-10000-8000-6000-4000-2000
0200040006000
(m)
0 50 100
-80
-80
-70
-70
-60
-60
-50
-50
-40
-40
-30
-30
-20
-20
-10
-10
2010/02/27
2010/02/27
2010/03/11
2010/03/11
2010/03/16
2011/02/11
2010/03/05
2010/07/14
2011/01/02
2011/02/14
2012/03/25
2012/04/17
-77˚
-77˚
-76˚
-76˚
-75˚
-75˚
-74˚
-74˚
-73˚
-73˚
-72˚
-72˚
-71˚
-71˚
-70˚
-70˚
-40˚ -40˚
-39˚ -39˚
-38˚ -38˚
-37˚ -37˚
-36˚ -36˚
-35˚ -35˚
-34˚ -34˚
-33˚ -33˚
-32˚ -32˚
Mocha FZ
6.6 cm/a
Fig. 1. Bathymetric/topographic map and seismicity of the study area. (A) Outer rise seismicity (M N 4.0, fromNEIC catalog) located since 1976 and prior to the 2010,Mw 8.8,Maule earth-quake. Beach balls are the centroidmoment tensors fromGCMT catalog for eventsM N 5.0. (B) Seismicity reported by NEIC after theMaule earthquake in the period 27-02-2010 to 31-12-2013. Colored circles are aftershockswith sizes scaled to the eventmagnitude and the colorbar represents hypocenter depths. Beachballs correspond to global centroidmoment tensors forthe largest aftershocks (Mw N 6.5) recorded after the 2010Maule earthquake. Dashed black lines are the contour depth (every 10 km) of the subducting oceanic slab (from Slab1.0, Hayeset al., 2013).
129J.A. Ruiz, E. Contreras-Reyes / Tectonophysics 653 (2015) 127–139
(JFR). In contrast, an extensional event triggered at 12 km depth north-ward from the 1981 event, with a magnitude Mw 7.0 that occurred onApril 9, 2001 (Clouard et al., 2007). Both events were followed by sever-al aftershocks, and from centroid moment tensor solutions reported byGCMT, the 1990,Mw 5.6, event had similar focal mechanism as the 1981outer rise event. In 2005, an event Mw 5.4 with similar mechanism tothe 2001, Mw 7.0, event was reported by the GCMT.
All the southern outer rise events show similar extensional faultingmechanisms according to the GCMT (Fig. 1A). Outer rise seismicity isdistributed along a narrow north–south strip from ~38.5°S to 40°S,and among these events eight present extensional focal mechanismswith strike predominantly parallel to the trench axis according to themoment tensor solutions of the GCMT. The largest event occurred inDecember 20th, 2000, with a centroid depth at 15 km and magnitudeMw 6.4 according to GCMT.
Fig. 1B summarizes the spatial distribution of aftershocks (M N 4.0)that occurred after the 2010 Maule earthquake, located by the NEIC.The centroid moment tensors of the largest aftershocks (Mw N 6.5)reported by the GCMT reveal the diversity of earthquake faulting inthe aftershock sequence. In particular, a large Mw 7.4 outer trenchslope earthquake occurred seaward at the southern edge of the mainrupture area (~38°S). Most of the outer rise events occurred at thenorthern and southernmost regions of the Maule 2010 rupture area.Little outer rise activity occurred in the middle just seawards of theepicentral region. The northern zone runs approximately from 33.5°S to35.5°S, and it presents a larger density of seismicity compared to thesouthern cluster located from 37.5°S to 38.5°S. Most of the later eventsare presumably aftershocks of the Mw 7.4 outer rise earthquake (Fig. 1).
Nevertheless, the southern outer rise seismic sequence is highlyremarkable in terms of the largest magnitude Mw 7.4 event triggeredand its proximity to the Mocha FZ. This event occurred as a directresponse to the mainshock, and is the largest outer rise event instru-mentally reported along the Chilean subduction zone; the Mw 7.0 that
occurred westward off Valparaiso in 2001 is the second largest(Clouard et al., 2007). Fig. 2 shows the centroid moment tensor of theMw 7.4 event and the aftershocks following this event reported by theNEIC (M N 4). We also show the centroid moment tensor solutionscomputed by the GCMT (M N 5.0). Five events, including the Mw 7.4,correspond to normal faultingwith nodal planes striking nearly parallelto the trench axis, except for one event striking obliquely to the trenchaxis. Also a strike slip event was triggered in the outer trench slopezone near the Mocha FZ. Outer rise seismicity located by NEIC shows aspatial distribution that is elongated north–south. Focal depths varybetween 5 and 35 km, however, several events are located at 35 kmdepth, meaning that the hypocenter depth is poorly constrained. Likely,these events have large depth uncertainties, as is typical when locatingearthquakes at teleseismic distances.
For events with magnitudes usually larger than 4.5 – depending onsignal-to-noise ratio of records – it is possible to compute regionalseismic moment tensors and to more precisely determine the centroiddepth by iterating the inversion process over several source depths tosearch for the best fitting model (e.g. Dreger, 2003; Kubo et al., 2002;Pasyanos et al., 1996; Ritsema and Lay, 1995). In the next section, wepresent the inversion of regional moment tensors from seismologicalrecordings for the sequence of outer rise events.
3. Data, analysis, modeling and testing
3.1. Data set
We selected from the NEIC worldwide catalog events with M N 4.5,located in the outer rise region along south-central Chile, including3 years from February 27, 2010. For each event in this dataset, wedownloaded 3-component broadband waveforms for all stations locat-ed at regional distances (Δ b 12°) from the NEIC online web facilities.Digital broadband recordings were available through the Global

0 50
2010/02/27 Mw 7.4
2010/03/04 Mw 5.0
2010/03/10 Mw 5.1
2010/06/28 Mw 5.6
2011/11/25 Mw 5.0
2012/04/06 Mw 5.0
A
B
Concepcion
Lebu
Temuco
Tirua
Angol
Lota
Arauco
-77˚
-77˚
-76˚
-76˚
-75˚
-75˚
-74˚
-74˚
-73˚
-73˚
-72˚
-72˚
-39˚ -39˚
-38˚ -38˚
-37˚ -37˚
0
10
20
30
40
50
(km)
A
B
Moho 7.4 5.0
5.1
5.6
5.0
0
10
20
30
40
50
Dep
th [k
m]
0 40 80 120 160 200 240 280
Along profile A-B [km]
Fig. 2. (A) High resolution bathymetricmap (Contreras-Reyes et al., 2008). Seismicity and sourcemechanism for the outer rise events occurred at 38°S of the study area. Colored circles areevents located by the NEIC in the period 27-02-2010 to 31-12-2013, with their sizes scaled tomagnitude. Colorbar represents hypocenter depths. Beach balls are centroidmoment tensorsolutions by the GCMT for events withmagnitudeMw N 5.0. (B) Cross-section A–B shows the centroid depth by GCMT solutions (beach ball) and colored circles are hypocenter depths byNEIC. Brown line is the top of the oceanic subducting slab, purple dashed line is the Moho discontinuity and the blue solid line is the bathymetry taken from the 2D seismic tomographymodel by Contreras-Reyes et al. (2008).
130 J.A. Ruiz, E. Contreras-Reyes / Tectonophysics 653 (2015) 127–139
Seismographic Network (GSS), and the Incorporated Research Institu-tions for Seismology (IRIS) Data Management Center.
3.2. Inverse method for regional moment tensors
We used the Time-Domain Moment Tensor (TDMT) inverse code toretrieve the seismicmoment tensor frombroadband regional waveformrecords (e.g. Dreger, 2003; Fukuyama and Dreger, 2000; Pasyanos et al.,1996). This software package has been used routinely at the Universityof California, Berkeley Seismological Laboratory, and successfully imple-mented at the Japan National Research Institute for Earth Sciencesand Disaster Prevention (NIED). This method solves a linear inverseproblem to retrieve deviatoric seismicmoment tensors from full region-al broadband records in the time domain via a linear least squarealgorithm. For a given source depth, the inversion scheme computesthe best fitting RMS (root mean square) or largest variance reduction(VR), of deconvolved data and synthetic waveforms filtered in a com-mon frequency band.
The misfit error between synthetics and observed waveforms issimply evaluated with the variance reduction (VR) defined by,
VR ¼ 1−Xi
ffiffiffiffiffiffiffiffiffiffiffiffiffiffiffiffiffiffioi−sið Þ2
qffiffiffiffiffio2i
q0B@
1CA
264
375� 100 ð1Þ
si and oi are the synthetic and observed waveforms, respectively andwhere sum is over stations and components. The best centroid depthis computed iteratively every 2 km depth by finding the solution that
yields the largest variance reduction over a broad depth range, or equiv-alent to the minimum Chi-square statistic. The best final seismicmoment tensor is expressed as a percentage of pure double-couple(DC) and percentage of compensated linear vector dipole (CLVD)moment tensors, and nodal planes are computed from DC. In thisapproach we assume purely deviatoric seismic moment tensors, so wedo not invert for the isotropic (ISO) part of the moment tensor.
Green's functions are computed for a 1Dvelocity crustalmodel usinga frequency–wavenumber integration method (Saikia, 1994). The 1Dvelocity model used in this study corresponds to the one proposed byCampos et al. (2002) which is a crustal model representative forsouth-central Chile. This velocity model provides reasonable solutionsfor regional moment tensors, even if the earthquake source is locatedin the outer rise, because the regional broadband waveforms invertedin this study and recorded at stations installed on land correspondmainly to surface waves propagating predominantly through the conti-nental crust. The epicenter location reported by the NEIC was fixed anda point-source was assumed for the regional events investigated in thisstudy, which is good assumption for the moderate to large events(Mw b 7.5) and the frequency band in which these events are analyzed.
3.3. Data selection and processing
Before running the moment tensor inversion, we performed signal-to-noise ratio analyses for the dataset in order to check if the frequencyband used in the inversion covers a band with good signal-to-noiseratios. It is important to check the noise level at far stations and forevents with small magnitudes (of about Mw b 5.0), but also particularly
131J.A. Ruiz, E. Contreras-Reyes / Tectonophysics 653 (2015) 127–139
needed for the records of the 2010,Mw 7.4, outer-rise event. In the lattercase, broadband recordings may present saturation at close stations,and/or be noisier than expected because seismic waves radiated fromthe 2010, Mw 8.8, Maule earthquake overlapwith those from the sourceof the outer rise event.
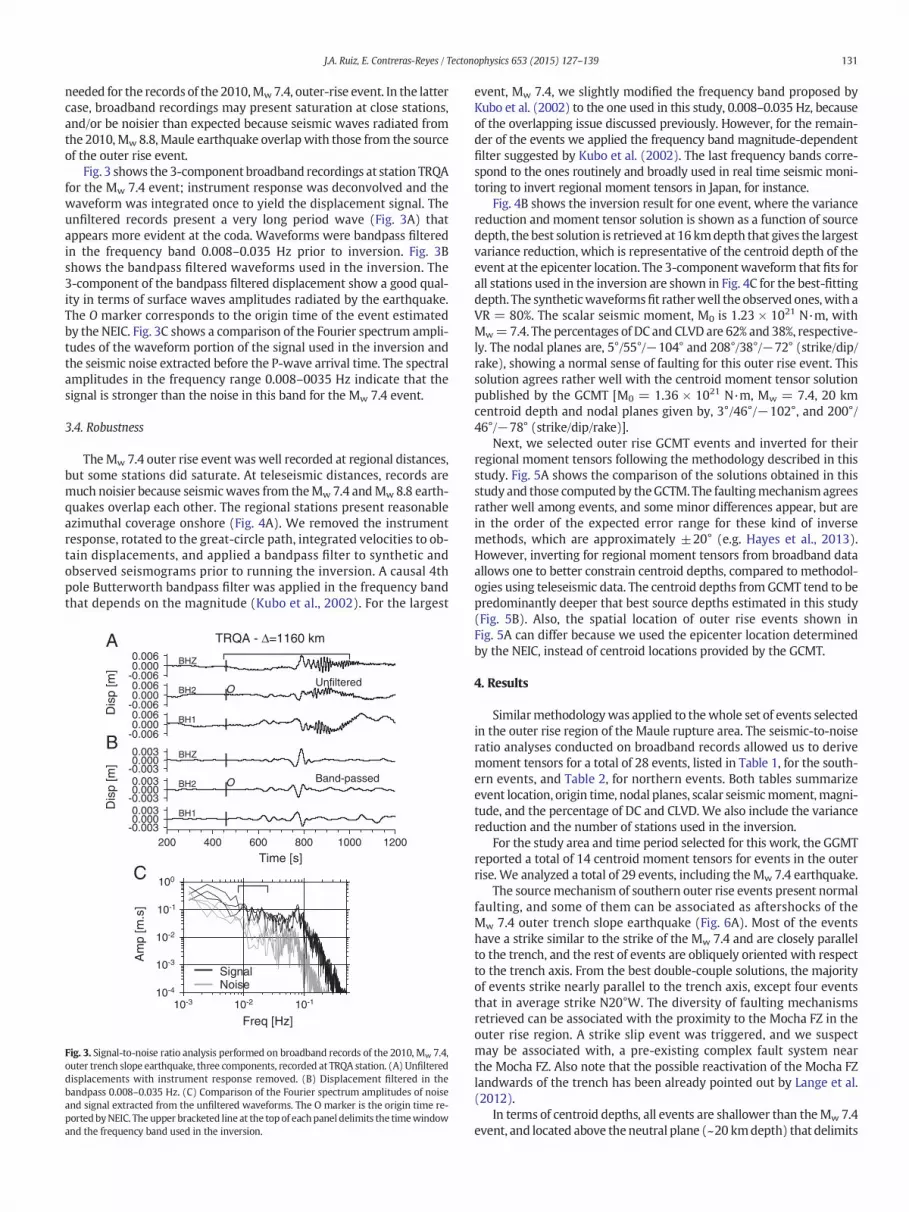
Fig. 3 shows the 3-component broadband recordings at station TRQAfor the Mw 7.4 event; instrument response was deconvolved and thewaveform was integrated once to yield the displacement signal. Theunfiltered records present a very long period wave (Fig. 3A) thatappears more evident at the coda. Waveforms were bandpass filteredin the frequency band 0.008–0.035 Hz prior to inversion. Fig. 3Bshows the bandpass filtered waveforms used in the inversion. The3-component of the bandpass filtered displacement show a good qual-ity in terms of surface waves amplitudes radiated by the earthquake.The O marker corresponds to the origin time of the event estimatedby the NEIC. Fig. 3C shows a comparison of the Fourier spectrum ampli-tudes of the waveform portion of the signal used in the inversion andthe seismic noise extracted before the P-wave arrival time. The spectralamplitudes in the frequency range 0.008–0035 Hz indicate that thesignal is stronger than the noise in this band for the Mw 7.4 event.
3.4. Robustness
The Mw 7.4 outer rise event was well recorded at regional distances,but some stations did saturate. At teleseismic distances, records aremuch noisier because seismicwaves from theMw 7.4 andMw 8.8 earth-quakes overlap each other. The regional stations present reasonableazimuthal coverage onshore (Fig. 4A). We removed the instrumentresponse, rotated to the great-circle path, integrated velocities to ob-tain displacements, and applied a bandpass filter to synthetic andobserved seismograms prior to running the inversion. A causal 4thpole Butterworth bandpass filter was applied in the frequency bandthat depends on the magnitude (Kubo et al., 2002). For the largest
Time [s]
BH1
-0.0030.0000.003
200 400 600 800 1000 1200
BH2 O Band-passed
-0.0030.0000.003
Dis
p [m
]
BHZB
-0.0030.0000.003
BH1
-0.0060.0000.006
BH2Unfiltered
O-0.0060.0000.006
Dis
p [m
]
BHZ
TRQA - Δ=1160 kmA
-0.0060.0000.006
C
NoiseSignal
10-4
10-3
10-2
10-1
100
Am
p [m
.s]
10-3 10-2 10-1
Freq [Hz]
Fig. 3. Signal-to-noise ratio analysis performed on broadband records of the 2010, Mw 7.4,outer trench slope earthquake, three components, recorded at TRQA station. (A) Unfiltereddisplacements with instrument response removed. (B) Displacement filtered in thebandpass 0.008–0.035 Hz. (C) Comparison of the Fourier spectrum amplitudes of noiseand signal extracted from the unfiltered waveforms. The O marker is the origin time re-portedbyNEIC. The upper bracketed line at the top of eachpanel delimits the timewindowand the frequency band used in the inversion.
event, Mw 7.4, we slightly modified the frequency band proposed byKubo et al. (2002) to the one used in this study, 0.008–0.035 Hz, becauseof the overlapping issue discussed previously. However, for the remain-der of the events we applied the frequency band magnitude-dependentfilter suggested by Kubo et al. (2002). The last frequency bands corre-spond to the ones routinely and broadly used in real time seismic moni-toring to invert regional moment tensors in Japan, for instance.
Fig. 4B shows the inversion result for one event, where the variancereduction and moment tensor solution is shown as a function of sourcedepth, the best solution is retrieved at 16 kmdepth that gives the largestvariance reduction, which is representative of the centroid depth of theevent at the epicenter location. The 3-component waveform that fits forall stations used in the inversion are shown in Fig. 4C for the best-fittingdepth. The syntheticwaveformsfit ratherwell the observed ones,with aVR = 80%. The scalar seismic moment, M0 is 1.23 × 10²¹ N·m, withMw=7.4. The percentages of DC and CLVD are 62% and 38%, respective-ly. The nodal planes are, 5°/55°/−104° and 208°/38°/−72° (strike/dip/rake), showing a normal sense of faulting for this outer rise event. Thissolution agrees rather well with the centroid moment tensor solutionpublished by the GCMT [M0 = 1.36 × 10²¹ N·m, Mw = 7.4, 20 kmcentroid depth and nodal planes given by, 3°/46°/−102°, and 200°/46°/−78° (strike/dip/rake)].
Next, we selected outer rise GCMT events and inverted for theirregional moment tensors following the methodology described in thisstudy. Fig. 5A shows the comparison of the solutions obtained in thisstudy and those computed by theGCTM. The faultingmechanism agreesrather well among events, and some minor differences appear, but arein the order of the expected error range for these kind of inversemethods, which are approximately ±20° (e.g. Hayes et al., 2013).However, inverting for regional moment tensors from broadband dataallows one to better constrain centroid depths, compared to methodol-ogies using teleseismic data. The centroid depths from GCMT tend to bepredominantly deeper that best source depths estimated in this study(Fig. 5B). Also, the spatial location of outer rise events shown inFig. 5A can differ because we used the epicenter location determinedby the NEIC, instead of centroid locations provided by the GCMT.
4. Results
Similarmethodologywas applied to thewhole set of events selectedin the outer rise region of the Maule rupture area. The seismic-to-noiseratio analyses conducted on broadband records allowed us to derivemoment tensors for a total of 28 events, listed in Table 1, for the south-ern events, and Table 2, for northern events. Both tables summarizeevent location, origin time, nodal planes, scalar seismicmoment,magni-tude, and the percentage of DC and CLVD. We also include the variancereduction and the number of stations used in the inversion.
For the study area and time period selected for this work, the GGMTreported a total of 14 centroid moment tensors for events in the outerrise. We analyzed a total of 29 events, including theMw 7.4 earthquake.
The sourcemechanism of southern outer rise events present normalfaulting, and some of them can be associated as aftershocks of theMw 7.4 outer trench slope earthquake (Fig. 6A). Most of the eventshave a strike similar to the strike of the Mw 7.4 and are closely parallelto the trench, and the rest of events are obliquely oriented with respectto the trench axis. From the best double-couple solutions, the majorityof events strike nearly parallel to the trench axis, except four eventsthat in average strike N20°W. The diversity of faulting mechanismsretrieved can be associated with the proximity to the Mocha FZ in theouter rise region. A strike slip event was triggered, and we suspectmay be associated with, a pre-existing complex fault system nearthe Mocha FZ. Also note that the possible reactivation of the Mocha FZlandwards of the trench has been already pointed out by Lange et al.(2012).
In terms of centroid depths, all events are shallower than theMw 7.4event, and located above the neutral plane (~20 kmdepth) that delimits

200km
400km
600km
800km
1000km
1200km
1400km
TRQA IUTRQA IUTRQA IUTRQA IU
ESP11 XH
TRQA IUTRQA IUTRQA IUTRQA IU
ESP04 XHESP07 XH
PEL1 CESP12 XH
ESP10 XHESP08 XH
PLCA GTPLCA GT
GO05 C
GO06 C
-78˚ -76˚ -74˚ -72˚ -70˚ -68˚ -66˚ -64˚ -62˚ -60˚
-46˚
-44˚
-42˚
-40˚
-38˚
-36˚
-34˚
-32˚
-30˚
0 4 8 12 16 20 24 28 32Depth [km ]
55
60
65
70
75
80
85
VR
[%]
0 4 8 12 16 20 24 28 32Depth [km ]
7.2
7.5
7.4
7.3
7.37.3
7.3 7.47.4
7.4
7.3
7.3
7.3
7.2
C Tangential Radial Vertical
ESP12_f0.030.data,59 Max Amp=2.96e-01 cmVR=81.2
95.00 sec
ESP11_f0.025.data,58 Max Amp=2.15e-01 cmVR=80.9
115.00 sec
ESP10_f0.025.data,59 Max Amp=2.22e-01 cmVR=79.4
115.00 sec
TRQA_f0.025.data,96 Max Amp=3.04e-01 cmVR=80.9
115.00 sec
ESP08_f0.025.data,58 Max Amp=2.13e-01 cmVR=78.9
115.00 sec
ESP04_f0.025.data,55 Max Amp=1.89e-01 cmVR=76.7
115.00 sec
Strike=5 ; 208
Rake =-104 ; -72
Dip =55 ; 38
Mo =1.23e+27
Mw =7.4
Percent DC=62
Percent CLVD=38
Percent ISO=0
Variance=5.89e-04
Var. Red=8.00e+01
RES/Pdc.=9.52e-06
P
T
(C)
BA
Fig. 4.Moment tensor solution for the February 27, 2010, Mw 7.4, outer trench slope earthquake. (A) Station map showing the epicenter location (gray star), regional broadband stations(triangles) and the concentric circles delimit the distance from the epicenter (plotted every 200 km). (B) Variance reduction as a function of source depth and beach balls are themomenttensors retrieved during the inversion at each source depth. (C)Waveforms fitting between synthetic (dashed line) and observed (solid line)waveforms at the best source depth, equal to16 km, that yields the largest variance reduction over several depths explored.
132 J.A. Ruiz, E. Contreras-Reyes / Tectonophysics 653 (2015) 127–139
the transition from tensional to compressional stress regimewithin theoceanic lithosphere (Seno and Yamanaka, 1996). Thus, the normalfaulting shallow intraplate outer rise events correlate well with theextensional stress regime expected in the outer rise in the early post-seismic phase of a megathrust earthquake (e.g. Christensen and Ruff,1988). This suggests that the Mw 7.4 event broke a shallower portionof the oceanic plate, whereas outer rise events were also triggered asresponse to the Mw 7.4 earthquake. The centroid depth variation ofevents covers from 5 to 20 km depth and the events are concentratedshallower than the hypocenter of the main shock (Mw = 7.4), whichis mechanically consistent with the extensional stress regime occurringin the outer trench slope zone.
From standard scaling laws (e.g. Strasser et al., 2010), we estimatedthe rupture fault plane dimensions (L × W = 120 × 30 km2) for theMw 7.4, with an average uniform slip of 1.4 m assuming a standardoceanic lithosphere with a rigidity of, μ ~ 30 GPa. We assumed nodalplanes from our best double-couple solution (Fig. 4C) and traced both
fault planes projected onto the free surface in Fig. 6A. It gives a rathergood idea of the rupture fault length of the Mw 7.4 outer rise event,which correlates well with the spatial distribution of the outer riseseismicity.
The northern outer rise events cover a larger region along the outertrench slope zone than the southern cluster, extending approximatelynorth–south for about 150–200 km length (Fig. 7A). All events presentnormal faulting mechanisms and strikes oriented approximately paral-lel to the trench axis. We observe similar magnitudes and focal mecha-nisms for all these events (most of them striking in average 38°, or 220°,for either one or the other nodal plane), with the largest with Mw 5.9.The best centroid depth for this set of outer rise events is ~10 km. Thenorthern outer rise seismicity is spatially correlated with the largestslip patch of the 2010, Mw 8.8, Maule earthquake, as shown in Fig. 8,in contrast to the southern outer rise events, which occurred offshoreat the south end of the rupture area and may have been triggeredmainly by the large Mw 7.4 outer trench slope earthquake.

0 50
Concepcion
Lota
Arauco
Lebu
Tirua 2010/02/27 Mw 7.4
2010/03/04 Mw 5.0
2010/03/10 Mw 5.1
2010/06/28 Mw 5.6
2011/11/25 Mw 5.0
2012/04/06 Mw 5.0
A
B
-77˚
-77˚
-76˚
-76˚
-75˚
-75˚
-74˚
-74˚
-73˚
-73˚
-72˚
-72˚
-39˚ -39˚
-38˚ -38˚
-37˚ -37˚
0
10
20
30
40
(km)
A
B
Moho
0
10
20
30
40
Dep
th [k
m]
0 40 80 120 160 200 240 280
Along profile A-B [km]
Fig. 5. Comparison of seismic moment tensors reported by the GCMT (dark gray) and the ones computed in this study (light gray). (A) Map view of the centroid (GCMT, colored circles)and epicenter (NEIC, colored squares) locations. Dashed line is the trench axis, and color bar represents centroid and hypocenter depths. (B) Cross-section A–B shows the centroid and bestsource depth estimated by CGMT and this study, respectively. Brown line presents the top of the oceanic subduction slab, purple dashed line is theMoho discontinuity and the blue solidline is the bathymetry (after Contreras-Reyes et al., 2008).
133J.A. Ruiz, E. Contreras-Reyes / Tectonophysics 653 (2015) 127–139
5. Discussion
5.1. Methodology and seismological results
The comparison of our regional moment tensor solutions againstthe GCMT solutions supports the reliability of our analysis and the rea-sonable solutions for the source mechanism. However, the regional
Table 1Earthquake sourceparameters and focalmechanisms for the outer rise events triggered in the sovariance reduction, DC, percentage of double-couple, CLVD, percentage of compensated linear
Date Time [UTC] Lon [°] Lat [°] Depth [km] M0 [D
Main 27-02-2010 8:01:21 −75.048 −37.773 16 1,23E
1 28-02-2010 10:43:07 −75.273 −38.501 16 3,13E2 01-03-2010 6:16:06 −74.928 −37.958 14 8,85E3 01-03-2010 8:58:32 −74.740 −37.850 12 3,09E4 04-03-2010 9:03:37 −74.582 −37.647 8 2,99E5 10-03-2010 16:00:51 −74.906 −38.093 14 2,75E6 20-03-2010 5:39:26 −74.863 −38.192 10 1,08E7 28-06-2010 0:59:46 −75.038 −37.910 10 2,11E8 25-11-2011 17:35:44 −75.032 −38.003 6 1,26E9 28-12-2011 19:54:24 −75.060 −37.941 8 1,08E10 06-01-2012 8:08:37 −75.091 −38.024 8 6,37E11 07-02-2012 12:02:11 −74.974 −37.902 8 7,41E12 06-04-2012 13:25:03 −75.019 −38.226 10 2,07E13 15-06-2012 5:43:11 −74.702 −38.188 6 8,48E14 24-08-2013 7:00:17 −75.272 −37.991 6 6,78E15 21-10-2013 18:17:21 −75.100 −37.809 8 2,78E
moment tensors provide better estimate of centroid depths as shownin this study for moderate magnitude events. The centroid depths ob-tained for both outer rise clusters are consistent with the mechanicalbehavior of the oceanic subduction slab subjects to bending in theouter rise zone. However, at regional distances and for off-shore eventsthe azimuth coverage is a permanent limitation when having oceanic-continental subduction zone margin, thus it is needed to use at least
uthern zone of theMaule rupture area. NP1 andNP2are nodal planes (strike/dip/rake), VR,vector dipole, and NST number of stations used in the inversion.
yne.cm] Mw NP1 NP2 VR DC CLVD NST
+ 30 7.40 5/55/−104 208/38/−72 79 62 38 6
+ 26 5.00 43/58/−88 219/32/−93 49 20 80 3+ 25 4.60 39/65/−93 227/25/−83 70 72 28 2+ 26 5.00 31/63/−83 196/27/−103 75 64 36 3+ 26 5.00 350/66/−125 229/41/−38 81 72 28 3+ 26 4.90 250/82/−15 342/75/−172 70 86 14 3+ 26 4.70 348/68/−100 193/24/−67 78 89 11 3+ 27 5.50 183/52/−124 51/49/−54 77 79 21 4+ 26 4.70 338/62/−95 168/29/−81 78 71 29 4+ 26 4.70 15/63/−82 179/28/−105 81 68 32 3+ 25 4.50 358/61/−89 175/29/−93 76 80 20 3+ 25 4.50 1/61/−89 179/29/−92 80 74 26 4+ 26 4.80 4/61/−91 186/29/−88 81 74 26 3+ 25 4.60 347/61/−96 179/30/−79 80 80 20 4+ 25 4.50 330/64/−96 164/26/−77 85 86 14 3+ 26 4.90 15/59/−87 190/31/−94 80 69 31 5

Table 2Same as Table 1, for outer rise events triggered in the northern zone of the study area.
Date Time [UTC] Lon [°] Lat [°] Depth [km] M0 [Dyne.cm] Mw NP1 NP2 VR DC CLVD NST
1 28-02-2010 1:45:29 −73.689 −34.450 12 7,45E + 26 5.20 45/60/−89 222/30/−92 67 65 35 42 28-02-2010 14:50:32 −73.287 −33.894 8 2,15E + 26 4.90 45/58/−85 216/32/−97 64 97 3 43 01-03-2010 5:30:35 −73.596 −34.674 8 1,79E + 26 4.80 40/55/−102 241/37/−73 56 77 23 54 01-03-2010 12:20:18 −73.736 −34.537 8 4,69E + 26 5.10 40/56/−96 231/35/−81 67 68 32 45 01-03-2010 14:36:30 −73.504 −34.390 8 6,35E + 26 5.20 44/55/−97 236/36/−80 60 65 35 46 01-03-2010 22:40:18 −73.814 −34.831 10 2,31E + 26 4.90 32/61/−98 228/30/−76 65 65 35 47 02-03-2010 9:44:56 −73.347 −34.162 10 1,39E + 26 4.70 40/63/−87 214/28/−95 70 91 9 48 08-03-2010 13:03:43 −73.820 −34.533 8 5,21E + 26 5.10 44/57/−93 229/34/−86 70 70 30 59 09-03-2010 21:59:23 −73.949 −34.765 12 1,51E + 26 4.80 24/54/−96 213/36/−82 68 90 10 410 10-03-2010 8:45:22 −73.831 −34.992 8 2,47E + 26 4.90 37/54/−91 218/36/−89 76 90 10 411 23-03-2010 3:44:58 −73.820 −34.808 10 1,39E + 26 4.70 32/58/−88 208/32/−94 67 85 15 512 21-10-2010 2:49:55 −73.726 −34.737 10 7,42E + 27 5.90 12/54/−112 227/42/−62 80 42 58 313 13-12-2010 18:51:04 −73.080 −33.989 6 4,98E + 26 5.10 63/59/−64 200/40/−125 78 78 22 3
134 J.A. Ruiz, E. Contreras-Reyes / Tectonophysics 653 (2015) 127–139
more than three stations to obtain robust solutions, as done in the sub-duction zone in Japan (e.g. Fukuyama and Dreger, 2000; Kubo et al.,2002). In our analysis, except for one event with a low VR, the regionalmoment tensors were obtained using at least more than three stations.
For the large outer trench slope event, Mw 7.4, the overlapping seis-mic waves issue was counterbalanced by using regional stations and a
Main
Ev01
Ev06
Ev07Ev08Ev10
Ev12
Ev13
Ev15
A
-77˚
-77˚
-76˚
-76˚
-75˚
-75˚
-39˚
-38˚
-37˚
A
B
0
10
20
30
40
Dep
th [k
m]
0 40 80 120
Along profile
Moho
350°C450°C
600°C
Fig. 6. Regional seismic moment tensors modeled in this study for the outer rise events locateddistribution of all regional moment tensor solutions, where colored circles correspond to its episible rupture fault planes (solid black line) assuming a rectangular fault. The dashed and solid dbar represents the best source depth estimated during the inversion. (B) Cross-section A–B shotwo nodal fault planes estimated along dip. Brown line is the top of the oceanic subducting slablack dashed, red solid and black dotted lines are the 350 °C, 450 °C and 600 °C isotherms, resphalf-spacemodel (e.g. Turcotte and Schubert, 1982). The estimateddepths for the isotherms areChile.
specific bandpass filter. Unfortunately, it was not possible to invert thecoseismic slip distribution or the source time function for this event.The rupture fault plane shown in Fig. 6was estimated based on standardscaling laws for intraplate earthquakes, howeverwith the seismologicaldataset available the along-dip slipped zone during the earthquake isnot well resolved.
0 50
Ev02
Ev03Ev04
Ev05
Ev09 Ev11
Ev14
B
-74˚
-74˚
-73˚
-73˚
-72˚
-72˚
-39˚
-38˚
-37˚
0
10
20
30
40
(km)
160 200 240 280
A-B [km]
in the southern region of the study area. (A) High resolution bathymetric map and spatialcenter location. For the largest outer trench slope event, Mw 7.4, we estimate the two pos-ark lines are the fault trace and fault edges projected to the free surface, respectively. Colorws the best source depth (centroid) estimated in this study and dark oblique lines are theb, purple dashed line is the Moho discontinuity, and blue solid line is the bathymetry. Theectively, computed for the subducting oceanic slab based on the cooling of a semi-infinitealso consistentwith the thermalmodel developed byVoelker et al. (2011) off south central

Valparaiso
0 50
Pichilemu
ic
Cauquenes
Constitucion
Cartagena
Ev01 Ev02
Ev03
Ev04
Ev05
Ev06
Ev07
Ev08
Ev09
Ev10 Ev11 Ev12
Ev13
A
B
-75˚
-75˚
-74˚
-74˚
-73˚
-73˚
-72˚
-72˚
-71˚
-71˚
-36˚ -36˚
-35˚ -35˚
-34˚ -34˚
-33˚ -33˚
0
10
20
30
40
(km)
A
B
0
5
10
15
20
25
30
35
40
Dep
th [k
m]
0 20 40 60 80 100 120 140 160 180 200
Along profile A-B [km]
Moho
350°C450°C
600°C
Fig. 7. Regional seismic moment tensors modeled in this study for the outer rise events located at the northern region of the study area. (A) High resolution bathymetric map and spatialdistribution of all regional moment tensor solutions computed in this study, where colored circles correspond to its epicenter location. Yellow line is the trench axis and the colorbar rep-resents the best source depth (centroid) estimated from the inversion. (B) Cross-section A–B shows the best source depth estimated in this study. Brown line is the top of the oceanicsubducting slab, purple dashed line is the Moho discontinuity, and blue solid line is the bathymetry (Moscoso and Contreras-Reyes, 2012). The black dashed, red lines, and black dottedlines are the 350 °C, 450 °C and 600 °C isotherms, respectively, computed for the subducting oceanic slab based on the cooling of a semi-infinite half-space model (e.g. Turcotte andSchubert, 1982).
135J.A. Ruiz, E. Contreras-Reyes / Tectonophysics 653 (2015) 127–139
5.2. Influence of the coseismic slip of the Maule megathrust earthquake onouter rise seismicity and adjacent areas
Fig. 8 shows the coseismic slip model of Moreno et al. (2012) andthe outer rise seismicity triggered by the Maule event. Most of theouter rise events (~70%) lie just west of the northern Maule asperity,which has the maximum peak-slip of ~15 m (Lorito et al., 2011; Vignyet al., 2011; Moreno et al., 2012). The observed outer rise seismicitycan be seen as a direct consequence of the stress transferred from thelarge coseismic slip of the northern asperity of the Maule event. Inter-estingly, the massive northern cluster of outer rise events is locatedwithin 50 km from the trench axis, which is the zone of maximumbending moment according to 3D flexure modeling of the oceanicNazca plate (Manríquez et al., 2014).
On the other hand, westward of the region of low coseismic slip (inthe epicentral region) between 36°S and 37°S, the outer rise of theoceanic Nazca plate presents little intraplate seismicity supportingthe idea that regions of low coseismic slip transfer little stress to thedowngoing plate (Christensen and Ruff, 1988; Dmowska and Lovison,1992). However, almost no outer rise seismic activity with events ofMw N 4.0 is observed in the outer rise west of the southern Maule as-perity (Fig. 8), even though ~10 m of slip is thought to have occurredon the megathrust here (Lorito et al., 2011; Moreno et al., 2012).
Instead, most of the outer rise seismicity is concentrated southwestof the southern Maule asperity, and some of the events are alignedwith the Mocha FZ.
A possible mechanism explaining the asymmetry of the outer riseseismic activity triggered by the southern asperity of the Mauleearthquake is the migration of the intraplate seismicity to regions ofpre-existing large intraplate faults and weakness. A natural candidateis the Mocha FZ, which hosts an uppermost oceanic mantle hydro-fractured up to depths of ~20 km according to seismic constraints(Contreras-Reyes et al., 2008). Fig. 6A shows that the largest extensionalevent (Mw 7.4) occurred just 40 km north of the Mocha FZ, and theassociate aftershocks sequence apparently migrated towards thetrenchward part of the Mocha FZ. Almost all events were extensionaland at depths shallower than 20 km (isotherm of 400–450 °C, Fig. 6B),and hence consistent with the proposed estimate for the depth of theneutral plane (~20 km) by Seno and Yamanaka (1996). One strike–slip event located near the Mocha FZ suggests the reactivation of thefossil transform fault. This interpretation is also supported not only bythe large spatial concentration of outer rise events, but also by the diver-sity in strike direction of the outer rise extensional events. Nevertheless,these events are concentrated at the trenchward part of the outer rise,where bending tensional plates are larger, rather than elsewherealong the fracture zone.

0 50 100
5
5
5
5
5
5
10
10
10
10
15
Valparais
Talcahuano
Lebu
Concepcion
Chillan
Los Angeles
Temuco
Pichilemu
Curico
Talca
Cauquenes
Tirua
Constitucion
Cobquecura
Angol
Linares
Arauco
San AntonioBathymetry
-77˚
-77˚
-76˚
-76˚
-75˚
-75˚
-74˚
-74˚
-73˚
-73˚
-72˚
-72˚
-71˚
-71˚
-39˚ -39˚
-38˚ -38˚
-37˚ -37˚
-36˚ -36˚
-35˚ -35˚
-34˚ -34˚
-33˚ -33˚
-10000-8000-6000-4000-2000
0200040006000
(m)
Fig. 8. Outer rise events located by the NEIC (yellow circles) that followed the 2010, Mw 8.8, Maule earthquake, in the period 27-02-2010 to 31-12-2013, including the large outer trenchslope Mw 7.4 earthquake. Circles are scaled to event magnitude. Blue line contours represent the amplitude of the coseismic slip of the 2010, Mw 8.8, Maule megathrust earthquake(Moreno et al., 2012).
136 J.A. Ruiz, E. Contreras-Reyes / Tectonophysics 653 (2015) 127–139
Reactivation of fossil transform faults as a consequence ofmegathrustearthquakes has also been reported off Sumatra with a sequence of largestrike–slip earthquakes of Mw N 8.4 (Meng et al., 2012). Coulomb stresschange calculations show that the coseismic slips of the Mw 9.2, 2004,Sumatra–Andaman megathrust earthquake can promote oceanic left-lateral strike–slip earthquakes on pre-existing meridian-aligned faultplanes (Delescluse et al., 2012). However, there is not much outer riseseismicity reported off Sumatra, where apparently most of the intra-plate seismicity is concentrated on the pre-existing meridian-alignedfault planes (some located several hundred of kilometers from theSumatra trench). In contrast, intraplate seismicity boosted by theMaule megathrust earthquake includes both outer rise seismicity andthe reactivation of a paleo-transform fault as shown in Fig. 1. Intraplatestresses inherited from the Maule main shock were not strong enoughto re-activate the Mocha FZ further seaward, andmost of the seismicitywas concentrated in the outer rise region. Nonetheless, intraplateevents with a significant strike–slip component support the idea ofreactivation of the paleo-transform fault.
5.3. Lithospheric strength and tectonic implications
The age of the oceanic Nazca plate is estimated to be ~34 and ~30Main the region of the northern and southern intraplate clusters, respec-tively (Tebbens et al., 1997). In Fig. 9, we show the yield strength
envelope of the oceanic lithosphere along with the depth distributionfor an oceanic plate representative of the studied region with a plateage of 32 Ma. Here the lithospheric strength is calculated by combiningByerlee's frictional sliding rule at shallow depth, and the rheology forwet olivine for the ductile portion (Kohlstedt et al., 1995). A geothermfor a 32 million year old lithosphere and a strain rate of 10−15 s−1 isassumed. The brittle–ductile transition for this 32 Myr old oceaniclithosphere occurs at ~21 km in the tensional regime, which is roughlythe depth limit for the largest Mw 7.4 outer rise event or overall outerrise events in the region (Fig. 9). The consistency between the strengthenvelope and the maximum depths of intraplate tensional eventssuggests that the earthquake sequence ruptured through the entirebrittle part of the oceanic lithosphere. The brittle–ductile transition isstrongly controlled by the thermal state of the oceanic plate, and it is anatural rheological boundary preventing deeper rupture for intraplateevents. Interestingly, and particularly for this case of a 32 Ma oceanicplate, the brittle–ductile transition depth is roughly coincident withthe 450 °C isotherm, which is suggested as the depth for the tension/compression transition (Seno and Yamanaka, 1996). Consistently, thetension/compression transition or neutral surface is also another deeplimit for tensional faulting.
Failure of the whole brittle upper part of the oceanic lithosphereis also consistent with previous studies that show that the oceanicNazca plate in the region is highly fractured as a consequence of

−1600 −1400 −1200 −1000 −800 −600 −400 −200 0 200 400−50
−45
−40
−35
−30
−25
−20
−15
−10
−5
0
compression tension
350°C
450°C
600°C
1000°C
Mw
7.4
tensional events??
?
yield stress [MPa]
dept
h [k
m]
Fig. 9. Strength envelope for an oceanic lithosphere 32Myr old. Stress differences or yield stress are limited at the top of the plate by frictional sliding rule according to Byerlee's frictionalsliding rule (red curve). Yield stress is limited at the base of the plate by steady state creep, which depends on the cube of the stress and exponentially on temperature (e.g. Kohlstedt et al.,1995). Isothermswere computed based on the cooling of a semi-infinite half-spacemodel (e.g. Turcotte and Schubert, 1982). The depth range for the outer rise events is delimited by theorange straight line. The brown orange straight line denotes the depth range of the largest Mw 7.4 outer rise. Please note that depths aremeasured from the seafloor. In contrast, for Figs. 6and 7, depths are measured from the sea level.
137J.A. Ruiz, E. Contreras-Reyes / Tectonophysics 653 (2015) 127–139
bending related faulting (Contreras-Reyes et al., 2008; Moscoso andContreras-Reyes, 2012). Active seismic investigations have foundevidence for active deformation on north–south trending faults, probablyresulting from the reactivation of the tectonic fabric of the seafloor(Contreras-Reyes et al., 2008; Moscoso and Contreras-Reyes, 2012). Inparticular, at ~36.5°S and ~38.5°S, Diaz-Naveas (1999) and Grevemeyeret al. (2005) imaged bending faults with seismic reflection data that cutat least ~6 km into the uppermost mantle. This mechanism has beenproposed to drive hydration of the upper part of the oceanic lithosphereand consequently mantle serpentinization (see for instance Faccenda,2014 for a review). Owing to the large number and great magnitude ofouter rise events boosted by the Maule megathrust earthquake, waterpercolation into the uppermantle is expected to bemore efficient duringthe co-seismic phase of large megathrust earthquakes (Moscoso andContreras-Reyes, 2012).
6. Conclusions
We analyzed the outer rise events triggered after the 2010 MauleMw 8.8 megathrust earthquake that occurred in south-central Chileand discuss its relationship to the subduction process and mechanismsresponsible for triggering such events. Our analysis focused on comput-ing regional seismic moment tensors for a large set of outer rise events(29 events with Mw ≥ 4.5) by inverting 3-component broadband re-gional waveforms.
We analyzed the largest outer rise event triggered by the Maulemainshock. This outer trench slope event, Mw 7.4, nucleated just 1.5 hafter the mainshock, had a normal fault mechanism and centroiddepth of about 16 km; all these characteristics strongly suggest that itwas triggered as a direct response to the stress transfer from the slipped
megathrust fault to the outer trench slope zone in the very early post-seismic phase. This event was located off shore the southern edge ofthe mainshock rupture area, near the oceanic Mocha FZ.
Intense outer rise seismicity following the 2010 Maule earthquakewas spatially distributed in twomain zones. The northern zone, offshorethe largest slip patch during the Maule earthquake, concentrated mostof the outer rise seismicity. Offshore the southern edge of the Maulerupture area, a second cluster of outer rise seismicity was triggeredwith fewer events compared to the north.
According to our moment tensor solutions, most of the intraplateevents were tensional, with centroid depths located in the upper20 km of the subducting oceanic plate; however, the northern andsouthern outer rise events present distinctive characteristics. Similarfocalmechanismswere obtained for all outer rise events in the northernzone, which are characterized by an extensional sense of faulting, samestrike angle (in average 38°, or 220°, for either one or the other nodalplane) and present little fluctuation in terms of magnitudes andcentroid depths.
In contrast, even if most of the southern outer rise events were asso-ciated with extensional faulting, a few events present a different focalmechanism. The centroid depth of events varies from 5 to 20 kmdepth, and present comparable magnitudes. The majority of eventsstrike nearly parallel to the trench axis, except four events withaverage strike of N20°W. Several large events nucleated near thetrenchward part of the oceanic Mocha FZ, and some of these eventshave a significant strike–slip component aligned with this oceanicfeature.
The predicted yield strength envelope for 32 Ma oceanic lithopheresuggests that intraplate tensional events rupture through the entirebrittle part of the oceanic lithosphere up to depths of 20 km.

138 J.A. Ruiz, E. Contreras-Reyes / Tectonophysics 653 (2015) 127–139
Acknowledgments
We thank the IRIS data center and NEIC for providing easy access toworldwide broadband waveforms. Some figures were drawn with thesoftware package Generic Mapping Tools (GMT) v4.5 (Wessel andSmith, 1998). Signal processing was done using Seismic Analisis Code,SAC (Goldstein et al., 2003). We gratefully acknowledge the support ofthe Chilean COmisión Nacional de Investigación Y Tecnología (CONICYT)under the grant USA2012-001 (Cooperación Chile-EEUU). We thankthe Editor, and two anonymous reviewers for suggestions and com-ments that improved the manuscript. We kindly thank Dr. Anne Trehufor helpful comments and for proofreading the manuscript. We alsothank Hiroo Kanamori for useful comments and suggestions.
References
Ammon, C.J., Kanamori, H., Lay, T., 2008. A great earthquake doublet and seismic stresstransfer cycle in the central Kuril Islands. Nat. Lett. 451, 561–565. http://dx.doi.org/10.1038/nature06521.
Asano, Y., Saito, T., Ito, Y., Shiomi, K., Hirose, H., Matsumoto, T., Aoi, S., Hori, S., Sekiguchi,S., 2011. Spatial distribution and focal mechanisms of aftershocks of the 2011 off thePacific coast of Tohoku earthquake. Earth Planets Space 63 (7), 669–673. http://dx.doi.org/10.5047/eps.2011.06.016.
Campos, J., Hatzfeld, D., Madariaga, R., Lopez, G., Kausel, E., Zollo, A., Barrientos, S., Lyon-Caen, H., 2002. The 1835 seismic gap in south central Chile. Phys. Earth Planet.Inter. 132, 177–195.
Chapple, W.M., Forsyth, D.W., 1979. Earthquakes and bending of plates at trenches.J. Geophys. Res. 84 (B12), 6729–6749. http://dx.doi.org/10.1029/JB084iB12p06729.
Christensen, D.H., Ruff, L.J., 1988. Seismic coupling and outer rise earthquakes. J. Geophys.Res. 93 (B11), 13421–13444. http://dx.doi.org/10.1029/JB093iB11p13421.
Clouard, V., Campos, J., Lemoine, A., Perez, A., Kausel, E., 2007. Outer rise stress changesrelated to the subduction of the Juan Fernandez Ridge, central Chile. J. Geophys.Res. 112, B05305. http://dx.doi.org/10.1029/2005JB003999.
Contreras-Reyes, E., Grevemeyer, I., Flueh, E.R., Reichert, C., 2008. Upper lithosphericstructure of the subduction zone offshore of southern Arauco peninsula, Chile, at~38°S. J. Geophys. Res. 113, B07303. http://dx.doi.org/10.1029/2007JB005569.
Delescluse, M., Chamot-Rooke, N., Cattin, R., Fleitout, L., Trubienko, O., Vigny, C., 2012.April 2012 intra-oceanic seismicity off Sumatra boosted by the Banda-Acehmegathrust. Nature 490, 240–244. http://dx.doi.org/10.1038/nature11520.
Delouis, B., Nocquet, J.-M., Vallée, M., 2010. Slip distribution of the February 27, 2010Mw = 8.8 Maule earthquake, central Chile, from static and high-rate GPS, InSAR,and broadband teleseismic data. Geophys. Res. Lett. 37, L17305. http://dx.doi.org/10.1029/2010GL043899.
Diaz-Naveas, J.L., 1999. Sediment subduction and accretion at the Chilean convergentmargin between 35 and 40S. Ph.D. thesis. Univ. of Kiel, Kiel, Germany.
Dmowska, R., Lovison, L., 1992. Influence of asperities along subduction interfaces on thestressing and seismicity of adjacent areas. Tectonophysics 211, 23–43.
Dmowska, R., Rice, J.R., Lovison, L.C., Josell, D., 1988. Stress transfer and seismic phenom-ena in coupled subduction zones during the earthquake cycle. J. Geophys. Res. 93(B7), 7869–7884. http://dx.doi.org/10.1029/JB093iB07p07869.
Dmowska, R., Zheng, G., Rice, J.R., 1996. Seismicity and deformation at convergentmargins due to heterogeneous coupling. J. Geophys. Res. 101 (B2), 3015–3029.http://dx.doi.org/10.1029/95JB03122.
Dreger, D.S., 2003. TDMT_INV: time domain seismic moment tensor INVersion. Int.Handb. Earthq. Eng. Seismol. 81B, 1627.
Faccenda, M., 2014. Water in the slab: a triology. Tectonophysics http://dx.doi.org/10.1016/j.tecto.2013.12.020.
Farías, M., Comte, D., Roecker, S., Carrizo, D., Pardo, M., 2011. Crustal extensional faultingtriggered by the 2010 Chilean earthquake: the Pichilemu Seismic Sequence. Tectonics30, TC6010. http://dx.doi.org/10.1029/2011TC002888.
Fritz, H.M., Petroff, C.M., Catalan, P.A., Cienfuegos, R., Winckler, P., Kalligeris, N., Weiss, R.,Barrientos, S.E., Meneses, G., Valderas-Bermejo, C., Ebeling, C., Papadopulus, A.,Contreras, M., Almar, R., Dominguez, J.C., Synolakis, C.E., 2011. Field survey of the27 February 2010 Chile tsunami. Pure Appl. Geophys. 168, 1989–2010. http://dx.doi.org/10.1007/s00024-011-0283-5.
Fukuyama, E., Dreger, D., 2000. Performance test of an automated moment tensor de-termination system for the future “Tokai” earthquake. Earth Planets Space 52,383–392.
Goldstein, P., Dodge, D., Firpo, M., Minner, L., 2003. SAC2000: signal processing and anal-ysis tools for seismologists and engineers. In: Lee,W.H.K., Kanamori, H., Jennings, P.C.,Kisslinger, C. (Eds.), IASPEI International Handbook of Earthquake and EngineeringSeismology. Academic Press, Amsterdam & Boston.
Grevemeyer, I., Kaul, N., Diaz-Naveas, J.L., Villinger, H., Ranero, C.R., Reichert, C., 2005. Heatflow and bending-related faulting at subduction trenches: Case studies offshore ofNicaragua and central Chile. Earth Planet. Sci. Lett. 236, 238–248. http://dx.doi.org/10.1016/j.epsl.2005.04.048.
Hayes, G.P., Bergman, E., Johnson, K.L., Benz, H.M., Brown, L., Meltzer, A., 2013.Seismotectonic framework of the February 27, 2010 Mw 8.8 Maule, Chile earth-quake sequence. Geophys. J. Int. 195 (2), 1034–1051. http://dx.doi.org/10.1093/gji/ggt238.
Kanamori, H., 1971. Seismological evidence for a lithospheric normal faulting — theSanriku earthquake of 1933. Phys. Earth Planet. Inter. 4, 289–300.
Khazaradze, G., Klotz, J., 2003. Short- and long-term effects of GPS measured crustaldeformation rates along the south central Andes. J. Geophys. Res. 108, 2289. http://dx.doi.org/10.1029/2002JB001879.
Kohlstedt, D.L., Evans, B., Mackwell, S.J., 1995. Strength of the lithosphere — constraintsimposed by laboratory experiments. J. Geophys. Res. 100 (B9), 17,587–17,602.
Korrat, I., Madariaga, R., 1986. Rupture of the Valparaiso (Chile) gap from 1971 to 1985.In: Das, S., Boatwright, J., Scholz, C. (Eds.), Earthquake Source Mechanics, MauriceEwing Ser vol. 6. AGU, Washington, D. C., pp. 247–258.
Kubo, A., Fukuyama, E., Kawai, H., Nonomura, K., 2002. NIED seismic moment tensorcatalogue for regional earthquakes around Japan: quality test and application.Tectonophysics 356 (1–3), 23–48. http://dx.doi.org/10.1016/S0040-1951(02)00375-X.
Lange, D., Tilmann, F., Barrientos, S., Contreras-Reyes, E., Methe, P., Moreno, M., Heit, B.,Agurto, H., Bernard, P., Vilotte, J.-P., Beck, S., 2012. Aftershock seismicity of the 27February 2010 Mw 8.8 Maule earthquake rupture zone. Earth Planet. Sci. Lett. 317–318C, 413–425. http://dx.doi.org/10.1016/j.epsl.2011.11.034.
Lay, T., Ammon, C.J., Kanamori, H., Rivera, L., Koper, K.D., Hutko, A.R., 2010. The 2009Samoa–Tonga great earthquake triggered doublet. Nature 466, 964–968. http://dx.doi.org/10.1038/nature09214.
Lay, T., Ammon, C.J., Kanamori, H., Kim, M.J., Xue, L., 2011. Outer trench-slope faulting andthe 2011 Mw 9.0 off the Pacific coast of Tohoku earthquake. Earth Planets Space 63,713–718. http://dx.doi.org/10.5047/eps.2011.05.006.
Lomnitz, C., 2004. Major earthquakes of Chile: a historical survey, 1535–1960. Seismol.Res. Lett. 75 (3), 368–378. http://dx.doi.org/10.1785/gssrl.75.3.368.
Lorito, S., Romano, F., Atzori, S., Tong, X., Avallone, A., McCloskey, J., Cocco, M., Boschi, E.,Piatanesi, A., 2011. Limited overlap between the seismic gap and coseismic slip of thegreat 2010 Chile earthquake. Nat. Geosci. 4, 173–177. http://dx.doi.org/10.1038/ngeo1073.
Madariaga, R., Métois, M., Vigny, C., Campos, J., 2010. Central Chile finally breaks. Science328 (5975), 181–182. http://dx.doi.org/10.1126/science.1189197.
Manríquez, P., Contreras-Reyes, E., Osses, A., 2014. Lithospheric 3D flexure modellingseaward of the oceanic plate seaward of the trench using variable elastic thickness.Geophys. J. Int. 196, 681–693. http://dx.doi.org/10.1093/gji/ggt464.
Meng, L., Ampuero, J.-P., Stock, J., Duputel, Z., Luo, Y., Tsai, V.C., 2012. Earthquake in aMaze: Compressional Rupture Branching During the 2012 Mw 8.6 Sumatra Earth-quake. Science 337 (6095), 724–726. http://dx.doi.org/10.1126/science.1224030.
Moreno, M., Melnick, D., Rosenau, M., Baez, J., Klotz, J., Oncken, O., Tassara, A., Chen, J.,Bataille, K., Bevis, M., Socquet, A., Bolte, J., Vigny, C., Brooks, B., Ryder, I., Grund, V.,Smalley, B., Carrizo, D., Bartsch, M., Hase, H., 2012. Toward understanding tectoniccontrol on the Mw 8.8 2010 Maule Chile earthquake. Earth Planet. Sci. Lett. 321–322, 152–165. http://dx.doi.org/10.1016/j.epsl.2012.01.006.
Moscoso, E., Contreras-Reyes, E., 2012. Outer rise seismicity related to the Maule, Chile2010 megathrust earthquake and hydration of the incoming oceanic lithosphere.Andean Geol. 39 (3), 564–572. http://dx.doi.org/10.5027/andgeoV39n3-a12.
Obana, K., Fujie, G., Takahashi, T., Yamamoto, Y., Nakamura, Y., Kodaira, S., Takahashi, N.,Kaneda, Y., Shinohara, M., 2012. Normal-faulting earthquakes beneath the outerslope of the Japan Trench after the 2011 Tohoku earthquake: implications for thestress regime in the incoming Pacific plate. Geophys. Res. Lett. 39, L00G24. http://dx.doi.org/10.1029/2011GL050399.
Pasyanos, M.E., Dreger, D.S., Romanowicz, B., 1996. Toward real-time estimation ofregional moment tensors. Bull. Seismol. Soc. Am. 86 (5), 1255–1269.
Rietbrock, A., Ryder, I., Hayes, G., Haberland, C., Comte, D., Roecker, S., Lyon-Caen, H., 2012.Aftershock seismicity of the 2010MauleMw=8.8, Chile, earthquake: correlation be-tween co-seismic slip models and aftershock distribution? Geophys. Res. Lett. 39,L08310. http://dx.doi.org/10.1029/2012GL051308.
Ritsema, J., Lay, T., 1995. Long-period regional wave moment tensor inversion for earth-quakes in the western United States. J. Geophys. Res. 100 (B6), 9853–9864. http://dx.doi.org/10.1029/95JB00238.
Ruegg, J.C., Rudloff, A., Vigny, C., Madariaga, R., de Chabalier, J.B., Campos, J., Kausel, E.,Barrientos, S., Dimitrov, D., 2009. Interseismic strain accumulation measured byGPS in the seismic gap between Constitución and Concepción in Chile. Phys. EarthPlanet. Inter. 175, 78–85.
Ruiz, J.A., Hayes, G.P., Carrizo, D., Kanamori, H., Socquet, A., Comte, D., 2014. Seismologicalanalyses of the 2010 March 11, Pichilemu, Chile Mw 7.0 and Mw 6.9 coastal intra-plate earthquakes. Geophys. J. Int. 197 (1), 414–434. http://dx.doi.org/10.1093/gji/ggt513.
Ryder, I., Rietbrock, A., Kelson, K., Burgmann, R., Floyd, M., Socquet, A., Vigny, C., Carrizo,D., 2012. Large extensional aftershocks in the continental forearc triggered by the2010 Maule earthquake, Chile. Geophys. J. Int. http://dx.doi.org/10.1111/j.1365-246X.2011.05321.x.
Saikia, C.K., 1994. Modified frequency–wavenumber algorithm for regionalseismograms using Filon's quadrature: modelling of Lg waves in eastern NorthAmerica. Geophys. J. Int. 118, 142–158. http://dx.doi.org/10.1111/j.1365-246X.1994.tb04680.x.
Seno, T., Yamanaka, Y., 1996. Double seismic zones, compressional deep trench-outer riseevents and superplumes. In: Bebout, G., et al. (Eds.), Subduction: Top to Bottom.Geophys. Monogr. Ser. vol. 96. AGU, Washington, D. C., pp. 347–355.
Spence, W., 1986. The 1977 Sumba Earthquake Series: Evidence for Slab Pull Force Actingat a Subduction Zone. J. Geophys. Res. 91 (B7), 7225–7239. http://dx.doi.org/10.1029/JB091iB07p07225.
Strasser, F.O., Arango,M.C., Bommer, J.J., 2010. Scaling of the source dimensions of interfaceand intraslab subduction-zone earthquakes with moment magnitude. 81 (No. 6),941–950. http://dx.doi.org/10.1785/gssrl.81.6.941.
Taylor, M.A., Zheng, G., Rice, J.R., Stuart, W.D., Dmowska, R., 1996. Cyclic stressingand seismicity at strongly coupled subduction zones. J. Geophys. Res. 101 (B4),8363–8381. http://dx.doi.org/10.1029/95JB03561.

139J.A. Ruiz, E. Contreras-Reyes / Tectonophysics 653 (2015) 127–139
Tebbens, S.F., Cande, S.C., Kovacs, L., Parra, J.C., LaBrecque, J.L., Vergara, H., 1997. The Chileridge: a tectonic framework. J. Geophys. Res. 102, 12,035–12,060. http://dx.doi.org/10.1029/96JB02581.
Turcotte, D., Schubert, G., 1982. Geodynamics—Applications of Continuum Physics toGeological Problems. John Wiley, Hoboken, N. J. (464 pp.).
Vargas, G., Farías, M., Carretier, S., Tassara, A., Baize, S., Melnick, D., 2011. Coastal uplift andtsunami effects associated to the 2010 Mw 8.8 Maule earthquake in central Chile.Andean Geol. 38 (1), 219–238.
Vigny, C., et al., 2011. The 2010 Mw 8.8 Maule megathrust earthquake of central Chile,monitored by GPS. Science 332, 1417. http://dx.doi.org/10.1126/science.1204132.
Voelker, D., Grevemeyer, I., Stipp, M., Wang, K., He, J., 2011. Thermal control of theseismogenic zone of southern central Chile. J. Geophys. Res. 116. http://dx.doi.org/10.1029/2011JB008247.
Wessel, P., Smith,W.H.F., 1998. New, improved version of generic mapping tools released.EOS Trans. Am. Geophys. Union 79 (47), 579.
Yue, H., Lay, T., Koper, K.D., 2012. En échelon and orthogonal fault ruptures of the 11 April2012 great intraplate earthquakes. Nature 490, 245–249. http://dx.doi.org/10.1038/nature11492.


