Embed Size (px)
Citation preview
14
PARTPARTPARTPART I.I.I.I. OWNERSHIPOWNERSHIPOWNERSHIPOWNERSHIP CONTROLCONTROLCONTROLCONTROL ANDANDANDAND PERFORMANCE:PERFORMANCE:PERFORMANCE:PERFORMANCE:COUNTRYCOUNTRYCOUNTRYCOUNTRY STUDIESSTUDIESSTUDIESSTUDIES
CHAPTERCHAPTERCHAPTERCHAPTER I.I.I.I. BULGARIA
bybybybyMitkoMitkoMitkoMitko DimitrovDimitrovDimitrovDimitrov andandandand EvgeniEvgeniEvgeniEvgeni PeevPeevPeevPeev
I.I.I.I. OwnershipOwnershipOwnershipOwnershipandandandandControlControlControlControl Structures:Structures:Structures:Structures: AAAAMacro-LevelMacro-LevelMacro-LevelMacro-LevelAnalysisAnalysisAnalysisAnalysis inininin BulgariaBulgariaBulgariaBulgaria
1.1.1.1. OwnershipOwnershipOwnershipOwnership StructureStructureStructureStructure
Changes in the ownership structure are among the most important characteristics ofthe transition to market economy and the conditions in which enterprises operate.In order to study this problem, however, it is not sufficient to just analyse the ratioof state-owned and private enterprises. It should be known whether privateenterprises are privatised former state ones or de novo established, whether stateenterprises are transformed into entities of new legal status, or not. It is thereforenecessary to examine not only the changes in ownership structure and its presentcondition, but also the distribution of enterprises by their legal status.
1.1.1.1.1.1.1.1. FormsFormsFormsForms ofofofof EconomicEconomicEconomicEconomicEntitiesEntitiesEntitiesEntities inininin BulgariaBulgariaBulgariaBulgariaThe legal status of economic agents in Bulgaria is regulated by the Law onCommerce1111 which was adopted in June 1991 and which was aiming to harmonisethe Bulgarian legislation with that of developed market economies. It was difficultto obtain a complete identity, since the historical and cultural specifics of differentWest European counties had resulted also in the forms of their economic activity.The goal, therefore, was an approximation rather in the essence and not in theterms, so that the Bulgarian system was made consistent with the western one.
Pursuant to the provisions of the Law on Commerce, a merchant is the commondenotation for any physical or legal person engaged in business activity(purchasing and sale of merchandise, production, services, financial transactions,etc.) in Bulgaria. A merchant can be a commercial company, a cooperative or aperson who has established an enterprise requiring that its activity be conducted asa commercial business. A "merchant" therefore is the most general concept onwhich the Law on Commerce is based.
1 Law on Commerce, State Gazette, 48/18.06.1991.
15
The private merchant is the first form of economic activity envisaged by the Law,which refers to any physical person who is registered at the court and who bearsfull liability for his obligations.
The association of two or more physical or legal persons for the purpose ofperforming business activities is denoted as a commercial company. A commercialcompany shall be any of the following: an unlimited partnership, a limitedpartnership, a private limited company, a public limited company, and a publiclimited partnership.
An unlimited partnership is a company incorporated by two or more personsengaged in business activity (commercial transactions) who bear joint andunlimited liability.
In the case when one or more of the partners bear joint and unlimited liability whilethe liability of the remaining members is limited to the extent of their pledgedcontribution, the commercial company is called a limited partnership. Themanagement and representation of the company is executed by the unlimited liablepartners.
A private limited company (Ltd.) is formed by one or more persons who are heldliable to the extent of their contribution to the company's capital. The managingbodies of the company include the general meeting of the partners and themanaging director. Should the company have more than 50 employees, they shallbe represented at the general meeting with the right to a deliberative vote only.
A public limited company (Pic.) is a company, which has its capital divided intoshares and which is liable to its creditors to the extent of its assets. The managingbodies of Pic. include a general meeting of the members and a board of directors(one-tier system) or a supervisory board and a management board (two-tiersystem). The members of the board of directors, respectively of the managementboard, represent the company jointly, except when provided otherwise by itsarticles of association. The difference comes from the fact that in a two-tier systemthe members of the management board are appointed by the supervisory board andnot directly by the shareholders.
A public limited partnership is similar to the limited partnership except for thataspect that the limited liable partners are issued shares in return for their capital.The company is promoted and managed by the general partners who have a votingright in the general meeting and constitute the board of directors.
Apart from these main forms of merchants, the Law on Commerce provides alsofor the existence of their alliances, or commercial groups, such as consortiums andholdings. The consortium is a contract-based group of merchants, while the holdingis a public limited company established for the purpose of management, withoutengaging in any production or commercial activity of its own.
The Law on Commerce contains also provisions for the legal forms of state- ownedand municipal enterprises, the main of them including the single-person private
16
limited company and the single-person public limited company (corporatised firmswith a hundred percent state participation). The formation of other commercialcompanies or associations thereof is further allowed. It is also provided that, byvirtue of a law, state-owned enterprises can be founded which are not commercialcompanies. The incorporation and transformation of state- owned enterprises insingle-person public (or, private) limited companies is regulated by a special law,while the municipal companies are subject to a resolution by the municipal council.
1.2.1.2.1.2.1.2. EnterprisesEnterprisesEnterprisesEnterprises RestructuringRestructuringRestructuringRestructuring inininin TermsTermsTermsTerms ofofofof OwnershipOwnershipOwnershipOwnership andandandand LegalLegalLegalLegal StatusStatusStatusStatus
The most considerable changes in the industrial organisation of the Bulgarianeconomy are related to its organisation structure. These were accomplished in twomain directions, namely: changes in the organisation forms of state-ownedenterprises and a sharp increase in the number and forms of commercial companiesowned by other economic agents, legal and physical persons mostly.
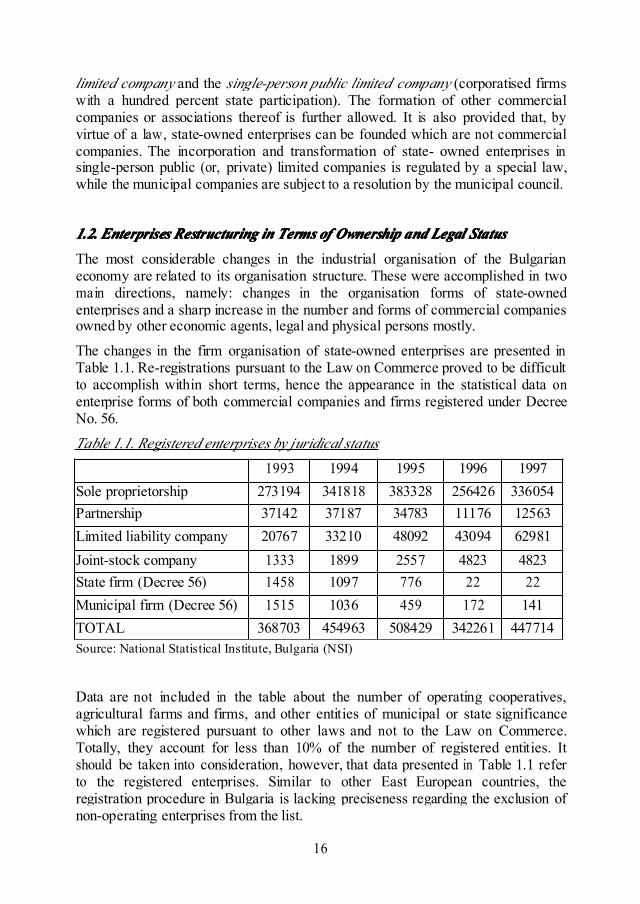
The changes in the firm organisation of state-owned enterprises are presented inTable 1.1. Re-registrations pursuant to the Law on Commerce proved to be difficultto accomplish within short terms, hence the appearance in the statistical data onenterprise forms of both commercial companies and firms registered under DecreeNo. 56.
Table 1.1. Registered enterprises by juridical status
1993 1994 1995 1996 1997Sole proprietorship 273194 341818 383328 256426 336054Partnership 37142 37187 34783 11176 12563Limited liability company 20767 33210 48092 43094 62981Joint-stock company 1333 1899 2557 4823 4823State firm (Decree 56) 1458 1097 776 22 22Municipal firm (Decree 56) 1515 1036 459 172 141TOTAL 368703 454963 508429 342261 447714Source: National Statistical Institute, Bulgaria (NSI)
Data are not included in the table about the number of operating cooperatives,agricultural farms and firms, and other entities of municipal or state significancewhich are registered pursuant to other laws and not to the Law on Commerce.Totally, they account for less than 10% of the number of registered entities. Itshould be taken into consideration, however, that data presented in Table 1.1 referto the registered enterprises. Similar to other East European countries, theregistration procedure in Bulgaria is lacking preciseness regarding the exclusion ofnon-operating enterprises from the list.
17
There is no reliable information neither about the failed enterprises nor about those,which have changed their juridical status or have merged with other enterprises. In1996 a re-registration of the enterprises was made in order to be created a betterinformation base for the real acting enterprises. As a result of the re-registration thetotal number of the enterprises diminished about 1/3. This is about the samepercentage with which diminished the total number of the enterprises in the CzechRepublic or Hungary as a result of the executed in these countries re-registration ofthe enterprises in 1995 or 1996. It seems that the processes in Eastern Europeancountries have many similar features and all the lime there appear proves for this indifferent areas.
If we examine the data for the different juridical forms of organisation, thetendencies in most cases differ essentially from the general tendency. Theregistered decrease of the number of the uncorporatised state and municipal firmsis normal. The reasons are their privatisation and the continuation of the process oftheir transformation according to the Law on Commerce.
The joint-stock companies sharply increase their number in 1996. This is due partlyto the including of about 1000 state enterprises in the scheme for massprivatisation. As a part of the preparation of this process a few hundreds statelimited liability companies were transformed in shareholding companies.
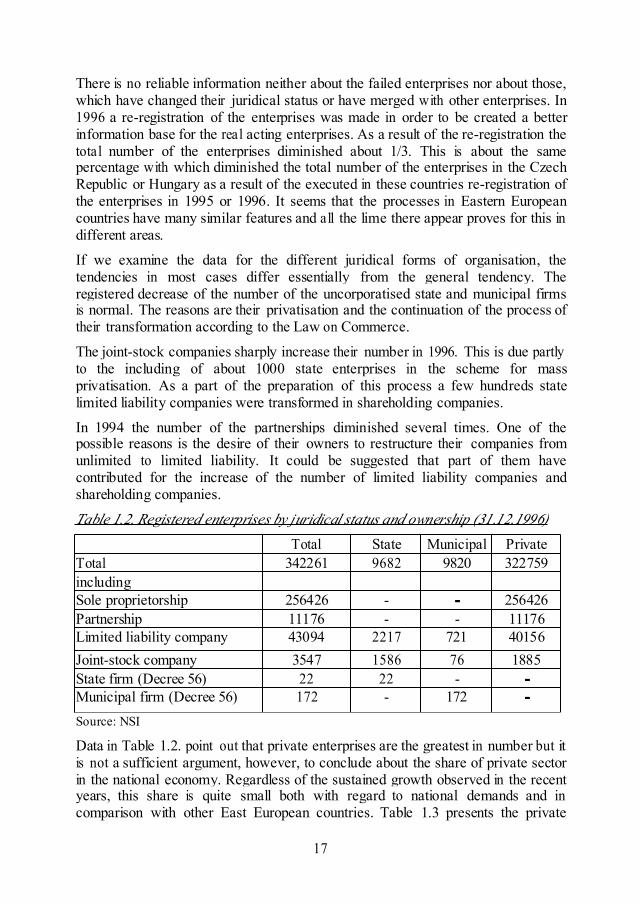
In 1994 the number of the partnerships diminished several times. One of thepossible reasons is the desire of their owners to restructure their companies fromunlimited to limited liability. It could be suggested that part of them havecontributed for the increase of the number of limited liability companies andshareholding companies.
Table 1.2. Registered enterprises by juridical status and ownership (31.12.1996)
Total State Municipal PrivateTotal 342261 9682 9820 322759includingSole proprietorship 256426 - ---- 256426Partnership 11176 - - 11176Limited liability company 43094 2217 721 40156Joint-stock company 3547 1586 76 1885State firm (Decree 56) 22 22 - ----Municipal firm (Decree 56) 172 - 172 ----
Source: NSI
Data in Table 1.2. point out that private enterprises are the greatest in number but itis not a sufficient argument, however, to conclude about the share of private sectorin the national economy. Regardless of the sustained growth observed in the recentyears, this share is quite small both with regard to national demands and incomparison with other East European countries. Table 1.3 presents the private
18
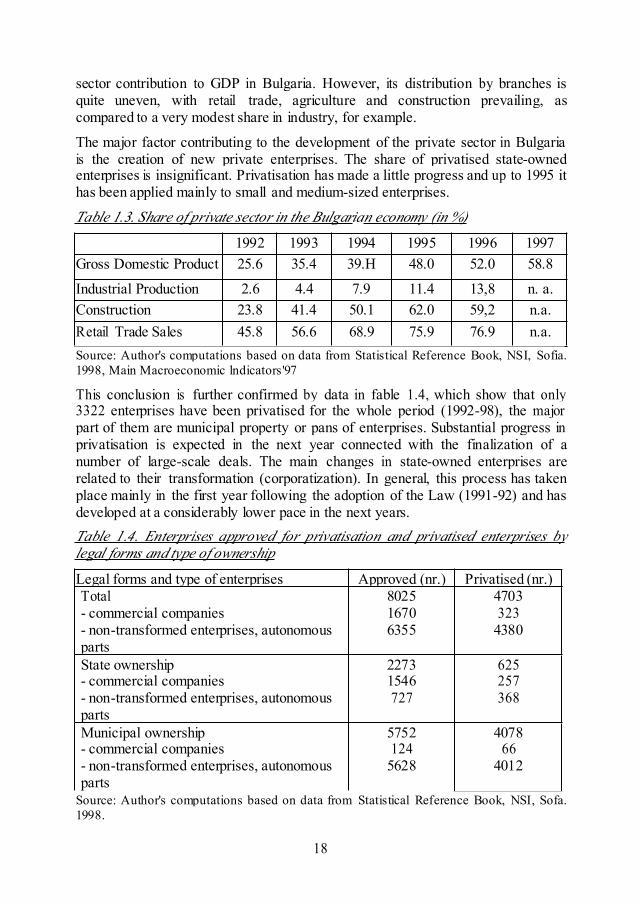
sector contribution to GDP in Bulgaria. However, its distribution by branches isquite uneven, with retail trade, agriculture and construction prevailing, ascompared to a very modest share in industry, for example.
The major factor contributing to the development of the private sector in Bulgariais the creation of new private enterprises. The share of privatised state-ownedenterprises is insignificant. Privatisation has made a little progress and up to 1995 ithas been applied mainly to small and medium-sized enterprises.
Table 1.3. Share of private sector in the Bulgarian economy (in %)
1992 1993 1994 1995 1996 1997Gross Domestic Product 25.6 35.4 39.H 48.0 52.0 58.8
Industrial Production 2.6 4.4 7.9 11.4 13,8 n. a.Construction 23.8 41.4 50.1 62.0 59,2 n.a.Retail Trade Sales 45.8 56.6 68.9 75.9 76.9 n.a.Source: Author's computations based on data from Statistical Reference Book, NSI, Sofia.1998, Main Macroeconomic lndicators'97
This conclusion is further confirmed by data in fable 1.4, which show that only3322 enterprises have been privatised for the whole period (1992-98), the majorpart of them are municipal property or pans of enterprises. Substantial progress inprivatisation is expected in the next year connected with the finalization of anumber of large-scale deals. The main changes in state-owned enterprises arerelated to their transformation (corporatization). In general, this process has takenplace mainly in the first year following the adoption of the Law (1991-92) and hasdeveloped at a considerably lower pace in the next years.Table 1.4. Enterprises approved for privatisation and privatised enterprises bylegal forms and type of ownership
Legal forms and type of enterprises Approved (nr.) Privatised (nr.)Total- commercial companies- non-transformed enterprises, autonomousparts
802516706355
4703323
4380
State ownership- commercial companies- non-transformed enterprises, autonomousparts
22731546727
625257368
Municipal ownership- commercial companies- non-transformed enterprises, autonomousparts
5752124
5628
407866
4012
Source: Author's computations based on data from Statistical Reference Book, NSI, Sofa.1998.
19
After 1993, non-transformed state-owned and municipal firms decreased twice innumber. This was due to two main reasons: first, the continuing process oftransformation, and, second, the privatisation of non-transformed state-ownedenterprises.
Comparing the figures in Table 1.4. on the number of approved for privatisationnon-transformed enterprises it can be concluded about a prevailing policy towardsprivatisation without a preliminary transformation of enterprises.
The general conclusion can be made, therefore, that changes in the ownershipstructure of Bulgarian economy are still at their initial stage. Most probably, thecreation of modern forms of economic organisation will be completed in the nextyears. Certain problems can emerge in the functioning of enterprises, stemmingfrom insufficient changes in ownership patterns.
2.2.2.2. ControlControlControlControl StructureStructureStructureStructureEvery randomly selected criterion of types of corporate control in a mixedeconomy fails to reflect faithfully the reality of the Bulgarian transitional economy.The formal quantitative stake in corporate assets does not determine at present whohas real control on particular enterprise and especially on corporatized state-ownedenterprises. A more suitable classification of firms by type of control includes theboth quantitative and qualitative indicators.
According to the classical criterion, corporations may be classified by thefollowing types of control: 1) private control - one party-individual, family,financial group, etc., owns 50-80% of shares; 2) majority control - one party owns50-80% of shares; 3) minority control - one party owns 20-50% of shares; 4)control by legal device; 5) managerial control - if there is no base for externalcontrol.2222
This classification is used by other scholars in order to provide a basis for studyingthe evolution of control structures in a mixed economy. It also serves as a startingpoint for creating a corresponding classification of types of control in a transitioneconomy.
There is no official statistical information about the control types in the Bulgarianeconomy. According to recent publication of the Bulgarian National StatisticalInstitute the ownership distribution in the privatized state enterprises is as follows(percentage of privatized objects): personnel - 32,6, Bulgarian physical persons -33,2, foreign physical persons - 0,4, Bulgarian juridical persons - 30,8 and foreignjuridical persons - 3. (Currant economic conjuncture in Bulgaria, Sofia, 30November, 1997).
2 Berle, A., and Means, G., Modern Corporation and Private Ownership, New York, 1932.
20
Empirical studies show some specific control structures of enterprises in theBulgarian economy in transition.3
2.1.2.1.2.1.2.1. PrivatePrivatePrivatePrivate andandandandMajorityMajorityMajorityMajority ControlControlControlControl
The prevailing types of control of private de novo and privatised companies are theprivate and majority control. One group of the companies under private control arecharacterised with dominant outsider stake of company assets. But these outsideinstitutional shareholders are: 1) firms owned by the company managers and 2)firms with company managerial participation in their ownership. Other group of thefirms under private control have dominant workers stake. But these firms are notprevailing as the former ones.
The companies under majority control are characterised with two groups firms aswell. Some of the enterprises are with dominant outsider stake as this largeshareholder is private firm. Essential feature of these firms are managerialparticipation in the company assets and the board of directors. The other companieshave dominant managerial stake of their assets. One party, usually private firmowned by company managers is the large shareholder in these firms.
The described control structures are characterised with some key features: first, thelarge shareholder has formal effective control on the managerial behaviour throughnominating the members of board of directors, obtaining real companyinformation, hiring and firing of managers. This control type diminishes thetransaction costs for the monitoring over the managers. These costs become lowerthan the ones of companies with dispersed ownership between many smallshareholders; second, the large shareholder brings more risk and has strongermotivation to compel managers for strategies maximising the shareholders wealth.
2.22.22.22.2 ControlControlControlControl BasedBasedBasedBased onononon UnestablishedUnestablishedUnestablishedUnestablishedPropertyPropertyPropertyProperty RightsRightsRightsRights andandandand InterestInterestInterestInterest GroupsGroupsGroupsGroups
Despite 100% state participation in their ownership, the corporatized state-ownedcompanies are mainly under managerial control and interest group control. Thesetypes of control are based on unestablished property rights and informal influenceby groups other than the nominal owner State. This peculiar transition kind ofcontrol is implicit and unstable.
3 See for example, Hare, P., and Peev, E., The Sole-Trader Company and ManagerialBehaviour in a Transitional Economy, Discussion Paper in Economics, No. 94/12, 1994,Heriot-Watt University; Peev, E., and Hare, P., Corporatization and Control in theTransitional Economy, Economic Systems, Vol. 19, No. 4, December 1995, pp. 265-283;Peev. E., and Simmons, C. Property-Rights, Managerial Strategies and EnterpriseAdjustment: Bulgaria in Transition, Journal of Southern Europe and the Balkans, Issue 3,forthcoming, 2000.
21
Unestablished property rights are such property rights structures which fail todetermine clearly who owns company assets, who is a bearer of residual risk, whois a decision-maker, who nominates members of the board of directors. In thisownership structure, however, there are different degrees of managerial discretion.
Another key feature of the control structure of the sole-trader company with ahundred percent state participation is the influence of interest groups other thanState. In the Bulgarian state-owned companies interest groups other than the ownerState are trade unions, political forces, finance groups. In the distinct companiesthey have different degrees of influence on management.
2.3.2.3.2.3.2.3. RetainedRetainedRetainedRetained andandandand ClearClearClearClear GovernmentGovernmentGovernmentGovernment ControlControlControlControl
Among state-owned companies there are also companies with purposefullyretained and clear government control. But their number is small and this controlstructure is not typical of the companies with 100% state participation. The keyfeatures of the control structures observed in the empirical studies are following:first, in the existing so far private sector, private and privatised firms, there isstrong owner type of control that is the base for constraining potential discretionarymanagerial behaviour; second, in the private companies managers participateclosely in company ownership, they have stake of private firms-large owners ofcompany assets, directly own company ownership and seat on the board ofdirectors; third, contrary to the conventional view that 100% state ownership meansstrong government control as well, the state-owned enterprises are characterisedwith of a high potential for managerial discretion.
2.4.2.4.2.4.2.4. ManagerialManagerialManagerialManagerial ControlControlControlControl andandandandMinorityMinorityMinorityMinority ControlControlControlControl
It can be expected that after the mass privatisation many companies, especiallylarge firms, would acquire dispersed ownership structure. Managerial and minoritytypes of control would be emerged. There would be separation of ownership fromcontrol and potential for inefficient managerial behaviour.
3.3.3.3. GovernanceGovernanceGovernanceGovernance structuresstructuresstructuresstructuresExamination of literature shows that in corporations there are agency problemsbetween shareholders and managers that arise as a result of the former and thelatter having different motives different risk-aversion, and different strategies.Because the owners are residual risk-bearers, they are interested in pursuingefficient strategies and there are governance mechanisms for disciplining potentialmanagerial opportunism and shirking. Some governance structures in moderncorporations are: ownership concentration, managerial ownership, the board of
22
directors, managerial compensation, capital and managerial markets, markets foreconomic environment etc.
For the purposes of studying enterprises in transition it is important to know whichof the governance structures surveyed have a basic influence in discipliningmanagers. Empirical studies try to examine some of these governance mechanismsof new established companies in Bulgaria.4
3.1.3.1.3.1.3.1. OwnershipOwnershipOwnershipOwnership ConcentrationConcentrationConcentrationConcentration
The high degree of concentration of company assets at the hands of one party -private firm, firms coalition, etc., is the most important governance mechanism tocompel managers to behave effectively in the newly established private firms andprivatised firms. Because the stockholdings are concentrated the large shareholdersmay receive reliable information about the company's performance. Owners havebroad powers to remove managers. Managers may feel constrained to pursuestrategies, which are in the shareholders' best interests. The struggle for corporatecontrol between top managers, employees, state officers and outsider interestgroups of state-owned companies ends after privatisation. The peculiar separationof ownership from control between these economic agents was transformed inownership concentration and strong control of large shareholders. However, theirbehaviour is not as efficient as predicted the conventional theory because of thespecific transition "crony capitalism'"conditions.
In its policy to shift all the risks of the reforms onto state-owned companies, thestate shows clearly inefficient behaviour. Contrary to the theory, instead of theowner with 100% participation constraining the potential for managerialopportunism in the sole-trader state-owned company, the same opportunism isdemonstrated by the owner himself. The empirical studies provide a number ofexamples about this strange owner motivation. In this unique situation it is notprobably for any one other than the nominal owner to constrain managers andencourage them to pursue strategies for efficient adjustment and restructuring.These efficient agents would be managers or interest groups but the efficiency oftheir behaviour depends on chance and not on the institutional structure given. Inshort, the high state ownership concentration of companies gives rise rathermanagerial discretion than strong government control.
4 Peev. E. Separation of Ownership and Control in the Transition: the Case of Bulgaria,Europe-Asia Studies, vol. 47, No 5, 1995, pp. 859-875 .
23
3.2.3.2.3.2.3.2. ManagerialManagerialManagerialManagerial OwnershipOwnershipOwnershipOwnership
As the governance structure described above this is another important mechanismfor efficient managerial behaviour in the private and privatised firms. Managerstake participation in company property directly or through their ownership stake inthe private firm, the large company shareholder. Both cases have a basic influencein disciplining managers for more efficient behaviour.
In state-owned companies the managers do not take part in ownership because theState has 100% participation. The legal way to change their implicit control overthe company into explicit control based on private established property rights ismanagers to offer privatisation proposals on their own initiative. This futureownership stake is both strong managerial intensive to privatisation and efficientgovernance device constraining managerial opportunism in the transition.
3.33.33.33.3 BoardBoardBoardBoard ofofofof DirectorsDirectorsDirectorsDirectors
In the private and privatised companies established so far the board of directors ischaracterised as institution with real power. The investigations indicate that thisgovernance body has strong influence on strategic decisions. The top-managers siton board of directors in many companies. This shows again that in the newlyestablished private sector managers have explicit control based on their privateownership stake.In the state-owned joint-stock companies the board of directors is a specificgovernance structure. The lack of other shareholders besides the State in thecompanies in question gives grounds to assume that the board of directors isassigned a key role in the control of the enterprises. Empirical investigations,however, reveal that the role of the board of directors in company adjustment isquite passive. Typically, the board of directors of a particular company is appointedby the government and the other interest groups, which take no risk. It is controlledby them and, at the same time, must exhibit a efficient economic behaviour andplease those who determine the membership of the board. But this leads to themembers of the board taking a rather passive role, which depends on their moraland personal human qualities rather than on clear mechanisms for efficientbehaviour.
3.4.3.4.3.4.3.4. CapitalCapitalCapitalCapital andandandandManagerialManagerialManagerialManagerial LabourLabourLabourLabourMarketsMarketsMarketsMarkets
The Bulgarian Stock Exchange - Sofia began to function on 21 October 1997. Thestart of the real transactions based on free supply and demand was on 24 November1997. Till the end of the year only three transactions were concluded. At the sametime OTC markets functioned as well and according to expert estimations the bulkof the transactions were concluded in these markets. Empirical studies indicate thatthe influence of market mechanisms is weak in the prívate and slate-owned firms
24
as well. Top managers have no plans for company participation in capital markets.The market for managerial services is only a fledgling one.
Because the market mechanisms (capital and managerial labour markets and themarket for corporate control) have remained undeveloped, the main incentives forcontrol over managers of private and privatised firms are direct non-market ones.Transaction costs are low because of the high ownership concentration andmanagerial participation of company ownership. This indicates again moreeffective corporate governance of the private companies than the state-owned ones.
However, after the forthcoming "mass" privatisation many companies would obtaindispersed property structure and transaction costs will rise because of need formonitoring of managerial decisions by many small shareholders. Under theseconditions different governance structures requiring lower transaction costs arelikely to be introduced: consolidation of shareholding by proxy battles,concentration of ownership in large blocks and other cheaper mechanisms to giveshareholders more power over management.
3.5.3.5.3.5.3.5. GeneralGeneralGeneralGeneral Semi-MarketSemi-MarketSemi-MarketSemi-Market EnvironmentEnvironmentEnvironmentEnvironment
The general economic environment in Bulgaria during the period studied ischaracterised as a very unstable and very "noisy". Under these specificcircumstances it is difficult to the owners to decide correctly if bad firmperformance is result of managerial mistakes or good economic position asoutcome of real managerial efforts. The most efficient governance mechanisms ofthe private and privatised firms become ownership concentration and owner-manager participation in decision-making.
In the state-owned companies the formal governance structures described aboveindicate the lack of strict institutional mechanisms for disciplining managers andthe broad scope for managerial discretion. But investigations also show theexistence of specific informal mechanisms for influencing managers. One suchpeculiar mechanism is the struggle between different interest groups for the controlof a given company.
Indicators for this unorthodox "market for corporate control" are the extent ofinvolvement of forces other than the nominally authorised ones in determining theboard of directors and the managers, the extent of involvement of such forces in theday-to-day running of the company, the degree of turnover of the companyexecutives and others. But this quasi-market delays the privatisation and goes onthe existing of the implicit managerial control.
25
4.4.4.4. EnterpriseEnterpriseEnterpriseEnterprise SizeSizeSizeSize StructureStructureStructureStructure
4.1.4.1.4.1.4.1. SourcesSourcesSourcesSources forforforfor ChangeChangeChangeChange ofofofof thethethethe SizeSizeSizeSize StructureStructureStructureStructureThe main reasons for deformed size structure of the enterprises in centrallymanaged economies are, first, the believing that only large-size production andtherefore the large-sized enterprises are effective and second, the wish to manageless at number economic entities which leads to centralisation of the existingenterprises.
At third place we can add the fears that the existing of an autonomous, marketoriented sector of small enterprises will help the economic and political unstabilityof the communist system which led to the continuously liquidation of this groupenterprises in most of the socialist countries.
The overcoming of the deform size structure of the enterprises in the period oftransition to market economy began exactly with the decline of the limitations inthe mentioned fields. First comes the development of the newly-established privateenterprises. Since they are SME as a rule, their vigorous development bought out aconsiderable growth of the relative percentage of these enterprises in the overallstructure. Second, there is the process of decentralisation of the state enterprises.Decentralising brought out growth in the overall number of enterprises anddecrease in the percentage of the large ones. Third, there is the establishing of newstate, municipal etc. non-private enterprises. Fourth, together with these sources ofincrease of the number of the enterprises it is necessary to point out one, whichleads to its decrease - liquidation of the loss-makers.
Another group of factors is connected with the change of the number of theemployees and change of the belonging of an enterprise to a certain size group.First, reducing overmanned on social reasons labour force, which varies from 20%to 40% for the different countries or different branches. Second, one should takeinto account the reduce of the employees because of the reduce of the production.The reasons could be short-term - crisis of the adjustment or middle- term - changeof the specialisation because of opening of the economy.
The mentioned two groups of factors start to act from the beginning of thetransition and it is expected that they would have short-term or middle-terminfluence. Together with them we could expect the influence of long-term factors.First, it can be expected a certain decrease of the number of the enterprises as aresult of the processes of decentralisation and demonopolization of enterprises.Second, further decrease of the number of the employed in an enterprise remainingor even increase the volume of the production as a result of the improvement oflabour productivity which now is a few times lower than it is in the developedcountries.
26
4.2.4.2.4.2.4.2. DecentralisationDecentralisationDecentralisationDecentralisation ofofofof thethethethe StateStateStateState EnterprisesEnterprisesEnterprisesEnterprises
In 1991 in Bulgaria began a process of decentralisation of the big state firms andcomplexes, existing till now, which was connected with establishment of newenterprises from their former production units. The main part of the enterpriseswere decentralised in 1991 although the process continued in the next few years.The number of the state enterprises increased in the industry from 5631 (1989) to3508 (1991) and to 4048 (1994), in the construction from 705 (1989) to 1154(1991) and to 1313 (1993), in the transport from 89 (1989) to 506 (1991) and to651 (1993), etc. After 1994-95 the number of the state enterprises began todecrease because of finishing the process of decentralization and increase in theprocess of privatization.
The analysis of the process of decentralisation of the state enterprises in thecountries from Central and South-Eastern Europe showed the existing of twomodels. The first of them (Bulgaria, Czech Republic), which can be called fulldecentralisation, is characterised with wholly separation of the former combinâtesin their composite enterprises in almost all branches.
As exceptions, subject to specific government decisions are considered usually themilitary production and some vertical combincombincombincombinââââtestestestes of a very important nationalsignificance. This approach is measured with 6-8 times increase in the number ofthe state enterprises.The applying of the second model (Romania), which can be determined as a partlydecentralisation, leads to 2-3 times increase in the number of the enterprises as aresult of the separation of obvious cases of production and economic unconnectedenterprises.
The advantages of the first model are in providing maximum opportunities forinclusion of the enterprises in a new type of division of labour, respectively in anew type of integration at national and international level, in the creation of betterconditions for competitiveness and for abolishing the monopolies.The disadvantages, which were best revealed in the Bulgarian case, are thedifficulties with the management of the many times increased number ofenterprises in conditions when the semi-market environment cannot be used as adisciplining factor. The situation of the Bulgarian enterprises was additionallycomplicated by the delaying of the privatisation.
Probably in order to avoid such weak points, the "full decentralisation" wasexecuted in the Czech Republic in two stages. The first stage was carried out in thebeginning of the reform and the second - as a part of the privatisation process.There were no limits whether to be privatised whole combinâtes, separateenterprises of their specific parts.
The decisions were taken by the state institutions choosing between severalcompeting projects. In this way the possibilities for management remain, the statecould not pass the clear cases of "hidden" privatisation, the executing of "full
27
decentralisation" coincides with the finding of new private owners.
The advantages of the "partly decentralisation" are the easier management and thekeeping of the existing production-technology links. The main disadvantage ishampering the privatisation and putting burdens in front of their restructuring, i.e.conditions for keeping and reproduction of the existing structure of the economyare created.
4.3.4.3.4.3.4.3. CreationCreationCreationCreation ofofofof NewNewNewNewPrivatePrivatePrivatePrivate EnterprisesEnterprisesEnterprisesEnterprises
In Bulgaria the number of the newly created private enterprises increasedextremely fast. Before 1989 they practically have missed, in the end of 1990 theirnumber reached 25 thousand and in the end of 1997 - 380 thousand. The speed ofthe process depends mostly on the conditions in the beginning of the transitionperiod - for example in Hungary the growth is comparatively less because evenbefore 1989 in this country there were conditions for carrying out specific forms ofprivate activity.
The general macroeconomic conditions and the policy concerning the small andmedium business definitely influence the distribution and the stability of the newlycreated private enterprises. The unstable macroeconomic situation in Bulgaria, thehigh interest rates, the high inflation, the crisis in the bank system limited theopportunities for establishment of new private enterprises and led to failure a largepart of also created firms. Besides in Bulgaria there is no policy in favour of thesmall and medium business - there is no a specific law, no financial alleviation, nocreated network for informational and consulting services, for education, etc.
It is necessary the process of establishment of new private enterprises to beencouraged, eased and supported. The reality is different. At least for Bulgaria itcan be said that the new small and medium private enterprises were created in spiteof the lack of a support from the state due to the initiative and the entrepreneurialspirit of the people. The specialised funds for crediting are insufficient and mostlyforeign originated, there is not a law on small and medium business, theentrepreneurship centres are not connected between each other, etc.
4.44.44.44.4 IncreaseIncreaseIncreaseIncreaseofofofof thethethethe TotalTotalTotalTotalNumberNumberNumberNumber ofofofof thethethethe EnterprisesEnterprisesEnterprisesEnterprises
The common tendency which can be seen in all countries from Central and South-Eastern Europe is the very quick increase in the total number of the enterprises(See Table 5.4.1. for Bulgaria). The second common feature is that the main sourceof this increase is the development of small and medium business.
When the significance of the mentioned figures is estimated, it is necessary tomake some specifications. As a rule the total number of the enterprises in EasternEurope includes the number of the registered, not the number of the activeenterprises. One of the used decisions of the problem is re-registration of the
28
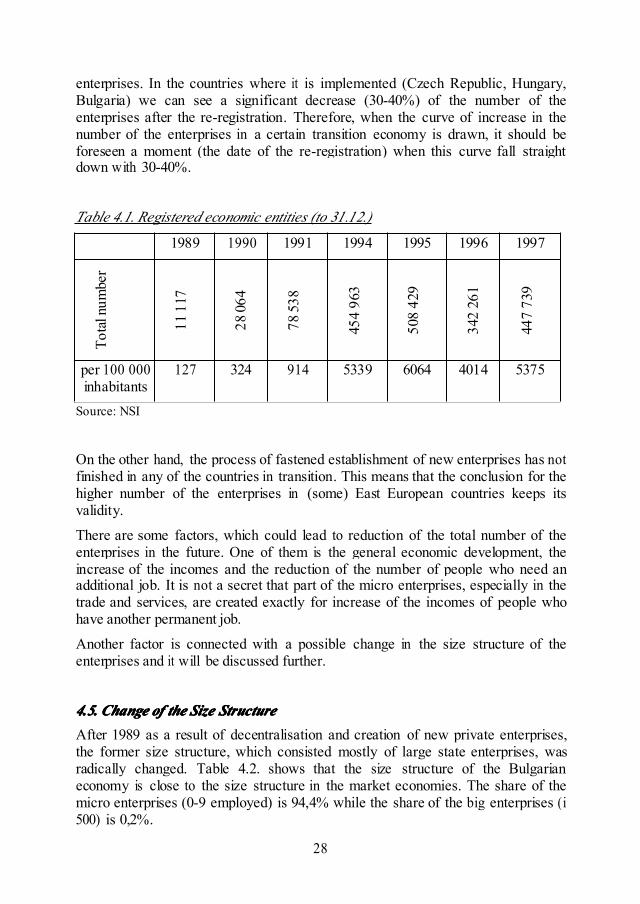
enterprises. In the countries where it is implemented (Czech Republic, Hungary,Bulgaria) we can see a significant decrease (30-40%) of the number of theenterprises after the re-registration. Therefore, when the curve of increase in thenumber of the enterprises in a certain transition economy is drawn, it should beforeseen a moment (the date of the re-registration) when this curve fall straightdown with 30-40%.
Table 4.1. Registered economic entities (to 31.12.)
1989 1990 1991 1994 1995 1996 1997
Tota
lnum
ber
1111
7
2806
4
7853
8
454
963
508
429
342
261
447
739
per 100 000inhabitants
127 324 914 5339 6064 4014 5375
Source: NSI
On the other hand, the process of fastened establishment of new enterprises has notfinished in any of the countries in transition. This means that the conclusion for thehigher number of the enterprises in (some) East European countries keeps itsvalidity.
There are some factors, which could lead to reduction of the total number of theenterprises in the future. One of them is the general economic development, theincrease of the incomes and the reduction of the number of people who need anadditional job. It is not a secret that part of the micro enterprises, especially in thetrade and services, are created exactly for increase of the incomes of people whohave another permanent job.
Another factor is connected with a possible change in the size structure of theenterprises and it will be discussed further.
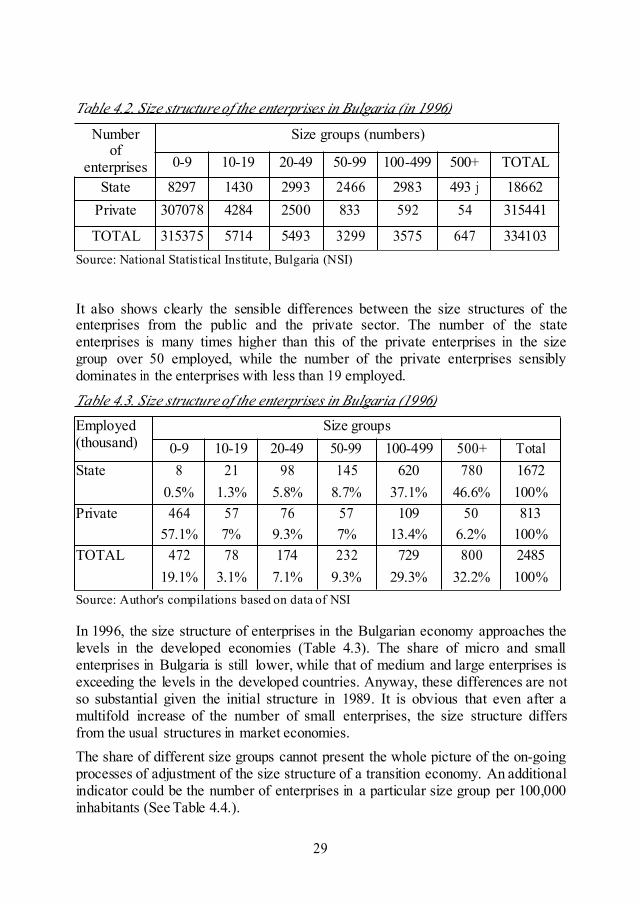
4.5.4.5.4.5.4.5. ChangeChangeChangeChange ofofofof thethethethe SizeSizeSizeSize StructureStructureStructureStructureAfter 1989 as a result of decentralisation and creation of new private enterprises,the former size structure, which consisted mostly of large state enterprises, wasradically changed. Table 4.2. shows that the size structure of the Bulgarianeconomy is close to the size structure in the market economies. The share of themicro enterprises (0-9 employed) is 94,4% while the share of the big enterprises (i500) is 0,2%.
29
Table 4.2. Size structure of the enterprises in Bulgaria (in 1996)
Numberof
enterprises
Size groups (numbers)
0-9 10-19 20-49 50-99 100-499 500+ TOTAL
State 8297 1430 2993 2466 2983 493 j 18662Private 307078 4284 2500 833 592 54 315441
TOTAL 315375 5714 5493 3299 3575 647 334103Source: National Statistical Institute, Bulgaria (NSI)
It also shows clearly the sensible differences between the size structures of theenterprises from the public and the private sector. The number of the stateenterprises is many times higher than this of the private enterprises in the sizegroup over 50 employed, while the number of the private enterprises sensiblydominates in the enterprises with less than 19 employed.
Table 4.3. Size structure of the enterprises in Bulgaria (1996)
Employed(thousand)
Size groups0-9 10-19 20-49 50-99 100-499 500+ Total
State 8 21 98 145 620 780 16720.5% 1.3% 5.8% 8.7% 37.1% 46.6% 100%
Private 464 57 76 57 109 50 81357.1% 7% 9.3% 7% 13.4% 6.2% 100%
TOTAL 472 78 174 232 729 800 248519.1% 3.1% 7.1% 9.3% 29.3% 32.2% 100%
Source: Author's compilations based on data of NSI
In 1996, the size structure of enterprises in the Bulgarian economy approaches thelevels in the developed economies (Table 4.3). The share of micro and smallenterprises in Bulgaria is still lower, while that of medium and large enterprises isexceeding the levels in the developed countries. Anyway, these differences are notso substantial given the initial structure in 1989. It is obvious that even after amultifold increase of the number of small enterprises, the size structure differsfrom the usual structures in market economies.The share of different size groups cannot present the whole picture of the on-goingprocesses of adjustment of the size structure of a transition economy. An additionalindicator could be the number of enterprises in a particular size group per 100,000inhabitants (See Table 4.4.).
30
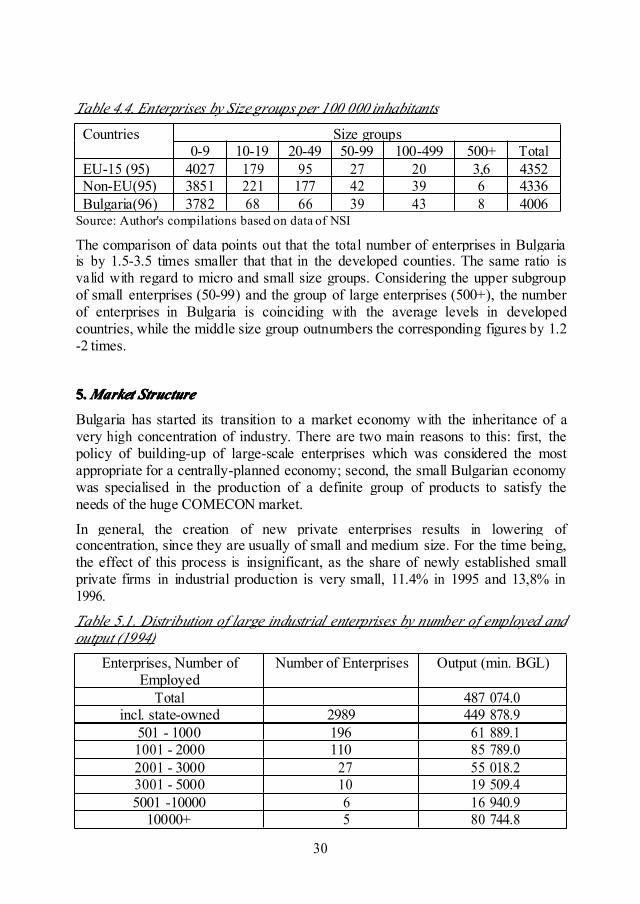
Table 4.4. Enterprises by Size groups per 100 000 inhabitants
Countries Size groups0-9 10-19 20-49 50-99 100-499 500+ Total
EU-15 (95) 4027 179 95 27 20 3,6 4352Non-EU(95) 3851 221 177 42 39 6 4336Bulgaria(96) 3782 68 66 39 43 8 4006
Source: Author's compilations based on data of NSI
The comparison of data points out that the total number of enterprises in Bulgariais by 1.5-3.5 times smaller that that in the developed counties. The same ratio isvalid with regard to micro and small size groups. Considering the upper subgroupof small enterprises (50-99) and the group of large enterprises (500+), the numberof enterprises in Bulgaria is coinciding with the average levels in developedcountries, while the middle size group outnumbers the corresponding figures by 1.2-2 times.
5.5.5.5.MarketMarketMarketMarket StructureStructureStructureStructure
Bulgaria has started its transition to a market economy with the inheritance of avery high concentration of industry. There are two main reasons to this: first, thepolicy of building-up of large-scale enterprises which was considered the mostappropriate for a centrally-planned economy; second, the small Bulgarian economywas specialised in the production of a definite group of products to satisfy theneeds of the huge COMECON market.
In general, the creation of new private enterprises results in lowering ofconcentration, since they are usually of small and medium size. For the time being,the effect of this process is insignificant, as the share of newly established smallprivate firms in industrial production is very small, 11.4% in 1995 and 13,8% in1996.
Table 5.1. Distribution of large industrial enterprises by number of employed andoutput (1994)
Enterprises, Number ofEmployed
Number of Enterprises Output (min. BGL)
Total 487 074.0incl. state-owned 2989 449 878.9
501 - 1000 196 61 889.11001 - 2000 110 85 789.02001 - 3000 27 55 018.23001 - 5000 10 19 509.45001 -10000 6 16 940.9
10000+ 5 80 744.8
31
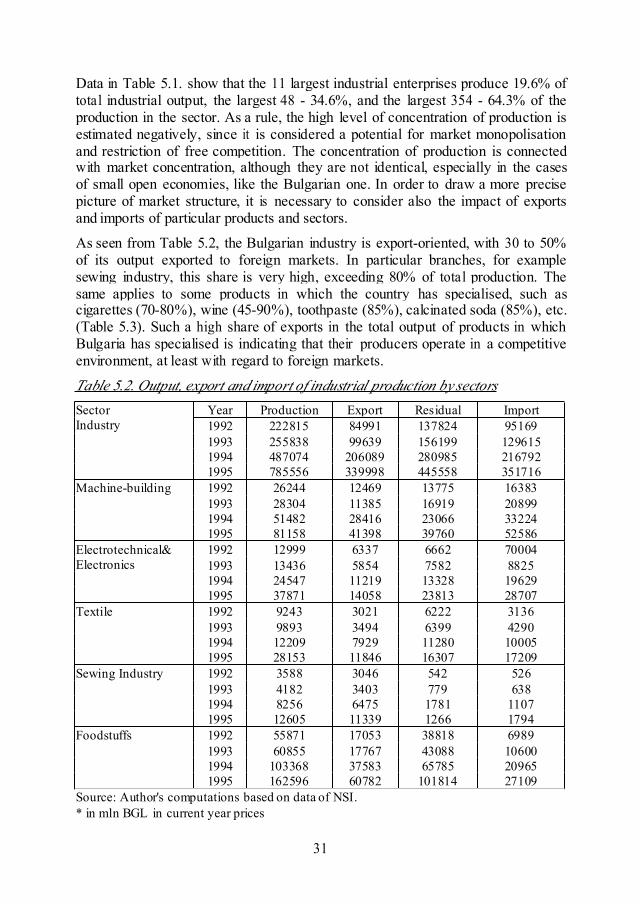
Data in Table 5.1. show that the 11 largest industrial enterprises produce 19.6% oftotal industrial output, the largest 48 - 34.6%, and the largest 354 - 64.3% of theproduction in the sector. As a rule, the high level of concentration of production isestimated negatively, since it is considered a potential for market monopolisationand restriction of free competition. The concentration of production is connectedwith market concentration, although they are not identical, especially in the casesof small open economies, like the Bulgarian one. In order to draw a more precisepicture of market structure, it is necessary to consider also the impact of exportsand imports of particular products and sectors.
As seen from Table 5.2, the Bulgarian industry is export-oriented, with 30 to 50%of its output exported to foreign markets. In particular branches, for examplesewing industry, this share is very high, exceeding 80% of total production. Thesame applies to some products in which the country has specialised, such ascigarettes (70-80%), wine (45-90%), toothpaste (85%), calcinated soda (85%), etc.(Table 5.3). Such a high share of exports in the total output of products in whichBulgaria has specialised is indicating that their producers operate in a competitiveenvironment, at least with regard to foreign markets.
Table 5.2. Output, export and import of industrial production by sectorsSectorIndustry
Year Production Export Residual Import1992 222815 84991 137824 951691993 255838 99639 156199 1296151994 487074 206089 280985 2167921995 785556 339998 445558 351716
Machine-building 1992 26244 12469 13775 163831993 28304 11385 16919 208991994 51482 28416 23066 332241995 81158 41398 39760 52586
Electrotechnical&Electronics
1992 12999 6337 6662 700041993 13436 5854 7582 88251994 24547 11219 13328 196291995 37871 14058 23813 28707
Textile 1992 9243 3021 6222 31361993 9893 3494 6399 42901994 12209 7929 11280 100051995 28153 11846 16307 17209
Sewing Industry 1992 3588 3046 542 5261993 4182 3403 779 6381994 8256 6475 1781 11071995 12605 11339 1266 1794
Foodstuffs 1992 55871 17053 38818 69891993 60855 17767 43088 106001994 103368 37583 65785 209651995 162596 60782 101814 27109
Source: Author's computations based on data of NSI.* in mln BGL in current year prices
32
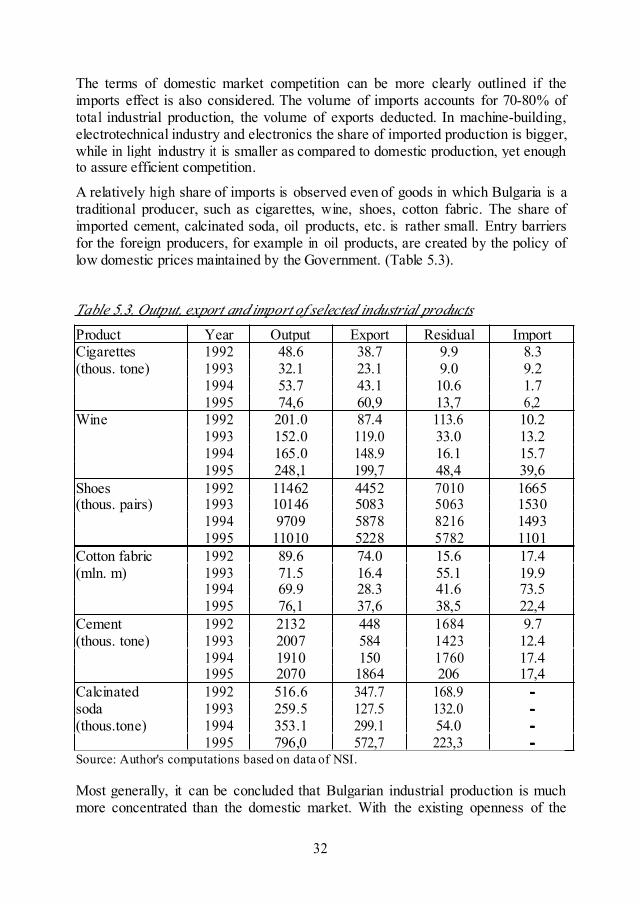
The terms of domestic market competition can be more clearly outlined if theimports effect is also considered. The volume of imports accounts for 70-80% oftotal industrial production, the volume of exports deducted. In machine-building,electrotechnical industry and electronics the share of imported production is bigger,while in light industry it is smaller as compared to domestic production, yet enoughto assure efficient competition.
A relatively high share of imports is observed even of goods in which Bulgaria is atraditional producer, such as cigarettes, wine, shoes, cotton fabric. The share ofimported cement, calcinated soda, oil products, etc. is rather small. Entry barriersfor the foreign producers, for example in oil products, are created by the policy oflow domestic prices maintained by the Government. (Table 5.3).
Table 5.3. Output, export and import of selected industrial products
Product Year Output Export Residual ImportCigarettes(thous. tone)
1992 48.6 38.7 9.9 8.31993 32.1 23.1 9.0 9.21994 53.7 43.1 10.6 1.71995 74,6 60,9 13,7 6,2
Wine 1992 201.0 87.4 113.6 10.21993 152.0 119.0 33.0 13.21994 165.0 148.9 16.1 15.71995 248,1 199,7 48,4 39,6
Shoes(thous. pairs)
1992 11462 4452 7010 16651993 10146 5083 5063 15301994 9709 5878 8216 14931995 11010 5228 5782 1101
Cotton fabric(mln. m)
1992 89.6 74.0 15.6 17.41993 71.5 16.4 55.1 19.91994 69.9 28.3 41.6 73.51995 76,1 37,6 38,5 22,4
Cement(thous. tone)
1992 2132 448 1684 9.71993 2007 584 1423 12.41994 1910 150 1760 17.41995 2070 1864 206 17,4
Calcinatedsoda(thous.tone)
1992 516.6 347.7 168.9 ----1993 259.5 127.5 132.0 ----1994 353.1 299.1 54.0 ----1995 796,0 572,7 223,3 ----
Source: Author's computations based on data of NSI.
Most generally, it can be concluded that Bulgarian industrial production is muchmore concentrated than the domestic market. With the existing openness of the
33
economy, however, all producers should be free to operate in a competitiveenvironment.
6666.... Government-FirmsGovernment-FirmsGovernment-FirmsGovernment-Firms RelationsRelationsRelationsRelationsI Inder the conditions of quasi-market environment and absent market institutions,the state has to fulfil functions similar to that of the market in normal marketeconomies, such as obeying financial discipline, financial restructuring orliquidation of enterprises, etc. In Bulgaria, the main problems in this sphere areconnected with subsidies and budget dotations, liquidation and financialrestructuring of enterprises.
6.1.6.1.6.1.6.1. ProductionProductionProductionProduction SubsidiesSubsidiesSubsidiesSubsidies andandandand BudgetBudgetBudgetBudget DotationsDotationsDotationsDotations
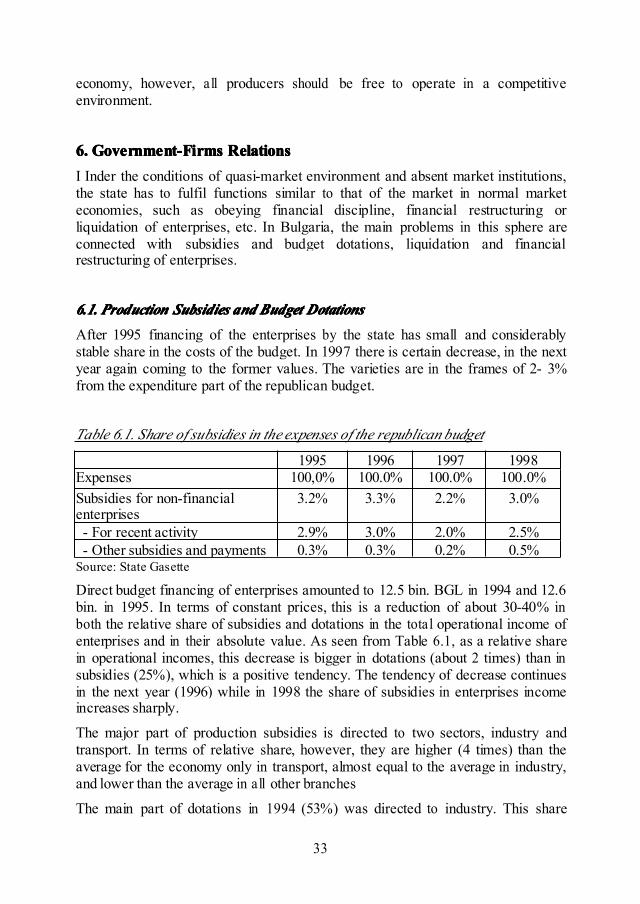
After 1995 financing of the enterprises by the state has small and considerablystable share in the costs of the budget. In 1997 there is certain decrease, in the nextyear again coming to the former values. The varieties are in the frames of 2- 3%from the expenditure part of the republican budget.
Table 6.1. Share of subsidies in the expenses of the republican budget
1995 1996 1997 1998Expenses 100,0% 100.0% 100.0% 100.0%Subsidies for non-financialenterprises
3.2% 3.3% 2.2% 3.0%
- For recent activity 2.9% 3.0% 2.0% 2.5%- Other subsidies and payments 0.3% 0.3% 0.2% 0.5%
Source: State Gasette
Direct budget financing of enterprises amounted to 12.5 bin. BGL in 1994 and 12.6bin. in 1995. In terms of constant prices, this is a reduction of about 30-40% inboth the relative share of subsidies and dotations in the total operational income ofenterprises and in their absolute value. As seen from Table 6.1, as a relative sharein operational incomes, this decrease is bigger in dotations (about 2 times) than insubsidies (25%), which is a positive tendency. The tendency of decrease continuesin the next year (1996) while in 1998 the share of subsidies in enterprises incomeincreases sharply.
The major part of production subsidies is directed to two sectors, industry andtransport. In terms of relative share, however, they are higher (4 times) than theaverage for the economy only in transport, almost equal to the average in industry,and lower than the average in all other branches
The main part of dotations in 1994 (53%) was directed to industry. This share
34
demonstrated a considerable decrease in 1995, down to 21%, yet remained abovethe average for the economy. The highest share of dotations went to construction,while the greatest increase in 1995 was observed in trade, the three sectors thusreceiving about 80% of total volume of dotations.
Production subsidies and dotations are quite unevenly distributed between industrysectors. Nearly a three-quarter of subsidies is directed to coal mining andproduction of electricity. The same branches have also the highest level ofsubsidies per unit of operational income - 2-3 times in electricity and more than 20times in coal mining. The rest of industrial branches are either close to the averagefor the economy (for example, non-ferrous metals) or considerably lower.
In their main part (88%), 1994 dotations were directed to production of electricityand non-ferrous metallurgy. Actually, non-ferrous metallurgy was the only branchdotated in 1995. There was a drastic decrease in dotations for electricity, whiletheir level in the other branches was insignificant.
It can be concluded that the main reason for direct financing of enterprises by thebudget is the maintenance of lower prices of energy carriers. The total increase ofthe share of production subsidies in 1998 is arranged together with theirconcentration. For example their share in carbon industry, non-ferrous metallurgy,wood industry, agriculture and trade decreases sharply, while in electric power andsteam energy, forestry and transport increases. The increased volume of subsidiesis distributed in branches, where the state by social reasons continues to paysubsidies.
6.2.6.2.6.2.6.2. FinancialFinancialFinancialFinancial RestructuringRestructuringRestructuringRestructuring ofofofof EnterprisesEnterprisesEnterprisesEnterprises
The delay of structural reforms in Bulgaria has brought bad financial results in agreat number of enterprises. In April 1996, the Government advanced a programfor restructuring, consisting of two main parts - liquidation, and financialrestructuring of loss-making state-owned enterprises.The program of financial restructuring includes a list of 36 industrial enterprises:15 in machine-building, 5 in electrotechnical industry, 4 in chemistry and oil-processing, 5 in textile, 3 in non-ferrous metallurgy, 2 in ferrous metallurgy, and 2in glass industry.
The total debt of these enterprises amounts to 54.6 bin BGL, which is equal to theircapital (54.5 bin. BGL), or their fixed tangible assets (59 bin. BGL). This is anindicator of a very high degree of decapitalization of enterprises included in theProgram, yet comparing the figures it should be kept into account that a revaluationof assets has not been made in Bulgaria since 1992, therefore the value (resp. price)of these enterprises should several times higher. In terms of current financialresults and indebtedness, enterprises can be classified into 4 main groups, namely:positive results and small debt, positive financial results and very big debt, currentloss and small debt, and current loss combined with very high indebtedness.
35
Obviously, enterprises suffer different problems and the solutions should besearched for each case in particular. Enterprises are given three months to prepareindividual plans for financial restructuring in a one-year term. If they aresuccessful, enterprises would be allowed rescheduling, reduction or cancellation ofold debts; in the opposite case, measures would be undertaken lor their liquidation.Enterprises included in the financial restructuring program ire under thegovernance and supervision of the Ministry of Finance.
6.36.36.36.3.... LiquidationLiquidationLiquidationLiquidation ofofofof EnterprisesEnterprisesEnterprisesEnterprises
Like in some other East European countries, the governments in Bulgaria haveproved to be rather reluctant towards the liquidation of state-owned enterprises. Ihe reason here is neither the absence of adequate legal basis, nor thenon existence of state loss-makers. Actually, there hasn't been adopted aparticular law on bankruptcy, yet the Commercial Law (1991) includes a specialchapter regulating this issue.
It was realised only in spring 1996 that any further delay in the solution of theseproblems would be crucial, and steps were undertaken in two directions: first,working-out a program for liquidation of a part of enterprises in extremely badfinancial condition, and, second, creating the prerequisites for the normalfunctioning and application of already existing legislation regarding the liquidationof loss-making state enterprises.
The program for liquidation has been initiated by the World Bank and theInternational Monetary Fund and is accomplished with the financial and expertassistance of these institutions. There are 64 state-owned companies included in thelist for liquidation, of them 38 in industry. These companies account for 3% of thetotal number of employees, 7% of the fixed assets, and more than 30% of the lossesin the sector. The total debt of enterprises in the list exceeds by 2.6 times theirfixed capital and by 2 times their long-term tangible assets. The goal of theprogram, therefore, is to improve the general performance of the sector, with aminimum negative effect on the employed.
Liquidation procedures have been opened for 27 of enterprises, while theremaining 11 will be privatised. Privatisation deals have been already concludedfor 8 of them, the rest are in process of negotiations with potential buyers.
As a result of the application of the provisions of the Commercial Law regulatingthe liquidation of companies, closing and liquidation procedures have been openedfor another group of 44 loss-making enterprises. These are mainly small- sizedenterprises with a total of 1070 employed.
36
II.II.II.II. Ownership,Ownership,Ownership,Ownership, ControlControlControlControl andandandand EconomicEconomicEconomicEconomic Behaviour:Behaviour:Behaviour:Behaviour: QuestionnaireQuestionnaireQuestionnaireQuestionnaireSurveySurveySurveySurvey inininin BulgariaBulgariaBulgariaBulgaria1.1.1.1. IntroductionIntroductionIntroductionIntroduction105 industrial enterprises were surveyed in Bulgaria. Paragraph 2. describes thesample of the surveyed enterprises. Paragraph 3. reveals the basic characteristics ofthe observed ownership, control and governance structures. Paragraph 4. analysesthe effect of the ownership structures and control on managerial behaviour andParagraph 5. on firm performance. Paragraph 6. analyses the influence of themarket structure, the Government, the industrial sector and size structure on firmperformance.
2.2.2.2. SampleSampleSampleSampleCharacteristicsCharacteristicsCharacteristicsCharacteristicsOwnership structure. The survey comprised four major groups of firms, classifiedaccording to the type of ownership: state-owned (SOE), corporatized state-owned(CE), former state-owned firms which have been privatized (PRE), and privatefirms established de novo (POE). Out of 105 surveyed enterprises 27 were POEs,22 - PREs, 54 - CEs, 2 - SOEs. The insignificant number of the traditional stateenterprises in the sample reflects the insignificant position of this kind ofownership in the Bulgarian industry. Out of all the registered enterprises inBulgaria in 1995, exactly 17,595 are CEs, whereas only 776 are SOEs. Aqualitative analysis can establish that there is not a significant industrial enterprise,which has remained SOEs. All the enterprises important to the country weretransformed in CEs as early as 1990/91.65% of the studied enterprises existed in some other form. 70% of the CEs existedin another form. Most of them were entirely owned by the state. This is typical ofthe transformation of SOEs into corporatised enterprises entirely owned by thestate (CEs). 95.5% of the privatised enterprises existed as state enterprises and4.5% as part of a state enterprise. This is not typical of the privatisation in thecountry where the prevailing number of the privatised enterprises were formed outof parts of state enterprises. But as far as their importance to the economy of thecountry is concerned the privatised firms originating from whole state enterpriseshave priority because as a rule they have bigger assets and a greater number ofpersonnel.Legal form structure. The sole proprietors prevail among the POEs (51.9% of thesample) which is typical of the existing private sector in Bulgaria too. LimitedLiability companies (33.3% of the sample) are the remaining big group of surveyedenterprises. They come third in number in the Bulgarian private sector in 1995.General partnerships were not included in the sample though they come second innumber in the private sector. The lack of precise statistics makes it difficult toestimate the actual share of these enterprises only in the industry. The empiricalwork of the interviewers within the adopted inductive approach did not find even asingle enterprise answering the sample criteria. 68.2% of the surveyed 1'iivatisedfirms are joint-stock companies. The rest are limited liability companies. It is
37
difficult to gather information in order to conclude whether this structure is typicalof the country.
Organisation structure. The average number of plants in the surveyed enterprises isabout 1 in the private sector and 2 in the public one. 6% of the CEs and 9% of thePREs are subsidiaries of other firms. On their part 6% of the CEs, 9% of the PREsand 11% of the POEs have their own subsidiaries. The structure of the samplefollows the tendencies in the development of the organisational structures in theBulgarian industry characterised by decentralisation of the economic units.
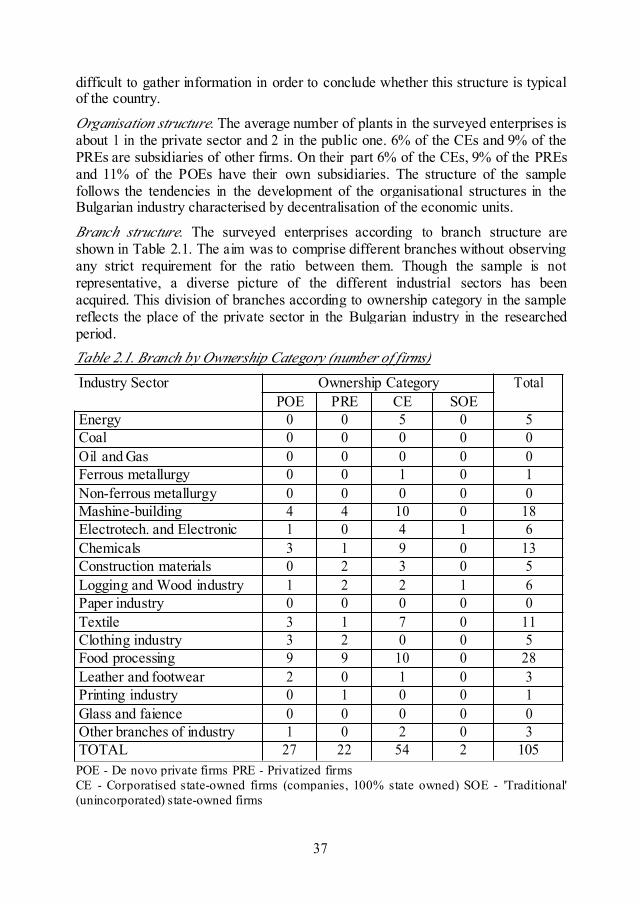
Branch structure. The surveyed enterprises according to branch structure areshown in Table 2.1. The aim was to comprise different branches without observingany strict requirement for the ratio between them. Though the sample is notrepresentative, a diverse picture of the different industrial sectors has beenacquired. This division of branches according to ownership category in the samplereflects the place of the private sector in the Bulgarian industry in the researchedperiod.Table 2.1. Branch by Ownership Category (number of firms)
Industry Sector Ownership Category TotalPOE PRE CE SOE
Energy 0 0 5 0 5Coal 0 0 0 0 0Oil and Gas 0 0 0 0 0Ferrous metallurgy 0 0 1 0 1Non-ferrous metallurgy 0 0 0 0 0Mashine-building 4 4 10 0 18Electrotech. and Electronic 1 0 4 1 6Chemicals 3 1 9 0 13Construction materials 0 2 3 0 5Logging and Wood industry 1 2 2 1 6Paper industry 0 0 0 0 0Textile 3 1 7 0 11Clothing industry 3 2 0 0 5Food processing 9 9 10 0 28Leather and footwear 2 0 1 0 3Printing industry 0 1 0 0 1Glass and faience 0 0 0 0 0Other branches of industry 1 0 2 0 3TOTAL 27 22 54 2 105POE - De novo private firms PRE - Privatized firmsCE - Corporatised state-owned firms (companies, 100% state owned) SOE - 'Traditional'(unincorporated) state-owned firms
38
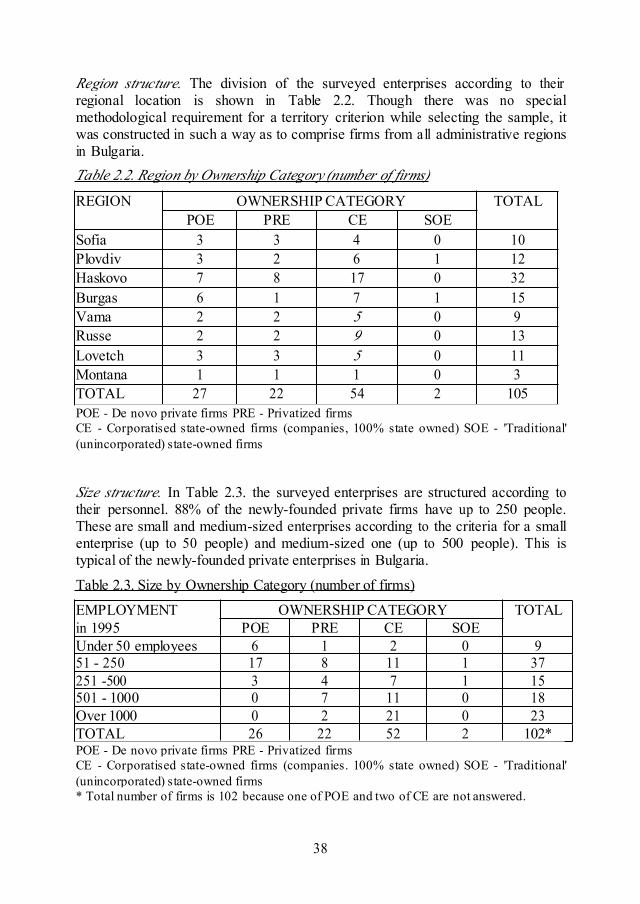
Region structure. The division of the surveyed enterprises according to theirregional location is shown in Table 2.2. Though there was no specialmethodological requirement for a territory criterion while selecting the sample, itwas constructed in such a way as to comprise firms from all administrative regionsin Bulgaria.Table 2.2. Region by Ownership Category (number of firms)
REGION OWNERSHIP CATEGORY TOTALPOE PRE CE SOE
Sofia 3 3 4 0 10Plovdiv 3 2 6 1 12Haskovo 7 8 17 0 32Burgas 6 1 7 1 15Vama 2 2 5 0 9Russe 2 2 9 0 13Lovetch 3 3 5 0 11Montana 1 1 1 0 3TOTAL 27 22 54 2 105POE - De novo private firms PRE - Privatized firmsCE - Corporatised state-owned firms (companies, 100% state owned) SOE - 'Traditional'(unincorporated) state-owned firms
Size structure. In Table 2.3. the surveyed enterprises are structured according totheir personnel. 88% of the newly-founded private firms have up to 250 people.These are small and medium-sized enterprises according to the criteria for a smallenterprise (up to 50 people) and medium-sized one (up to 500 people). This istypical of the newly-founded private enterprises in Bulgaria.
Table 2.3. Size by Ownership Category (number of firms)
EMPLOYMENT OWNERSHIP CATEGORY TOTALin 1995 POE PRE CE SOEUnder 50 employees 6 1 2 0 951 - 250 17 8 11 1 37251 -500 3 4 7 1 15501 - 1000 0 7 11 0 18Over 1000 0 2 21 0 23TOTAL 26 22 52 2 102*POE - De novo private firms PRE - Privatized firmsCE - Corporatised state-owned firms (companies. 100% state owned) SOE - 'Traditional'(unincorporated) state-owned firms* Total number of firms is 102 because one of POE and two of CE are not answered.
39
Half of the privatised firms are with personnel up to 500 people. This is typical ofthe privatised enterprises in the country, the prevailing of which are small andmedium-sized firms. As it could have been presumed from the perspective of thetopic and aim of the study, the prevailing part (63%) of the CEs are with personnelover 500 people and 40% of them have over 1000 people employed. This feature isin discrepancy with the typical place of the big firms in the public sector ( theirnumber is 15% of the existing corporatised state enterprises in the country). Thedeviation from the typical of the country size structure is intentionally sought. Theproblems of the separation of ownership and control phenomenon are characteristicmostly of the big firms, that is why the aim was to comprise to a maximum degreetypical big enterprises in the Bulgarian industry notwithstanding their ownershipstructure at the time of the research.
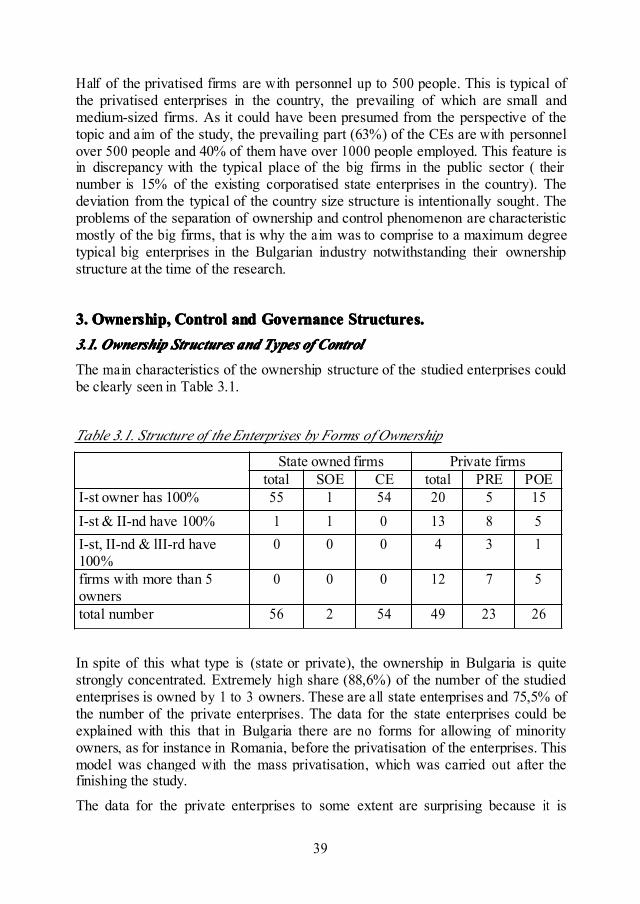
3.3.3.3. Ownership,Ownership,Ownership,Ownership, ControlControlControlControl andandandand GovernanceGovernanceGovernanceGovernance Structures.Structures.Structures.Structures.3.1.3.1.3.1.3.1. OwnershipOwnershipOwnershipOwnership StructuresStructuresStructuresStructures andandandand TypesTypesTypesTypes ofofofof ControlControlControlControl
The main characteristics of the ownership structure of the studied enterprises couldbe clearly seen in Table 3.1.
Table 3.1. Structure of the Enterprises by Forms of Ownership
State owned firms Private firmstotal SOE CE total PRE POE
I-st owner has 100% 55 1 54 20 5 15I-st & II-nd have 100% 1 1 0 13 8 5I-st, II-nd & lII-rd have100%
0 0 0 4 3 1
firms with more than 5owners
0 0 0 12 7 5
total number 56 2 54 49 23 26
In spite of this what type is (state or private), the ownership in Bulgaria is quitestrongly concentrated. Extremely high share (88,6%) of the number of the studiedenterprises is owned by 1 to 3 owners. These are all state enterprises and 75,5% ofthe number of the private enterprises. The data for the state enterprises could beexplained with this that in Bulgaria there are no forms for allowing of minorityowners, as for instance in Romania, before the privatisation of the enterprises. Thismodel was changed with the mass privatisation, which was carried out after thefinishing the study.
The data for the private enterprises to some extent are surprising because it is
40
known that there are fears from dispersion of the ownership in the transitioneconomies in result of the privatisation. In our case there is only weak tendency todispersion which is revealing in the fact that the relative share of the privatisedenterprises, owned by 1+3 owners (69,6%) is lower than of the private enterprisescreated de novo (80,8%).Interesting are 11% of the number of the enterprises which have more than 5owners. The share of the first 5 owners does not exceed 50% as in privatised(29.8%) and in the newly created private enterprises (42,9%).
The analysis shows the following: first, the concentration of the ownership of thestudied enterprises is very high; second, in the bigger part of the enterprises - allstate and 75% of the private there is absolute concentration revealed in the fact that1 to 3 owners have 100% of the assets; third, in the rest of the enterprises there ishigh concentration revealed in the fact that the first three owners have less than30% of the ownership but many times more than the fourth and the next owners.
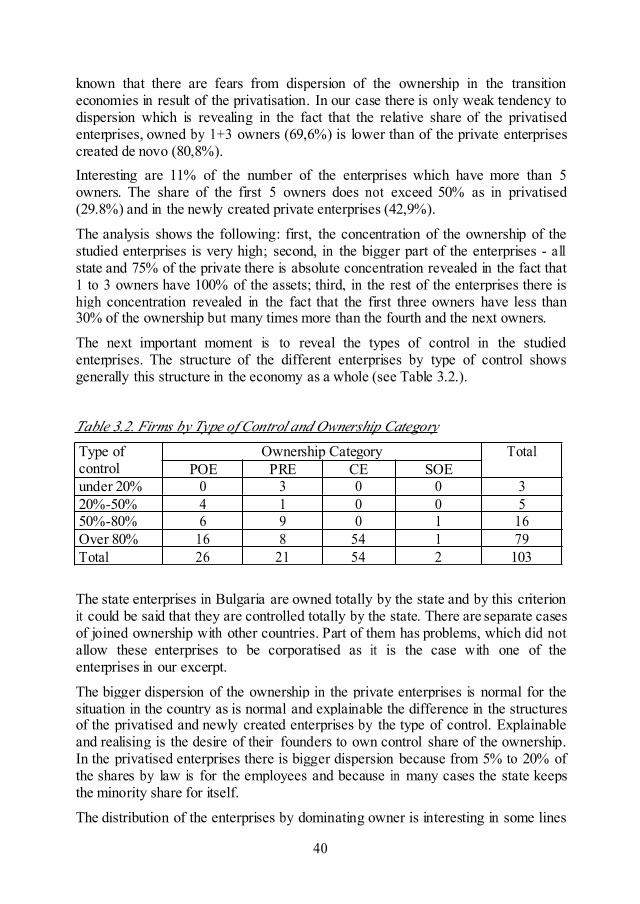
The next important moment is to reveal the types of control in the studiedenterprises. The structure of the different enterprises by type of control showsgenerally this structure in the economy as a whole (see Table 3.2.).
Table 3.2. Firms by Type of Control and Ownership Category
Type ofcontrol
Ownership Category TotalPOE PRE CE SOE
under 20% 0 3 0 0 320%-50% 4 1 0 0 550%-80% 6 9 0 1 16Over 80% 16 8 54 1 79Total 26 21 54 2 103
The state enterprises in Bulgaria are owned totally by the state and by this criterionit could be said that they are controlled totally by the state. There are separate casesof joined ownership with other countries. Part of them has problems, which did notallow these enterprises to be corporatised as it is the case with one of theenterprises in our excerpt.
The bigger dispersion of the ownership in the private enterprises is normal for thesituation in the country as is normal and explainable the difference in the structuresof the privatised and newly created enterprises by the type of control. Explainableand realising is the desire of their founders to own control share of the ownership.In the privatised enterprises there is bigger dispersion because from 5% to 20% ofthe shares by law is for the employees and because in many cases the state keepsthe minority share for itself.
The distribution of the enterprises by dominating owner is interesting in some lines
41
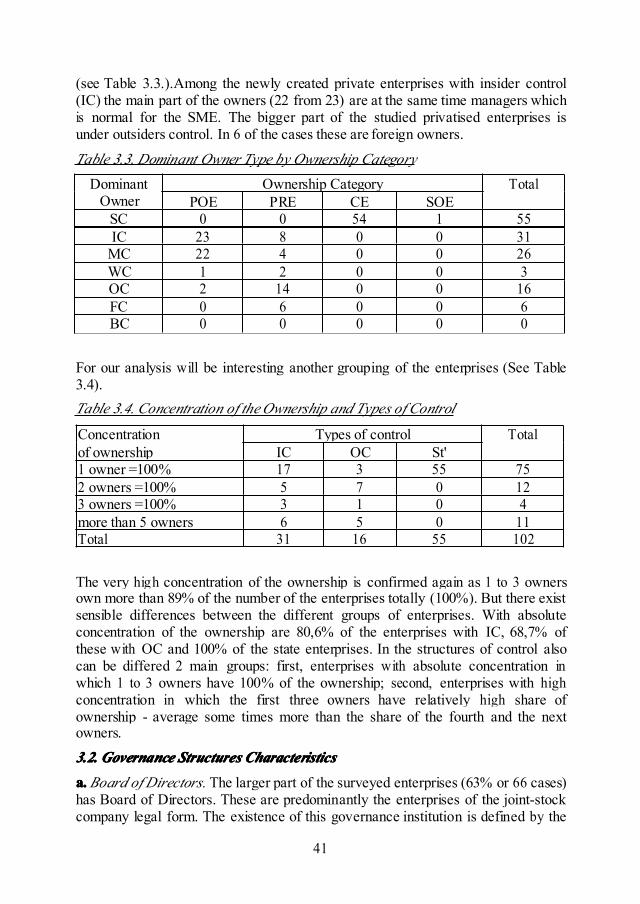
(see Table 3.3.).Among the newly created private enterprises with insider control(IC) the main part of the owners (22 from 23) are at the same time managers whichis normal for the SME. The bigger part of the studied privatised enterprises isunder outsiders control. In 6 of the cases these are foreign owners.
Table 3.3. Dominant Owner Type by Ownership Category
DominantOwner
Ownership Category TotalPOE PRE CE SOE
SC 0 0 54 1 55IC 23 8 0 0 31
MC 22 4 0 0 26WC 1 2 0 0 3OC 2 14 0 0 16FC 0 6 0 0 6BC 0 0 0 0 0
For our analysis will be interesting another grouping of the enterprises (See Table3.4).Table 3.4. Concentration of theOwnership and Types of Control
Concentration Types of control Totalof ownership IC OC St'1 owner =100% 17 3 55 752 owners =100% 5 7 0 123 owners =100% 3 1 0 4more than 5 owners 6 5 0 11Total 31 16 55 102
The very high concentration of the ownership is confirmed again as 1 to 3 ownersown more than 89% of the number of the enterprises totally (100%). But there existsensible differences between the different groups of enterprises. With absoluteconcentration of the ownership are 80,6% of the enterprises with IC, 68,7% ofthese with OC and 100% of the state enterprises. In the structures of control alsocan be differed 2 main groups: first, enterprises with absolute concentration inwhich 1 to 3 owners have 100% of the ownership; second, enterprises with highconcentration in which the first three owners have relatively high share ofownership - average some times more than the share of the fourth and the nextowners.
3.2.3.2.3.2.3.2. GovernanceGovernanceGovernanceGovernance StructuresStructuresStructuresStructures CharacteristicsCharacteristicsCharacteristicsCharacteristics
a.a.a.a. Board of Directors. The larger part of the surveyed enterprises (63% or 66 cases)has Board of Directors. These are predominantly the enterprises of the joint-stockcompany legal form. The existence of this governance institution is defined by the
42
requirements of clause 219 in the Law on Commerce, according to which everyjoint-stock company has a Board of Directors. The sample includes joint-stockcompanies with different ownership category - 2 POEs, 15 privatised and 42 CEs.The total number of the 'corporatised' state-owned firms (CEs) is larger (54),because they include the limited liability companies with 100% state participation.Enterprises, which are not joint-stock companies also, have a governanceinstitution, often called 'Council of Directors' and similar in function to the Boardof Directors. In the sample these are 3 private and 3 privatised limited liabilitycompanies and 1 traditional state enterprise.
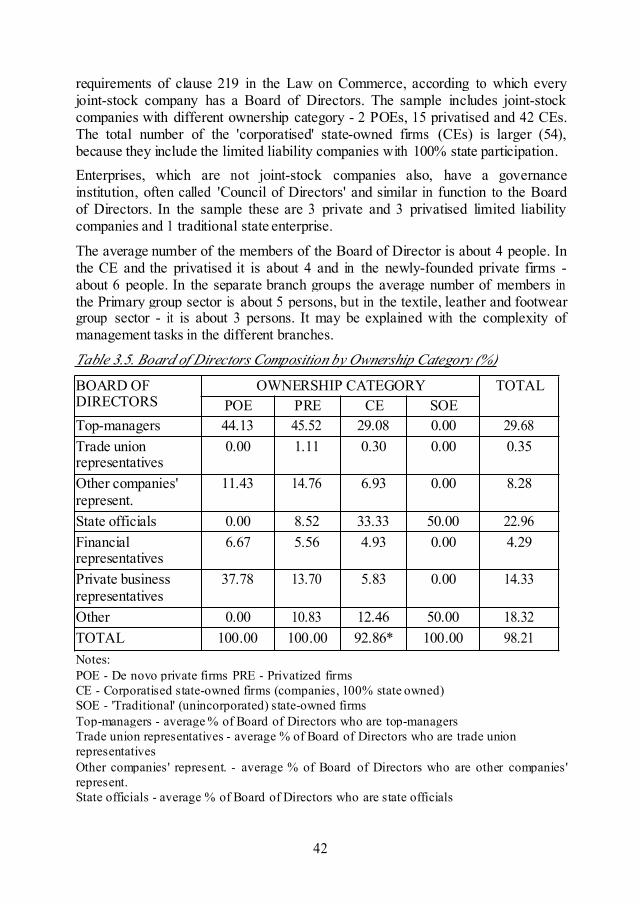
The average number of the members of the Board of Director is about 4 people. Inthe CE and the privatised it is about 4 and in the newly-founded private firms -about 6 people. In the separate branch groups the average number of members inthe Primary group sector is about 5 persons, but in the textile, leather and footweargroup sector - it is about 3 persons. It may be explained with the complexity ofmanagement tasks in the different branches.
Table 3.5. Board of Directors Composition by Ownership Category (%)
BOARD OFDIRECTORS
OWNERSHIP CATEGORY TOTALPOE PRE CE SOE
Top-managers 44.13 45.52 29.08 0.00 29.68Trade unionrepresentatives
0.00 1.11 0.30 0.00 0.35
Other companies'represent.
11.43 14.76 6.93 0.00 8.28
State officials 0.00 8.52 33.33 50.00 22.96Financialrepresentatives
6.67 5.56 4.93 0.00 4.29
Private businessrepresentatives
37.78 13.70 5.83 0.00 14.33
Other 0.00 10.83 12.46 50.00 18.32TOTAL 100.00 100.00 92.86* 100.00 98.21Notes:POE - De novo private firms PRE - Privatized firmsCE - Corporatised state-owned firms (companies, 100% state owned)SOE - 'Traditional' (unincorporated) state-owned firmsTop-managers - average % of Board of Directors who are top-managersTrade union representatives - average % of Board of Directors who are trade unionrepresentativesOther companies' represent. - average % of Board of Directors who are other companies'represent.State officials - average % of Board of Directors who are state officials
43
Financial representatives - average % of Board of Directors who are financialrepresentativesPrivate business represent. - average % of Board of Directors who are private businessrepresent.Total percentage of CE firms is 92.86 because three of the firms are not answered.
Table 3.5 shows the Board of Directors composition by Ownership Category. Inthe POEs over 80% of the members of the Board of Directors are top-managers andrepresentatives of the private business, and about 10% are people working in therespective enterprise. In the PREs these numbers are respectively about 60% and15%. While the above numbers have been anticipated and explainable, thecomposition of the Council of Directors in the CEs seems strange. In them about18% of the members are representatives of the private business or 'other' economicsubjects difficult to identify.
The Trade Unions have an insignificant presence in the Councils of Directors. Inthe PREs it is a little over 1% and in the POEs and CEs it is 0% or about 0%. Thiscreates a potential for a low level of workers' influence on decision making.
According to expert views of the managers of the surveyed enterprises on the basisof a seven-grade scale, the average influence of the Board of Directors on thestrategic decisions was graded 4.58, bearing in mind that in the CE the grades arelower - 4.21, and in the private sector - higher (POEs - 5.60 and PREs - 5.33). Theassessment of the influence on the operative decisions shows lower levels (3.91 onthe average), but the grading of the firms with different category of ownership isthe same: CEs - 3.62, POEs- 5.60 and PREs- 4.39.
The results above show the more passive role of the Board of Directors at makingboth the strategic and operative decisions in the corporatised state enterprises incomparison with the enterprises in the private sector. On the other hand, in theprivate sector itself the influence of the Board of Directors in the newly-foundedprivate firms is stronger than in the privatised firms.
The high estimation of the influence of the Board of Directors on the operativedecisions in the newly-founded private firms (60% of them define it as very strongand extensive) shows that in these enterprises the Board has taken over untypical ofits nature functions of the operative management. This also reveals the greatercentralisation and the concentration of power of decision making in the samehands. The same tendency has been observed in the privatised enterprises (about50% of them assess the influence of the Board on operative decision making asstrong, very strong and extensive). For comparison, only 32% of the CE givesimilar assessment of the strong role of the Board in operative decision making.b.b.b.b. Supervisory Board. Only 3% of the surveyed enterprises have a SupervisoryBoard in their governance structure. According to the Law on Commerce they havea two-tier system of governance, i.e. Board of Directors and Supervisory Board.For comparison, the enterprises with a one-tire structure are those with a Board of
44
Directors only. The studied enterprises with a Supervisory Board are two privatisedones and one newly-founded private one. However, the case of the newly-foundedprivate enterprise is specific because it has no Board of Directors but only aSupervisory Board, which leads to the conclusion that these are two names for thesame thing and the system has one tier. The average number of the members of theSupervisory Board is 3 people. One of the privatised enterprises is under insidercontrol and the other one is under outsider control. In the first enterprise themembers of the Supervisory Board are representatives of the Trade Unions andother employees of the firm. In the second enterprise the members of theSupervisory Board are top-managers, one of them being an owner of the firm - thebiggest shareholder in the firm. This distribution of the board members aseconomic agents shows that the governance structure of the Supervisory Board isused to acquire more influence of part of the owners on the operations of theenterprises. In Bulgaria, however, this governance mechanism of control over themanagers was not typical in the period of the study.
c.c.c.c. Conflict between managers and Board of Directors (Supervisory Board). In thenewly-founded private enterprises there is full agreement at making the decisions.Such agreement exists in about 70% of the privatised enterprises. These results canbe explained with the merging of interests of the Board of Directors and themanagers in this ownership category.
While the above results are explainable, the high percentage of corporatised stateenterprises (about 87%), saying that there is full agreement between the Board ofDirectors and the managers at decision making cannot be interpreted one-sidedly.On the one hand this could mean curbing the potential managerial opportunism onpart of the institution of the Board as a disciplining mechanism. The highpercentage of private businessmen and other 'non-identifiable' persons in the Boardof Directors in these enterprises casts doubts that the demonstrated unanimity maybe directed against the interests of the enterprise. On the other hand there exists onepurely methodological explanation of the optimistic answers. The managers had toassess the level of their own disagreement with the institution that governed them.This in itself created the potential wish to soften the facts.
d.d.d.d. Shareholder voting rights. The institution of the General Meeting of theshareholders as a discipline mechanism for effective managerial behaviour has noreal role in the enterprises surveyed. In the CEs this governing body does not existsince the Government is the only shareholder. In the newly-founded private andprivatised joint-stock companies about one third use direct voting in their GeneralMeetings. The system of voting by proxies has not been developed yet. Only aboutten of the surveyed enterprises use voting by proxies. In 2% of the firms theproxies are insiders and in 8% - other economic agents.
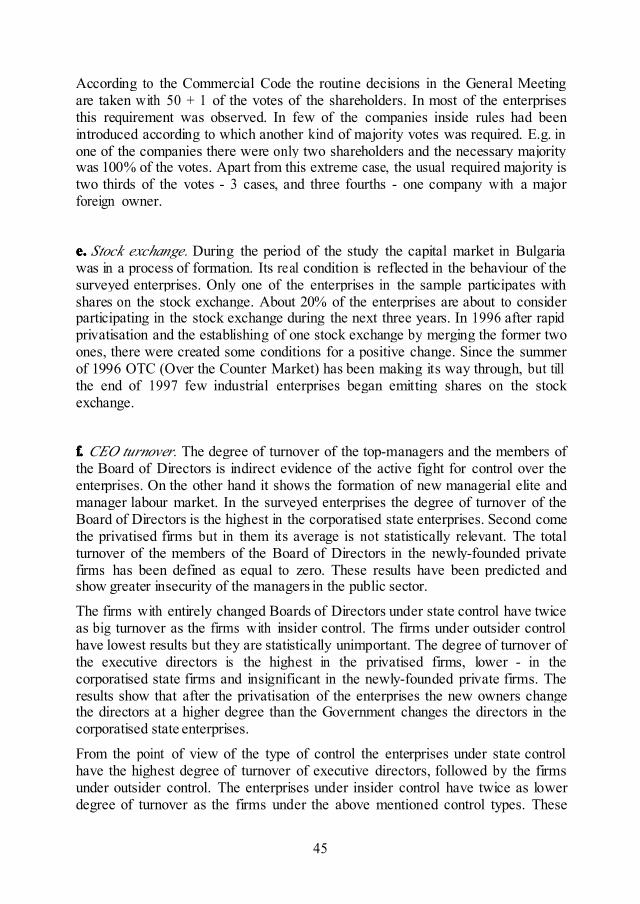
45
According to the Commercial Code the routine decisions in the General Meetingare taken with 50 + 1 of the votes of the shareholders. In most of the enterprisesthis requirement was observed. In few of the companies inside rules had beenintroduced according to which another kind of majority votes was required. E.g. inone of the companies there were only two shareholders and the necessary majoritywas 100% of the votes. Apart from this extreme case, the usual required majority istwo thirds of the votes - 3 cases, and three fourths - one company with a majorforeign owner.
e.e.e.e. Stock exchange. During the period of the study the capital market in Bulgariawas in a process of formation. Its real condition is reflected in the behaviour of thesurveyed enterprises. Only one of the enterprises in the sample participates withshares on the stock exchange. About 20% of the enterprises are about to considerparticipating in the stock exchange during the next three years. In 1996 after rapidprivatisation and the establishing of one stock exchange by merging the former twoones, there were created some conditions for a positive change. Since the summerof 1996 OTC (Over the Counter Market) has been making its way through, but tillthe end of 1997 few industrial enterprises began emitting shares on the stockexchange.
f.f.f.f. CEO turnover. The degree of turnover of the top-managers and the members ofthe Board of Directors is indirect evidence of the active fight for control over theenterprises. On the other hand it shows the formation of new managerial elite andmanager labour market. In the surveyed enterprises the degree of turnover of theBoard of Directors is the highest in the corporatised state enterprises. Second comethe privatised firms but in them its average is not statistically relevant. The totalturnover of the members of the Board of Directors in the newly-founded privatefirms has been defined as equal to zero. These results have been predicted andshow greater insecurity of the managers in the public sector.
The firms with entirely changed Boards of Directors under state control have twiceas big turnover as the firms with insider control. The firms under outsider controlhave lowest results but they are statistically unimportant. The degree of turnover ofthe executive directors is the highest in the privatised firms, lower - in thecorporatised state firms and insignificant in the newly-founded private firms. Theresults show that after the privatisation of the enterprises the new owners changethe directors at a higher degree than the Government changes the directors in thecorporatised state enterprises.
From the point of view of the type of control the enterprises under state controlhave the highest degree of turnover of executive directors, followed by the firmsunder outsider control. The enterprises under insider control have twice as lowerdegree of turnover as the firms under the above mentioned control types. These
46
results explain the more stable position of the managers of the firms under insidercontrol, which has been expected. Once again they confirm the insecure position ofthe top-managers in the corporatised state firms.
It could be deducted that at the basis of the turnover of the managers of theprivatised enterprises are the sensible expectations of the new owners for greaterefficiency. The change of managers of the corporatised state enterprises, however,is also due to political considerations. The diverse picture of the top-managersmade it impossible to draw cardinal conclusions about the basic motives, which ledthe Government when changing the director of a state enterprise. There weredirectors from the times of the communist nomenclature who the new reformistgovernments did not change.
g.g.g.g. Government influence. The influence of the Government on the activity of theenterprises in the transition period is a specific governance mechanism ofdisciplining the managers to efficient behaviour. Following the overall philosophyof withdrawal of the state from the economy, the Government has beenwithdrawing from financing the enterprises. Only about 5% of the surveyedenterprises have received financial help from the Government. Naturally theseenterprises are from the public sector. They are corporatised state enterprises. Theprevailing part of them is in the primary industry group. 4.5% of the privatisedenterprises have received financial help from financial institutions. The newly-founded enterprises in the sample have not received any help.
The Government controls price formation in 19% of the surveyed enterprises. Thecontrol over the prices is not based on the different ownership category but on thedifferent branch category of the firms. 22% of the corporatised state enterprises,19%) of the newly-founded firms and 9% of the privatised enterprises are understate control when establishing their prices. All the enterprises from the primaryindustry group and 39% of the food processing enterprises belong to this group.The average grade of the role of the state institutions as regulators of the economicactivity of the enterprises is bad (about 2 on the 5-grade scale). The corporatisedstate enterprises and the privatised firms give similar grades for the role of theParliament and the Government. These grades are bad for the Parliament andbetween bad and satisfactory for the Government. The newly-founded private firmsare more pessimistic when assessing the work of all state institutions. Their gradesare between very bad and bad.Similar grades between very bad and bad are given by the enterprises under insidercontrol. The firms under state control and under outsider control on their part aremore optimistic - their grades are between bad and satisfactory.
The results reveal that the newly-founded private enterprises and those underinsider control are more critical of the role of the state institutions as regulators ofeconomic life for stimulating the economic activity. These enterprises stay farthest
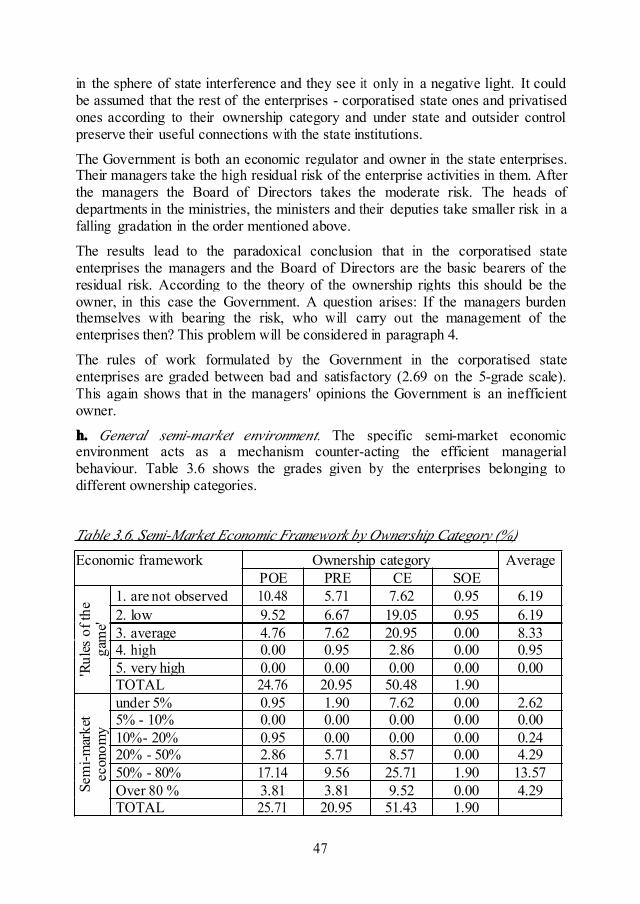
47
in the sphere of state interference and they see it only in a negative light. It couldbe assumed that the rest of the enterprises - corporatised state ones and privatisedones according to their ownership category and under state and outsider controlpreserve their useful connections with the state institutions.
The Government is both an economic regulator and owner in the state enterprises.Their managers take the high residual risk of the enterprise activities in them. Afterthe managers the Board of Directors takes the moderate risk. The heads ofdepartments in the ministries, the ministers and their deputies take smaller risk in afalling gradation in the order mentioned above.
The results lead to the paradoxical conclusion that in the corporatised stateenterprises the managers and the Board of Directors are the basic bearers of theresidual risk. According to the theory of the ownership rights this should be theowner, in this case the Government. A question arises: If the managers burdenthemselves with bearing the risk, who will carry out the management of theenterprises then? This problem will be considered in paragraph 4.
The rules of work formulated by the Government in the corporatised stateenterprises are graded between bad and satisfactory (2.69 on the 5-grade scale).This again shows that in the managers' opinions the Government is an inefficientowner.
h.h.h.h. General semi-market environment. The specific semi-market economicenvironment acts as a mechanism counter-acting the efficient managerialbehaviour. Table 3.6 shows the grades given by the enterprises belonging todifferent ownership categories.
Table 3.6. Semi-Market Economic Framework by Ownership Category (%)
Economic framework Ownership category AveragePOE PRE CE SOE
'Rul
esof
the
gam
e'
1. are not observed 10.48 5.71 7.62 0.95 6.192. low 9.52 6.67 19.05 0.95 6.193. average 4.76 7.62 20.95 0.00 8.334. high 0.00 0.95 2.86 0.00 0.955. very high 0.00 0.00 0.00 0.00 0.00TOTAL 24.76 20.95 50.48 1.90
Sem
i-mar
ket
econ
omy
under 5% 0.95 1.90 7.62 0.00 2.625% - 10% 0.00 0.00 0.00 0.00 0.0010%- 20% 0.95 0.00 0.00 0.00 0.2420% - 50% 2.86 5.71 8.57 0.00 4.2950% - 80% 17.14 9.56 25.71 1.90 13.57Over 80 % 3.81 3.81 9.52 0.00 4.29TOTAL 25.71 20.95 51.43 1.90
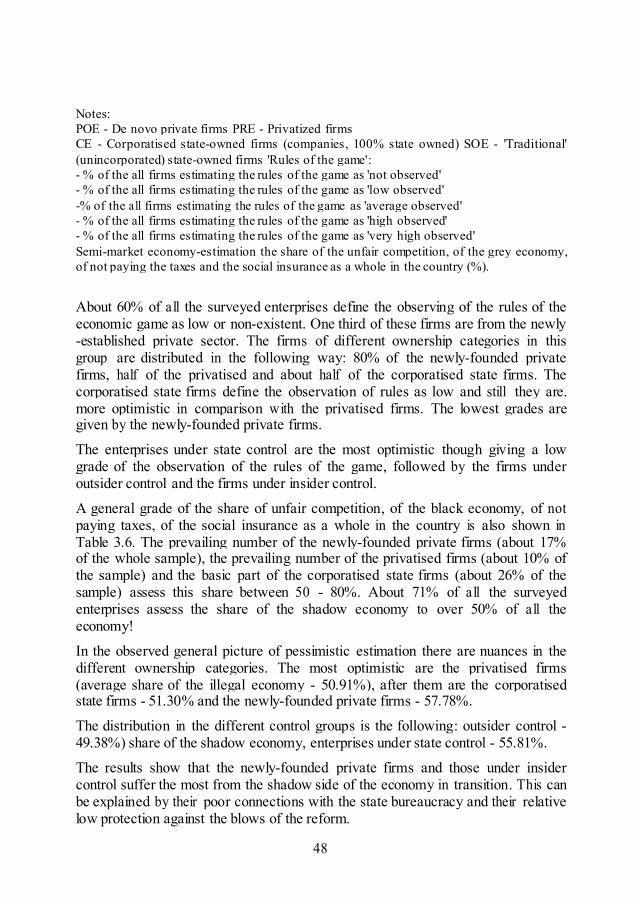
48
Notes:POE - De novo private firms PRE - Privatized firmsCE - Corporatised state-owned firms (companies, 100% state owned) SOE - 'Traditional'(unincorporated) state-owned firms 'Rules of the game':- % of the all firms estimating the rules of the game as 'not observed'- % of the all firms estimating the rules of the game as 'low observed'-% of the all firms estimating the rules of the game as 'average observed'- % of the all firms estimating the rules of the game as 'high observed'- % of the all firms estimating the rules of the game as 'very high observed'Semi-market economy-estimation the share of the unfair competition, of the grey economy,of not paying the taxes and the social insurance as a whole in the country (%).
About 60% of all the surveyed enterprises define the observing of the rules of theeconomic game as low or non-existent. One third of these firms are from the newly-established private sector. The firms of different ownership categories in thisgroup are distributed in the following way: 80% of the newly-founded privatefirms, half of the privatised and about half of the corporatised state firms. Thecorporatised state firms define the observation of rules as low and still they are.more optimistic in comparison with the privatised firms. The lowest grades aregiven by the newly-founded private firms.
The enterprises under state control are the most optimistic though giving a lowgrade of the observation of the rules of the game, followed by the firms underoutsider control and the firms under insider control.
A general grade of the share of unfair competition, of the black economy, of notpaying taxes, of the social insurance as a whole in the country is also shown inTable 3.6. The prevailing number of the newly-founded private firms (about 17%of the whole sample), the prevailing number of the privatised firms (about 10% ofthe sample) and the basic part of the corporatised state firms (about 26% of thesample) assess this share between 50 - 80%. About 71% of all the surveyedenterprises assess the share of the shadow economy to over 50% of all theeconomy!
In the observed general picture of pessimistic estimation there are nuances in thedifferent ownership categories. The most optimistic are the privatised firms(average share of the illegal economy - 50.91%), after them are the corporatisedstate firms - 51.30% and the newly-founded private firms - 57.78%.
The distribution in the different control groups is the following: outsider control -49.38%) share of the shadow economy, enterprises under state control - 55.81%.
The results show that the newly-founded private firms and those under insidercontrol suffer the most from the shadow side of the economy in transition. This canbe explained by their poor connections with the state bureaucracy and their relativelow protection against the blows of the reform.
49
In the small enterprises with employees up to 50 people the assessment of the shareof the shadow economy is especially pessimistic - 60.56% of the whole economy.With the growing of the enterprises in number this pessimism gradually decreasesand reaches 44.57% in the big firms with personnel of over 1 001 people. Theseresults can be explained by the different position that the small and lug firms havein the economy and the bigger vulnerability of the small ones in the newchangeable environment. However, another explanation can be given too. Thesmall firms are more sensitive to the changing conditions and their pessimisticassessment is due to the fact that they reflect better the real economic conditions inthe country. While the big firms, a greater part of which are state ones, are not sosensitive to the environment and their optimistic at first glance assessment issimply ignorance of the real conditions. For the time being it could he assumed thatof the two interpretations the first is more realistic.From the point of view of the market structure of the enterprises the picture issimilar. The most pessimistic are the enterprises with a little market share on theinterior market - 55.10 shadow economy. The optimism about the environmentgrows parallel to the growing market power of the firms and reaches 37.65%shadow economy at firms with 75 - 100% market share. These results can beexplained in the light of the above analysis. Firms with market power are not sovulnerable and are less influenced by the surrounding semi-market environmentthan firms with a small market share, which are more susceptible to theunfavourable changes of the environment.
Two major groups of enterprises can be pointed out. The first group - newly-founded small private firms under insider control with a small market share. Thesecond group - corporatised and privatised big state firms with big market power.The unfavourable semi-market economic environment strongly effects the firstgroup. The effect of the environment is weaker on the second group.
4.4.4.4. EffectsEffectsEffectsEffects ofofofof OwnershipOwnershipOwnershipOwnership andandandand ControlControlControlControl StructuresStructuresStructuresStructures onononon ManagerialManagerialManagerialManagerialBehaviourBehaviourBehaviourBehaviour4.1.4.1.4.1.4.1. InfluenceInfluenceInfluenceInfluence ofofofof EconomicEconomicEconomicEconomic ActorsActorsActorsActors
Is there a positive correlation between the nominal ownership and the efficientcontrol in the enterprises? An attempt has been made at a direct empirical study ofthe separation of the nominal dominating owner and the agent who actually makesthe decisions by assessing the effect of the different economic actors on themanagement of the enterprises. This effect is assessed in three degrees: 1 - rare orno effect; 2 - moderate effect; 3 - dominant, most important. It is studied accordingto four basic types of decisions.
50
aaaa. Influence of the economic agents on decision making in the sphere of sales,production, marketing, current operations of the enterprises. In CKs and PRKs themanagers have the strongest influence, in I'OH - the managers-owners. Thisinfiuenee is assessed near dominant. In the enterprises under state control themanagers have dominant influence too. The Boards of Directors have moderateinfluence and the Government - weak. In the firms under managers', workers" andoutsider control the managers-owners have dominant influence. In the enterprisesunder foreign firms' influence the outside institutional owners have dominantinfluence.
The results have been predicted because this type of decisions depends more onmanagerial professionalism than on the distribution of power among the differenteconomic actors in the enterprises. Only in the firms under foreign controldominant foreign investor has bigger control over this kind of decisions.
b.b.b.b. Influence of the economic agents on decision making in the sphere ofemployment, hiring and firing of workers, social and non-wage benefits. Themanagers have dominant influence in the corporatised state and privatised firmsand in the newly-founded private firms - the managers-owners.
Similar results have been received in the enterprises under different types ofcontrol as about the first type of decisions. The managers have dominant (thoughassessed as moderate) influence in the enterprises under state control and themanagers-owners have dominant influence in the enterprises under managerial,workers' and outsider control. In the enterprises, which are under foreign firms'control the outside institutional owners have dominant influence.
The results once again confirm the strong owner influence in the firms with adominant owner who is a foreign investor. Another specific result is the weakworkers' influence on this type of decision making in the enterprises nominallycontrolled by workers. In them the dominant influence belongs to the managersthough assessed as moderate.
c.c.c.c. Influence of the economic actors on decision making in the sphere of managerialemployment, hiring and firing of managers, managerial compensation.Surprisingly, in the corporatised state enterprises the Board of Directors has lowerinfluence on these decisions than the managers themselves. This influence wasassessed as moderate. In the privatized and the newly-founded private firms theresults confirm the rational expectations - the Boards of Directors have dominantinfluence in the first and the managers-owners - in the second.
In the enterprises under state control there is no economic agent who can exercisedominant influence on these types of decisions. The influence of the managers, theBoard of Directors and the Government is moderate.
51
In the enterprises under managerial control the managers have dominant influence,and in those under workers' control - the managers have moderate influence, butMill they are reported first at decision making.
In the enterprises under outsider control the Board of Directors has dominantinfluence and in the firms with a dominant foreign owner this influence belongs tothe outside institutional owners.
These results point out the relatively big managerial discretion in the corporatisedstate enterprises and in those under nominal workers' control. This generates thehypothesis that in this type of enterprises there is real separation of ownership andcontrol.
d.d.d.d. Influence of the economic agents on the financial decisions in the enterprises. Inthe corporatised state enterprises the managers have high independence whenmaking these decisions. Their influence is dominant, followed by the influence ofthe Board of Directors, which is assessed as moderate.
The managers-owners and the Board of Directors have dominant influence in theprivatised enterprises, followed by the managers and the outside institutionalowners, assessed moderate.
In the newly-founded private firms the picture is as follows: managers-owners andthe Board of Directors are with dominant influence, outside institutional ownerswith influence between moderate and dominant.
In the enterprises under state control the influence of the managers is moderate,followed by the influence of the Board of Directors, assessed also as moderatewhile the third in influence - the Government was assessed as weak or non-existent. These results once again confirm the high degree of managerial discretionin the public sector.
In the enterprises controlled by the managers the managers-owners have dominantinfluence at this type of decision making, followed by the moderate influence ofthe managers and the Board of Directors.
In the firms under workers' control the managers-owners and the Board ofDirectors share equal dominant influences. After them come the workers-ownerswhose influence was assessed as moderate. So, once again it is confirmed that thenominal dominant ownership of the workers has not been transformed intoeffective control over the enterprises.
In the enterprises under outsider control the managers-owners and the Board ofDirectors exercise dominant influence, followed by the outside institutionalowners. In this group, the firms under the control of foreign investors are a specialcase.
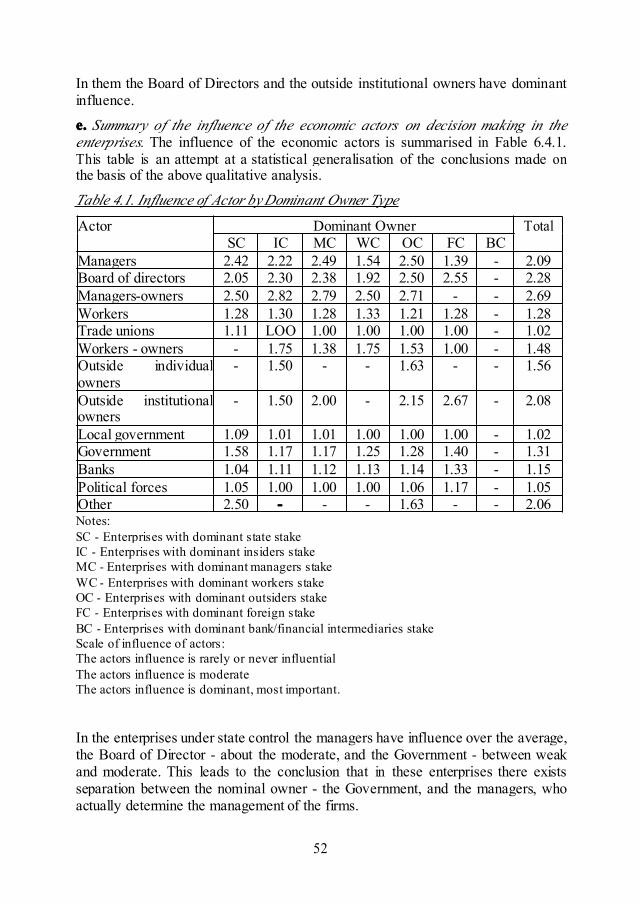
52
In them the Board of Directors and the outside institutional owners have dominantinfluence.
e.e.e.e. Summary of the influence of the economic actors on decision making in theenterprises. The influence of the economic actors is summarised in Fable 6.4.1.This table is an attempt at a statistical generalisation of the conclusions made onthe basis of the above qualitative analysis.
Table 4.1. Influence of Actor byDominant Owner Type
Actor Dominant Owner TotalSC IC MC WC OC FC BC
Managers 2.42 2.22 2.49 1.54 2.50 1.39 - 2.09Board of directors 2.05 2.30 2.38 1.92 2.50 2.55 - 2.28Managers-owners 2.50 2.82 2.79 2.50 2.71 - - 2.69Workers 1.28 1.30 1.28 1.33 1.21 1.28 - 1.28Trade unions 1.11 LOO 1.00 1.00 1.00 1.00 - 1.02Workers - owners - 1.75 1.38 1.75 1.53 1.00 - 1.48Outside individualowners
- 1.50 - - 1.63 - - 1.56
Outside institutionalowners
- 1.50 2.00 - 2.15 2.67 - 2.08
Local government 1.09 1.01 1.01 1.00 1.00 1.00 - 1.02Government 1.58 1.17 1.17 1.25 1.28 1.40 - 1.31Banks 1.04 1.11 1.12 1.13 1.14 1.33 - 1.15Political forces 1.05 1.00 1.00 1.00 1.06 1.17 - 1.05Other 2.50 ---- - - 1.63 - - 2.06Notes:SC - Enterprises with dominant state stakeIC - Enterprises with dominant insiders stakeMC - Enterprises with dominant managers stakeWC - Enterprises with dominant workers stakeOC - Enterprises with dominant outsiders stakeFC - Enterprises with dominant foreign stakeBC - Enterprises with dominant bank/financial intermediaries stakeScale of influence of actors:The actors influence is rarely or never influentialThe actors influence is moderateThe actors influence is dominant, most important.
In the enterprises under state control the managers have influence over the average,the Board of Director - about the moderate, and the Government - between weakand moderate. This leads to the conclusion that in these enterprises there existsseparation between the nominal owner - the Government, and the managers, whoactually determine the management of the firms.
53
In the enterprises under workers' control the managers-owners have betweenmoderate and dominant influence, followed by the Board of Directors with averageinfluence, and third in influence come the workers-owners, whose influence isbetween weak and moderate. In this type of firms there also exists real separationof the nominal dominant owner in the person of the workers, and the efficientcontrol exercised by the managers.
In the firms under outsider control the managers-owners have dominant influence,followed by the Board of Directors and the outsider institutional owners.
There is a second group of enterprises where the dominant owner and the dominanteconomic actor, the real decision-maker in the enterprises, coincide to a largeextent. These are the enterprises under managerial control and the enterprises underthe control of a foreign investor. On the basis of the hitherto analysis we can addthe newly-founded private firms to this group.
4.2.4.2.4.2.4.2. ManagerialManagerialManagerialManagerial StrategiesStrategiesStrategiesStrategies totototo EnterpriseEnterpriseEnterpriseEnterpriseRestructuringRestructuringRestructuringRestructuring
The managerial behaviour is revealed in using (or not using) different strategies ofadaptation to the new conditions by the enterprises. There are three basic groups ofmanagerial activity: general management, management of personnel and financialmanagement. The results below should be considered conventional and are only anattempt to highlight the basic differences in managerial behaviour in the differentgroups of enterprises classified according to their ownership structure and control.
General management. The corporatised state firms show passive behaviour in allspheres of economic activity in general management. The exception is only thesearch for new markets where the changes are assessed as moderate. The changesin price formation policy, marketing, improving the production quality are assessedbetween small and moderate.
The privatised firms have more directions of economic activity over the average.These are price policy and improvement of marketing, search for new markets. Asaverage are assessed the changes towards improvement of the production quality,the changes in the provision policy, and those connected with new investments. Incomparison with all the other ownership categories in the sphere of investments theprivatised firms demonstrate the highest activity.
The newly-founded private firms demonstrate changes over the average in thesphere of quality development and price policy, followed by the search for newmarkets and marketing improvement. In the other directions their activity showsmall changes, which is explainable taking into consideration their origin.
54
In the spheres of production, marketing and management restructuring theenterprises under outsider control (especially control by a foreign investor) are themost active. The most passive are the enterprises under state control. Theenterprises under insider control are in an intermediate position. In the sphere ofmanagement restructuring the enterprises under workers' control are the mostactive. There the changes in the management structure and the managing personnelare assessed as big. In the other types of control the changes are assessed as smalland average.
In the sphere of investments and technology development the changes in theenterprises under foreign investor's control are over moderate, and about moderate- in the firms under managerial control, and small - in the enterprises under stateand workers' control.
These results prompt the hypothesis that there is a correlation between the bigmanagerial discretion in the enterprises under state control and the passivemanagerial behaviour in the restructuring. On the other hand it can be assumed thatthere is a significant relation between the strong power of the owners andrespectively the low degree of managerial discretion in the enterprises under thecontrol of foreign investors and their active restructuring.
Personnel management. Salary reduction is not a priority strategy in neither of thestudied ownership groups and types of control. Just the opposite can be pointed out- a tendency of pay-rise.
The most insignificant changes in the sphere of personnel reduction are observed inthe newly-founded private firms. Considering their genesis this was quitepredictable. As a rule these companies employ small but well-structured personnel.
In the privatised companies the changes concerning the reduction of personnel aredefined as small. A similar assessment is given in the public sector firms. While thepreservation or the insignificant reduction of personnel in the privatised enterprisescan be explained with the requirements that are often suggested by the Governmentto the new owners, the passive behaviour towards the personnel in the public sectorcan only be explained by inefficient managerial behaviour. The managers are notmotivated to reduce the personnel because this may lead to social tension.
Paradoxically, the most active at personnel reduction are the firms under workers'control though this activity is relative to the other types of control. It is assessedbetween small and moderate. There follow the enterprises under state controlwhere the reduction of personnel is assessed as small. The most conservative in thisrespect are the firms under managerial control where the changes wereinsignificant.
55
The enterprises under outsider control and with a foreign owner take theintermediate position but are assessed low.
At first sight the behaviour of the firms under workers' control is surprising but itcan be interpreted with the help of the analysed specific structure of separation ofownership control. It gives bigger managerial discretion and managers couldbehave against personnel interests.
Financial management. The corporatised state firms were most active in the searchfor foreign investors and partners, the bank relations, the shortening of the paymentperiod. However, the assessment of the operations in these directions is low. Asimilar arrangement of priorities is characteristic of the privatised firms though thechanges in them are less tangible than in the public sector. The newly-foundedprivate firms have insignificant changes in all directions except for the search forforeign investors and partners. Summarising, it can be concluded that in the sphereof financial management the most active restructuring exists in the enterprisesunder outsider control, and within this group, in the ones under foreign owner'scontrol.
The firms under managerial control have the most passive restructuring. With theexception of the search for foreign partners and investors, in the other directionsthey are more passive than the firms under state control. It should be noted thoughthat the differences between the two groups are insignificant. They both giveassessment in the scope between small changes and no changes. The firms underworkers' control take an intermediate position.
The results once again show the leading role of the firms under a foreign owner'scontrol in the sphere of restructuring.
5.5.5.5. EffectsEffectsEffectsEffects ofofofof OwnershipOwnershipOwnershipOwnership andandandand ControlControlControlControl StructuresStructuresStructuresStructures onononon FirmFirmFirmFirm PerformancePerformancePerformancePerformance
5.1.5.1.5.1.5.1. OwnershipOwnershipOwnershipOwnership StructuresStructuresStructuresStructures andandandand FirmFirmFirmFirmPerformancePerformancePerformancePerformance
We check whether the specifics of the types of ownership influence upon firmsperformance as the private enterprises perform better than the state, corporateenterprises - better than traditional ones and newly created private enterprises -better than recently privatised.
In our study we have used the following indexes for firm performance: sales,profits/sales ratio, export/sales ratio, productivity/sales/employment, age of capitalstock and employment. Also used is the self-evaluation of the managers for thelevel of technology in the enterprises in relation with that of similar enterprises inthe developed countries and the economic position of the enterprises in the lastyears.
56
a.a.a.a. Sales. The data for our study show as a whole quite decreased volume of salesfor all categories enterprises for the period 1990-1995, which corresponds to thewhole condition of the economy in this period. That is why the influence of theownership can be searched in comparing the indexes for dynamics of the volume ofsales of the enterprises with different type of ownership with the average for thecountry. The data for the newly created private enterprises only show betterperformance then the average for the country and with quite a difference - 3-4times compared with the enterprises from the other three groups.
bbbb Profit/sales ratio. In 1995 all categories enterprises - SOE, CE, PRE and POEshow positive indexes for profit/sales ratio. But compared with the average data forthe whole sample the private enterprises have better indexes than the state ones. Ifthey separate to groups the arrangement will be the following -POE>PRE>Average>CE>SOE.
More different is the order in which the different groups of enterprises arearranged, if we take the dynamics of the index profit/sales ratio in the period 1990-1995 - SOE>PRE>POE>Average>CE. Most illogical seems the exchange of placesof the corporatised and traditional state enterprises (SOE). The enterprises fromSOE have extremely low level of the studied index in 1990. Although thatprofit/sales ratio increases most in SOE for the period 1990-1995, in 1995 it is stillten times lower than this of the other groups.
If we combine the dynamic and statistic aspect we will be able to express moreexactly the influence of the ownership upon profit/sales ratio. The results are thefollowing: very high result and stable growth (POE), high result and very highgrowth (PRE), low result and negative growth (CE) and extremely low result andvery high growth (SOE). The growth in the last group can be accepted as resultmore to the low starting level than it is provoked of the type of ownership.
As a whole we can say that the private enterprises are more efficient than the state,the difference between them remains high enough for the whole studied period, butinside the group of private enterprises the difference between POE and PREdecreases and inside the state enterprises - between CE and SOE.
c.c.c.c. Export/sales ratio. To a high extent this is also determined by other factorsoutside the structures of ownership. The branch, the size of the enterprises and theformer specialisation in the frames of COMECON can influence very strongly theshare of export in the total volume of sales.
Higher than the average is the share of export for SOE and lower for POE. Theindexes of the other two groups of enterprises are close to the average.
The studied enterprises as a whole have increased the export share in the last 5years. The dynamics though is different in the different groups. The highest rate of
57
increase is in POE - almost twice higher than the average for the whole while in theother groups it is lower than the average, e.g. the newly created private enterprisesvery quickly increase the export share in the volume of sales reaching in this waythe ratio which is characterising the other groups of enterprises.
d.d.d.d. Productivity. This is one of the most important indexes for measuring the firmperformance. Important is the level of productivity as well as its dynamics. Thelevels of productivity differ quite much between the different enterprises accordingto the type of ownership. Only POE show higher indexes than the average and thedifference compared with the other groups is several times more.
The dynamics of the productivity is also different. In all groups there is decrease m1995 compared with the level of 1990. The biggest (more than the average) is thisdecrease in POE and the least (less than the average) is in CE. in the other twogroups SOE and PRE this level is close to the average.
Considering the two indexes together - the level and the dynamics of theproductivity, we can see closing of the levels in the 5 years period despite the factthat these differences still remain big.
e.e.e.e. Employment. Concerning the relationship between ownership structure andemployed could be said the things mentioned about the sales. Furthermore theinherited over-employment in the state enterprises is a reason to expect much fasterdecrease of the number of employed in these enterprises compared with the restcategories. While in POE a part of the big increase in the number of employees isprobably due to the fact that in the last years they have had partly employedpersons who have not been registered.
The mentioned specifics once again confirm the difficulties for determining theconnection between the ownership and the indexes for performance. In this casethe stage of the life circle of the enterprise can weight more.
f.f.f.f. Age of capital stocks. It should be pointed that all newly created privateenterprises in Bulgaria are created after 1990 and that's why the age of theirequipment by rule is under 10 years except in the cases when they have boughtmachines and equipment at second hand. The privatised enterprises have inheritedthe age structure of their equipment from the state enterprises. The positiveinfluence of the private property and especially of the concentrated private propertyshould be felt as stronger as much more time has passed after the privatisation.
Data show that POE has the greatest share from the assets of age to 5 years. Theshare of the new machines and equipment is 3-10 times higher than in other groupsof enterprises. The arrangement is the following POE>Average>PRE>SOE>CE.
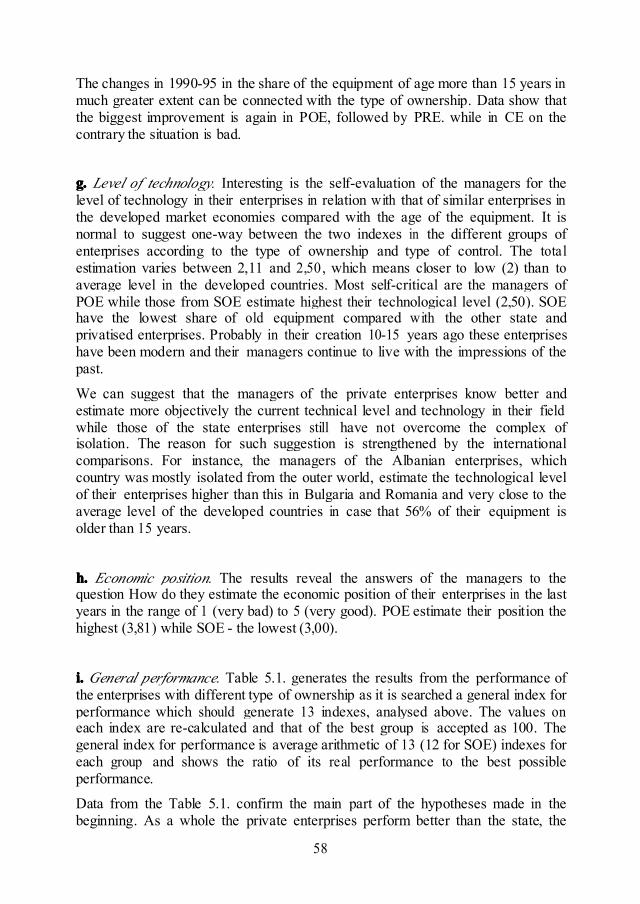
58
The changes in 1990-95 in the share of the equipment of age more than 15 years inmuch greater extent can be connected with the type of ownership. Data show thatthe biggest improvement is again in POE, followed by PRE. while in CE on thecontrary the situation is bad.
g.g.g.g. Level of technology. Interesting is the self-evaluation of the managers for thelevel of technology in their enterprises in relation with that of similar enterprises inthe developed market economies compared with the age of the equipment. It isnormal to suggest one-way between the two indexes in the different groups ofenterprises according to the type of ownership and type of control. The totalestimation varies between 2,11 and 2,50, which means closer to low (2) than toaverage level in the developed countries. Most self-critical are the managers ofPOE while those from SOE estimate highest their technological level (2,50). SOEhave the lowest share of old equipment compared with the other state andprivatised enterprises. Probably in their creation 10-15 years ago these enterpriseshave been modern and their managers continue to live with the impressions of thepast.
We can suggest that the managers of the private enterprises know better andestimate more objectively the current technical level and technology in their fieldwhile those of the state enterprises still have not overcome the complex ofisolation. The reason for such suggestion is strengthened by the internationalcomparisons. For instance, the managers of the Albanian enterprises, whichcountry was mostly isolated from the outer world, estimate the technological levelof their enterprises higher than this in Bulgaria and Romania and very close to theaverage level of the developed countries in case that 56% of their equipment isolder than 15 years.
h.h.h.h. Economic position. The results reveal the answers of the managers to thequestion How do they estimate the economic position of their enterprises in the lastyears in the range of 1 (very bad) to 5 (very good). POE estimate their position thehighest (3,81) while SOE - the lowest (3,00).
i.i.i.i. General performance. Table 5.1. generates the results from the performance ofthe enterprises with different type of ownership as it is searched a general index forperformance which should generate 13 indexes, analysed above. The values oneach index are re-calculated and that of the best group is accepted as 100. Thegeneral index for performance is average arithmetic of 13 (12 for SOE) indexes foreach group and shows the ratio of its real performance to the best possibleperformance.
Data from the Table 5.1. confirm the main part of the hypotheses made in thebeginning. As a whole the private enterprises perform better than the state, the
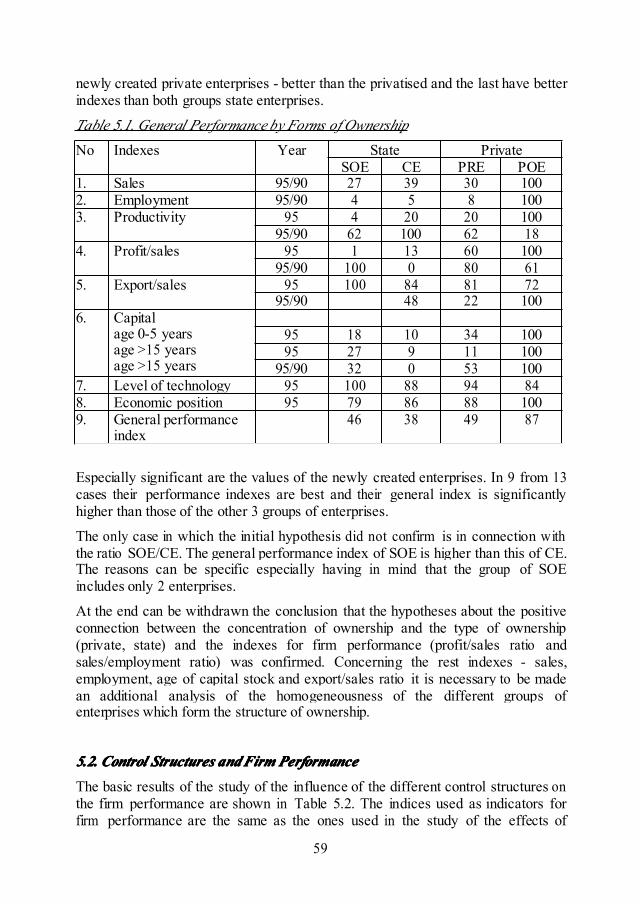
59
newly created private enterprises - better than the privatised and the last have betterindexes than both groups state enterprises.
Table 5.1. General Performance by Forms of Ownership
No Indexes Year State PrivateSOE CE PRE POE
1. Sales 95/90 27 39 30 1002. Employment 95/90 4 5 8 1003. Productivity 95 4 20 20 100
95/90 62 100 62 184. Profit/sales 95 1 13 60 100
95/90 100 0 80 615. Export/sales 95 100 84 81 72
95/90 48 22 1006. Capital
age 0-5 yearsage >15 yearsage >15 years
95 18 10 34 10095 27 9 11 100
95/90 32 0 53 1007. Level of technology 95 100 88 94 848. Economic position 95 79 86 88 1009. General performance
index46 38 49 87
Especially significant are the values of the newly created enterprises. In 9 from 13cases their performance indexes are best and their general index is significantlyhigher than those of the other 3 groups of enterprises.
The only case in which the initial hypothesis did not confirm is in connection withthe ratio SOE/CE. The general performance index of SOE is higher than this of CE.The reasons can be specific especially having in mind that the group of SOEincludes only 2 enterprises.
At the end can be withdrawn the conclusion that the hypotheses about the positiveconnection between the concentration of ownership and the type of ownership(private, state) and the indexes for firm performance (profit/sales ratio andsales/employment ratio) was confirmed. Concerning the rest indexes - sales,employment, age of capital stock and export/sales ratio it is necessary to be madean additional analysis of the homogeneousness of the different groups ofenterprises which form the structure of ownership.
5.2.5.2.5.2.5.2. ControlControlControlControl StructuresStructuresStructuresStructures andandandandFirmFirmFirmFirm PerformancePerformancePerformancePerformance
The basic results of the study of the influence of the different control structures onthe firm performance are shown in Table 5.2. The indices used as indicators forfirm performance are the same as the ones used in the study of the effects of
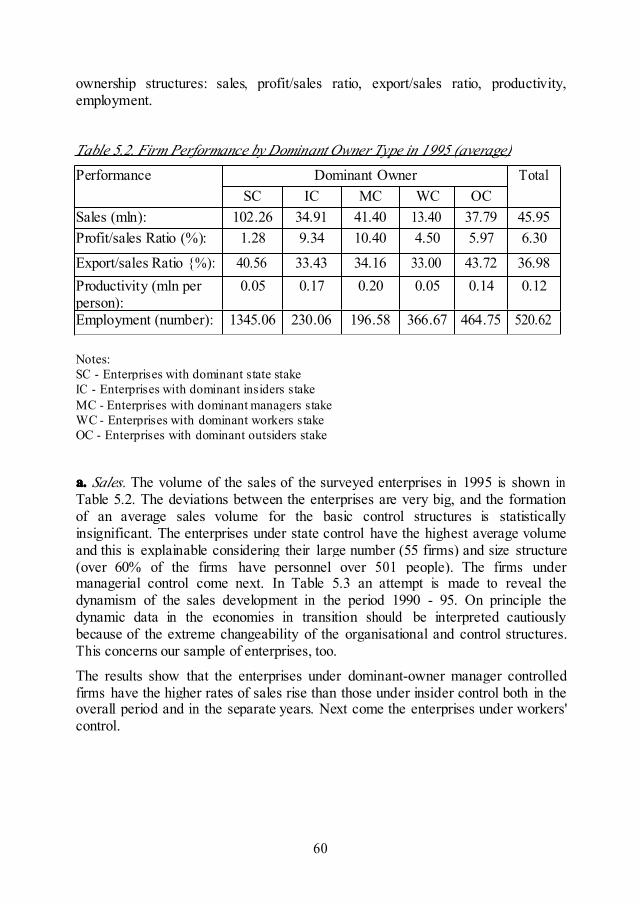
60
ownership structures: sales, profit/sales ratio, export/sales ratio, productivity,employment.
Table 5.2. Firm Performance by Dominant Owner Type in 1995 (average)
Performance Dominant Owner TotalSC IC MC WC OC
Sales (mln): 102.26 34.91 41.40 13.40 37.79 45.95Profit/sales Ratio (%): 1.28 9.34 10.40 4.50 5.97 6.30
Export/sales Ratio {%): 40.56 33.43 34.16 33.00 43.72 36.98Productivity (mln perperson):
0.05 0.17 0.20 0.05 0.14 0.12
Employment (number): 1345.06 230.06 196.58 366.67 464.75 520.62
Notes:SC - Enterprises with dominant state stakeIC - Enterprises with dominant insiders stakeMC - Enterprises with dominant managers stakeWC - Enterprises with dominant workers stakeOC - Enterprises with dominant outsiders stake
a.a.a.a. Sales. The volume of the sales of the surveyed enterprises in 1995 is shown inTable 5.2. The deviations between the enterprises are very big, and the formationof an average sales volume for the basic control structures is statisticallyinsignificant. The enterprises under state control have the highest average volumeand this is explainable considering their large number (55 firms) and size structure(over 60% of the firms have personnel over 501 people). The firms undermanagerial control come next. In Table 5.3 an attempt is made to reveal thedynamism of the sales development in the period 1990 - 95. On principle thedynamic data in the economies in transition should be interpreted cautiouslybecause of the extreme changeability of the organisational and control structures.This concerns our sample of enterprises, too.
The results show that the enterprises under dominant-owner manager controlledfirms have the higher rates of sales rise than those under insider control both in theoverall period and in the separate years. Next come the enterprises under workers'control.
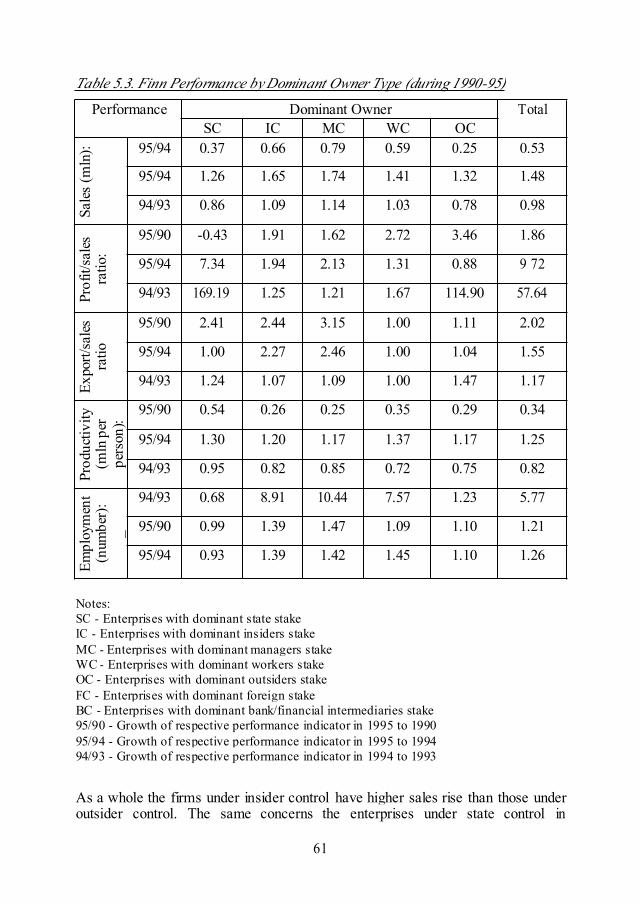
61
Table 5.3. Finn Performance byDominant Owner Type (during 1990-95)
Performance Dominant Owner TotalSC IC MC WC OC
Sale
s(m
ln): 95/94 0.37 0.66 0.79 0.59 0.25 0.53
95/94 1.26 1.65 1.74 1.41 1.32 1.48
94/93 0.86 1.09 1.14 1.03 0.78 0.98
Prof
it/sa
les
ratio
:
95/90 -0.43 1.91 1.62 2.72 3.46 1.86
95/94 7.34 1.94 2.13 1.31 0.88 9 72
94/93 169.19 1.25 1.21 1.67 114.90 57.64
Expo
rt/sa
les
ratio
95/90 2.41 2.44 3.15 1.00 1.11 2.02
95/94 1.00 2.27 2.46 1.00 1.04 1.55
94/93 1.24 1.07 1.09 1.00 1.47 1.17
Prod
uctiv
ity(m
lnpe
rpe
rson
):
95/90 0.54 0.26 0.25 0.35 0.29 0.34
95/94 1.30 1.20 1.17 1.37 1.17 1.25
94/93 0.95 0.82 0.85 0.72 0.75 0.82
Empl
oym
ent
(num
ber)
:_
94/93 0.68 8.91 10.44 7.57 1.23 5.77
95/90 0.99 1.39 1.47 1.09 1.10 1.21
95/94 0.93 1.39 1.42 1.45 1.10 1.26
Notes:SC - Enterprises with dominant state stakeIC - Enterprises with dominant insiders stakeMC - Enterprises with dominant managers stakeWC - Enterprises with dominant workers stakeOC - Enterprises with dominant outsiders stakeFC - Enterprises with dominant foreign stakeBC - Enterprises with dominant bank/financial intermediaries stake95/90 - Growth of respective performance indicator in 1995 to 199095/94 - Growth of respective performance indicator in 1995 to 199494/93 - Growth of respective performance indicator in 1994 to 1993
As a whole the firms under insider control have higher sales rise than those underoutsider control. The same concerns the enterprises under state control in
62
comparison with those under outsider control. So, it can be supposed that thedominant owner-manager controlled firms show more efficient performance withconsideration to the sales rise. The firms under outsider control show the lowestrate of sales rise.
b.b.b.b. Profit/sales ratio. The results characterising the profitability of the enterprisesare presented in Table 5.2. According to expert estimation the enterprises underinsider control have a position between satisfactory and good. There follow thefirms under state and insider control with similar grades, a little over thesatisfactory. These results are statistically significant.
The dominant owner-manager controlled enterprises show the highest profitability,followed by the firms under outsider control. Further are the enterprises underworkers' control and the arrangement finishes with the firms under state control.The nature of the studied indicator can create conditions for hiding the realprofitability by the managers while interviewed. In spite of this, on the basis ofadditional expert estimation and its coincidence with the profitability data, it can besupposed that the most efficient are the firms under dominant owner- managercontrol, while the least efficient ones are the firms under state control.
The dynamism of the studied indicator is shown in Table 5.3. For the period 1990 -95 the highest rate of profitability rise belongs to the firms under outsider control,followed by the firms under workers' control. The manager-controlled firms comein between these two. Last, the firms under state control are with a negative rate ofprofitability rise.
c.c.c.c. Export/sales ratio. Another indicator characterising the firm performance of thesurveyed enterprises is export/sales ratio. (See Table 5.2) This is an indirectindicator of the competitiveness of the enterprises. The highest share for 1995belongs to the enterprises under outsider control, followed by those under statecontrol. The enterprises under managerial and workers' control give similar resultsand are at the bottom of the scale. These average results are not statisticallyimportant because of the dispersal of data in the different control groups ofenterprises.
Against the background of dynamism for the period 1990 - 95 this indicator has thehighest value in the manager-controlled enterprises. Then come the firms understate control, those under outsider control and last come the enterprises underworkers' control.
On the basis of the data gathered, it can be concluded that the most competitive onthe foreign markets are the enterprises under outsider control. Here, however, thecause-effect relation can be different. They are competitive not because they haveoutsider control, but they have outsider control because they were competitive at
63
the beginning of the reform in the 90s. Going on speculating, we can also explainwhy the enterprises under state control have grades of this indicator. They areexport-oriented enterprises.
d.d.d.d. Productivity (sales/employment). Another important indicator of efficient firmperformance is productivity. The 1995 results in this respect are shown in Table 5.2and 5.3. The dominant owner-manager controlled enterprises are the mostproductive in 1995, followed by the firms under outsider control. The last twoplaces are taken by the enterprises under workers' and state control.
Viewed dynamically, this indicator shows a different picture. The highest rate ofproductivity growth for the period 1990 - 95 have the enterprises under statecontrol. There follow the enterprises under workers' control. The firms underinsider control take an intermediate position. Last according to the rate ofproductivity growth come the manager-controlled firms.The higher rate of productivity growth in the public sector should be explained onthe basis of the whole hitherto analysis.
e.e.e.e. Age of capital stock. For 1995 about half of the capital in the enterprises underinsider control, about 20 % of the capital of the enterprise under outsider controland a very small part (5%) of the capital under state control falls into the agecategory 0 -5 years.At the other end of the age structure - over 15-year old equipment the arrangementis in the same order but backwards. In the enterprises under state control about40% of the equipment is of that age, in those under insider control - a little over10%. The last group, the firms under managerial control, has about 8% of theircapital in this age category.
These results are supplemented by expert assessment of the technological level ofthe enterprises studied in comparison with similar enterprises in the developedmarket economies. The estimation is that in all the enterprises this level is lower.There are little differences in the types of control.
The most optimistic are the managers in the enterprises under outsider control,followed by those under state control and last come the enterprises under insidercontrol.
The results do not give a definite assessment of the state of the equipment in theenterprise grouped according to control type. It can be supposed, however, that theenterprises under dominant owner-manager control, have more modern equipment,while the enterprises under state control have the oldest one.
f.f.f.f. Employment. The firm performance in relation to employment is shown in Table5.2 and 5.3. For 1995 the average number of personnel is the highest in the
64
enterprises under state control (about 1, 350 people), and lowest in the enterprisesunder outsider control (average - 460 people) and the firms under workers' control -370 people.
The dynamism of the development of this indicator for 1990 - 95 shows that theincrease of personnel is highest in the manager-controlled enterprises, followed bythe enterprises under workers' control. The enterprises under outsider control comethird. The increase of personnel in the state-controlled enterprises is insignificant.
It could be supposed that the enterprises under dominant owner-manager controland workers' control have a more expansive employment policy, and the enterpr; esunder outsider and state control - more restrictive.
6.6.6.6.MarketMarketMarketMarket Power,Power,Power,Power, GovernmentGovernmentGovernmentGovernment InfluenceInfluenceInfluenceInfluence andandandand OtherOtherOtherOther FactorsFactorsFactorsFactors onononon FirmFirmFirmFirmPerformancePerformancePerformancePerformance
6.1.6.1.6.1.6.1. MarketMarketMarketMarket StructureStructureStructureStructure
The market structure is one of the main factors, which influence on firmperformance. In this study we accept a wider understanding of this relationship asbesides the market share we include other factors - share of export, number ofcompetitors and their behaviour, which we determine as elements of the marketstructure. The aim is to be more exactly determined the market power of a certaingroup of firms and the competitive character of the environment in which they act.
Similar approach we accept in study the relationship between market structure andperformance for the conditions in Bulgaria as its market structure is characterisedwith some contradictory moments. First, the country has a small domestic market.Second, Bulgarian firms were specialised for the huge market of CMEA whichfurther more enforces the opportunity for monopolisation of the domestic marketbut in the post-communist period creates conditions these firms to act incompetitive environment of the foreign markets. Third, the country opens by itsmembership in the World Trade Organisation, its association to the EuropeanUnion, creation of bilateral zones for free trade and the forthcoming joining toCEFTA. All these steps lead to increasing influence of the foreign firms on thedomestic market. Fourth, in the last years in Bulgaria were created a few hundredthousand SME, part of which show more increasing competitive pressure on theexisting medium and big state-owned enterprises.
It is obvious that in these conditions only the share of one firm on the domesticmarket cannot determine quite exactly the market power of a certain firm and thecompetitive character of the environment in which it acts. We will analyse theinfluence of export/sales ratio, number and behaviour of competitors, market shareof the foreign competitors as well as their number and behaviour.
65
The interaction between the factors can be studied in two directions. First, to checkwhether the other factors influence in the same direction as the market share uponthe market power of the enterprise and the competitive character of theenvironment in which it operates. Second, to determine what is the total influenceof the different factors upon the enterprises from the different groups - byownership, control, size and branch.Data from table 6.1. show that the other factors influence in direction ofdiminishing the market power and improving the competitive character of theenvironment in 2 groups enterprises - with market share 25-50% and 50-75%. Inthe enterprises with more than 75% market share the influence of all factors is one-way for increasing the market power and limiting the competition. Exception isonly the share of the export, which is higher than that of the other groups ofenterprises but it cannot neutralise the contrary influence of the factors acting onthe domestic market.
Table 6.1. Market Share and Other Factors for Market Power
mar
kets
hare
expo
rt/sa
les
ratio
num
bero
f|co
mpe
titor
s
beha
viou
r
mar
kets
hare
offo
reig
ners
num
bero
ffo
reig
nco
mpe
titor
s
beha
viou
rof
fore
igne
rs
tota
lest
imat
ion
0-25% + + + = = = - +225-50% - + = = + + = +250-75% - + - = = = + 0
75-100% - + - - - - - -5
Note: market share: small (+), middle (=), big (-); number of competitors: big _ over theaverage (+), around the average (=), small (-); behaviour: aggressive (+). average (=),friendly (-); number foreign competitors: big _ over the average (+), around the average(=),behaviour: aggressive (+), average (=), friendly (-); criteria for classification: strongcompetitive (over +5), rather competitive (+2 till +4), neutral (- 1 till +1), rather non-competitive (- 2 till - 4), strong non-competitive (under - 5)
If we follow the influence of each factor upon the different groups of enterpriseswe will have the following picture:
Market share. Concerning the ownership and control the enterprises in Bulgaria aredivided clearly in 2 groups. The state firms, especially those which are corporatisedas well as the firms under state control have very high market share (>43%). Theprivate firms as well as those with IC and OC have comparatively low market share- under 22,76%.
66
By branches - engineering and chemicals have high market share - over 47,52%while the light industry as a whole, including food processing and wooden andpaper industry, have small (under 20,5% and the rest branches - close to the middlefor the country (32.1 %).
By size structure enterprises are also divided in two groups - till 500 employeeswith low market share and over 500 employees with high market share.
Export/sales ratio. As a whole Bulgarian enterprises export comparatively highshare of their production - average 37,39%) which for instance is about 2 timesmore than the share of the export of the other two countries in our study - Albaniaand Romania. The data show that in spite of the way of grouping of the enterprises- by ownership, by control, by branches, by size or by share on the domestic marketall groups enterprises have strong competitive influence from the foreign markets.There are only 2 exceptions - enterprises from primary and wooden and paperindustries. In a certain extent it is surprising that all newly created firms and allSME included in our sample have high share of export because this does notcorrespond to the situation of the country as a whole for these two groupsenterprises. The explanation could be in the fact that we don't study microenterprises and those from retail trade and services, which are dominated part andwork mainly on the domestic market.
Number of competitors. The number of competing enterprises on the Bulgarianmarket is approximately big - almost 37 average for the country. This could bevery clearly seen if we compare the number of competitors in the other two studiedcountries - three times more than Albania and twice more than Romania. It couldbe supposed that in Albania the number of competitors are mainly determined bythe small size of this economy. The more opened character of the Bulgarianeconomy and more fully separation of the former state complexes of enterprises ledto bigger increase of the number of the state enterprises in Bulgaria compared withRomania.
The influence of the last factor is seen very clearly when we compare the numberof the competitors of the state and private enterprises in Bulgaria. Where thedecentralisation is made - in corporatised state firms, the number of competitors ishigher than in the privatized and newly established firms.
There are natural factors which determine the smaller number of competitors andthis could be seen most clearly the enterprises by branches. The smallest numbercompetitors have the firms from primary industry sector (1,20), engineering (5,20)and chemicals (6,77) while in the enterprises from food industry their number is thebiggest (99,14).
When the enterprises are grouped according to the number of employees we cansee a natural tendency of decrease of the number of the competitors. Exception is
67
the smallest size group (under 50) whose enterprises have average 2-3 times lesscompetitors than those from the next size group. It could be supposed that includedin our sample small enterprises are specialised and they have found a small niche inwhich there is no place for many producers.
As a whole the number of enterprises in Bulgaria is enough to create conditions forcompetition and in this sense opportunities for better performance. Exceptions areprimary industries, firms with over 1000 employees and those with over 45%market share where the competitors are few.
Behaviour of competitors. As a whole the behaviour of the competitors on theBulgarian market is not very aggressive. Nevertheless the data give opportunity todiffer some groups of enterprises. The pressure for diminishing the market share ofthe studied enterprises is higher than the average in small and medium-sizedenterprises (to 250 employees), in those under insiders control and the food,wooden and paper industries. The pressure is less than the average for the stateenterprises, for those with more than 250 employees and the engineering, textileand primary industries.
Number of foreign competitors. The number of the foreigners is highest in thetextile industry, concerning the small and medium-sized enterprises (to 250employees), newly created private enterprises. Comparatively lower is theirnumber in the primary sector, concerning the traditional state enterprises, the bigenterprises (over 500 employees) and those from the food and chemical industries.
The reason for studying separately the share and the behaviour of the foreign andthe domestic competitors is the expectation for a difference between the twogroups. Concerning the market share the difference is in the fact that the averagemarket share of one foreign competitor is 50-60% higher than this of one domesticcompetitor.
Behaviour of foreign competitors. The expectations for more aggressive behaviourof the foreign competitors are not covered. As a whole for the country and in mostof the groups of enterprises this behaviour is similar to the behaviour of thedomestic competitors. More aggressive is the behaviour of the foreigners only inwooden and paper industries and engineering. Friendlier is the behaviour of theforeigners in the primary sector, in the enterprises with more than 250 employeesand in those under outsider control.
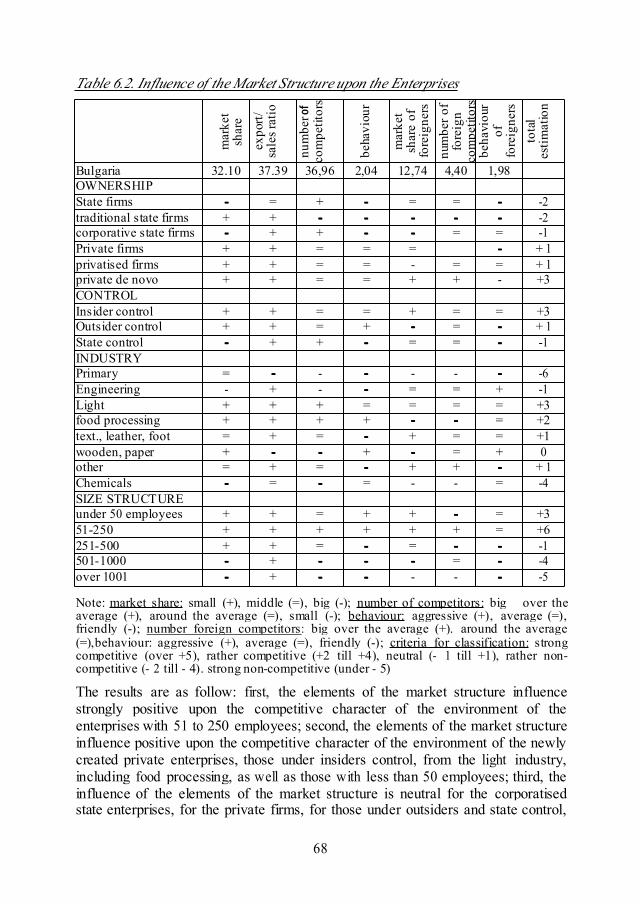
68
Table 6.2. Influence of theMarket Structure upon the Enterprises
mar
ket
shar
e
expo
rt/sa
lesr
atio
num
berof
com
petit
ors
beha
viou
r
mar
ket
shar
eof
fore
igne
rsnu
mbe
rof
fore
ign
com
petit
ors
beha
viou
rof
fore
igne
rsto
tal
estim
atio
n
Bulgaria 32.10 37.39 36,96 2,04 12,74 4,40 1,98OWNERSHIPState firms ---- = + ---- = = ---- -2traditional state firms + + ---- ---- ---- ---- ---- -2corporative state firms ---- + + ---- ---- = = -1Private firms + + = = = ---- + 1privatised firms + + = = - = = + 1private de novo + + = = + + - +3CONTROLInsider control + + = = + = = +3Outsider control + + = + ---- = ---- + 1State control ---- + + ---- = = ---- -1INDUSTRYPrimary = ---- - ---- - - ---- -6Engineering - + - ---- = = + -1Light + + + = = = = +3food processing + + + + ---- ---- = +2text., leather, foot = + = ---- + = = +1wooden, paper + ---- ---- + ---- = + 0other = + = ---- + + ---- + 1Chemicals ---- = ---- = - - = -4SIZE STRUCTUREunder 50 employees + + = + + ---- = +351-250 + + + + + + = +6251-500 + + = ---- = ---- ---- -1501-1000 ---- + ---- ---- ---- = ---- -4over 1001 ---- + ---- ---- - - ---- -5
Note: market share: small (+), middle (=), big (-); number of competitors: big _ over theaverage (+), around the average (=), small (-); behaviour: aggressive (+), average (=),friendly (-); number foreign competitors: big over the average (+). around the average(=),behaviour: aggressive (+), average (=), friendly (-); criteria for classification: strongcompetitive (over +5), rather competitive (+2 till +4), neutral (- 1 till +1), rather non-competitive (- 2 till - 4). strong non-competitive (under - 5)
The results are as follow: first, the elements of the market structure influencestrongly positive upon the competitive character of the environment of theenterprises with 51 to 250 employees; second, the elements of the market structureinfluence positive upon the competitive character of the environment of the newlycreated private enterprises, those under insiders control, from the light industry,including food processing, as well as those with less than 50 employees; third, theinfluence of the elements of the market structure is neutral for the corporatisedstate enterprises, for the private firms, for those under outsiders and state control,
69
for those from engineering, textile, leather and foot, wooden, paper industries, forthose with 251-500 employees; fourth, elements of the market structure have rathernegative influence upon the competitive character of the environment fortraditional state firms; fifth , elements of the market structure have strongly negativeinfluence upon the competitive character of the environment for the firms fromprimary industry, chemicals and those with more than 500 employees.
Sales. The dynamics of the total volume of sales can be influenced by the marketshare of the enterprise. In conditions of crisis the bigger market share can be afactor for a bigger resistance to outside shocks. All groups of enterprises showdecrease in the volume of sales but in those with more than 50% market share thedecrease is less.
Employment. The dynamics of the employment shows quite colourful picture. Thenumber of the employees has increased most in the enterprises with less than 25%market share. Both middle groups (25-50%) and (50-75%) show decrease of thetotal number of employees while the group with the highest market share hasincreased the number of employees but considerably less than the first group.
Profit/sales ratio. This is one of the most important synthetic indexes formeasuring the firm performance in normal economic conditions. In 1995 all groupsof enterprises show positive values of this index with the exception of those withmarket share 50-75% (-1,83%). The index of the enterprises with market share 25-50%. is the highest (8,6%).
In the study of the dynamics of profit/sales ratio the arrangement is more different.Only the enterprises with less market share have improvement in 1995 comparedwith 1990. The other groups have spoiled their results as the worst are the data forthose with market share over 75%.
Productivity. With highest productivity are the enterprises with market share 25-50% and with worst are those with market share over 75%. The other two groupsare in a medium position with little difference between them.
The dynamics of the productivity is highest in the group with market share 50-75% and the worst is in that with less than 25%.
Export/sales ratio. All groups have high share of the export in the sales - over 30%.The highest is in the two margin groups - 43,15% (0-25%) and 45,61% (75-100%).All groups have also increased the share of the export in the last 5 years. Thebiggest is the increase in the group with the least share of export, which givesreason to expect a certain equity between the different groups.
70
Age of capital. There is a sensitive difference concerning the share of the newequipment (0-5 years). While in the enterprises with market share 25-50% it is26,41%, in those with market share 50-75% it is only 5%. In a similar way arearranged the different groups by the share of the old equipment (>15 years). Thehighest share (69.55%) have the enterprises with market share 50-75% and thelowest - those with market share 25-50% (15,96%).
In the period 1990-95 the share of the old equipment has decreased almost with8%> in the enterprises with market share 25-50% while in the groups with highermarket share it has increased.
Level of technology. The self-estimation of the managers about the technologicallevel of their enterprises as a whole fits with the arrangement by age of capital withthe exception of the enterprises with market share over 75%. This group has highshare of old equipment, small share of new equipment and the biggest increase inthe share of capital of age over 15 years, however the managers estimate that thetechnological level of their enterprises is closest to that of the developed countries.
Economic position. The differences between the different groups are not bigconcerning the self-estimation about the economic position of the enterprises (from3,33 to 3,83) which means between average and good. Nevertheless compared withthe other indexes it seems that the managers of the two groups with higher marketshare (50-75%) and (75-100%)) have overestimated their enterprises.
General performance. Table 6.3. presents the general results for the firmperformance with different market share. The highest general performance indexhave the enterprises with market share 25-50%. Their results are the highest in 6from total 13 used indexes for measuring the firm performance and only in onecase - the dynamics of export/sales ratio, the result is the lowest.The enterprises with market share (50-75%) and (75-100%) show comparativelyworst general performance index. The first group has the lowest values of 6 of theperformance indexes.
No matter how conditional is this approach for quantity determination of thegeneral performance index, the fact that the best performed group has the bestresults in the half of the used indexes and the worst performed group has the worstresults in the half of the indexes, shows that the arrangement is reasonable.
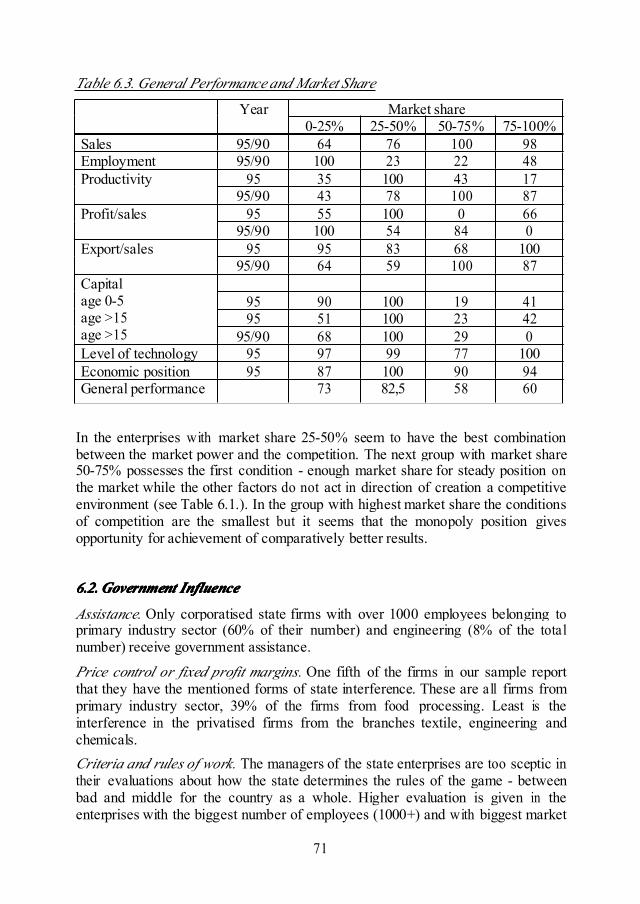
71
Table 6.3. General Performance and Market Share
Year Market share0-25% 25-50% 50-75% 75-100%
Sales 95/90 64 76 100 98Employment 95/90 100 23 22 48Productivity 95 35 100 43 17
95/90 43 78 100 87Profit/sales 95 55 100 0 66
95/90 100 54 84 0Export/sales 95 95 83 68 100
95/90 64 59 100 87Capitalage 0-5age >15age >15
95 90 100 19 4195 51 100 23 42
95/90 68 100 29 0Level of technology 95 97 99 77 100Economic position 95 87 100 90 94General performance 73 82,5 58 60
In the enterprises with market share 25-50% seem to have the best combinationbetween the market power and the competition. The next group with market share50-75% possesses the first condition - enough market share for steady position onthe market while the other factors do not act in direction of creation a competitiveenvironment (see Table 6.1.). In the group with highest market share the conditionsof competition are the smallest but it seems that the monopoly position givesopportunity for achievement of comparatively better results.
6.2.6.2.6.2.6.2.GovernmentGovernmentGovernmentGovernment InfluenceInfluenceInfluenceInfluence
Assistance. Only corporatised state firms with over 1000 employees belonging toprimary industry sector (60% of their number) and engineering (8% of the totalnumber) receive government assistance.
Price control or fixed profit margins. One fifth of the firms in our sample reportthat they have the mentioned forms of state interference. These are all firms fromprimary industry sector, 39% of the firms from food processing. Least is theinterference in the privatised firms from the branches textile, engineering andchemicals.Criteria and rules of work. The managers of the state enterprises are too sceptic intheir evaluations about how the state determines the rules of the game - betweenbad and middle for the country as a whole. Higher evaluation is given in theenterprises with the biggest number of employees (1000+) and with biggest market
72
share (75-100%) which reveals the satisfaction of the big monopoly enterprises.
6.3.6.3.6.3.6.3. IndustryIndustryIndustryIndustry SectorSectorSectorSector andandandand FirmFirmFirmFirmPerformancePerformancePerformancePerformance
Sales. Best results has chemical industry while least sales per enterprise haveengineering, textile and wooden, paper industries. To a great extend these resultsare predetermined by the character of production and that is why it is moreimportant to trace the tendency in the development of the sales compared with theaverage for the economy as a whole.
Better than the average is the tendency in two branches - textile and chemicals. Onthe other pole with less rate are the branches food processing, wooden and paperindustries. The rest branches have tendency of developing the sales close to theaverage for the country.
Profit/sales ratio. This is a synthetic index, which in greater extent than the formercould be connected with the quantity of work of the particular enterprise, with itscondition in 1995 as well as with the tendencies of its development.
Best is this index in the enterprises from the textile and chemical industry as wellas from food processing and light industry as a whole. There is only one branch -primary industry sector whose index profit/sales ratio defers sharply from theothers. In analysing we should not ignore the possible influence of external factors
the different prices, as a rule smaller than the market prices combined with the lackof export and relative partial compensation by higher international prices.
Concerning the tendency of change of the index profit/sales ratio it is better thanthe average for food processing, light and primary industry sectors and worse forengineering and chemicals.
On the basis of these data we can make the following suggestions for the groupingof the branches according to the condition and the tendencies of development ofthe index profit/sales ratio:
light industry, food processing and others which are profitable and all the timeimprove their condition,
chemical industry is strongly profitable but with negative tendency ofdevelopment,
primary industry is strongly losing but with positive tendency.
Export/sales ratio. In 1995 the enterprises from engineering and textile haveexported the biggest share of their production, with comparatively low export shareis wooden, paper industry while the export from primary industry is zero.Only the textile industry increases sensitively its share of export while food, paperand wooden industry increase their shares lower than the average for the country.According to the conditions and tendencies of development of the index
73
export/sales ratio we could suggest the existence of three groups branches - textileindustry has high export share which is increasing, wooden, paper industry hascomparatively low export share which continues to decrease and all the otherbranches are close to the average for the country.
Productivity (sales/employment). The enterprises from food processing and otherindustries are with highest productivity. The enterprises from primary industry andwooden, paper industries on the contrary, show 3-8 times less productivity than Ilie average.
Hie chemicals and engineering show best tendency for development of this indexwhile food processing comparatively worst.
The mutual studying of the condition of the productivity in 1995 and the tendenciesof its development in the last 5 years period shows contradiction - there cannot beseen final positions of improving the higher productivity and decreasing the lowproductivity of the enterprises.
Employment. The number of employees in the enterprises by branches isdetermined to a great extent by the character of the production that is why moreimportant are the tendencies of its increase or decrease. The biggest number ofemployed is in enterprises from the primary industries followed by those fromchemical industry. The enterprises from the light industry are with the least numberof employed. This totally fits with the character of the production and with the totalpicture of the country.
The arrangement is different when we examine the changes in the number ofemployed 95/90. The traditional branches (primary industry, engineering,chemistry) show slightly decrease in the number of employed while the otherbranches show significant increase in this number. The reason should not besearched at branch level because the light industry has not increased its productionfew times. Rather the explanation is at enterprise level - in the light industry thereare more private enterprises, incl. newly created ones which for the studied periodhave grown and have increased the number of employees.
Age of capital stocks. The share of the equipment older than 15 years iscomparatively lower in engineering, textile, wooden industries while in primaryindustry it is extremely high (76%). Especially negative is that this branch has thehighest percent of increase of the old equipment in the last 5 years.
In the economy as a whole and in the biggest part of the branches we can seepositive tendency of decrease of the share of the oldest equipment and it isstrongest in engineering and textile, which has led to the mentioned comparativelygood results in 1995.
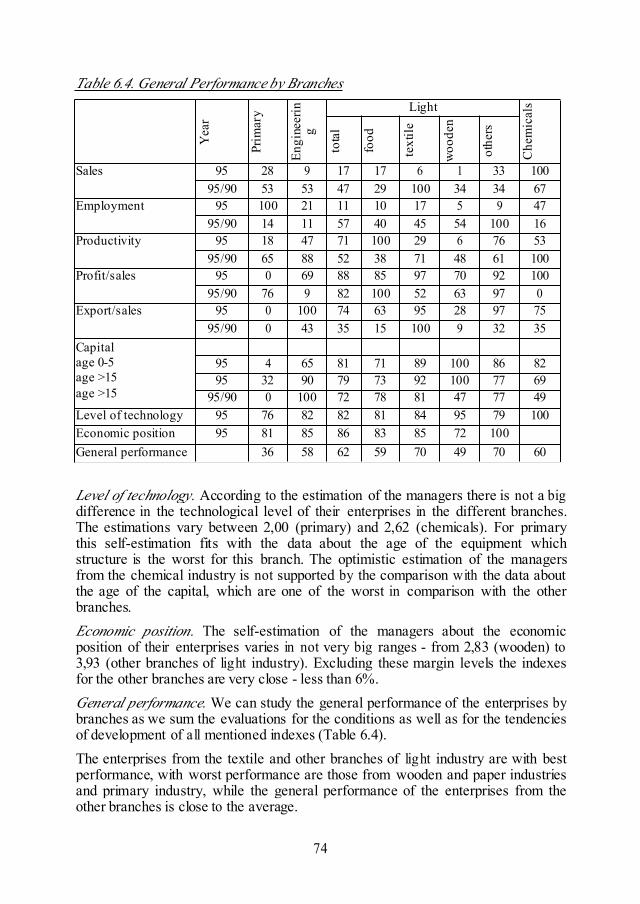
74
Table 6.4. General Performance by Branches
Yea
r
Prim
ary
Engi
neer
ing
Light
Che
mic
als
tota
l
food
text
ile
woo
den
othe
rs
Sales 95 28 9 17 17 6 1 33 10095/90 53 53 47 29 100 34 34 67
Employment 95 100 21 11 10 17 5 9 4795/90 14 11 57 40 45 54 100 16
Productivity 95 18 47 71 100 29 6 76 5395/90 65 88 52 38 71 48 61 100
Profit/sales 95 0 69 88 85 97 70 92 10095/90 76 9 82 100 52 63 97 0
Export/sales 95 0 100 74 63 95 28 97 7595/90 0 43 35 15 100 9 32 35
Capitalage 0-5age >15age >15
95 4 65 81 71 89 100 86 8295 32 90 79 73 92 100 77 69
95/90 0 100 72 78 81 47 77 49Level of technology 95 76 82 82 81 84 95 79 100Economic position 95 81 85 86 83 85 72 100General performance 36 58 62 59 70 49 70 60
Level of technology. According to the estimation of the managers there is not a bigdifference in the technological level of their enterprises in the different branches.The estimations vary between 2,00 (primary) and 2,62 (chemicals). For primarythis self-estimation fits with the data about the age of the equipment whichstructure is the worst for this branch. The optimistic estimation of the managersfrom the chemical industry is not supported by the comparison with the data aboutthe age of the capital, which are one of the worst in comparison with the otherbranches.Economic position. The self-estimation of the managers about the economicposition of their enterprises varies in not very big ranges - from 2,83 (wooden) to3,93 (other branches of light industry). Excluding these margin levels the indexesfor the other branches are very close - less than 6%.General performance. We can study the general performance of the enterprises bybranches as we sum the evaluations for the conditions as well as for the tendenciesof development of all mentioned indexes (Table 6.4).The enterprises from the textile and other branches of light industry are with bestperformance, with worst performance are those from wooden and paper industriesand primary industry, while the general performance of the enterprises from theother branches is close to the average.
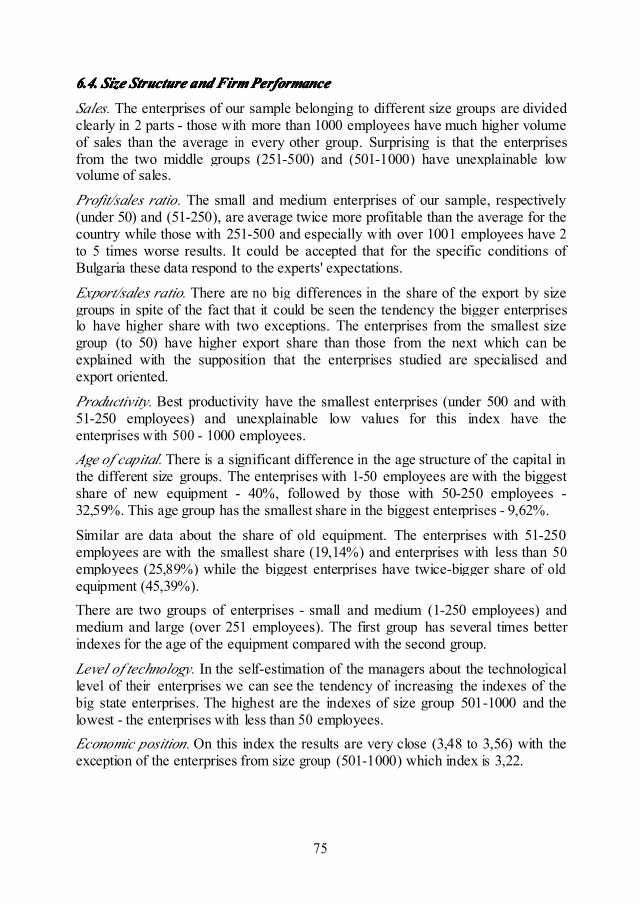
75
6666.4..4..4..4. SizeSizeSizeSize StructureStructureStructureStructure andandandand FirmFirmFirmFirmPerformancePerformancePerformancePerformance
Sales. The enterprises of our sample belonging to different size groups are dividedclearly in 2 parts - those with more than 1000 employees have much higher volumeof sales than the average in every other group. Surprising is that the enterprisesfrom the two middle groups (251-500) and (501-1000) have unexplainable lowvolume of sales.
Profit/sales ratio. The small and medium enterprises of our sample, respectively(under 50) and (51-250), are average twice more profitable than the average for thecountry while those with 251-500 and especially with over 1001 employees have 2to 5 times worse results. It could be accepted that for the specific conditions ofBulgaria these data respond to the experts' expectations.
Export/sales ratio. There are no big differences in the share of the export by sizegroups in spite of the fact that it could be seen the tendency the bigger enterpriseslo have higher share with two exceptions. The enterprises from the smallest sizegroup (to 50) have higher export share than those from the next which can beexplained with the supposition that the enterprises studied are specialised andexport oriented.
Productivity. Best productivity have the smallest enterprises (under 500 and with51-250 employees) and unexplainable low values for this index have theenterprises with 500 - 1000 employees.Age of capital. There is a significant difference in the age structure of the capital inthe different size groups. The enterprises with 1-50 employees are with the biggestshare of new equipment - 40%, followed by those with 50-250 employees -32,59%. This age group has the smallest share in the biggest enterprises - 9,62%.
Similar are data about the share of old equipment. The enterprises with 51-250employees are with the smallest share (19,14%) and enterprises with less than 50employees (25,89%) while the biggest enterprises have twice-bigger share of oldequipment (45,39%).There are two groups of enterprises - small and medium (1-250 employees) andmedium and large (over 251 employees). The first group has several times betterindexes for the age of the equipment compared with the second group.
Level of technology. In the self-estimation of the managers about the technologicallevel of their enterprises we can see the tendency of increasing the indexes of thebig state enterprises. The highest are the indexes of size group 501-1000 and thelowest - the enterprises with less than 50 employees.Economic position.On this index the results are very close (3,48 to 3,56) with theexception of the enterprises from size group (501-1000) which index is 3,22.
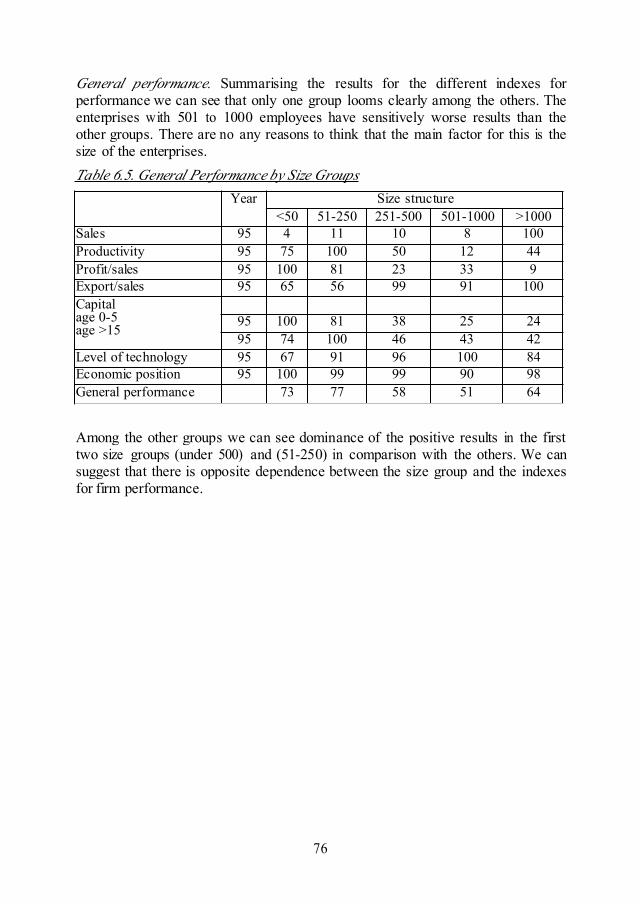
76
General performance. Summarising the results for the different indexes forperformance we can see that only one group looms clearly among the others. Theenterprises with 501 to 1000 employees have sensitively worse results than theother groups. There are no any reasons to think that the main factor for this is thesize of the enterprises.Table 6.5. General Performance by Size Groups
Year Size structure<50 51-250 251-500 501-1000 >1000
Sales 95 4 11 10 8 100Productivity 95 75 100 50 12 44Profit/sales 95 100 81 23 33 9Export/sales 95 65 56 99 91 100Capitalage 0-5age >15 95 100 81 38 25 24
95 74 100 46 43 42Level of technology 95 67 91 96 100 84Economic position 95 100 99 99 90 98General performance 73 77 58 51 64
Among the other groups we can see dominance of the positive results in the firsttwo size groups (under 500) and (51-250) in comparison with the others. We cansuggest that there is opposite dependence between the size group and the indexesfor firm performance.


