Embed Size (px)
Citation preview
PAPER NO. SHC 32/2016
Memorandum for the Subsidised Housing Committee of the Hong Kong Housing Authority
2016 Rent Review of Public Rental Housing
PURPOSE This paper seeks Members’ endorsement of the outcome of the 2016 rent review conducted under the rent adjustment mechanism for public rental housing (PRH) as stipulated in the Housing Ordinance (Cap. 283). BACKGROUND 2. Section 16A of the Housing Ordinance, which stipulates the rent adjustment mechanism for PRH, came into effect on 1 January 2008. Section 16A provides that the Housing Authority (HA) shall conduct a rent review every two years Note 1 and vary the PRH rent according to the change in the income index between the first and second periods covered by the review. Section 16A(4) provides that HA, “if satisfied on a review of the relevant rent that the income index for the second period is higher than the income index for the first period by more than 0.1%, shall as soon as practicable after the review increase the relevant rent by the rate of the increase of the income index or 10%, whichever is less”; and “if satisfied on a review of the relevant rent that the income index for the second period is lower than the income index for the first period by more than 0.1%, shall as soon as practicable after the review reduce the relevant rent by the rate of reduction of the income index”. 3. The mechanism provides an objective basis for HA to determine when PRH rent should be adjusted and by how much, taking into account tenants’ affordability. It also helps promote the long-term sustainability of the PRH programme. Background information on the rent adjustment mechanism, as well as the methodology for data collection and computation is at Annex A.
Note 1 Section 16A(1)(b) of the Housing Ordinance stipulates that HA “shall review the relevant rent as soon as practicable after the second anniversary of the expiry date of the second period for the last review”.
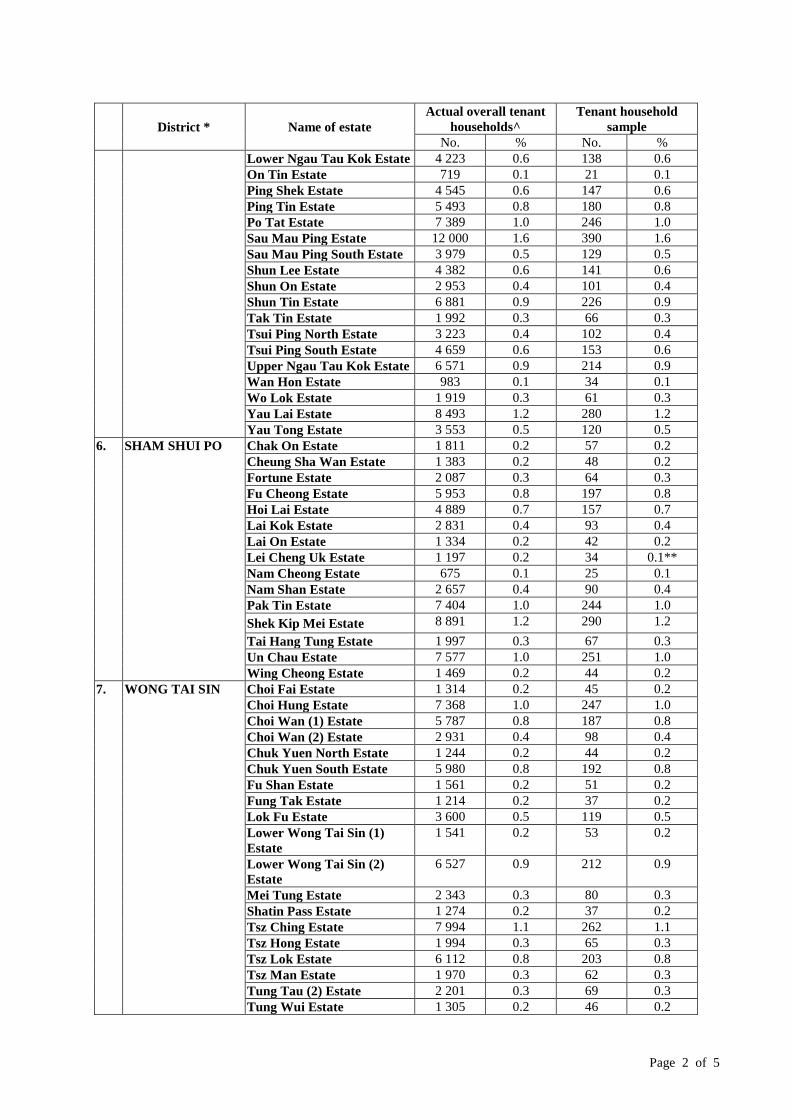
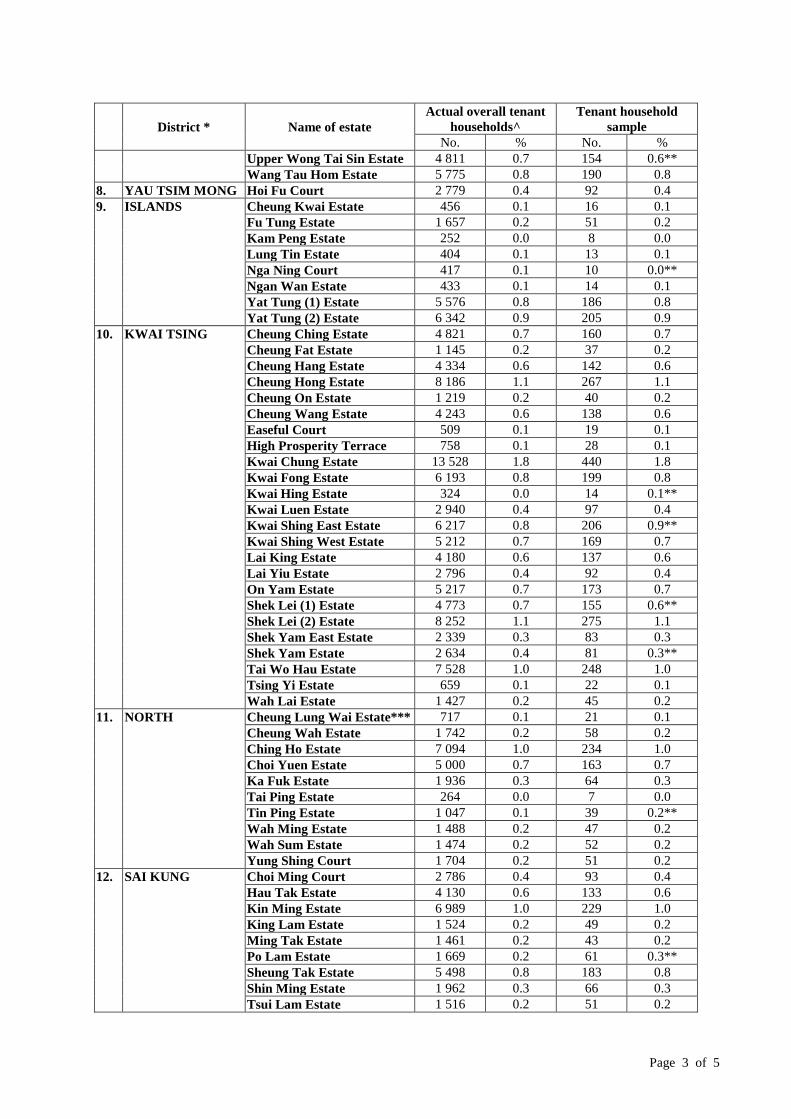
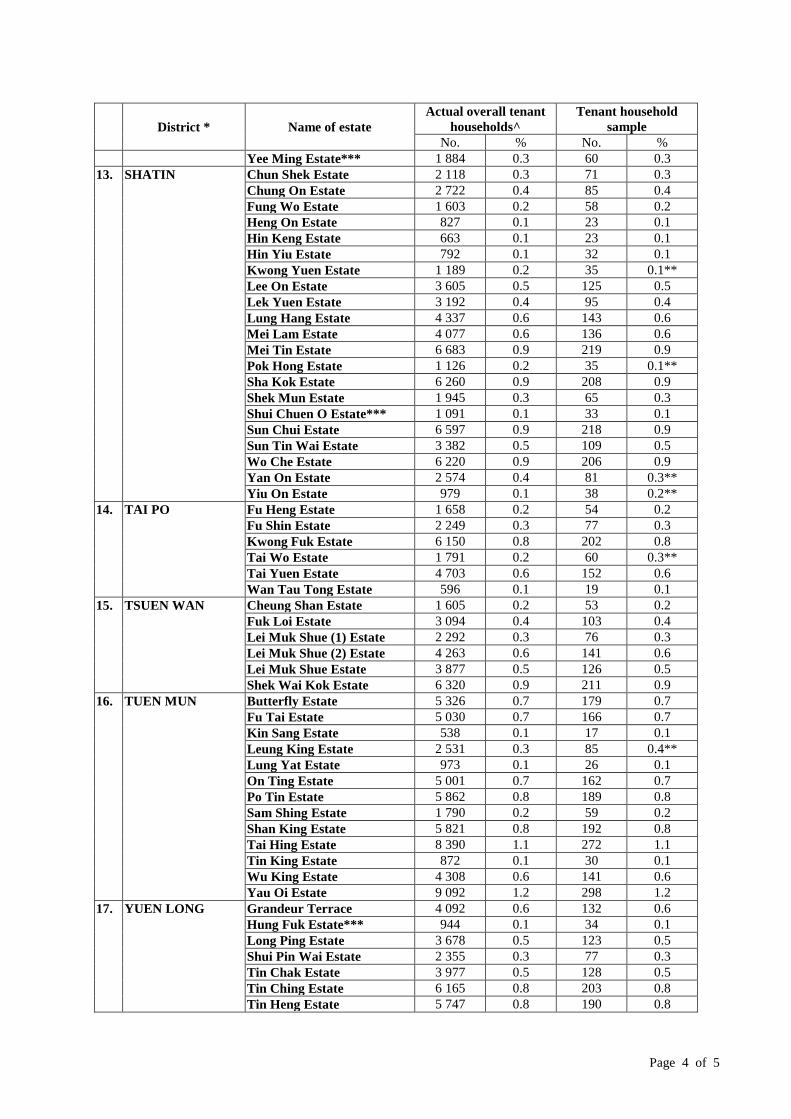
- 2 -
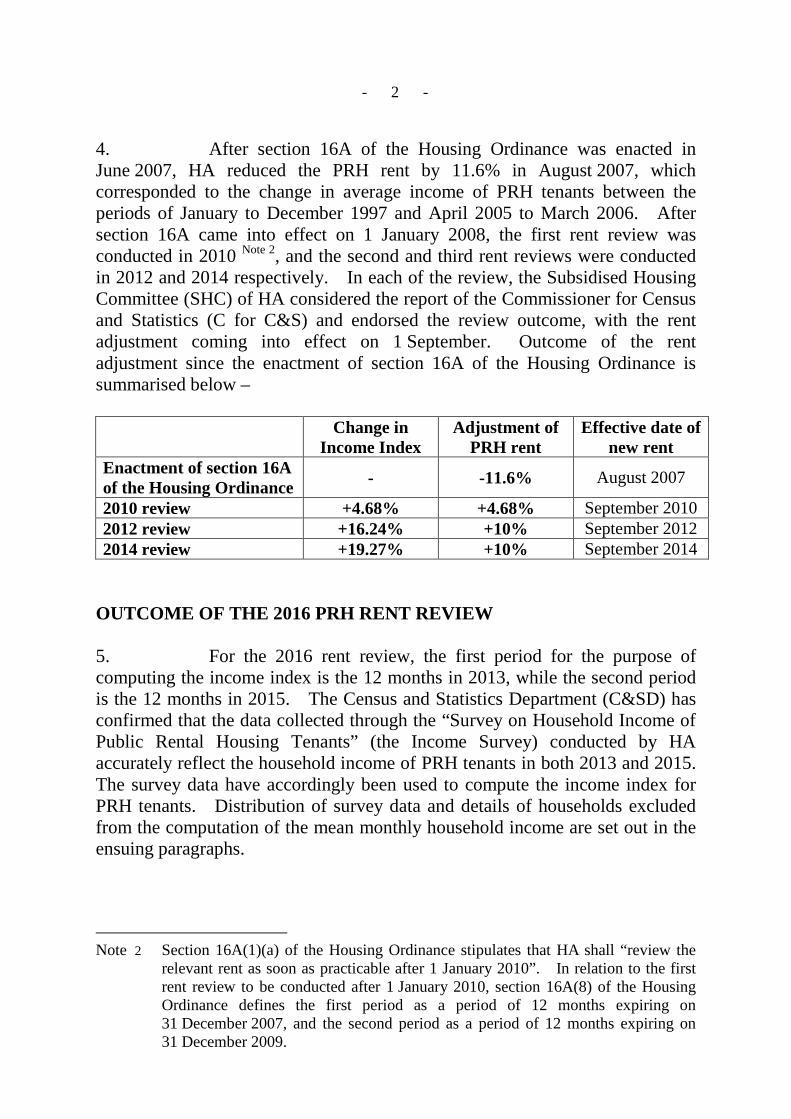
4. After section 16A of the Housing Ordinance was enacted in June 2007, HA reduced the PRH rent by 11.6% in August 2007, which corresponded to the change in average income of PRH tenants between the periods of January to December 1997 and April 2005 to March 2006. After section 16A came into effect on 1 January 2008, the first rent review was conducted in 2010 Note 2, and the second and third rent reviews were conducted in 2012 and 2014 respectively. In each of the review, the Subsidised Housing Committee (SHC) of HA considered the report of the Commissioner for Census and Statistics (C for C&S) and endorsed the review outcome, with the rent adjustment coming into effect on 1 September. Outcome of the rent adjustment since the enactment of section 16A of the Housing Ordinance is summarised below – Change in
Income Index Adjustment of
PRH rent Effective date of
new rent Enactment of section 16A of the Housing Ordinance - -11.6% August 2007
2010 review +4.68% +4.68% September 2010 2012 review +16.24% +10% September 2012 2014 review +19.27% +10% September 2014
OUTCOME OF THE 2016 PRH RENT REVIEW 5. For the 2016 rent review, the first period for the purpose of computing the income index is the 12 months in 2013, while the second period is the 12 months in 2015. The Census and Statistics Department (C&SD) has confirmed that the data collected through the “Survey on Household Income of Public Rental Housing Tenants” (the Income Survey) conducted by HA accurately reflect the household income of PRH tenants in both 2013 and 2015. The survey data have accordingly been used to compute the income index for PRH tenants. Distribution of survey data and details of households excluded from the computation of the mean monthly household income are set out in the ensuing paragraphs.
Note 2 Section 16A(1)(a) of the Housing Ordinance stipulates that HA shall “review the relevant rent as soon as practicable after 1 January 2010”. In relation to the first rent review to be conducted after 1 January 2010, section 16A(8) of the Housing Ordinance defines the first period as a period of 12 months expiring on 31 December 2007, and the second period as a period of 12 months expiring on 31 December 2009.
- 3 -
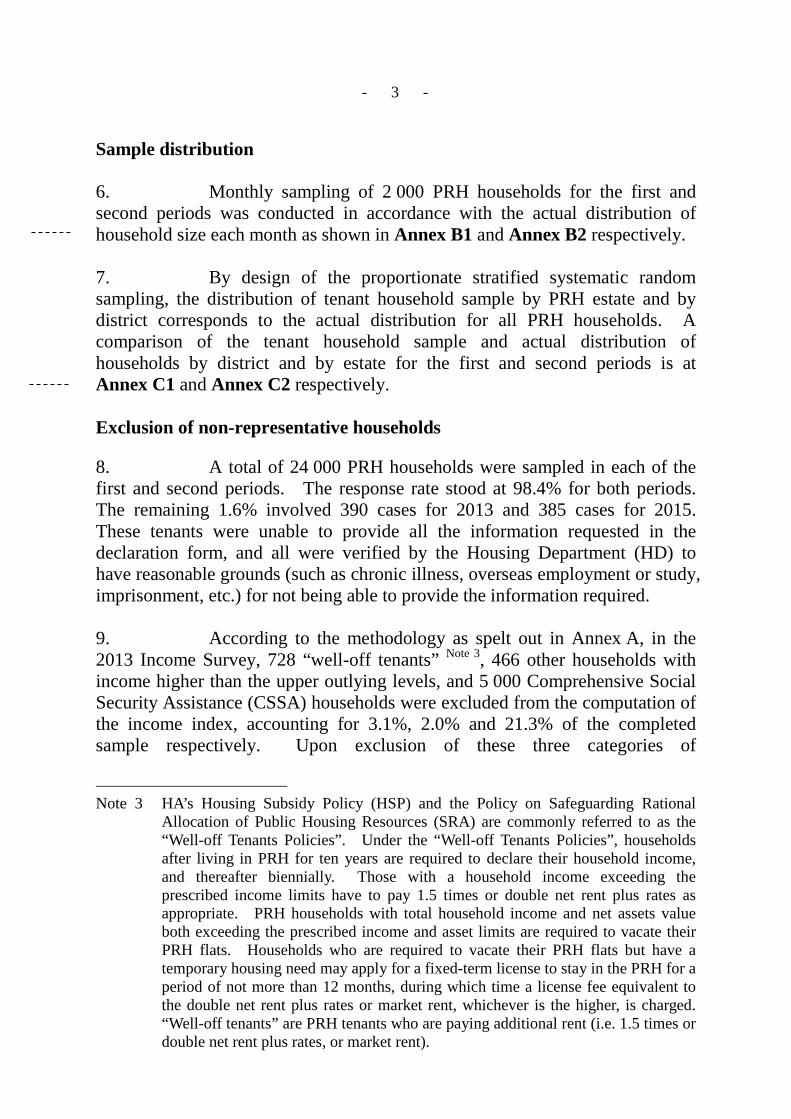
Sample distribution 6. Monthly sampling of 2 000 PRH households for the first and second periods was conducted in accordance with the actual distribution of household size each month as shown in Annex B1 and Annex B2 respectively. 7. By design of the proportionate stratified systematic random sampling, the distribution of tenant household sample by PRH estate and by district corresponds to the actual distribution for all PRH households. A comparison of the tenant household sample and actual distribution of households by district and by estate for the first and second periods is at Annex C1 and Annex C2 respectively. Exclusion of non-representative households 8. A total of 24 000 PRH households were sampled in each of the first and second periods. The response rate stood at 98.4% for both periods. The remaining 1.6% involved 390 cases for 2013 and 385 cases for 2015. These tenants were unable to provide all the information requested in the declaration form, and all were verified by the Housing Department (HD) to have reasonable grounds (such as chronic illness, overseas employment or study, imprisonment, etc.) for not being able to provide the information required. 9. According to the methodology as spelt out in Annex A, in the 2013 Income Survey, 728 “well-off tenants” Note 3, 466 other households with income higher than the upper outlying levels, and 5 000 Comprehensive Social Security Assistance (CSSA) households were excluded from the computation of the income index, accounting for 3.1%, 2.0% and 21.3% of the completed sample respectively. Upon exclusion of these three categories of
Note 3 HA’s Housing Subsidy Policy (HSP) and the Policy on Safeguarding Rational Allocation of Public Housing Resources (SRA) are commonly referred to as the “Well-off Tenants Policies”. Under the “Well-off Tenants Policies”, households after living in PRH for ten years are required to declare their household income, and thereafter biennially. Those with a household income exceeding the prescribed income limits have to pay 1.5 times or double net rent plus rates as appropriate. PRH households with total household income and net assets value both exceeding the prescribed income and asset limits are required to vacate their PRH flats. Households who are required to vacate their PRH flats but have a temporary housing need may apply for a fixed-term license to stay in the PRH for a period of not more than 12 months, during which time a license fee equivalent to the double net rent plus rates or market rent, whichever is the higher, is charged. “Well-off tenants” are PRH tenants who are paying additional rent (i.e. 1.5 times or double net rent plus rates, or market rent).
- 4 -
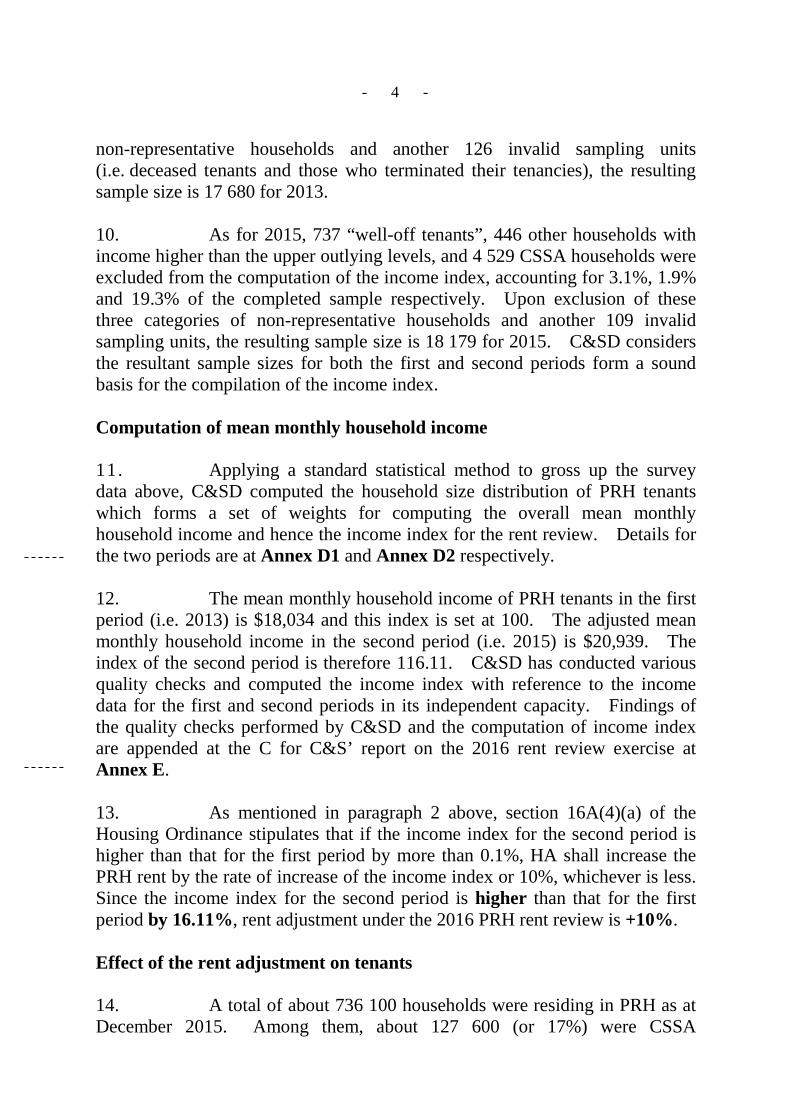
non-representative households and another 126 invalid sampling units (i.e. deceased tenants and those who terminated their tenancies), the resulting sample size is 17 680 for 2013. 10. As for 2015, 737 “well-off tenants”, 446 other households with income higher than the upper outlying levels, and 4 529 CSSA households were excluded from the computation of the income index, accounting for 3.1%, 1.9% and 19.3% of the completed sample respectively. Upon exclusion of these three categories of non-representative households and another 109 invalid sampling units, the resulting sample size is 18 179 for 2015. C&SD considers the resultant sample sizes for both the first and second periods form a sound basis for the compilation of the income index. Computation of mean monthly household income 11. Applying a standard statistical method to gross up the survey data above, C&SD computed the household size distribution of PRH tenants which forms a set of weights for computing the overall mean monthly household income and hence the income index for the rent review. Details for the two periods are at Annex D1 and Annex D2 respectively. 12. The mean monthly household income of PRH tenants in the first period (i.e. 2013) is $18,034 and this index is set at 100. The adjusted mean monthly household income in the second period (i.e. 2015) is $20,939. The index of the second period is therefore 116.11. C&SD has conducted various quality checks and computed the income index with reference to the income data for the first and second periods in its independent capacity. Findings of the quality checks performed by C&SD and the computation of income index are appended at the C for C&S’ report on the 2016 rent review exercise at Annex E. 13. As mentioned in paragraph 2 above, section 16A(4)(a) of the Housing Ordinance stipulates that if the income index for the second period is higher than that for the first period by more than 0.1%, HA shall increase the PRH rent by the rate of increase of the income index or 10%, whichever is less. Since the income index for the second period is higher than that for the first period by 16.11%, rent adjustment under the 2016 PRH rent review is +10%. Effect of the rent adjustment on tenants 14. A total of about 736 100 households were residing in PRH as at December 2015. Among them, about 127 600 (or 17%) were CSSA
- 5 -
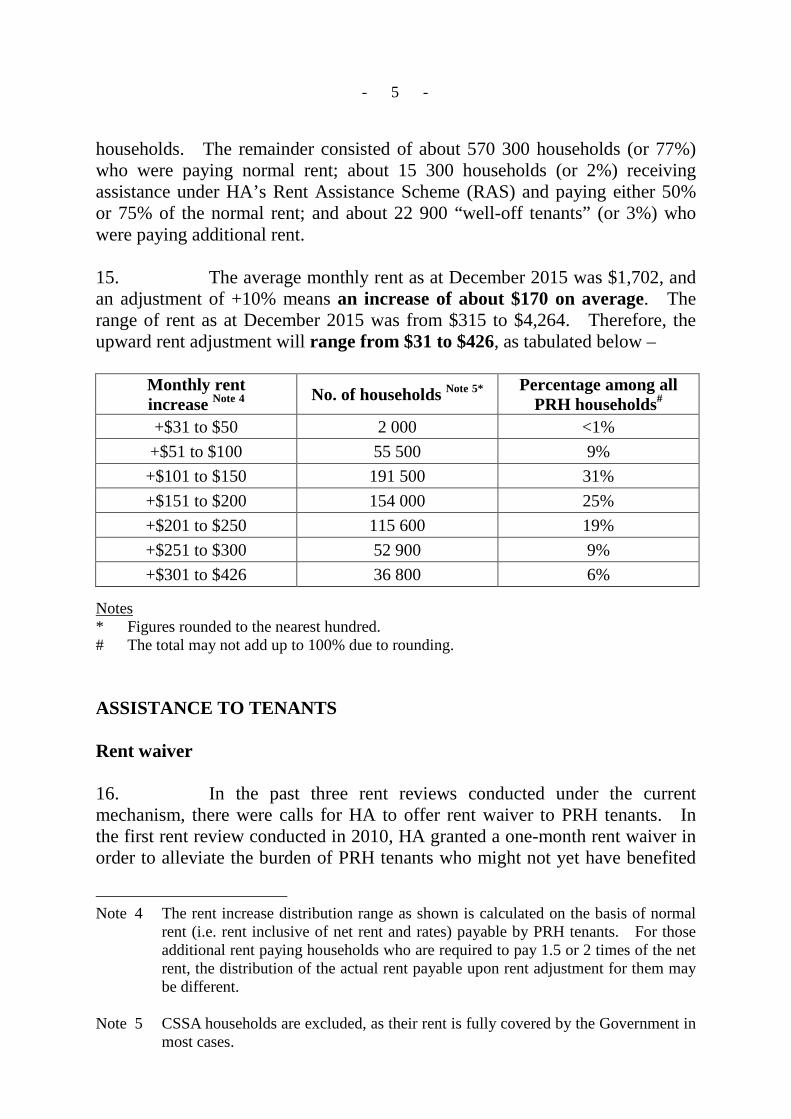
households. The remainder consisted of about 570 300 households (or 77%) who were paying normal rent; about 15 300 households (or 2%) receiving assistance under HA’s Rent Assistance Scheme (RAS) and paying either 50% or 75% of the normal rent; and about 22 900 “well-off tenants” (or 3%) who were paying additional rent. 15. The average monthly rent as at December 2015 was $1,702, and an adjustment of +10% means an increase of about $170 on average. The range of rent as at December 2015 was from $315 to $4,264. Therefore, the upward rent adjustment will range from $31 to $426, as tabulated below –
Monthly rent increase Note 4 No. of households Note 5* Percentage among all
PRH households#
+$31 to $50 2 000 <1% +$51 to $100 55 500 9%
+$101 to $150 191 500 31% +$151 to $200 154 000 25% +$201 to $250 115 600 19% +$251 to $300 52 900 9% +$301 to $426 36 800 6%
Notes * Figures rounded to the nearest hundred. # The total may not add up to 100% due to rounding. ASSISTANCE TO TENANTS Rent waiver
16. In the past three rent reviews conducted under the current mechanism, there were calls for HA to offer rent waiver to PRH tenants. In the first rent review conducted in 2010, HA granted a one-month rent waiver in order to alleviate the burden of PRH tenants who might not yet have benefited
Note 4 The rent increase distribution range as shown is calculated on the basis of normal rent (i.e. rent inclusive of net rent and rates) payable by PRH tenants. For those additional rent paying households who are required to pay 1.5 or 2 times of the net rent, the distribution of the actual rent payable upon rent adjustment for them may be different.
Note 5 CSSA households are excluded, as their rent is fully covered by the Government in
most cases.
- 6 -
from the economic recovery then. In the 2012 rent review, HA adopted a “sharing of burden approach” by granting a one-month rent waiver to share the financial burden of PRH tenants. In the 2014 rent review, however, having regard to the then prevailing economic situation and the growth in tenants’ income, HA did not grant any rent waiver. SHC considered that granting a rent waiver to all tenants irrespective of whether tenants are in need may not be the best use of HA’s revenue. It may also not be the most equitable, when there is a growing demand on HA’s resources from citizens who are waiting for their PRH units. Instead, SHC considered that there should be targeted assistance to those tenants who are in need. 17. For the current rent review, there are once again calls for rent waiver. In considering whether rent waiver should be offered to tenants, Members may find the following factors relevant –
(a) PRH tenants’ mean household income has increased in the past two years from $18,034 to $20,939 (i.e. an increase of $2,905, or an increase of 16.11%), as compared to the rent increase of $170 on average;
(b) as a result of the design of the rent adjustment mechanism, over
the years tenants’ household income has increased more than the increase in rent. Specifically, to provide a starting point for the rent adjustment mechanism to operate effectively, HA reduced the PRH rent by 11.6% in August 2007. From 2007 to 2009, the increase in household income was 4.68% and PRH rent was increased by the same rate. The increase in household income from 2009 to 2011 Note 6 was 16.24% while the increase in household income from 2011 to 2013 Note 7 was 19.27%. However, rent was only raised by 10% on both occasions. From 2013 to 2015, the household income has increased by 16.11%, but again, the rent will only increase by 10%;
(c) cumulatively, the income of PRH households has increased
by 68.5% Note 8 from 2007 (the first period of the first rent
Note 6 The change in income index was covered in the 2012 rent review. Note 7 The change in income index was covered in the 2014 rent review. Note 8 This figure is obtained by comparing the income index of 2007 (set at 100) and the
income index of 2015. In accordance with the methodology of the current rent adjustment mechanism, the household distribution of 2007 was used in computing the income index of 2015.
- 7 -
review conducted under the current mechanism) to 2015 (the second period of the current 2016 rent review). However, by adopting a 10% rent increase pursuant to the outcome of the current rent review, PRH rent will have only increased cumulatively by 39.3% over all four rent reviews conducted under the current rent adjustment mechanism. In other words, income increase has far exceeded rent increase;
(d) as a crude comparison, the ratio of the average PRH rent to
the average PRH household income in 2007 was 9.97%, and has gradually decreased to 9.10%9 after the rent increase in accordance with the 2016 review. Although these figures are not the actual rent-to-income ratios, they do provide an indicative reference to the affordability of PRH tenants Note 10. Overall, PRH tenants have been using a decreasing proportion of their income to pay rent;
(e) as at end-December 2015, 3% of PRH tenants are “well-off
tenants” and should be able to afford the rent increase. Another 17% are CSSA recipients, whose rent is fully covered by the Government in most cases;
Note 9 The calculation is as follows –
2007 2015 Average PRH rent $1,319
(the first period of the 2010 rent review, i.e. the first rent review under the current mechanism)
$1,702 × (1 + 10%) = $1,872
(after the +10% rent adjustment
under the 2016 rent review) Average PRH household income
$13,233 (calculated using the actual household distribution in
2007)
$20,566 (calculated using the actual household distribution in
2015) Average rent / Average household income $1,319 / $13,233 = 9.97% $1,872 / $20,566 = 9.10%
Note 10 This is only a crude comparison, as the coverage of “average PRH rent” and the
“average PRH household income” is different. The “average PRH rent” is the average rent of a PRH unit under HA. It is flat-based and does not exclude non-representative households as in the calculation of average household income in a PRH rent review. On the other hand, the “average PRH household income” is tenant-based with unrepresentative households excluded.

- 8 -
(f) the financial implications of a rent waiver are substantial. We have worked out the following based on the budget approved by HA in January 2016 –
2016-17 2019-20
1. Rental housing operating deficit (a) in the January 2016 budget $1.5 billion $3.7 billion (b) after 10% rent increase $0.6 billion $2.0 billion (c) plus 1 month waiver (if offered) $2.0 billion $2.0
billion Note 11 2. Monthly operating deficit per PRH unit
(a) in the January 2016 budget $158 $377 (b) after 10% rent increase $59 $207 (c) plus 1 month waiver (if offered) $214 $207 Note 11
In other words, based on this budget, the deficit of the rental
housing operating account is expected to increase from about $1.5 billion in 2016-17 to about $3.7 billion in 2019-20. The monthly operating deficit for each PRH unit based on the approved budget is expected to widen from about $158 in 2016-17 to about $377 in 2019-20. With a 10% increase in PRH rent in September 2016 in accordance with the rent review results as explained above, the deficit of the rental housing operating account is expected to narrow to about $0.6 billion in 2016-17 and to about $2.0 billion in 2019-20 respectively. If HA were to provide a one-month rent waiver while adjusting the rent upward by 10% in September 2016, we estimate that the deficit of the rental housing 2016-17 operating account will increase to about $2.0 billion, with the average monthly operating deficit for each PRH unit in 2016-17 rising from about $158 to about $214. This is because one-month’s rent will amount to about $1.4 billion, while the extra rent received by HA in 2016-17 due to the 10% upward rent adjustment in September 2016 will only be around $0.9 billion; and
(g) section 4(4) of the Housing Ordinance stipulates that “[t]he
policy of the HA shall be directed to ensuring that the revenue accruing to it from its estates shall be sufficient to meet its recurrent expenditure on its estates.”. As endorsed by SHC at
Note 11 Since the rent waiver, if implemented, is a one-off measure in 2016-17, it has no effect on the rental housing operating account in 2017-18 and afterwards.
- 9 -
the 2014 rent review, granting a rent waiver to all tenants irrespective of whether tenants are in need may not be the best use of HA’s revenue.
18. Irrespective of any rent waiver, tenants with genuine financial difficulties currently can have access to other forms of assistance offered by both HA and the Government. Details are in the ensuing paragraphs. Rent Assistance Scheme
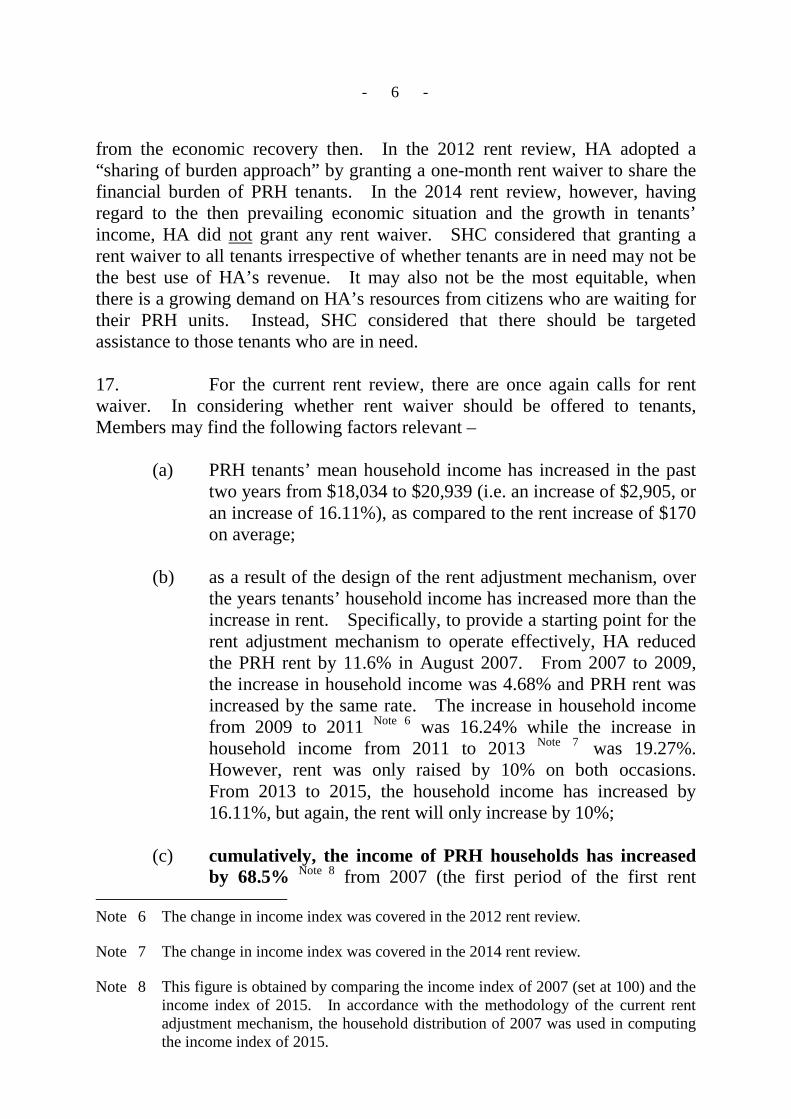
19. As far as targeted relief measures are concerned, HA operates the Rent Assistance Scheme (RAS) to help PRH tenants with temporary financial difficulties pay their rent. Depending on the level of their income, eligible applicants will be granted either 25% or 50% rent reduction. During the 2014 rent review, HA reviewed the operation of RAS and enhanced the scheme’s publicity and application process. As a result of the enhancements which took effect in August 2014, the number of RAS beneficiaries increased by 24%, from about 12 300 as at July 2014 to about 15 300 as at December 2015, accounting for about 2% of all PRH households. Details of the RAS and the enhancements are at Annex F. 20. In keeping with the direction laid down by SHC in 2014, we will continue to review the operation of RAS and consider measures to further enhance the Scheme. Government’s initiatives and measures 21. PRH households also benefit from Government’s initiatives and can apply for various Government’s schemes which assist low-income families. Tenants with recurrent financial difficulties can apply for the CSSA. Currently around 17% of our tenants are CSSA recipients. Apart from such established government programme, additional new initiatives include –
(a) as one of the relief measures announced in the 2016-17 Budget, the Government will waive rates for all four quarters of 2016-17, subject to a ceiling of $1,000 per quarter for each rateable property. HA will pass on all the rates concession to PRH tenants, which is estimated to be $2,098 million in total. The rates waived for the four quarters will on average amount to about 1.5 times of the existing monthly rent (i.e. before rent

- 10 -
adjustment) Note 12 paid by PRH tenants; and
(b) the Low-income Working Family Allowance (LIFA) Scheme seeks to encourage self-reliance and ease inter-generational poverty. Under the LIFA Scheme, a family of two or more members meeting the income and asset limits may apply for a half-rate or full-rate Basic Allowance or Higher Allowance (ranging from $300 to $1,000 per month) if the applicant meets the working hour requirements. For each eligible child in the family, he/she may also be eligible for a half-rate or full-rate Child Allowance ($400 or $800 per month). LIFA is open for first-round applications in three phases from May to July 2016.
IMPLEMENTATION AND PUBLICITY 22. Section 16A(4) of the Housing Ordinance stipulates that HA shall adjust PRH rent as soon as practicable after the rent review, whereas section 16A(5)(b) provides that HA shall not vary the relevant rent before the second anniversary of the date of the last variation. In the three previous rent reviews under the current mechanism, the new rent came into effect on 1 September. Therefore, the rent adjustment in accordance with the outcome of the 2016 rent review exercise should take effect from 1 September 2016. 23. Subject to SHC’s endorsement of the outcome of the current rent review, we will issue a press release to set out SHC’s decision on the level of rent adjustment. In accordance with past practice, PRH tenants will also be notified one month in advance of their new rent levels. 24. This paper is copied to members of HA and the Finance Committee concurrently for information.
Note 12 The monthly rates waived for the flat occupied as a percentage of monthly rent payable for each tenant (excluding those who are not paying normal rent, such as well-off tenants, tenants under RAS, etc.) is compiled. Taking the average of this percentage among the relevant tenants concerned (i.e. 12.5%) and multiplying it by 12 (months), it is estimated that the rates concession for a 12-month period is roughly equivalent to a reduction in rent for 1.5 months.

- 11 -
DISCUSSION 25. At the SHC meeting to be held on 8 July 2016, Members will be requested to approve the outcome of the 2016 rent review in accordance with section 16A(4) of the Housing Ordinance (paragraph 13 above). Mr Lennon WONG Secretary, Subsidised Housing Committee Tel. No.: 2761 5033 Fax No.: 2761 0019 File Ref. : HD (CR) 4-4/SP/10-10/0-3 (Strategy Division) Date of Issue : 27 June 2016
Annex A
Background and methodology of the Rent Adjustment Mechanism
A. Background leading to the establishment of the current rent
adjustment mechanism It has been a long-established policy for HA to set the PRH rent at affordable levels. At the same time, under section 4(4) of the Housing Ordinance, the policy of HA shall be directed to ensuring that the revenue accruing to it from its estates shall be sufficient to meet its recurrent expenditure on its estates. 2. Prior to 1998, HA used to review and adjust the rent of PRH units in batches biennially. Each batch comprised different number of units in different locations. In determining whether, and if so the extent to which, PRH rent should be adjusted, HA would take into account a number of factors, including tenants’ affordability, consumer price movements, Government rates, wage movement, comparative estate values, running costs of the estates under review, HA’s financial conditions, etc. In 1997, the Housing Ordinance was amended by way of a Private Members’ Bill. The amended Ordinance came into effect in March 1998. The then section 16(1A) of the Housing Ordinance imposed, inter alia, the requirement of the median rent-to-income ratio (MRIR) of all estates not exceeding 10% after any rent variation. The requirement did not provide an objective basis for HA to consider any rent adjustment, since increases in MRIR could be brought about by extraneous factors other than changes in PRH tenants’ household income, such as an increase in the proportion of small households, elderly households or CSSA households, and improvement in the PRH allocation standard. There was thus a need to establish an objective and sustainable mechanism to form the basis for rent adjustments. 3. HA set up an Ad Hoc Committee in January 2001 to review its domestic rent policy. The objective of the review is to map out a rent policy that is affordable and flexible, provides greater choice to tenants, and contributes to the long-term sustainability of the public housing programme. In November 2006, HA approved the Report on the Review of Domestic Rent Policy, which recommended the formulation of the income-based rent adjustment mechanism to replace the previous statutory 10% MRIR cap. B. The current mechanism 4. The Housing (Amendment) Bill 2007 (the Amendment Bill) introduced the current mechanism to provide for upward or downward adjustment of PRH rent according to the changes in the household income of
- 2 -
PRH tenants. The Amendment Bill was passed by the Legislative Council in June 2007 and came into operation on 1 January 2008. To provide a starting point for the rent adjustment mechanism to operate effectively, HA reduced the PRH rent by 11.6% from August 2007 Note 1. 5. Under the current PRH rent adjustment mechanism, HA shall conduct a rent review every two years and vary the PRH rent according to the change in the income index between the first and second periods covered by the review. As stipulated in section 16A(4) of the Housing Ordinance, if the income index for the second period is higher than that for the first period by more than 0.1%, HA shall increase the PRH rent by the rate of increase of the income index or 10%, whichever is less. If the income index for the second period is lower than that for the first period by more than 0.1%, HA shall reduce the PRH rent by the rate of reduction of the income index. 6. Rent adjustments are made with reference to the change in the income index between the first and second periods of the rent review cycle. In accordance with section 16A(8) of the Housing Ordinance, for the 2016 rent review, the first period is the period of 12 months expiring on 31 December 2013, and the second period is the period of 12 months expiring on 31 December 2015. Under section 16A(7)(a), an income index for the first period reflects the level of the mean monthly household income of tenants over the first period and an income index for the second period reflects the level of the adjusted mean monthly household income of tenants over the second period. As stipulated in Section 16A(8), “adjusted mean monthly household income” means the mean monthly income of tenants assessed on the basis of the distribution of the household size of those tenants over the first period. 7. Section 16A(7)(b) of the Housing Ordinance specifies that C for C&S shall, in relation to the compilation of the income index, compute the index. This includes the computation of the change in the income index between the first and second periods.
Note 1 In 2006, the HA Ad Hoc Committee on Review of Domestic Rent Policy considered that for the income-based rent adjustment mechanism to operate effectively and fairly, the then PRH rent should be adjusted to a level considered appropriate and acceptable to the community. Since the level of PRH rent had remained unchanged from 1997 to 2006, a comparison of the income index of PRH tenants in the two periods of January - December 1997 and April 2005 - March 2006 was made, and the corresponding decrease in income of 11.6% was adopted as the basis for the rent reduction.
- 3 -
C. Data collection and computation 8. Compilation of the income index involves data collection and data computation. The income data of PRH households collected through the Income Survey is used as the basis for compiling the income index. 9. To collect the income data, a sample of 2 000 PRH households is randomly selected by HA each month and each sampled household receives a notification letter together with an income declaration form. The income declaration forms are served under section 25(1) of the Housing Ordinance and declaration is mandatory. The declarable income includes remuneration from employment and self-employment, and other income (for example, interest and dividends). All sampled households are required by law to complete the forms. However, to mitigate the burden caused to the sampled households, no household is selected more than once within a period of 12 months. 10. For each sampled household, every family member listed in the tenancy records shall, in compliance with the relevant stipulations of the Ordinance, declare truthfully their monthly income. Explanatory notes are provided in the income declaration form to facilitate their provision of income data. The sampled households shall return the duly completed income declaration forms within the time specified. Information provided by tenants is treated in strict confidence and is solely used for compiling the income index. Households who knowingly make false statements of their particulars required in the income declaration forms, or refuse or fail to return the forms by the specified time, shall be guilty of an offence and will be liable to prosecution. 11. The compilation of the income index serves to assess the “pure income change” in the household income of PRH tenants during the rent review cycle with a view to determining the extent of rent adjustment. To do this, the household size distribution of PRH tenants in the rent review cycle should remain unchanged, so that the impact on household income due to variations of household size distribution could be eliminated in computing the income index. The role of HA 12. HA collects the income data from the sampled households. The sampling method and the data collection process were devised in consultation with C&SD to ensure the representativeness and accuracy of the Income Survey.
- 4 -
13. As far as sampling is concerned, a probability-based sampling method is adopted to randomly select 2 000 PRH tenants each month to participate in the Income Survey. PRH tenants are first categorised into five household size categories (i.e. five strata): 1-person households, 2-person households, 3-person households, 4-person households and households of 5 persons or above. Households are then drawn from each category according to the actual household size distribution of PRH tenants in a particular month. 2 000 households were sampled according to the actual household size distribution month by month. This method is known as proportionate stratified systematic random sampling. It provides more precise estimates than the simple random sampling. 14. In the course of data collection and processing, HA has adopted the following measures to safeguard the quality of data collected in the Income Survey –
(a) HA responds to tenants’ enquiries regarding any problems they encounter when completing the income declaration forms so as to minimise errors and omissions. Home visits are also conducted by HA staff upon request to assist physically challenged tenants and the elderly to complete the forms;
(b) HA has carried out preliminary vetting of all the returned income
declaration forms upon receipt from the sampled households. For those forms which were not duly completed or in need of further clarification, the households concerned were contacted by the staff of the HD, and may be asked to provide documentary proof of income and other related information for verification of the declared income data;
(c) HA has adopted a double data entry approach, i.e. the same set
of data is input into the computer by two staff members separately. The two sets of data are then compared and matched with each other for verification to avoid manual input errors; and
(d) HA has conducted computerised validation check on the input
data of the Income Survey. Any discrepancies identified were verified with the sampled households concerned before providing the dataset to C&SD for computing the income index.
- 5 -
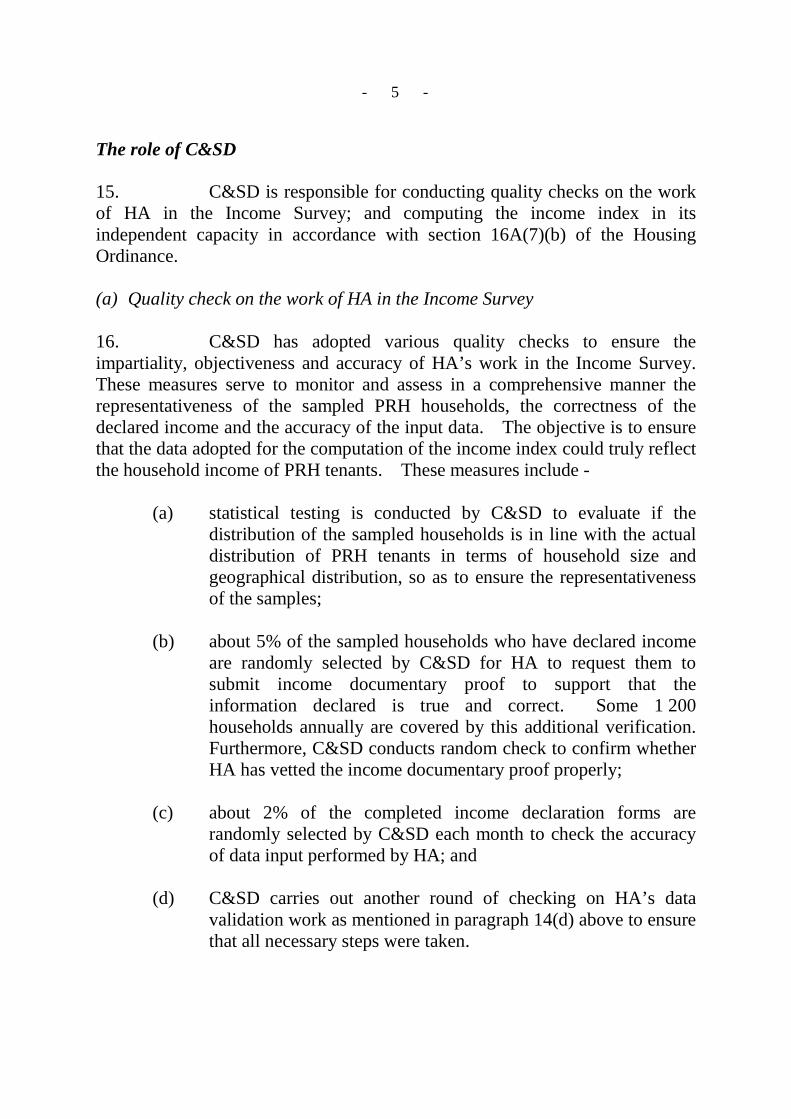
The role of C&SD 15. C&SD is responsible for conducting quality checks on the work of HA in the Income Survey; and computing the income index in its independent capacity in accordance with section 16A(7)(b) of the Housing Ordinance. (a) Quality check on the work of HA in the Income Survey 16. C&SD has adopted various quality checks to ensure the impartiality, objectiveness and accuracy of HA’s work in the Income Survey. These measures serve to monitor and assess in a comprehensive manner the representativeness of the sampled PRH households, the correctness of the declared income and the accuracy of the input data. The objective is to ensure that the data adopted for the computation of the income index could truly reflect the household income of PRH tenants. These measures include -
(a) statistical testing is conducted by C&SD to evaluate if the distribution of the sampled households is in line with the actual distribution of PRH tenants in terms of household size and geographical distribution, so as to ensure the representativeness of the samples;
(b) about 5% of the sampled households who have declared income
are randomly selected by C&SD for HA to request them to submit income documentary proof to support that the information declared is true and correct. Some 1 200 households annually are covered by this additional verification. Furthermore, C&SD conducts random check to confirm whether HA has vetted the income documentary proof properly;
(c) about 2% of the completed income declaration forms are
randomly selected by C&SD each month to check the accuracy of data input performed by HA; and
(d) C&SD carries out another round of checking on HA’s data
validation work as mentioned in paragraph 14(d) above to ensure that all necessary steps were taken.
- 6 -
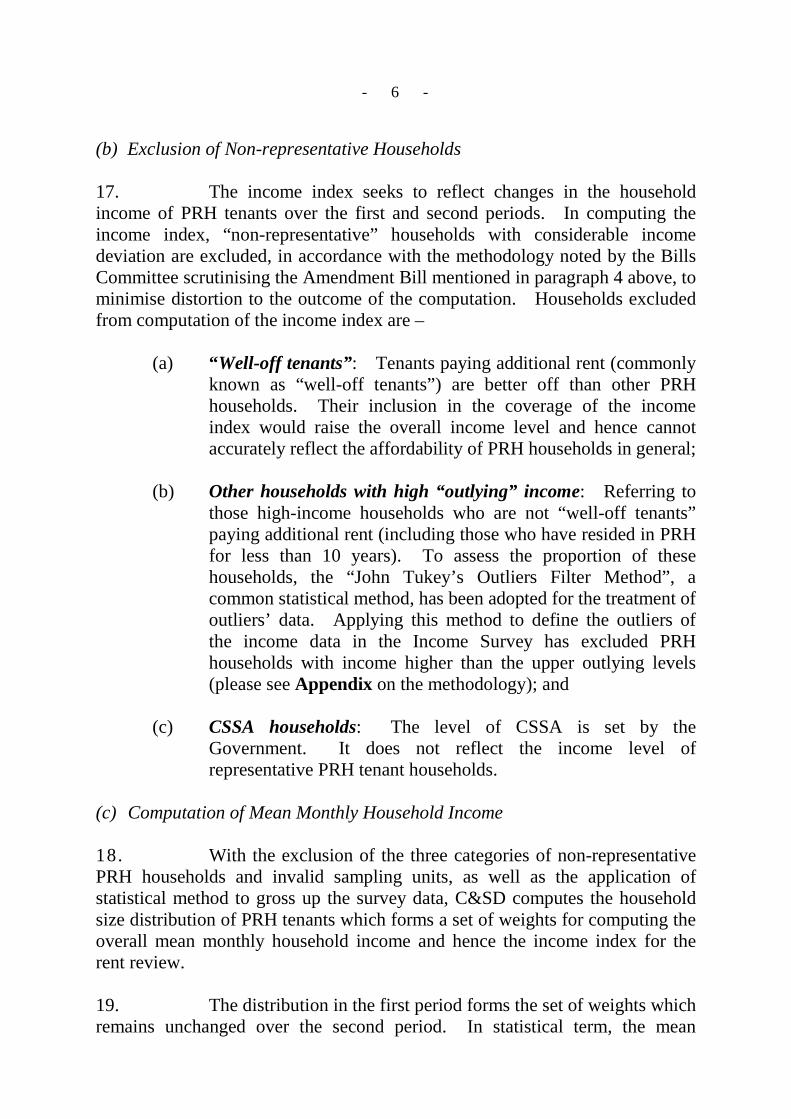
(b) Exclusion of Non-representative Households 17. The income index seeks to reflect changes in the household income of PRH tenants over the first and second periods. In computing the income index, “non-representative” households with considerable income deviation are excluded, in accordance with the methodology noted by the Bills Committee scrutinising the Amendment Bill mentioned in paragraph 4 above, to minimise distortion to the outcome of the computation. Households excluded from computation of the income index are –
(a) “Well-off tenants”: Tenants paying additional rent (commonly known as “well-off tenants”) are better off than other PRH households. Their inclusion in the coverage of the income index would raise the overall income level and hence cannot accurately reflect the affordability of PRH households in general;
(b) Other households with high “outlying” income: Referring to
those high-income households who are not “well-off tenants” paying additional rent (including those who have resided in PRH for less than 10 years). To assess the proportion of these households, the “John Tukey’s Outliers Filter Method”, a common statistical method, has been adopted for the treatment of outliers’ data. Applying this method to define the outliers of the income data in the Income Survey has excluded PRH households with income higher than the upper outlying levels (please see Appendix on the methodology); and
(c) CSSA households: The level of CSSA is set by the
Government. It does not reflect the income level of representative PRH tenant households.
(c) Computation of Mean Monthly Household Income 18. With the exclusion of the three categories of non-representative PRH households and invalid sampling units, as well as the application of statistical method to gross up the survey data, C&SD computes the household size distribution of PRH tenants which forms a set of weights for computing the overall mean monthly household income and hence the income index for the rent review. 19. The distribution in the first period forms the set of weights which remains unchanged over the second period. In statistical term, the mean
- 7 -
monthly household income of the second period is “adjusted” based on the household size distribution of the first period in order to discount the impact on household income due to variation in household size distribution in the rent review cycle.
Appendix to Annex A
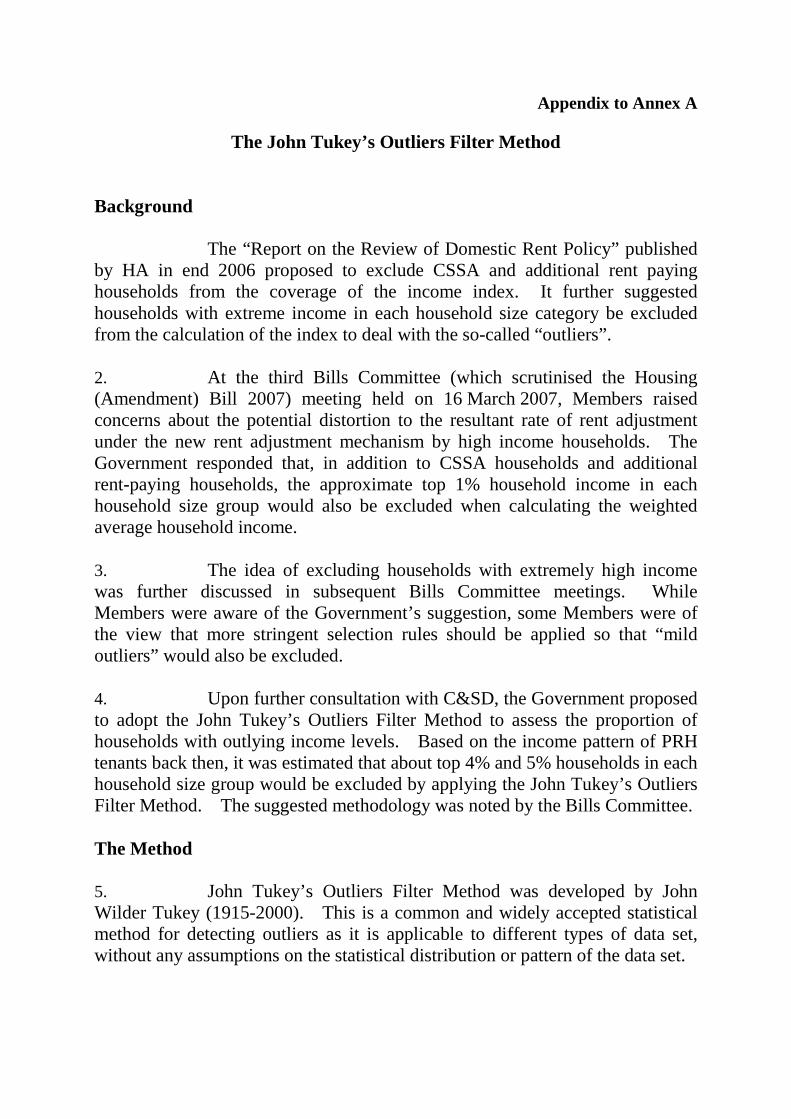
The John Tukey’s Outliers Filter Method Background
The “Report on the Review of Domestic Rent Policy” published by HA in end 2006 proposed to exclude CSSA and additional rent paying households from the coverage of the income index. It further suggested households with extreme income in each household size category be excluded from the calculation of the index to deal with the so-called “outliers”.
2. At the third Bills Committee (which scrutinised the Housing (Amendment) Bill 2007) meeting held on 16 March 2007, Members raised concerns about the potential distortion to the resultant rate of rent adjustment under the new rent adjustment mechanism by high income households. The Government responded that, in addition to CSSA households and additional rent-paying households, the approximate top 1% household income in each household size group would also be excluded when calculating the weighted average household income. 3. The idea of excluding households with extremely high income was further discussed in subsequent Bills Committee meetings. While Members were aware of the Government’s suggestion, some Members were of the view that more stringent selection rules should be applied so that “mild outliers” would also be excluded. 4. Upon further consultation with C&SD, the Government proposed to adopt the John Tukey’s Outliers Filter Method to assess the proportion of households with outlying income levels. Based on the income pattern of PRH tenants back then, it was estimated that about top 4% and 5% households in each household size group would be excluded by applying the John Tukey’s Outliers Filter Method. The suggested methodology was noted by the Bills Committee. The Method
5. John Tukey’s Outliers Filter Method was developed by John Wilder Tukey (1915-2000). This is a common and widely accepted statistical method for detecting outliers as it is applicable to different types of data set, without any assumptions on the statistical distribution or pattern of the data set.
- 2 -
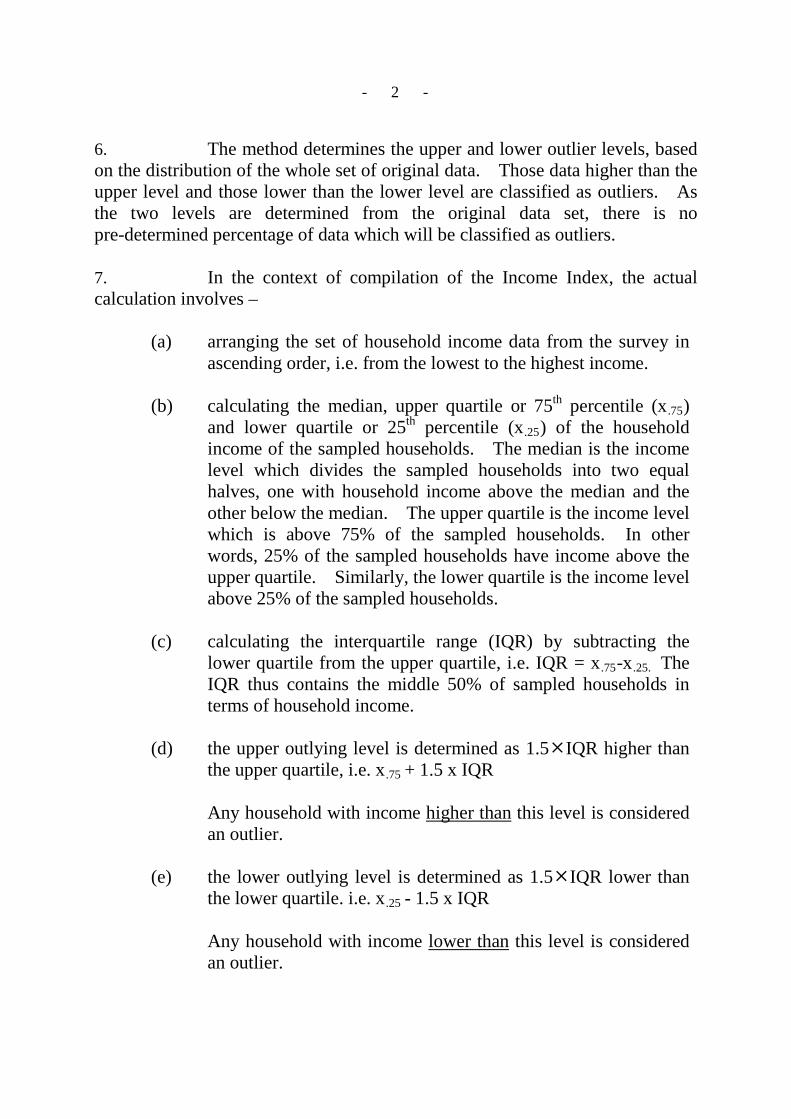
6. The method determines the upper and lower outlier levels, based on the distribution of the whole set of original data. Those data higher than the upper level and those lower than the lower level are classified as outliers. As the two levels are determined from the original data set, there is no pre-determined percentage of data which will be classified as outliers. 7. In the context of compilation of the Income Index, the actual calculation involves –
(a) arranging the set of household income data from the survey in ascending order, i.e. from the lowest to the highest income.
(b) calculating the median, upper quartile or 75th percentile (x.75)
and lower quartile or 25th percentile (x.25) of the household income of the sampled households. The median is the income level which divides the sampled households into two equal halves, one with household income above the median and the other below the median. The upper quartile is the income level which is above 75% of the sampled households. In other words, 25% of the sampled households have income above the upper quartile. Similarly, the lower quartile is the income level above 25% of the sampled households.
(c) calculating the interquartile range (IQR) by subtracting the
lower quartile from the upper quartile, i.e. IQR = x.75-x.25. The IQR thus contains the middle 50% of sampled households in terms of household income.
(d) the upper outlying level is determined as 1.5IQR higher than
the upper quartile, i.e. x.75 + 1.5 x IQR
Any household with income higher than this level is considered an outlier.
(e) the lower outlying level is determined as 1.5IQR lower than
the lower quartile. i.e. x.25 - 1.5 x IQR
Any household with income lower than this level is considered an outlier.
- 3 -
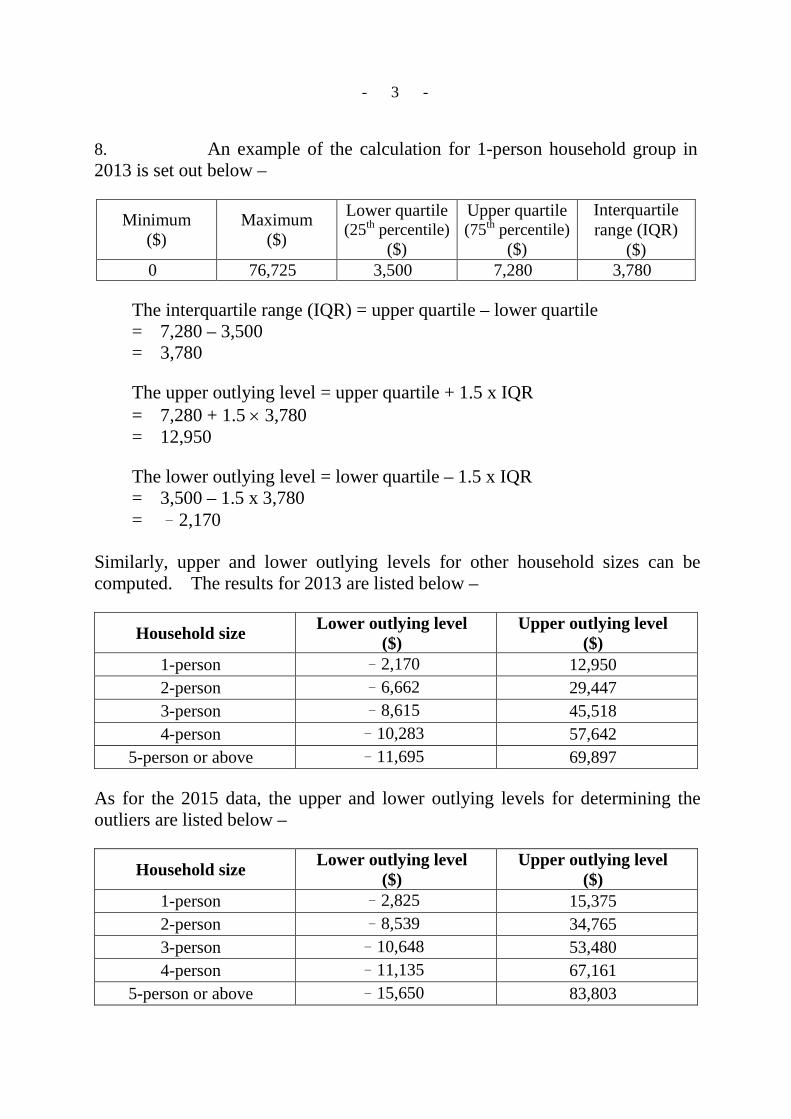
8. An example of the calculation for 1-person household group in 2013 is set out below –
Minimum ($)
Maximum ($)
Lower quartile (25th percentile)
($)
Upper quartile (75th percentile)
($)
Interquartile range (IQR)
($) 0 76,725 3,500 7,280 3,780
The interquartile range (IQR) = upper quartile – lower quartile = 7,280 – 3,500 = 3,780
The upper outlying level = upper quartile + 1.5 x IQR = 7,280 + 1.5 × 3,780 = 12,950
The lower outlying level = lower quartile – 1.5 x IQR = 3,500 – 1.5 x 3,780 = –2,170
Similarly, upper and lower outlying levels for other household sizes can be computed. The results for 2013 are listed below –
Household size Lower outlying level ($)
Upper outlying level ($)
1-person –2,170 12,950 2-person –6,662 29,447 3-person –8,615 45,518 4-person –10,283 57,642
5-person or above –11,695 69,897 As for the 2015 data, the upper and lower outlying levels for determining the outliers are listed below –
Household size Lower outlying level ($)
Upper outlying level ($)
1-person –2,825 15,375 2-person –8,539 34,765 3-person –10,648 53,480 4-person –11,135 67,161
5-person or above –15,650 83,803

- 4 -
Households with income exceeding the upper outlying level or less than the lower outlying level are considered as outliers. In reality, there is no household with negative income. Therefore, no household from the lower end of the actual income distribution is considered as outlier and excluded.
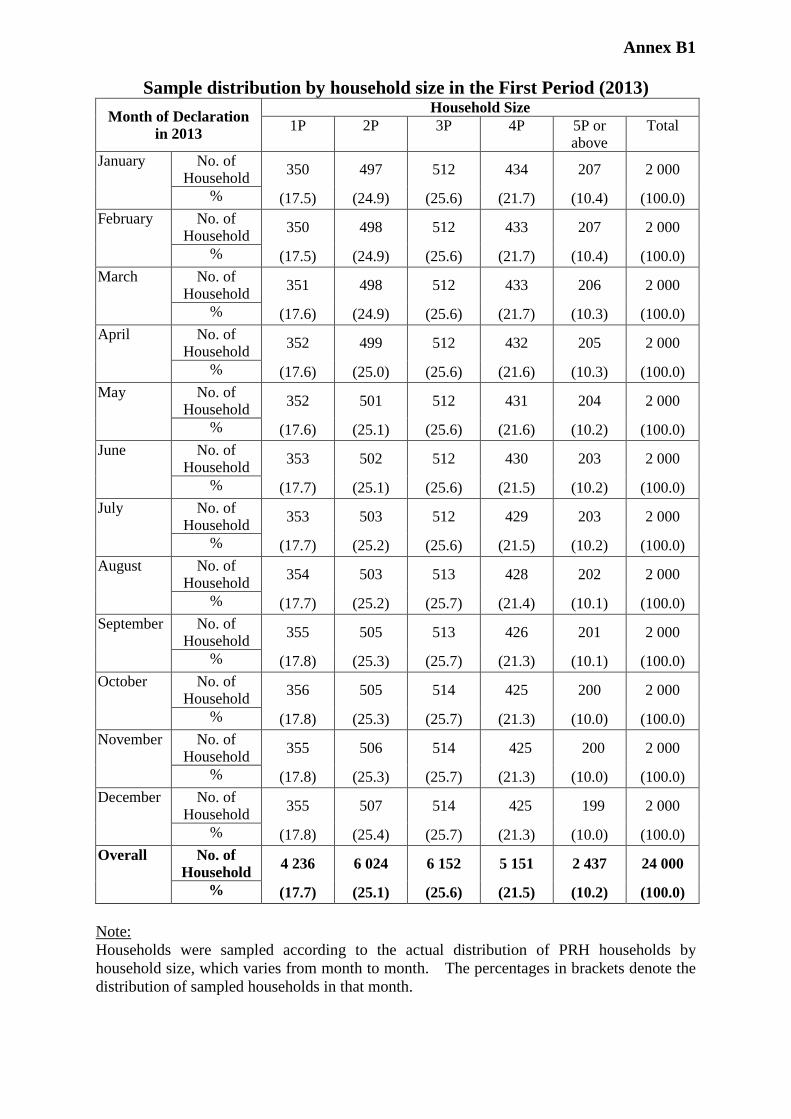
Annex B1
Sample distribution by household size in the First Period (2013) Month of Declaration
in 2013
Household Size 1P 2P 3P 4P 5P or
above Total
January No. of Household 350 497 512 434 207 2 000
% (17.5) (24.9) (25.6) (21.7) (10.4) (100.0) February No. of
Household 350 498 512 433 207 2 000
% (17.5) (24.9) (25.6) (21.7) (10.4) (100.0) March No. of
Household 351 498 512 433 206 2 000
% (17.6) (24.9) (25.6) (21.7) (10.3) (100.0) April No. of
Household 352 499 512 432 205 2 000
% (17.6) (25.0) (25.6) (21.6) (10.3) (100.0) May No. of
Household 352 501 512 431 204 2 000
% (17.6) (25.1) (25.6) (21.6) (10.2) (100.0) June No. of
Household 353 502 512 430 203 2 000
% (17.7) (25.1) (25.6) (21.5) (10.2) (100.0) July No. of
Household 353 503 512 429 203 2 000
% (17.7) (25.2) (25.6) (21.5) (10.2) (100.0) August No. of
Household 354 503 513 428 202 2 000
% (17.7) (25.2) (25.7) (21.4) (10.1) (100.0) September No. of
Household 355 505 513 426 201 2 000
% (17.8) (25.3) (25.7) (21.3) (10.1) (100.0) October No. of
Household 356 505 514 425 200 2 000
% (17.8) (25.3) (25.7) (21.3) (10.0) (100.0) November No. of
Household 355 506 514 425 200 2 000
% (17.8) (25.3) (25.7) (21.3) (10.0) (100.0) December No. of
Household 355 507 514 425 199 2 000
% (17.8) (25.4) (25.7) (21.3) (10.0) (100.0) Overall No. of
Household 4 236 6 024 6 152 5 151 2 437 24 000
% (17.7) (25.1) (25.6) (21.5) (10.2) (100.0) Note: Households were sampled according to the actual distribution of PRH households by household size, which varies from month to month. The percentages in brackets denote the distribution of sampled households in that month.
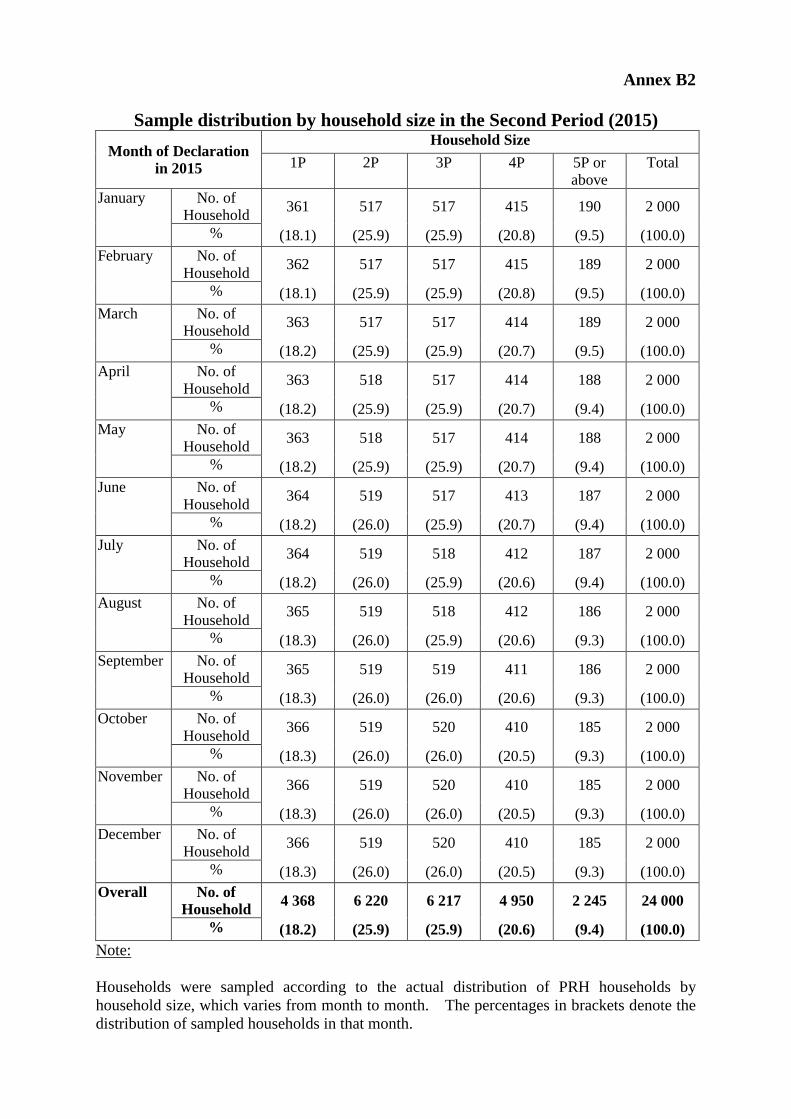
Annex B2
Sample distribution by household size in the Second Period (2015)
Month of Declaration in 2015
Household Size 1P 2P 3P 4P 5P or
above Total
January No. of Household 361 517 517 415 190 2 000
% (18.1) (25.9) (25.9) (20.8) (9.5) (100.0) February No. of
Household 362 517 517 415 189 2 000
% (18.1) (25.9) (25.9) (20.8) (9.5) (100.0) March No. of
Household 363 517 517 414 189 2 000
% (18.2) (25.9) (25.9) (20.7) (9.5) (100.0) April No. of
Household 363 518 517 414 188 2 000
% (18.2) (25.9) (25.9) (20.7) (9.4) (100.0) May No. of
Household 363 518 517 414 188 2 000
% (18.2) (25.9) (25.9) (20.7) (9.4) (100.0) June No. of
Household 364 519 517 413 187 2 000
% (18.2) (26.0) (25.9) (20.7) (9.4) (100.0) July No. of
Household 364 519 518 412 187 2 000
% (18.2) (26.0) (25.9) (20.6) (9.4) (100.0) August No. of
Household 365 519 518 412 186 2 000
% (18.3) (26.0) (25.9) (20.6) (9.3) (100.0) September No. of
Household 365 519 519 411 186 2 000
% (18.3) (26.0) (26.0) (20.6) (9.3) (100.0) October No. of
Household 366 519 520 410 185 2 000
% (18.3) (26.0) (26.0) (20.5) (9.3) (100.0) November No. of
Household 366 519 520 410 185 2 000
% (18.3) (26.0) (26.0) (20.5) (9.3) (100.0) December No. of
Household 366 519 520 410 185 2 000
% (18.3) (26.0) (26.0) (20.5) (9.3) (100.0) Overall No. of
Household 4 368 6 220 6 217 4 950 2 245 24 000
% (18.2) (25.9) (25.9) (20.6) (9.4) (100.0) Note: Households were sampled according to the actual distribution of PRH households by household size, which varies from month to month. The percentages in brackets denote the distribution of sampled households in that month.
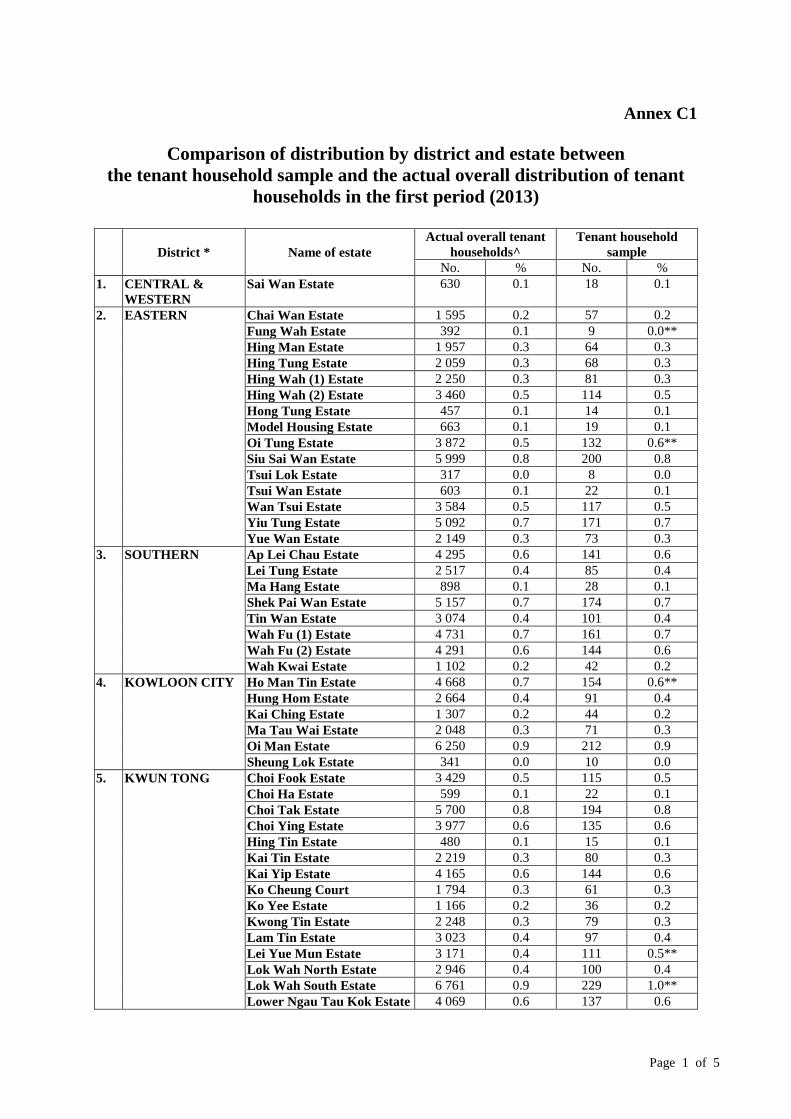
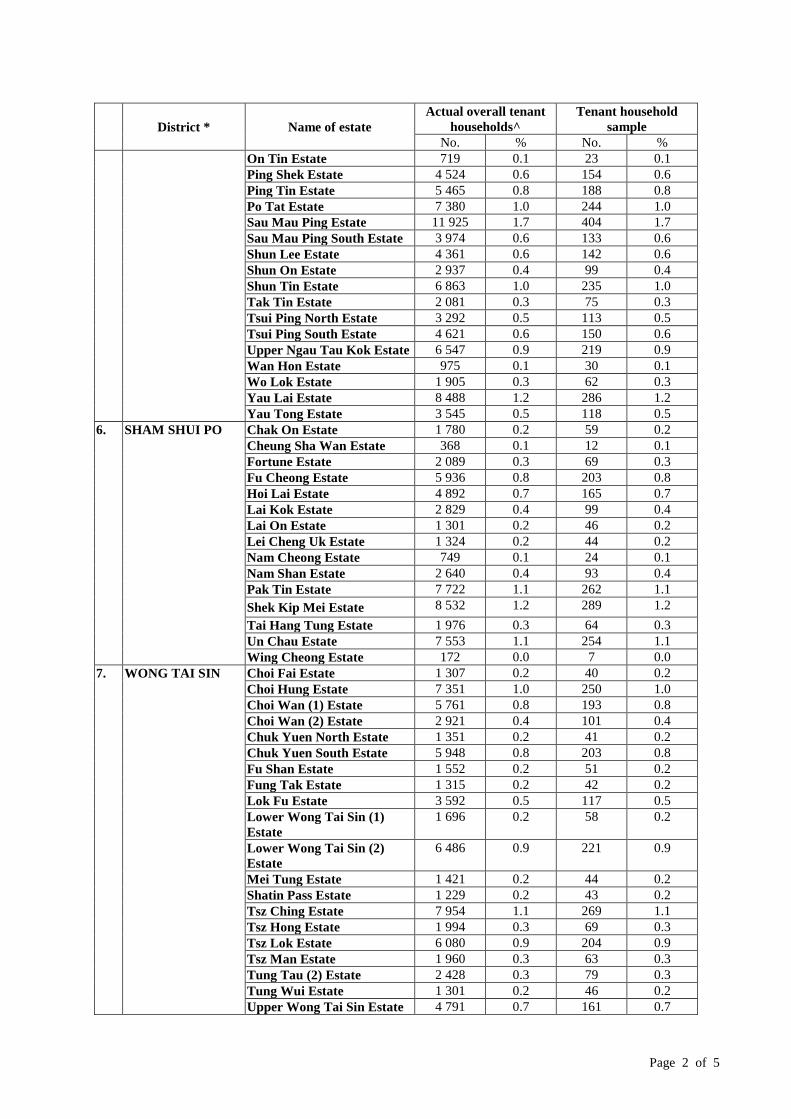
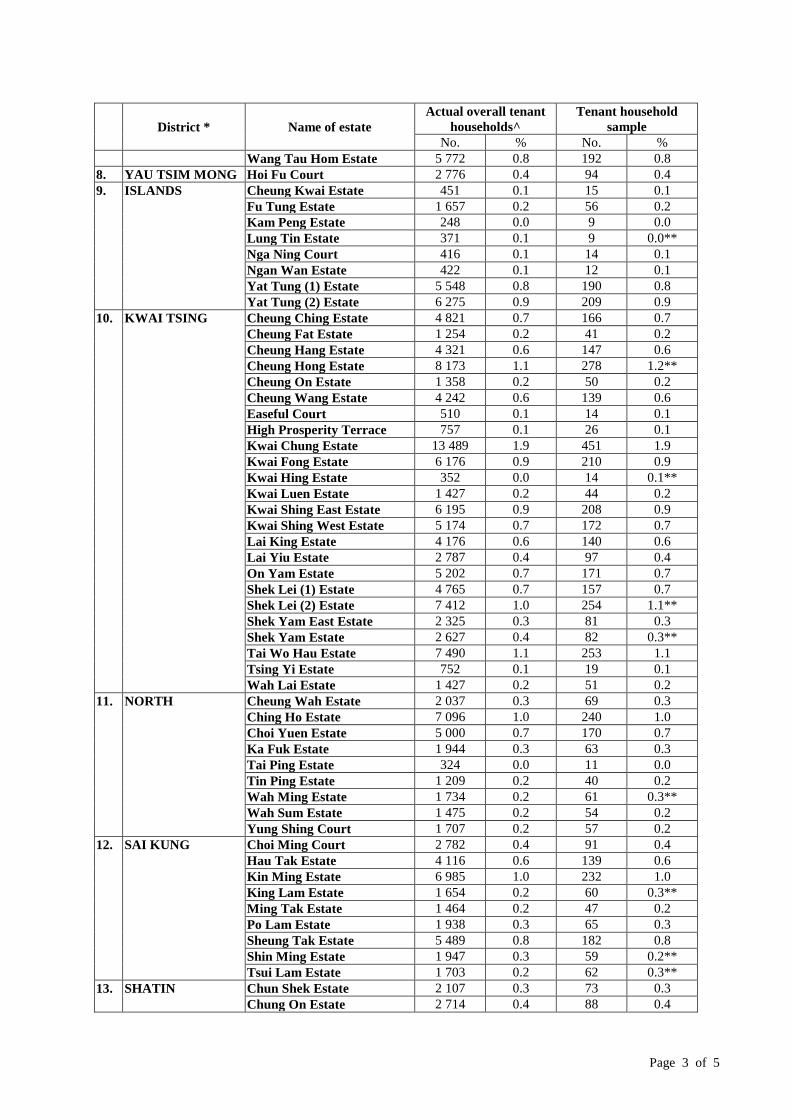
Annex C1
Comparison of distribution by district and estate between the tenant household sample and the actual overall distribution of tenant
households in the first period (2013)
District * Name of estate
Actual overall tenant households^
Tenant household sample
No. % No. % 1. CENTRAL &
WESTERN Sai Wan Estate 630 0.1 18 0.1
2. EASTERN Chai Wan Estate 1 595 0.2 57 0.2 Fung Wah Estate 392 0.1 9 0.0**
Hing Man Estate 1 957 0.3 64 0.3 Hing Tung Estate 2 059 0.3 68 0.3 Hing Wah (1) Estate 2 250 0.3 81 0.3 Hing Wah (2) Estate 3 460 0.5 114 0.5 Hong Tung Estate 457 0.1 14 0.1 Model Housing Estate 663 0.1 19 0.1 Oi Tung Estate 3 872 0.5 132 0.6** Siu Sai Wan Estate 5 999 0.8 200 0.8 Tsui Lok Estate 317 0.0 8 0.0 Tsui Wan Estate 603 0.1 22 0.1 Wan Tsui Estate 3 584 0.5 117 0.5 Yiu Tung Estate 5 092 0.7 171 0.7 Yue Wan Estate 2 149 0.3 73 0.3
3. SOUTHERN Ap Lei Chau Estate 4 295 0.6 141 0.6 Lei Tung Estate 2 517 0.4 85 0.4 Ma Hang Estate 898 0.1 28 0.1 Shek Pai Wan Estate 5 157 0.7 174 0.7 Tin Wan Estate 3 074 0.4 101 0.4 Wah Fu (1) Estate 4 731 0.7 161 0.7 Wah Fu (2) Estate 4 291 0.6 144 0.6 Wah Kwai Estate 1 102 0.2 42 0.2
4. KOWLOON CITY Ho Man Tin Estate 4 668 0.7 154 0.6** Hung Hom Estate 2 664 0.4 91 0.4 Kai Ching Estate 1 307 0.2 44 0.2 Ma Tau Wai Estate 2 048 0.3 71 0.3 Oi Man Estate 6 250 0.9 212 0.9 Sheung Lok Estate 341 0.0 10 0.0
5. KWUN TONG Choi Fook Estate 3 429 0.5 115 0.5 Choi Ha Estate 599 0.1 22 0.1 Choi Tak Estate 5 700 0.8 194 0.8 Choi Ying Estate 3 977 0.6 135 0.6 Hing Tin Estate 480 0.1 15 0.1 Kai Tin Estate 2 219 0.3 80 0.3 Kai Yip Estate 4 165 0.6 144 0.6 Ko Cheung Court 1 794 0.3 61 0.3 Ko Yee Estate 1 166 0.2 36 0.2 Kwong Tin Estate 2 248 0.3 79 0.3 Lam Tin Estate 3 023 0.4 97 0.4 Lei Yue Mun Estate 3 171 0.4 111 0.5** Lok Wah North Estate 2 946 0.4 100 0.4 Lok Wah South Estate 6 761 0.9 229 1.0** Lower Ngau Tau Kok Estate 4 069 0.6 137 0.6
Page 1 of 5
District * Name of estate
Actual overall tenant households^
Tenant household sample
No. % No. % On Tin Estate 719 0.1 23 0.1
Ping Shek Estate 4 524 0.6 154 0.6 Ping Tin Estate 5 465 0.8 188 0.8 Po Tat Estate 7 380 1.0 244 1.0 Sau Mau Ping Estate 11 925 1.7 404 1.7 Sau Mau Ping South Estate 3 974 0.6 133 0.6 Shun Lee Estate 4 361 0.6 142 0.6 Shun On Estate 2 937 0.4 99 0.4 Shun Tin Estate 6 863 1.0 235 1.0 Tak Tin Estate 2 081 0.3 75 0.3 Tsui Ping North Estate 3 292 0.5 113 0.5 Tsui Ping South Estate 4 621 0.6 150 0.6 Upper Ngau Tau Kok Estate 6 547 0.9 219 0.9 Wan Hon Estate 975 0.1 30 0.1 Wo Lok Estate 1 905 0.3 62 0.3 Yau Lai Estate 8 488 1.2 286 1.2 Yau Tong Estate 3 545 0.5 118 0.5
6. SHAM SHUI PO Chak On Estate 1 780 0.2 59 0.2 Cheung Sha Wan Estate 368 0.1 12 0.1 Fortune Estate 2 089 0.3 69 0.3 Fu Cheong Estate 5 936 0.8 203 0.8 Hoi Lai Estate 4 892 0.7 165 0.7 Lai Kok Estate 2 829 0.4 99 0.4 Lai On Estate 1 301 0.2 46 0.2 Lei Cheng Uk Estate 1 324 0.2 44 0.2 Nam Cheong Estate 749 0.1 24 0.1 Nam Shan Estate 2 640 0.4 93 0.4 Pak Tin Estate 7 722 1.1 262 1.1 Shek Kip Mei Estate 8 532 1.2 289 1.2 Tai Hang Tung Estate 1 976 0.3 64 0.3 Un Chau Estate 7 553 1.1 254 1.1 Wing Cheong Estate 172 0.0 7 0.0
7. WONG TAI SIN Choi Fai Estate 1 307 0.2 40 0.2 Choi Hung Estate 7 351 1.0 250 1.0 Choi Wan (1) Estate 5 761 0.8 193 0.8 Choi Wan (2) Estate 2 921 0.4 101 0.4 Chuk Yuen North Estate 1 351 0.2 41 0.2 Chuk Yuen South Estate 5 948 0.8 203 0.8 Fu Shan Estate 1 552 0.2 51 0.2 Fung Tak Estate 1 315 0.2 42 0.2 Lok Fu Estate 3 592 0.5 117 0.5 Lower Wong Tai Sin (1) Estate
1 696 0.2 58 0.2
Lower Wong Tai Sin (2) Estate
6 486 0.9 221 0.9
Mei Tung Estate 1 421 0.2 44 0.2 Shatin Pass Estate 1 229 0.2 43 0.2 Tsz Ching Estate 7 954 1.1 269 1.1 Tsz Hong Estate 1 994 0.3 69 0.3 Tsz Lok Estate 6 080 0.9 204 0.9 Tsz Man Estate 1 960 0.3 63 0.3 Tung Tau (2) Estate 2 428 0.3 79 0.3 Tung Wui Estate 1 301 0.2 46 0.2 Upper Wong Tai Sin Estate 4 791 0.7 161 0.7
Page 2 of 5
District * Name of estate
Actual overall tenant households^
Tenant household sample
No. % No. % Wang Tau Hom Estate 5 772 0.8 192 0.8 8. YAU TSIM MONG Hoi Fu Court 2 776 0.4 94 0.4 9. ISLANDS Cheung Kwai Estate 451 0.1 15 0.1
Fu Tung Estate 1 657 0.2 56 0.2 Kam Peng Estate 248 0.0 9 0.0 Lung Tin Estate 371 0.1 9 0.0** Nga Ning Court 416 0.1 14 0.1 Ngan Wan Estate 422 0.1 12 0.1
Yat Tung (1) Estate 5 548 0.8 190 0.8 Yat Tung (2) Estate 6 275 0.9 209 0.9
10. KWAI TSING Cheung Ching Estate 4 821 0.7 166 0.7 Cheung Fat Estate 1 254 0.2 41 0.2
Cheung Hang Estate 4 321 0.6 147 0.6 Cheung Hong Estate 8 173 1.1 278 1.2** Cheung On Estate 1 358 0.2 50 0.2 Cheung Wang Estate 4 242 0.6 139 0.6 Easeful Court 510 0.1 14 0.1 High Prosperity Terrace 757 0.1 26 0.1 Kwai Chung Estate 13 489 1.9 451 1.9 Kwai Fong Estate 6 176 0.9 210 0.9 Kwai Hing Estate 352 0.0 14 0.1** Kwai Luen Estate 1 427 0.2 44 0.2 Kwai Shing East Estate 6 195 0.9 208 0.9 Kwai Shing West Estate 5 174 0.7 172 0.7 Lai King Estate 4 176 0.6 140 0.6 Lai Yiu Estate 2 787 0.4 97 0.4 On Yam Estate 5 202 0.7 171 0.7 Shek Lei (1) Estate 4 765 0.7 157 0.7 Shek Lei (2) Estate 7 412 1.0 254 1.1** Shek Yam East Estate 2 325 0.3 81 0.3 Shek Yam Estate 2 627 0.4 82 0.3** Tai Wo Hau Estate 7 490 1.1 253 1.1 Tsing Yi Estate 752 0.1 19 0.1 Wah Lai Estate 1 427 0.2 51 0.2
11. NORTH Cheung Wah Estate 2 037 0.3 69 0.3 Ching Ho Estate 7 096 1.0 240 1.0 Choi Yuen Estate 5 000 0.7 170 0.7 Ka Fuk Estate 1 944 0.3 63 0.3 Tai Ping Estate 324 0.0 11 0.0 Tin Ping Estate 1 209 0.2 40 0.2 Wah Ming Estate 1 734 0.2 61 0.3** Wah Sum Estate 1 475 0.2 54 0.2 Yung Shing Court 1 707 0.2 57 0.2
12. SAI KUNG
Choi Ming Court 2 782 0.4 91 0.4 Hau Tak Estate 4 116 0.6 139 0.6 Kin Ming Estate 6 985 1.0 232 1.0 King Lam Estate 1 654 0.2 60 0.3** Ming Tak Estate 1 464 0.2 47 0.2 Po Lam Estate 1 938 0.3 65 0.3 Sheung Tak Estate 5 489 0.8 182 0.8 Shin Ming Estate 1 947 0.3 59 0.2** Tsui Lam Estate 1 703 0.2 62 0.3**
13. SHATIN Chun Shek Estate 2 107 0.3 73 0.3 Chung On Estate 2 714 0.4 88 0.4
Page 3 of 5

District * Name of estate
Actual overall tenant households^
Tenant household sample
No. % No. % Fung Wo Estate 604 0.1 23 0.1
Heng On Estate 964 0.1 36 0.2** Hin Keng Estate 790 0.1 26 0.1
Hin Yiu Estate 792 0.1 27 0.1 Kwong Yuen Estate 1 361 0.2 46 0.2 Lee On Estate 3 595 0.5 127 0.5 Lek Yuen Estate 3 169 0.4 108 0.5** Lung Hang Estate 4 329 0.6 152 0.6 Mei Lam Estate 4 072 0.6 141 0.6 Mei Tin Estate 5 992 0.8 203 0.8 Pok Hong Estate 1 242 0.2 46 0.2 Sha Kok Estate 6 216 0.9 207 0.9 Shek Mun Estate 1 944 0.3 70 0.3 Sun Chui Estate 6 592 0.9 227 0.9 Sun Tin Wai Estate 3 373 0.5 116 0.5 Wo Che Estate 6 224 0.9 211 0.9 Yan On Estate 2 573 0.4 90 0.4 Yiu On Estate 1 100 0.2 36 0.2
14. TAI PO Fu Heng Estate 1 871 0.3 66 0.3 Fu Shin Estate 2 473 0.3 88 0.4** Kwong Fuk Estate 6 151 0.9 204 0.9 Tai Wo Estate 2 050 0.3 70 0.3 Tai Yuen Estate 4 698 0.7 159 0.7 Wan Tau Tong Estate 673 0.1 19 0.1
15. TSUEN WAN Cheung Shan Estate 1602 0.2 49 0.2 Fuk Loi Estate 3 109 0.4 101 0.4 Lei Muk Shue (1) Estate 2 288 0.3 70 0.3 Lei Muk Shue (2) Estate 4 243 0.6 142 0.6 Lei Muk Shue Estate 3 876 0.5 137 0.6** Shek Wai Kok Estate 6 307 0.9 220 0.9
16. TUEN MUN Butterfly Estate 5 308 0.7 180 0.8** Fu Tai Estate 5 018 0.7 170 0.7 Kin Sang Estate 600 0.1 22 0.1 Leung King Estate 2 833 0.4 94 0.4 Lung Yat Estate 335 0.0 11 0.0 On Ting Estate 4 981 0.7 168 0.7 Po Tin Estate 6 495 0.9 214 0.9 Sam Shing Estate 1 791 0.3 58 0.2** Shan King Estate 6 320 0.9 218 0.9 Tai Hing Estate 8 370 1.2 282 1.2 Tin King Estate 991 0.1 37 0.2** Wu King Estate 4 304 0.6 140 0.6 Yau Oi Estate 9 077 1.3 308 1.3
17. YUEN LONG Grandeur Terrace 4 089 0.6 140 0.6 Long Ping Estate 4 349 0.6 143 0.6 Shui Pin Wai Estate 2 350 0.3 80 0.3 Tin Chak Estate 3 970 0.6 136 0.6 Tin Ching Estate 6 154 0.9 208 0.9 Tin Heng Estate 5 744 0.8 194 0.8 Tin Shui (1) Estate 4 573 0.6 151 0.6 Tin Shui (2) Estate 3 155 0.4 110 0.5** Tin Tsz Estate 3 255 0.5 108 0.5 Tin Wah Estate 3 647 0.5 123 0.5 Tin Yan Estate 5 473 0.8 187 0.8
Page 4 of 5

District * Name of estate
Actual overall tenant households^
Tenant household sample
No. % No. % Tin Yat Estate 3 321 0.5 109 0.5
Tin Yiu (1) Estate 4 596 0.6 156 0.7** Tin Yiu (2) Estate 3 805 0.5 129 0.5 Tin Yuet Estate 4 127 0.6 139 0.6
OVERALL 711 937 100.0 24 000 100.0 * The estates are grouped according to 17 districts for easy reference. There are no PRH estates
in Wan Chai district. ** Chi-square tests were conducted to compare the actual overall distribution of the sample and that
of the tenancy records by district and by estate. The results indicated that the differences between the actual and sampled distribution are insignificant.
^ Refer to the average number of households for the 12 months in 2013.
Note: Statistically, the sample distribution tallies with the actual distribution by design of the proportionate stratified systematic random sampling method. That is, the sample effectively reflects the distribution of all PRH tenants by district and by estate.
Page 5 of 5
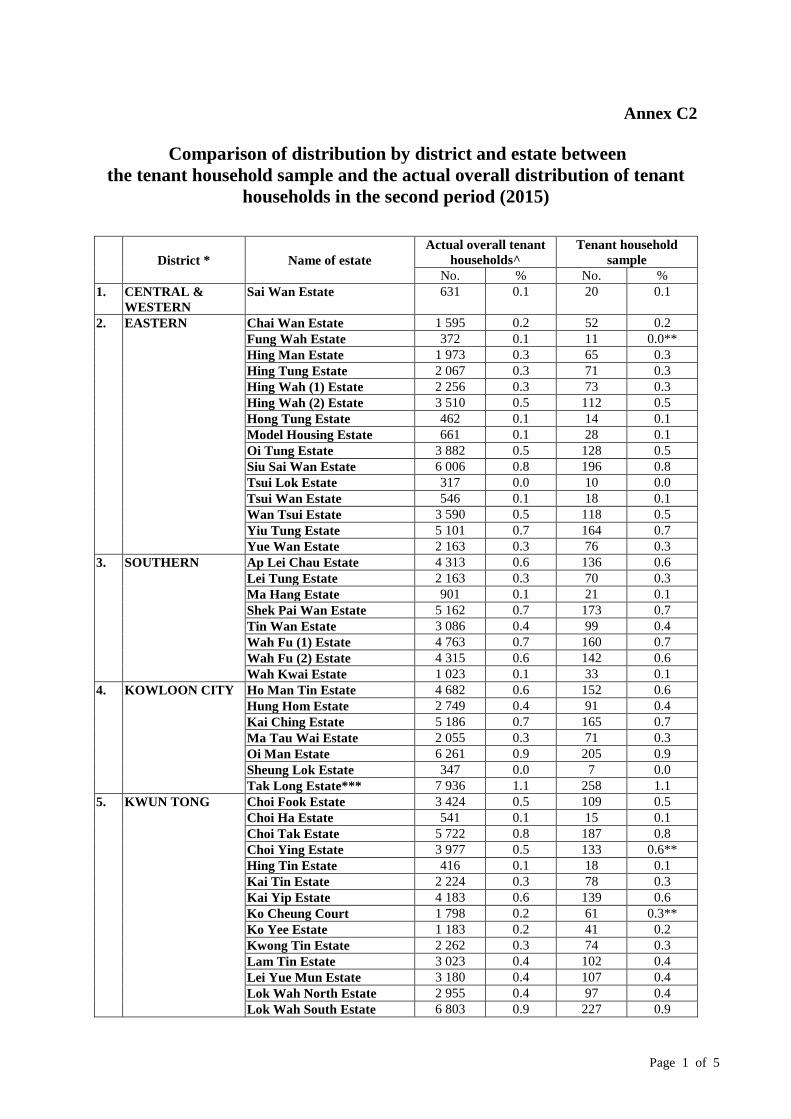
Annex C2
Comparison of distribution by district and estate between the tenant household sample and the actual overall distribution of tenant
households in the second period (2015)
District * Name of estate
Actual overall tenant households^
Tenant household sample
No. % No. % 1. CENTRAL &
WESTERN Sai Wan Estate 631 0.1 20 0.1
2. EASTERN Chai Wan Estate 1 595 0.2 52 0.2 Fung Wah Estate 372 0.1 11 0.0**
Hing Man Estate 1 973 0.3 65 0.3 Hing Tung Estate 2 067 0.3 71 0.3 Hing Wah (1) Estate 2 256 0.3 73 0.3 Hing Wah (2) Estate 3 510 0.5 112 0.5 Hong Tung Estate 462 0.1 14 0.1 Model Housing Estate 661 0.1 28 0.1 Oi Tung Estate 3 882 0.5 128 0.5 Siu Sai Wan Estate 6 006 0.8 196 0.8 Tsui Lok Estate 317 0.0 10 0.0 Tsui Wan Estate 546 0.1 18 0.1 Wan Tsui Estate 3 590 0.5 118 0.5 Yiu Tung Estate 5 101 0.7 164 0.7 Yue Wan Estate 2 163 0.3 76 0.3
3. SOUTHERN Ap Lei Chau Estate 4 313 0.6 136 0.6 Lei Tung Estate 2 163 0.3 70 0.3 Ma Hang Estate 901 0.1 21 0.1 Shek Pai Wan Estate 5 162 0.7 173 0.7 Tin Wan Estate 3 086 0.4 99 0.4 Wah Fu (1) Estate 4 763 0.7 160 0.7 Wah Fu (2) Estate 4 315 0.6 142 0.6 Wah Kwai Estate 1 023 0.1 33 0.1
4. KOWLOON CITY Ho Man Tin Estate 4 682 0.6 152 0.6 Hung Hom Estate 2 749 0.4 91 0.4 Kai Ching Estate 5 186 0.7 165 0.7 Ma Tau Wai Estate 2 055 0.3 71 0.3 Oi Man Estate 6 261 0.9 205 0.9 Sheung Lok Estate 347 0.0 7 0.0 Tak Long Estate*** 7 936 1.1 258 1.1
5. KWUN TONG Choi Fook Estate 3 424 0.5 109 0.5 Choi Ha Estate 541 0.1 15 0.1 Choi Tak Estate 5 722 0.8 187 0.8 Choi Ying Estate 3 977 0.5 133 0.6** Hing Tin Estate 416 0.1 18 0.1 Kai Tin Estate 2 224 0.3 78 0.3 Kai Yip Estate 4 183 0.6 139 0.6 Ko Cheung Court 1 798 0.2 61 0.3** Ko Yee Estate 1 183 0.2 41 0.2 Kwong Tin Estate 2 262 0.3 74 0.3 Lam Tin Estate 3 023 0.4 102 0.4 Lei Yue Mun Estate 3 180 0.4 107 0.4 Lok Wah North Estate 2 955 0.4 97 0.4 Lok Wah South Estate 6 803 0.9 227 0.9
Page 1 of 5
District * Name of estate
Actual overall tenant households^
Tenant household sample
No. % No. % Lower Ngau Tau Kok Estate 4 223 0.6 138 0.6
On Tin Estate 719 0.1 21 0.1 Ping Shek Estate 4 545 0.6 147 0.6 Ping Tin Estate 5 493 0.8 180 0.8 Po Tat Estate 7 389 1.0 246 1.0 Sau Mau Ping Estate 12 000 1.6 390 1.6 Sau Mau Ping South Estate 3 979 0.5 129 0.5 Shun Lee Estate 4 382 0.6 141 0.6 Shun On Estate 2 953 0.4 101 0.4 Shun Tin Estate 6 881 0.9 226 0.9 Tak Tin Estate 1 992 0.3 66 0.3 Tsui Ping North Estate 3 223 0.4 102 0.4 Tsui Ping South Estate 4 659 0.6 153 0.6 Upper Ngau Tau Kok Estate 6 571 0.9 214 0.9 Wan Hon Estate 983 0.1 34 0.1 Wo Lok Estate 1 919 0.3 61 0.3 Yau Lai Estate 8 493 1.2 280 1.2 Yau Tong Estate 3 553 0.5 120 0.5
6. SHAM SHUI PO Chak On Estate 1 811 0.2 57 0.2 Cheung Sha Wan Estate 1 383 0.2 48 0.2 Fortune Estate 2 087 0.3 64 0.3 Fu Cheong Estate 5 953 0.8 197 0.8 Hoi Lai Estate 4 889 0.7 157 0.7 Lai Kok Estate 2 831 0.4 93 0.4 Lai On Estate 1 334 0.2 42 0.2 Lei Cheng Uk Estate 1 197 0.2 34 0.1** Nam Cheong Estate 675 0.1 25 0.1 Nam Shan Estate 2 657 0.4 90 0.4 Pak Tin Estate 7 404 1.0 244 1.0 Shek Kip Mei Estate 8 891 1.2 290 1.2 Tai Hang Tung Estate 1 997 0.3 67 0.3 Un Chau Estate 7 577 1.0 251 1.0 Wing Cheong Estate 1 469 0.2 44 0.2
7. WONG TAI SIN Choi Fai Estate 1 314 0.2 45 0.2 Choi Hung Estate 7 368 1.0 247 1.0 Choi Wan (1) Estate 5 787 0.8 187 0.8 Choi Wan (2) Estate 2 931 0.4 98 0.4 Chuk Yuen North Estate 1 244 0.2 44 0.2 Chuk Yuen South Estate 5 980 0.8 192 0.8 Fu Shan Estate 1 561 0.2 51 0.2 Fung Tak Estate 1 214 0.2 37 0.2 Lok Fu Estate 3 600 0.5 119 0.5 Lower Wong Tai Sin (1) Estate
1 541 0.2 53 0.2
Lower Wong Tai Sin (2) Estate
6 527 0.9 212 0.9
Mei Tung Estate 2 343 0.3 80 0.3 Shatin Pass Estate 1 274 0.2 37 0.2 Tsz Ching Estate 7 994 1.1 262 1.1 Tsz Hong Estate 1 994 0.3 65 0.3 Tsz Lok Estate 6 112 0.8 203 0.8 Tsz Man Estate 1 970 0.3 62 0.3 Tung Tau (2) Estate 2 201 0.3 69 0.3 Tung Wui Estate 1 305 0.2 46 0.2
Page 2 of 5
District * Name of estate
Actual overall tenant households^
Tenant household sample
No. % No. % Upper Wong Tai Sin Estate 4 811 0.7 154 0.6**
Wang Tau Hom Estate 5 775 0.8 190 0.8 8. YAU TSIM MONG Hoi Fu Court 2 779 0.4 92 0.4 9. ISLANDS Cheung Kwai Estate 456 0.1 16 0.1
Fu Tung Estate 1 657 0.2 51 0.2 Kam Peng Estate 252 0.0 8 0.0 Lung Tin Estate 404 0.1 13 0.1 Nga Ning Court 417 0.1 10 0.0** Ngan Wan Estate 433 0.1 14 0.1
Yat Tung (1) Estate 5 576 0.8 186 0.8 Yat Tung (2) Estate 6 342 0.9 205 0.9
10. KWAI TSING Cheung Ching Estate 4 821 0.7 160 0.7 Cheung Fat Estate 1 145 0.2 37 0.2
Cheung Hang Estate 4 334 0.6 142 0.6 Cheung Hong Estate 8 186 1.1 267 1.1 Cheung On Estate 1 219 0.2 40 0.2 Cheung Wang Estate 4 243 0.6 138 0.6 Easeful Court 509 0.1 19 0.1 High Prosperity Terrace 758 0.1 28 0.1 Kwai Chung Estate 13 528 1.8 440 1.8 Kwai Fong Estate 6 193 0.8 199 0.8 Kwai Hing Estate 324 0.0 14 0.1** Kwai Luen Estate 2 940 0.4 97 0.4 Kwai Shing East Estate 6 217 0.8 206 0.9** Kwai Shing West Estate 5 212 0.7 169 0.7 Lai King Estate 4 180 0.6 137 0.6 Lai Yiu Estate 2 796 0.4 92 0.4 On Yam Estate 5 217 0.7 173 0.7 Shek Lei (1) Estate 4 773 0.7 155 0.6** Shek Lei (2) Estate 8 252 1.1 275 1.1 Shek Yam East Estate 2 339 0.3 83 0.3 Shek Yam Estate 2 634 0.4 81 0.3** Tai Wo Hau Estate 7 528 1.0 248 1.0 Tsing Yi Estate 659 0.1 22 0.1 Wah Lai Estate 1 427 0.2 45 0.2
11. NORTH Cheung Lung Wai Estate*** 717 0.1 21 0.1 Cheung Wah Estate 1 742 0.2 58 0.2 Ching Ho Estate 7 094 1.0 234 1.0 Choi Yuen Estate 5 000 0.7 163 0.7 Ka Fuk Estate 1 936 0.3 64 0.3 Tai Ping Estate 264 0.0 7 0.0 Tin Ping Estate 1 047 0.1 39 0.2** Wah Ming Estate 1 488 0.2 47 0.2 Wah Sum Estate 1 474 0.2 52 0.2 Yung Shing Court 1 704 0.2 51 0.2
12. SAI KUNG Choi Ming Court 2 786 0.4 93 0.4 Hau Tak Estate 4 130 0.6 133 0.6 Kin Ming Estate 6 989 1.0 229 1.0 King Lam Estate 1 524 0.2 49 0.2 Ming Tak Estate 1 461 0.2 43 0.2 Po Lam Estate 1 669 0.2 61 0.3** Sheung Tak Estate 5 498 0.8 183 0.8 Shin Ming Estate 1 962 0.3 66 0.3 Tsui Lam Estate 1 516 0.2 51 0.2
Page 3 of 5
District * Name of estate
Actual overall tenant households^
Tenant household sample
No. % No. % Yee Ming Estate*** 1 884 0.3 60 0.3 13. SHATIN Chun Shek Estate 2 118 0.3 71 0.3
Chung On Estate 2 722 0.4 85 0.4 Fung Wo Estate 1 603 0.2 58 0.2 Heng On Estate 827 0.1 23 0.1 Hin Keng Estate 663 0.1 23 0.1 Hin Yiu Estate 792 0.1 32 0.1 Kwong Yuen Estate 1 189 0.2 35 0.1** Lee On Estate 3 605 0.5 125 0.5 Lek Yuen Estate 3 192 0.4 95 0.4 Lung Hang Estate 4 337 0.6 143 0.6 Mei Lam Estate 4 077 0.6 136 0.6 Mei Tin Estate 6 683 0.9 219 0.9 Pok Hong Estate 1 126 0.2 35 0.1** Sha Kok Estate 6 260 0.9 208 0.9 Shek Mun Estate 1 945 0.3 65 0.3 Shui Chuen O Estate*** 1 091 0.1 33 0.1 Sun Chui Estate 6 597 0.9 218 0.9 Sun Tin Wai Estate 3 382 0.5 109 0.5 Wo Che Estate 6 220 0.9 206 0.9 Yan On Estate 2 574 0.4 81 0.3** Yiu On Estate 979 0.1 38 0.2**
14. TAI PO Fu Heng Estate 1 658 0.2 54 0.2 Fu Shin Estate 2 249 0.3 77 0.3 Kwong Fuk Estate 6 150 0.8 202 0.8 Tai Wo Estate 1 791 0.2 60 0.3** Tai Yuen Estate 4 703 0.6 152 0.6 Wan Tau Tong Estate 596 0.1 19 0.1
15. TSUEN WAN Cheung Shan Estate 1 605 0.2 53 0.2 Fuk Loi Estate 3 094 0.4 103 0.4 Lei Muk Shue (1) Estate 2 292 0.3 76 0.3 Lei Muk Shue (2) Estate 4 263 0.6 141 0.6 Lei Muk Shue Estate 3 877 0.5 126 0.5 Shek Wai Kok Estate 6 320 0.9 211 0.9
16. TUEN MUN Butterfly Estate 5 326 0.7 179 0.7 Fu Tai Estate 5 030 0.7 166 0.7 Kin Sang Estate 538 0.1 17 0.1 Leung King Estate 2 531 0.3 85 0.4** Lung Yat Estate 973 0.1 26 0.1 On Ting Estate 5 001 0.7 162 0.7 Po Tin Estate 5 862 0.8 189 0.8 Sam Shing Estate 1 790 0.2 59 0.2 Shan King Estate 5 821 0.8 192 0.8 Tai Hing Estate 8 390 1.1 272 1.1 Tin King Estate 872 0.1 30 0.1 Wu King Estate 4 308 0.6 141 0.6 Yau Oi Estate 9 092 1.2 298 1.2
17. YUEN LONG Grandeur Terrace 4 092 0.6 132 0.6 Hung Fuk Estate*** 944 0.1 34 0.1 Long Ping Estate 3 678 0.5 123 0.5 Shui Pin Wai Estate 2 355 0.3 77 0.3 Tin Chak Estate 3 977 0.5 128 0.5 Tin Ching Estate 6 165 0.8 203 0.8 Tin Heng Estate 5 747 0.8 190 0.8
Page 4 of 5
District * Name of estate
Actual overall tenant households^
Tenant household sample
No. % No. % Tin Shui (1) Estate 4 592 0.6 152 0.6
Tin Shui (2) Estate 3 160 0.4 105 0.4 Tin Tsz Estate 3 261 0.4 105 0.4 Tin Wah Estate 3 664 0.5 120 0.5 Tin Yan Estate 5 540 0.8 182 0.8 Tin Yat Estate 3 324 0.5 110 0.5 Tin Yiu (1) Estate 4 604 0.6 147 0.6 Tin Yiu (2) Estate 3 806 0.5 127 0.5 Tin Yuet Estate 4 153 0.6 139 0.6
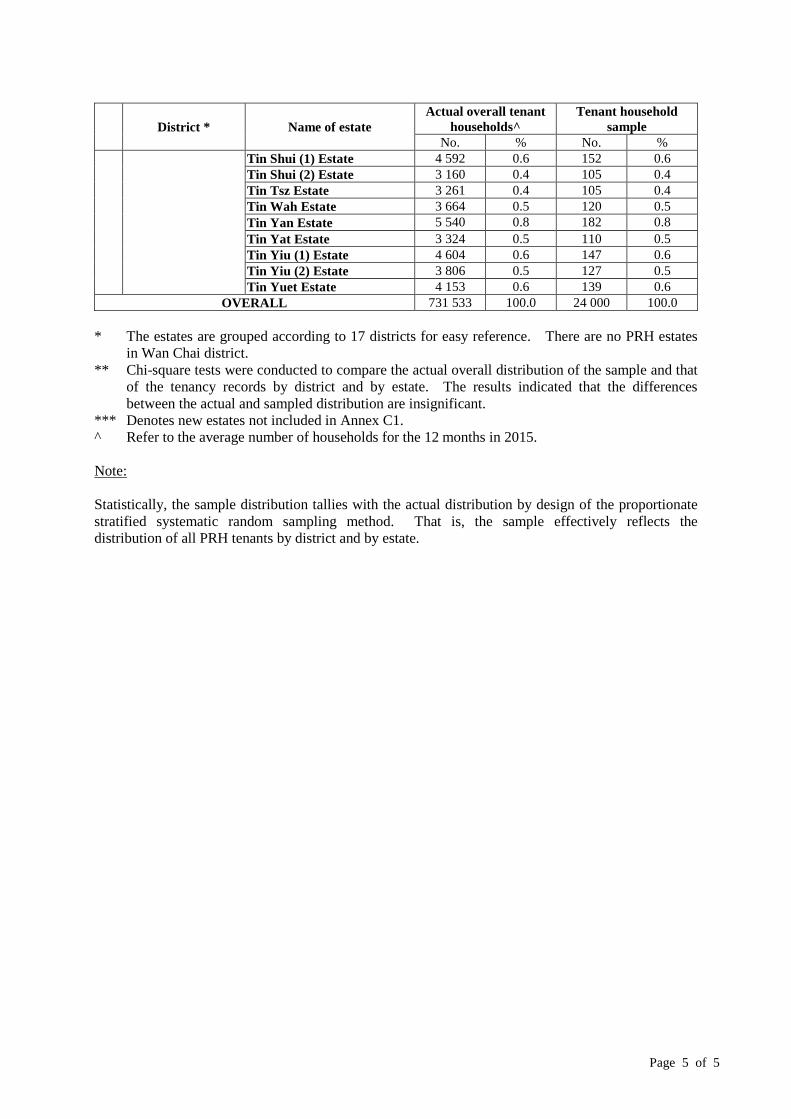
OVERALL 731 533 100.0 24 000 100.0
* The estates are grouped according to 17 districts for easy reference. There are no PRH estates in Wan Chai district.
** Chi-square tests were conducted to compare the actual overall distribution of the sample and that of the tenancy records by district and by estate. The results indicated that the differences between the actual and sampled distribution are insignificant.
*** Denotes new estates not included in Annex C1. ^ Refer to the average number of households for the 12 months in 2015. Note: Statistically, the sample distribution tallies with the actual distribution by design of the proportionate stratified systematic random sampling method. That is, the sample effectively reflects the distribution of all PRH tenants by district and by estate.
Page 5 of 5
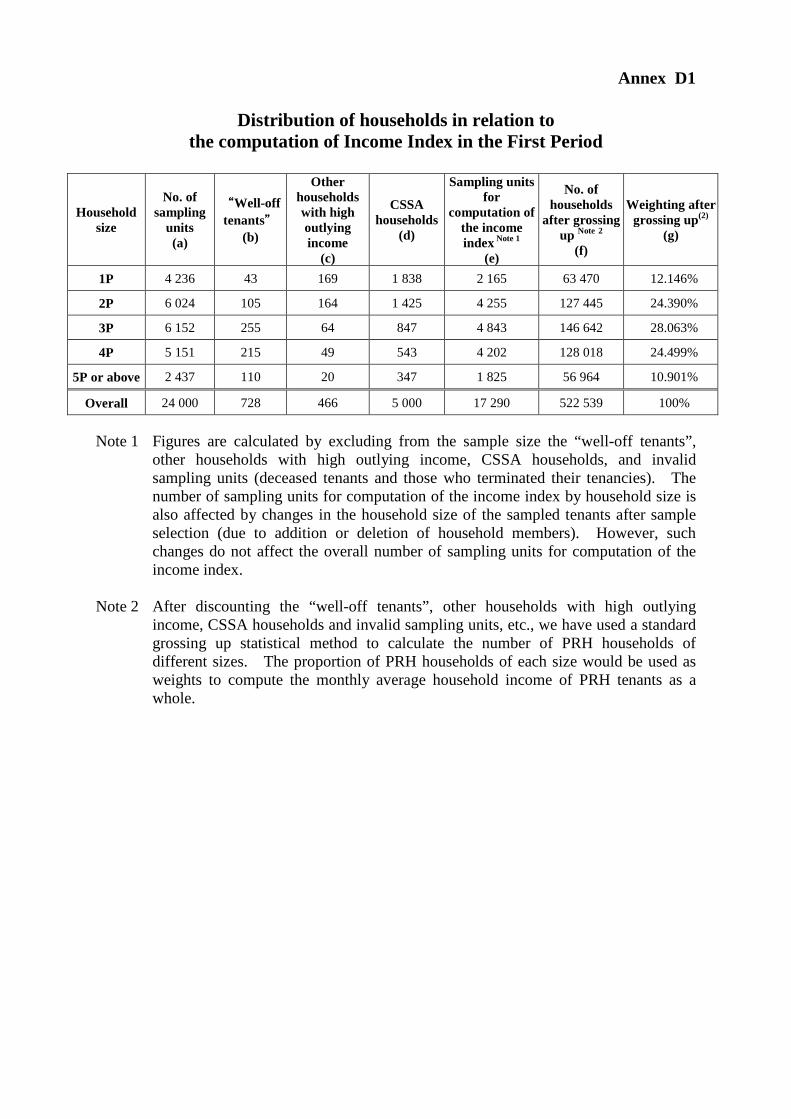
Annex D1
Distribution of households in relation to
the computation of Income Index in the First Period
Household size
No. of sampling
units (a)
“Well-off tenants”
(b)
Other households with high outlying income
(c)
CSSA households
(d)
Sampling units for
computation of the income index Note 1
(e)
No. of households
after grossing up Note 2
(f)
Weighting after grossing up(2)
(g)
1P 4 236 43 169 1 838 2 165 63 470 12.146%
2P 6 024 105 164 1 425 4 255 127 445 24.390%
3P 6 152 255 64 847 4 843 146 642 28.063%
4P 5 151 215 49 543 4 202 128 018 24.499%
5P or above 2 437 110 20 347 1 825 56 964 10.901%
Overall 24 000 728 466 5 000 17 290 522 539 100% Note 1 Figures are calculated by excluding from the sample size the “well-off tenants”,
other households with high outlying income, CSSA households, and invalid sampling units (deceased tenants and those who terminated their tenancies). The number of sampling units for computation of the income index by household size is also affected by changes in the household size of the sampled tenants after sample selection (due to addition or deletion of household members). However, such changes do not affect the overall number of sampling units for computation of the income index.
Note 2 After discounting the “well-off tenants”, other households with high outlying
income, CSSA households and invalid sampling units, etc., we have used a standard grossing up statistical method to calculate the number of PRH households of different sizes. The proportion of PRH households of each size would be used as weights to compute the monthly average household income of PRH tenants as a whole.

Annex D2
Distribution of households in relation to
the computation of Income Index in the Second Period
Household size
No. of sampling
units (a)
“Well-off tenants”
(b)
Other households with high outlying income
(c)
CSSA households
(d)
Sampling units for
computation of the income index Note 1
(e)
No. of households
after grossing up Note 2
(f)
Weighting after grossing up Note 2
(g)
1P 4 368 56 179 1 743 2 391 71 885 13.014%
2P 6 220 144 132 1 357 4 460 138 289 25.035%
3P 6 217 237 69 708 5 081 157 734 28.555%
4P 4 950 199 47 442 4 123 129 054 23.363%
5P or above 2 245 101 19 279 1 739 55 422 10.033%
Overall 24 000 737 446 4 529 17 794 552 385 100%
Note 1 Figures are calculated by excluding from the sample size the “well-off tenants”,
other households with high outlying income, CSSA households, and invalid sampling units (i.e. deceased tenants and those who terminated their tenancies). The number of sampling units for computation of the income index by household size is also affected by changes in the household size of the sampled tenants after sample selection (due to addition or deletion of household members). However, such changes do not affect the overall number of sampling units for computation of the income index.
Note 2 After discounting the “well-off tenants”, other households with high outlying
income, CSSA households and invalid sampling units, etc., we have used a standard grossing up statistical method to calculate the number of PRH households of different sizes. The proportion of PRH households of each size would be used as weights to compute the monthly average household income of PRH tenants as a whole.
As stipulated in section 16A(8) of the Housing Ordinance, “adjusted mean monthly household income” refers to the mean monthly income of tenants assessed on the basis of the distribution of the household size of those tenants over the first period. Hence for this rent review, the set of weights in column (g) in Annex D1 will be used instead of column (g) in this Annex for computing the adjusted overall mean monthly household income. The set of weights in column (g) in this Annex will be used in the next rent review exercise.
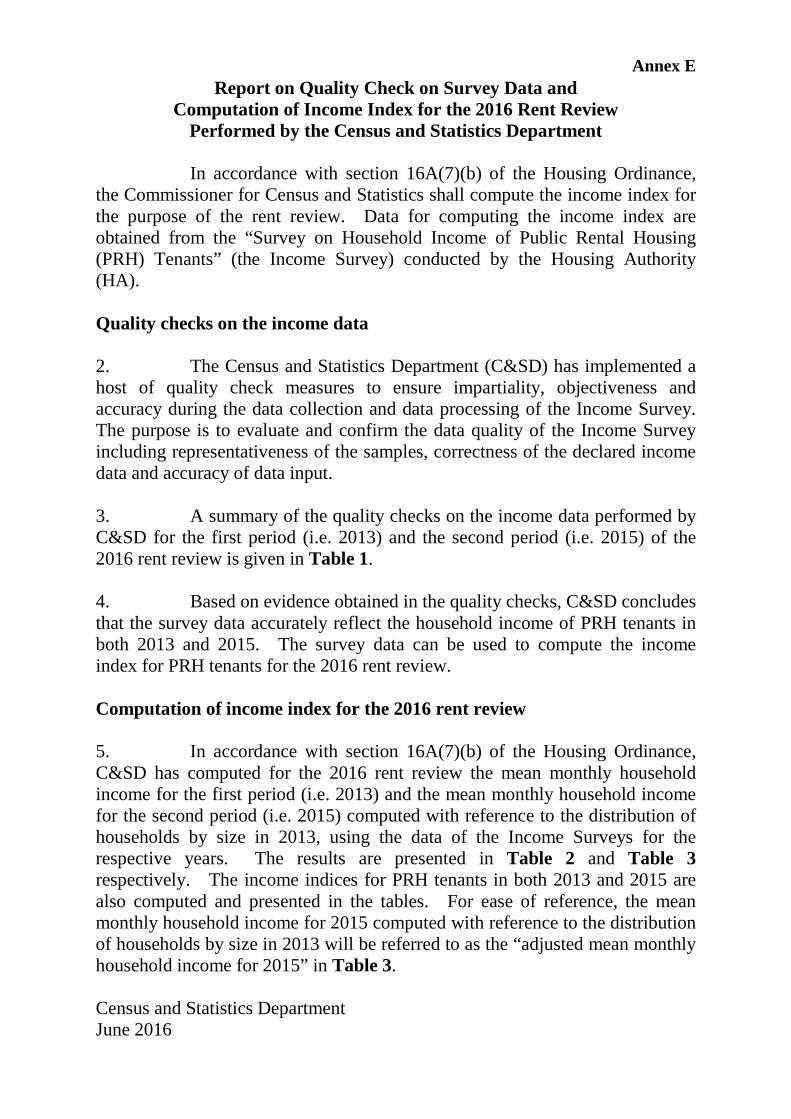
Annex E
Report on Quality Check on Survey Data and Computation of Income Index for the 2016 Rent Review
Performed by the Census and Statistics Department In accordance with section 16A(7)(b) of the Housing Ordinance, the Commissioner for Census and Statistics shall compute the income index for the purpose of the rent review. Data for computing the income index are obtained from the “Survey on Household Income of Public Rental Housing (PRH) Tenants” (the Income Survey) conducted by the Housing Authority (HA). Quality checks on the income data 2. The Census and Statistics Department (C&SD) has implemented a host of quality check measures to ensure impartiality, objectiveness and accuracy during the data collection and data processing of the Income Survey. The purpose is to evaluate and confirm the data quality of the Income Survey including representativeness of the samples, correctness of the declared income data and accuracy of data input. 3. A summary of the quality checks on the income data performed by C&SD for the first period (i.e. 2013) and the second period (i.e. 2015) of the 2016 rent review is given in Table 1. 4. Based on evidence obtained in the quality checks, C&SD concludes that the survey data accurately reflect the household income of PRH tenants in both 2013 and 2015. The survey data can be used to compute the income index for PRH tenants for the 2016 rent review. Computation of income index for the 2016 rent review 5. In accordance with section 16A(7)(b) of the Housing Ordinance, C&SD has computed for the 2016 rent review the mean monthly household income for the first period (i.e. 2013) and the mean monthly household income for the second period (i.e. 2015) computed with reference to the distribution of households by size in 2013, using the data of the Income Surveys for the respective years. The results are presented in Table 2 and Table 3 respectively. The income indices for PRH tenants in both 2013 and 2015 are also computed and presented in the tables. For ease of reference, the mean monthly household income for 2015 computed with reference to the distribution of households by size in 2013 will be referred to as the “adjusted mean monthly household income for 2015” in Table 3. Census and Statistics Department June 2016
- 1 -
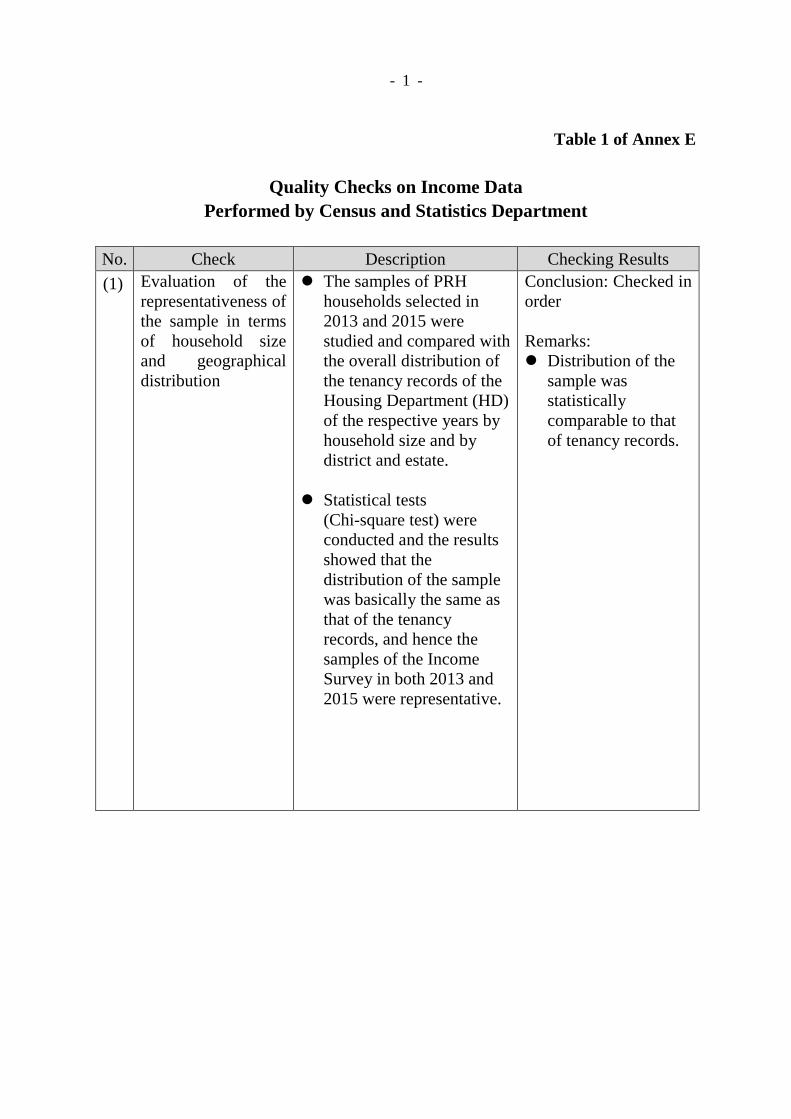
Table 1 of Annex E
Quality Checks on Income Data Performed by Census and Statistics Department
No. Check Description Checking Results (1) Evaluation of the
representativeness of the sample in terms of household size and geographical distribution
The samples of PRH households selected in 2013 and 2015 were studied and compared with the overall distribution of the tenancy records of the Housing Department (HD) of the respective years by household size and by district and estate.
Statistical tests (Chi-square test) were conducted and the results showed that the distribution of the sample was basically the same as that of the tenancy records, and hence the samples of the Income Survey in both 2013 and 2015 were representative.
Conclusion: Checked in order Remarks: Distribution of the
sample was statistically comparable to that of tenancy records.
- 2 -
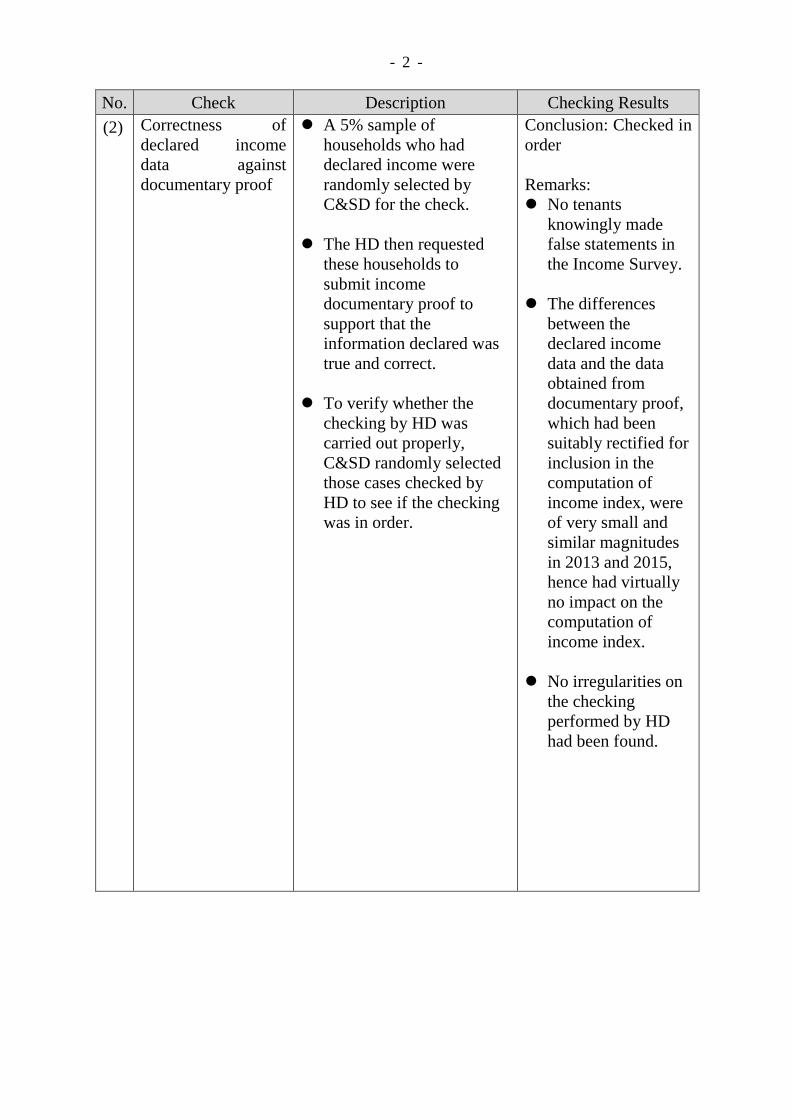
No. Check Description Checking Results (2) Correctness of
declared income data against documentary proof
A 5% sample of households who had declared income were randomly selected by C&SD for the check.
The HD then requested these households to submit income documentary proof to support that the information declared was true and correct.
To verify whether the
checking by HD was carried out properly, C&SD randomly selected those cases checked by HD to see if the checking was in order.
Conclusion: Checked in order Remarks: No tenants
knowingly made false statements in the Income Survey.
The differences between the declared income data and the data obtained from documentary proof, which had been suitably rectified for inclusion in the computation of income index, were of very small and similar magnitudes in 2013 and 2015, hence had virtually no impact on the computation of income index.
No irregularities on the checking performed by HD had been found.
- 3 -
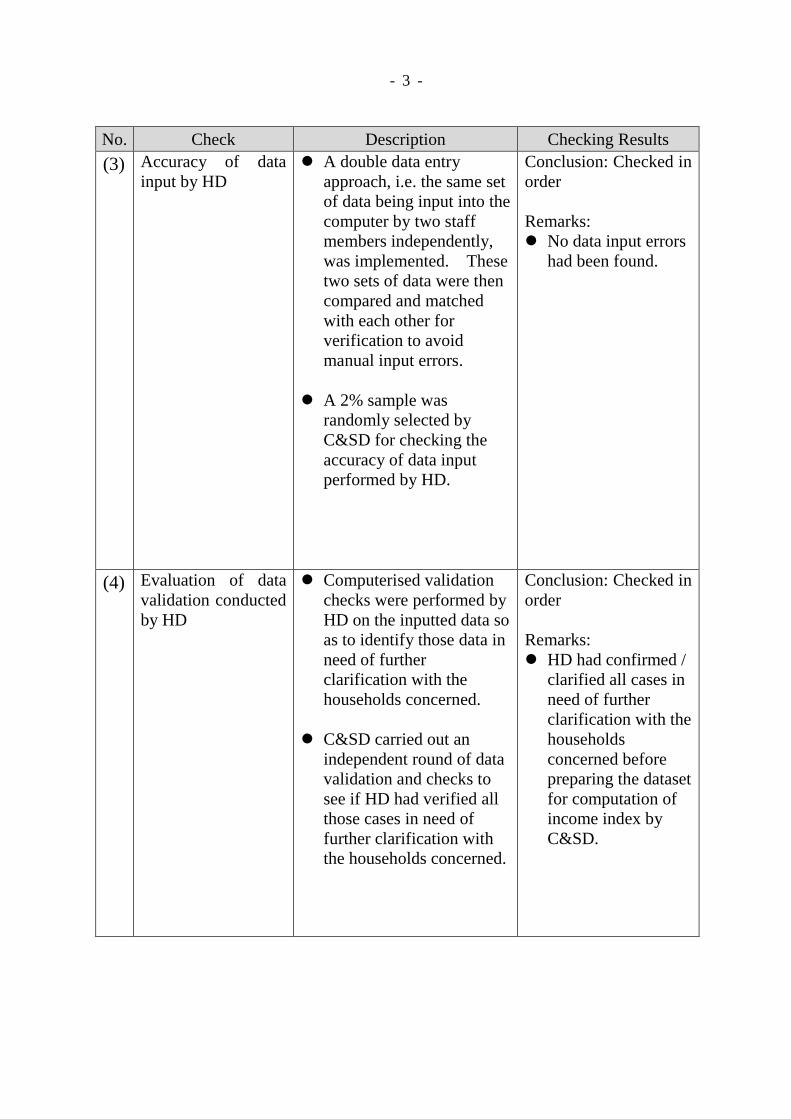
No. Check Description Checking Results (3) Accuracy of data
input by HD A double data entry
approach, i.e. the same set of data being input into the computer by two staff members independently, was implemented. These two sets of data were then compared and matched with each other for verification to avoid manual input errors.
A 2% sample was randomly selected by C&SD for checking the accuracy of data input performed by HD.
Conclusion: Checked in order Remarks: No data input errors
had been found.
(4) Evaluation of data validation conducted by HD
Computerised validation checks were performed by HD on the inputted data so as to identify those data in need of further clarification with the households concerned.
C&SD carried out an independent round of data validation and checks to see if HD had verified all those cases in need of further clarification with the households concerned.
Conclusion: Checked in order Remarks: HD had confirmed /
clarified all cases in need of further clarification with the households concerned before preparing the dataset for computation of income index by C&SD.
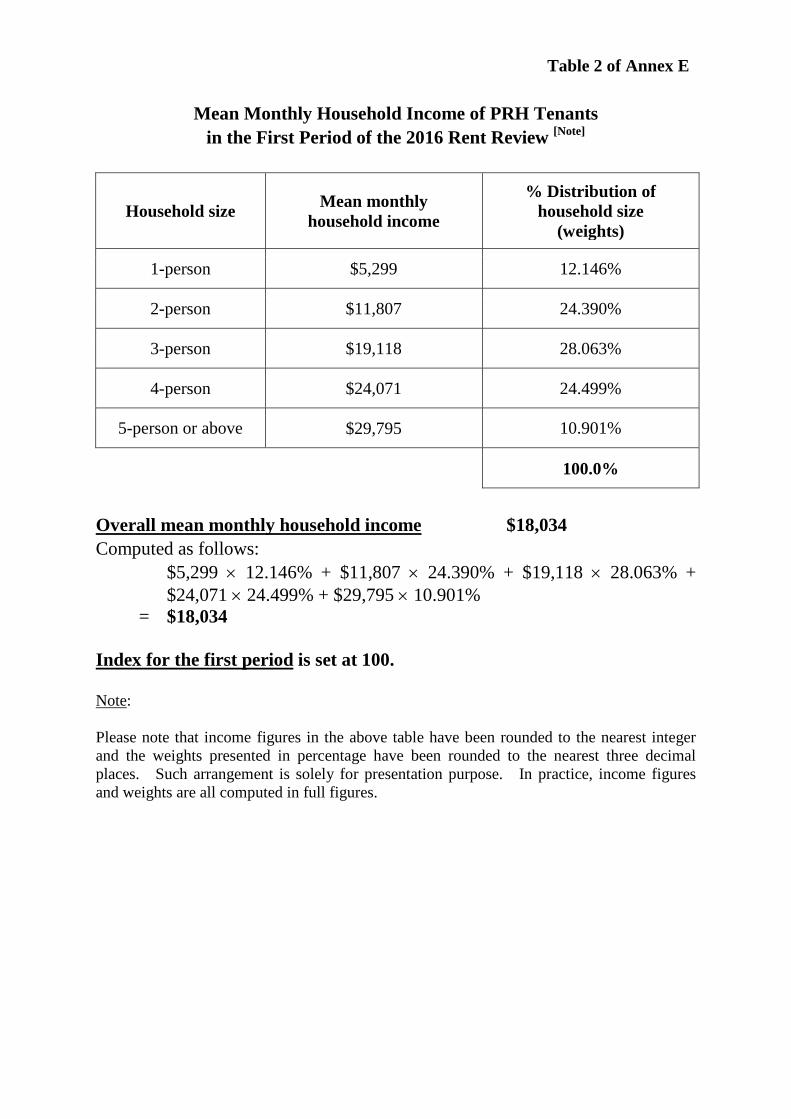
Table 2 of Annex E
Mean Monthly Household Income of PRH Tenants
in the First Period of the 2016 Rent Review [Note]
Household size Mean monthly household income
% Distribution of household size
(weights)
1-person $5,299 12.146%
2-person $11,807 24.390%
3-person $19,118 28.063%
4-person $24,071 24.499%
5-person or above $29,795 10.901%
100.0%
Overall mean monthly household income $18,034 Computed as follows:
$5,299 × 12.146% + $11,807 × 24.390% + $19,118 × 28.063% + $24,071 × 24.499% + $29,795 × 10.901%
= $18,034
Index for the first period is set at 100.
Note: Please note that income figures in the above table have been rounded to the nearest integer and the weights presented in percentage have been rounded to the nearest three decimal places. Such arrangement is solely for presentation purpose. In practice, income figures and weights are all computed in full figures.
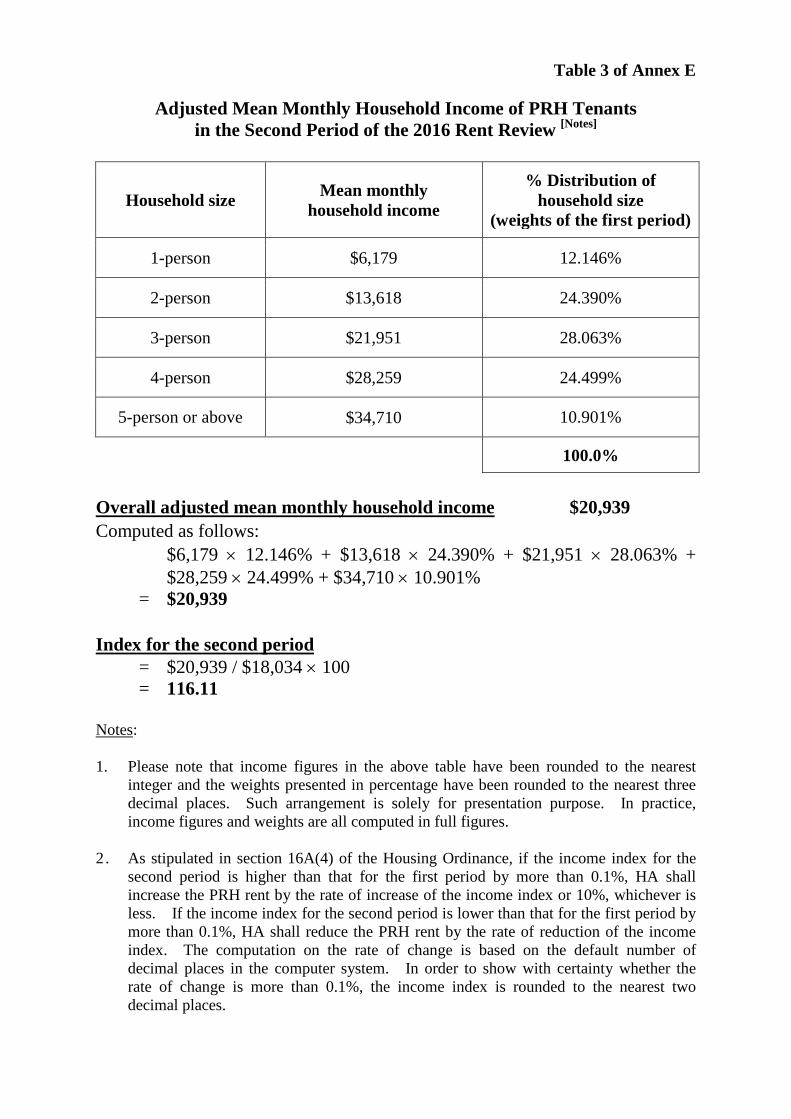
Table 3 of Annex E
Adjusted Mean Monthly Household Income of PRH Tenants
in the Second Period of the 2016 Rent Review [Notes]
Household size Mean monthly household income
% Distribution of household size
(weights of the first period)
1-person $6,179 12.146%
2-person $13,618 24.390%
3-person $21,951 28.063%
4-person $28,259 24.499%
5-person or above $34,710 10.901%
100.0%
Overall adjusted mean monthly household income $20,939 Computed as follows:
$6,179 × 12.146% + $13,618 × 24.390% + $21,951 × 28.063% + $28,259 × 24.499% + $34,710 × 10.901%
= $20,939 Index for the second period
= $20,939 / $18,034 × 100 = 116.11
Notes: 1. Please note that income figures in the above table have been rounded to the nearest
integer and the weights presented in percentage have been rounded to the nearest three decimal places. Such arrangement is solely for presentation purpose. In practice, income figures and weights are all computed in full figures.
2 . As stipulated in section 16A(4) of the Housing Ordinance, if the income index for the second period is higher than that for the first period by more than 0.1%, HA shall increase the PRH rent by the rate of increase of the income index or 10%, whichever is less. If the income index for the second period is lower than that for the first period by more than 0.1%, HA shall reduce the PRH rent by the rate of reduction of the income index. The computation on the rate of change is based on the default number of decimal places in the computer system. In order to show with certainty whether the rate of change is more than 0.1%, the income index is rounded to the nearest two decimal places.
- 1 -
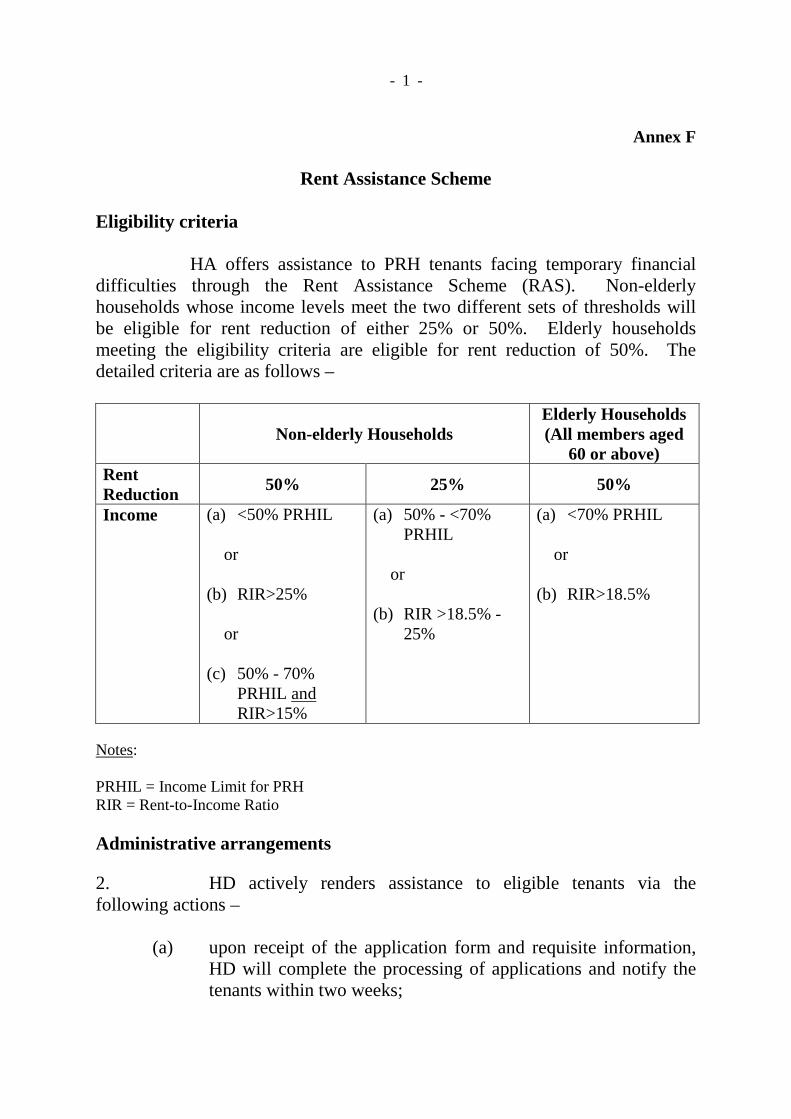
Annex F
Rent Assistance Scheme Eligibility criteria
HA offers assistance to PRH tenants facing temporary financial difficulties through the Rent Assistance Scheme (RAS). Non-elderly households whose income levels meet the two different sets of thresholds will be eligible for rent reduction of either 25% or 50%. Elderly households meeting the eligibility criteria are eligible for rent reduction of 50%. The detailed criteria are as follows –
Non-elderly Households Elderly Households (All members aged
60 or above) Rent Reduction 50% 25% 50%
Income (a) <50% PRHIL or (b) RIR>25% or (c) 50% - 70%
PRHIL and RIR>15%
(a) 50% - <70% PRHIL
or (b) RIR >18.5% -
25%
(a) <70% PRHIL or (b) RIR>18.5%
Notes: PRHIL = Income Limit for PRH RIR = Rent-to-Income Ratio Administrative arrangements 2. HD actively renders assistance to eligible tenants via the following actions –
(a) upon receipt of the application form and requisite information, HD will complete the processing of applications and notify the tenants within two weeks;

- 2 -
(b) widely publicises the RAS through various channels, e.g. posters
and leaflets, the radio, Housing Channel, HA/HD web site, EMAC newsletter, etc.; and
(c) reminds tenants with rent arrears on the availability of the RAS
in the rent chasing letters. It is also stated in the rent adjustment notification letters to tenants that the RAS is available. In this respect, HD in particular reaches out to households with elderly and disabled members. HD highlights in the notification letters that staff of HD stand ready to assist tenant households with elderly and disabled family members in their RAS applications where necessary.
Enhancements made to RAS
3. During the 2014 rent review, we reviewed the operation of RAS and implemented enhancements to the publicity of RAS and its application process so that more tenants who are in need would know about the scheme and benefit from it. Details are set out in the ensuing paragraphs.
Strengthening the publicity of RAS
4. To further enhance publicity of the RAS, we have rolled out the following new measures –
(a) distributed RAS leaflets (which set out in detail the eligibility criteria and application procedures) to all PRH tenants paying normal rent together with the rent adjustment notification letters issued in July 2014;
(b) publicised the availability and policy of RAS at Estate
Management Advisory Committee (EMAC) meetings, and solicited assistance from non-government organisations, local District Council members and EMAC members to refer tenants in need to estate offices for rent assistance;
(c) displayed eye-catching stands/notices publicising RAS at
conspicuous location at the Customer Service Counter/waiting hall of estate offices; and
- 3 -
(d) adopted a caring and proactive approach in reaching out to tenants in need, in particular the elderly and single parent families, during the biennial flat inspection or during other home visits for tenancy management, checking of repairs etc.
Facilitating the application process 5. To facilitate tenants in applying for RAS, we have implemented the following measures to provide assistance to applicants –
(a) upon receipt of enquiry on the RAS, estate staff would explain to
the applicant the details of the policy, eligibility criteria, procedures, and supporting documents required for vetting; and
(b) estate staff would also explain and provide assistance to the
tenants, in particular the elderly, who may have difficulties in understanding the application form.
Effective date of rent relief 6. Prior to August 2014, for applications received on or after 16th of a month, RAS would be effective from the first day of the following month. To enable tenants in need to receive timely rent assistance, from September 2014 onwards, rent assistance will be granted to all successful applicants with retrospective effect from the first day of the month, regardless of whether the applications are received in the first or second half of the month.


